Article

A Bi-Level Optimization Approach to Charging Load Regulation of Electric Vehicle Fast Charging Stations Based on a Battery Energy Storage System

1
School of Electrical Engineering, Beijing Jiaotong University, Beijing 100044, China
2
Department of Electrical and Computer Engineering, Wayne State University, Detroit, MI 48202, USA
*
Author to whom correspondence should be addressed.
Energies 2018, 11(1), 229; https://doi.org/10.3390/en11010229
Submission received: 20 December 2017 / Revised: 13 January 2018 / Accepted: 15 January 2018 / Published: 18 January 2018
(This article belongs to the Special Issue The International Symposium on Electric Vehicles (ISEV2017))

Abstract

:
Fast charging stations enable the high-powered rapid recharging of electric vehicles. However, these stations also face challenges due to power fluctuations, high peak loads, and low load factors, affecting the reliable and economic operation of charging stations and distribution networks. This paper introduces a battery energy storage system (BESS) for charging load control, which is a more user-friendly approach and is more robust to perturbations. With the goals of peak-shaving, total electricity cost reduction, and minimization of variation in the state-of-charge (SOC) range, a BESS-based bi-level optimization strategy for the charging load regulation of fast charging stations is proposed in this paper. At the first level, a day-ahead optimization strategy generates the optimal planned load curve and the deviation band to be used as a reference for ensuring multiple control objectives through linear programming, and even for avoiding control failure caused by insufficient BESS energy. Based on this day-ahead optimal plan, at a second level, real-time rolling optimization converts the control process to a multistage decision-making problem. The predictive control-based real-time rolling optimization strategy in the proposed model was used to achieve the above control objectives and maintain battery life. Finally, through a horizontal comparison of two control approaches in each case study, and a longitudinal comparison of the control robustness against different degrees of load disturbances in three cases, the results indicated that the proposed control strategy was able to significantly improve the charging load characteristics, even with large disturbances. Meanwhile, the proposed approach ensures the least amount of variation in the range of battery SOC and reduces the total electricity cost, which will be of a considerable benefit to station operators.

1. Introduction

To address the energy and environmental crises, and as a significant component of sustainable development and the low-carbon economy, transport electrification, including electric vehicles (EVs), is experiencing a worldwide period of rapid development. As the energy supply of EVs, the charging infrastructure plays a crucial role in its promotion [1,2,3]. Due to the shorter recharging duration required compared to AC charging, as well as the lower investment cost compared to battery-swap charging, DC fast charging has become the mainstream method used for electric bus, taxi, and emergency charging [4,5]. In addition, given the potential for increased battery capacity, DC fast charging is expected to be beneficial for daily use [6,7]. Increased battery capacity enables long distance travel and range anxiety is eliminated with high power rapid recharging. Depending on the battery and vehicle types, a recharge range of greater than 100 km in less than 10 min is easily achievable.
However, these short charging time and high-power properties generate a new type of load with a high peak load and fast power fluctuations, resulting in a low load factor. From our measurements of many real fast charging stations, the charging load valley can be zero, while the peak load almost reaches the maximum distribution capacity of the station, which can be between hundreds of kilowatts and several megawatts. The load factors are usually below 0.3. This creates new challenges to the reliable and economic operation of charging stations and distribution networks.
Since the peak power of a fast charging station is much higher than the average power, the construction of the station based on peak load increases both the investment and operation costs. Currently, a large industrial electricity tariff standard is applied to fast charging stations in Beijing and other cities in China, of which a 32 CNY/kVA (4.8421 USD/kVA) per month basic electricity price is charged according to the capacity of the distribution transformer, in addition to the time-of-use (TOU) electricity cost. This high peak charging load requires a large extra power supply from the grid, which poses problems for choosing locations for the stations, and the cost of power grid capacity expansion is nearly 10,000 CNY/kVA. At the same time, the rapid and severe fluctuations disturb the distribution networks, and the voltage quality significantly deteriorates. Meanwhile, the power loss in distribution also increases [8,9,10].
Currently, charging load control or coordinated charging is achieved through several methods, two of which are:
(1) Direct control is the direct regulation of the charging time, the number of charging vehicles, or the charging power due to the controllability of the charging load. This method is implemented by the charging station, aggregator, or distribution system operators (DSO). Based on aggregators and DSO, a hierarchical coordinated charging framework for EVs minimizes the electricity cost and peak load [11]. The total charging cost minimization was achieved in the aggregator using a strategy that directly interrupts the charging process [12]. With the goals of peak-shaving and valley-filling, the number of charging electric vehicles in a certain period was calculated in order to attain direct control [13]. In addition to directly regulating the charging load to reduce the power loss of the grid, optimal integration place was pursued [14]. Temporal and spatial joint control strategies were proposed to reduce the level of charging congestion [15,16]. Based on stochastic charging time switching control of on-board electric vehicle (EV) chargers, Zhang et al. [17] proposed a decentralized strategy to coordinate charge operation of electric vehicles. Silvestre et al. [18] devised an optimal strategy to control the recharge start time for a given parking lot to minimize losses or the energy cost. In addition, various algorithms have been applied to the charging management of parking stations and battery swapping stations [19,20].
(2) Demand side management-based charging price guiding coordinates the charging behavior of EV users with a TOU charging price or other market mechanisms to attain indirect control over charging loads. Based on the TOU electricity price, Yang et al. [21] proposed one approach to obtaining the TOU charging price in order to reduce the charging peak-valley load difference. A game-theoretic approach for optimal TOU pricing was introduced to improve the efficiency of operation [22]. Another optimization model for determining the optimal charging prices for EVs, to maximize the EV-parking lot owner’s profit was presented by Awad et al. [23]. Yang et al. [24] considered electric vehicle route optimization by using the time-of-use price to minimize the total distribution costs. EV charging was coordinated to absorb excess wind energy via dual-tariff schemes [25].
The first type of control strategy directly regulates the charging process or power, and has a favorable charging load control effect. However, direct control may affect the vehicle user’s demand, and user-friendliness is relatively low. Using a price mechanism to guide the user’s charging behavior seems to be a more suitable method. Although the method is user-friendly, the price mechanism itself may still conflict with users’ demand or behavior. For example, when some users are not sensitive to the guiding price, the load control effect will deteriorate in a high-power fast charging scenario, even if insensitive users are rather rare. This can also be described as a lack of robustness against load disturbance caused by user sensitivity, driving habits, or traffic conditions.
Recently, to reduce the impact of the EV charging on node voltages and feeder currents, Islam et al. [26] chose an appropriate combination of solutions, such as upgrading the grid, and deploying onsite PV or battery energy storage system (BESS), or both, and found the optimal PV and BESS sizes for the chosen combination. Graber et al. [27] presented a stochastic sizing method to determine the number of different types of EV charging stations in urban parking lots while considering BESS. These studies focused on the design and configuration of the charging station rather than real-time operation and load control. To address the problem of controlling the high power needed from fast charging operations, a BESS was used as the buffer to store energy and control the load demand [28]. However, this solution dispatches the batteries only when demand exceeds a reference maximum value. This approach is simple, but lacks optimization ability, such as electricity cost reduction and the optimal usage of batteries, and always causes the net demand to exceed the limit value.
This paper introduces lithium-ion battery-based BESS to the charging load control of the fast charging station. To address the objectives of charging load peak-shaving and TOU tariff-based economic operation while reducing the charging load change rate, this novel method is more user-friendly and flexible, and is independent of the user’s personal price sensitivity and behavior and other disturbances, compared to the existing charging load control methodology.
In this paper, we propose a BESS-based bi-level optimization strategy for regulating the charging load of the electric vehicle fast charging station. In the first level day-ahead strategy, the optimization model to achieve both reduced daily electricity cost for the station and charging load peak-shaving is established with multiple constraints. Afterward, based on the optimal charging load obtained with linear programming, the day-ahead optimal planned load deviation band is established. Using this optimal planned load deviation band, the BESS capacity margin for the remainder of the daily operation time can be considered to avoid control failure caused by insufficient BESS energy. In the following real-time strategy, since the BESS state has typical Markov properties in real-time operation, model predictive control (MPC) was used to optimize the rolling of the BESS power in a fast charging station. During this real-time optimization process, and based on the day-ahead optimal planned load deviation band set at the first level, the variation in the BESS state-of-charge (SOC) range was optimized to improve the expected battery life.
This paper is organized into the following sections. The main problems and motivation for this paper are described in Section 2. Section 3 introduces the proposed BESS-based bi-level optimization strategy in detail. The basic control model and control logic of the strategy are outlined. Then, the day-ahead level optimization strategy is detailed, after which the day-ahead optimal planned load deviation band is established. Subsequently, the real-time model and basic control are detailed. Then the MPC-based real-time rolling optimization model is proposed and detailed in Section 4. In Section 5, a case study of day-ahead level optimization is presented first, as well as a horizontal comparison of two real-time control approaches, namely direct control and MPC-based control. Longitudinal comparison of the control robustness is examined through three cases with different load disturbances. Finally, conclusions are drawn in Section 6.

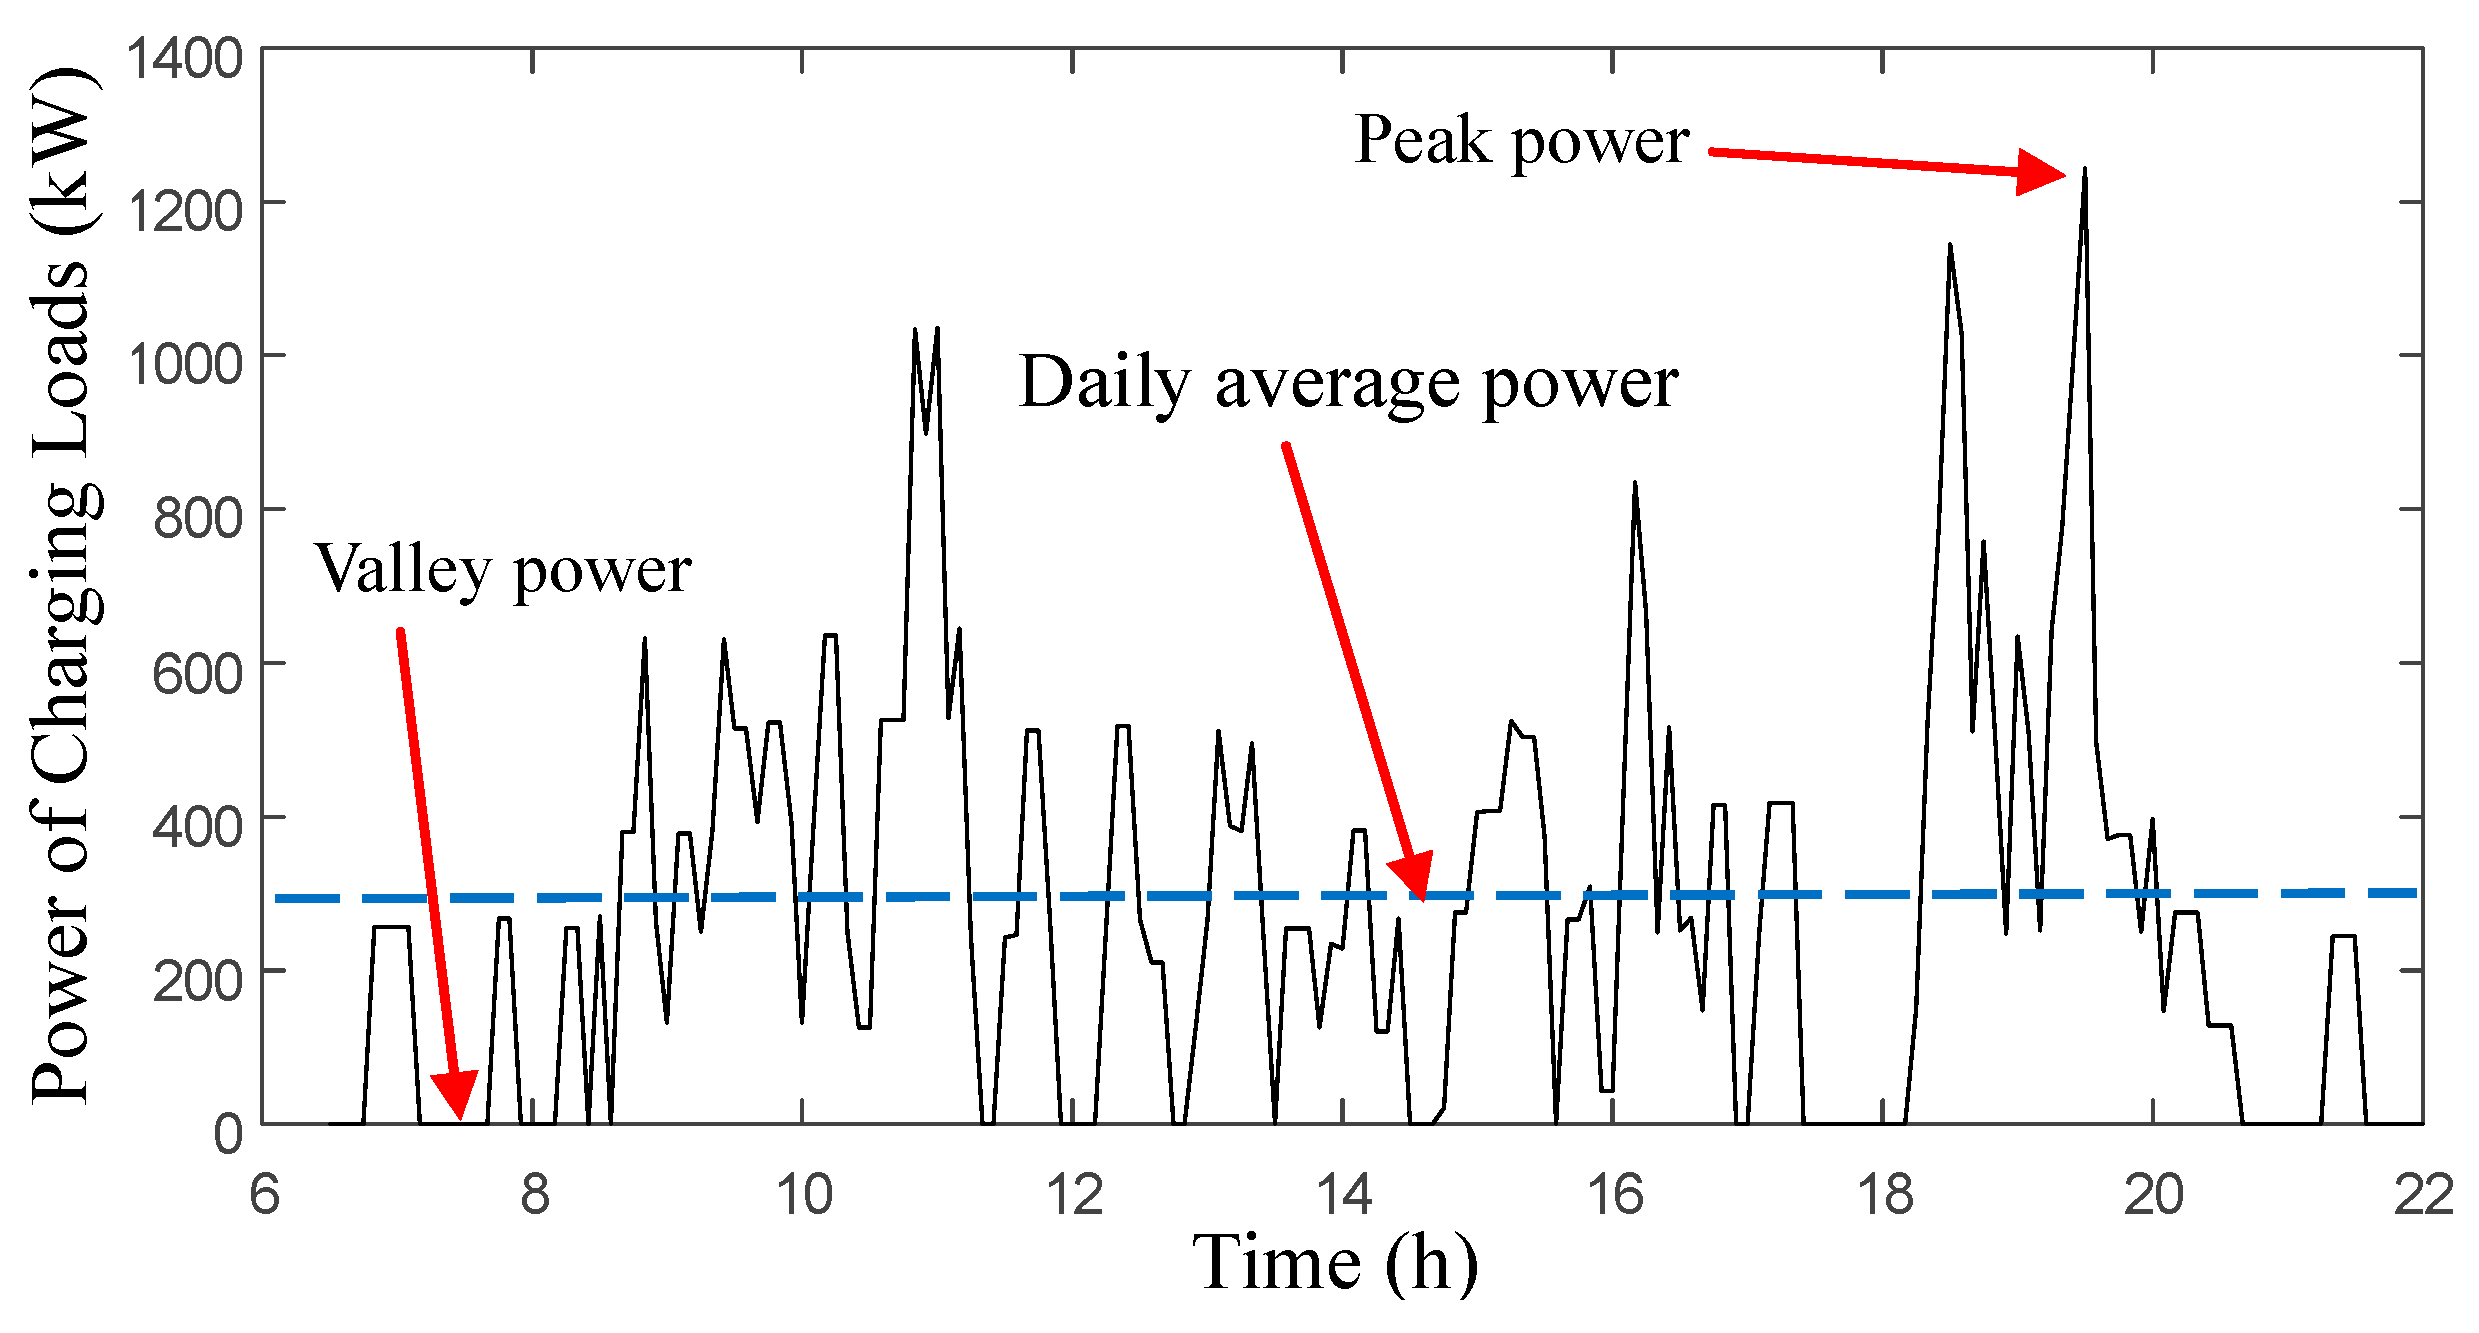
2. Problems and Motivating Scenarios

This study was motivated by problems seen in fast charging stations, in which the charging loads suffer from severe power fluctuations, high peak loads, and low load factors. A typical electric bus fast charging station, in which BESS is included, is depicted in Figure 1.
In this fast charging station, eight DC chargers are individually connected to the grid through a 10 kV/0.4 kV distribution transformer. The actual measured charging load curve of this fast charging station, which is located in the Huairou District in Beijing, China, is shown in Figure 2. The peak and valley power of the load curve are 1244.3 kW and 0 kW, respectively, whereas the daily average power is only 276.5 kW. Therefore, the load factor is 0.222, which is rather low compared to other common loads in the utility grid. This will result in higher investment and operation costs, due to the redundant power capacity drawn from the utility grid during construction and the basic electricity price paid once per month. Additionally, severe charging power fluctuations may affect the voltage quality and power loss in the distribution networks. If the station is integrated into a weak power grid, the point of common coupling voltage in the higher voltage distribution areas will deteriorate.
Compared to the two existing types of charging load control, introducing BESS to fast charging stations is a promising way to manage these problems, since this method is user-friendly, and robust against the vehicle user’s individual characteristics and real-time load perturbations. BESS is able to effectively control the load of a fast charging station. However, the battery cost for BESS is a limitation of this method. Though the price of batteries will decrease considerably with the increasing use of electric vehicles, minimizing the degradation of the batteries is essential to the optimal operation of BESS. The day-ahead optimal planned load deviation band is a pivotal aspect in the proposed method, and is also the first step of the proposed strategy.

3. Control Model and Bi-Level Optimization Strategy

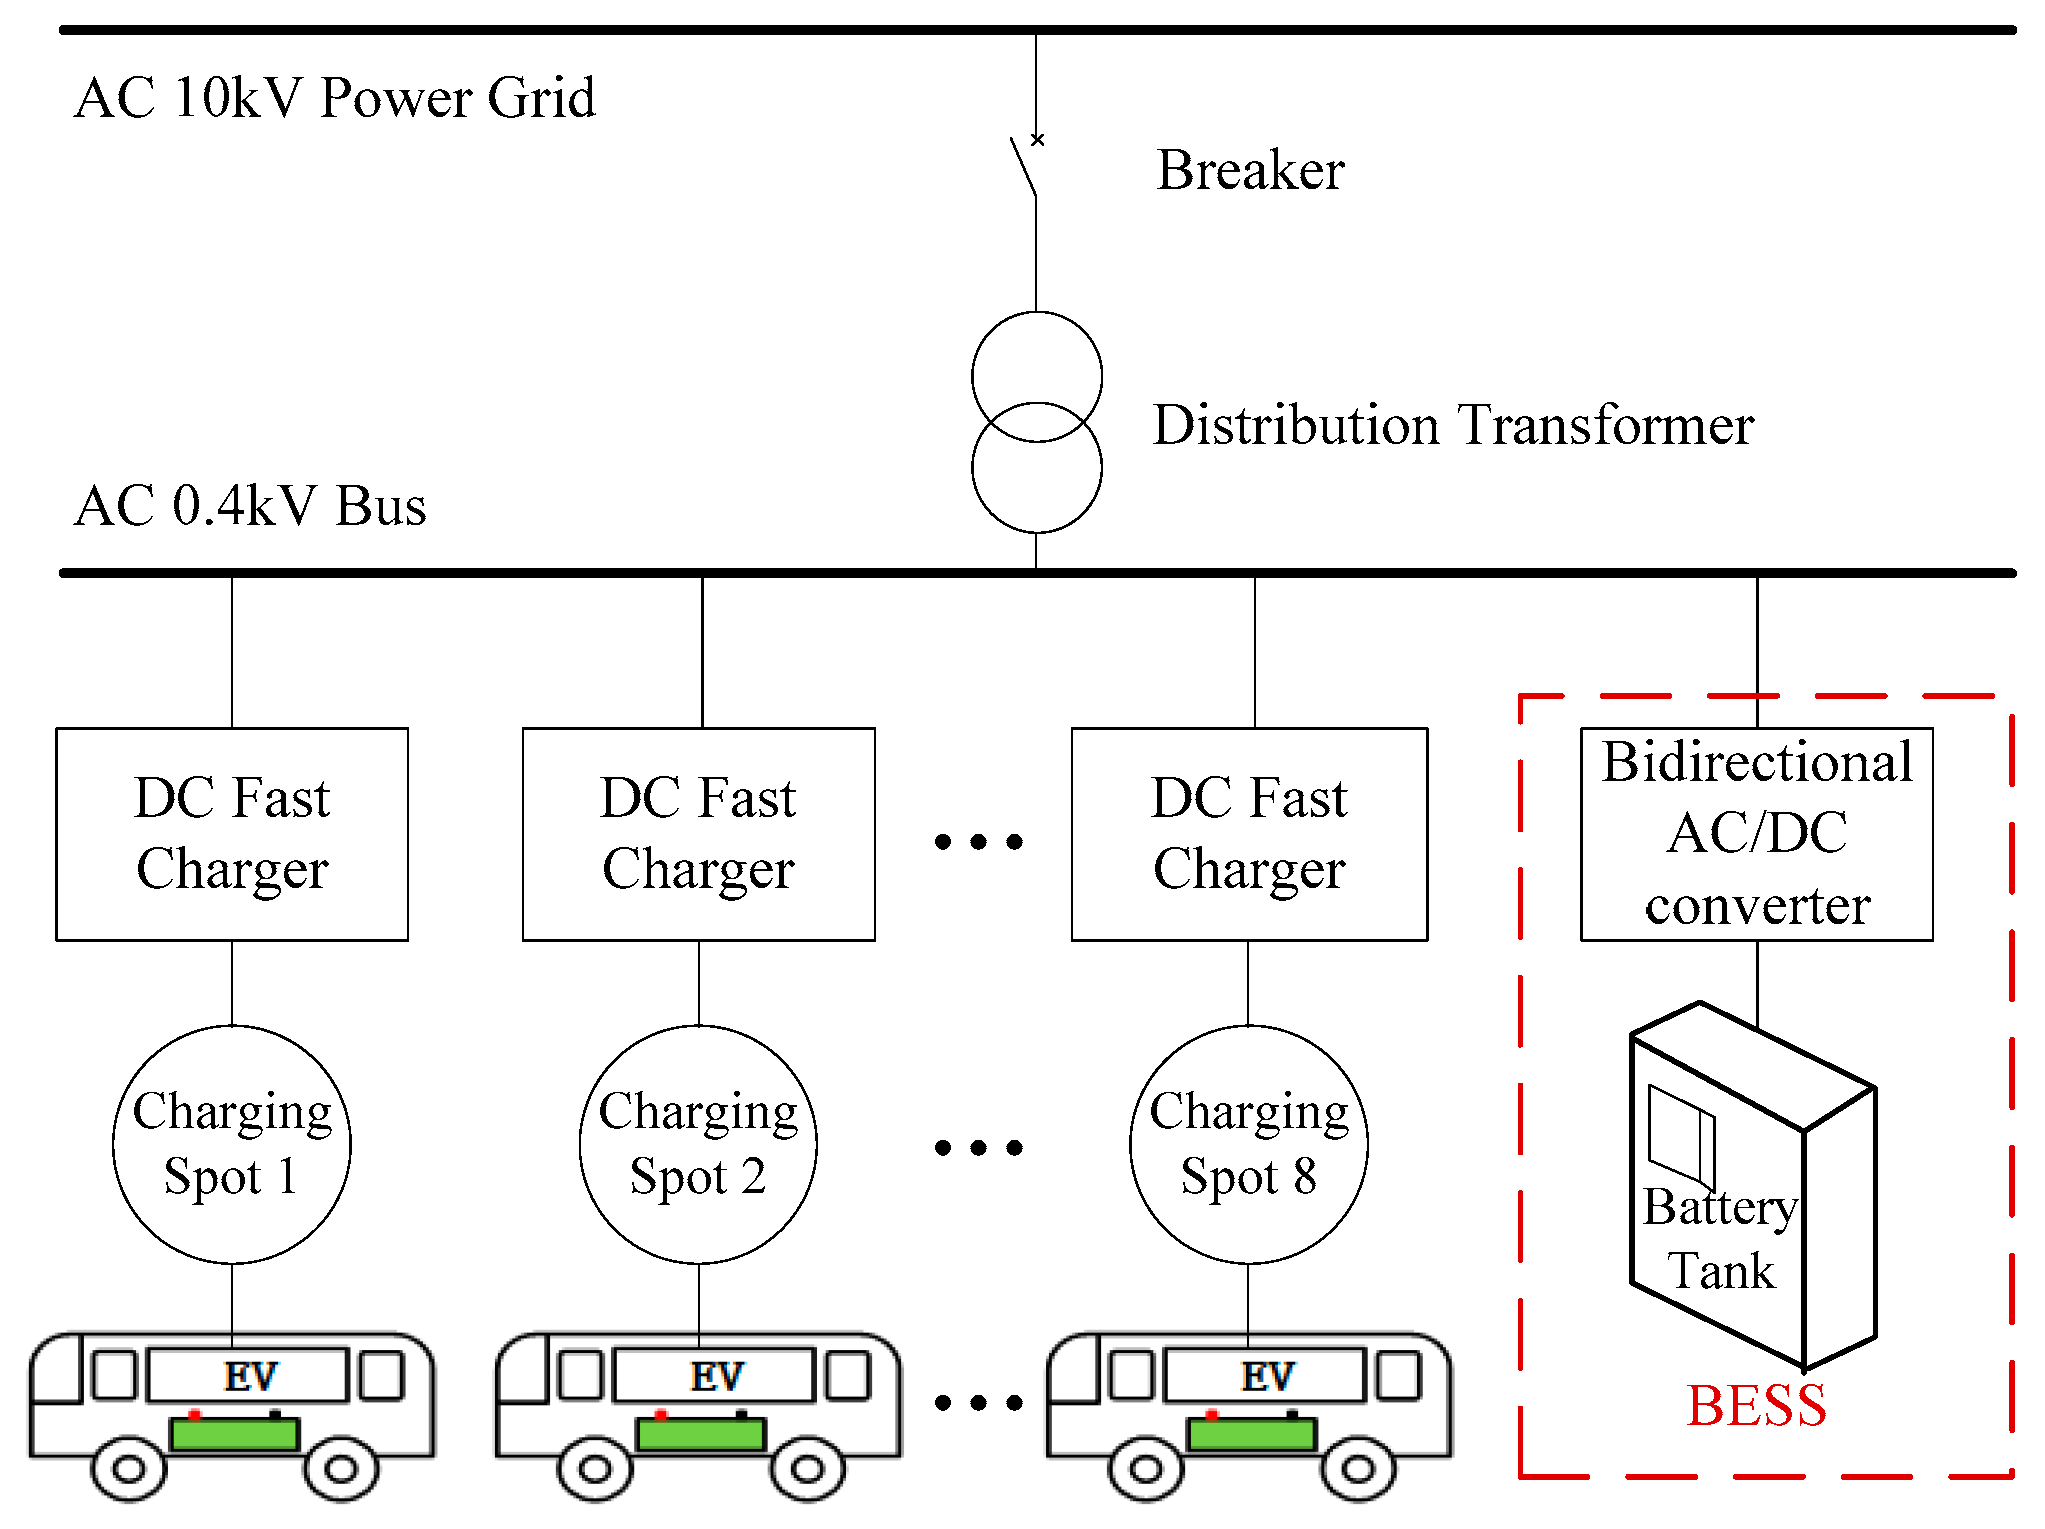
3.1. The BESS-Based Fast Charging Station Control Model

Based on the typical topology of a fast charging station depicted in Figure 1, the basic control model of this system can be expressed as follows:
P b ( t ) = P g ( t ) P c ( t )
E ( t + Δ t ) = E ( t ) P b ( t ) Δ t
where P b ( t ) is the output power of BESS, P g ( t ) is the grid-side power of the fast charging station, P c ( t ) is the charging load power of the fast charging station, E is the energy of the BESS, and t and Δ t are the time and the BESS calculation step time, respectively. These two equations are derived from the principle of the power and energy balance of the fast charging station.
To address the control objectives of charging load peak-shaving, TOU tariff-based economic operation, minimization of BESS SOC variations [29,30,31], and avoidance of control failure caused by insufficient BESS energy, a BESS-based bi-level optimization strategy for regulating the charging load of the EV fast charging station is proposed in this paper. The strategy involves two levels of optimization: the first is a day-ahead optimization level, which creates a peak-shaving and economic operation control plan; and the second is a real-time rolling optimization level, which achieves the day-ahead plan and guarantees the lifetime and the available energy of the BESS. A diagram of the bi-level optimization strategy is shown in Figure 3, which displays the logical relationship between the two levels and the distribution of the objectives in the two optimization processes.

3.2. Day-Ahead Level Optimization Strategy

As the first level of the bi-level optimization strategy, the day-ahead level is implemented in the energy management system (EMS) of the fast charging station, based on the day-ahead charging load forecasting data obtained from a load forecasting system and other constraint information. Since the electricity charge is the variable portion of the daily production costs in a charging station, minimizing the electricity charge is one way to increase profits. The TOU electricity rates stipulated in a fast charging station are the fixed electricity prices, and usually contain peak, flat, and valley prices that vary based on the time of day in order to promote reasonable timing of electricity consumption. Therefore, to reduce the operation costs, minimizing the daily electricity cost of the fast charging station was chosen as the objective function:
min C = min { i = 1 n c ( i ) P g ( i ) τ } = min { i = 1 n c ( i ) [ P b ( i ) + P c f ( i ) ] τ }
where C is the daily electricity cost, c ( i ) is the TOU electricity rate during the time index i, n and τ are the number of time index and the time interval, respectively, which depend on the input charging load forecasting data interval, and P c f is the total forecasted charging power by time.
Since the objectives of reducing the peak loads and the charging load change rate are rigid, they can be handled as constraint conditions in the strategy, for the sake of simplicity. Therefore, the constraint conditions that should be satisfied in the optimization are as follows:
The peak-shaving grid-side power constraint is:
P g min P g ( i ) P g max
The charging load change rate constraint is:
γ min P g ( i + 1 ) P g ( i ) P t γ max
The BESS energy constraint is:
λ min E E b ( i ) λ max E
The BESS power constraint is:
P b min P b ( i ) P b max
where P g min and P g max are the minimum and maximum grid-side power, respectively; γ min and γ max are the minimum and maximum charging load change rates, respectively; P t is the power capacity of the transformer; λ min and λ max are the minimum and maximum permitted BESS energy percentage, respectively; P b min and P b max are the minimum and maximum BESS output power, respectively, which are always the rated power of the BESS converter.
Since the objective function, constraints, and feasible range of the day-ahead level constitute a nonempty bounded convex set, this problem can be solved with a linear programming algorithm, through which the day-ahead optimal planned load curve can be obtained. This day-ahead optimal planned load curve includes optimal objective information, such as peak-shaving, electricity cost minimization, and charging load change rate reduction.

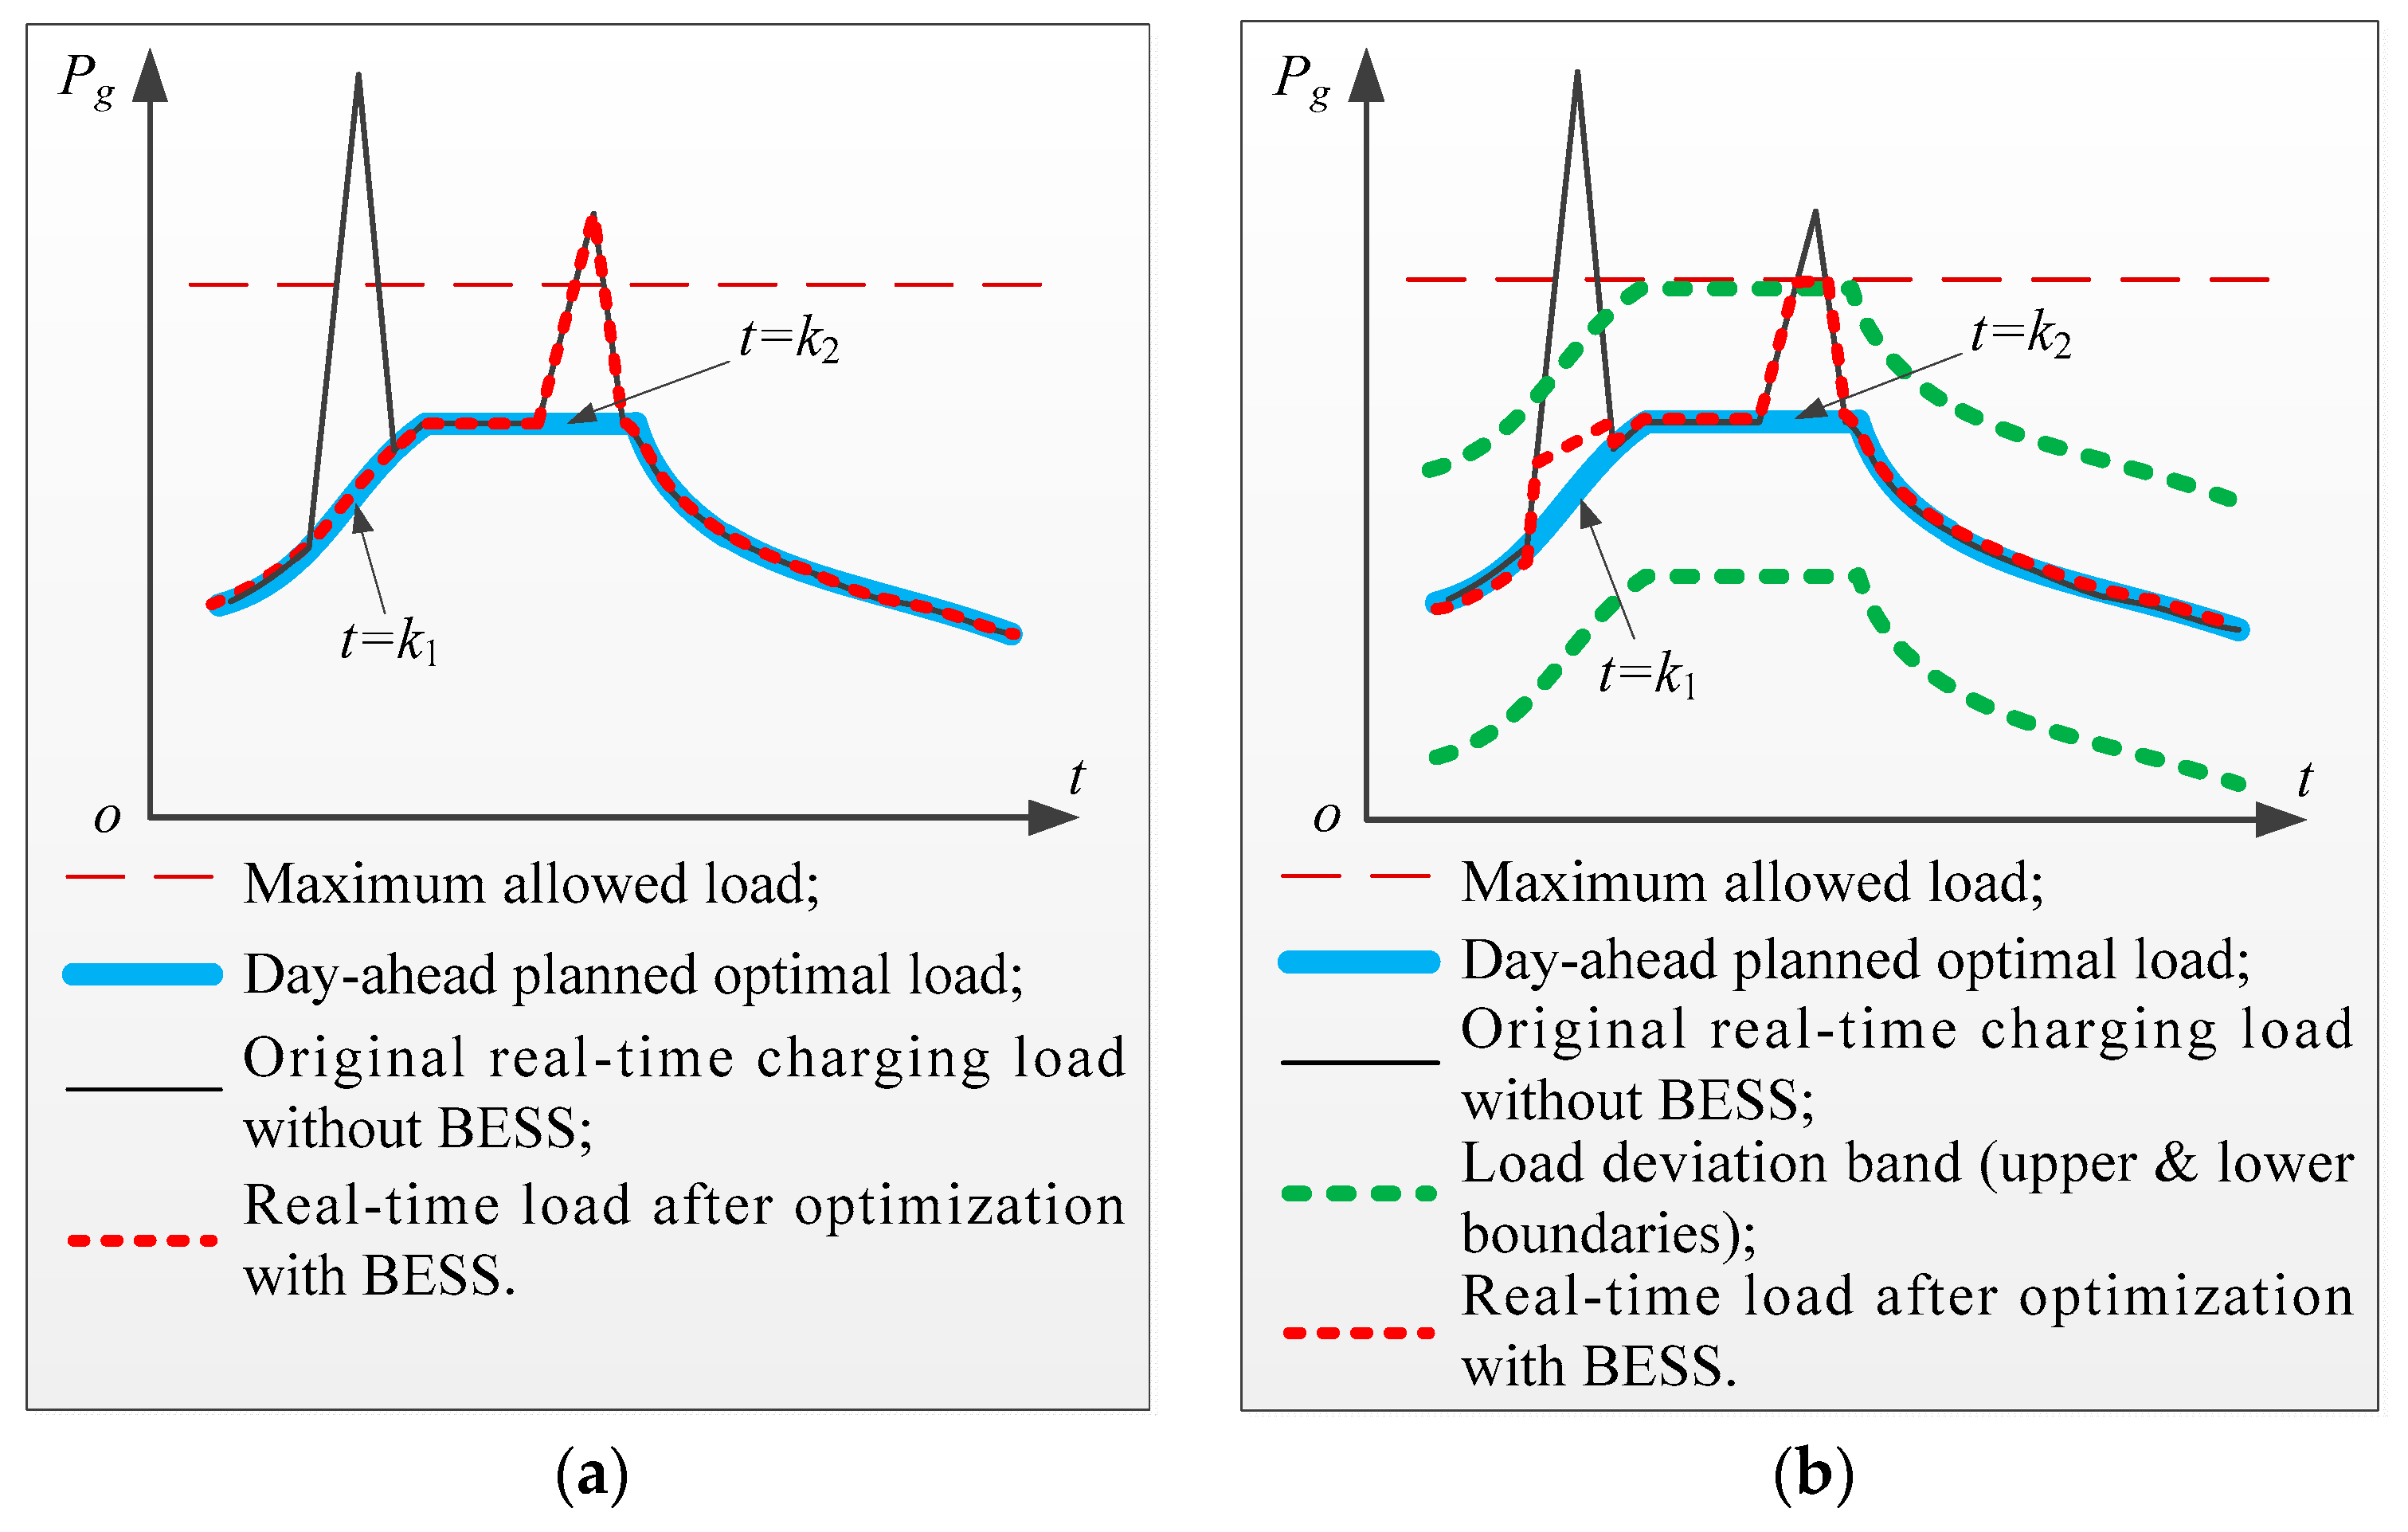
3.3. Day-Ahead Optimal Planned Load Deviation Band

Since each battery has an energy limitation, the BESS capacity margin for the rest of the daily operation times should be considered in order to avoid control failure caused by the insufficiency of BESS energy. In addition, for the optimal usage of BESS to extend the lifecycle of batteries, the concept of the load deviation band is introduced in this paper on the basis of the day-ahead optimal planned load curve, making the peak-shaving objective a load band, rather than a load curve. This is a kind of constraint relaxation, actually. The mathematical model of the day-ahead optimal planned load deviation band is as follows:
P u ( i ) = min { P g max , P g ( i ) + δ max { P g ( i ) } } i { 1 , 2 , , n }
P l ( i ) = max { P g min , P g ( i ) δ max { P g ( i ) } } i { 1 , 2 , , n }
where P u and P l are the upper and lower boundaries of the day-ahead optimal planned load deviation band, respectively; P g ( i ) is the optimal planned load derived by the day-ahead level optimization; and δ is the band deviation coefficient, which is between 0 and 1.
A schematic diagram of the day-ahead optimal planned load deviation band is shown in Figure 4. Without the load deviation band, the original real-time charging load peak at time k1 is shaved to the planned value of the day-ahead optimal load. However, at time k2, the peak-shaving failed due to exhausting the capacity of BESS. With the load deviation band applied, the strategy does not shave the load peak at the time k1 to the optimal value determined by the day-ahead level optimization, but to a higher value than the optimal one, which saves BESS energy for time k2 and enables peak-shaving at time k2.

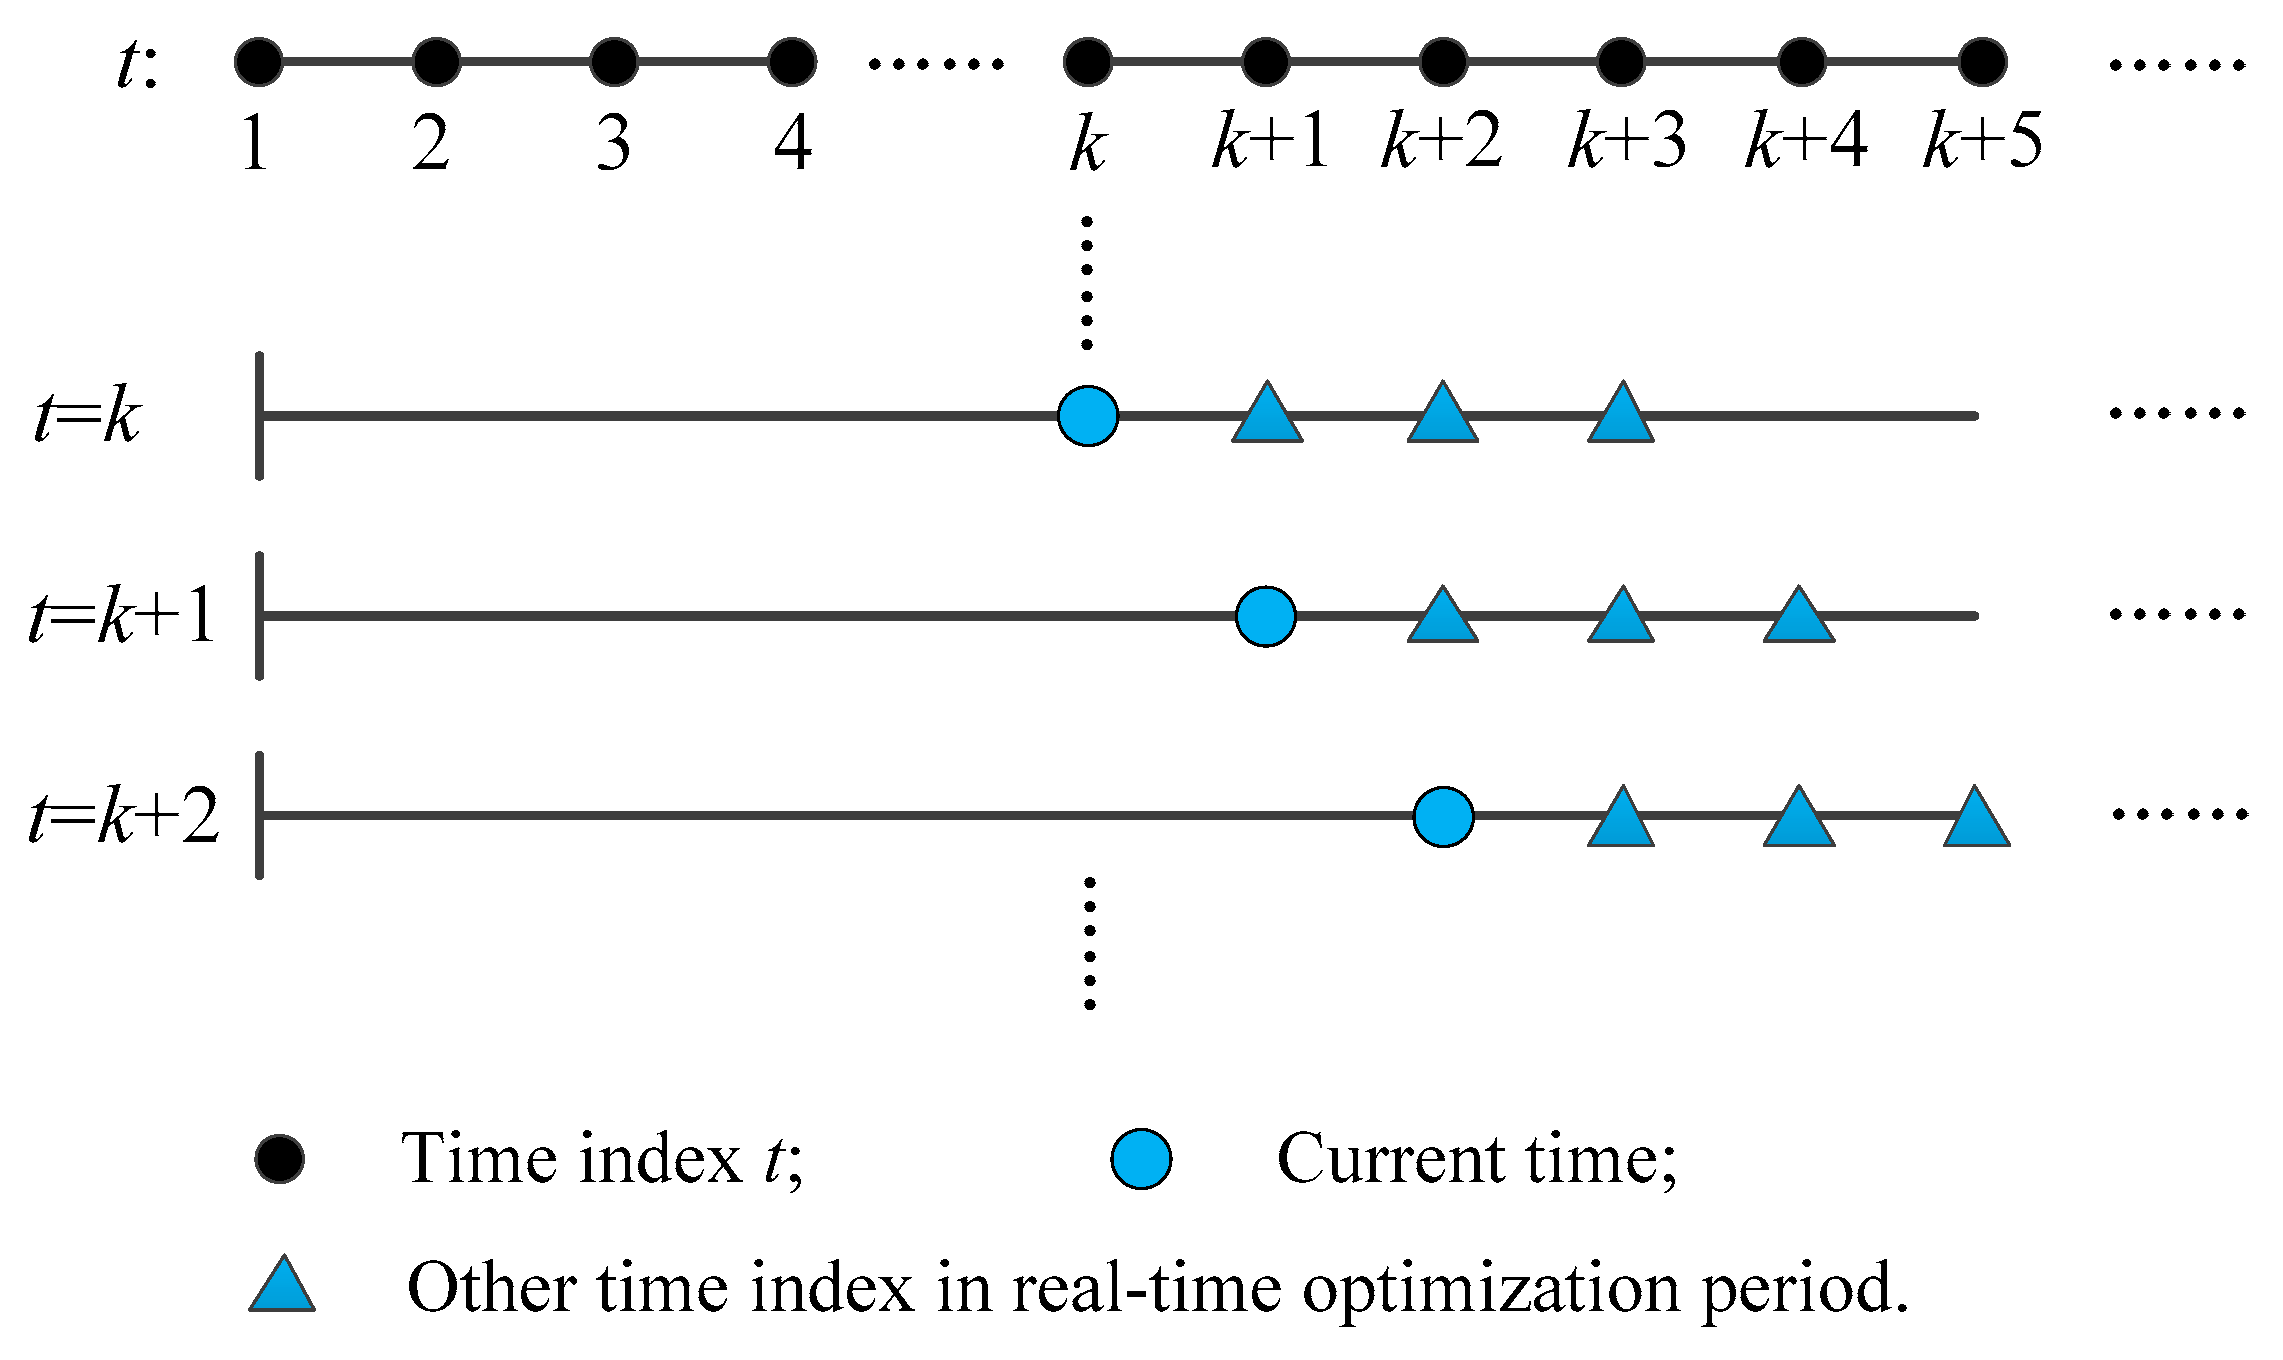
3.4. Real-Time Rolling Optimization

At the real-time optimization level, the strategy that is embedded in the EMS of a fast charging station is implemented in real time. Therefore, online optimization of the BESS output power or the grid-side power is required to follow the day-ahead optimal planned load deviation band during this process.
The real-time optimization strategy must achieve the day-ahead optimization objectives, represented by the load deviation band, and optimize the BESS usage to conserve energy for the following load peaks online. In addition, based on the load deviation band, the variation in the range of the SOC of BESS can be minimized during charging load regulation. This will improve the battery life during operation, since lithium-ion batteries with a reduced SOC range of around 50% exhibit a significantly slower capacity loss rate [32,33,34].
During real-time operation, considering the uncertainty and perturbations of the charging loads, as well as the period of ultra-short-term charging load forecasting, rolling optimization (Figure 5) for the BESS power, by transferring the control process into a multistage decision-making problem, is proposed in this paper.
Figure 5 depicts the rolling optimization strategy principle. More specifically, the first line of this figure is the time axis. The second line shows the single-stage decision-making optimization period at time index k during rolling optimization. Similarly, the third and the fourth lines show the rolling optimization process, which scrolls forward step by step. In Figure 5, four time indices are used as an example. The optimization, which is a single-stage decision-making process, is implemented within the optimization period at each time index. When the solution, which is the output power of the BESS after optimization, is obtained, only the first value in the optimal trajectory is applied to the process. At the next time index, the entire procedure is repeated. This optimization process continues to scroll forward to constantly generate BESS control commands. Based on the above illustrations, during each decision-making period, the objective function of the optimization model is as follows:
min J = k = 1 m [ s ( k ) L ] 2
where m is the number of time indices in a rolling optimization period, k is the time index in the real-time rolling optimization, and its time interval is the control step of the real-time rolling optimization, s is the state-of-charge of the BESS, and L is a reference value equal to 0.5.
In addition to the above objective of reducing the variation in the SOC range to ensure battery life, other objectives for charging load control are as follows:
The grid-side power constraint for peak-shaving using the day-ahead optimal planned load deviation band is:
P l ( k ) P g ( k ) P u ( k ) k { 1 , 2 , , m }
The BESS energy constraint is:
λ min E b ( k ) E λ max k { 2 , 3 , , m + 1 }
The BESS power constraint is:
P b min P b ( k ) P b max k { 1 , 2 , , m }

4. MPC-Based Real-Time Rolling Optimization Model

In this paper, to solve the above real-time rolling optimization problem, we used the model predictive control approach. With MPC, also known as receding horizon control, an optimization problem can be solved at each time step to determine a plan of action over a fixed time horizon. The first input from this plan is applied to the system. At the next time step, the planning process is repeated, solving a new optimization problem with the time horizon shifted one step forward. The control policy involves feedback, since real-time measurements are used to determine the control input. MPC is a nonlinear control policy that handles input constraints, output constraints, and various control objectives. Moreover, MPC is a high-speed solver that can be applied to real-time application [35,36].
Accordingly, we propose a MPC-based real-time rolling optimization strategy that ensures the grid-side power follows the day-ahead optimal planned load deviation band and improves the battery life.
The state space model of the fast charging station can be written as follows:
{ x ( k ) = u ( k ) r ( k ) y ( k + 1 ) = y ( k ) 1 T x ( k )
where x ( k ) is the BESS output power P b , u ( k ) is the grid-side power of the fast charging station P g , r ( k ) is the charging load power of the fast charging station P c , y ( k ) is the state-of-charge of the BESS, and T is the time constant determined by the control step. For example, if the control step is 5 min, and 1 h is used as the reference, then T = 60 5 = 12 . For simplification, T = 12 will be used in the following deduction and optimization.
Equation (14) can be transformed to the following style:
{ X = U R Y = Y p + M T ( R U ) = Y p + M 12 ( R U )
where:
X = [ x ( 1 ) x ( m ) ] ,   U = [ u ( 1 ) u ( m ) ] ,   R = [ r ( 1 ) r ( m ) ] ,   Y = [ y ( 2 ) y ( m + 1 ) ] ,   Y p = [ y ( 1 ) y ( 1 ) ] ,   M = [ 1 0 0 1 1 0 1 1 1 ] ,
and the number of time indices in a rolling optimization period m is the prediction horizon in MPC.
Therefore, ignoring the constant terms, the objective function in Equation (10) can be represented as:
min J = Y T Y 2 L c T Y
where L c = [ L L ] .
By substituting the prediction expression in Equation (15) into the objective function in Equation (16), and ignoring the constant terms, the objective function can be expressed as:
min J = 1 2 U T ( 2 M T M T 2 ) U + ( 2 T M T Y p 2 T 2 M T M R + 2 T M T L c ) T U = 1 2 U T ( M T M 72 ) U + ( 1 6 M T Y p 1 72 M T M R + 1 6 M T L c ) T U
Since the objective function can be solved by quadratic programming (QP) in MPC, transforming the following standard formula of QP is necessary:
min x J = 1 2 x T H x + h T x
s . t . l b x u b
where x is the vector of the optimization variables; H and h are the matrices of the quadratic term and the first term in the equation, respectively; l b and u b are the vectors of the constraint condition boundaries.
Therefore, in Equation (17), H = M T M 72 , h = 1 6 M T Y p 1 72 M T M R + 1 6 M T L c . According to Equations (11) to (13), the constraints can be expressed as:
C 1 U C 2
C 3 X C 4
C 5 Y p + M 12 ( R U ) C 6
where:
C 1 = [ P l ( 1 ) P l ( m ) ] ,   C 2 = [ P u ( 1 ) P u ( m ) ] ,   C 3 = [ P b min P b min ] ,   C 4 = [ P b max P b max ] ,   C 5 = [ λ min E λ min E ] ,   C 6 = [ λ max E λ max E ] .
Then, Equation (20) to Equation (22) can be transformed into:
{ C 1 U C 2 C 3 + R U C 4 + R M 1 ( 12 Y p + M R 12 C 6 ) U M 1 ( 12 Y p + M R 12 C 5 )
Based on Equation (23), the vectors of the constraint condition boundaries in Equation (19) in the MPC-based real-time rolling optimization can be derived:
l b = [ max { D 1 T } ] T = [ max { [ C 1 C 3 + R M 1 ( 12 Y p + M R 12 C 6 ) ] T } ] T
u b = [ min { D 2 T } ] T = [ min { [ C 2 C 4 + R M 1 ( 12 Y p + M R 12 C 5 ) ] T } ] T
In Equations (23) and (24), the symbols ‘max’ and ‘min’ stand for calculating the maximum or minimum value in every column of the matrix D 1 T or D 2 T .
In the standard QP form, the MPC-based rolling optimization can be easily implemented with the Matlab optimization toolbox, which can be applied to an actual charging station using the hybrid programming of C# and Matlab.

5. Case Studies and Validation

Based on the above theory and methodology, case studies and their results are presented in this section.
A real fast charging station with eight 230 kW fast chargers and a 500 kWh/800 kW BESS, which is described in Section 2, was chosen for the case study, the topology of which is shown in Figure 1. This charging station is located in the Huairou District in Beijing, China and serves 50 electric buses. All the data used in this paper were obtained from the actual monitoring system in the station.
This section is organized as follows. First, day-ahead optimization is performed in Section 5.1. Next, real-time rolling optimization is implemented for three cases in Section 5.2. In each case, a horizontal comparison of the results with or without BESS is performed, in which the BESS is controlled by two different real-time approaches. For robustness testing against load disturbance caused by driving habits or traffic conditions, longitudinal comparison is performed for Case I, II, and III, with the charging loads of three different day-ahead forecasting accuracies.

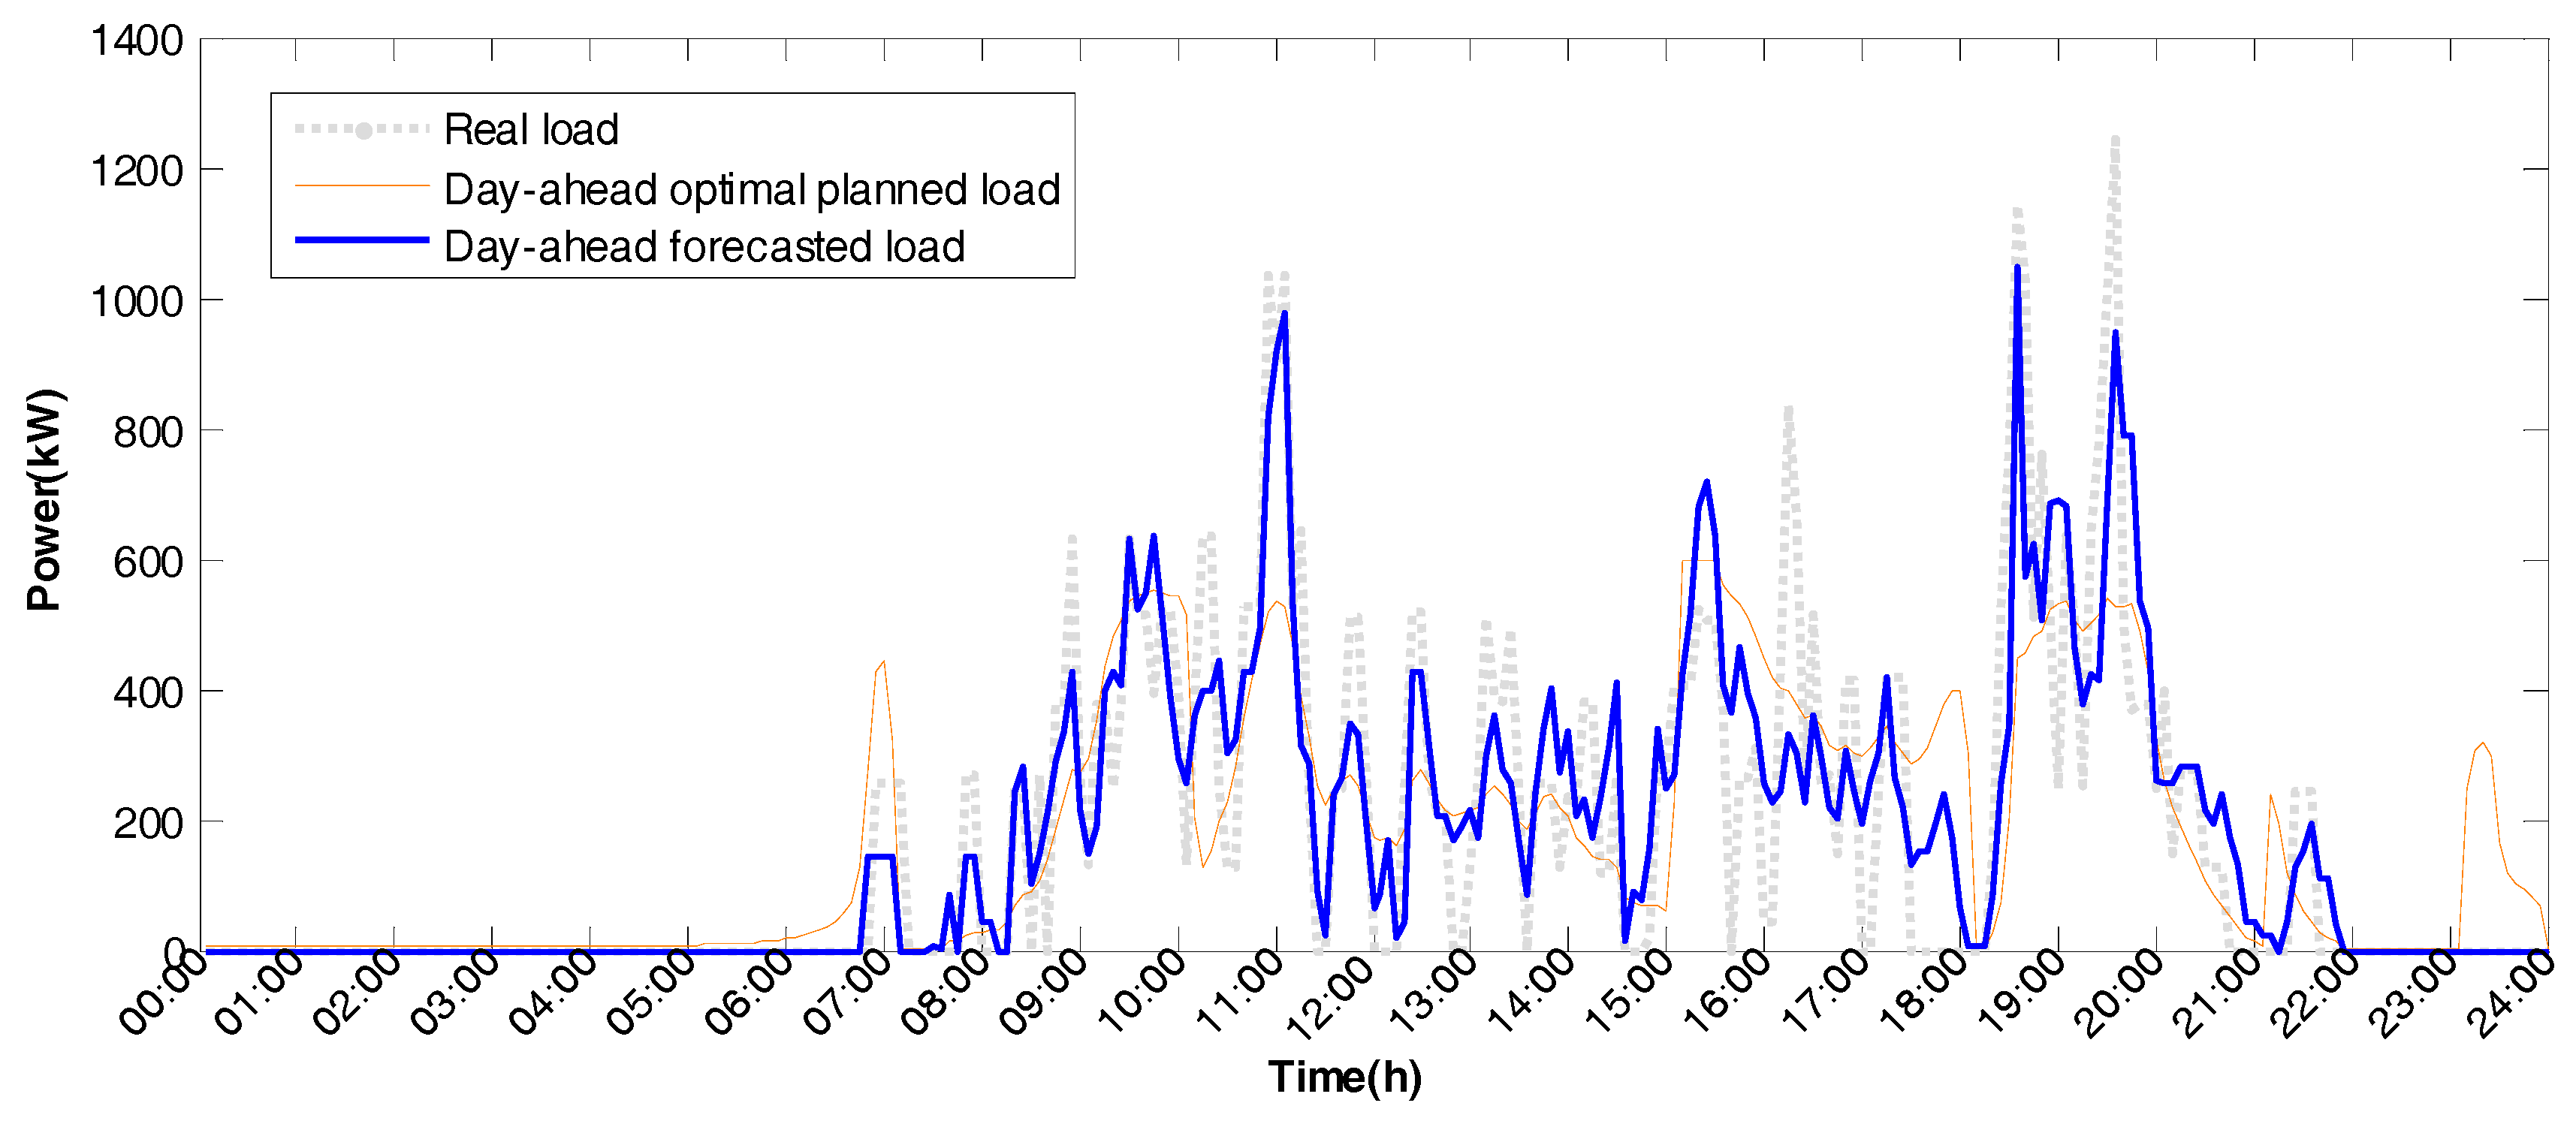
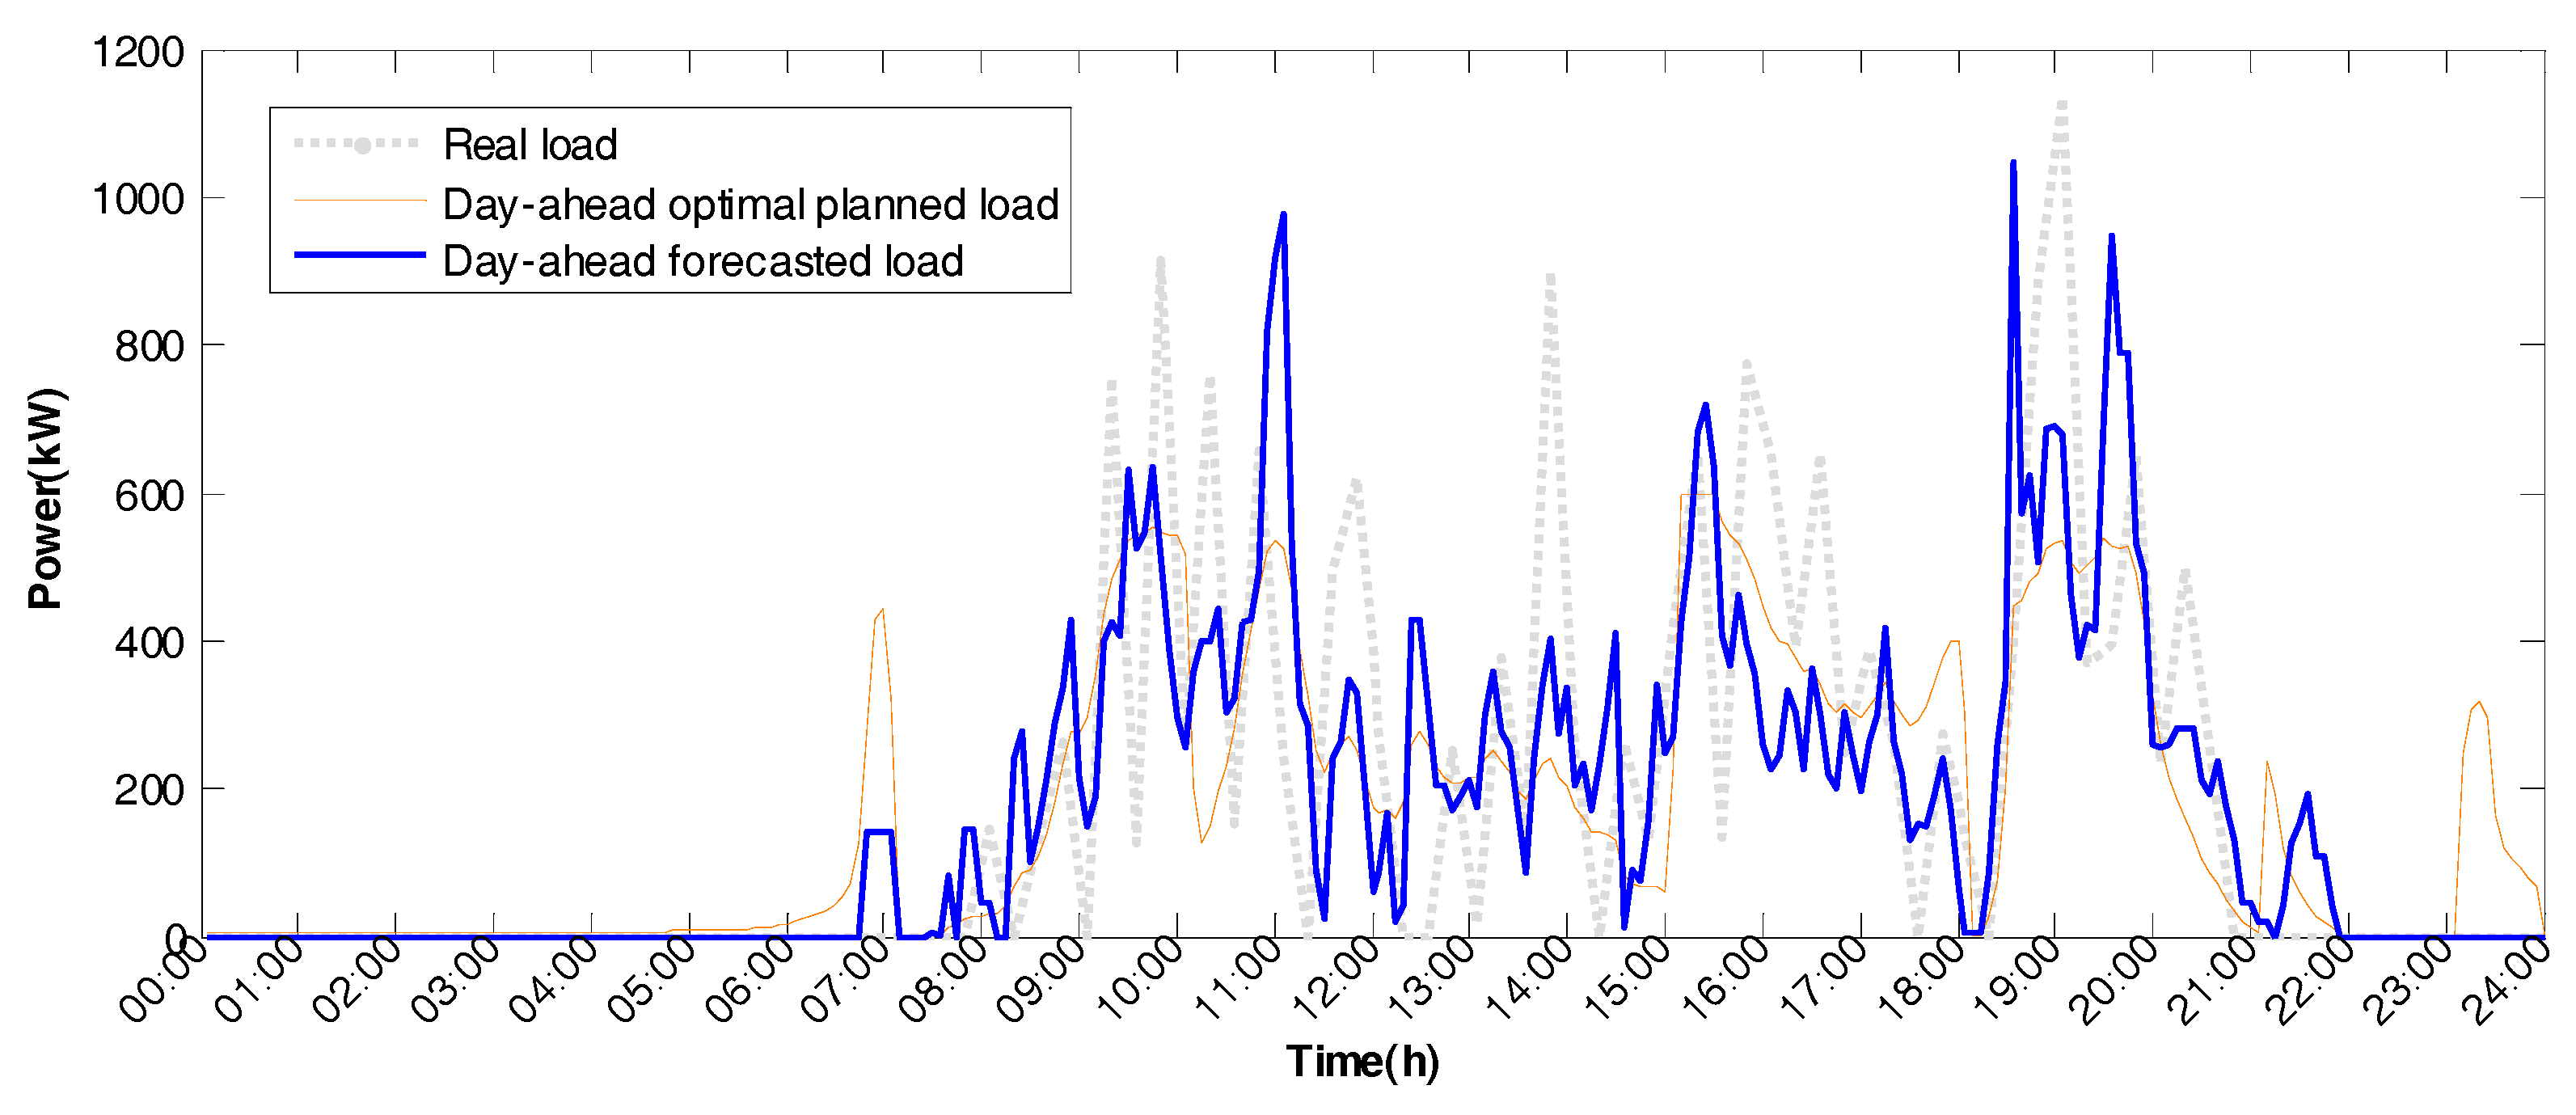
5.1. Day-Ahead Level Optimization Case Study

The day-ahead forecasted charging loads from a charging load forecasting system are shown in Figure 6. The root mean squared error (RMSE) between the observed and predicted data was used to describe the accuracy of the day-ahead charging load forecasting. In Figure 6, the accuracy of the day-ahead charging load forecasting is 100% for an ideal situation, meaning the forecasting is precise. The peak charging hours are mainly concentrated at 10:00 to 11:00 a.m. and 6:00 to 8:00 p.m., and the maximum peak load is 1048 kW.
The parameters in this case study are listed in Table 1. The large industrial electricity tariff standard applied to fast charging stations in Beijing is shown in Table 2.
Based on the parameters in Table 1 and Table 2, the day-ahead optimal planned load curve was obtained using linear programming, as shown in Figure 7. The peak charging load on the day-ahead optimal planned load curve was significantly reduced to 598.4 kW from 1048.64 kW, and the load factor rose from 17.19% to 30.13%. As outlined in the first two sections, this will benefit both the station operator and the power system. Using this day-ahead optimal planned load curve, the peak-valley difference would also improve, from 1048.64 kW to 598.4 kW. The maximum charging load change rate would decrease to 9.2%, which is below the constraint of 10%. Furthermore, the daily electricity cost of the fast charging station would decrease from 3805.84 CNY to 3530.08 CNY, which is a 7.25% reduction, and would benefit the operator of the station because of the yearly electricity cost savings of 100,652.4 CNY.
The output power and the SOC of the BESS in day-ahead optimization are shown in Figure 8. The output power and the SOC of the BESS are within their constraint ranges.
Therefore, the day-ahead optimal planned load curve satisfies all the control objectives, including peak-shaving and electricity cost minimization, and can be applied in real-time as a reference plan for the following day.

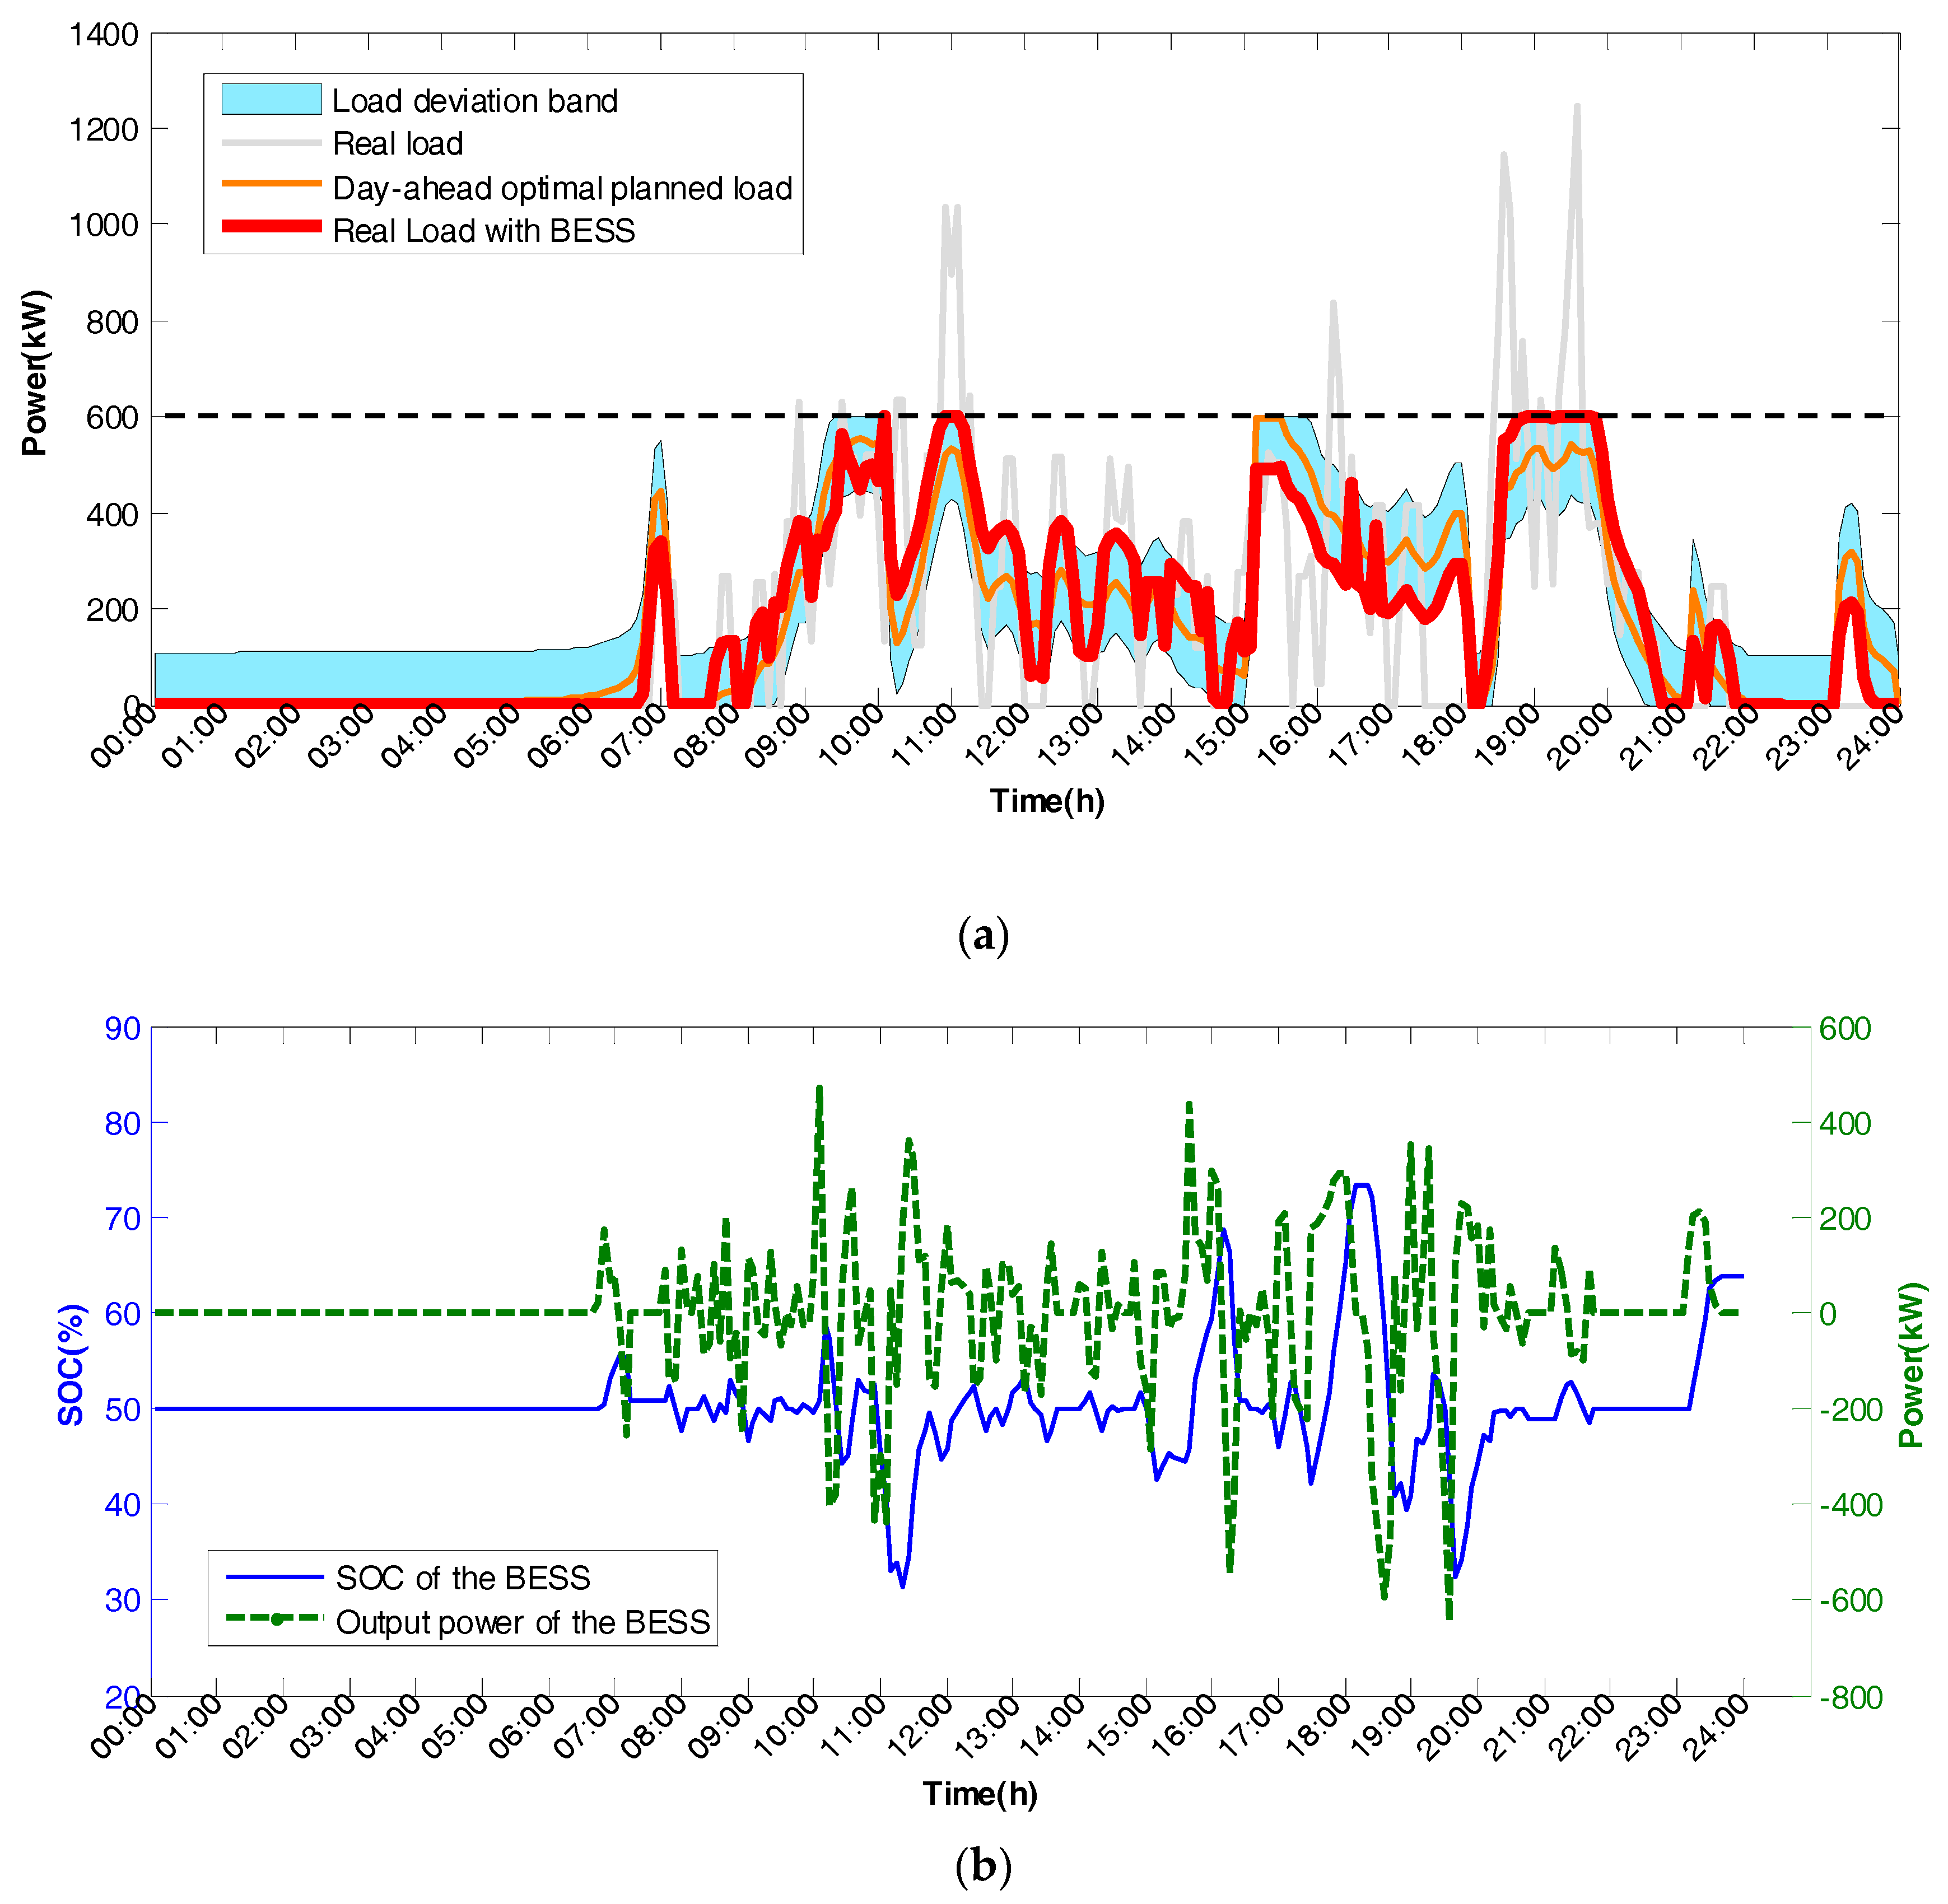
5.2. Real-Time Level Rolling Optimization Case Study

Three cases are provided here to illustrate the control effects of the real-time rolling optimization level, and validate the bi-level optimization strategy. In addition, by comparing these three cases with different day-ahead charging load forecasting accuracies, the robustness of the proposed strategy is validated. Note that all three cases are based on the day-ahead optimal planned load curve provided in Section 5.1. In this section, the parameters are the same as those listed in Table 1, except for the number of time indices in a rolling optimization period. Instead, m = 12 and the real-time control step is 5 min.

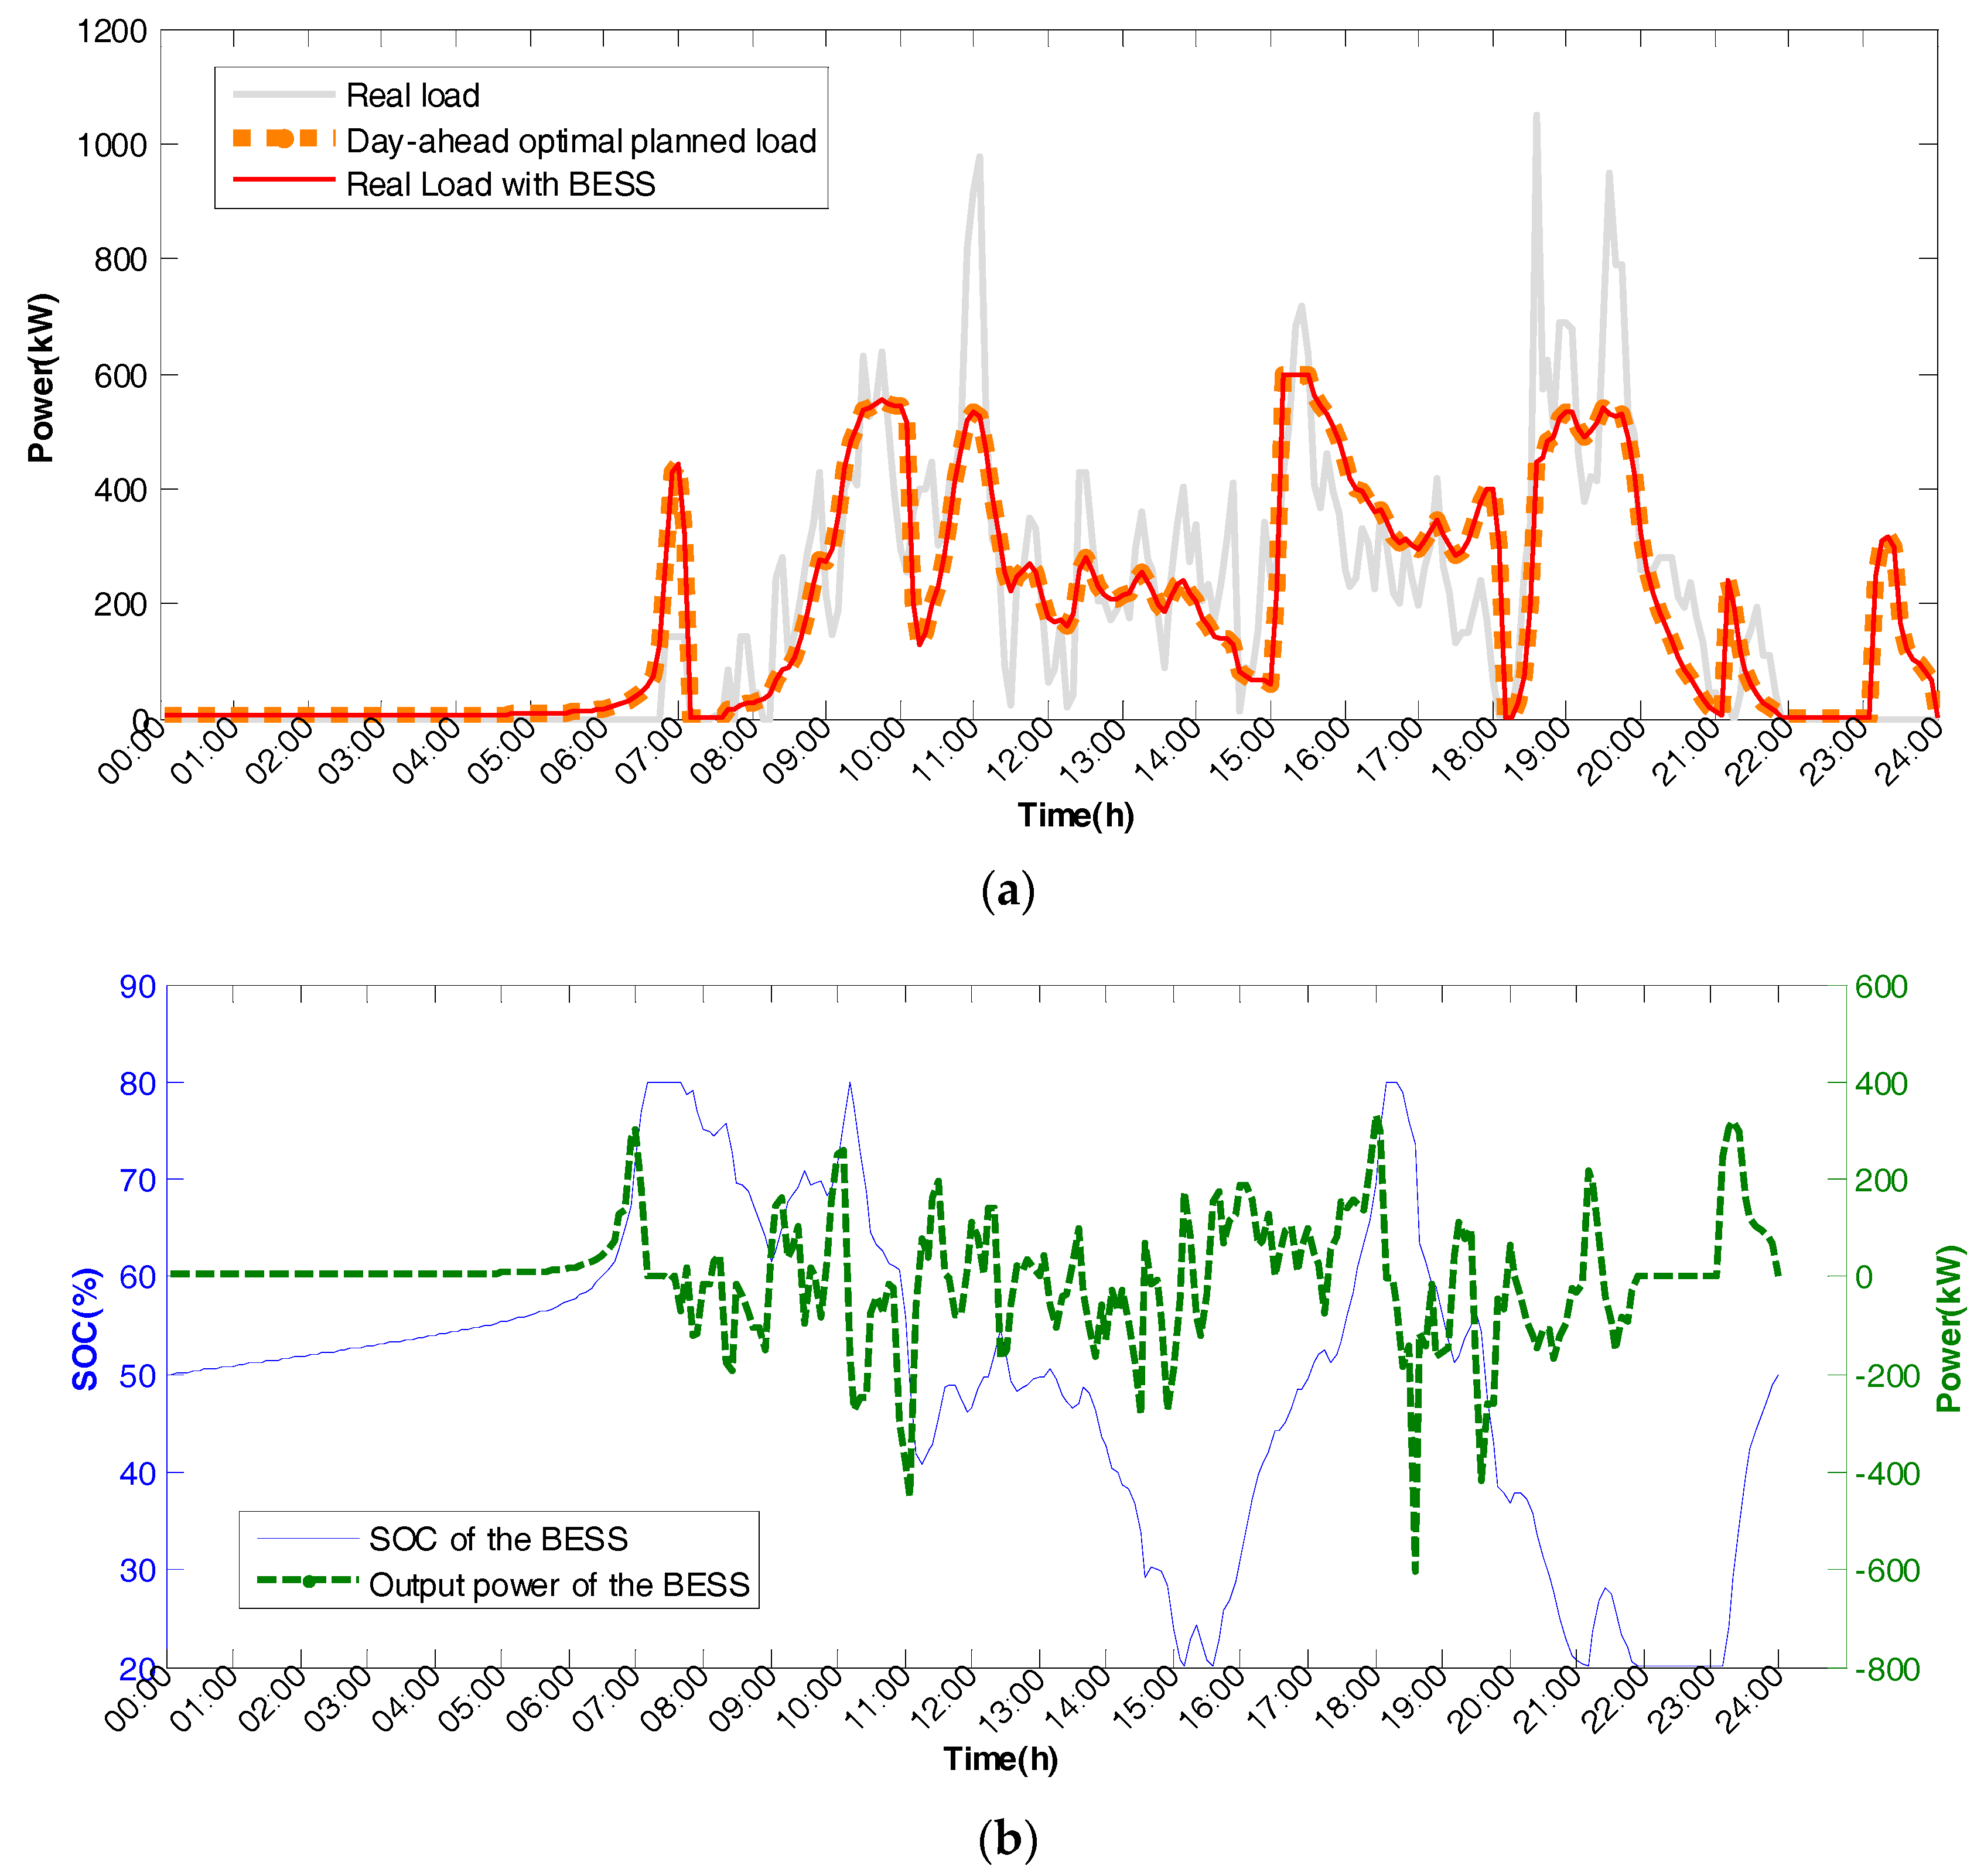
5.2.1. Real-Time Optimization Case I

In Case I, the day-ahead charging load forecasting accuracy is 100% as ideal, as shown in Figure 9. In this case, two types of BESS-based strategies are performed and compared: direct control and MPC-based control.
In Figure 9, the variance between the day-ahead forecasted loads and the real loads is 0. As detailed in Section 5.1, the peak charging load on the day-ahead optimal planned load curve was reduced to 598.4 kW from 1048.64 kW, whereas the load factor increased from 17.19% to 30.13%.
(1) The direct control strategy directly determines the BESS output from the difference between the day-ahead optimal planned value and the current charging load, considering the power and energy constraints of the BESS. Unlike rolling optimization, direct control does not have a rolling period, focusing only on control in the current moment and does not consider the future operation demands. The direct control result is shown in Figure 10.
From Figure 10, the control objectives have essentially been satisfied, as evidenced by the low day-ahead forecasting errors. However, from 7:05 to 7:25 a.m., 10:05 to 10:10 a.m., and 6:05 to 6:15 p.m., the SOC of the BESS reached the upper limit of 80%. This results in zero power output of the BESS, and may even cause the failure of the plan tracking for peak-shaving at those moments.
(2) The MPC-based real-time optimization strategy is a rolling optimization multistage decision-making problem approach. The control result is shown in Figure 11. The results illustrate that the MPC-based strategy also satisfied the objectives. Moreover, over the entire day, the SOC of the BESS never reached the upper limit of 80%, meaning that the MPC-based approach performed better than the direct control approach because of the rolling optimization mechanism.
The results and the horizontal comparison of the three different real-time charging load control approaches are shown in Table 3.
As shown in Table 3, the charging load control performance of the two real-time strategies were almost the same in Case I, but the variation in the SOC ranges were considerably reduced by MPC compared to direct control. The basic electricity cost per day was also reduced due to the reduced peak load caused by introducing the BESS. The TOU electricity costs per day were reduced by each of the three different real-time approaches.

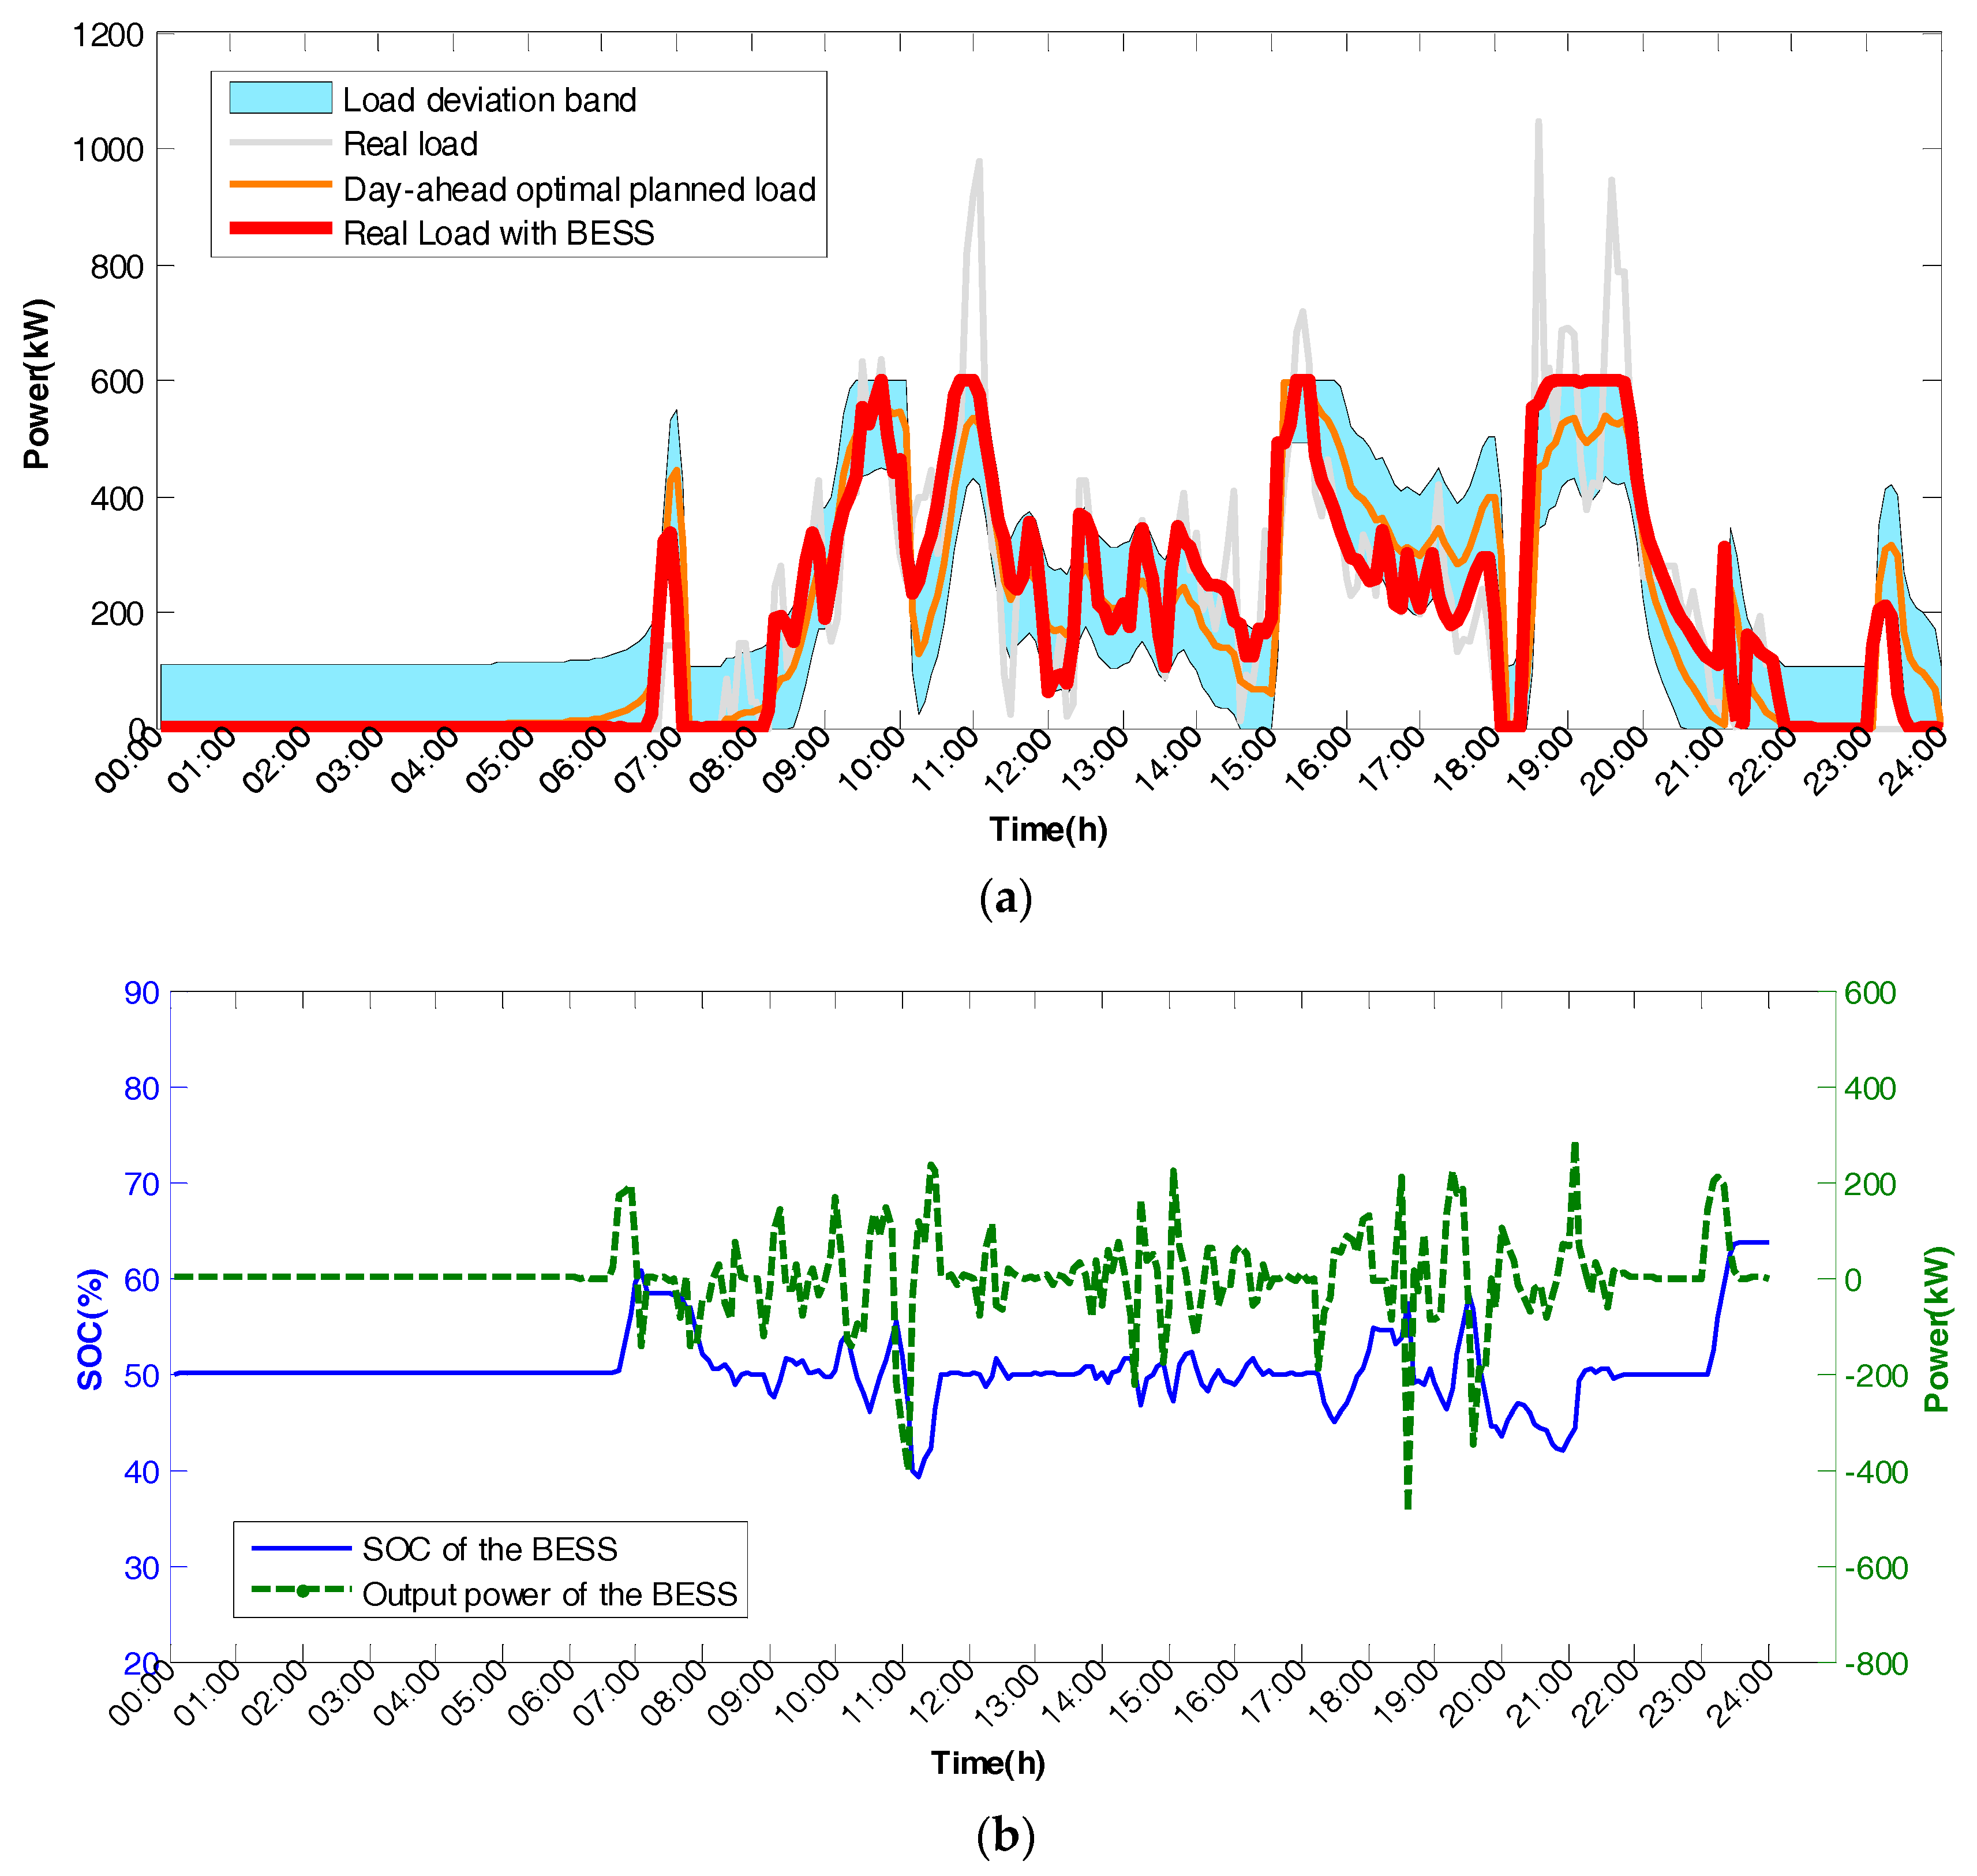
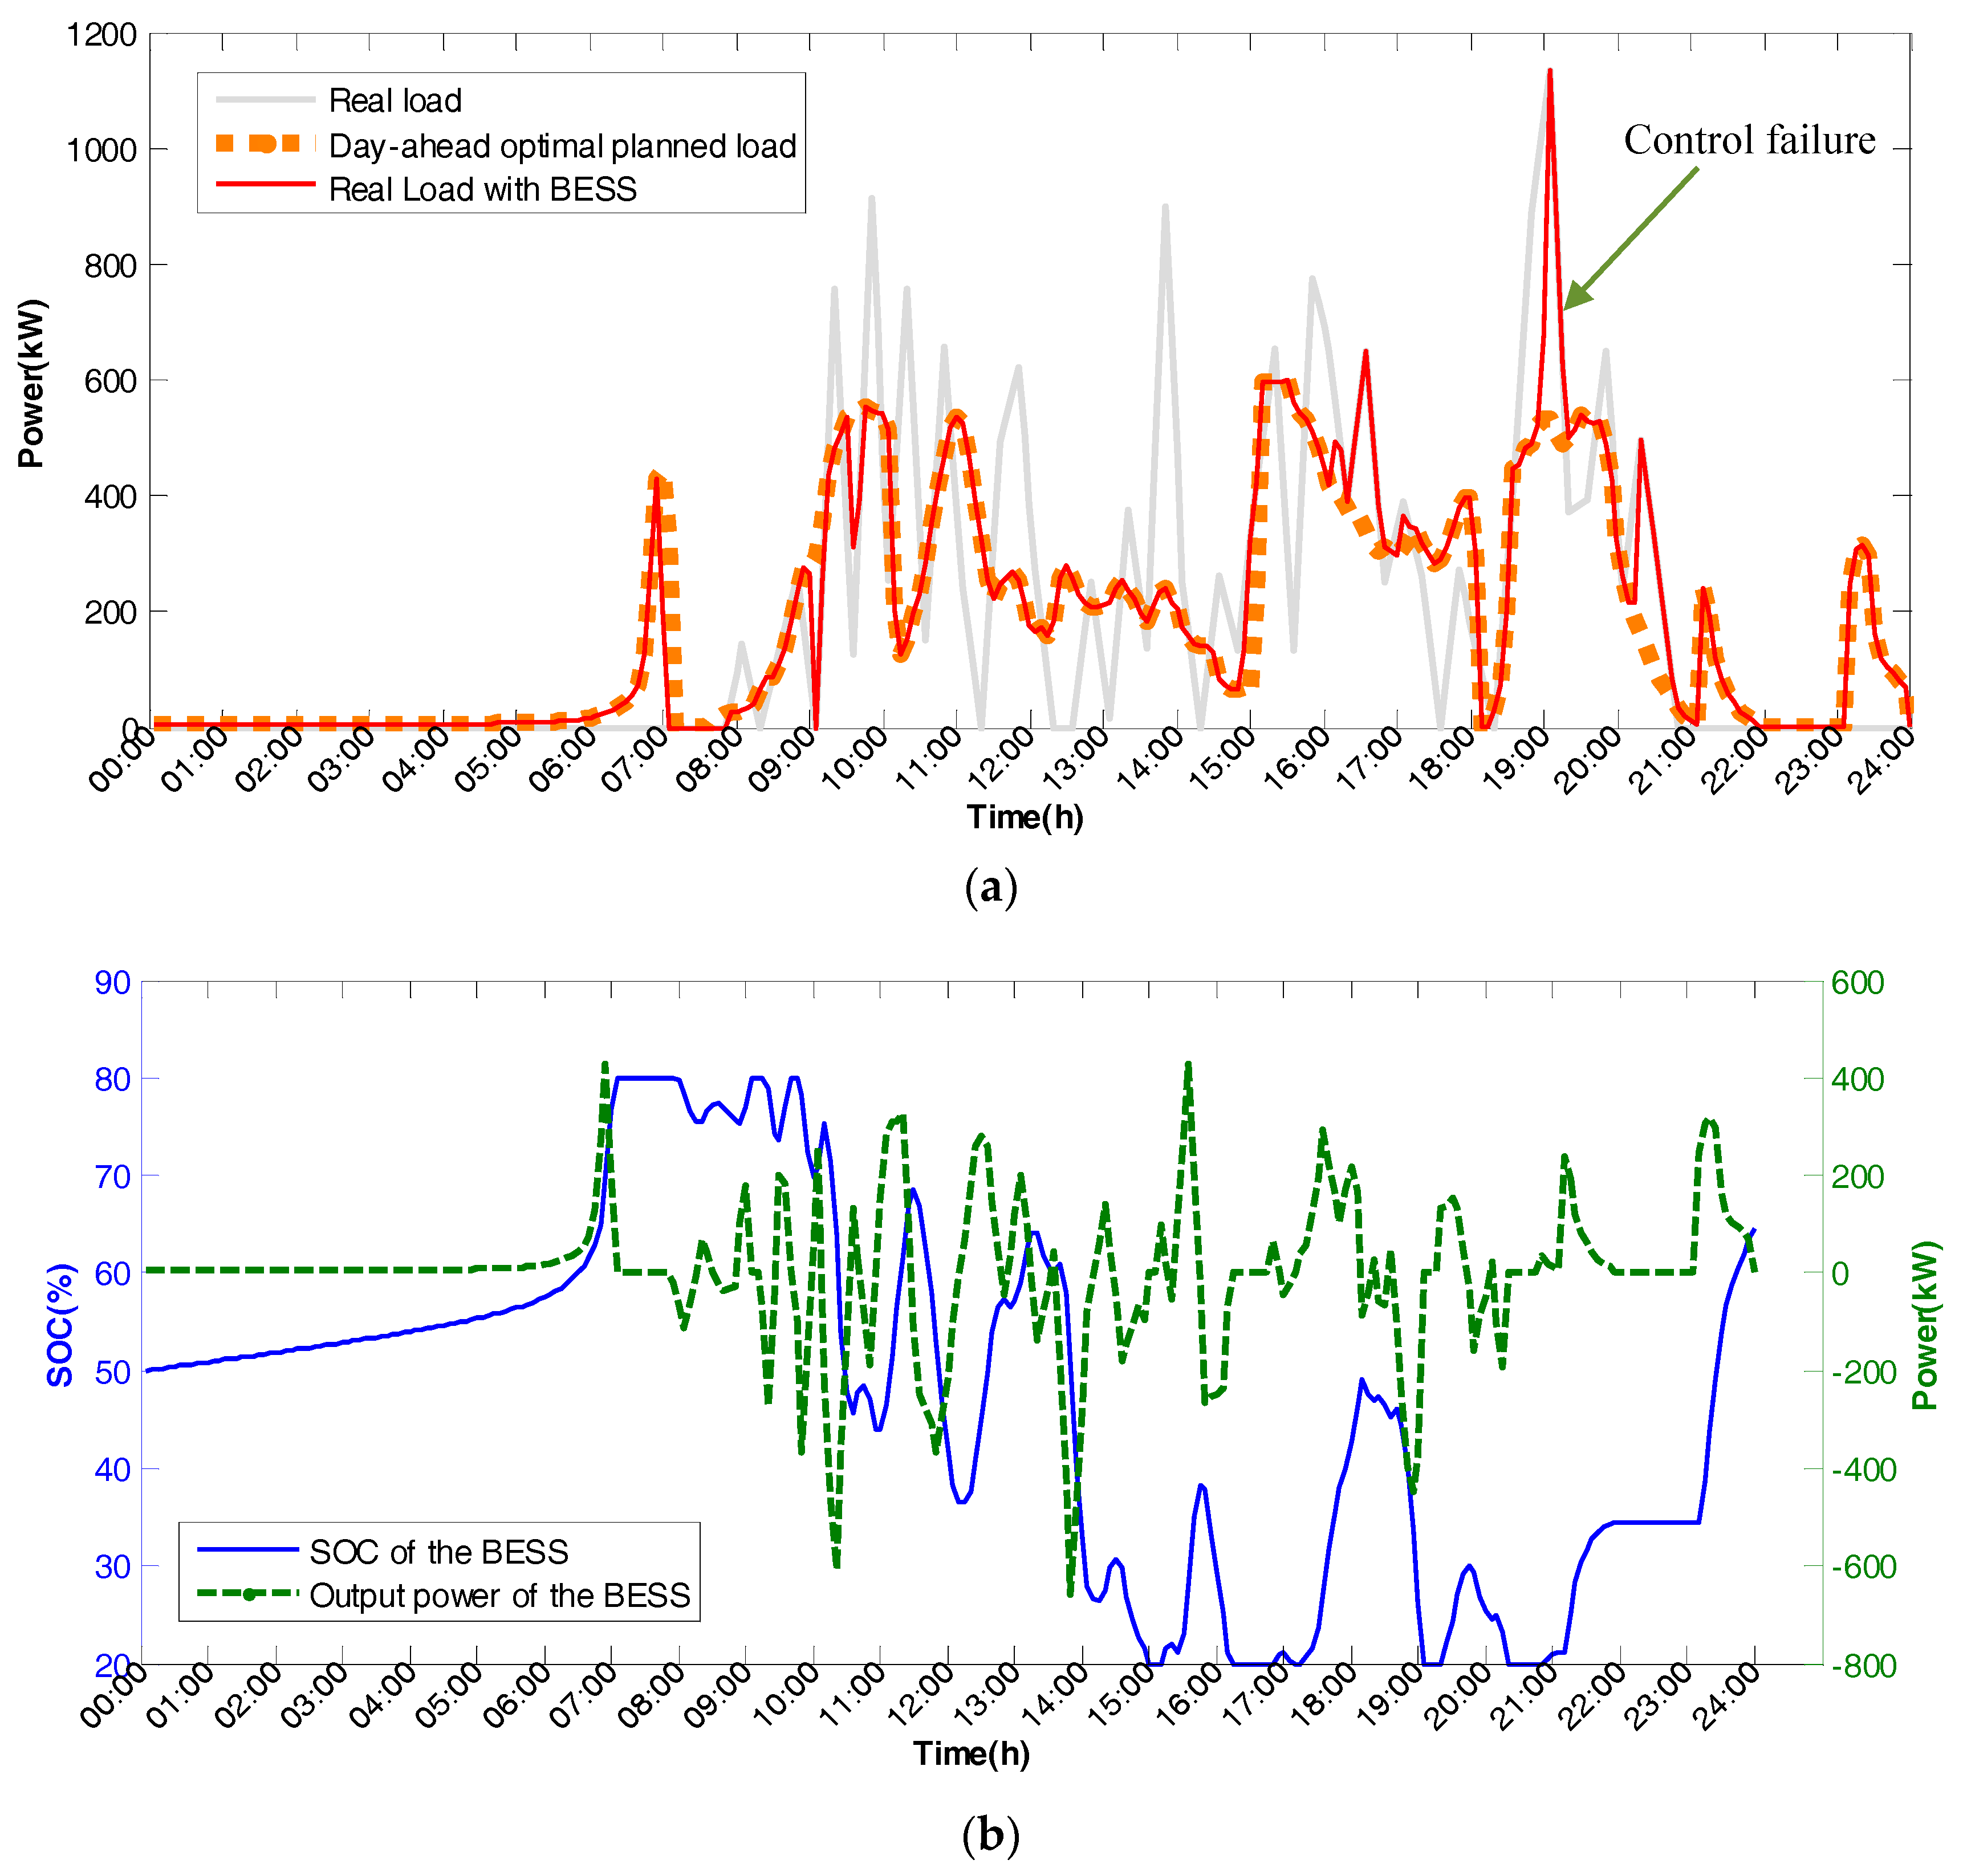
5.2.2. Real-Time Optimization Case II

In Case II, the day-ahead charging load forecasting accuracy was 87.27%, as shown in Figure 12. The variance between the day-ahead forecasted loads and the real loads was calculated as 15,145.4 which also means a larger load disturbance during daily operation.
(1) The control results of the direct control strategy for Case II are shown in Figure 13.
From Figure 13, from 7:35 to 7:45 p.m., the SOC of the BESS almost reached the lower boundary, and its energy was insufficient to shave the load peak to a value below the maximum constraint. This control failure was caused by the increased day-ahead forecasting errors, and the direct control strategy itself, which does not consider future demand and excessively consumed BESS energy in order to shave the peak to about 500 kW during the 6:20–6:50 p.m. time frame.
(2) The control results of the MPC-based real-time rolling optimization strategy are shown in Figure 14. Compared to the direct control results, the load peak from 7:35 to 7:45 p.m. was successfully shaved to the maximum acceptable power of 600 kW, due to the optimal usage of the BESS, which avoided the excessive consumption of BESS energy during the previous peak time frame of 6:20–6:50 p.m.
The results and the horizontal comparison of the two different real-time charging load control approaches are shown in Table 4.
As shown in Table 4, compared to the original situation with direct control and without BESS-based control, the MPC-based rolling optimization strategy significantly improved the charging load characteristics in Case II, even with disturbances. The peak load with direct control was 783.45 kW, which is more than the constraint of 600 kW, causing a failure in the charging load control. Additionally, the variation in the SOC ranges was considerably reduced by MPC compared to direct control, decreasing from 60% to 42.06%. The total electricity cost, including the TOU electricity cost and the basic electricity cost, was reduced by about 17% by BESS-based real-time control, whereas the direct control and MPC-based optimization total electricity costs were almost identical.

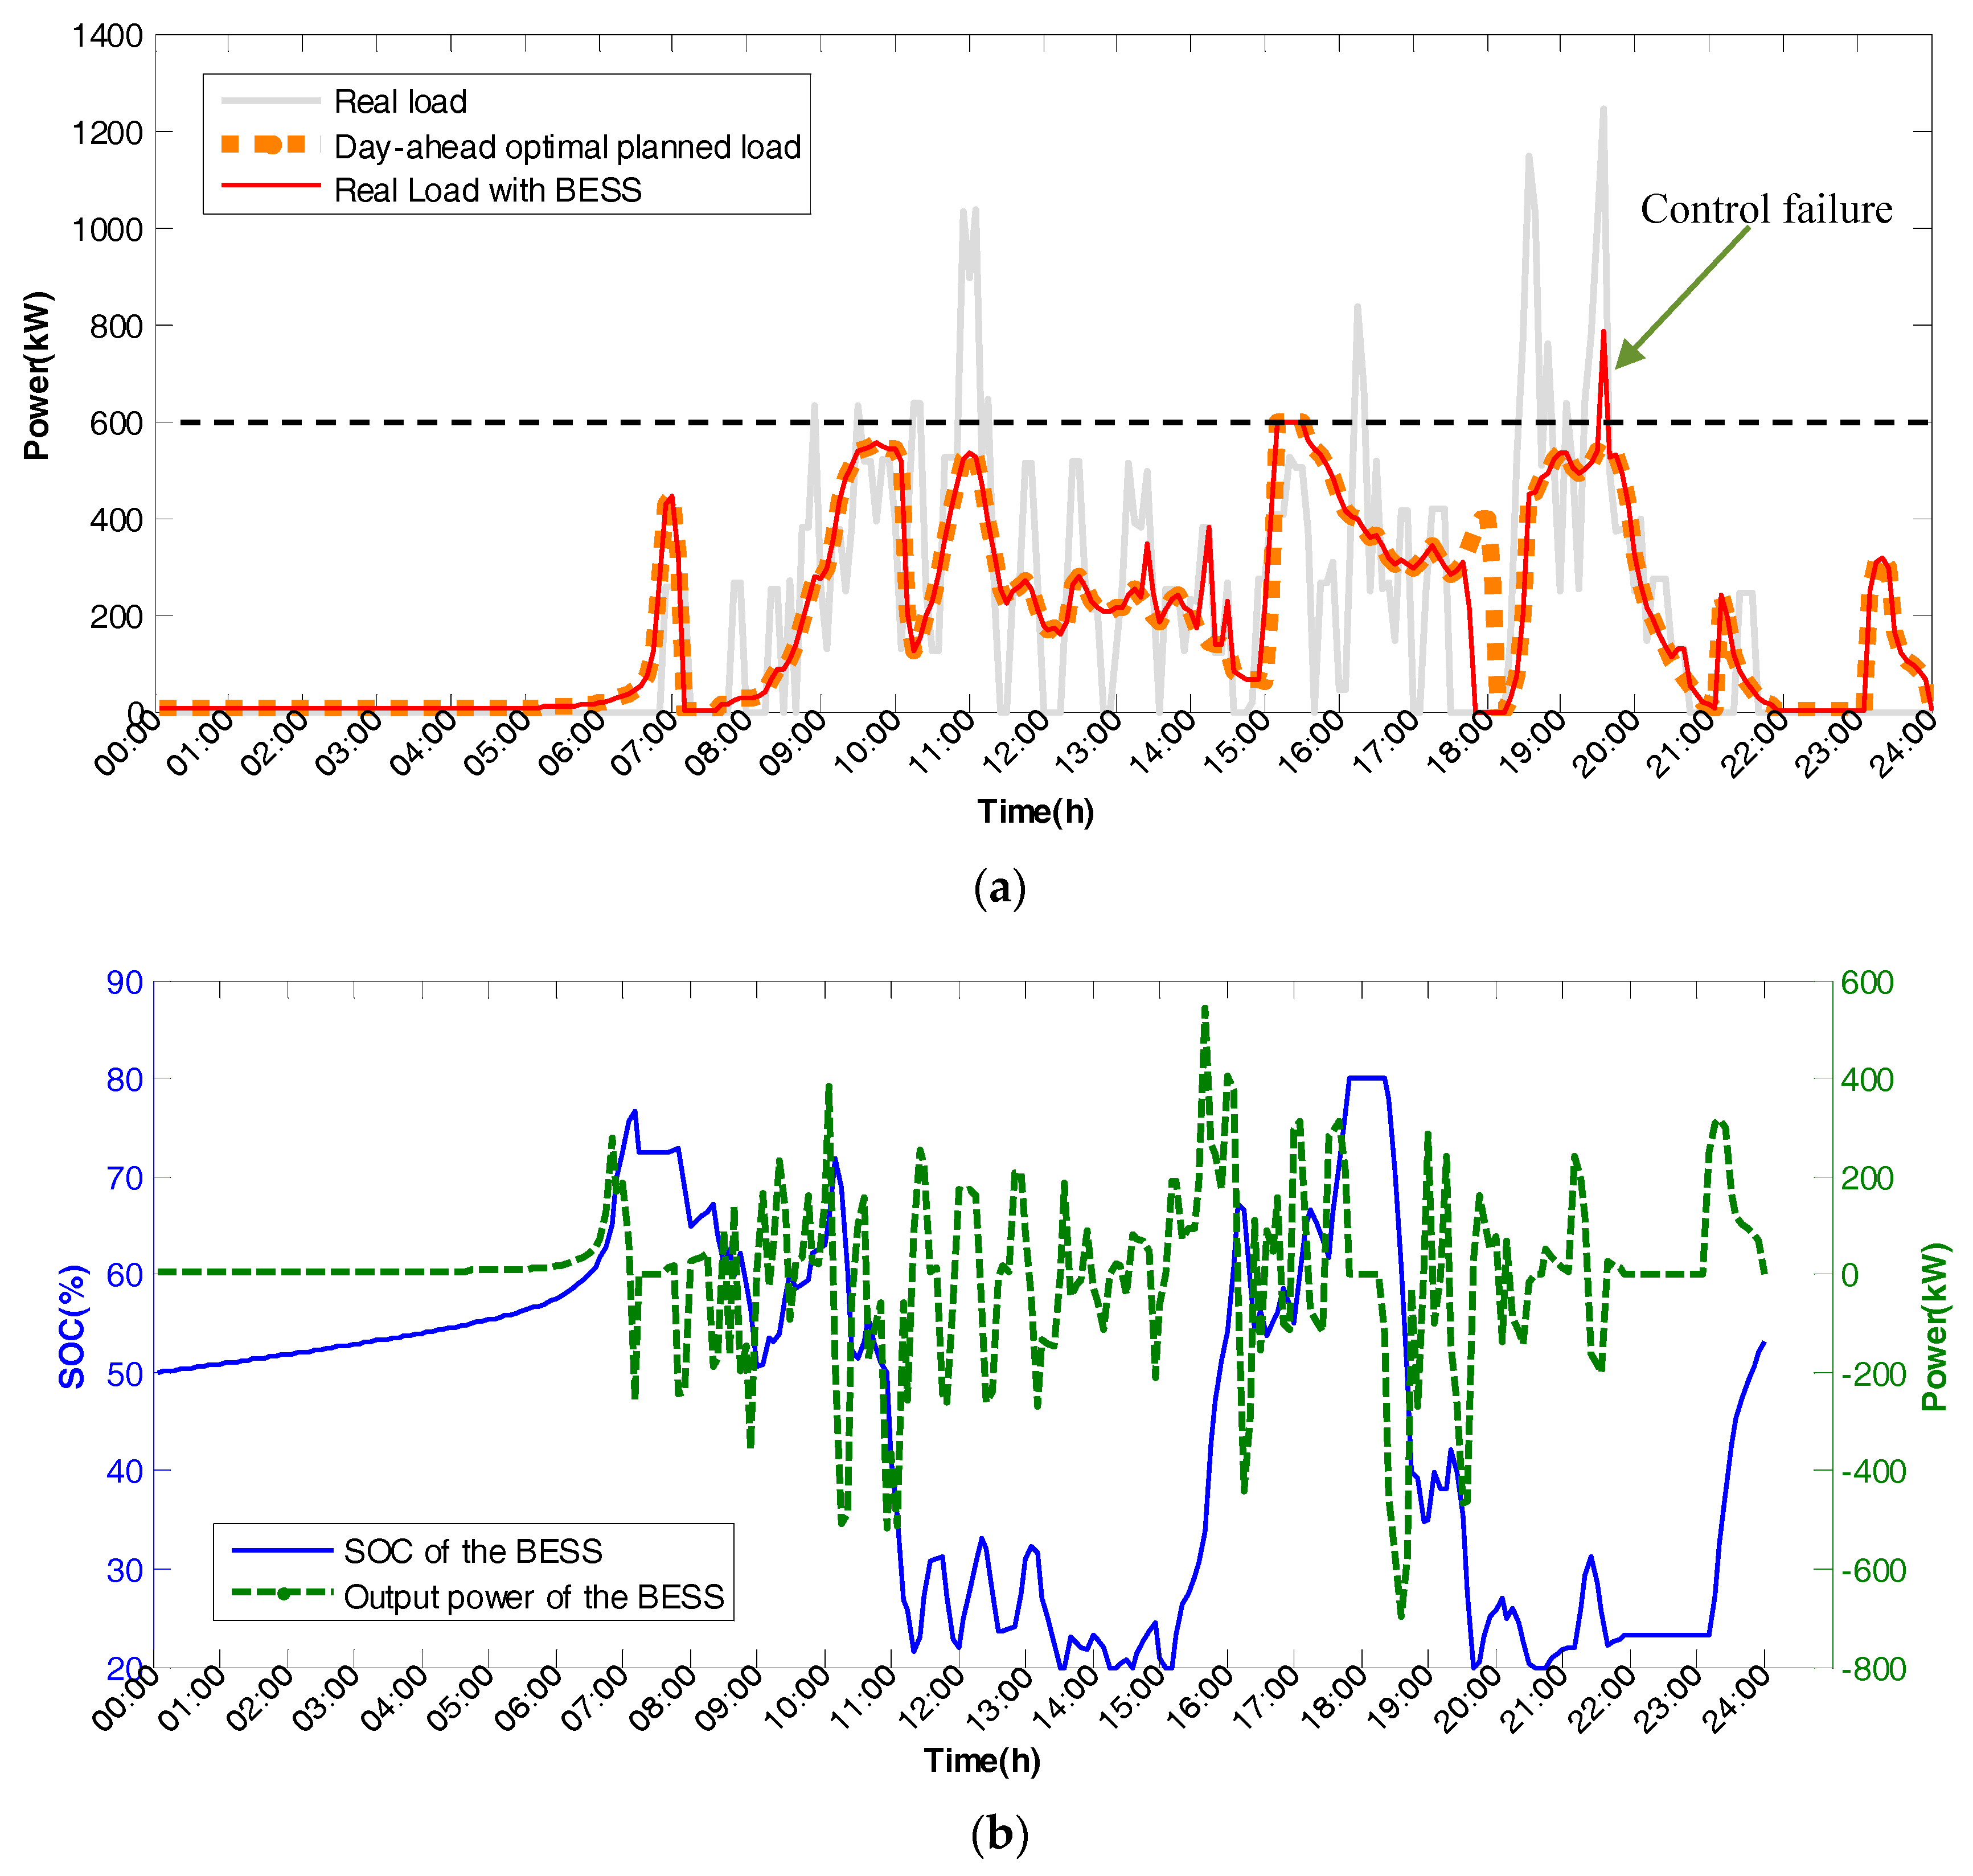
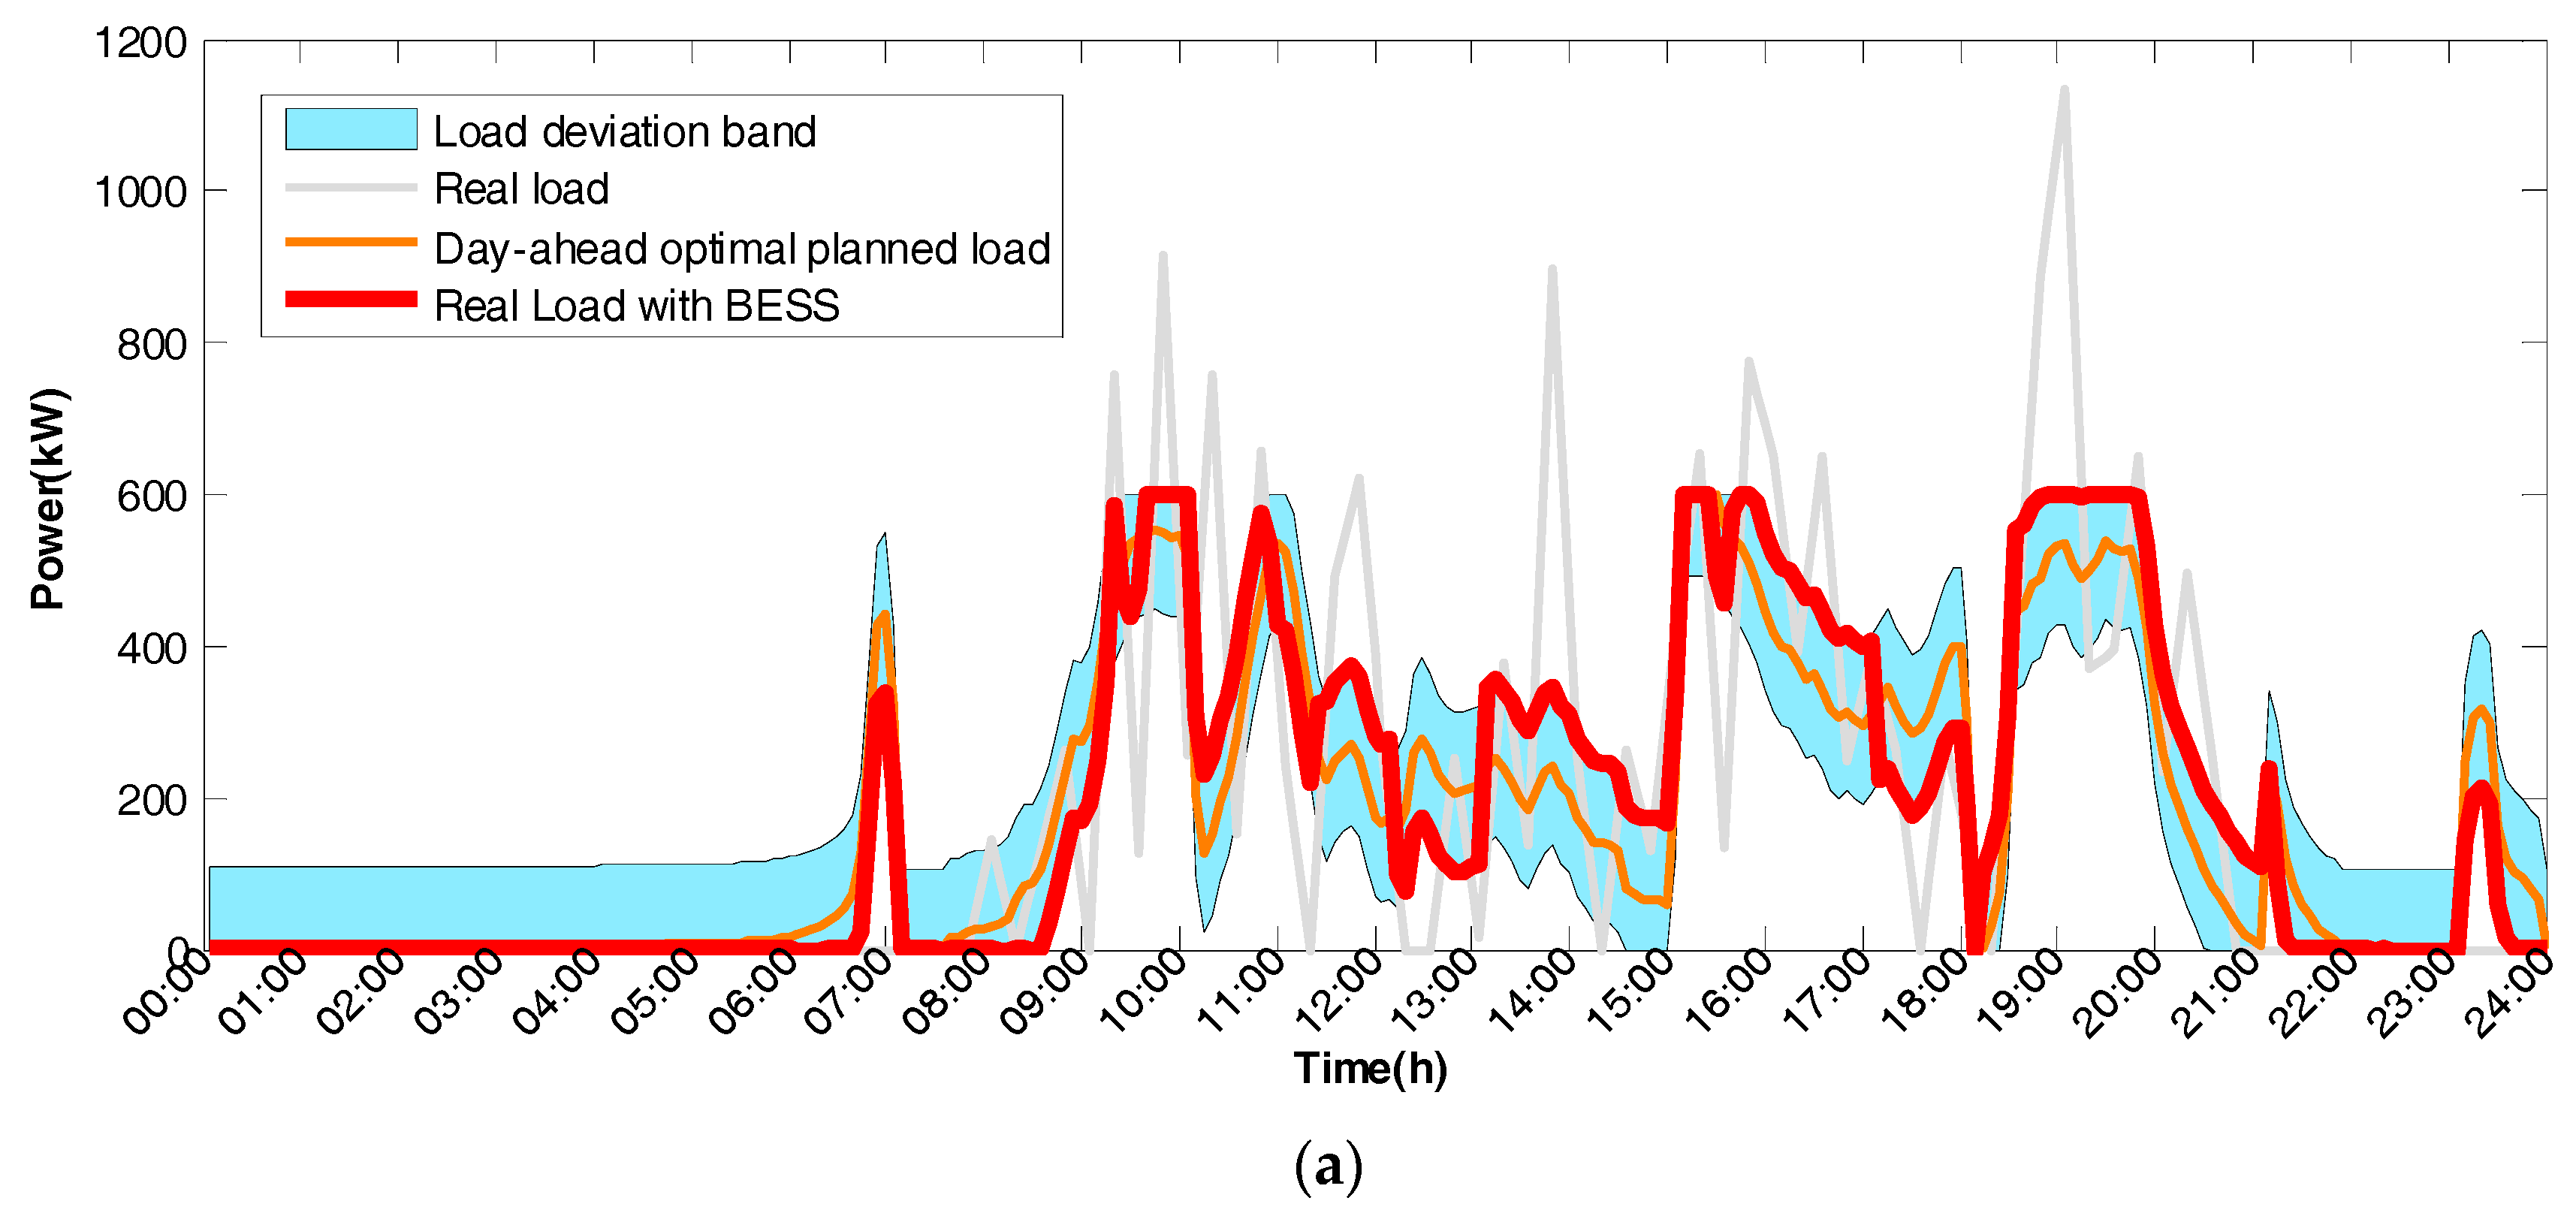
5.2.3. Real-Time Optimization Case III

In Case III, the day-ahead charging load forecasting accuracy was rather low, only 82.57%, as shown in Figure 15. The variance between the day-ahead forecasted loads and the real loads was calculated as 28,399.05, which is much higher than those in the previous cases and indicates a very large load disturbance in daily operation.
(1) The control results of the direct control strategy for Case III are shown in Figure 16.
As can be seen from Figure 16, from 7:00 to 7:15 p.m., an extreme situation occurred in which the maximum peak of the charging load was not reduced, due to a large day-ahead forecasting error occurring simultaneously, and the lack of optimization ability of the direct control strategy.
(2) The control results of the MPC-based real-time rolling optimization strategy for Case III are shown in Figure 17. Compared to the results of direct control, the load peak from 7:00 to 7:15 p.m. was successfully shaved to the maximum acceptable power of 600 kW due to the optimal usage of the BESS. This illustrates that the MPC-based real-time rolling strategy achieved the control objectives, even with a large load disturbance, due to the proposed optimization mechanism, which considers future operation demands.
The results and the horizontal comparison of the two different real-time charging load control approaches are shown in Table 5.
As shown in Table 5, the direct control completely failed at peak-shaving, but the MPC-based rolling optimization strategy significantly improved the charging load characteristics in Case III, even with large disturbances. This verifies the robustness of the MPC-based control strategy against load forecasting error and load disturbance.
Finally, based on the longitudinal comparison of the results of the three cases, we reached the following conclusions. Firstly, the MPC-based real-time rolling optimization strategy can significantly improve the charging load characteristics and satisfy the objectives and constraints, even with large forecasting errors, which also illustrates the robustness of the proposed approach. Secondly, the variation in the SOC range will increase with the decrease in the day-ahead charging load forecasting accuracy, but the MPC-based strategy can still ensure the smallest variation in the SOC range. Thirdly, the MPC-based real-time rolling optimization strategy can reduce the total electricity cost to benefit the station operator.
The bi-level optimization control strategy proposed in this paper is meant to be applied to the daily operation of a fast charging station. For practical applications, based on the day-ahead forecasted charging load, day-ahead level optimization generates the optimal planned load curve that satisfies the multiple control objectives. Then, using this day-ahead optimal planned load curve as the reference, real-time level rolling optimization can be used to attain the control objectives. This second level of optimization is an online real-time BESS control strategy that can be embedded into the energy management system of a charging station.

6. Conclusions

This paper introduces BESS to the charging load control of fast charging stations, to address the challenges posed by the unique fast charging characteristics. Consequently, we proposed a BESS-based bi-level optimization strategy for charging load regulation of the electric vehicle fast charging station to achieve multiple control objectives. The results of the case studies show that: (1) through linear programming, the day-ahead level optimization can generate a day-ahead optimal planned load curve or a deviation band as a reference to achieve the objectives of charging load peak-shaving, electricity cost minimization, and charging load change rate reduction. (2) By using the proposed MPC-based control, real-time level rolling optimization can achieve the day-ahead plan, and ensure the lifespan and available energy of the BESS. (3) The real-time level control approach, namely MPC-based control, exhibits better performance in peak-shaving, total electricity cost reduction, and minimizing the variation in the SOC range compared to the results without BESS introduced or with only direct control, due to the day-ahead optimal planned load deviation band and real-time rolling optimization. (4) The robustness of our bi-level optimization strategy against load disturbance was validated by the comparison of the results from the three case studies with different day-ahead charging load forecasting accuracies, which might have been affected by the driver’s personal habits or the traffic conditions. In addition, many potential extensions of the work reported in this paper are possible, such as case studies based on fast charging stations for different types of vehicles.

Acknowledgments

This work was supported by the National Key R&D Program of China [grant number 2016YFB0900500]; and the Fundamental Research Funds for the Central Universities [grant number 2016RC029].

Author Contributions

Yan Bao proposed the bi-level optimization model and strategy; Yu Luo performed the simulations; Yan Bao, Yu Luo, Weige Zhang, and Mei Huang analyzed the results; Le Yi Wang modified the paper; Jiuchun Jiang organized the structure of the paper.

Conflicts of Interest

The authors declare no conflict of interest.

References

  1. Madina, C.; Zamora, I.; Zabala, E. Methodology for assessing electric vehicle charging infrastructure business models. Energy Policy 2016, 89, 284–293. [Google Scholar] [CrossRef]
  2. Morrissey, P.; Weldon, P.; O’Mahony, M. Future standard and fast charging infrastructure planning: An analysis of electric vehicle charging behavior. Energy Policy 2016, 89, 257–270. [Google Scholar] [CrossRef]
  3. Chan, C.C. The state of the art of electric, hybrid, and fuel cell vehicles. Proc. IEEE 2007, 95, 704–718. [Google Scholar] [CrossRef]
  4. Serradilla, J.; Wardle, J.; Blythe, P.; Gibbon, J. An evidence-based approach for investment in rapid-charging infrastructure. Energy Policy 2017, 106, 514–524. [Google Scholar] [CrossRef]
  5. Xylia, M.; Leduc, S.; Patrizio, P.; Kraxner, F.; Silveira, S. Locating charging infrastructure for electric buses in Stockholm. Transp. Res. Part C Emerg. Technol. 2017, 78, 183–200. [Google Scholar] [CrossRef]
  6. Xiong, R.; He, H.; Sun, F.; Zhao, K. Online estimation of peak power capability of Li-ion batteries in electric vehicles by a hardware-in-Loop approach. Energies 2012, 5, 1455–1469. [Google Scholar] [CrossRef]
  7. Lee, J.; Madanat, S. Optimal design of electric vehicle public charging system in an urban network for Greenhouse Gas Emission and cost minimization. Transp. Res. Part C Emerg. Technol. 2017, 85, 494–508. [Google Scholar] [CrossRef]
  8. Marra, F.; Yang, G.Y.; Fawzy, Y.T.; Traeholt, C. Improvement of local voltage in feeders with photovoltaic using electric vehicles. IEEE Trans. Power Syst. 2013, 28, 3515–3516. [Google Scholar] [CrossRef]
  9. Sortomme, E.; Hindi, M.M.; Macpherson, S.D.J.; Venkata, S.S. Coordinated charging of plug-in hybrid electric vehicles to minimize distribution system losses. IEEE Trans. Smart Grid 2011, 2, 198–205. [Google Scholar] [CrossRef]
  10. Clement-Nyns, K.; Haesen, E.; Driesen, J. The impact of charging plug-in hybrid electric vehicles on a residential distribution grid. IEEE Trans. Power Syst. 2010, 25, 371–380. [Google Scholar] [CrossRef] [Green Version]
  11. Xu, Z.; Hu, Z.; Song, Y.; Zhao, W.; Zhang, Y. Coordination of PEVs charging across multiple aggregators. Appl. Energy 2014, 136, 582–589. [Google Scholar] [CrossRef]
  12. Han, J.; Park, J.; Lee, K. Optimal scheduling for electric vehicle charging under variable maximum charging power. Energies 2017, 10, 933. [Google Scholar] [CrossRef]
  13. Masoum, A.S.; Deilami, S.; Moses, P.S.; Masoum, M.A.S.; Abu-Siada, A. Smart load management of plug-in electric vehicles in distribution and residential networks with charging stations for peak shaving and loss minimization considering voltage regulation. IET Gener. Transm. Distrib. 2011, 5, 877–888. [Google Scholar] [CrossRef]
  14. Deilami, S.; Masoum, A.S.; Moses, P.S.; Masoum, M.A.S. Real-time coordination of plug-in electric vehicle charging in smart grids to minimize power losses and improve voltage profile. IEEE Trans. Smart Grid 2011, 2, 456–467. [Google Scholar] [CrossRef]
  15. He, L.; Yang, J.; Yan, J.; Tang, Y.; He, H. A bi-layer optimization based temporal and spatial scheduling for large-scale electric vehicles. Appl. Energy 2016, 168, 179–192. [Google Scholar] [CrossRef]
  16. D’Hulst, R.; Ridder, F.D.; Claessens, B. Decentralized coordinated charging of electric vehicles considering locational and temporal flexibility. Int. Trans. Electr. Energy Syst. 2014, 25, 2562–2575. [Google Scholar] [CrossRef]
  17. Zhang, W.; Zhang, D.; Mu, B.; Wang, L.Y.; Bao, Y.; Jiang, J.C.; Morais, H. Decentralized electric vehicle charging strategies for reduced load variation and guaranteed charge completion in regional distribution grids. Energies 2017, 10, 147. [Google Scholar] [CrossRef]
  18. Silvestre, M.L.D.; Sanseverino, E.R.; Zizzo, G.; Graditi, G. An optimization approach for efficient management of EV parking lots with batteries recharging facilities. J. Ambient Intell. Humaniz. Comput. 2013, 4, 641–649. [Google Scholar] [CrossRef]
  19. Tikader, R.; Ganguly, S. Energy management at municipal parking deck for charging of Plug-in hybrid electric vehicles. In Proceedings of the IEEE Students’ Conference on Electrical, Electronics and Computer Science, Bhopal, India, 1–2 March 2014; pp. 1–5. [Google Scholar]
  20. Zheng, Y.; Dong, Z.Y.; Xu, Y.; Meng, K.; Zhao, J.H.; Qiu, J. Electric vehicle battery charging/swap stations in distribution systems: Comparison study and optimal planning. IEEE Trans. Power Syst. 2014, 29, 221–229. [Google Scholar] [CrossRef]
  21. Yang, Z.; Sun, L.; Chen, J.; Yang, Q.; Chen, X.; Xing, K. Profit maximization for plug-in electric taxi with uncertain future electricity prices. IEEE Trans. Power Syst. 2014, 29, 3058–3068. [Google Scholar] [CrossRef]
  22. Yang, P.; Tang, G.; Nehorai, A. A game-theoretic approach for optimal time-of-use electricity pricing. IEEE Trans. Power Syst. 2013, 28, 884–892. [Google Scholar] [CrossRef]
  23. Awad, A.; Shaaban, M.; El-Fouly, T.; El-Saadany, E.; Salama, M. Optimal resource allocation and charging prices for benefit maximization in smart PEV-parking lots. IEEE Trans. Sustain. Energy 2017, 3, 906–915. [Google Scholar] [CrossRef]
  24. Yang, H.; Yang, S.; Xu, Y.; Cao, E.; Lai, M.; Dong, Z. Electric vehicle route optimization considering time-of-use electricity price by learnable partheno-genetic algorithm. IEEE Trans. Smart Grid 2015, 6, 657–666. [Google Scholar] [CrossRef]
  25. Liu, P.; Yu, J.; Fan, K.; Eissa, M. PEV charging coordination to absorb excess wind energy via group differentiated dual-tariff schemes. Electr. Power Syst. Res. 2017, 151, 208–217. [Google Scholar] [CrossRef]
  26. Islam, S.; Mithulananthan, N.; Lee, K.Y. Suitability of PV and battery storage in EV charging at business premises. IEEE Trans. Power Syst. 2017. [Google Scholar] [CrossRef]
  27. Graber, G.; Galdi, V.; Calderaro, V.; Mancarella, P. A stochastic approach to size EV charging stations with support of second life battery storage systems. In Proceedings of the IEEE PES PowerTech Conference, Manchester, UK, 18–22 June 2017; pp. 1–6. [Google Scholar]
  28. Makohin, D.; Jordan, F.V.; Zeni, V.S.; Lemos, K.H.M.; Pica, C.; Gianesini, M.A. Use of lithium iron phosphate energy storage system for EV charging station demand side management. In Proceedings of the IEEE International Symposium on Power Electronics for Distributed Generation Systems, Florianópolis, Brazil, 17–20 April 2017; pp. 1–6. [Google Scholar]
  29. Xiong, R.; Yu, Q.Q.; Wang, L.Y.; Lin, C. A novel method to obtain the open circuit voltage for the state of charge of lithium ion batteries in electric vehicles by using h infinity filter. Appl. Energy 2017, 207, 346–353. [Google Scholar] [CrossRef]
  30. Yu, Q.; Xiong, R.; Lin, C.; Shen, W.; Deng, J. Lithium-ion battery parameters and state-of-charge joint estimation based on h infinity and unscented kalman filters. IEEE Trans. Veh. Technol. 2017, 66, 8693–8701. [Google Scholar] [CrossRef]
  31. Xiong, R.; Cao, J.; Yu, Q.; He, H.; Sun, F. Critical review on the battery state of charge estimation methods for electric vehicles. IEEE Access 2017. [Google Scholar] [CrossRef]
  32. Ecker, M.; Nieto, N.; Käbitz, S.; Schmalstieg, J.; Blanke, H.; Warnecke, A. Calendar and cycle life study of Li(NiMnCo)O2-based 18650 lithium-ion batteries. J. Power Sources 2014, 248, 839–851. [Google Scholar] [CrossRef]
  33. Saxena, S.; Hendricks, C.; Pecht, M. Cycle life testing and modeling of graphite/LiCoO2, cells under different state of charge ranges. J. Power Sources 2016, 327, 394–400. [Google Scholar] [CrossRef]
  34. Xiong, R.; Tian, J.; Mu, H.; Wang, C. A systematic model-based degradation behavior recognition and health monitoring method for lithium-ion batteries. Appl. Energy 2017, 207, 372–383. [Google Scholar] [CrossRef]
  35. Mattingley, J.; Wang, Y.; Boyd, S. Receding horizon control: Automatic generation of high-speed solvers. IEEE Control Syst. Mag. 2011, 31, 52–65. [Google Scholar] [CrossRef]
  36. Maciejowski, J.M. Predictive Control with Constraints; Prentice Hall: London, UK, 2002; pp. 154–331. ISBN 0-201-39823-0. [Google Scholar]
Figure 1. Typical topology of a fast charging station.
Energies 11 00229 g001
Figure 2. Actual charging load curve of an electric bus fast charging station.
Energies 11 00229 g002
Figure 3. Logic diagram of the bi-level optimization strategy.
Energies 11 00229 g003
Figure 4. Schematic diagram for the day-ahead optimal planned load deviation band: (a) Without a load deviation band; (b) With a load deviation band.
Energies 11 00229 g004
Figure 5. The principle diagram of the BESS rolling optimization strategy.
Energies 11 00229 g005
Figure 6. Day-ahead forecasted charging loads of the fast charging station.
Energies 11 00229 g006
Figure 7. Day-ahead optimal planned load curve of the fast charging station.
Energies 11 00229 g007
Figure 8. Output power and state-of-charge (SOC) of the BESS during day-ahead optimization.
Energies 11 00229 g008
Figure 9. Day-ahead forecasted load, day-ahead optimal planned load, and real load curves for Case I.
Energies 11 00229 g009
Figure 10. Real-time control results by direct control strategy in Case I: (a) The charging load control results; (b) The output power and SOC of the BESS.
Energies 11 00229 g010
Figure 11. Real-time control results of the model predictive control (MPC)-based strategy in Case I: (a) The charging load control results; (b) The output power and SOC of the BESS.
Energies 11 00229 g011
Figure 12. Day-ahead forecasted load, day-ahead optimal planned load, and real load curves in Case II.
Energies 11 00229 g012
Figure 13. Real-time control results obtained with the direct control strategy in Case II: (a) The charging load control results; (b) The output power and SOC of the BESS.
Energies 11 00229 g013
Figure 14. Real-time control results obtained by the MPC-based strategy for Case II: (a) The charging load control results; (b) The output power and SOC of the BESS.
Energies 11 00229 g014
Figure 15. Day-ahead forecasted load, day-ahead optimal planned load, and real load curves for Case III.
Energies 11 00229 g015
Figure 16. Real-time control results of the direct control strategy for Case III: (a) The charging load control results; (b) The output power and SOC of the BESS.
Energies 11 00229 g016
Figure 17. Real-time control results of the MPC-based strategy for Case III: (a) The charging load control results; (b) The output power and SOC of the BESS.
Energies 11 00229 g017aEnergies 11 00229 g017b
Table 1. Parameters of the day-ahead level optimization.
ParameterValueUnit
Maximum grid-side power600kW
Minimum grid-side power0kW
Maximum charging load change rate10%-
Minimum charging load change rate−10%-
Maximum permitted percentage of BESS energy80%-
Minimum permitted percentage of BESS energy20%-
BESS original SOC50%-
Maximum output power of BESS800kW
Minimum output power of BESS−800kW
Table 2. Large industrial time-of-use (TOU) electricity tariff in Beijing.
TimePrice GradePrice (CNY/kWh)
0:00–7:00Valley0.3946
7:00–10:00Flat0.6950
10:00–15:00Peak1.0044
15:00–18:00Flat0.6950
18:00–21:00Peak1.0044
21:00–23:00Flat0.6950
23:00–24:00Valley0.3946
Table 3. Comparison of the results of two different real-time approaches for Case I.
ItemWithout BESS-Based ControlDirect ControlMPC
Peak load (kW)1048.64598.4600
Load factor17.19%30.13%30.53%
Peak-valley difference (kW)1048.64598.4600
Maximum SOC-80%63.74%
Minimum SOC-20%39.17%
Variation range of SOC-60%24.56%
TOU electricity cost (CNY/Day)3805.843530.083584.73
Basic electricity cost (CNY/Day)1597.93911.85914.29
Table 4. Comparison of the results of the two different real-time approaches for Case II.
ItemWithout BESS-Based ControlDirect ControlMPC
Peak load (kW)1244.37783.45600
Load factor14.35%22.88%30.24%
Peak-valley difference (kW)1244.37783.45600
Maximum SOC-80%73.36%
Minimum SOC-20%31.3%
Variation range of SOC-60%42.06%
TOU electricity cost (CNY/Day)3790.283546.273747.06
Basic electricity cost (CNY/Day)1896.181193.83914.29
Table 5. Comparison of the results of the two different real-time approaches for Case III.
ItemWithout BESS Based ControlDirect ControlMPC
Peak load (kW)1134.841134.84600
Load factor16.45%16.72%31.59%
Peak-valley difference (kW)1134.841134.84600
Maximum SOC-80%67.9%
Minimum SOC-20%27.25%
Variation range of SOC-60%40.65%
TOU electricity cost (CNY/Day)3946.153777.823902.7
Basic electricity cost (CNY/Day)1729.281729.28914.29

