Abstract
Coal matrix deformation is one of the main controlling factors for coal reservoir permeability changes in nitrogen foam fracturing. The characteristics and mechanism of coal matrix deformation during the process of adsorption/desorption were studied by isothermal adsorption/desorption experiments with methane and nitrogen. Based on the free-energy theories, the Langmuir equation, and elastic mechanics, mathematical models of coal matrix deformation were developed and the deformation characteristics in adsorption/desorption processes were examined. From the study, we deduced that the coal matrix swelling, caused by methane adsorption, was a Langmuir-type relationship with the gas pressure, and exponentially increased as the adsorption quantity increased. Then, the deformation rate and amplitude of the coal matrix decreased gradually with the increase of the pressure. At the following stage, where nitrogen replaces methane, the coal matrix swelling continued but the deformation amplitude decreased, which was only 19.60% of the methane adsorption stage. At the mixed gas desorption stage, the coal matrix shrank with the reduction of pressure and the shrinkage amount changed logarithmically with the pressure, which had the hysteresis effect when compared with the swelling in adsorption. The mechanism of coal matrix deformation was discussed through a comparison of the change of micropores, mesopores, and also part macropores in the adsorption process.
1. Introduction
A coal seam is a kind of typical heterogeneous unconventional natural gas reservoir, developed abundantly in pores and fractures [1,2]. Pores in the coal matrix are the main space that adsorbs coalbed methane (CBM), and pores and fractures are also the main channels for CBM diffusion and migration [3,4]. Compared to those in other countries, coal reservoirs in China are characterized by low reservoir pressure, low gas saturation, and low permeability. The permeability of most coal seams ranges from 10−4 to 10−1 mD [5,6,7,8]. Nitrogen foam fracturing was introduced into CBM exploitation, as traditional hydraulic fracturing for coal reservoirs cannot sufficiently enhance the permeability significantly in the complex geological conditions of China. Therefore, nitrogen foam fracturing has been introduced into CBM exploitation as a new technique in recent years [9,10,11,12]. High pressure nitrogen gas is injected into the coal reservoir, which can improve the recovery efficiency of CBM [5,13,14,15,16].
Nitrogen foam fracturing has many advantages for CBM reservoir reconstruction. However, due to nitrogen adsorption, the pressure of the reservoir increases and the coal matrix swells, which leads to a decrease in coal reservoir permeability. Studies on the relationship between the swelling deformation of the coal matrix and the adsorption of methane and nitrogen are helpful for precise control of the nitrogen volume in the fracturing process.
Nitrogen foam fracturing involves multicomponent gas adsorption/desorption, replacement, and interaction. The coal matrix swells and shrinks, and coal reservoir permeability decreases and increases accordingly [17,18,19,20]. As is widely known, methane adsorption in coal is through physical adsorption. The adsorption quantity of coal is not only associated with its own properties (pore features, coal–rock composition, coal rank, and moisture content), but also associated with temperature, gas types, and coal particle size [21,22,23,24].
In recent years, research on coal matrix deformation has mainly focused on adsorption gas types, adsorption quantity, gas pressure, and so on. Lin and Zhou calculated the deformation of coal samples by experiments; the deformation amplitude was CO2 > CH4 > N2. As the gas pressure and adsorption quantity increases, the coal sample swelling deformation basically follows the Langmuir equation. In the desorption process, the shrinkage deformation of coal samples decreases exponentially [25]. A study has shown that coal matrix deformation is associated with the adsorption quantities of different gases: the nitrogen adsorption quantity is the lowest. Its deformation is lower than other gases, and has a linear relationship with adsorption quantity [26]. Through laboratory experiments or numerical simulations, the relationship between coal matrix deformation and the pressure or adsorption quantity of gas can be estimated. However, due to the differences in the experimental apparatus, measuring methods, selection of samples, and simulation calculation models, there are differences in the relationship between coal matrix deformation and the pressure or adsorption quantity of gas [27,28,29,30,31]. The deformation of the coal matrix plays an important role in the change of coal reservoir permeability [32,33].
Most researchers have focused on pure or mixed gas adsorption-induced coal matrix deformation. Studies on the continuous deformation characteristics of the coal matrix during the process of methane replacement by nitrogen injection, which involves two kinds of gas adsorption/desorption and their interactions, are relatively few in number.
This paper studied the coal matrix deformation models at different stages by performing isothermal adsorption/desorption experiments of methane replacement by nitrogen injection. Combining the experimental results, the deformation law of the coal matrix and the relationship between the coal matrix and its adsorption quantity or pressure was studied, which can provide technical support and a theoretical basis for tuning injection parameters in nitrogen foam fracturing and predicting coal reservoir permeability. By comparing the characteristics of pore development in the samples before and after isothermal adsorption experiments, the mechanism of coal matrix deformation was discussed. Finally, the results revealed whether the output and migration of CBM was of benefit.
2. Deformation Model
The coal matrix deformation experiment was divided into three stages: the first stage is the methane adsorption process; the second stage is the nitrogen injection process; and the third stage is the desorption process by pressure decrease. Assuming that the temperature of the gas adsorption and desorption process remains unchanged, the gas pressure does not affect the compressibility of the coal matrix under the low-pressure condition. Based on the theories of surface free energy, the Langmuir equation, and elastic mechanics, the deformation models were established at different stages.
2.1. Methane Adsorption Swelling Model
Assuming that the coal matrix is an isotropic elastic body, the change in the elastic energy equals the change in the surface energy of the coal matrix caused by the adsorption. Bangham considered that the swelling deformation of the coal matrix was proportional to its surface free energy decrease, and that the surface free energy could be considered as the surface tension of the unit length, so the swelling deformation of the coal matrix was proportional to the decrease in surface tension [34,35]. The relationship between the swelling deformation and the surface tension reduction of the coal matrix is expressed in Equation (1):
where ε is the coal matrix deformation, 1; ρc is the coal matrix density, cm3/g; S is the specific surface area, m2/g; Δr is the surface tension reduction, N·m−1; and E is the elastic modulus, Pa.
After the coal matrix absorbs methane, the surface tension will decrease. The surface tension reduction can be calculated by the Gibbs formula [36]:
In Equation (2), R is the universal gas constant, 8.314 J/(mol·K); T is the absolute temperature, K; Γ is the surface excess, mol/m2; and P is the adsorption gas pressure, Pa.
According to the principle of minimum energy, the carbon atoms in the surface of the coal matrix can reduce its specific surface energy by adsorption of methane molecules, so that the methane adsorption concentration in the pores or fractures is lower than that on the surface. The methane concentration difference is known as surface excess, which can be expressed as
where V is the standard state volume of the adsorbed gas, cm3; and V0 is the molar volume of gas, cm3/mol [37,38].
When the methane pressure increases from P1 to P2, by substituting Equations (2) and (3) into Equation (1), the coal matrix deformation can be expressed as follows:
The adsorption volume of coal matrix is usually expressed by the Langmuir equation [39]:
where VCH4 is the volume of methane adsorption, cm3/g; a is the maximum adsorption quantity, cm3/g; and b is the adsorption equilibrium constant, MPa−1.
When the methane pressure increases from P1 to P2, the coal matrix swelling deformation can be expressed as
Equation (6) shows that the adsorption quantity of the coal matrix increases as the pressure increases, and the coal matrix swells. The coal matrix deformation is associated with the gas pressure, temperature, and the characteristics of the adsorbent. Compared with the adsorption model of coal–rock by [40], the adsorption swelling model in this paper only considered changes of the adsorption quantity and the pressure, from which the coal matrix deformation under different gas pressure can easily be calculated.
2.2. Nitrogen Injection Swelling Model
Previous studies have shown that the adsorption quantity of the coal matrix with regards to different gases is different, and that the adsorption quantity of methane is higher than that of nitrogen [21,41].
After nitrogen injection, the nitrogen and the methane will compete for adsorption. The calculation of multicomponent gas adsorption quantity is based on the extended Langmuir equation [42,43]:
where VN2 and VCH4 are the adsorption quantities of nitrogen and methane, respectively, cm3/g; aN2 and aCH4 are the maximum adsorption quantities of nitrogen and methane, respectively, cm3/g; bN2 and bCH4 are the adsorption equilibrium constants of nitrogen and methane, respectively, MPa−1; and PN2 and PCH4 are the partial pressures of nitrogen and methane, respectively, in the adsorption equilibrium state, MPa.
In the adsorption equilibrium state, the equilibrium pressure is the sum of the two partial pressures:
where P is the equilibrium pressure, MPa.
In Equation (10), XN2 and XCH4 are the molar fractions of nitrogen and methane, respectively, in the free phase, %. Their values can be tested by gas chromatograph, and XN2 + XCH4 = 1.
From the initial to the equilibrium state, set the nitrogen pressure from 0 to P3, and the methane pressure from P2 to P4. According to Equation (4), during the process of nitrogen replacing methane, the coal matrix deformation can be deduced from Equations (11) and (12):
where ΔεN2 and ΔεCH4 are the coal matrix deformations induced by nitrogen and methane adsorption, respectively, 1.
As the nitrogen injection rate is slow and constant, the partial pressure of nitrogen can be considered to increase linearly. The relationship between the partial pressure of nitrogen and the equilibrium pressure is given by Equation (13):
where u and w are the fitting constants given by the experimental results.
From Equations (9), (10), and (13), the relationship between the partial pressure of nitrogen and methane can be obtained.
Then, from Equations (7), (11), and (15), the coal matrix deformation model caused by nitrogen adsorption or replacement can be obtained.
Analogously, from Equations (8), (12), and (14), the coal matrix deformation model caused by methane adsorption can be obtained.
In the nitrogen injection process, the total deformation of the coal matrix caused by nitrogen and methane is given by Equation (18):
where Δεt is the total deformation of the coal matrix induced by nitrogen and methane, 1.
2.3. Shrinking Model in Methane and Nitrogen Desorption
In the desorption process, as the pressure decreases, the molar fractions of nitrogen and methane in the free phase change dynamically. When the pressure is low, the relationship between the ratio of nitrogen and methane molar fractions and the equilibrium pressure is linear:
where m and n are the fitting constants.
According to Equation (10), the relationship between the partial pressures of the two gases and the equilibrium pressure can be expressed as:
Combined with Equation (9), the relationships between the partial pressures of the two gases can be obtained:
During the process of pressure reduction, the partial pressure of nitrogen changes from PN21 to PN22, and the partial pressure of methane changes from PCH41 to PCH42. According to Equation (4), the coal matrix deformation induced by nitrogen or methane is obtained.
From Equations (7), (22), and (23), the model of nitrogen-induced shrinking deformation of the coal matrix is obtained.
Similarly, from Equations (8), (21), and (24), a model of methane-induced shrinking deformation of the coal matrix is obtained.
In the desorption process, as there are two kinds of gas desorption, the shrinking deformation of the coal matrix was also caused by two kinds of gas desorption. The total deformation is:
where Δεj is the total deformation of the coal matrix induced by the two kinds of gas desorption, 1.
3. Experimental Methods and Results
3.1. Isothermal Adsorption–Desorption Experiments
To study coal matrix deformation throughout the whole process, isothermal adsorption/desorption experiments of methane replacement by injection nitrogen were undertaken. The coal samples were collected from the No. 3 coal seam of Yuwu mine in the southern Qinshui basin of Shanxi Province, which belongs lean coal. According to the borehole temperature data, the experimental temperature was set to 298.15 K. The raw coal was naturally dried, divided, and ground to 0.18–0.25 mm (60–80 mesh) following Chinese Standard Method GB 474-2008 [44]. The equilibrium water coal samples were prepared according to the Chinese Standard Method GB/T 19560-2008 [45].
Experimental apparatus: (1) ISO-300 isothermal adsorption/desorption instrument (Terra Tek, Inc., Salt Lake City, UT, USA), equipped with pressure sensors and data automatic recording and processing software, which could record the balance pressure, the gas adsorption quantity, and other experimental parameters; (2) SP-2100A gas chromatography (Beijing Beifen-Ruili Analytical Instrument Co., Ltd., Beijing, China), which was used to test the composition and concentration of free gases in the adsorption/desorption equilibrium state.
To obtain the adsorption quantity and adsorption constants of methane and nitrogen, the isothermal adsorption experiments for methane and nitrogen were carried out. The density, physical, and mechanical parameters of the coal samples were tested, and their values are shown in Table 1.

Table 1.
Gas adsorption constant, density, and modulus of elasticity of coal samples.
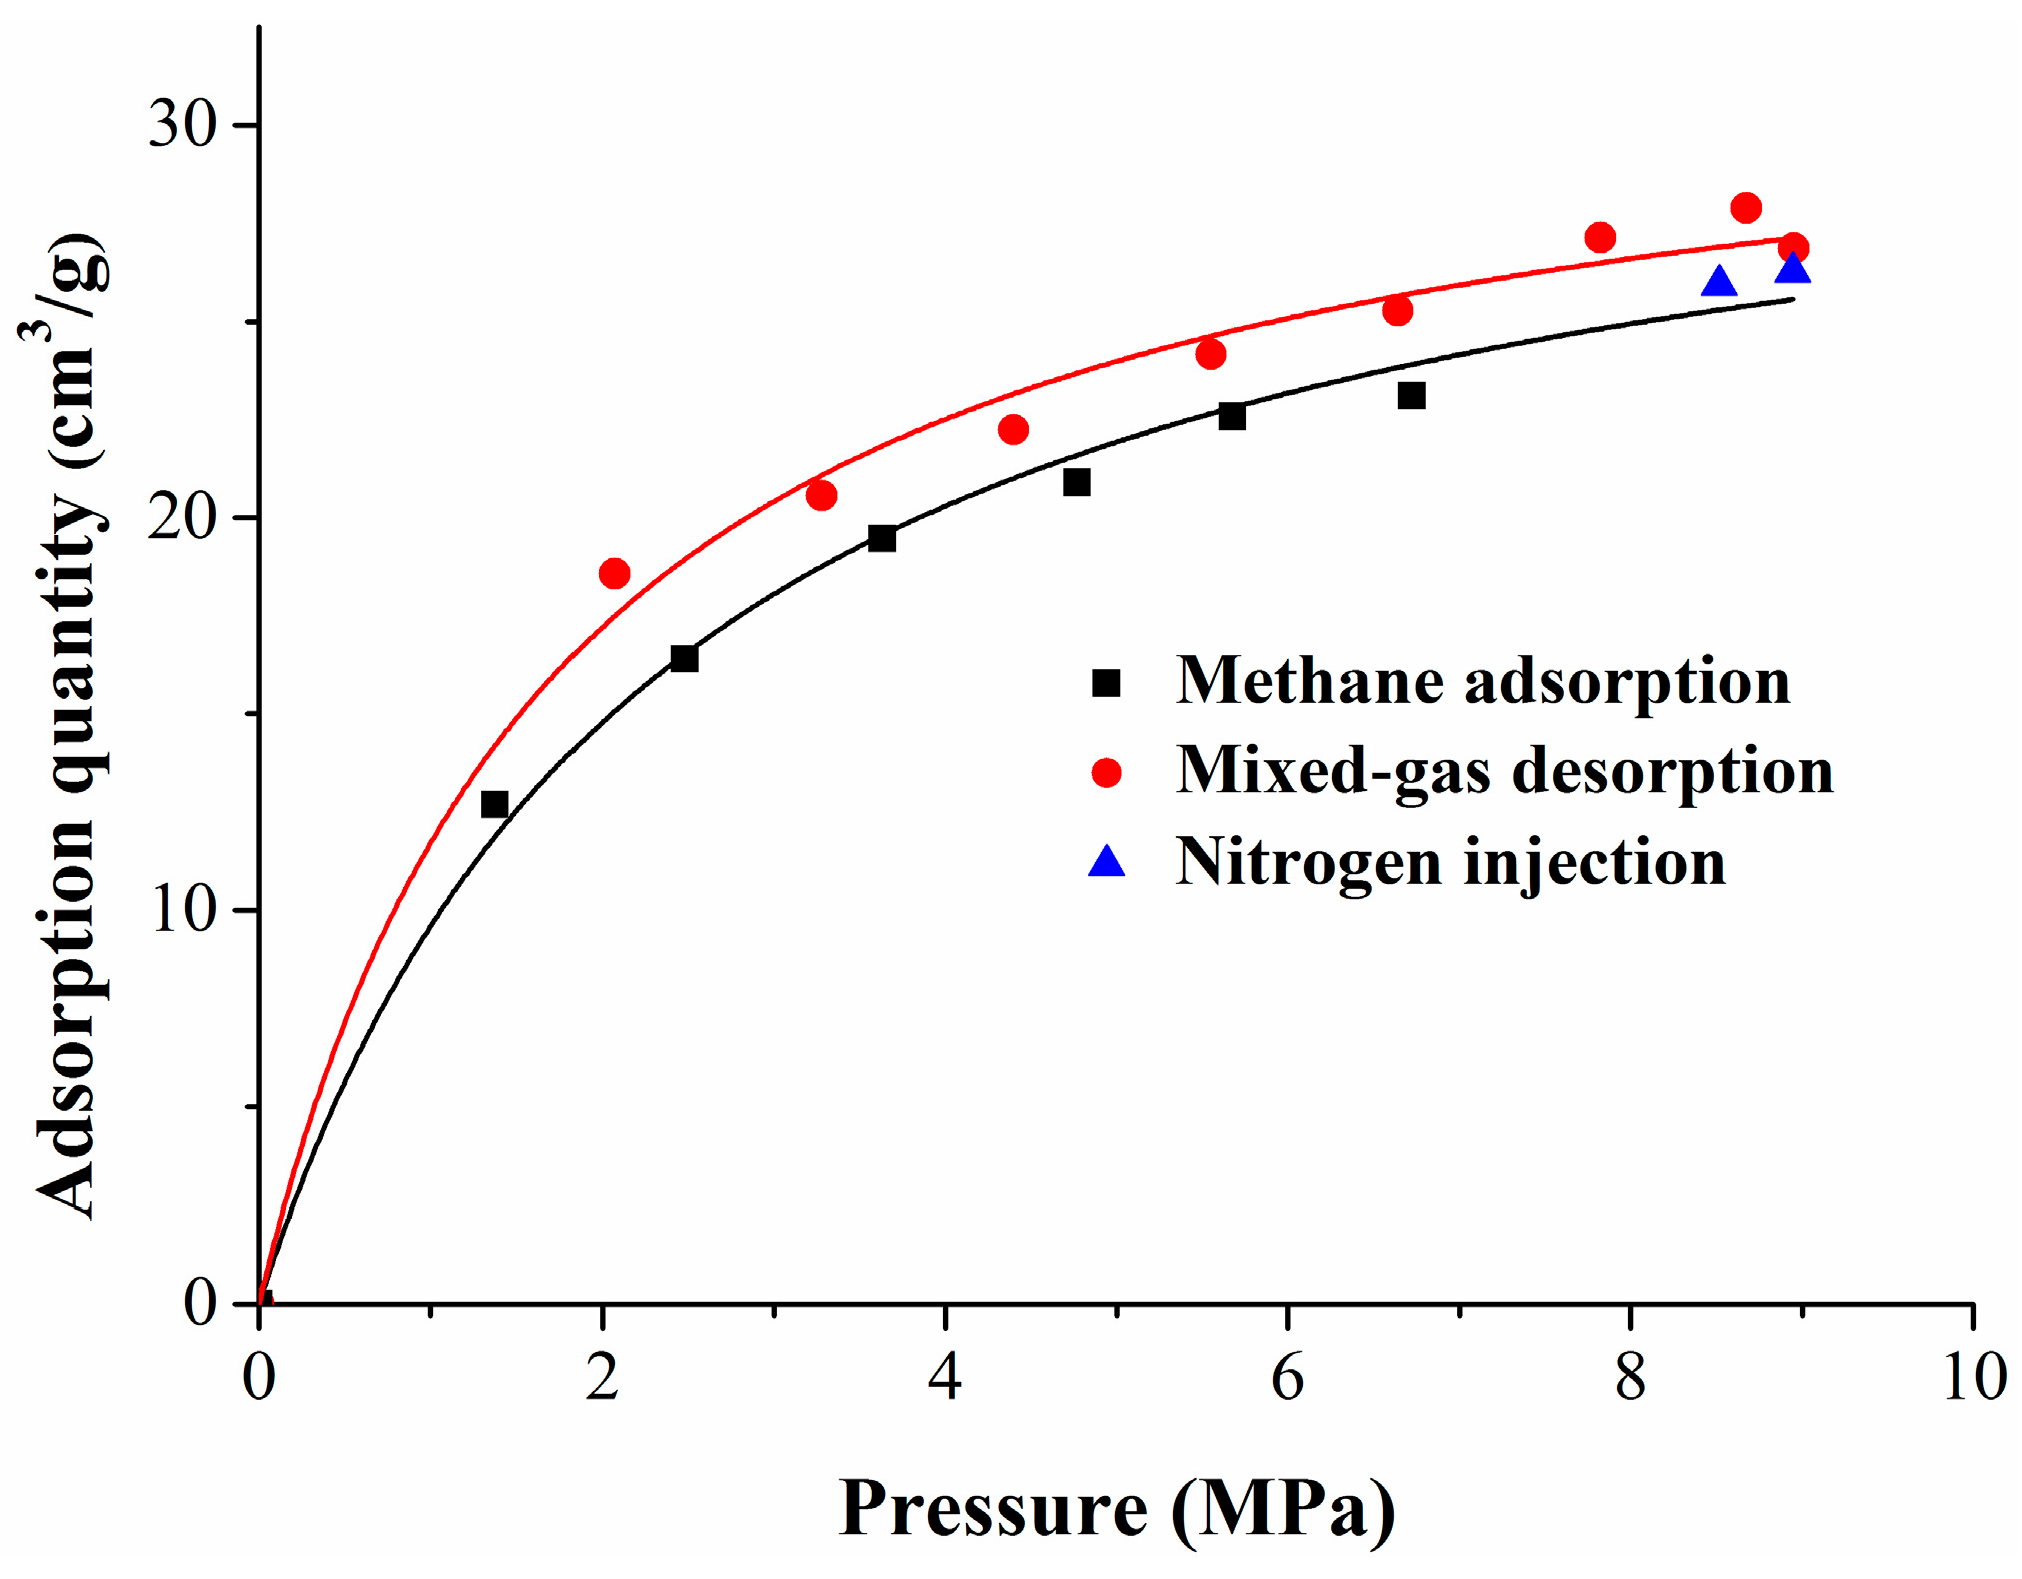
The experiment included three stages: methane adsorption, methane replacement by nitrogen, and mixed gas desorption. Six gas injection pressure points (1, 2, 3, 4, 5, 6 MPa), two equilibrium gas injection pressure points (8 MPa and 10 MPa), and seven gas desorption pressure points (9, 8, 7, 6, 5, 4, 3 MPa) were set in the methane adsorption stage, methane replacement stage, and mixed gas desorption stage, respectively. According to the standard for the experimental method of high-pressure isothermal adsorption for coal, the adsorption time of each equilibrium pressure point was greater than 12 h, and the equilibrium pressure decreased when compared with the maximum pressure of the injected gas. At the methane replacement stage and the mixed gas desorption stage, the concentrations of methane and nitrogen were tested by the gas-phase chromatograph at each equilibrium pressure point. According to the experimental results, the isothermal adsorption/desorption curves of the whole experiment were fitted, as shown in Figure 1. This figure depicts the isothermal adsorption and desorption curves of the whole experiment, which, shown versus pressure, also displayed significant hysteresis and followed a Langmuir-type relationship. Seri simulated gas adsorption on a solid surface using the Monte Carlo method, and explained that the hysteresis effect was caused by the hysteresis of the equilibrium calculation and the change of surface structure [46].
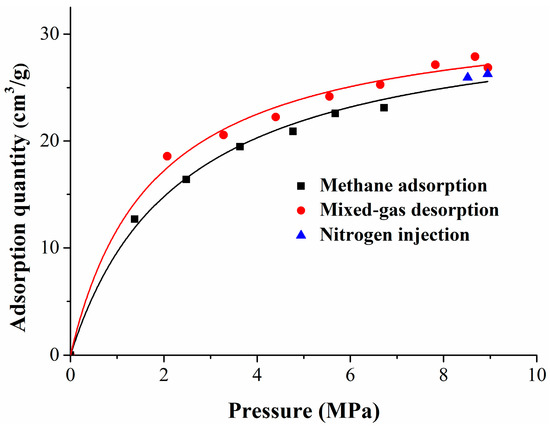
Figure 1.
Isothermal adsorption and desorption curves.
3.2. Pore Structure Test by Carbon Dioxide and Argon Adsorption
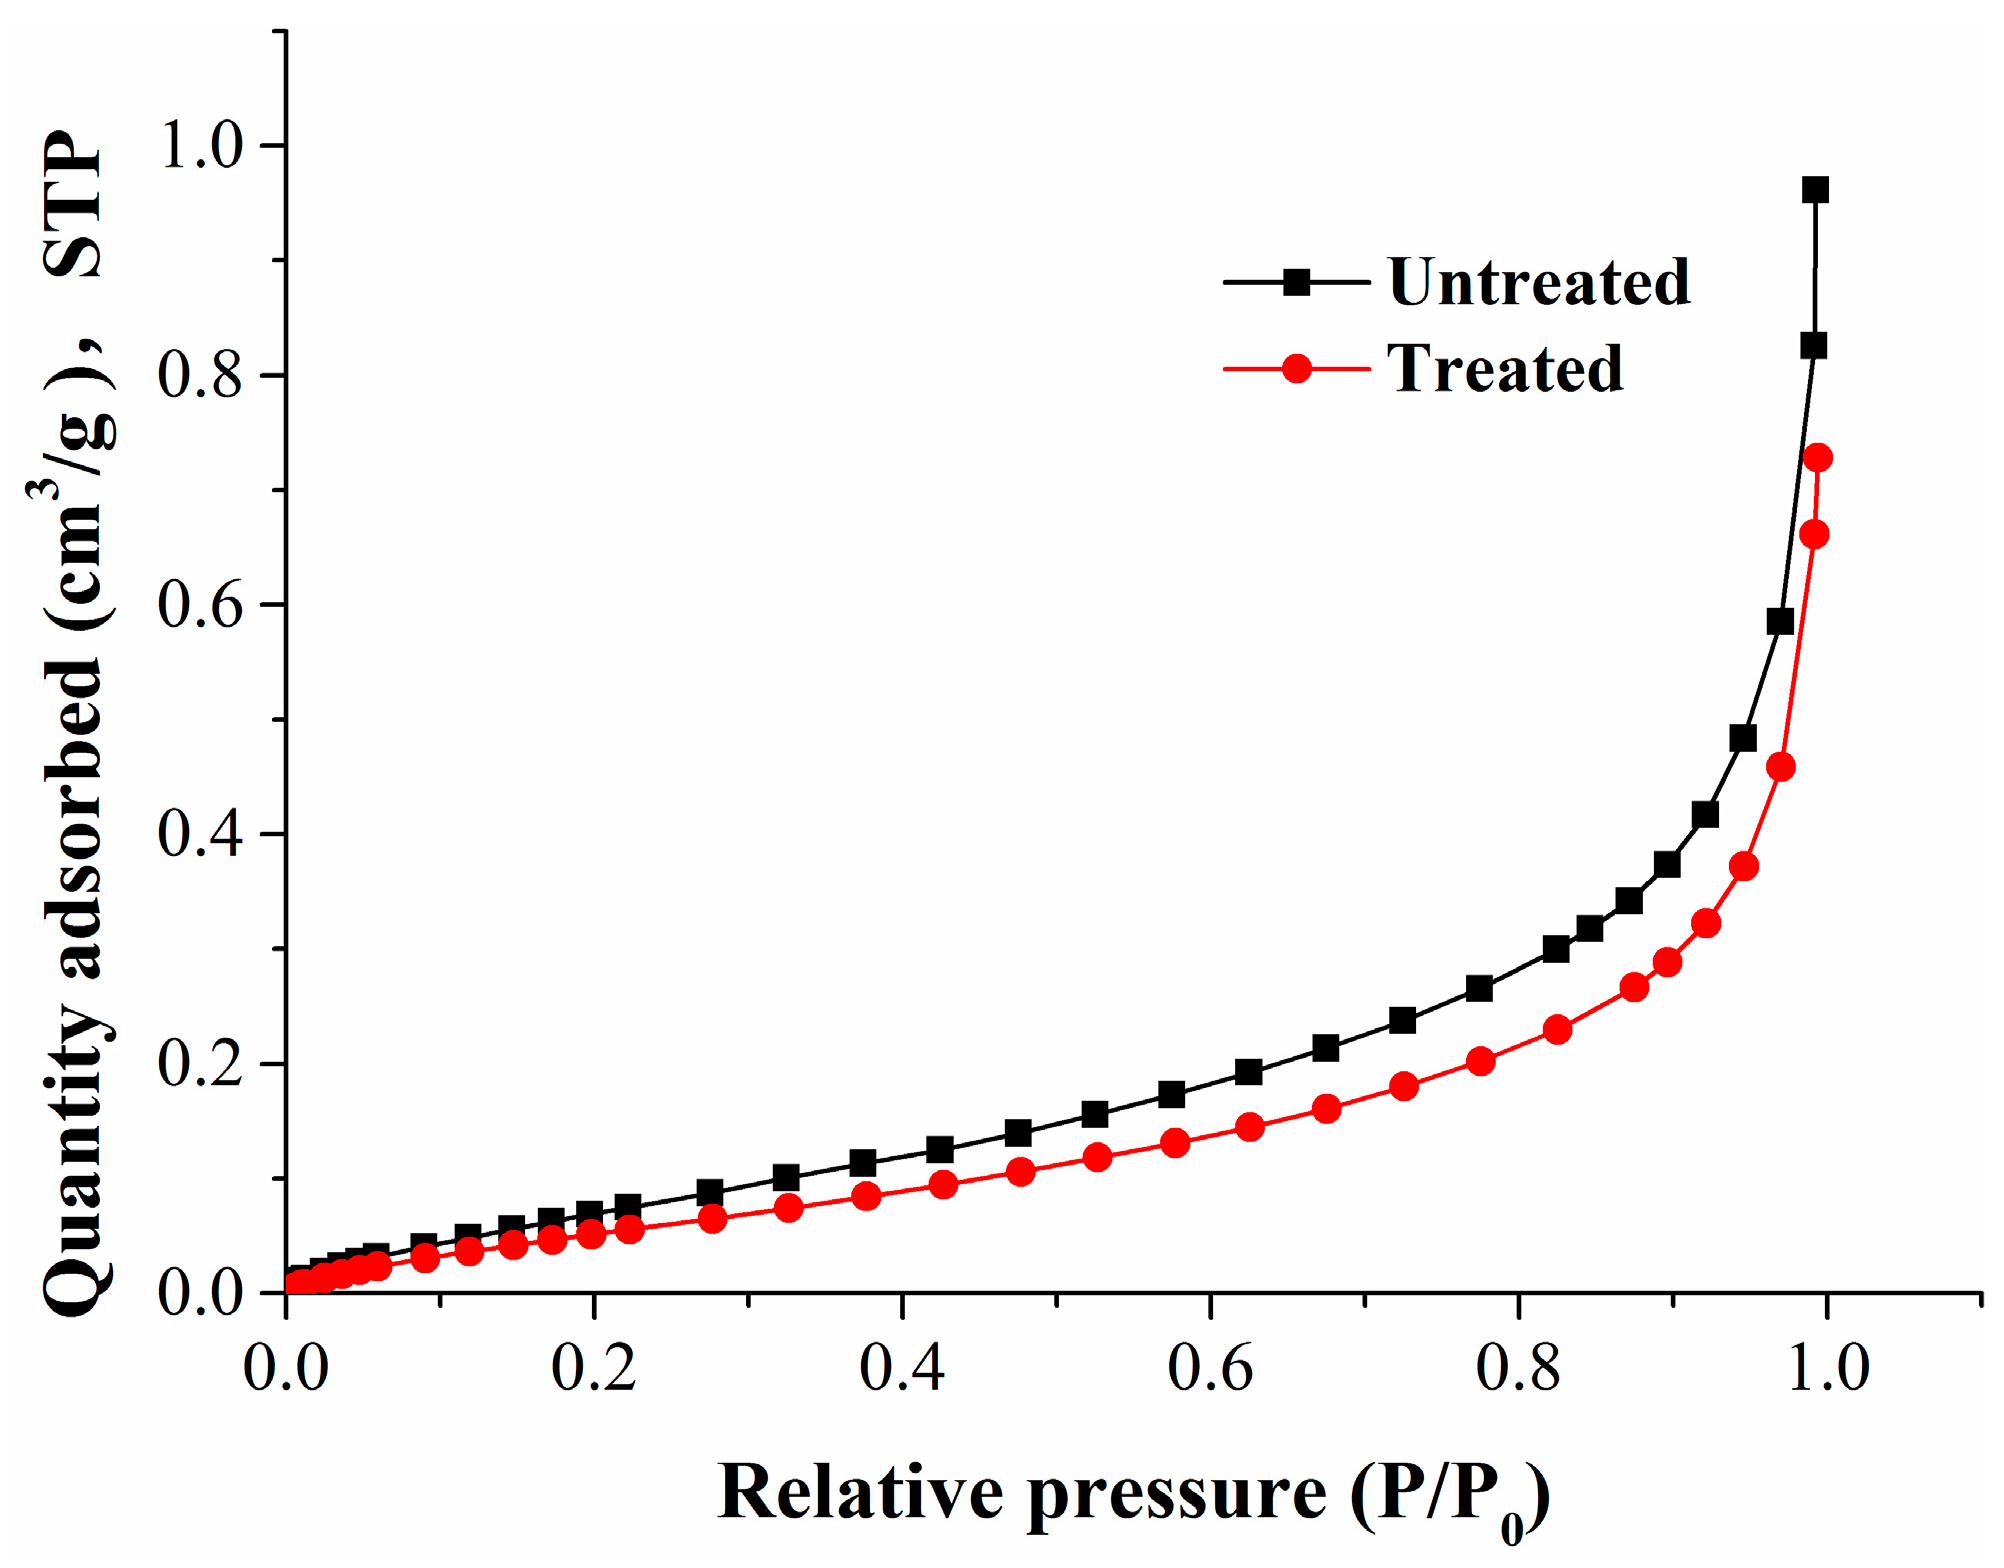
Coal matrix swelling in adsorption can cause a reduction of porosity and permeability. To reveal the variation of the pore structure during adsorption, we selected two kinds of experimental coal samples: untreated raw coal samples, and coal samples that had been treated using high-pressure nitrogen replacement and desorption. The gas adsorption experiments were carried out on two types of coal sample to obtain pore structure parameters such as pore volume and surface area. The pore structure test was conducted by carbon dioxide adsorption and argon adsorption compliant with the Chinese National Standard GB/T 21650.3-2011 [47]. The curves relating to the isothermal adsorption of carbon dioxide and argon are shown in Figure 2 and Figure 3, respectively.
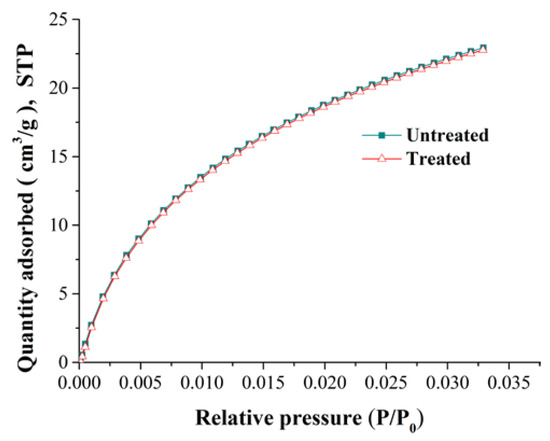
Figure 2.
The adsorption isotherms for carbon dioxide at 273 K.
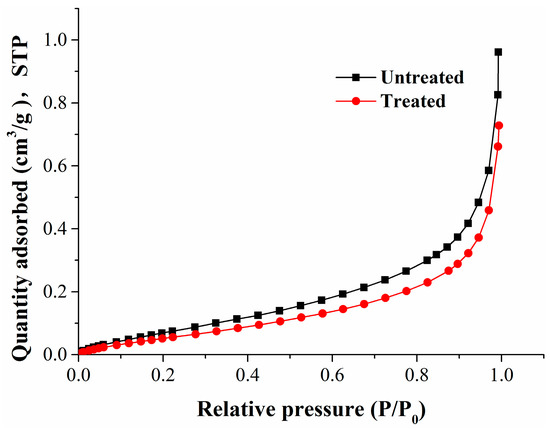
Figure 3.
The adsorption isotherms for argon at 87 K.
From Figure 2, the adsorption curves of carbon dioxide in ice water (273 K) for the untreated and treated coal samples were basically the same. Figure 3 shows that the adsorption curve of argon decreased slightly at 87 K for the treated coal sample, which shows that the pore structure of the coal samples has changed.
4. Deformation Characteristics of the Coal Matrix
4.1. Deformation of the Coal Matrix at the Methane Adsorption Stage
The experimental results of the methane adsorption stage were substituted into Equation (6), which was used to obtain the coal matrix deformation amount, the results are shown in Table 2.
Table 2.
The coal matrix deformation amount and deformation rate at the methane adsorption stage.
With the increase in pressure and absorption quantity, the coal matrix swells, and the swelling deformation amount increases continuously; however, the deformation rate and amplitude decreases gradually. The experimental results also confirmed that coal matrix deformation under pressure was nonlinear under higher pressure [28,31].
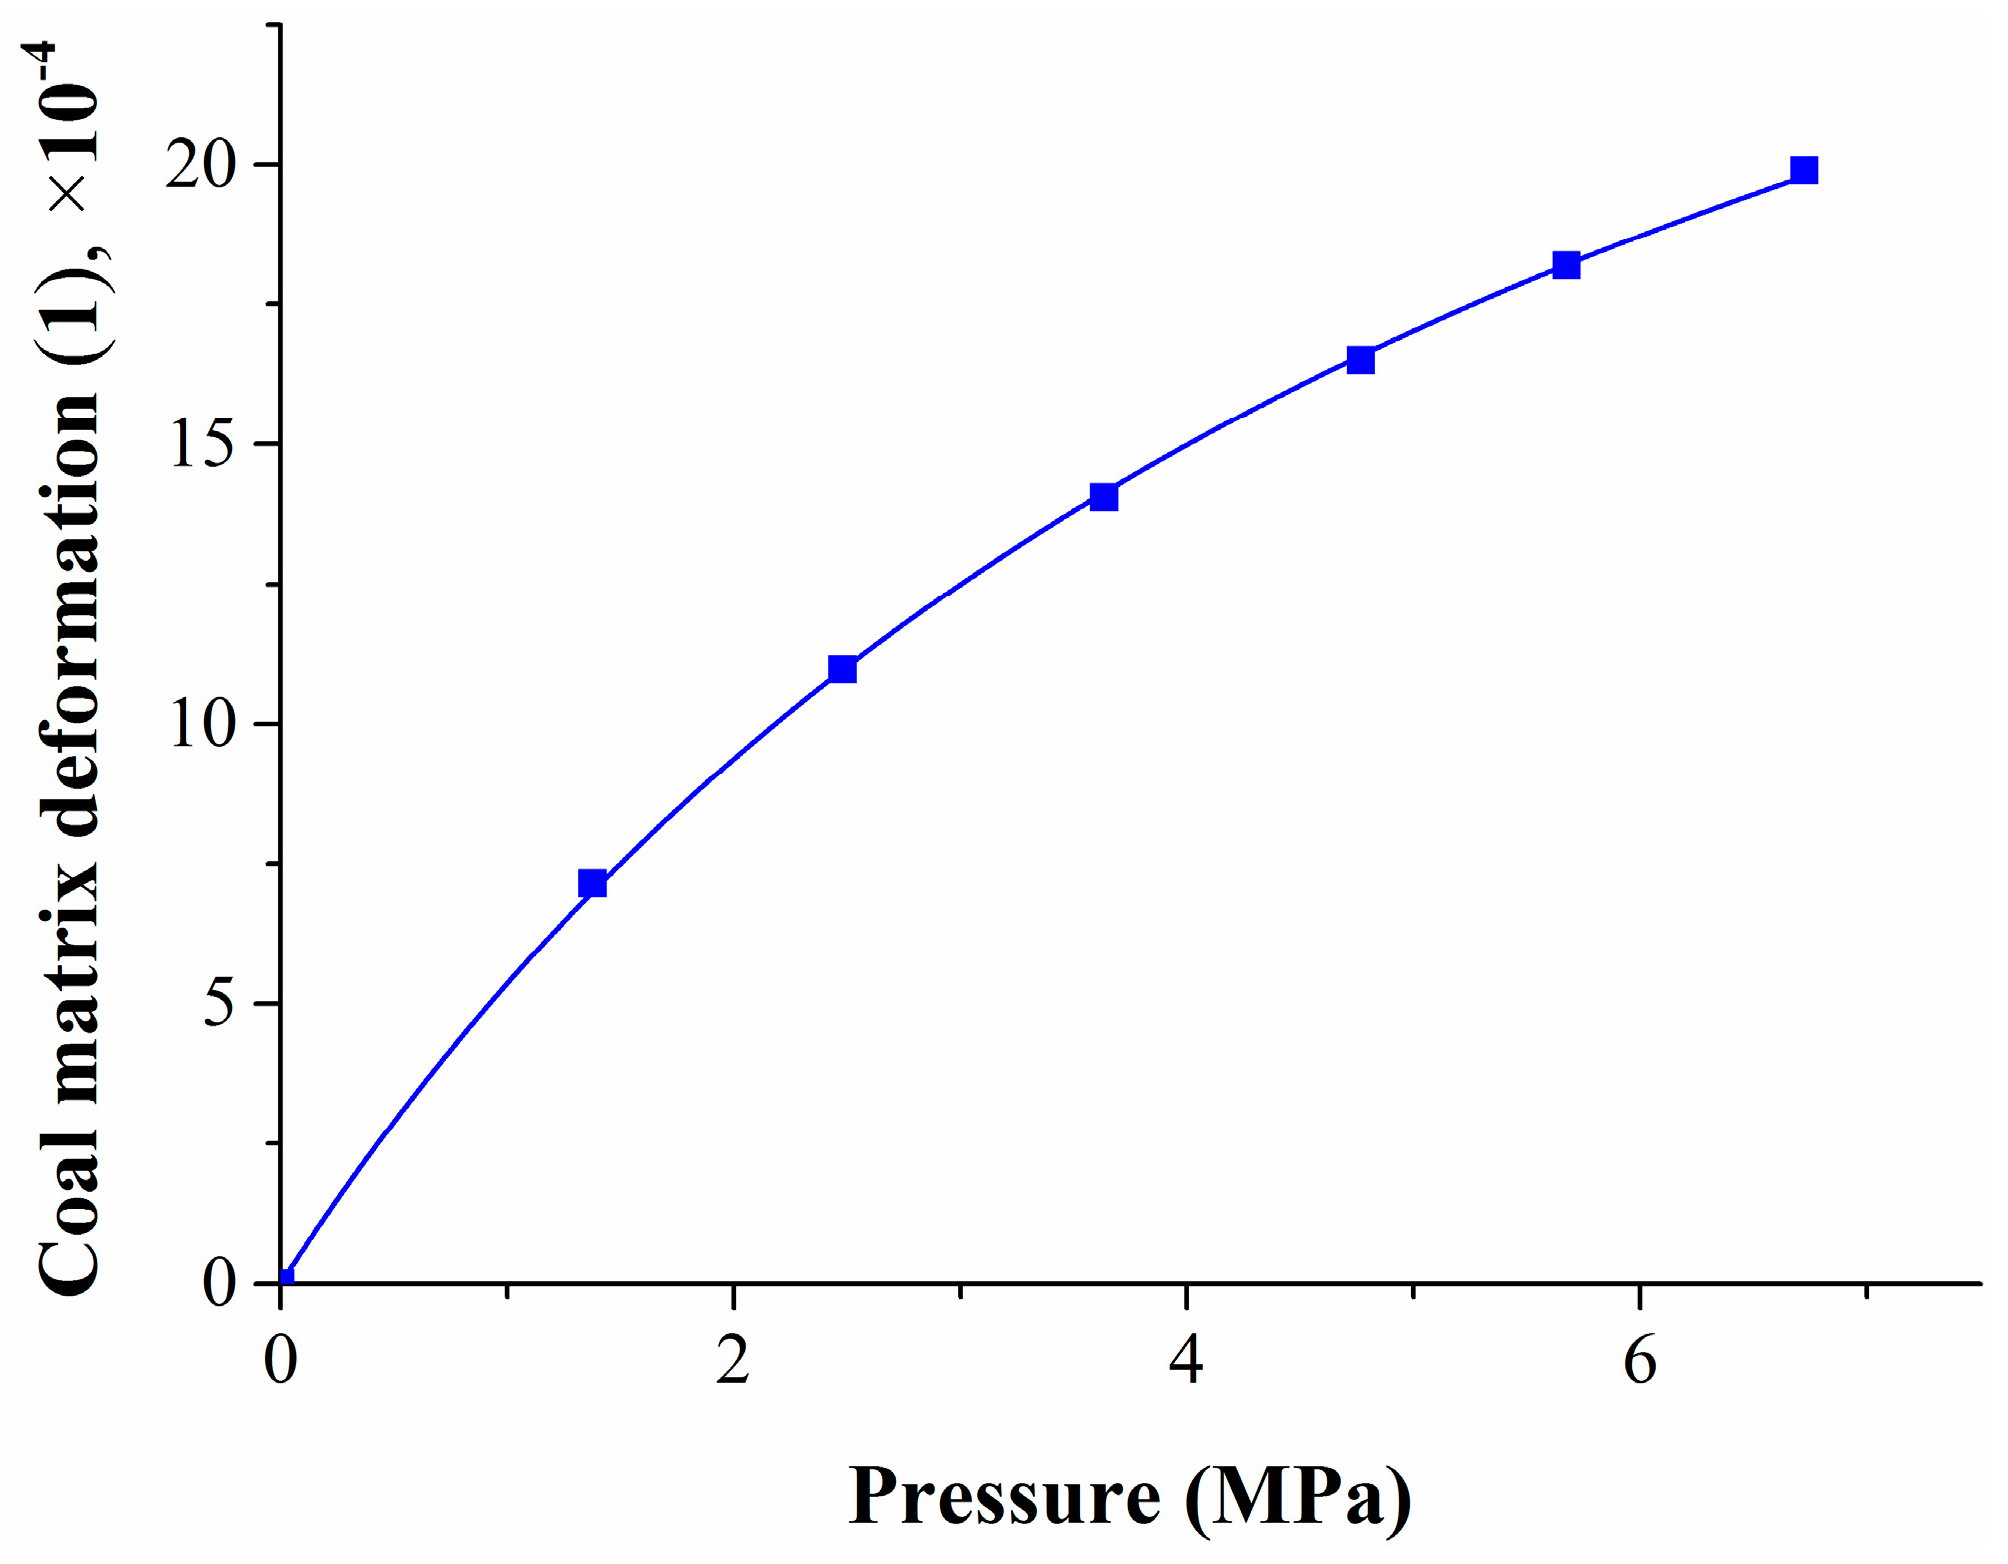
To study the relationship between coal matrix deformation and the pressure or methane adsorption quantity, the test data was fitted, the results are shown in Figure 4 and Figure 5.
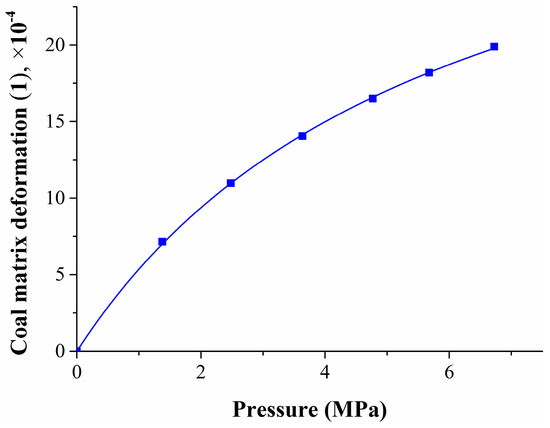
Figure 4.
Relationship between coal matrix deformation and the methane pressure.
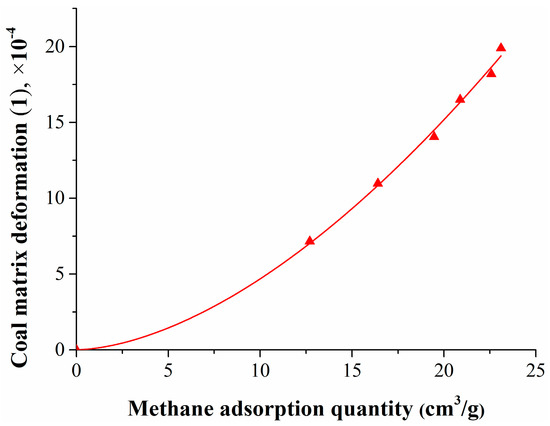
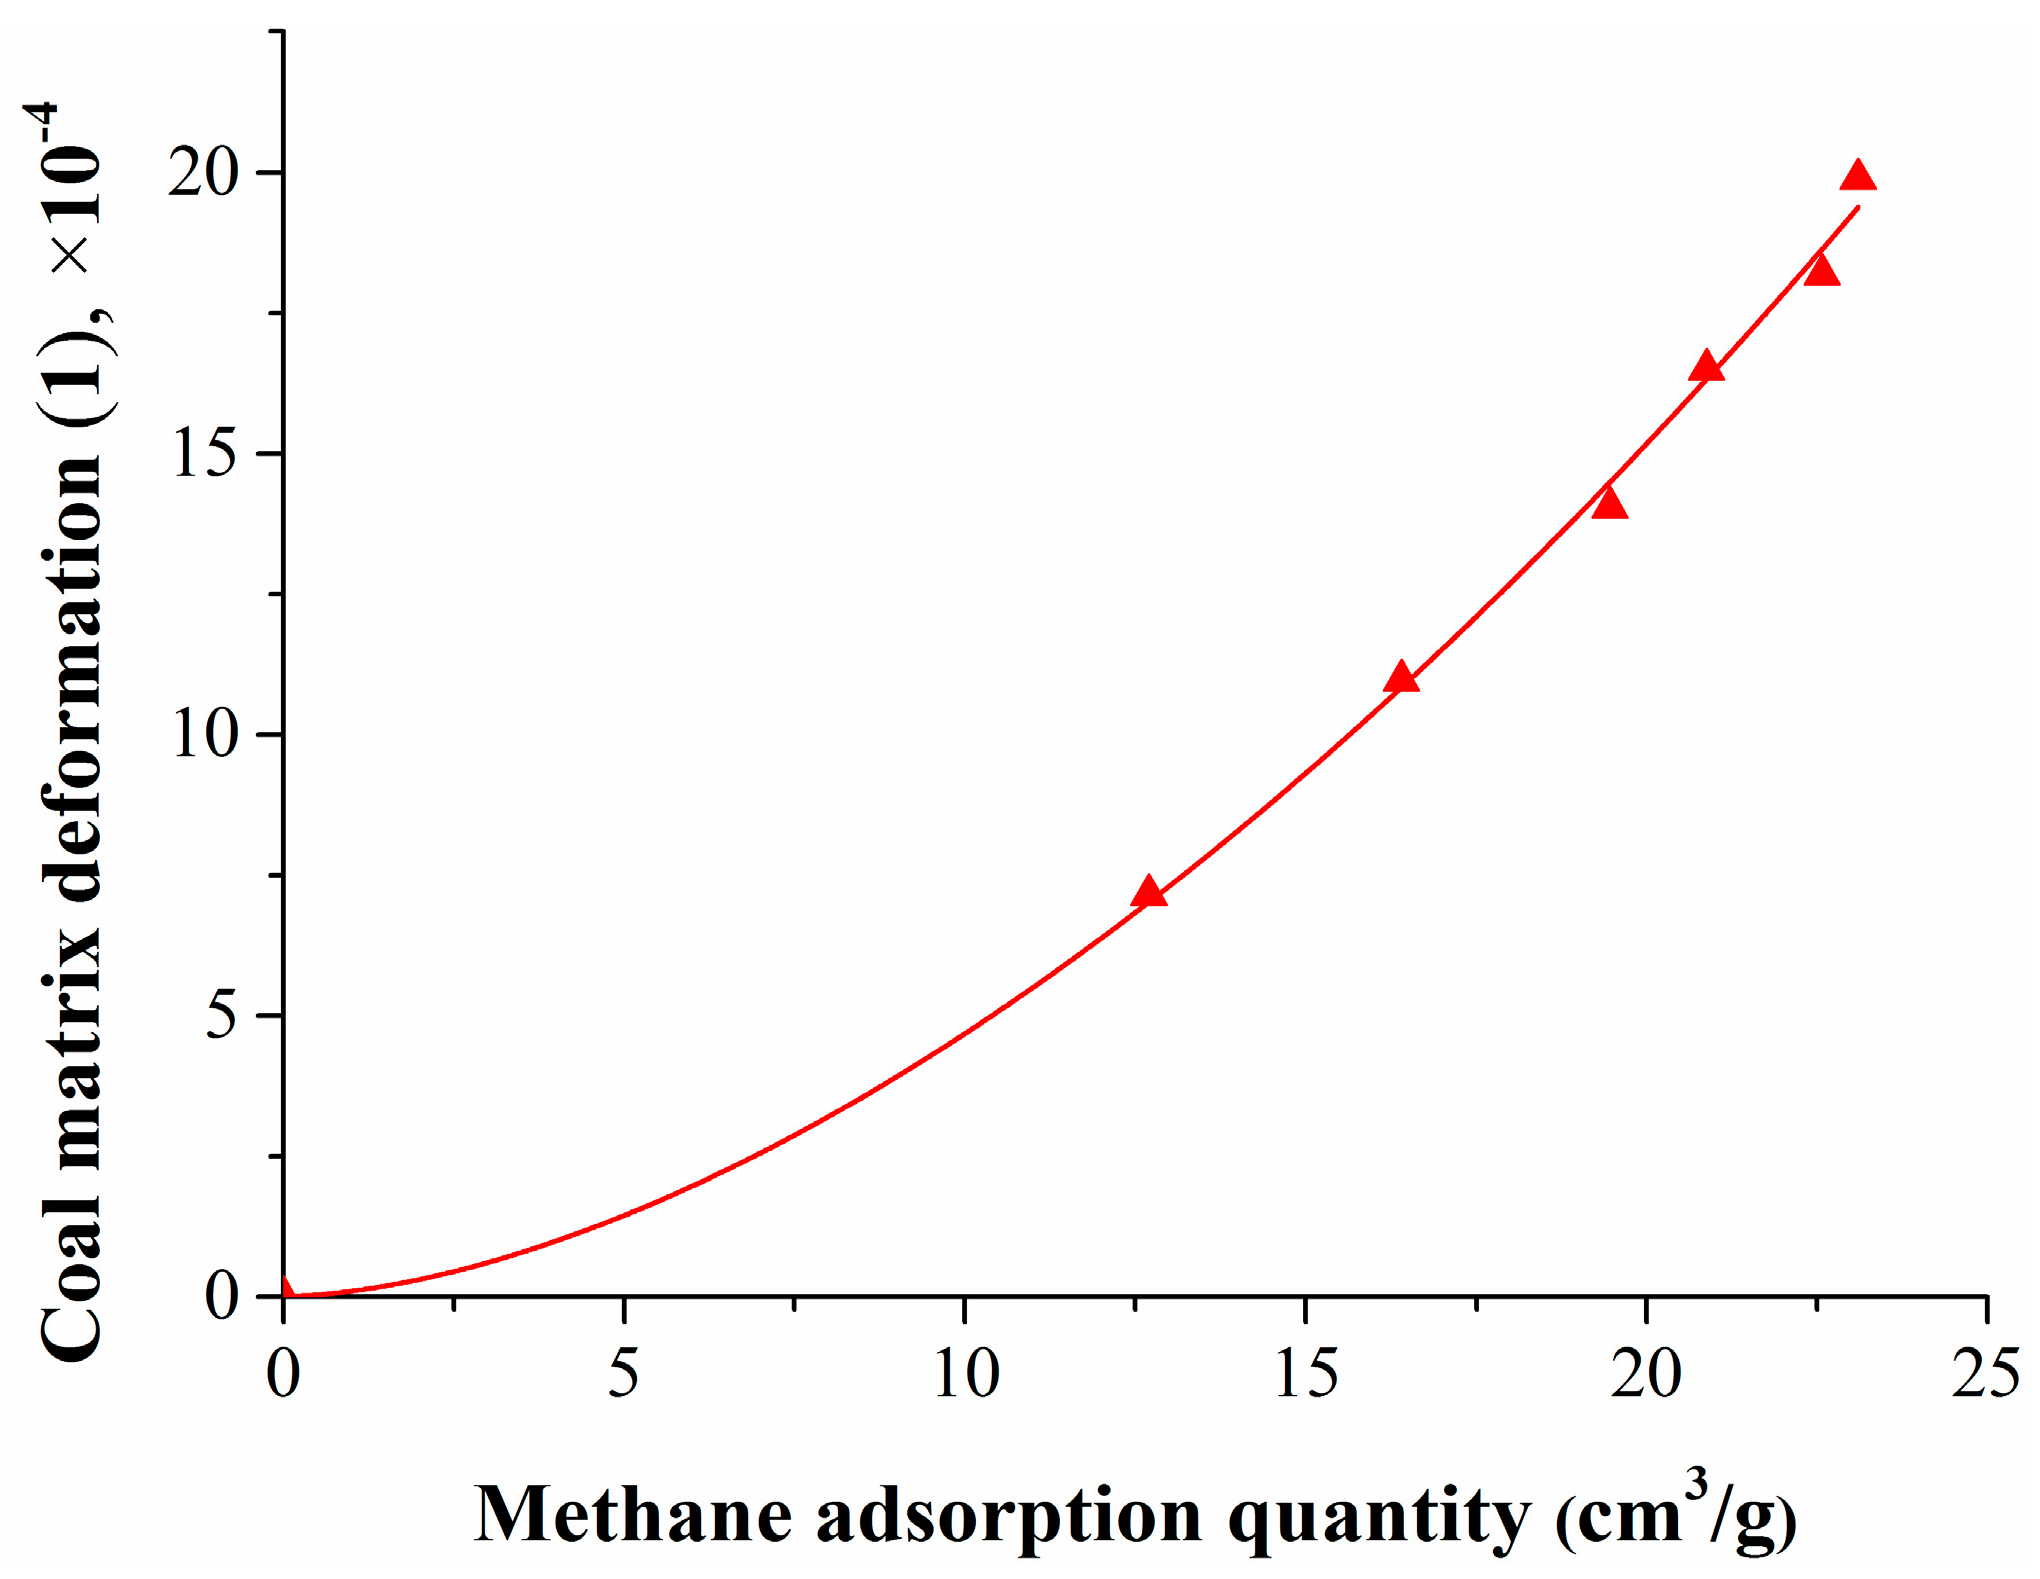
Figure 5.
Relationship between coal matrix deformation and the methane adsorption quantity.
Figure 4 shows that the relationship between the coal matrix deformation and the pressure was similar to the Langmuir equation; its specific expression is given by Equation (28):
where ΔεCH4 is the coal matrix deformation caused by methane adsorption, 1; PCH4 is the methane pressure, MPa; and R2 is the correlation coefficient.
Figure 5 shows that the coal matrix swelling deformation increased exponentially as the methane adsorption quantity increased, and their relationship can be expressed as follows:
where QCH4 is the methane adsorption quantity, cm3/g.
4.2. Deformation of the Coal Matrix at the Methane Replacement by Nitrogen Stage
The nitrogen injection was uniform and slow in the experiment; therefore, the partial pressure of nitrogen can be considered to have increased linearly with the equilibrium pressure. According to the nitrogen concentration in the free gas as tested by gas chromatography and the equilibrium pressure, the partial pressure of nitrogen was calculated. The relationship between the partial pressure of nitrogen and the equilibrium pressures can be fitted based on experimental results:
where PN2 is the partial pressure of nitrogen, MPa; and P is the equilibrium pressure, MPa.
The experimental results at the methane replacement stage were substituted into Equations (16) and (17), which provided the coal matrix deformation, the results are shown in Table 3.
Table 3.
The coal matrix deformation amount and deformation rate at the stage where methane is replaced by nitrogen.
Table 3 shows that the coal matrix deformation during the process of methane replacement by nitrogen was the result of mixed gas adsorption where the swelling deformation induced by methane was higher than that induced by nitrogen. The physical explanation for this is that the coal adsorption quantity of methane was higher than that of nitrogen. With the increase in pressure and the adsorption quantity, the coal matrix swelled continuously, and the deformation amplitude decreased gradually, but the deformation rate first increased and then decreased.
4.3. Deformation of the Coal Matrix at the Mixed Gas Desorption Stage
When the isothermal adsorption experiment with methane and nitrogen ended, the mixed gas desorption experiment began. At this stage, the equilibrium pressure and the methane and nitrogen concentrations under each pressure point were tested and recorded. The partial pressures of methane and nitrogen at each of the pressure points were calculated and are shown in Table 4.
Table 4.
The partial pressures of methane and nitrogen and their ratio.
According to the experimental data, the relationship between the partial pressure ratio and the equilibrium pressure can be expressed as follows:
where PCH4/PN2 is the partial pressure ratio, 1; and P is the equilibrium pressure, MPa.
The related parameters were substituted into Equations (25) and (26), from which the coal matrix deformation amount and rate were obtained, and the results are shown in Table 5.
Table 5.
The coal matrix deformation amount and rate at the mixed gas desorption stage.
Table 5 shows that the adsorption quantity decreased and the coal matrix shrank with the decrease of the equilibrium pressure. As the variation of the partial pressure and desorption quantity of the methane was much higher than that of the nitrogen, the coal matrix shrinkage was mainly induced by methane. The coal matrix shrinkage deformation rate was not constant, but decreased at the initial stage and then later increased.
By using the isothermal adsorption/desorption experiment and coal matrix deformation calculation models, the mixed gas adsorption quantity and the coal matrix deformation amount were obtained. To study the relationship between the coal matrix deformation and the pressure or adsorption quantity, the experimental data were fitted, and the results are shown in Figure 6 and Figure 7.

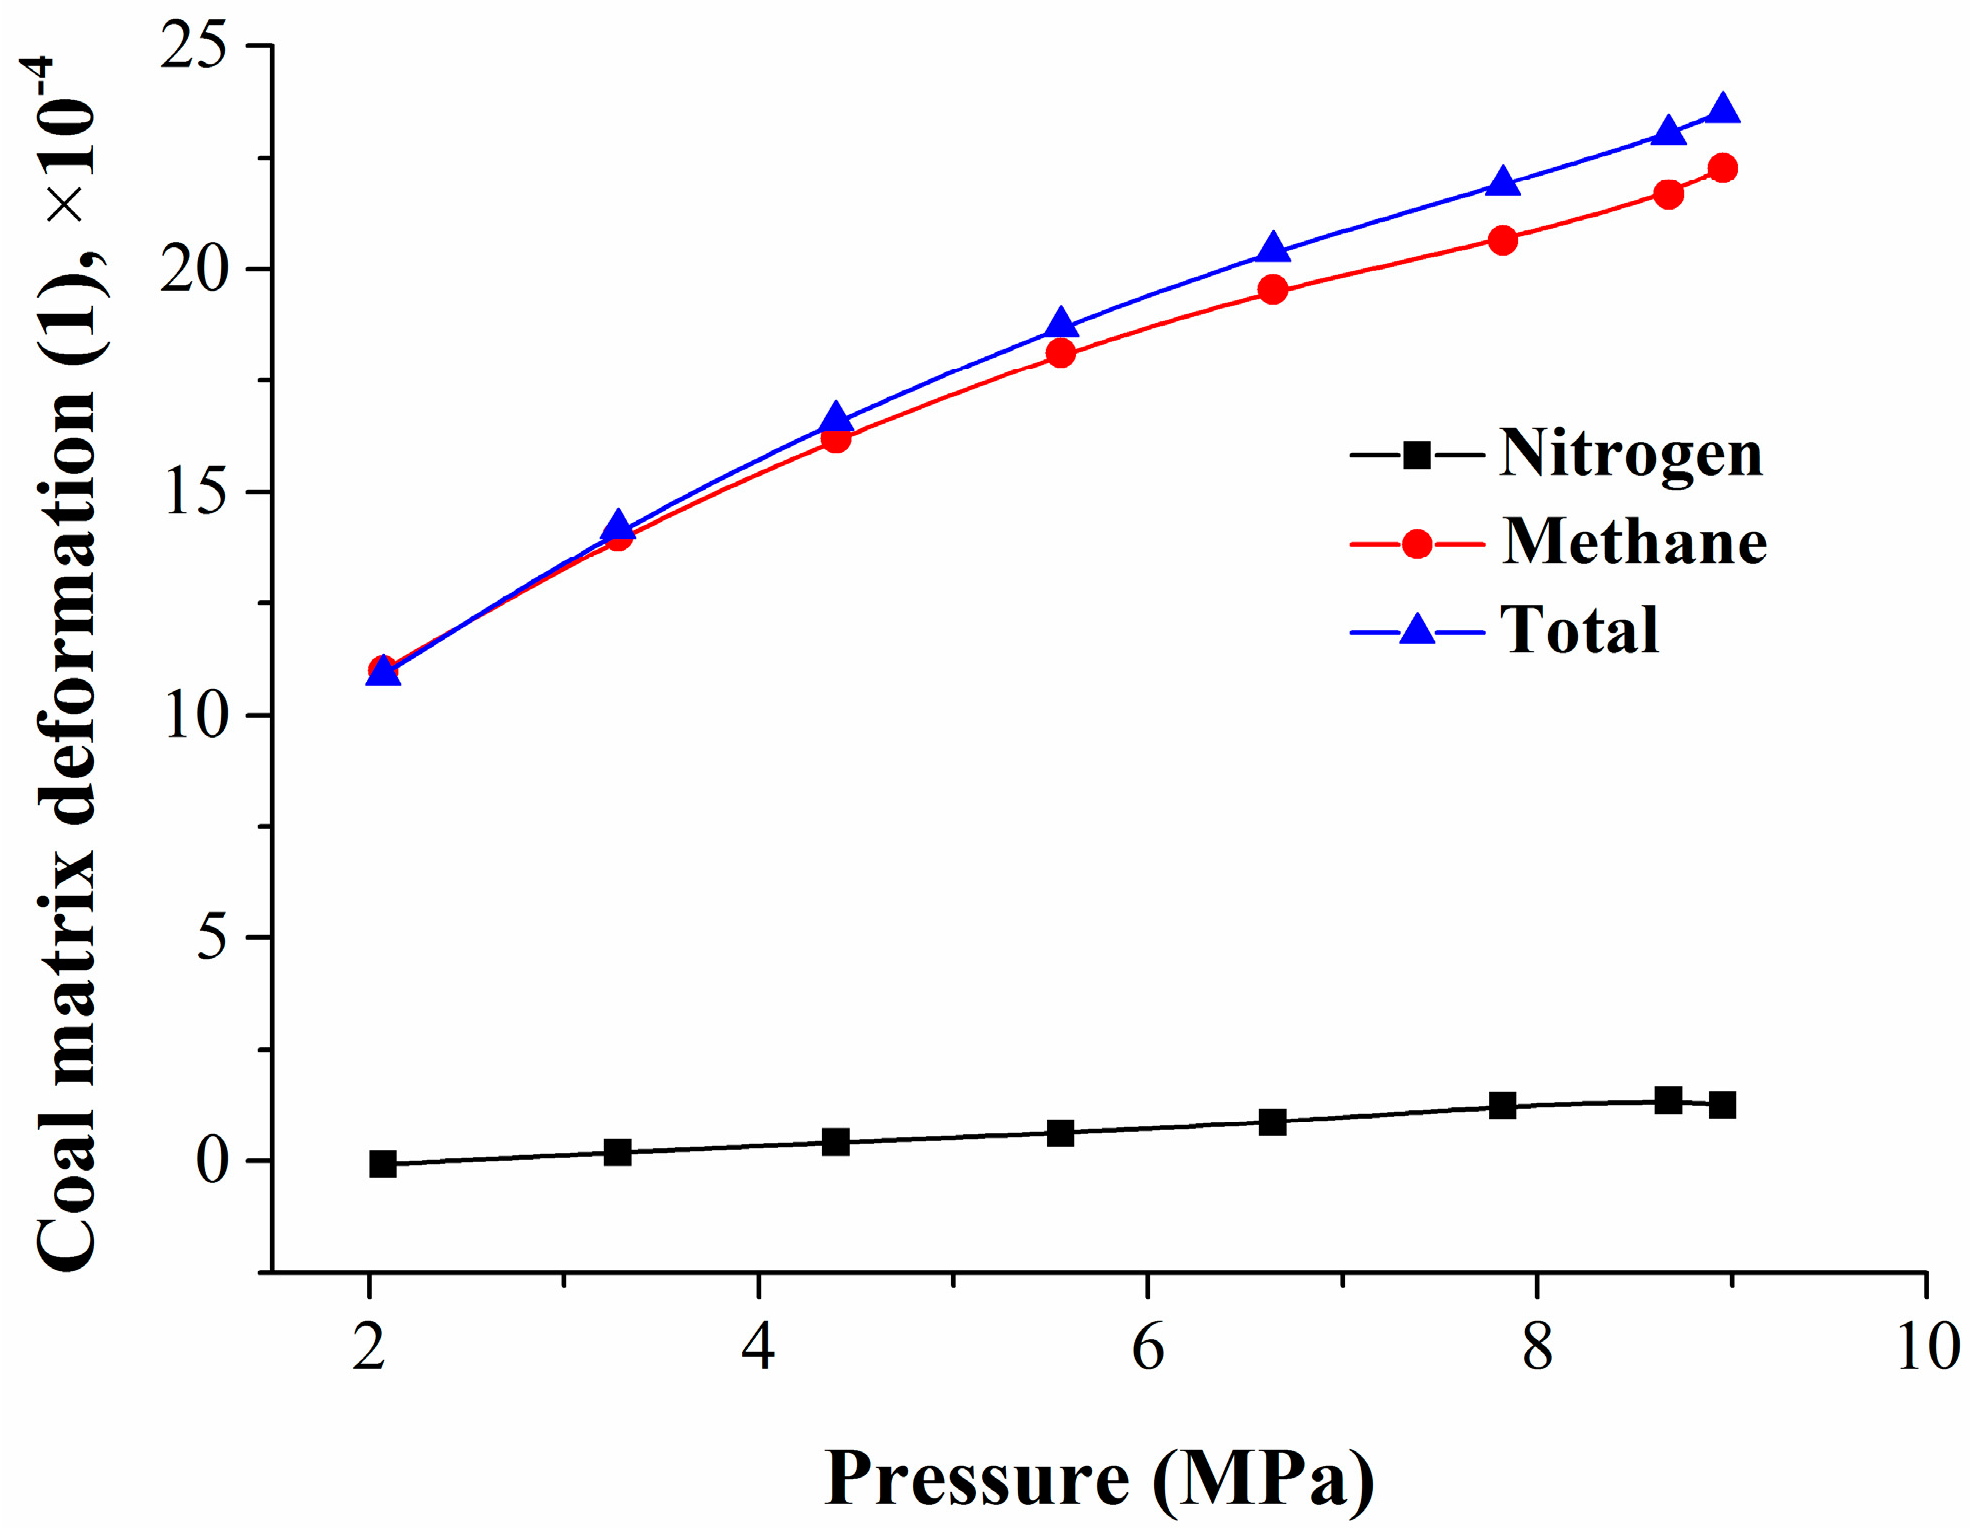
Figure 6.
Relationship between coal matrix deformation and pressure.

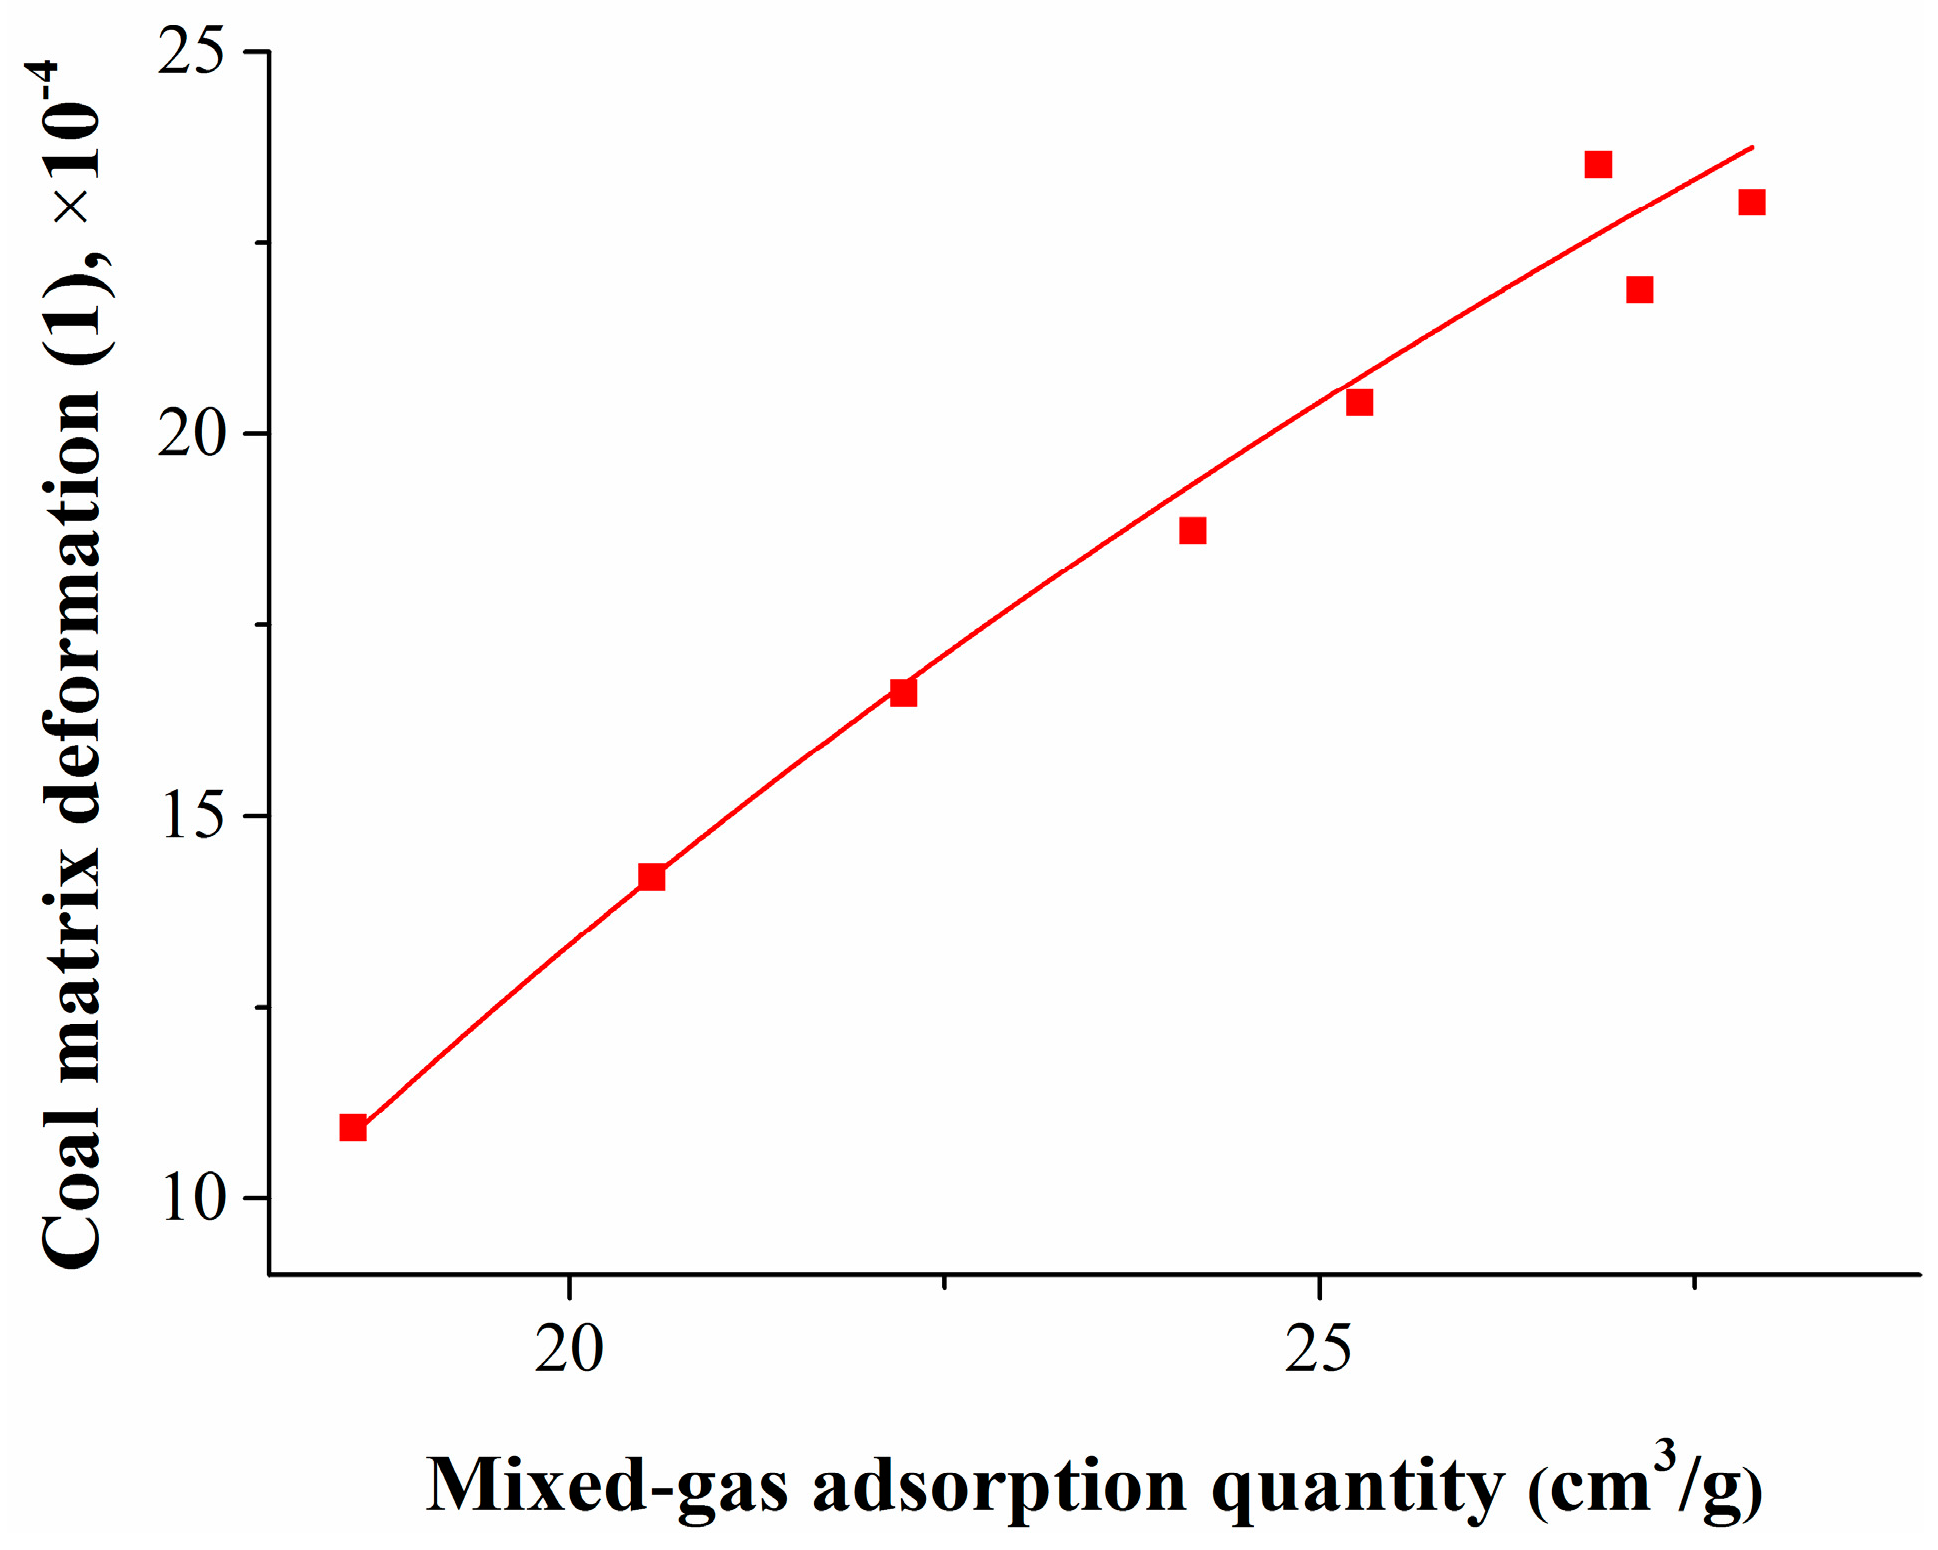
Figure 7.
Relationship between coal matrix deformation and mixed gas adsorption quantity.
Figure 6 shows that, with the decrease in equilibrium pressure, the coal matrix shrinkage deformation decreased in a logarithmic manner, mainly caused by methane desorption. The relationship between the coal matrix deformation and the pressure can be expressed as
where Δεj is the coal matrix shrinkage deformation, 1; and P is the equilibrium pressure, MPa.
Figure 7 shows that, with the decrease of the gas adsorption quantity, the coal matrix shrinkage deformation also decreased logarithmically. The relationship between the coal matrix deformation and the mixed gas adsorption quantity can be expressed as
where Δεj is the coal matrix shrinkage deformation, 1; and Qj is the mixed gas adsorption quantity, cm3/g.
4.4. Pore Structure Variation and the Coal Matrix Deformation Mechanism
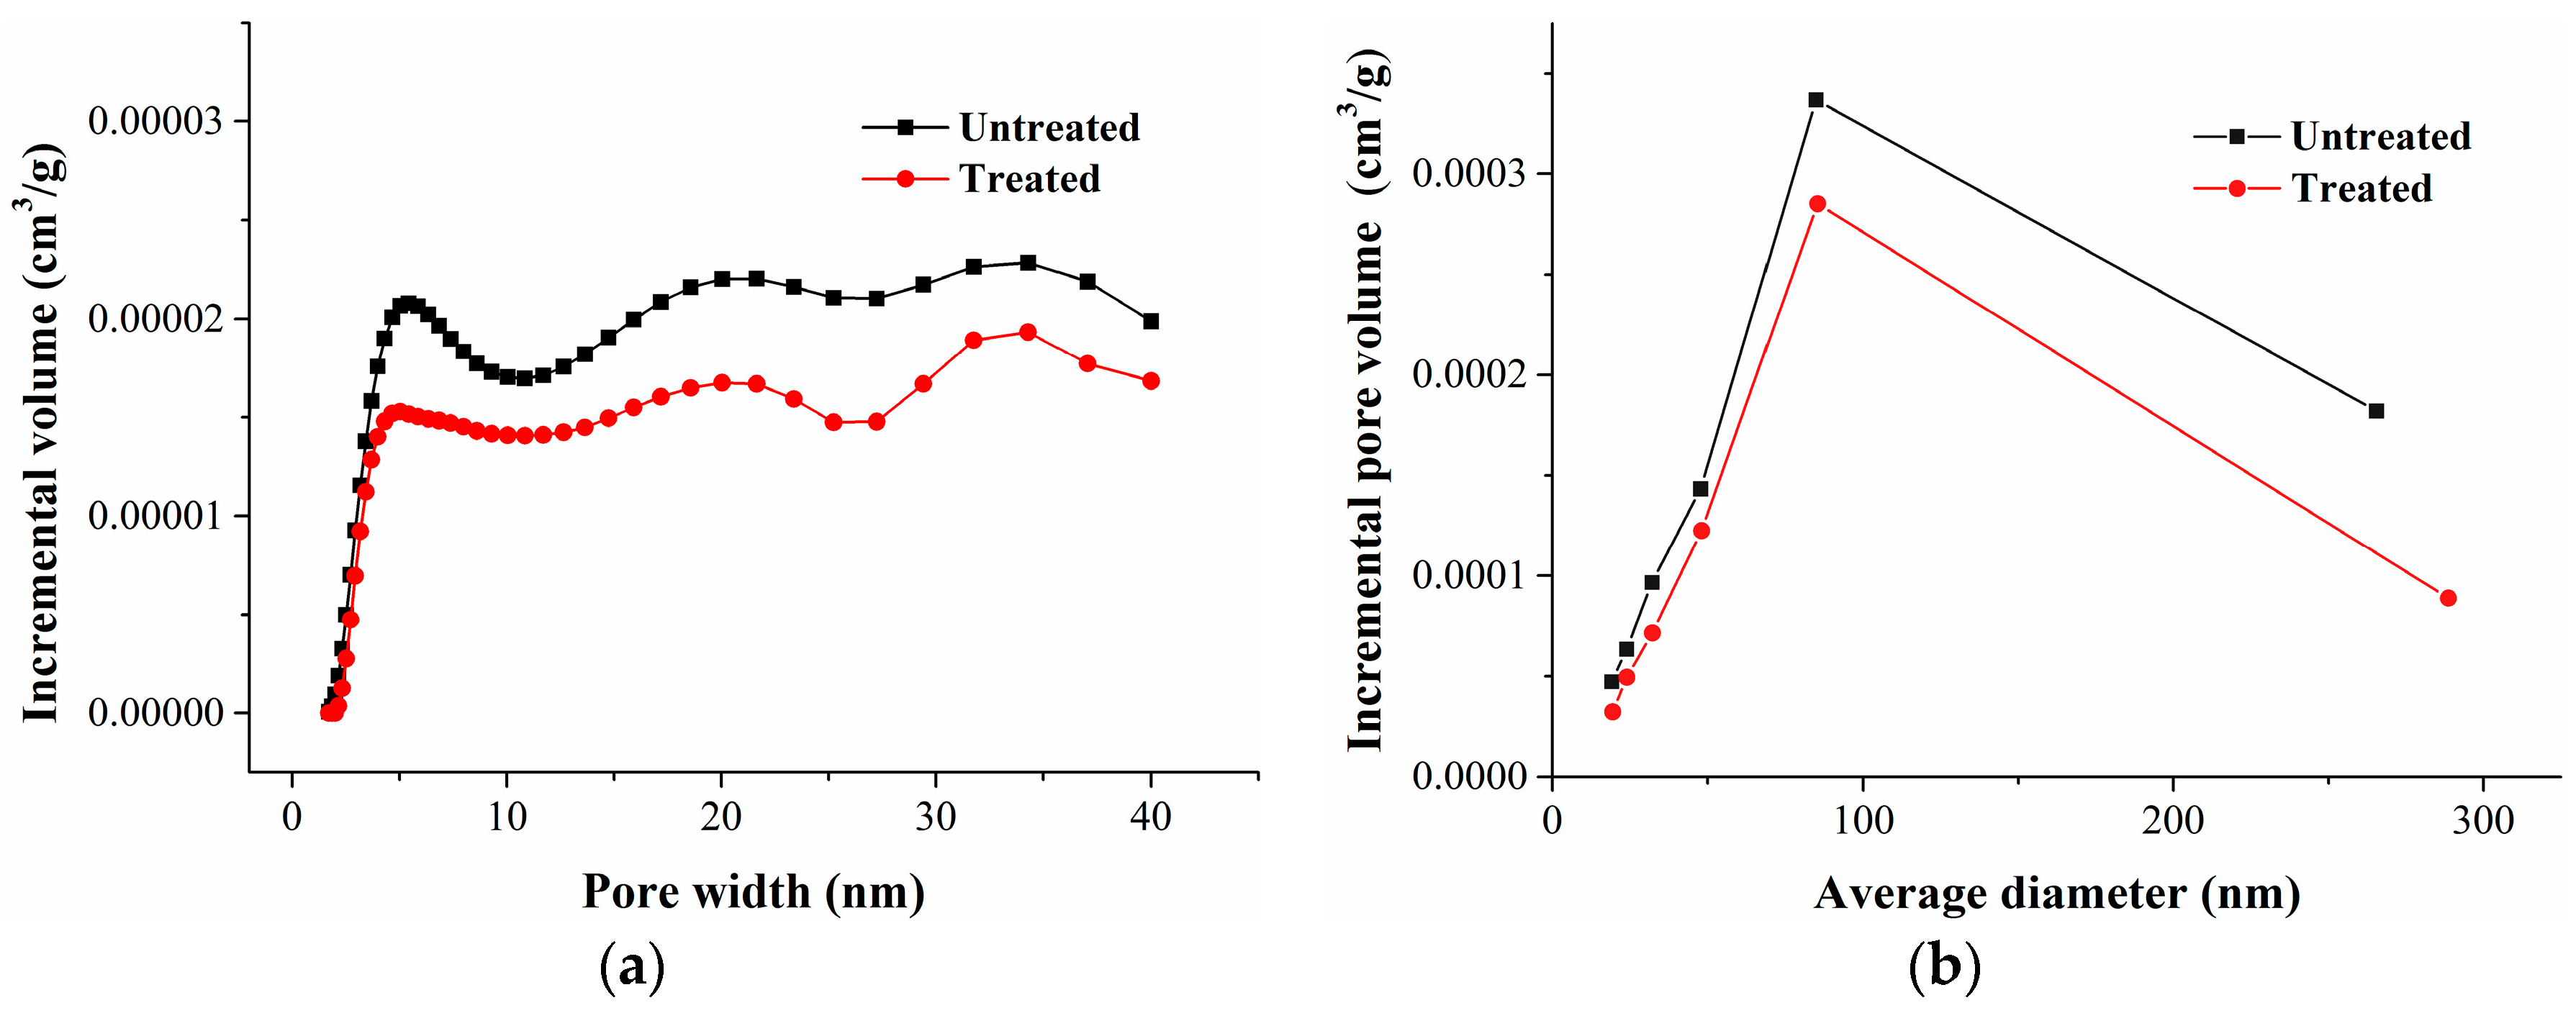
Coal is a kind of imperfectly elastic body, so part of the coal matrix swelling could be retained after the isothermal adsorption experiment. We revealed the deformation mechanism of the coal matrix by comparing the variation of pores in the coal. According to the classification standard of IUPAC, the pores in porous solids are divided into three types: micropores (<2 nm), mesopores (2~50 nm), and macropores (>50 nm) [48]. The carbon dioxide adsorption test at 273 K (ice/water bath) is an accurate method to determine the pore volume and the specific surface area of micropores in carbonaceous materials [49,50]. Comparing the carbon dioxide adsorption curves of the coal samples before and after adsorption, we found that they almost overlapped (Figure 2). Based on the carbon dioxide isotherm adsorption curves, the pore volume, specific surface area, and the distribution of micropores could be calculated with the DFT (density functional theory) analysis model; the results are shown in Table 6 and Figure 8.
Table 6.
Pore volume and specific surface area determined from carbon dioxide adsorption.
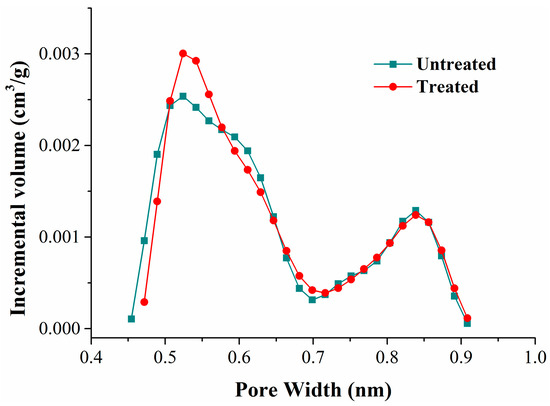
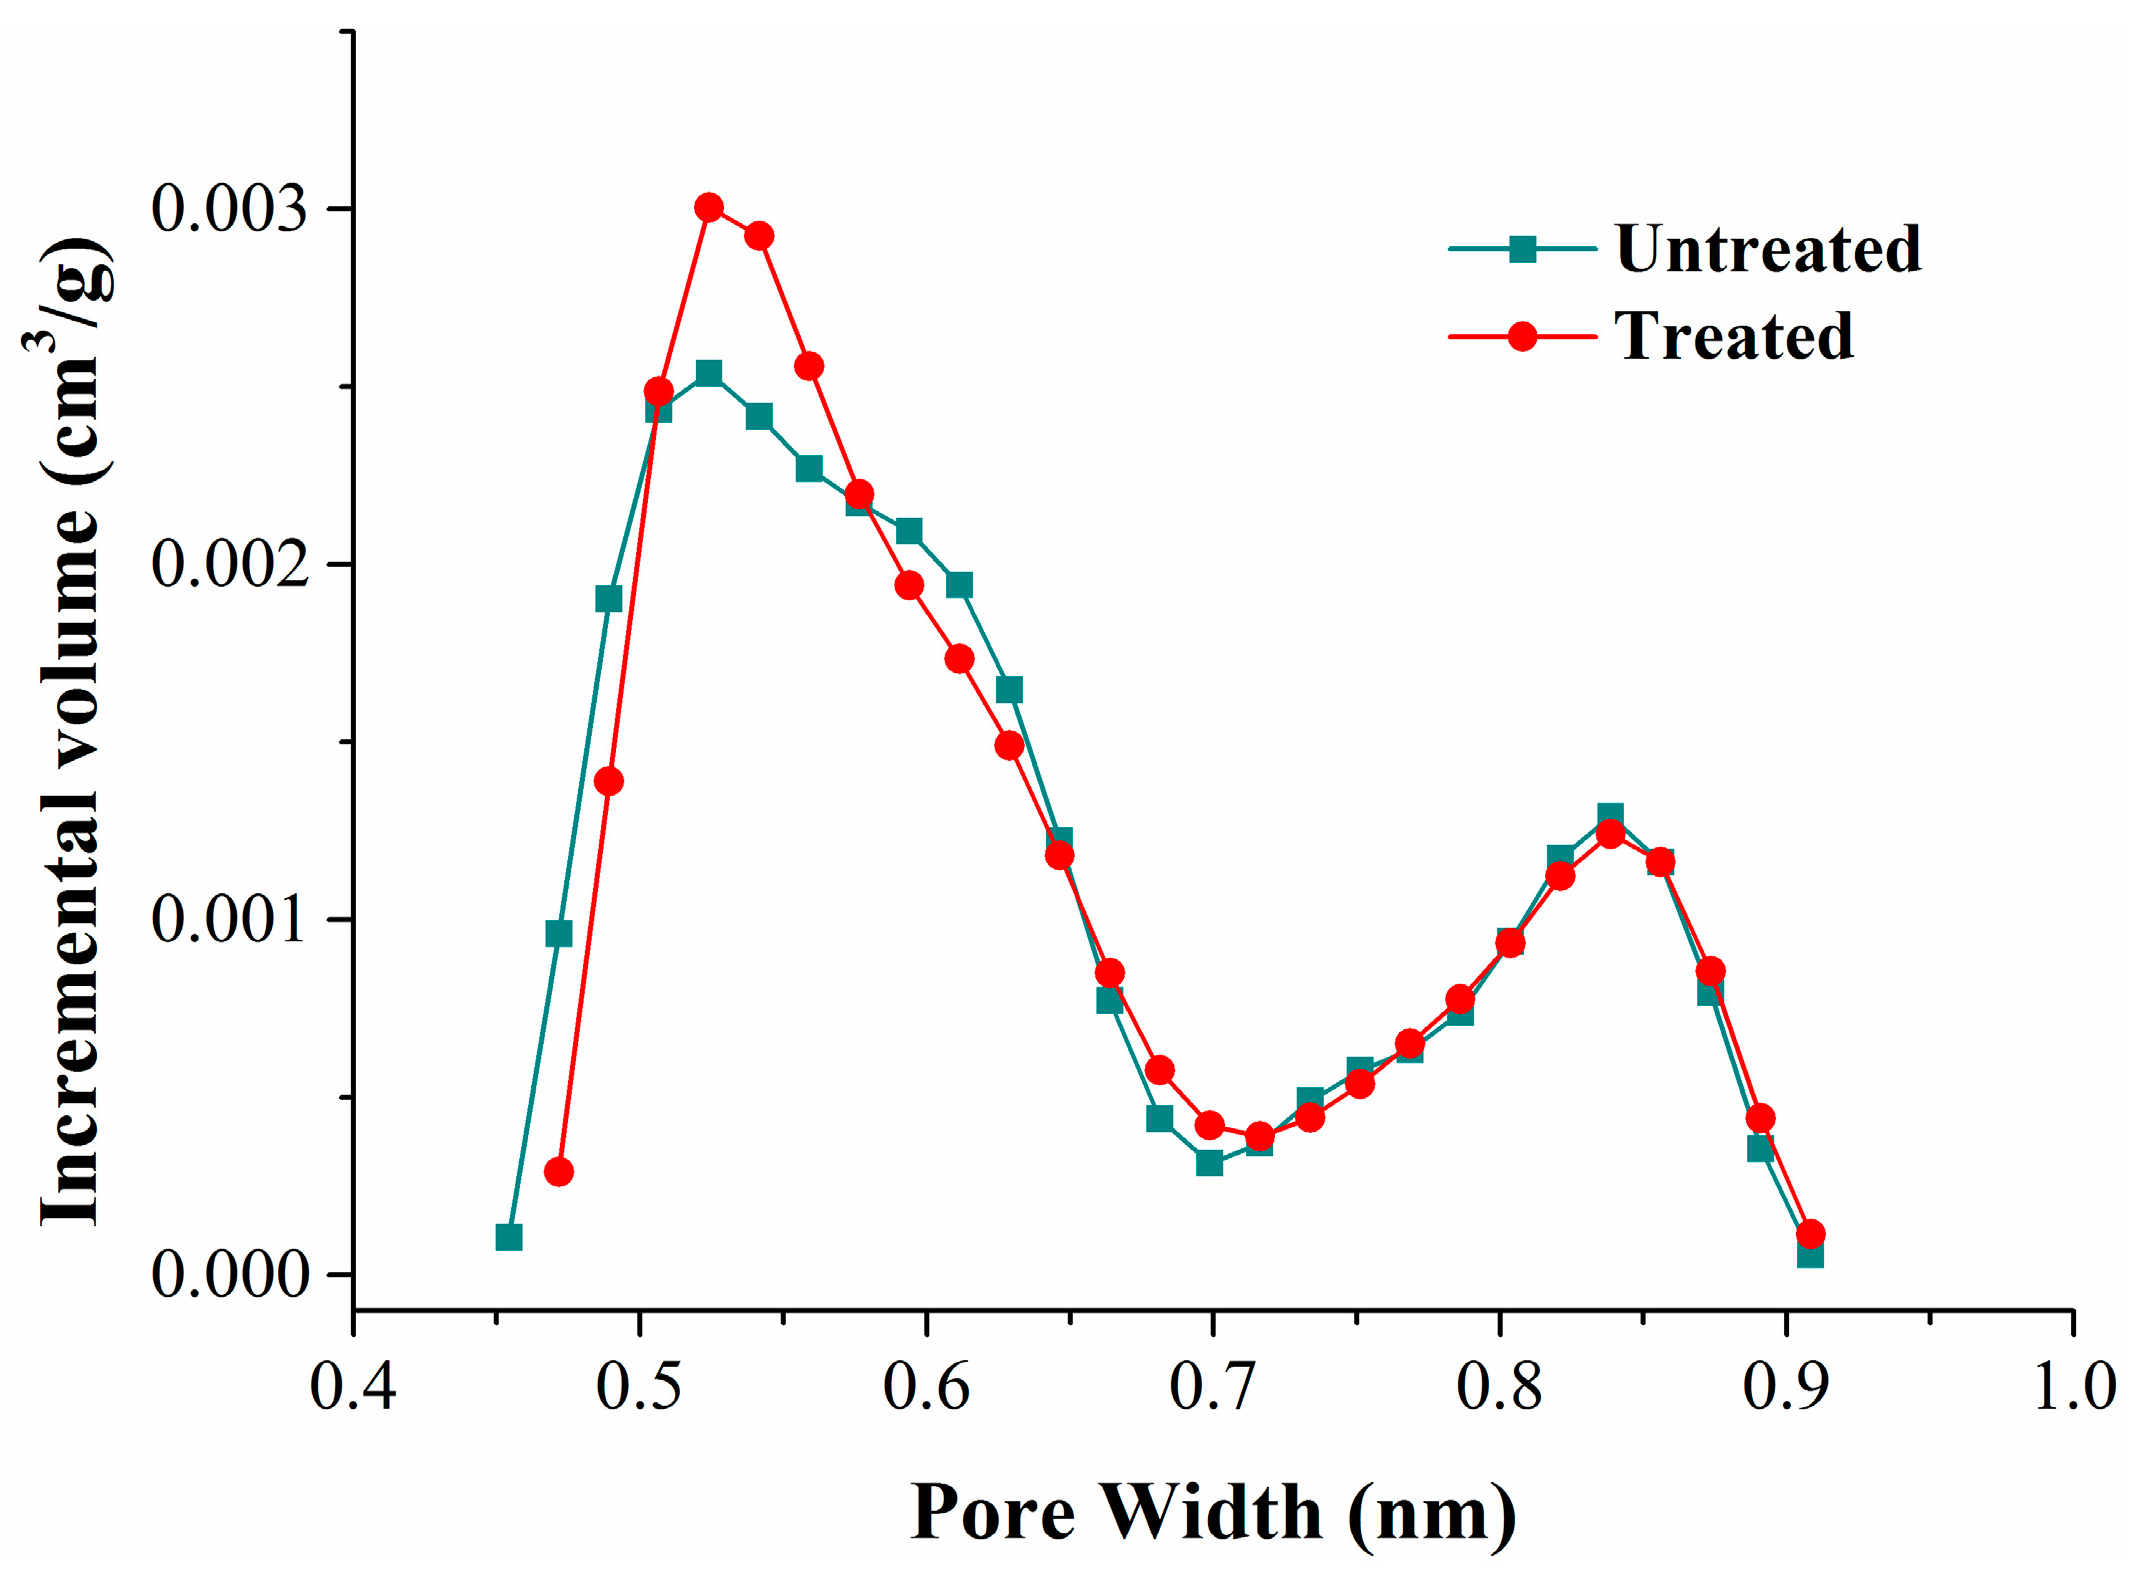
Figure 8.
Pore volume distribution of carbon dioxide adsorption.
Table 6 shows that the pore volume and specific surface area between 0.4720–0.9084 nm increased slightly after methane and nitrogen adsorption. Compared with the pore volume distribution curves (Figure 8), we found that the pore volume variation mainly focused on pores less than 0.6 nm in width. The pore diameter of pores less than 0.5 nm in width enlarged, and the pore volume of pores between 0.5 and 0.6 nm in width increased.
The specific surface area, pore volume, and pore size distribution of mesopores and part macropores in coal were measured by argon adsorption at 87 K. Based on the argon adsorption curves (Figure 3), the specific surface area, pore volume, and the distribution of mesopores and part macropores were obtained using the BJH (Barrett–Joyner–Halenda) and DFT analysis models; the results are shown in Table 7 and Figure 9.
Table 7.
Pore volume and specific area determined by argon adsorption.
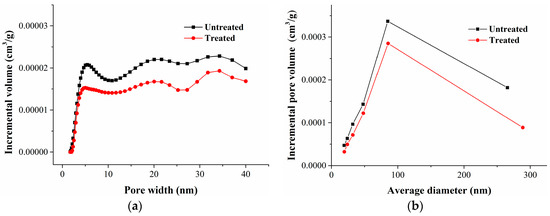
Figure 9.
Pore volume distribution of argon adsorption. (a) Calculated by the DFT model; and (b) Calculated by the BJH model.
Table 7 shows that the pore volume and specific surface of mesopores and part macropores (2–250 nm) decreased slightly after methane and nitrogen adsorption. The pore size distribution curves of the pore volume of coal samples before and after gas adsorption showed that the pore volume of mesopores and part macropores declined slightly (Figure 9). The increment of pore volume and specific surface area in the micropores obviously exceeded the reduction of pore volume and specific surface area of the mesopores and part macropores.
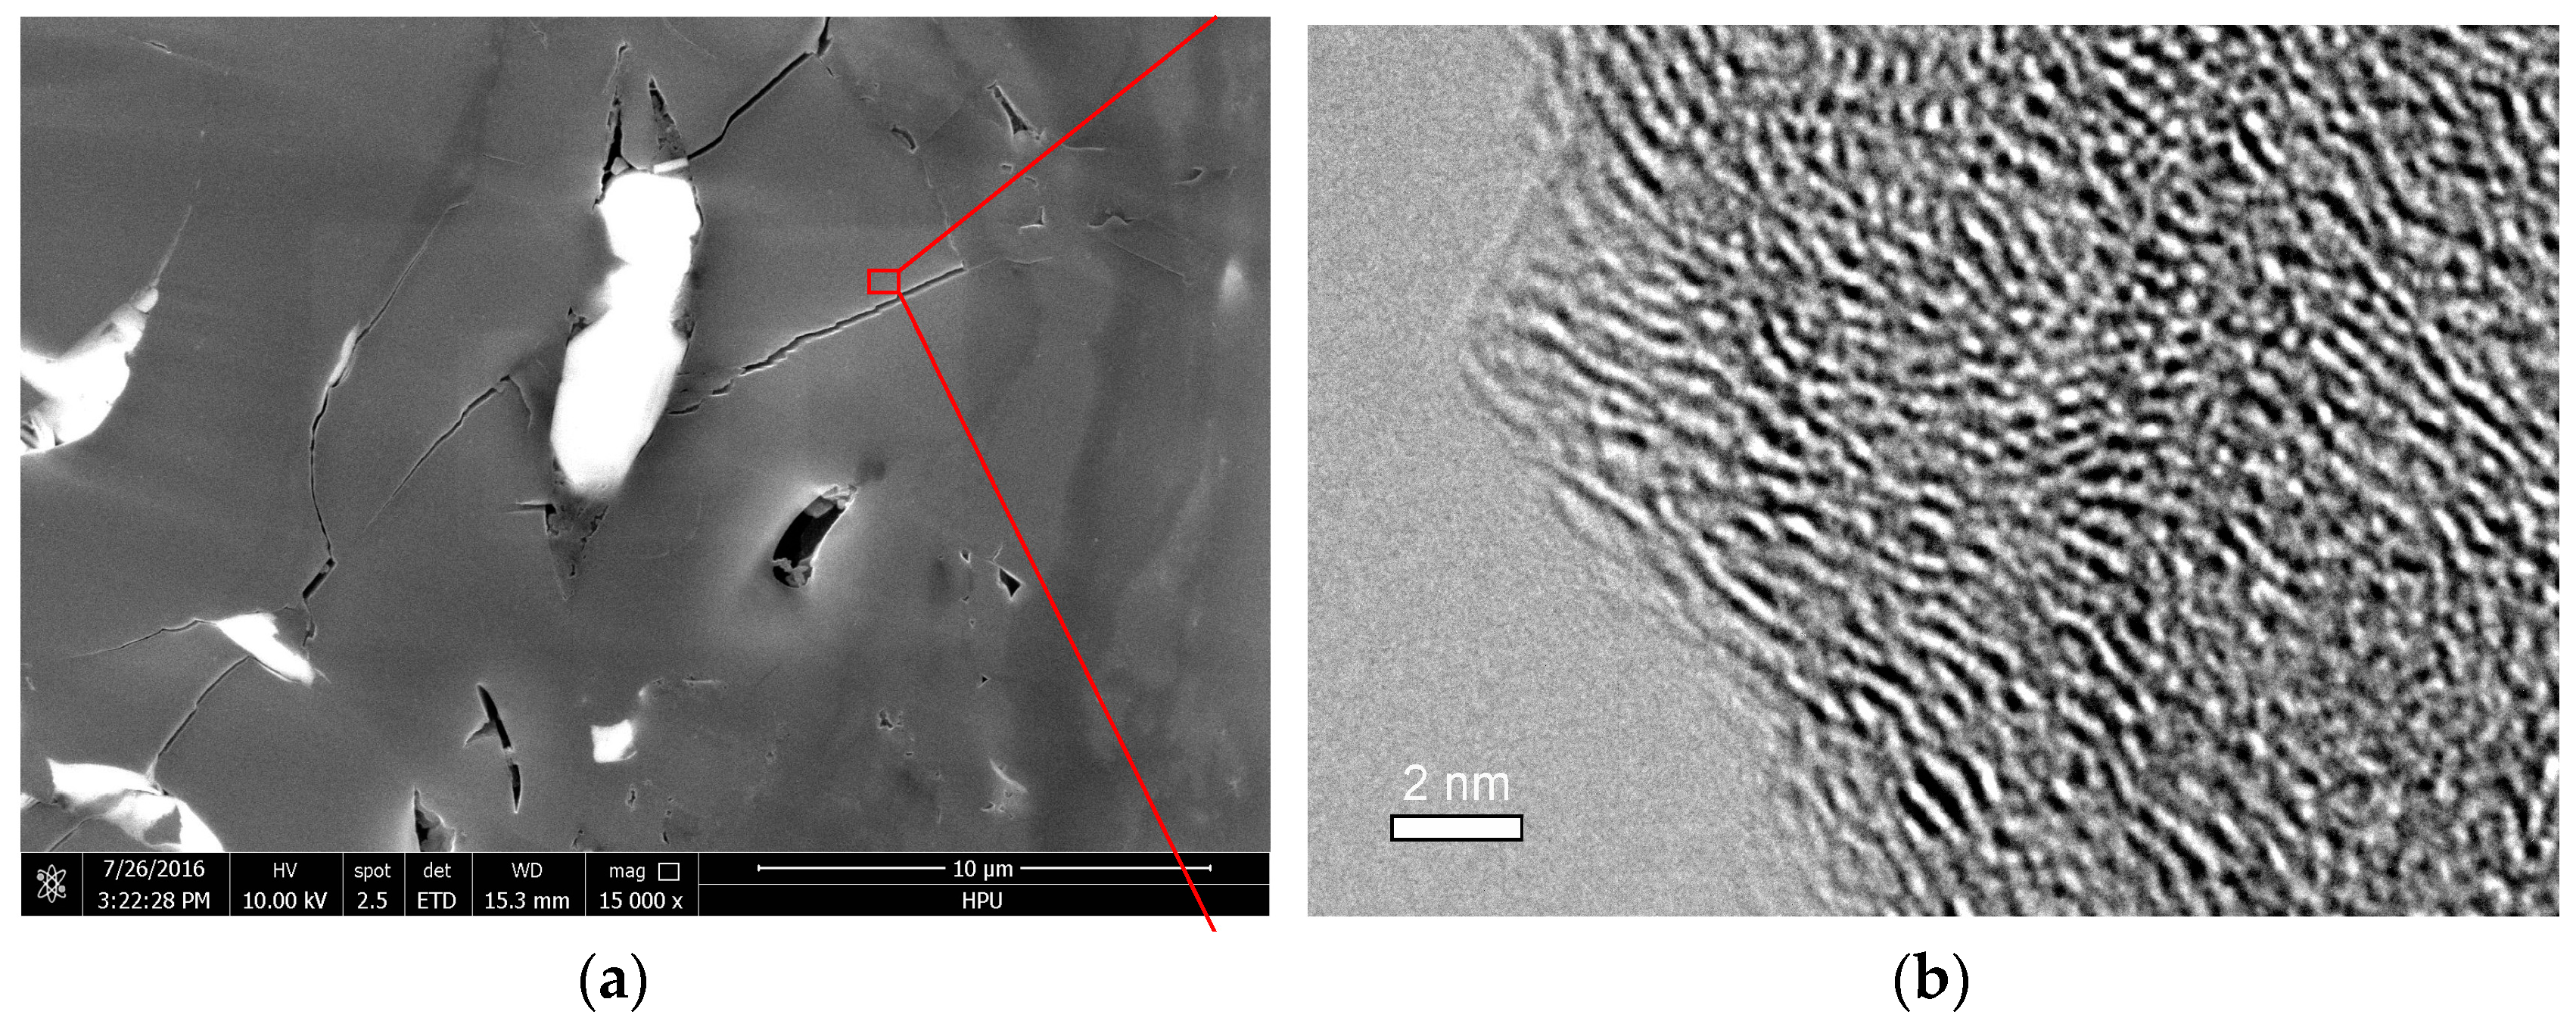
The micropores, mesopores, and macropores in the coal matrix were observed using HRTEM (JEOL Ltd., Tokyo, Japan) and FE-SEM (FEI Company, Hillsboro, OR, USA). Figure 10a is an FE-SEM image of the mesopores and macropores, and Figure 10b is a TEM image of the micropores. The vast majority of gas was absorbed on the surface of micropores, then the gas molecules desorbed and moved through the mesopores and macropores for release in CBM production. When the gas molecules absorbed on the micropore surface, the micropore volume increased, which led to the coal matrix swelling. We detected a residual micropore volume increment of 0.0006760 cm3/g. Meanwhile, the mesopore and macropore volume decreased due to the coal matrix swelling. The residual reduction was about 0.0002286 cm3/g, which was less than significant in terms of the micropore volume increment. The coal matrix deformation caused by gas adsorption was very small, and only a fraction of the deformation remained after the gas adsorption experiment. Therefore, the pore volume variation that we detected was very tiny, and some deformation in the macropores and cleat could not be determined by the argon adsorption experiment.
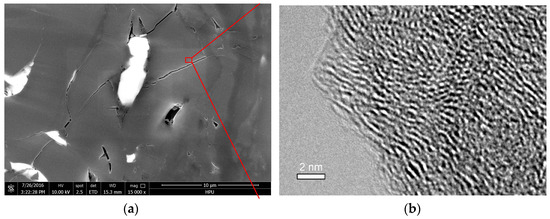
Figure 10.
FE-SEM and TEM images of coal matrix. (a) FE-SEM image of mesopores and macropores (×15,000); and (b) HRTEM image of micropores (×600,000).
4.5. Significance of the Coal Matrix Deformation
When gas is adsorbed or desorbed, the coal matrix will swell or shrink. The deformation amount is influenced by many factors such as the pressure, adsorption/desorption quantity, or gas type, and the deformation rate with pressure varies across different pressure intervals. From adsorption to desorption, the trend of coal matrix deformation under pressure is shown in Figure 11.
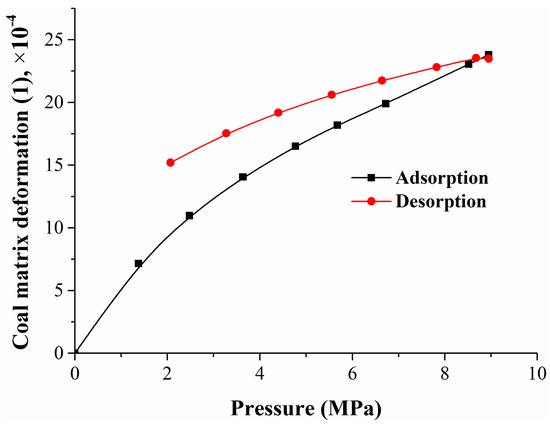
Figure 11.
Relationship between the coal matrix deformation and pressure.
Figure 11 shows that the coal matrix deformation also had a hysteresis effect as well as coal adsorption and desorption. There was a nonlinear relationship between the amount of the coal matrix deformation and the adsorption pressure or quantity. Experimental and computational results showed that the coal matrix swelling deformation induced by nitrogen or methane adsorption in the range of 6.72–8.95 MPa was only 19.6% of the mixed gases adsorption—less than 6.72 MPa. Seidle–Huitt’s permeability model assumes that all permeability changes are only caused by the adsorption-/desorption-induced strain. The coal reservoir permeability reduction caused by nitrogen desorption was much lower than the original reservoir permeability reduction caused by methane adsorption [51]. At the mixed gases desorption stage, the coal matrix shrank continuously. Compared with the coal matrix swelling in adsorption, the shrinkage had an obvious hysteresis effect.
Therefore, the nitrogen injection pressure should be controlled reasonably in nitrogen foam fracturing. Sufficient nitrogen pressure and quantity are necessary to ensure that the coal seam is fractured, but excessive pressure may lead to significant swelling of the coal matrix, which can decrease the permeability of the coal reservoir greatly.
In foaming hydraulic fracturing, the nitrogen injection will decrease the methane component pressure in the fracture; hence, more methane can be desorbed. The coal matrix swelling caused by gas adsorption will lead to the shrinkage of mesopores and macropores. With the increase of the injected fluid pressure, the fluid pressure of the coal reservoir increased, the effective stress decreased, and the permeability of the coal reservoir increased. Some studies have shown that the effective stress and permeability are negatively exponential. When the high-pressure nitrogen is injected, the effective stress of the coal reservoir can be reduced slowly, which is advantageous in maintaining the permeability of the coal reservoir [52,53]. This positive effect can counteract or even exceed the negative effect of mesopore and macropore shrinkage caused by gas adsorption. These results show that coal reservoir permeability increases, but their relationship needs further work.
5. Conclusions
In this paper, we conducted gas adsorption and replacement, a pore structure test experiment, established different stages of a coal matrix deformation model, and compared the characteristics of coal matrix deformation and pore structure. The results can be summarized as follows:
- (1)
- There was a nonlinear relationship between the amount of coal matrix deformation and the adsorption pressure or quantity. The deformation of the coal matrix caused by nitrogen was much less than that caused by methane. The coal matrix deformation also had a hysteresis effect as well as coal adsorption and desorption.
- (2)
- The results of the pore structure test of the coal matrix showed that the adsorption and desorption of gas led to a change in pore structure. The pore volume and specific surface of mesopores and part macropores (2–250 nm) decreased slightly after methane and nitrogen adsorption. It also showed that the deformation of the coal matrix was not completely elastic, and the permeability of the coal reservoir was dynamically changed during the production process of coalbed gas.
- (3)
- Generally, nitrogen foam fracturing was helpful in increasing the coal reservoir permeability. However, excessive pressure may lead to significant swelling of the coal matrix, which can decrease the permeability of the coal reservoir greatly. Therefore, the nitrogen injection pressure should be reasonably controlled.
Acknowledgments
This work was supported by the National Science Foundation of China (No. 41172141), Coal Seam Gas Joint Foundation Shanxi (No. 2016012001), and Henan Provincial Science and Technology Research Projects (No. 14A440005). We would like to express our appreciation to the other members of the laboratory for help provided in experiments and language editing.
Author Contributions
Drafting of manuscript: Xiaofeng Ji and Dangyu Song; acquisition of data: Xiaoming Ni and Haotian Zhao; analysis and interpretation of data: Xiaofeng Ji and Dangyu Song; performance of the experiments: Xiaofeng Ji and Yunbo Li; and planning and supervision of the research: Dangyu Song.
Conflicts of Interest
The authors declare no conflict of interest.
References
- Cai, Y.; Liu, D.; Pan, Z.; Che, Y.; Liu, Z. Investigating the effects of seepage-pores and fractures on coal permeability by fractal analysis. Transp. Porous Media 2016, 111, 479–497. [Google Scholar] [CrossRef]
- Gamson, P.D.; Beamish, B.B.; Johnson, D.P. Coal microstructure and micropermeability and their effects on natural gas recovery. Fuel 1993, 72, 87–99. [Google Scholar] [CrossRef]
- Gray, I. Reservoir engineering in coal seams: Part 1—The physical process of gas storage and movement in coal seams. SPE Reserv. Eng. 1987, 2, 28–34. [Google Scholar] [CrossRef]
- Mitra, A.; Harpalani, S.; Liu, S. Laboratory measurement and modeling of coal permeability with continued methane production: Part 1—Laboratory results. Fuel 2012, 94, 110–116. [Google Scholar] [CrossRef]
- Xu, J.; Xu, X.Y.; Jia, J.; Zhao, C.X. Economic evaluation analysis of CBM development in Qinshui Basin of Shanxi province. China Coalbed Methane 2015, 12, 36–38. (In Chinese) [Google Scholar]
- Liu, D.; Yao, Y.; Tang, D.; Tang, S.; Che, Y.; Huang, W. Coal reservoir characteristics and coalbed methane resource assessment in Huainan and Huaibei coalfields, Southern North China. Int. J. Coal Geol. 2009, 79, 97–112. [Google Scholar] [CrossRef]
- Wang, S.; Zhou, F.; Kang, J.; Wang, X.; Li, H.; Wang, J. A heat transfer model of high-temperature nitrogen injection into a methane drainage borehole. J. Nat. Gas Sci. Eng. 2015, 24, 449–456. [Google Scholar] [CrossRef]
- Xia, T.; Zhou, F.; Liu, J.; Gao, F. Evaluation of the pre-drained coal seam gas quality. Fuel 2014, 130, 296–305. [Google Scholar] [CrossRef]
- Busch, A.; Gensterblum, Y. CBM and CO2-ECBM related sorption processes in coal: A review. Int. J. Coal Geol. 2011, 87, 49–71. [Google Scholar] [CrossRef]
- Jessen, K.; Tang, G.Q.; Kovscek, A.R. Laboratory and simulation investigation of enhanced coalbed methane recovery by gas injection. Transp. Porous Media 2008, 73, 141–159. [Google Scholar] [CrossRef]
- Stevens, S.H.; Spector, D.; Riemer, P. Enhanced coalbed methane recovery using CO2 injection: Worldwide resource and CO2 sequestration potential. In Proceedings of the SPE International Oil and Gas Conference and Exhibition in China, Beijing, China, 2–6 November 1998. [Google Scholar]
- Van Hemert, P.; Wolf, K.H.A.A.; Rudolph, E.S.J. Output gas stream composition from methane saturated coal during injection of nitrogen, carbon dioxide, a nitrogen–carbon dioxide mixture and a hydrogen–carbon dioxide mixture. Int. J. Coal Geol. 2012, 89, 108–113. [Google Scholar] [CrossRef]
- Puri, R.; Yee, D. Enhanced coalbed methane recovery. In Proceedings of the SPE Annual Technical Conference and Exhibition, New Orleans, LA, USA, 23–26 September 1990. [Google Scholar]
- Sayyafzadeh, M.; Keshavarz, A.; Alias, A.R.M.; Dong, K.A.; Manser, M. Enhancing Coal Bed Methane Recovery by Varying-Composition Gas Injection. In Proceedings of the SPE/IATMI Asia Pacific Oil & Gas Conference and Exhibition, Nusa Dua, Indonesia, 20–22 October 2015. [Google Scholar]
- Shi, J.Q.; Durucan, S. A model for changes in coalbed permeability during primary and enhanced methane recovery. SPE Reserv. Eval. Eng. 2005, 8, 291–299. [Google Scholar] [CrossRef]
- Zhu, J.; Jessen, K.; Kovscek, A.R.; Orr, F.M., Jr. Analytical theory of coalbed methane recovery by gas injection. SPE J. 2003, 8, 371–379. [Google Scholar] [CrossRef]
- Liu, J.; Chen, Z.; Elsworth, D.; Miao, X.; Mao, X. Evolution of coal permeability from stress-controlled to displacement-controlled swelling conditions. Fuel 2011, 90, 2987–2997. [Google Scholar] [CrossRef]
- Zang, J.; Wang, K.; Zhao, Y. Evaluation of gas sorption-induced internal swelling in coal. Fuel 2015, 143, 165–172. [Google Scholar] [CrossRef]
- Zhang, H.; Liu, J.; Elsworth, D. How sorption-induced matrix deformation affects gas flow in coal seams: A new FE model. Int. J. Rock Mech. Min. Sci. 2008, 45, 1226–1236. [Google Scholar] [CrossRef]
- Zhu, W.C.; Liu, J.; Sheng, J.C.; Elsworth, D. Analysis of coupled gas flow and deformation process with desorption and Klinkenberg effects in coal seams. Int. J. Rock Mech. Min. Sci. 2007, 44, 971–980. [Google Scholar] [CrossRef]
- Fujimoto, S.; Mizuno, R.; Saito, Y.; Nakamura, S. Clinical application of wave intensity for the treatment of essential hypertension. Heart Vessels 2004, 19, 19–22. [Google Scholar] [CrossRef] [PubMed]
- Liu, J.; Peach, C.J.; Zhou, H.; Spiers, C.J. Thermodynamic models for swelling of unconfined coal due to adsorption of mixed gases. Fuel 2015, 157, 151–161. [Google Scholar] [CrossRef]
- Wang, S.; Elsworth, D.; Liu, J. Permeability evolution in fractured coal: The roles of fracture geometry and water-content. Int. J. Coal Geol. 2011, 87, 13–25. [Google Scholar] [CrossRef]
- Zhang, L.; Aziz, N.; Ren, T.X.; Wang, Z. Influence of temperature on coal sorption characteristics and the theory of coal surface free energy. Procedia Eng. 2011, 26, 1430–1439. [Google Scholar] [CrossRef]
- Lin, B.; Zhou, S. Experimenta linvestigation on deformation law of coal body containing methane. J. China Univ. Min. Technol. 1986, 15, 9–16. (In Chinese) [Google Scholar]
- Cui, X.; Bustin, R.M.; Chikatamarla, L. Adsorption-induced coal swelling and stress: Implications for methane production and acid gas sequestration into coal seams. J. Geophys. Res. 2007, 112, B10202. [Google Scholar] [CrossRef]
- Chareonsuppanimit, P.; Mohammad, S.A.; Robinson, R.L.; Gasem, K.A.M. Modeling gas-adsorption-induced swelling and permeability changes in coals. Int. J. Coal Geol. 2014, 121, 98–109. [Google Scholar] [CrossRef]
- Chen, G.; Yang, J.; Liu, Z. Method for simultaneous measure of sorption and swelling of the block coal under high gas pressure. Energy Fuels 2012, 26, 4583–4589. [Google Scholar] [CrossRef]
- Day, S.; Fry, R.; Sakurovs, R. Swelling of Australian coals in supercritical CO2. Int. J. Coal Geol. 2008, 74, 41–52. [Google Scholar] [CrossRef]
- Kelemen, S.R.; Kwiatek, L.M. Physical properties of selected block Argonne Premium bituminous coal related to CO2, CH4, and N2 adsorption. Int. J. Coal Geol. 2009, 77, 2–9. [Google Scholar] [CrossRef]
- Pan, Z.; Connell, L.D. A theoretical model for gas adsorption-induced coal swelling. Int. J. Coal Geol. 2007, 69, 243–252. [Google Scholar] [CrossRef]
- Chen, Z.; Liu, J.; Pan, Z.; Connell, L.D.; Elsworth, D. Effect of the effective stress coefficient and sorption-induced strain on the evolution of coal permeability: Model development and analysis. Int. J. Greenh. Gas Control 2012, 8, 101–110. [Google Scholar] [CrossRef]
- Zhou, Y.; Li, Z.; Yang, Y.; Zhang, L.; Qi, Q.; Si, L.; Li, J. Improved porosity and permeability models with coal matrix block deformation effect. Rock Mech. Rock Eng. 2016, 49, 3687–3697. [Google Scholar] [CrossRef]
- Scherer, G.W. Dilatation of porous glass. J. Am. Ceram. Soc. 1986, 69, 473–480. [Google Scholar] [CrossRef]
- Bangham, D.H.; Razouk, R.I. The swelling of charcoal. Part V. The saturation and immersion expansions and the heat of wetting. Proc. R. Soc. Lond. 1938, 166, 572–586. [Google Scholar] [CrossRef]
- Setzer, M.; Wittmann, F. Surface energy and mechanical behaviour of hardened cement paste. Appl. Phys. 1974, 3, 403–409. [Google Scholar] [CrossRef]
- Adamson, A.W.; Gast, A.P. Physical Chemistry of Surfaces; John Wiley Sons, Inc.: Hoboken, NJ, USA, 1967. [Google Scholar]
- Sircar, S. Gibbsian surface excess for gas adsorption revisited. Ind. Eng. Chem. Res. 1999, 38, 3670–3682. [Google Scholar] [CrossRef]
- Langmuir, I. The constitution and fundamental properties of solids and liquids. II. Liquids. 1. J. Am. Chem. Soc. 1917, 39, 1848–1906. [Google Scholar] [CrossRef]
- Zhou, J.P.; Xian, X.F.; Jiang, Y.D.; Gu, D.S.; Wang, C. A model of adsorption induced coal deformation based on thermodynamics approach. J. China Coal Soc. 2011, 36, 468–472. (In Chinese) [Google Scholar]
- Dreisbach, F.; Staudt, R.; Keller, J. High pressure adsorption data of methane, nitrogen, carbon dioxide and their binary and ternary mixtures on activated carbon. Adsorption 1999, 5, 215–227. [Google Scholar] [CrossRef]
- Arri, L.; Yee, D.; Morgan, W.; Jeansonne, M. Modeling coalbed methane production with binary gas sorption. In Proceedings of the SPE Rocky Mountain Regional Meeting, Casper, WY, USA, 18–21 May 1992. [Google Scholar]
- Yang, R. Gas Separation by Adsorption Processes; Pergamon: Bergama, Turkey, 1988. [Google Scholar]
- Standardization Administration of China. Method for Preparation of Coal Sample; GB 474-2008; China National Standards: Beijing, China, 2008.
- Standardization Administration of China. Experimental Method of High-Pressure Isothermal Adsorption to Coal; GB/T 19560-2008; China National Standards: Beijing, China, 2008.
- Seri-Levy, A.; Avnir, D. Effects of heterogeneous surface geometry on adsorption. Langmuir 1993, 9, 3067–3076. [Google Scholar]
- Standardization Administration of China. Pore Size Distribution and Porosity of Solid Materials by Mercury Porosimetry and Gas Adsorption-Part 3: Analysis of Micropores by Gas Adsorption; GB/T 21650.3-2011; China National Standards: Beijing, China, 2011.
- Thommes, M.; Kaneko, K.; Neimark, A.V.; Olivier, J.P.; Rodriguez Reinoso, F.; Rouquerol, J.; Sing, K.S. Physisorption of gases, with special reference to the evaluation of surface area and pore size distribution (IUPAC technical report). Pure Appl. Chem. 2015, 87, 1051–1069. [Google Scholar] [CrossRef]
- Marsh, H. Adsorption methods to study microporosity in coals and carbons—A critique. Carbon 1987, 25, 49–58. [Google Scholar] [CrossRef]
- Thommes, M. Physical adsorption characterization of nanoporous materials. Chem. Ing. Tech. 2010, 82, 1059–1073. [Google Scholar] [CrossRef]
- Seidle, J.; Jeansonne, M.; Erickson, D. Application of matchstick geometry to stress dependent permeability in coals. In Proceedings of the SPE Rocky Mountain Regional Meeting, Casper, WY, USA, 18–21 May 1992. [Google Scholar]
- Ma, F.; He, S.; Zhu, H.; Xie, Q.; Jiao, C. The effect of stress and pore pressure on formation permeability of ultra-low-permeability reservoir. Petrol. Sci. Technol. 2012, 30, 1221–1231. [Google Scholar] [CrossRef]
- Meng, Z.P.; Hou, Q.L. Coupling model of stress-dependent permeability in high-rank coal reservoir and its control mechanism. China J. Geophys. 2013, 56, 667–675. (In Chinese) [Google Scholar]


© 2018 by the authors. Licensee MDPI, Basel, Switzerland. This article is an open access article distributed under the terms and conditions of the Creative Commons Attribution (CC BY) license (http://creativecommons.org/licenses/by/4.0/).