Abstract
The current paper mainly focuses on finding a more appropriate way to enhance the fan performance at off-design conditions. The centrifugal fan (CF) based on flap-adjustment (FA) has been investigated through theoretical, experimental, and finite element methods. To obtain a more predominant performance of CF from the different adjustments, we carried out a comparative analysis on FA and leading-adjustment (LA) in aerodynamic performances, which included the adjusted angle of blades, total pressure, efficiency, system-efficiency, adjustment-efficiency, and energy-saving rate. The contribution of this paper is the integrated performance curve of the CF. Finally, the results showed that the effects of FA and LA on economic performance and energy savings of the fan varied with the blade angles. Furthermore, FA was feasible, which is more sensitive than LA. Moreover, the CF with FA offered a more extended flow-range of high economic characteristic in comparison with LA. Finally, when the operation flow-range extends, energy-saving rate of the fan with FA would have improvement.
1. Introduction
As important equipment for many industries, the centrifugal fan (CF) has wide applications and it accounts for a large amount of primary energy consumption [1]. How to improve its overall efficiency [2], total pressure [3], and energy utilization [4,5] should be significantly understood. Commonly, in practical industrial applications, the real-time efficiency is lower than the designed maximum efficiency when the fan system works at an off-design condition. The flow in rotating fans is always unsteady due to the complex flow conditions, e.g., the flow separation and vortex shedding. Hence, the fan adjustment to pursue better performance in the progress of its operation must be investigated, such as outlet-angle (OA) adjustment [6] and inlet guide vanes (IGVs) adjustment [7], which is also called the leading-adjustment (LA) in this paper.
The inlet vanes lead to a whirl to the entering gas, so that the gas enters the CF or pump system in a fixed rotation direction. Through aerodynamic principles, due to IGVs, the CF operates with stable enough characteristic pressure curves, which do not tend to surge because of the turbulence created by the vanes in the inlet position in running condition [8]. By installing a guide vane of several sheets at the suction cascade inlet of the cross-flow fan and optimizing the angle, results in [9] showed that the high pressure was obtained. In the previous researches, Reference [10] found a downstream flow resistance method to adjust the fan performance and the stalling effect in a fan system. Reference [11] designed a digital signal processor controller to adjust the stagger angle of IGVs automatically that optimized the efficiency at any operating condition. To achieve higher pressure and performance enhancement of the fan, Reference [12] investigated the effect of the angle and length of the leading blades on the performance of the cross-flow fan by controlling the pre-rotation of the rotor inlet flow. Furthermore, by installing IGVs at the centrifugal pump inlet, an inevitable pressure loss was induced due to the friction loss on IGVs’ surface and the incidence loss on IGVs’ leading edge [13].
However, many guide vanes installed in the entrance seem to lower the efficiency of the fan in order to generate the loss of the flow by itself [12]. In particular, when the IGVs’ angle exceeded 45°, the efficiency of the fan decreased obviously, which resulted in lots of wasted energy [14].
With the development of the Finite Element (FE) method [15,16], research in [17] was carried out on effects of installing angle setting for the rotor blade based on both FE method and experimental method, and found that volume flow rate, pressure and torque of fan presented an increasing tendency in various degrees with increasing angles. In a pioneer study, Reference [18] focused on the measurement about the pressure based on the pump impeller experiment and researched diffuser vane with different gaps that lay in the middle of the blade trailing edge and diffuser vane leading edge. In recent years, researches based on this aspect have been investigated more thoroughly, e.g., the dynamic and periodic interaction between the static and rotor blade rows within a low-speed fan was analyzed by [19], and on this basis, Reference [10] modified the conventional Computational Fluid Dynamics (CFD) approaches to investigate the effect of the inter-blade flow with different blade angles of attack. Reference [20] analyzed how a change in the outlet and torsion angles affected the performance of the fan and applied the optimal values to the design to improve the performance of the fan. Reference [6] investigated the outlet angles using a numerical analysis method, and the result showed that the discharge flow rate slightly increased with increased outlet angle, leading to increased theoretical power and efficiency. In the present investigations, Reference [21] carried out numerical identification of blade exit angle effect on the performance for a multistage centrifugal impeller and found that the most convenient blade exit angle that had a highest efficiency of 84.6% was at eighteen degree.
The previous researches mainly focused on the impact of outlet-angle change of the integral blade on the fan performance [22], however, in the progress of the fan operation, there have been few investigations of the effect on the fan performance, especially on the CF performance, when we only change the local outlet angle of the blade tail, but not the integral blade mounting angle. Hence, according to the aerodynamic principles, this paper focused the comparative investigation on CF with flap-adjustment (FA) and leading-adjustment (LA) based on both experimental and FE methods. In particular, this research on CF performed well at an off-design condition, as well as a design-flow condition. In addition, economic performance and energy-saving rates are mainly presented to analyze the CF characteristic.
2. Experiment
Figure 1 shows the position and structure characteristic of a flap-adjusted blade (FAB) and leading-adjusted blade (LAB) in this experiment. As shown in Figure 1, the normal blade is replaced by FAB which separates the blade into two parts. One part is the first half of the blade which is the same as the normal blade, and the other part is the rotating blade with a rotor angle. LAB is also called the inlet guide vane [8,23], which is placed between the current flow collector and the impeller inlet shown at the left of Figure 1. During this experiment, when LAB was in the investigation, α0 could be any angle and α must be zero degree, and when FAB is in the investigation, α could be any angle and α0 must be zero degree. In this paper, the energy-saving characteristics of CF based on FAB and LAB were the main concerns, which were researched separately to reach a better comparative analysis.
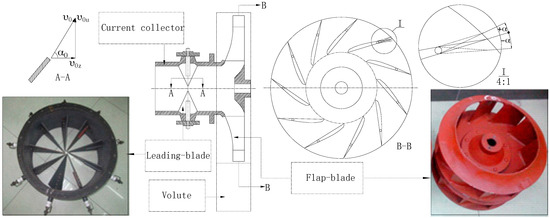
Figure 1.
Adjusted principle.
When considering the experiment conditions of our fluid-machinery laboratory, the CF model in this experiment was different from the FE calculation model in the next section. Furthermore, this paper only focused on the performance of FA and LA, hence, the centrifugal impeller structure with different rotated flap angles was divided into several impellers with different fixed flap angles, as shown at the right of Figure 1. Additionally, the parameters of 4-72-11 CF for experiment are listed in Table 1. In this experiment, the leading-blade (LB) angles of the CF were 0°, +10°, +20°, +30°, +40°, +50° and +60°, while the FA angles were −20°, 0°, +10°, and +20°.

Table 1.
Parameters of experimental centrifugal fan model.
3. Finite Element Methods
3.1. Modelling
Table 2 shows the parameters of CF model used in FE calculation, which is a litter different from the one used in the experiment. The difference only focuses on that the specific speed of the experiment CF being 72, while specific speed of the FE calculation CF is 73, for which the FE calculation results on the performance differences using this model could be more obvious than the experimental results. Moreover, as the two different models have similar performances, including the internal flow principles, so that the comparative results were reasonable.
Table 2.
Parameters of Finite Element (FE) calculation centrifugal fan model.
In this FE calculation, the Pro ENGINEER software (Creo Parametric 4.0, Parametric Technology Corporation, Boston, MA, USA) was chosen to build the CF model. As is shown in Figure 2, the flow collector, impeller, and volute are three parts of the model. Regarding the flap parts, the length of FB part was 30% of the original blade length, and the FB angles were −20°, −15°, −10°, −5°, 0°, +10°, and +20°. The LB angles are −10°, 0°, +15°, +30°, +40°, +50°, and +60°.
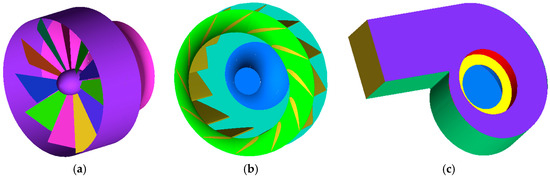
Figure 2.
Computation model of CF: (a) leading-blade (LB); (b) impeller; and (c) volute.
3.2. Computation Mesh
The meshing parts of the CF models built by ICEM CFD software (ANSYS 14.0, Canonsburg, PA, USA) were arranged for unstructured grids. The blade surface is filled with mesh refinement, therefore the computing was easy to converge. The final number of the total grid was 1.64 million, as shown in Figure 3. The FE results of 1.21 million grids, 1.64 million grids, and 2.05 million grids when the FB angle was 0° were compared to exclude the impact of the grid number on the FE results. From the results in Figure 4, the result of 1.64 million grids followed the requirement of mesh uncertainty.
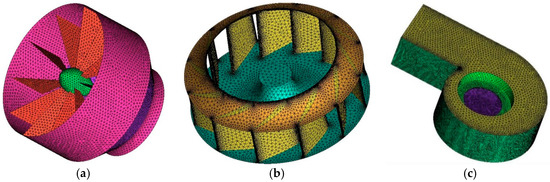
Figure 3.
Computation grid of CF: (a) LB; (b) impeller; and (c) volute.
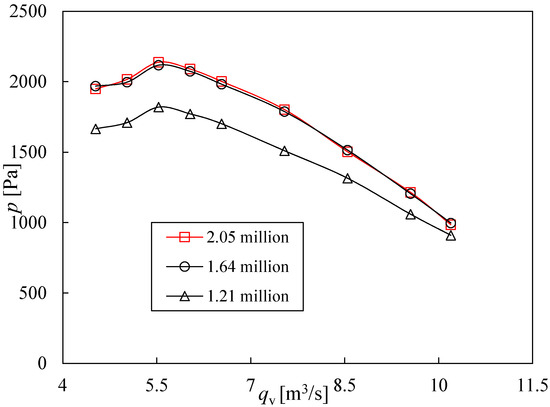
Figure 4.
Computation test of grid uncertainty.
3.3. Boundary Conditions and FE Calculation
As an important branch of FE analysis in fluid machinery, the CFD software is usually used for this calculation [24,25]. The large flow condition was based on the three-dimensional steady Reynolds time-averaged Navier-Stokes (N-S) equations [26] and the small flow unsteady conditions on the turbulence Spalart-Allmaras (S-A) model [27]. The pressure-coupled semi-implicit method was adopted, where pressure and convection interpolation were calculated with pressure staggering option (PRESTO) and the second-order upwind scheme. Since the fan model included revolving dynamic and static regions, the steady flow coupling between the areas employed a multiple reference frame model, and the unsteady flow employed a sliding mesh model.
Regarding the boundary conditions, a velocity-inlet was chosen with axial admission, the export was the outflow and the wall adopted no-slip wall boundary conditions. The areas between the dynamic region of the impeller and the static region of the volute and the current collector were processed with interface. The steady condition adopted the multiple references (MRE) model and the unsteady condition adopted the sliding-grid model for the rotor, and the speed was 1450 r/min and the inlet reference pressure was 101,325 Pa, ignoring the gravity.
The FE simulation was calculated under two conditions that were 0° of the flap angle and 0° of the leading angle. When compared with the experimental data of G4-73-11 No. 8D centrifugal fan in the sampling book [28], the FE calculation result was found to be consistent with the trend of the experimental performance curve, as shown in Figure 5. The curve error was within 3.5% and the curve error was within 3.7%, which indicated that the full operating condition errors were within the allowable range. Hence, the numerical result about 0° flap-blade angle could be considered as validated with the experimental data. Additionally, in case of the same mathematic model and boundary conditions with 0° flap-blade angle, the results of FE calculation about other blade angles in this paper were valid and consistent with the actual situation.
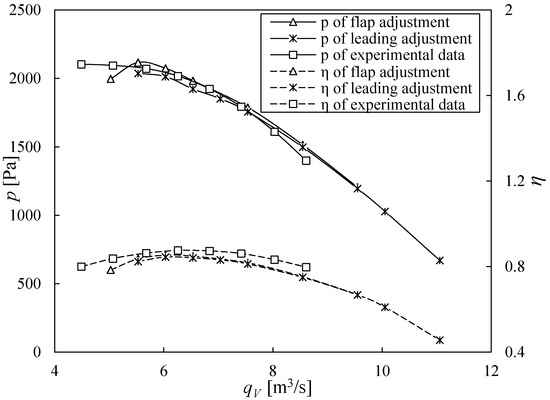
Figure 5.
The performance curve comparison of FE results and the experimental data.
4. Results
4.1. Experimental Results
Figure 6 shows the LA and FA experimental results on the total pressure and efficiency with the change of the flow region. The black lines represent the pressure curves of the CF and the blue dot-lines are the efficiency curves. From Figure 6a, with the rise of the leading angle, the total pressure decreased and the pressure-error between the two neighboring leading angle increased apparently. The maximum efficiency was 78.9%, which occurred in the 0° leading angle. In particular, when the flap angle was larger, the efficiency reduced more quickly. This phenomenon and the reason about the rapid decline of the efficiency could be found in the investigation of [14].
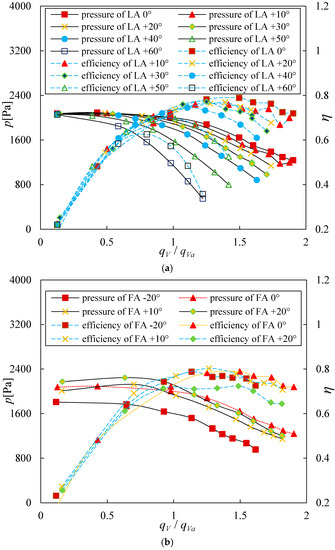
Figure 6.
Experimental results about total pressure and efficiency based on (a) LA; (b) FA.
Figure 6b shows the FA experimental results. The performance curve of 0° was different from the changing law of the other three curves as the impeller of 0° was the original one obtained from the CF Company while the impellers of +20°, +10°, and −20° were processed in another company. Due to the differences of the thickness and the welding process, curves between them exist as errors. The maximum total pressure occurred when the FB was +20°. With the decrease of the angle, the total pressure dropped down quickly. But, the changing law of efficiency curve was different with the total pressure curve. When the blade angle was +10°, the maximum efficiency was 80.3%, which was promoted by 1.4% from 78.9% of the original impeller. With the decline of the flow rate, the efficiency of CF with FA under the same flow-rate condition was always higher than the efficiency of the CF with the original impeller.
When comparing the LA results with the FA results, the maximum total pressure of CF with FA was 2245.6 Pa, which was promoted by 174.6 Pa from 2071 Pa of CF with LA. Apparently, the decline value of maximum efficiency for every 10° based on different flap angles was lower than that based on different leading angles, and the maximum efficiency 80.3% of CF with FA was 1.4% higher than the maximum efficiency 78.9% of the CF with LA.
4.2. FE Results
Figure 7 shows the LA and FA simulation results about total pressure and efficiency changing laws. From Figure 7a, the maximum pressure 2079.8 Pa occurred in a −10° leading angle. With the rise of the leading angle, the maximum total pressure decreased with the decline of leading angle. While the leading angle was in the sphere from −10° to +15°, the LA was not as sensitive when compared with a larger LA angle. Hence, comparatively, LA was sensitive in the sphere from +15° to +60°. Furthermore, it was the same phenomenon as the efficiency except that it was the −10° leading angle which kept a similar maximum efficiency with 0° leading angle. The maximum efficiency remained at a high value above 80% from −10° to +30° leading angle, while the maximum efficiency dropped quickly from +30° to +60° leading angle.
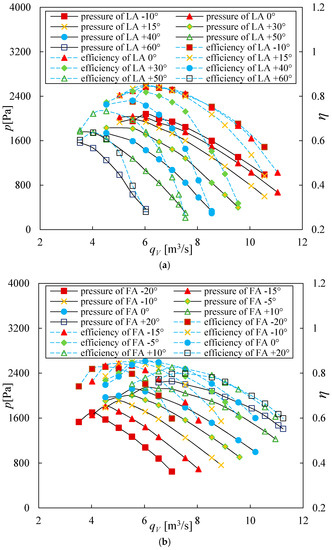
Figure 7.
FE results about total pressure and efficiency based on (a) LA; (b) FA.
Figure 7b indicates the FA simulation results about total pressure and efficiency changing laws that matched the former experimental results. The pressure curve changed with different flap angles and the maximum pressure decreased with the decline of the flap angle. Regardless of whether the flap angle was positive or negative, the pressure characteristic curve changed, which hinted that CF with FA would have a wide-range to adopt in different flow conditions. The pressure changing value of every 5° for positive flap angles was similar with the value of every 10° for negative flap angles. From the efficiency results, when the flap angle was −5°, the fan behaved at the maximum efficiency of 85.5%, which was 0.2% higher than the maximum efficiency 85.3% of 0° flap angle at the design-flow condition. The maximum efficiency decreased while the flap angle approached +20° and the variation was 6%. Furthermore, the decline error of maximum efficiency was 2% when the flap angle changes to −20°. In particular, assuming that the flow rate dropped down to 5 m3/s, the efficiency of CF with −20° flap angle was 82.2%, which was promoted by 3.2% from 79% of the original 0° flap angle, which hinted that CF with FA could work with a high efficiency at the low-flow or off-design region.
When comparing Figure 7a,b, regardless of LA or FA, the mainly changing rules of the total pressure were similar, which was that the total pressure would rise with the increase of the angle. However, the maximum total pressure of FA was 2253.5 Pa, which was 173.7 Pa higher than the LA of 2079.8 Pa. Regarding the efficiency results, the maximum efficiency for CF with FA was 85.5%, which was promoted by 0.7% from 84.8% of CF with LA. Moreover, when it came to the low-flow sphere, CF with FA could have a higher efficiency than CF with LA, e.g., when the flow rate was 4 m3/s, the maximum efficiency for CF with LA was 72.2%, while the maximum efficiency for CF with FA was 81.8%. Moreover, the high efficiency sphere of FA was wider than LA.
5. Analysis and Discussion
5.1. Theoretical Analysis
The outlet mounting angle of the flap-structure of the centrifugal blade is shown in Equation (1). Hence, according to the Euler equations of the fan, it can be derived as Equation (2). Through Equations (1) and (2), it indicates that the change of the flap angle causes the change of the blade setting angle and the maximum total pressure would be higher with the increase of the flap angles, that could be also observed from Figure 6 and Figure 7. Consequently, the part-rotating angle could adjust the fan performance obviously, which is the principle of the flap adjustment. The relationship between the pressure coefficient and flow coefficient in Equation (3) could be calculated by normalized Equation (2) in order to get a direct relationship of different parameters. Equation (4) is obtained after Equation (3), which shows that pressure variation with the changing flow is closely related to the flap angle and width-radius ratio. The width-radius ratio here was almost fixed in this situation when compared with the change of the flap blade angle. Hence, the wide range of change in the flap angle was the key factor to adjust the performance of the CF with FA. In Figure 6 and Figure 7, the performance of the CF with FA changed with the flap angle in different flow rates, which validated the theoretical analysis. Furthermore, according to Equation (4), the slope of the pressure is getting smaller with the increase of flap angles, which presents a phenomenon where the pressure curves are getting flat with the increase of flap angles in the pressure figures. As a result, the smaller setting angle would make the flap adjustment more sensitive which is also presented by both experiment and FE method in Figure 6 and Figure 7:
5.2. Comparative Economic Analysis
The progress about the adjustment in actual engineering applications is represented as Figure 8. The fan, marked as F, works in the pipeline system and the flow-valve is marked as the symbol M, as is shown at the top of Figure 8. The performance curve before the adjustment is marked as and after the adjustment is marked as in Figure 8, so we could obtain the efficiency to represent the economic performance of the fan, as is shown in Equation (5). Additionally, the resistance of M under the opened situation originally was R, and after it was closed, the resistance was R’. As a result, the pipeline-efficiency of the system was defined as Equation (6), which hinted at the increasing level of the system resistance and could well describe the economic performance in the operation of this pipeline system. In the pipeline operation progress, there are three condition points, which are a, b, and c, and the pipeline-efficiency of these three points could be described as Equations (7)–(9):
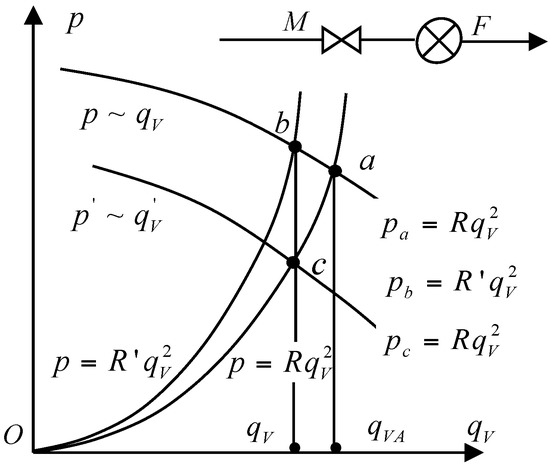
Figure 8.
The adjustment progress of the fan.
in Equation (10) is defined as the system-efficiency, where represents the input-power of the system. Therefore, if the original input-point of the system energy is treated as the shaft of the fan, could also represent the shaft-power of the fan, and shows the effective utilization of the input-energy to the fan system. Therefore, Equations (11)–(13) could be derived from Equation (10):
The adjustment-efficiency in Equation (14) could be defined as the system-efficiency ratio before and after the adjustment. indicates the economic performance of the adjustment and the change of the effective energy utilization after the adjustment. Hence, the previous four parameters representing different efficiency, which are could well describe the economic performance in the fan adjustment:
As is shown in Figure 8, the current operating point was assumed as point a that is also a rated working point, so the effective power could be derived as Equation (15) and the shaft-power of the fan after the adjustment could be derived as Equation (16):
Hence, the system-efficiency curve and adjustment-efficiency curve could be obviously obtained from Equation (17) derived by Equations (15) and (16). Hence, the economic performance of different adjustments could be shown in Figure 9 and Figure 10:
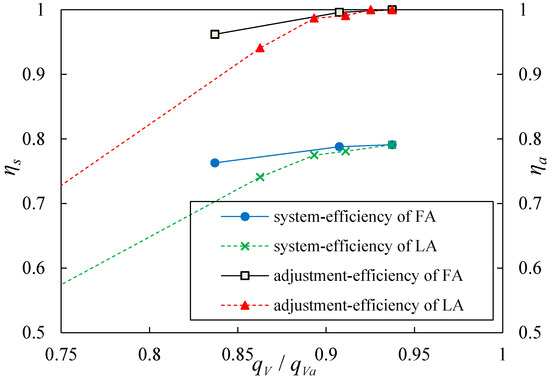
Figure 9.
The economic performance curve of different adjustments based on the experiment.
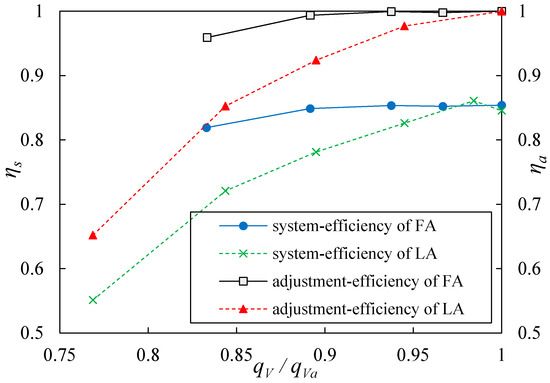
Figure 10.
The economic performance curve of different adjustments based on the FE calculation.
Figure 9 indicates the system-efficiency and adjustment-efficiency curves on the LA and FA experiments. Furthermore, we could obviously observe the trend of the data. The system-efficiency of FA was totally higher than LA. The maximum system-efficiency values of LA and FA was approximate. The ratio of the flow rates in the horizontal axis means the opening extent of the flow-valve in the operation progress. As a result, that means the flow-valve of the fan system is completely opened when the ratio was 1. While the ratio becomes lower, the flow-valve becomes more closed. It was apparent that the two adjustments could make CF work in an efficient situation when the flow-ratio was over 90% and the system-efficiency values of the two adjustments were higher than 78%. When the flow-ratio decreased to 85%, the system-efficiency value of the FA fan was 5% higher than the system-efficiency of LA fan. When the flow-ratio approached 80%, the value error of system-efficiency was 9%. These system-efficiency errors between FA and LA indicated that the CF with FA could obtain a higher energy efficiency than the CF with LA. From the adjustment-efficiency curves about LA and FA, when the flow-ratio was over 90%, both of adjustment-efficiency values about the two adjustments were approximate. When flow-ratio dropped down to 85% and 80%, the adjustment-efficiency errors were 5.3% and 11%, which hinted that the CF with FA after the adjustment could have a more effective energy utilization than the CF with LA.
Figure 10 shows the FE calculation results of the economic performance based on FA and LA. As the FE method could calculate all of the conditions without economic costs, we could obtain more results from FE calculation. Totally, the FE calculation results had the same trend as the experimental results in Figure 9, regardless of whether it was about the system-efficiency or about the adjustment-efficiency and the efficiency errors between FA and LA were more apparent.
Moreover, from the results of the experiment and FE calculation, CF with FA could always obtain a better performance than CF with LA. Due to different CF models in experiment and FE calculation, it could better indicate that FA could be adapted in different CFs, and that FA is actually a more superior adjustment than LA.
As more data could be obtained from FE calculation, assuming the current operating point was the point of maximum efficiency with flow qva, the pipeline characteristic curve in FE calculation could be gained. The fan efficiency in different operating conditions with FA and LA can be obtained under this pipeline characteristic curve, which is shown in Figure 11.
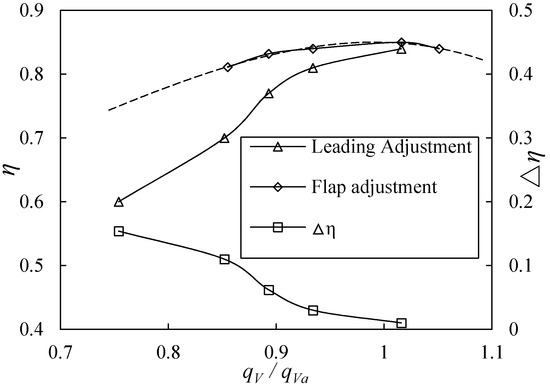
Figure 11.
Efficiency of two adjustment in the same pipe-resistance.
Figure 11 indicates the efficiency of two adjustments in the same pipe-resistance based on the FE calculation results. The efficiency curve of the CF with FA was flatter and the efficiency value declined slowly, while the efficiency of the CF with LA was steeper and its efficiency declined rapidly. When the flow-ratio decreased, the efficiency error between two adjustments increased obviously. When the flow-ratio reduced to 75%, the efficiency error was 15%. Hence, with the decline of the flow-ratio, CF with LA would enter the unstable condition more prematurely than CF with FA, which means that CF with FA could work in a larger range of flow-ratio with a high-efficiency.
5.3. Energy-Saving Rates
Energy-saving rate can be defined as Equation (18). As is widely known, CF with LA could behave with an apparent high-efficiency characteristics, while the CF system works at an off-design condition. Hence, as a more predominant adjustment at the off-design condition, the parameter of energy saving rate could apparently reflect the superiority of CF based on FA when compared with CF based on LA:
Assuming the current condition is the rated condition, the flow rate is qva, and energy-saving rates can be obtained from FE calculation result based on CF with FA and LA, as shown in Table 3:
Table 3.
Energy-saving rates of different flow-ratios. (*: accumulated error.)
Table 3 shows that the saving rates were all positive, which indicated that CF with FA saves more energy than CF with LA. With the increase of the adjustment range, the energy-saving effect was more obvious, e.g., when the flow-ratio was 74%, the energy-saving rate of the CF with FA reached 20.4% when compared to CF with LA. When considering the large amount energy consumption of the CF in the power plant and the power of the CF with LA is , assuming that the power plant has three operating units and that every unit has six CFs with LA, when the off-design operation time is 20% of the total operation time, when compared with LA, the saved energy amount for one year about 365 days of CF with FA could be calculated as Equation (19), which is a large value and should be taken into consideration to gain a reduction of energy consumption.
6. Conclusions and Outlook
This paper presented a new adjustment in the CF operation at the off-design condition that is FA. Theoretical, experimental, and FE methods were carried out in order to investigate the CF performance with FA and LA comparatively. Above all, the advantages of the FA were fully embodied. Thus, the economic performance of CF with FA in variable conditions was very clear, which confirmed that the CF with FA is feasible.
A methodology was also described to evaluate the economic characteristic of the CF, which includes total pressure, efficiency, pipeline-efficiency, system-efficiency, adjustment-efficiency, and energy saving rate. CF with FA could obtain higher maximum total pressure with the increase of the flap angle, while the efficiency of CF with FA could present a higher value when compared with both LA and the original impeller. In particular, with the more change to the flow-ratio at different off-design conditions, the system-efficiency, adjustment-efficiency and the energy saving rate of CF with FA were apparently higher than with LA. Hence, FA was a more predominant adjustment than LA in the progress of the CF operation. Finally, CF with FA obtained an obvious energy-saving performance and an efficient operation in a wide flow range and the saved energy amount of the CF with FA was considerable and meaningful, especially for some large units.
As a future step, detailed information about the internal flow should be described from the FE calculation, therefore, the reasons about the superiority of CF with FA could be further investigated. Moreover, how to implement the mechanical structure of the FA in the progress of the CF operation when it comes to the off-design conditions should be considered significantly.
Author Contributions
Genglin Chen conceived the study and designed the experiments; Jinyun Zhao and Haipeng Zhang performed the experiments and the simulation; Wei Xu and Genglin Chen analyzed the data; Wei Xu wrote the paper. Gengling Chen audited and modified the article.
Conflicts of Interest
The authors declare no conflict of interest.
Nomenclature
| The flap angle [°] | |
| Blade outlet setting angle [°] | |
| Blade outlet original setting angle [°] | |
| Theoretical total pressure [Pa] | |
| Density [kg/m3] | |
| Impeller blade outlet circumferential speed [m/s] | |
| The theoretical flow rate [m3/s] | |
| The diameter of the blade outlet [m] | |
| The width of the blade outlet [m] | |
| Pressure coefficient, | |
| Flow coefficient, | |
| The ratio of the impeller width and diameter | |
| The actual total pressure [Pa] | |
| The actual efficiency | |
| The actual flow rate [m3/s] | |
| The flow rate on designed condition [m3/s] | |
| Energy-saving rate | |
| The power of fan with leading adjustment [kW] | |
| The power of fan with flap adjustment [kW] | |
| Condition number, i = 1, 2, 3, 4, 5 | |
| Saved energy amount [kWh] |
References
- Zhang, L.; Wang, S.L.; Hu, C.X.; Zhang, Q. Multi-objective optimization design and experimental investigation of centrifugal fan performance. Chin. J. Mech. Eng. 2013, 26, 1267–1276. [Google Scholar] [CrossRef]
- Setoguchi, T.; Santhakumar, S.; Takao, M.; Kim, T.H.; Kaneko, K. Effect of guide vane shape on the performance of a Wells turbine. Renew. Energy 2001, 23, 1–15. [Google Scholar] [CrossRef]
- Bhope, D.V.; Padole, P.M. Experimental and theoretical analysis of stresses, noise and flow in centrifugal fan impeller. Mech. Mach. Theory 2004, 39, 1257–1271. [Google Scholar] [CrossRef]
- Setoguchi, T.; Santhakumar, S.; Takao, M.; Kim, T.H.; Kaneko, K. Amodified wells turbine for wave energy conversion. Renew. Energy 2003, 28, 79–91. [Google Scholar] [CrossRef]
- Fernando, J.T.E.F.; Fong, J.A.C.; De Almeida, A.T. Ecoanalysis of variable-speed drives for flow regulation in pumping systems. IEEE Trans. Ind. Electron. 2011, 58, 2117–2125. [Google Scholar]
- Yi, C.S.; Yun, J.H.; Jeong, I.G.; Suh, J.S.; Song, C.K. Predicting the oil cooler fan performance of large-sized diesel engines by changing the outlet and torsion angles. J. Mech. Sci. Technol. 2013, 27, 469–475. [Google Scholar] [CrossRef]
- Munisamy, K.M.; Govindasamy, R.; Thangaraju, S.K. Experimental investigation on design enhancement of axial fan using fixed guide vane. Mater. Sci. Eng. 2015, 88, 012026. [Google Scholar] [CrossRef]
- Khajanawaz, S.; Rao, K.N.; Sitaramaraju, A.V. Experimental investigation on energy saving in centrifugal fans using different inlet guide vanes. Int. J. Innov. Res. Sci. Eng. Technol. 2013, 2, 2319–8753. [Google Scholar]
- Fukutomi, J.; Nakase, Y.; Ichimiya, M.; Shinohara, Z. A study of performance improvement of cross-flow fan by inlet guide vanes. Trans. Jpn. Soc. Mech. Eng. 1998, 64, 442–446. [Google Scholar] [CrossRef]
- Szu, H.L.; Rong, F.H.; Chuang, A.L. Computational and experimental investigations of performance curve of an axial fan using downstream flow resistance method. Exp. Therm. Fluid Sci. 2010, 33, 827–837. [Google Scholar]
- Li, J.C.; Lin, F.; Nie, C.Q.; Chen, J.Y. Automatic efficiency optimization of an axial compressor with adjustable inlet guide vanes. J. Therm. Sci. 2012, 21, 120–126. [Google Scholar] [CrossRef]
- Fukutomi, J.; Nakamura, R. Performance and internal flow of cross-flow fan with inlet guide vane. JSME Int. J. Ser. B Fluids Therm. Eng. 2005, 48, 763–769. [Google Scholar] [CrossRef]
- Tan, L.; Zhu, B.S.; Cao, S.L.; Wang, Y.C.; Wang, B.B. Influence of prewhirl regulation by inlet guide vanes on cavitation performance of a centrifugal pump. Energies 2014, 7, 1050–1065. [Google Scholar] [CrossRef]
- Xu, W.; Chen, G.L.; Zhao, J.Y. Study on characteristics of centrifugal fan controlled by leading device. Min. Mach. 2015, 127, 28–31. (In Chinese) [Google Scholar]
- Launder, B.E.; Spalding, D.B. The numerical computation of turbulent flows. Comput. Methods Appl. Mech. Eng. 1973, 3, 269–289. [Google Scholar] [CrossRef]
- Rai, M.M. Navier–Stokes simulation of rotor/stator interaction using patched and overlaid grids. J. Propuls. Power 1987, 3, 387–396. [Google Scholar] [CrossRef]
- Yan, X.K.; Wang, L.J.; Zhang, J.S.; Wang, X.Y. Numerical and experimental investigation on effect of installation angle of rotor blade on axial flow fan. In Proceedings of the 2nd International Conference on Mechanical and Electrical Technology (ICMET), Singapore, 10–12 September 2010; pp. 359–363. [Google Scholar]
- Arndt, N.; Acosta, A.J.; Brennen, C.E.; Caughey, T.K. Experimental investigation of rotor-stator interaction in a centrifugal pump with several vaned diffusers. J. Turbomach. 1990, 112, 98–108. [Google Scholar] [CrossRef]
- Oro, J.M.F.; Diaz, K.M.A.; Morros, C.S. Unsteady flow and wake transport in a low-speed axial fan with inlet guide vanes. J. Fluids Eng. 2013, 129, 1015–1029. [Google Scholar]
- Kim, J.H.; Choi, J.H.; Husain, A.; Kim, K.Y. Performance enhancement of axial fan blade through multi-objective optimization techniques. J. Mech. Sci. Technol. 2010, 24, 2059–2066. [Google Scholar] [CrossRef]
- Babayigit, O.; Kocaaslan, O.; Aksoy, M.H.; Guleren, K.M.; Ozgoren, M. Numerical identification of blade exit angle effect on the performance for a multistage centrifugal pump impeller. EPJ Web Conf. 2015, 92, 02003. [Google Scholar] [CrossRef]
- Wang, S.L.; Zhang, L.; Wu, Z.R. Optimization research of centrifugal fan with different blade number and outlet blade angle. In Proceedings of the Power and Energy Engineering Conference (APPEEC 2009), Wuhan, China, 27–31 March 2009; pp. 2985–2988. [Google Scholar]
- Liu, Y.B.; Tan, L.; Liu, M.; Hao, Y.; Xu, Y. Influence of prewhirl angle and axial distance on energy performance and pressure fluctuation for a centrifugal pump with inlet guide vanes. Energies 2017, 10, 695. [Google Scholar]
- Zhu, X.C.; Lin, W.L.; Du, Z.H. Experimental and numerical investigation on the flow field in the tip region of an axial ventilation fan. J. Fluids Eng. 2005, 127, 299–307. [Google Scholar] [CrossRef]
- Meyer, C.J.; Kröger, D.G. Numerical simulation of the flow field in the vicinity of an axial flow fan. Int. J. Numer. Methods Fluids 2001, 36, 947–969. [Google Scholar] [CrossRef]
- Yao, Q.; Xu, D.; Pan, L.S.; Teo, A.L.; Melissa, H.W.M.; Lee, V.S.P.; Shabbir, M. CFD simulation of flows in valveless micropumps. Eng. Appl. Comput. Fluid Mech. 2007, 1, 181–188. [Google Scholar] [CrossRef]
- Younsia, M.; Djerradab, A.; Belamric, T.; Menterd, F. Application of the SAS turbulence model to predict the unsteady flow field behaviour in a forward centrifugal fan. Int. J. Comput. Fluid Dyn. 2008, 22, 639–648. [Google Scholar] [CrossRef]
- Sun, Y. The Fans. In The Sampling Book of Fans; China Machine Press: Beijing, China, 2003; pp. 377–388. ISBN 7-111-10573-7. (In Chinese) [Google Scholar]
© 2018 by the authors. Licensee MDPI, Basel, Switzerland. This article is an open access article distributed under the terms and conditions of the Creative Commons Attribution (CC BY) license (http://creativecommons.org/licenses/by/4.0/).