Article

Effectiveness Analysis and Temperature Effect Mechanism on Chemical and Electrical-Based Transformer Insulation Diagnostic Parameters Obtained from PDC Data

1
Guangxi Key Laboratory of Power System Optimization and Energy Technology, Guangxi University, Nanning 530004, Guangxi, China
2
State Grid Henan Electric Power Research Institute, Zhengzhou 450052, Henan, China
3
Shijiazhuang Power Supply Branch of State Grid Electric Power Company, Shijiazhuang 050000, Hebei, China
4
National Demonstration Center for Experimental Electrical Engineering Education, Guangxi University, Nanning 530004, Guangxi, China
*
Authors to whom correspondence should be addressed.
These authors contributed equally to this work.
Energies 2018, 11(1), 146; https://doi.org/10.3390/en11010146
Submission received: 8 December 2017 / Revised: 26 December 2017 / Accepted: 31 December 2017 / Published: 8 January 2018
(This article belongs to the Section F: Electrical Engineering)

Abstract

:
The dielectric monitoring/diagnostic tool, such as Polarization and Depolarization Current (PDC) measurement, is now being widely applied to obtain the status of deteriorated transformers around the world. Nowadays, several works have reported that the chemical and electrical-based transformer insulation diagnostic parameters (absorption ratio, polarization index, paper conductivity, oil conductivity, insulation resistance, etc.) can be easily calculated from the PDC data. It is a fact that before using these parameters to obtain the status of deteriorated transformers, the power engineers should prudently investigate the effectiveness of these parameters. However, there are few papers that investigate the important issue. In addition, the understanding of temperature effect mechanism on these parameters should also be prudently studied. In the present work, we firstly prepare several oil-impregnated pressboard specimens with various insulation statuses by using a sequence of thermal ageing and moisture absorption experiments launched in the laboratory, and then the PDC measurement is performed to obtain the chemical and electrical-based transformer insulation diagnostic parameters. Finally, we systematically interpret the effectiveness and temperature effect mechanism on these chemical and electrical-based transformer insulation diagnostic parameters.

1. Introduction

Power transformers, generally speaking, can be regarded as a ‘heart’ in electric power transmission and transformation area around the world [1]. It is believed that many of installed transformers are close to the end-stage of their design life [2]. In current economic condition, replacing them with new transformers (only attributed to their ageing/degradation) are unreasonable due to some of these may be still in a healthy status [3,4,5]. In addition, the unexpected power outage due to the ageing/degradation of transformer insulation can lead to huge financial loss to the utility all over the world, such as hospital, transportation, and factory, etc. [6]. Therefore, in order to extend the service life of transformers to the maximum extent, it would be interesting for power utilities to know the insulation condition in oil-filled transformers. Presently, many early papers have widely reported that the life of the cellulosic insulation materials can determine the remaining life of a transformer [7,8]. Hence, it is of great significance for power utilities, by virtue of suitable diagnostic techniques, to reliably and timely obtain the status of transformer cellulose insulation. Historically, the dissolved gas analysis (DGA) [9] and the chemical and electrical-based transformer insulation diagnostic parameters such as oil conductivity (OC), paper conductivity (PC), insulation resistance (IR), polarization index (P.I.), and absorption ratio (AR) have been generally utilised for status diagnosis of transformer insulation [2,10,11]. Unfortunately, obtaining these condition monitoring/diagnosis parameters, in practice, may cost lots of manpower and time consumption, and therefore it is becoming a hot research issue about how to effectively solve this technological problem. Over last several decades, the increasing requirements to nondestructively and reliably acquire the insulation status in transformers using advanced tools have immensely promoted the development of dielectric response diagnostic techniques, such as Return Voltage Measurement (RVM) [12,13], Polarization and Depolarization Current (PDC) [14,15,16], and Frequency Domain Spectroscopy (FDS) [17,18,19]. Among these dielectric response diagnosis tools, the PDC technique is gaining exceptional significance to the utility professionals due to that it can provide sufficient insulation information about the ageing degree and water content level on transformer insulation system.
So far, several works have reported that the chemical and electrical-based transformer insulation diagnostic parameters (absorption ratio, polarization index, paper conductivity, oil conductivity, insulation resistance, etc.) can be obtained from the PDC data [5,11,16,20,21]. This is a great contribution for reducing the manpower and time cost. However, it is a fact that before using these parameters to obtain the status of deteriorated transformers, the power engineers should prudently investigate the effectiveness of these parameters. Unfortunately, there are few works that investigated this issue. In addition, the temperature is an important factor, which should be taken into consideration due to the fact that PDC data are severely temperature dependent [5,14]. It is believed that the mean annual temperature could be as high as 40 °C (even higher in some countries) with only few winter weeks in hot countries. While, in the cold countries, the mean annual temperature could be as low as 0 °C (even lower in some countries) [5]. These extreme temperatures can result in a mass process of migration, distribution, and equilibrium of moisture/conductive pollutant between dielectric oil and cellulose paper/pressboard [5,15], and these behaviors, therefore, can affect these parameters. Furthermore, the temperature effect mechanism is rather complicated. Thus, it is necessary to systematically study the temperature effect mechanism on chemical and electrical-based transformer insulation diagnostic parameters.
This paper reports the understanding and interpretation of the effectiveness and temperature effect mechanism on chemical and electrical-based transformer insulation diagnostic parameters that were obtained from PDC data. In the present work, we firstly prepare several oil-impregnated pressboards with various insulation statuses using a series of thermal ageing and moisture absorption experiments launched in laboratory conditions, and then perform the PDC measurement to obtain the chemical and electrical transformer insulation diagnostic parameters. Finally, the effectiveness and temperature effect mechanism on chemical and electrical-based transformer insulation diagnostic parameters are systematically studied.

2. Experimental Specimens and PDC Measurement Platform [4,11]

The cellulose pressboard disc specimens, which are shown in Figure 1, are provided by Chongqing Aea Group Transformer Co., Ltd. (Chongqing, China). The thickness and diameter of these pressboard disc specimens are 2 mm and 160 mm, respectively.
The transformer oil used in our experiments is the Karamay No. 25 naphthenic mineral oil, which is provided by Chongqing Chuanrun Petroleum Chemical Co., Ltd. (Chongqing, China). These mineral oil specimens can satisfy the standard of ASTM D3487-2000(II).

2.1. Preparation of Experimental Specimens

To acquire the oil-impregnated pressboard specimens with various insulation statuses, a vacuum chamber is firstly used for drying the new cellulose pressboard specimens, which is shown in Figure 2, at 105 °C/50 Pa for 48 h. In drying process, the weights of pressboard specimen are strictly monitored using a high precision electronic balance for determining whether these pressboard specimens can satisfy the experiment requirement or not. Secondly, the dried and degassed insulation oil is heated to 40 °C/50 Pa. After that, a sealed vacuum chamber is used for the oil impregnation activities of these dried pressboard specimens for 48 h at 40 °C/50 Pa. Then, several oil-impregnated pressboard specimens are randomly sampled to obtain the moisture level by using the known Coulometric Karl Fischer Titration techniques in terms of IEC 60814 and the initial moisture content of unaged pressboard specimens is equal to 1.11%. Finally, the experimental pressboard specimens are acquired with four insulation statuses (ageing 0 day and water content 4.02%, ageing 8 days and water content 2.82%, ageing 21 days and water content 3.71%, ageing 42 days and water content 1.17%). Moreover, the degree of polymerization (DP) of cellulose pressboard specimen is measured according to IEC 60450 for representing the degradation status of new and degraded cellulose pressboard specimens.

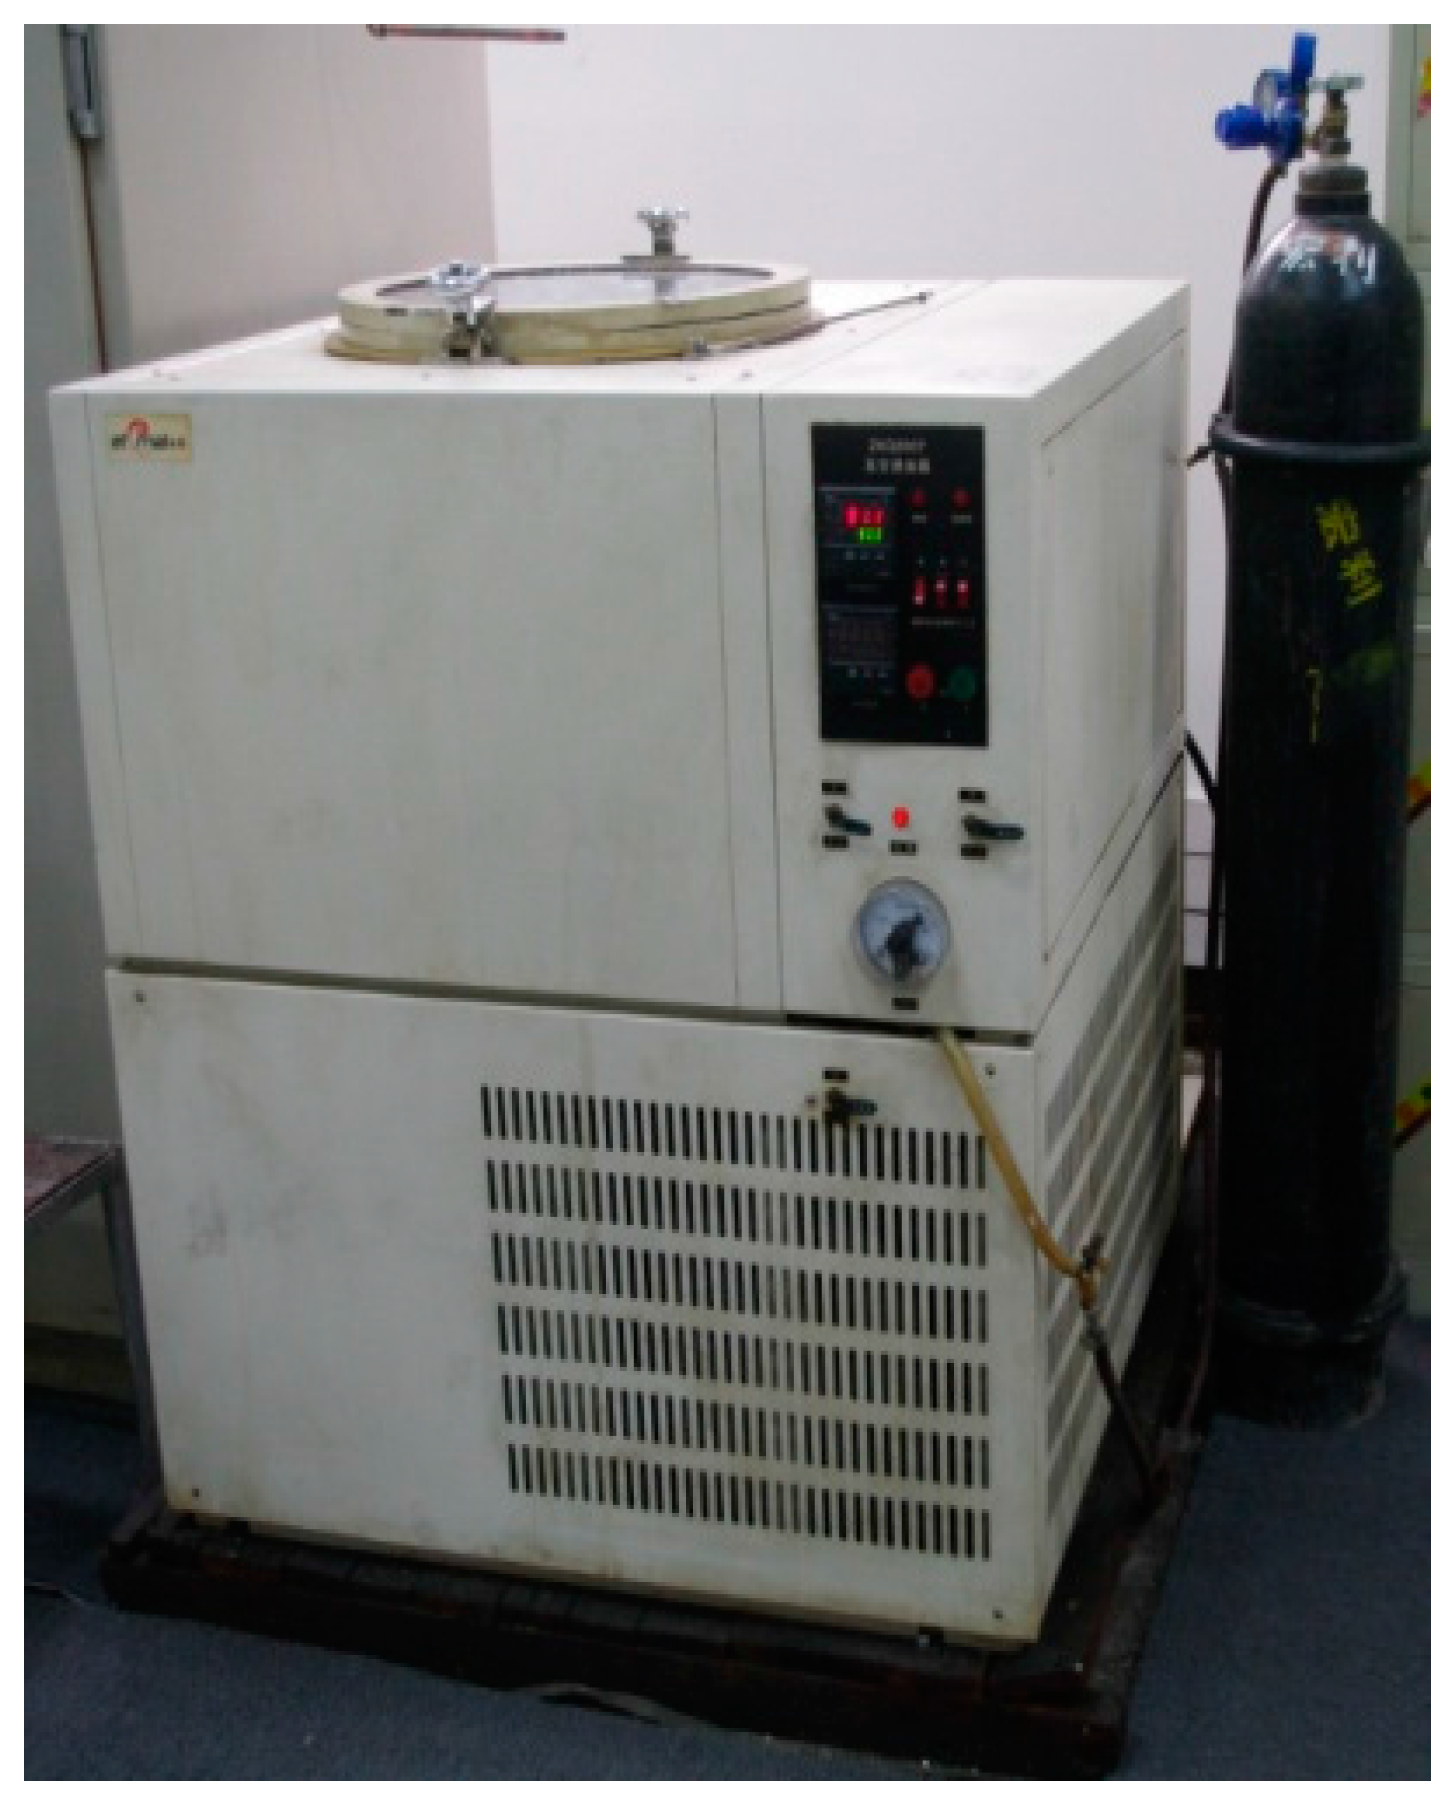
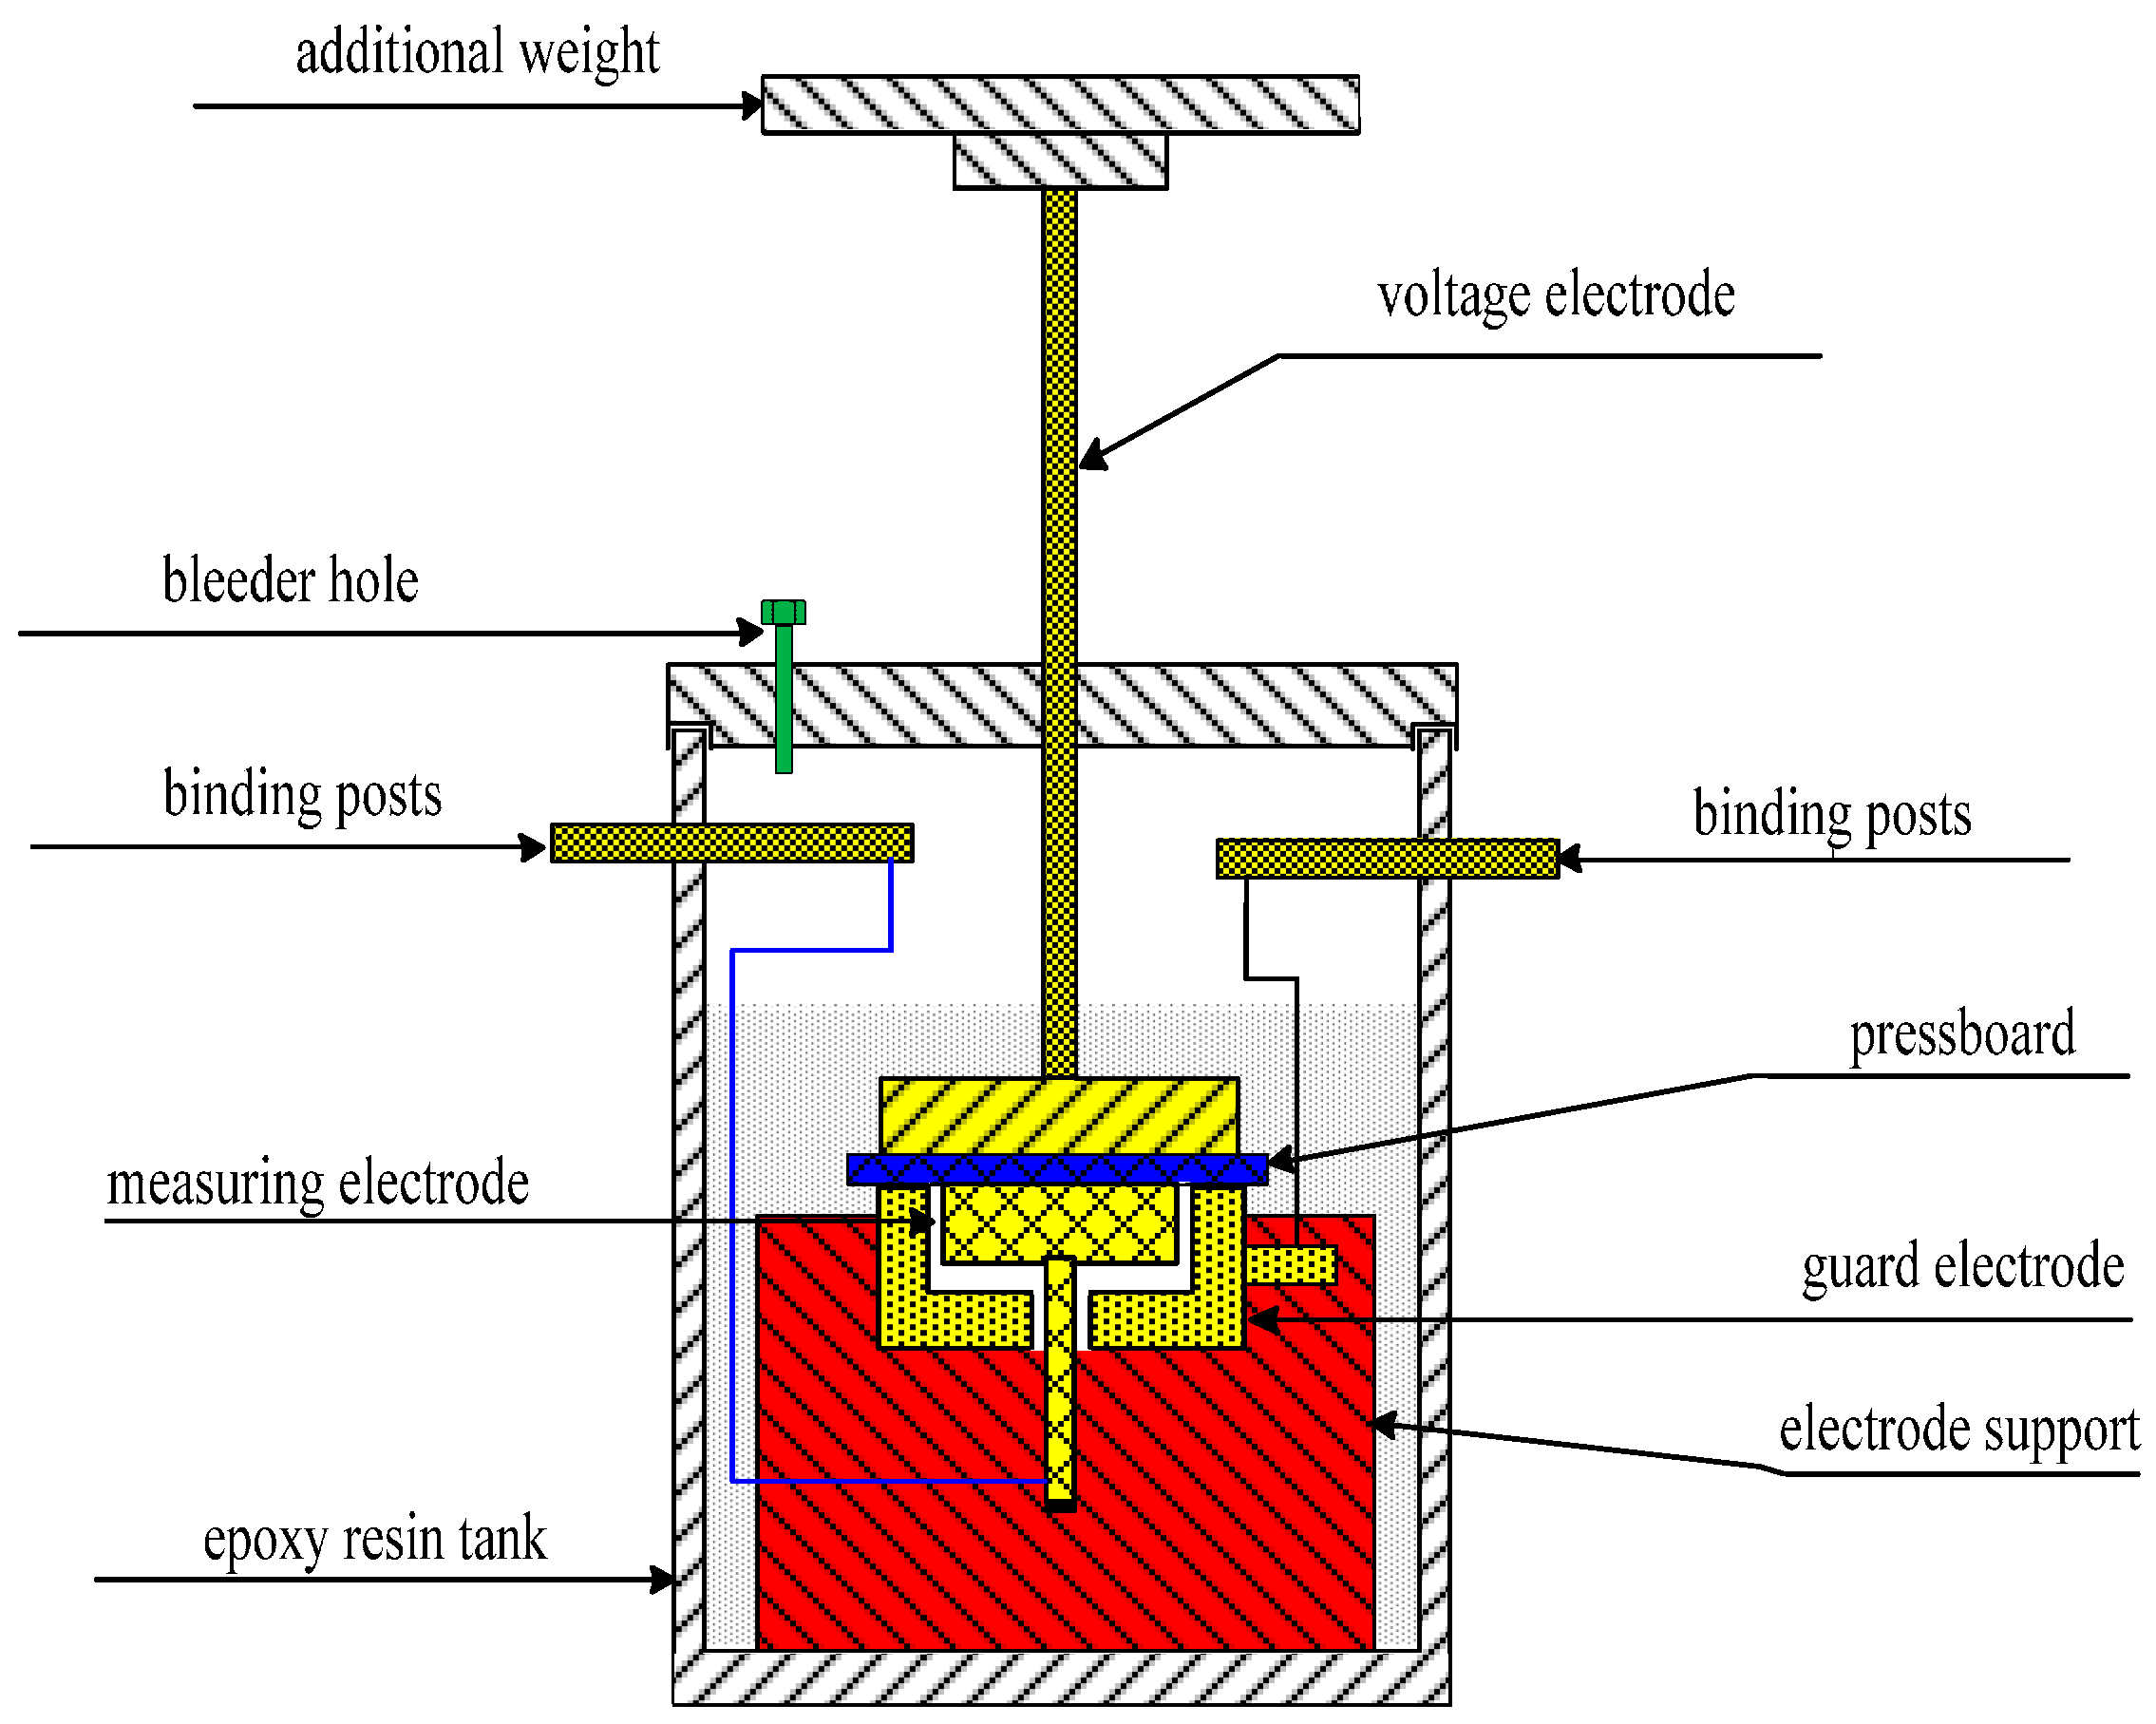
2.2. PDC Measurement Platform (Three Electrode Test Cell and DIRANA Using the PDC Measurement)

A sealed three electrode test cell embedded in transformer oil is shown in Figure 3. These experimental cellulose pressboard specimens are placed in the sealed three electrode test cell. This instrument includes a voltage electrode, a measuring electrode, and a guard electrode. The voltage electrode disc and measuring electrode disc adopt the cylinder structure with the diameters of 141 mm and 113 mm, respectively. The voltage electrode disc is connected to an additional weight (a copper plate) to ensure the close contact between cellulose pressboard specimen and the electrodes. In addition, to ensure the good repeatability in each test, the air bubbles between the electrode and the pressboard are removed using the specialized bleeder hole. The PDC measurements on oil-impregnated pressboard specimens are measured by DIRANA (Chinese version, OMICRON, Electronics GmbH, Klaus, Austria), which is shown in Figure 4.

3. Measurement Results of Polarization and Depolarization Current (PDC)

3.1. Polarization Current

It is a fact that the insulation temperature in transformer tank gradually decreases after de-energizing the transformer, and the PDC measurement is usually performed during the process of decreasing insulation temperature. Therefore, in order to stimulate this general process, we launch the PDC measurement under a condition of decreasing insulation temperature. The measurement results of polarization current on experimental pressboard specimens with four insulation statuses, at four different insulation temperatures (90, 75, 60, and 45 °C), are provided in Figure 5, in a log-log scale. It can be seen that the magnitudes of polarization current decrease with decreasing insulation temperature. Moreover, the ‘inflection point’ of polarization currents will occur with an insulation temperature decrease. Similar results are observed in the literatures [21,22]. This inflection point phenomenon seems to be related to the relaxation time constant with temperature dependant. It is interesting to note that the inflection point of polarization currents will migrate from smaller measurement time point to larger measurement time point with insulation temperature decrease.
The authors believe that the variation of polarization current curves at any insulation temperature, as shown in Figure 5, depends on two elements. The first element is the conduction current. A lower insulation temperature gives rise to a lower conduction current value due to the weak mobility of charge carrier in cellulose pressboard specimen. The decreasing conduction current contributes to decreasing the polarization current. The second element is the polarization behavior inside cellulose pressboard specimen. The decreasing insulation temperature can weaken polarization behavior, and then give rise to the decrease of relaxation current. In [4], it is reported that the PDC results mainly reflect the Maxwell-Wagner effect inside the cellulose pressboard specimen when the response duration is 5000 s and above. The polarization duration in our PDC measurement is exactly set to 5000 s, therefore we believe that the polarization behavior, as shown in Figure 5, is mainly attributed to the Maxwell-Wagner effect inside the cellulose pressboard specimen. Finally, we observed the phenomenon that the decreasing insulation temperature can result in the decrease of polarization currents.

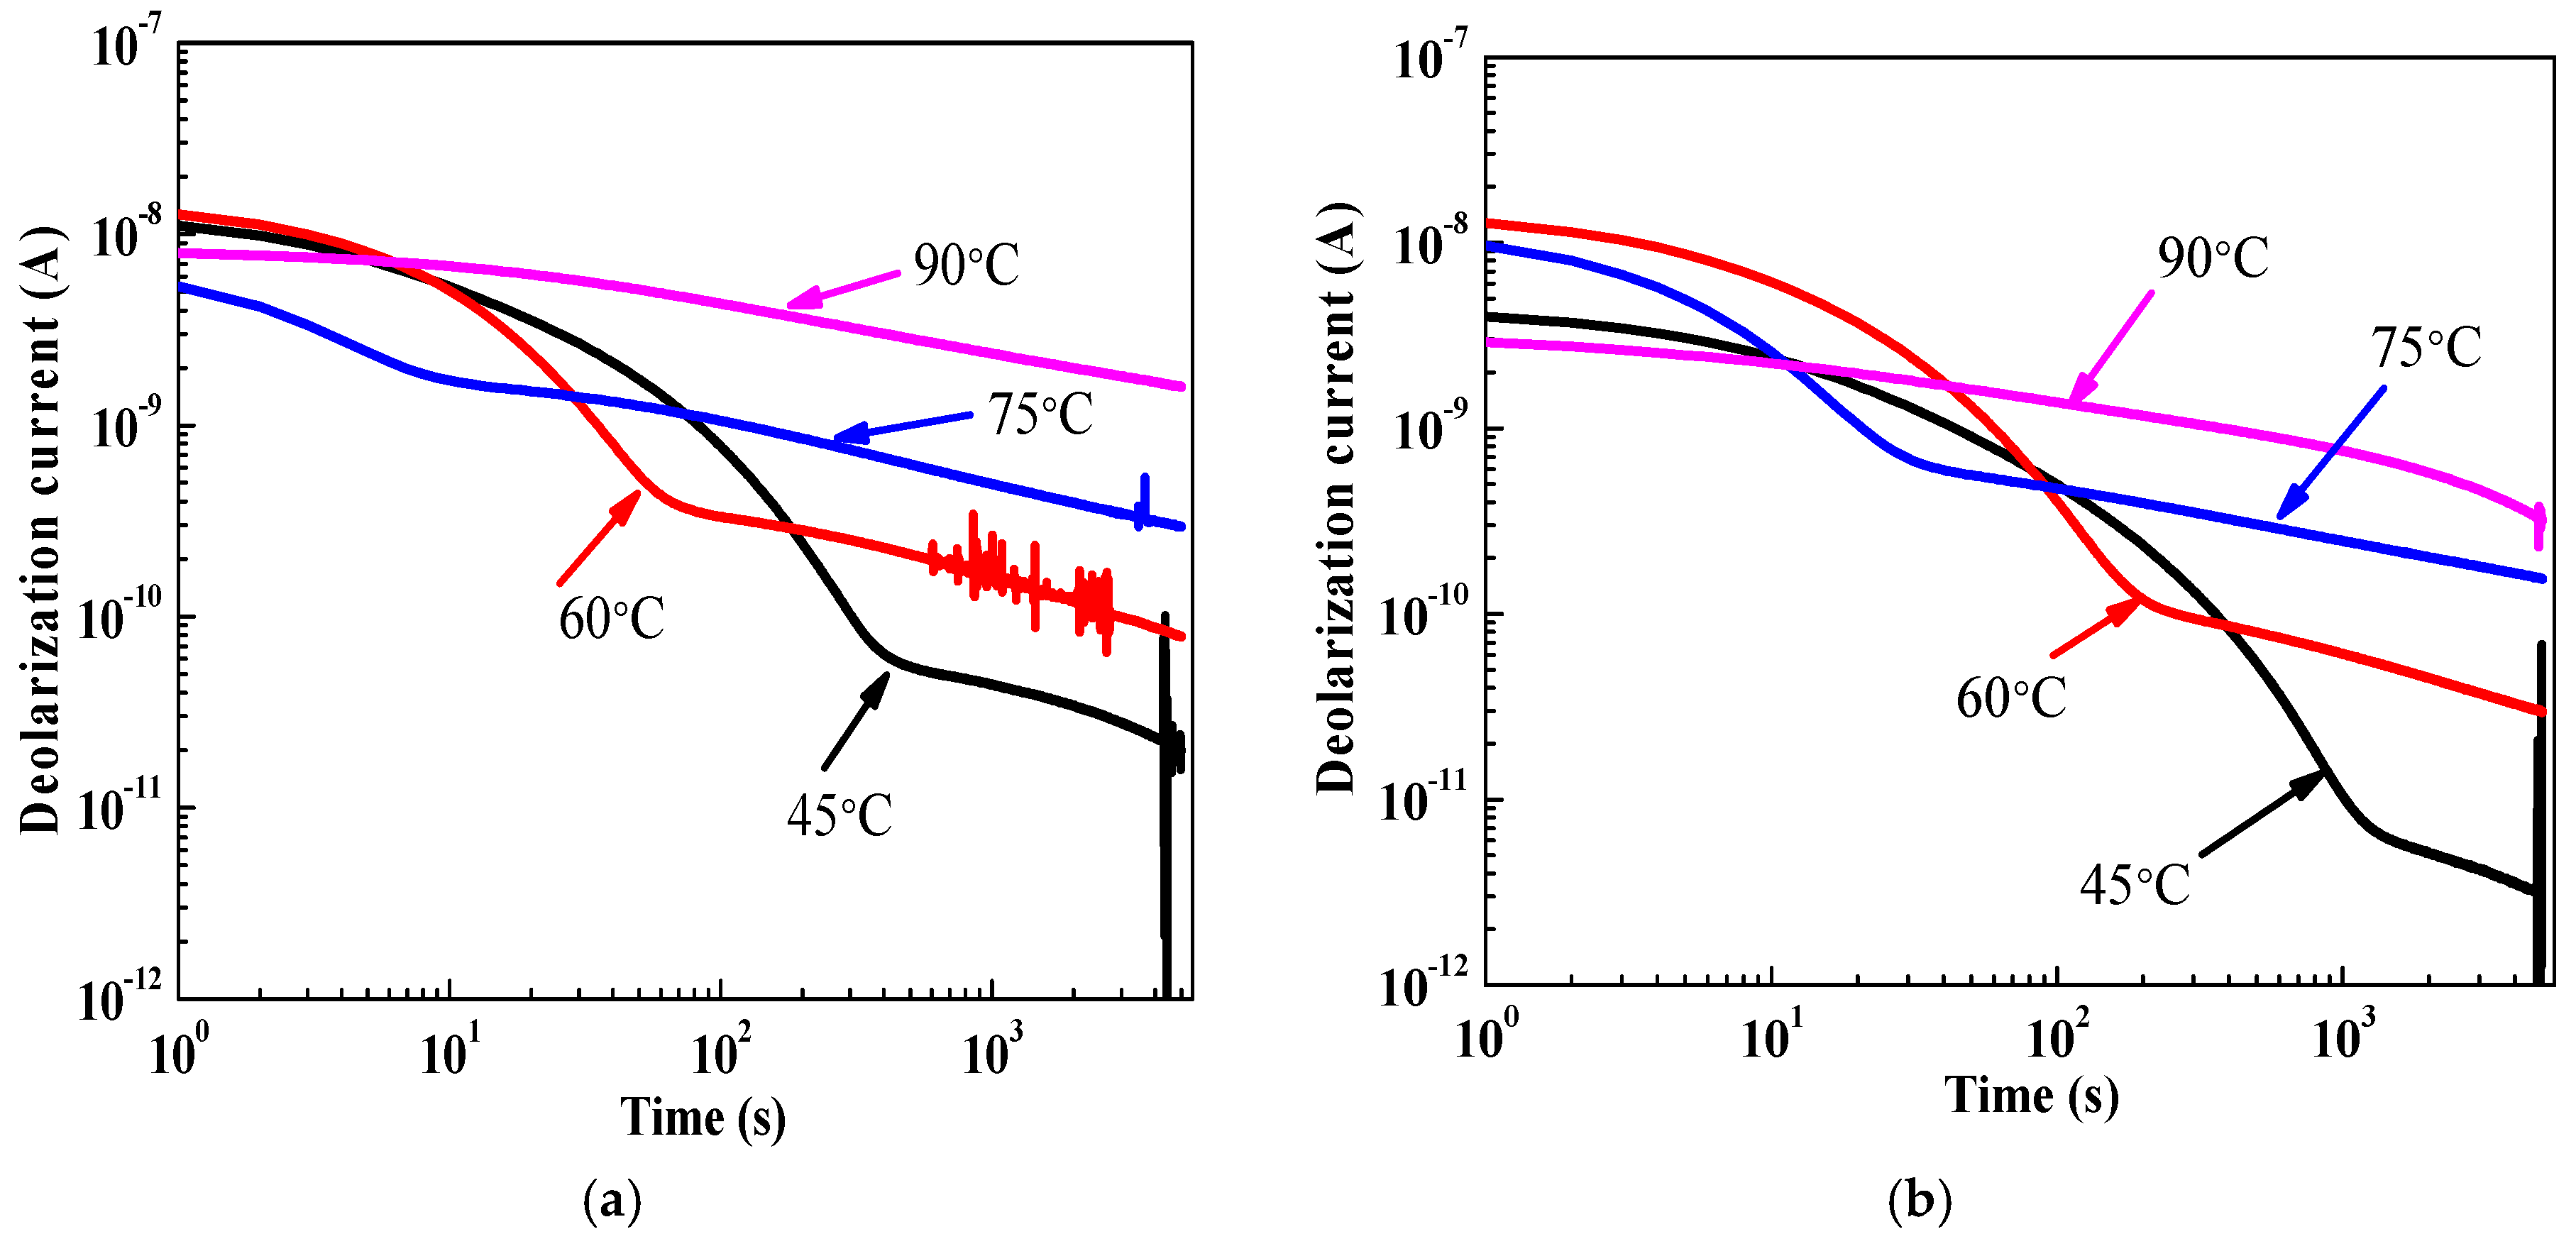
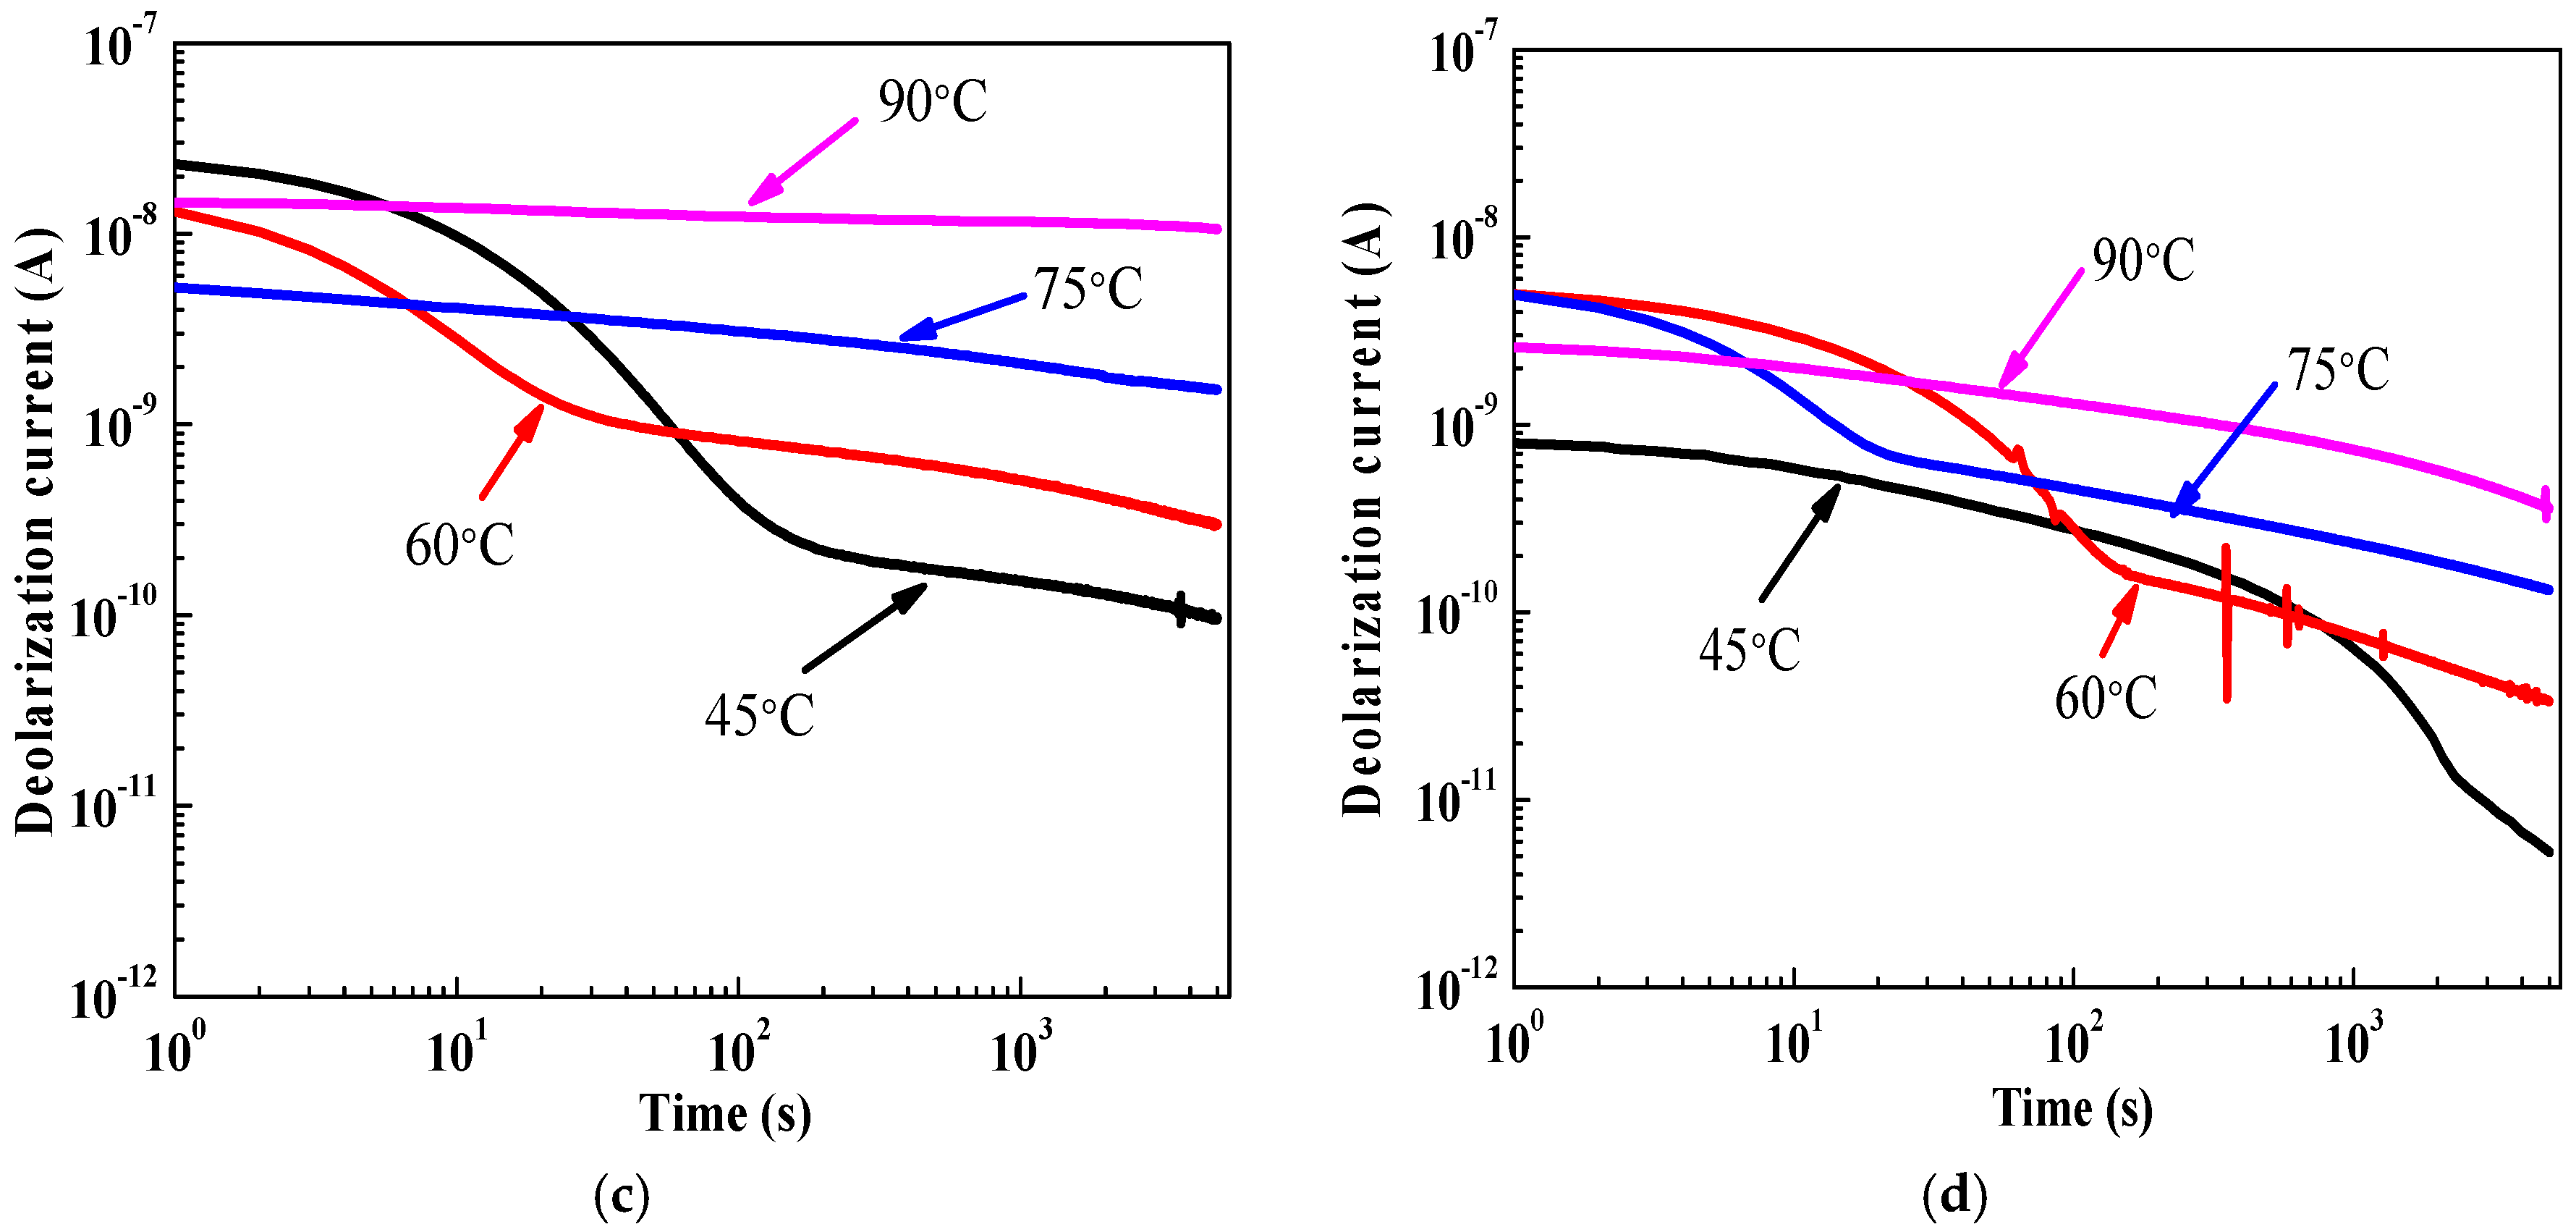
3.2. Deolarization Current

The measurement results of depolarization current on experimental pressboard specimens with four typical insulation statuses, at four different insulation temperatures (90, 75, 60, and 45 °C), are presented in Figure 6, in a log-log scale. It is also observed that the depolarization current magnitudes decrease with decreasing insulation temperature. In addition, the more obvious ‘inflection point’ of depolarization current is found to migrate from a smaller measurement time point to larger measurement time point with insulation temperature decrease. In addition, the conclusion that the inflection point phenomenon seems to be related to the relaxation time constant with temperature dependant is more prominent. It should be noted that we observed the noise current of some depolarization currents shown in Figure 6a (45, 60 and 75 °C), Figure 6b (45 and 90 °C), Figure 6c (45 °C), and Figure 6d (60 and 90 °C). Similar results are also reported in the paper [4,11,23]. This phenomenon might be ascribed to the fluctuation of the weak electric field presented in our laboratory, which induces a current in measurement system cables. Therefore, when performing the PDC measurement, we suggest the researchers to take effective measures to reduce the noise current.
Due to the fact that the DC voltage is removed from the oil-impregnated pressboard, for the depolarization current results, as shown in Figure 6, it is believed that the variation of depolarization current curves under any insulation temperature only depends on the relaxation current. The decreasing insulation temperature can weaken depolarization behavior, and then give rise to the decrease of relaxation current. Finally, we observed the phenomenon that the decreasing insulation temperature can also result in the decrease of depolarization currents.

4. Chemical and Electrical-Based Transformer Insulation Diagnostic Parameters Obtained from PDC Data

The transformer main insulation system, as a typical composite insulation, consists of a series of barriers, oil duct, and spacer, which is shown in Figure 7. Generally, in order to calculate the chemical and electrical-based transformer insulation diagnostic parameters (absorption ratio, polarization index, paper conductivity, oil conductivity, insulation resistance, etc.), the XY model [17,18,24,25], as shown in Figure 8, is introduced to indirectly obtain the oil and paper conductivity separately. While the polarization index, absorption ratio, and insulation resistance can be directly calculated from PDC data. It should be noted that the oil conductivity is not the focus of this contribution, while we pay more attention to the paper conductivity due to the fact that the status of paper insulation can determine the service duration of the whole transformer insulation. Therefore, we do not deduce the computational formula of oil conductivity. In the XY model, the X represents the ratio value of barriers to oil and the Y represents the ratio value of spacers to insulation oil, which can be, respectively, written as
X = radial   effective   thickness   of   total   barriers radial   thickness   of   the   duct
Y = total   effective   width   of   the   spacers   along   periphery   of   the   duct periphery   of   the   duct
The ranges of X and Y are typically 0.2–0.5 and 0.1–0.3, respectively, in a typical transformer insulation system [22]. It should be noted that the X value, in this work, is almost equal to 1, and the Y value is equal to 0 due to the test object is the only oil-impregnated pressboard specimens. In this section, we deduce the calculation formula of chemical and electrical-based transformer insulation diagnostic parameters.
(a) Paper conductivity (σpaper)
① Method one of formula derivation [20,22]
Assuming that the insulation medium is charged for a sufficiently long time, and the final polarization current became the conduction current, which can be expressed as
i d c C 0 U 0 σ r ε 0
where the C0 represents the geometric capacitance, U0 represents the step voltage applied to the insulation, ε0 is the vacuum permittivity (ε0 = 8.852 × 10⁻¹² F/m), and the σr is the dc conductivity of the dielectric medium.
As for the insulation arrangement presented in Figure 7 and Figure 8 (as for a actual transformer insulation system, the spacers can be neglected due to the small ratio of spacers to insulation oil, that is to say, the Y value is equal to 0), the composite conductivity (σr) involved in oil conductivity (σoil) together with paper conductivity (σpaper) can be written as
σ r σ p a p e r σ o i l σ p a p e r ( 1 X ) + σ o i l X
When σoil >> σpaper, the (4) can be written as
σ r σ p a p e r X
According to (3)–(5), the paper/pressboard conductivity can be written as
σ p a p e r ε 0 X C 0 U 0 i d c
In this work, as for the (6), due to the test object is the oil-impregnated pressboard, and the X value can be regarded to be equal to 1, therefore, the conduction current idc can be written as idc = ip(tm) − id(tm). Therefore, the σpaper can be finally expressed as
σ p a p e r ε 0 C 0 U 0 [ i p ( t m ) i d ( t m ) ]
where the ip(tm) is the polarization current at the end of measure time, while the id(tm) is the depolarization current at the end of measure time.
② Method two of formula derivation [5,20]
The polarization current ip(t) applied to the insulation medium can be expressed as
i p ( t ) = C 0 U 0 [ σ 0 ε 0 + ε δ ( t ) + f ( t ) ]
In terms of principle of superposition, the sudden decrease of the voltage U0 to zero is regarded as a negative voltage step at time t = tc. Ignoring the second term in (8) due to the extreme transience of impulse current, the polarization current id(t) can be written as
i d ( t ) = C 0 U 0 [ f ( t ) f ( t + t c ) ]
If the insulation medium is charged for a sufficient duration, that is to say, so that f(t + tc) ≈ 0, and the (9) can be written as
i d ( t ) C 0 U 0 f ( t )
According to (8)–(10), the paper conductivity can be finally written as
σ p a p e r ε 0 C 0 U 0 [ i p ( t m ) i d ( t m ) ]
(b) Insulation resistance (R60s)
The insulation resistance at 60 s (R60s) is the insulation resistance when the insulation medium is charged with a step voltage U0 for the duration 60 s, which can be depicted as
R 60 s = U 0 i p ( 60 s )
(c) Absorption ratio (AR)
Absorption (AR) is the ratio of the insulation resistance at 60 s to 15 s, which can be expressed as
K = R 60 s R 15 s = i p ( 15 s ) i p ( 60 s )
(d) Polarization index (P.I.)
Polarization index (P.I.) is the ratio of the insulation resistance at 600 s to 60 s, which can be depicted as
P . I . = R 600 s R 60 s = i p ( 60 s ) i p ( 600 s )

5. Temperature Effect Mechanism Together with Effectiveness Analysis on Chemical and Electrical-Based Transformer Insulation Diagnostic Parameters

(a) Paper conductivity (σpaper)
Figure 9 presents the calculation results of paper conductivity (σpaper), it can be found that the paper conductivity obviously decreases with absolute temperate decrease. This indicates that the status of paper insulation become good with temperature decrease. According to the (6), (7), and (11), the authors believe that if the C0 and U0 are a constant, respectively, then the variation of paper conductivity at any insulation temperature only depends on the migration rate of charge carriers inside oil-impregnated cellulose pressboard. The decreasing insulation temperature can decrease the paper conductivity because the decreasing migration rate of charge carriers inside oil-impregnated cellulose pressboard can decrease the conduction currents, and thus finally decreasing the paper conductivity. It is interesting to note that this decreasing value of paper conductivity due to the decreasing insulation temperature does not represent permanent good condition of the paper insulation, because the temperature effect is inverted when insulation temperature in paper insulation increases. The present research findings reported that the paper conductivity varied with absolute temperature T, according to the well-known Arrhenius equation, which can be expressed in (15) [26].
σ p a p e r ( T ) A e ( E a / R T )
where Ea is the activation energy of experimental cellulose pressboard (J/mol), R is the molar gas constant (R = 8.314 J/mol), T is the absolute temperature in Kelvin, and A is a constant that is involved in ions mobility in the paper insulation. It is found that if taking natural logarithm on both sides of (15), it can be changed as
ln σ p a p e r ( T ) ln A + ( E a R ) 1 T
It is observed from (16), there is linear relation between lnσpaper (T) and 1/T, and the slope is the −Ea/R. Figure 10 provides the relations between lnσpaper (T) and 1/T, it is observed that there is a better line relationship between lnσpaper (T) and 1/T, and the R-squared can be reached up to 0.957. In addition, according to the fitting equations between lnσpaper (T) and 1/T shown in Figure 10, the values of activation energy Ea can be accurately obtained, which is provided in Table 1. It can be seen from Table 1 that the values of activation energy Ea with four insulation statuses were found to be in the range 93.75–135.59 kJ/mol. This is in agreement with the published works [26,27,28]. The variation values of activation energy Ea is unsystematic and the range most reflects the effectiveness of the chemical and electrical-based transformer insulation diagnostic parameters obtained from PDC measurement.
(b) Insulation resistance (R60s)
Figure 11 presents the calculation results of insulation resistance (R60s), it is found that the values of R60s increase with insulation temperate decrease.
Authors in [3] reported that the insulation resistance can present meritorious knowledge about the overall status of the transformer insulation. A lower value indicates a bad status of the transformer insulation that is caused by an insulation temperature increase, whereas higher corresponds to better status of the transformer insulation because of the temperature decrease [1,3]. From the calculation results of R60s, as shown in Figure 11, the paper insulation can be restored to a good condition with insulation temperature decrease. In the work, we hold the view that the variation of insulation resistance at any insulation temperature depends on two elements. The first element is the migration rate of charge carriers inside oil-impregnated cellulose pressboard. The decreasing mobility of the charge carriers inside the oil-impregnated cellulose pressboard due to the decreasing insulation temperatures, evidently, results in the increase of insulation resistances. The second element is the process of migration, distribution, and equilibrium of moisture/conductive pollutant between dielectric oil and cellulose insulation. During the insulation temperature decrease, the relative saturation of water and conductive pollutant in dielectric oil decreases with the insulation temperature decrease, and thus moisture and conductive pollutant migrates from dielectric oil into cellulose until a new equilibrium state is achieved. The increasing moisture and conductive pollutant in paper insulation could slightly decrease the value of insulation resistance. It is interesting to note that the first factor contradicts with the second factor. However, the migration rate of charge carriers inside oil-impregnated cellulose pressboard is the predominant factor, and the insulation resistance therefore increases with insulation temperature decrease. In addition, it should be pointed out that the obvious increase of insulation resistance, in fact, also does not represent permanent good condition of the paper insulation, since the insulation performance of oil-impregnated cellulose pressboards is reversed once the temperatures increase. The insulation resistance is also vary with absolute temperature T, according to the well-known Arrhenius relationship, as shown in (17) [1].
R 60 s ( T ) R i n i t i a l e E a / R T
where Ea is the activation energy of experimental cellulose pressboard (J/mol), R is the molar gas constant (R = 8.314 J/mol), T is the absolute temperature in Kelvin, Rinitial is the initial insulation resistance related to an infinity high temperature and R60s (T) is the insulation resistance when the insulation medium is charged with a step voltage U0 for the duration 60 s at the absolute temperature T. Similarly, if taking natural logarithm on both sides of (17), it also can be changed as
ln R 60 s ( T ) ln R i n i t i a l + ( E a R ) 1 T
It is observed from (18) that there is linear relation between lnR60s (T) and 1/T, and the slope is the Ea/R. Figure 12 provides relations between lnR60s (T) and 1/T, it is found that there is a better line relationship between lnR60s (T) and 1/T, and all of the R-squared can be reached up to 0.984.
Furthermore, according to the fitting equations between lnR60s (T), and 1/T shown in Figure 12, the values of activation energy can be accurately obtained, which is presented in Table 2. It can be seen from Table 2 that the values of activation energy of experimental cellulose pressboards with four insulation statuses were found to be in the range 94.00–110.19 kJ/mol. This is also in accordance with the published works [26,27,28]. When compared to the Table 1, it can be seen from Table 2 that the fluctuation range of the activation energy using the linear relation between lnR60s (T) and 1/T is smaller than using the linear relation between lnσpaper (T) and 1/T due to the better goodness of fit on fitting curves between lnR60s (T) and 1/T presented in the Figure 12. It is also indicated that the variation values of activation energy are unsystematic and the small ranges may also reflect the effectiveness on chemical and electrical-based transformer insulation diagnostic parameters obtained from PDC measurement.
(c) Absorption ratio (AR)
Figure 13 presents the calculation results of absorption ratio (AR). It is observed that the AR value is a parameter that is greatly temperature dependent and there are no obvious change rules on the AR values. This phenomenon may attribute to the transient process of migration, distribution, and equilibrium of moisture and conductive pollutant between oil and cellulose material. In the early stage of measurement duration, the transient process is rather complicated. In the paper, we believe that the transient process can cause the fluctuation of polarization current, and thus result in the fluctuation of AR values. It is found that the AR value is rather unreliable when using the parameter to obtain the status of transformer cellulose insulation. Therefore, the absorption ratio is not a good insulation degradation indicator for the transformer cellulose material.
(d) Polarization index (P.I.)
Figure 14 presents the calculation results of polarization index (P.I.). Similarly, it is also observed that the P.I. value is a temperature dependent parameter and there are no obvious change rules on the P.I. values. The P.I. is different from paper conductivity, which is positive correlation with insulation temperature decrease and insulation resistance, which is negative correlation with insulation temperature. It is a fact that P.I. is the ratio of insulation resistance at 600 s to 60 s. Similarly, the transient process of the migration, distribution, and equilibrium of moisture and conductive pollutant between dielectric oil and cellulose paper/pressboard can cause the fluctuation of polarization current, and thus result in the fluctuation of P.I. values. In addition, it is also found that the P.I. value, obviously affected by temperature, is also rather unreliable when applying the parameter to obtain the status of transformer cellulose insulation. Similar conclusions are also observed in the papers [2,5]. Therefore, the polarization index is also not a good insulation degradation indicator for the transformer cellulose material.
To sum up, the temperature effect on paper conductivity, and insulation resistance can be effectively eliminated by using the well-known Arrhenius equation and the two parameters can be used are suitable for field application, while the absorption ratio and polarization index obtained from polarization and depolarization current measurement are irregular and it is indicated that these parameters cannot be are not suitable for field application.

6. Conclusions

This aim of the contribution is to understand and interpret the effectiveness of chemical and electrical-based transformer insulation diagnostic parameters obtained from PDC measurement, as well as temperature effect mechanism on these parameters. The detailed conclusions in this paper are as follows:
(1)
The magnitudes of polarization/depolarization current obviously decrease with a decreasing insulation temperature. Moreover, the ‘inflection point’ of polarization/depolarization currents will occur with insulation temperature decrease. This inflection point phenomenon seems to be related to the relaxation time constant with temperature dependant. The inflection point will migrate from smaller measurement time point to larger measurement time point with an insulation temperature decrease.
(2)
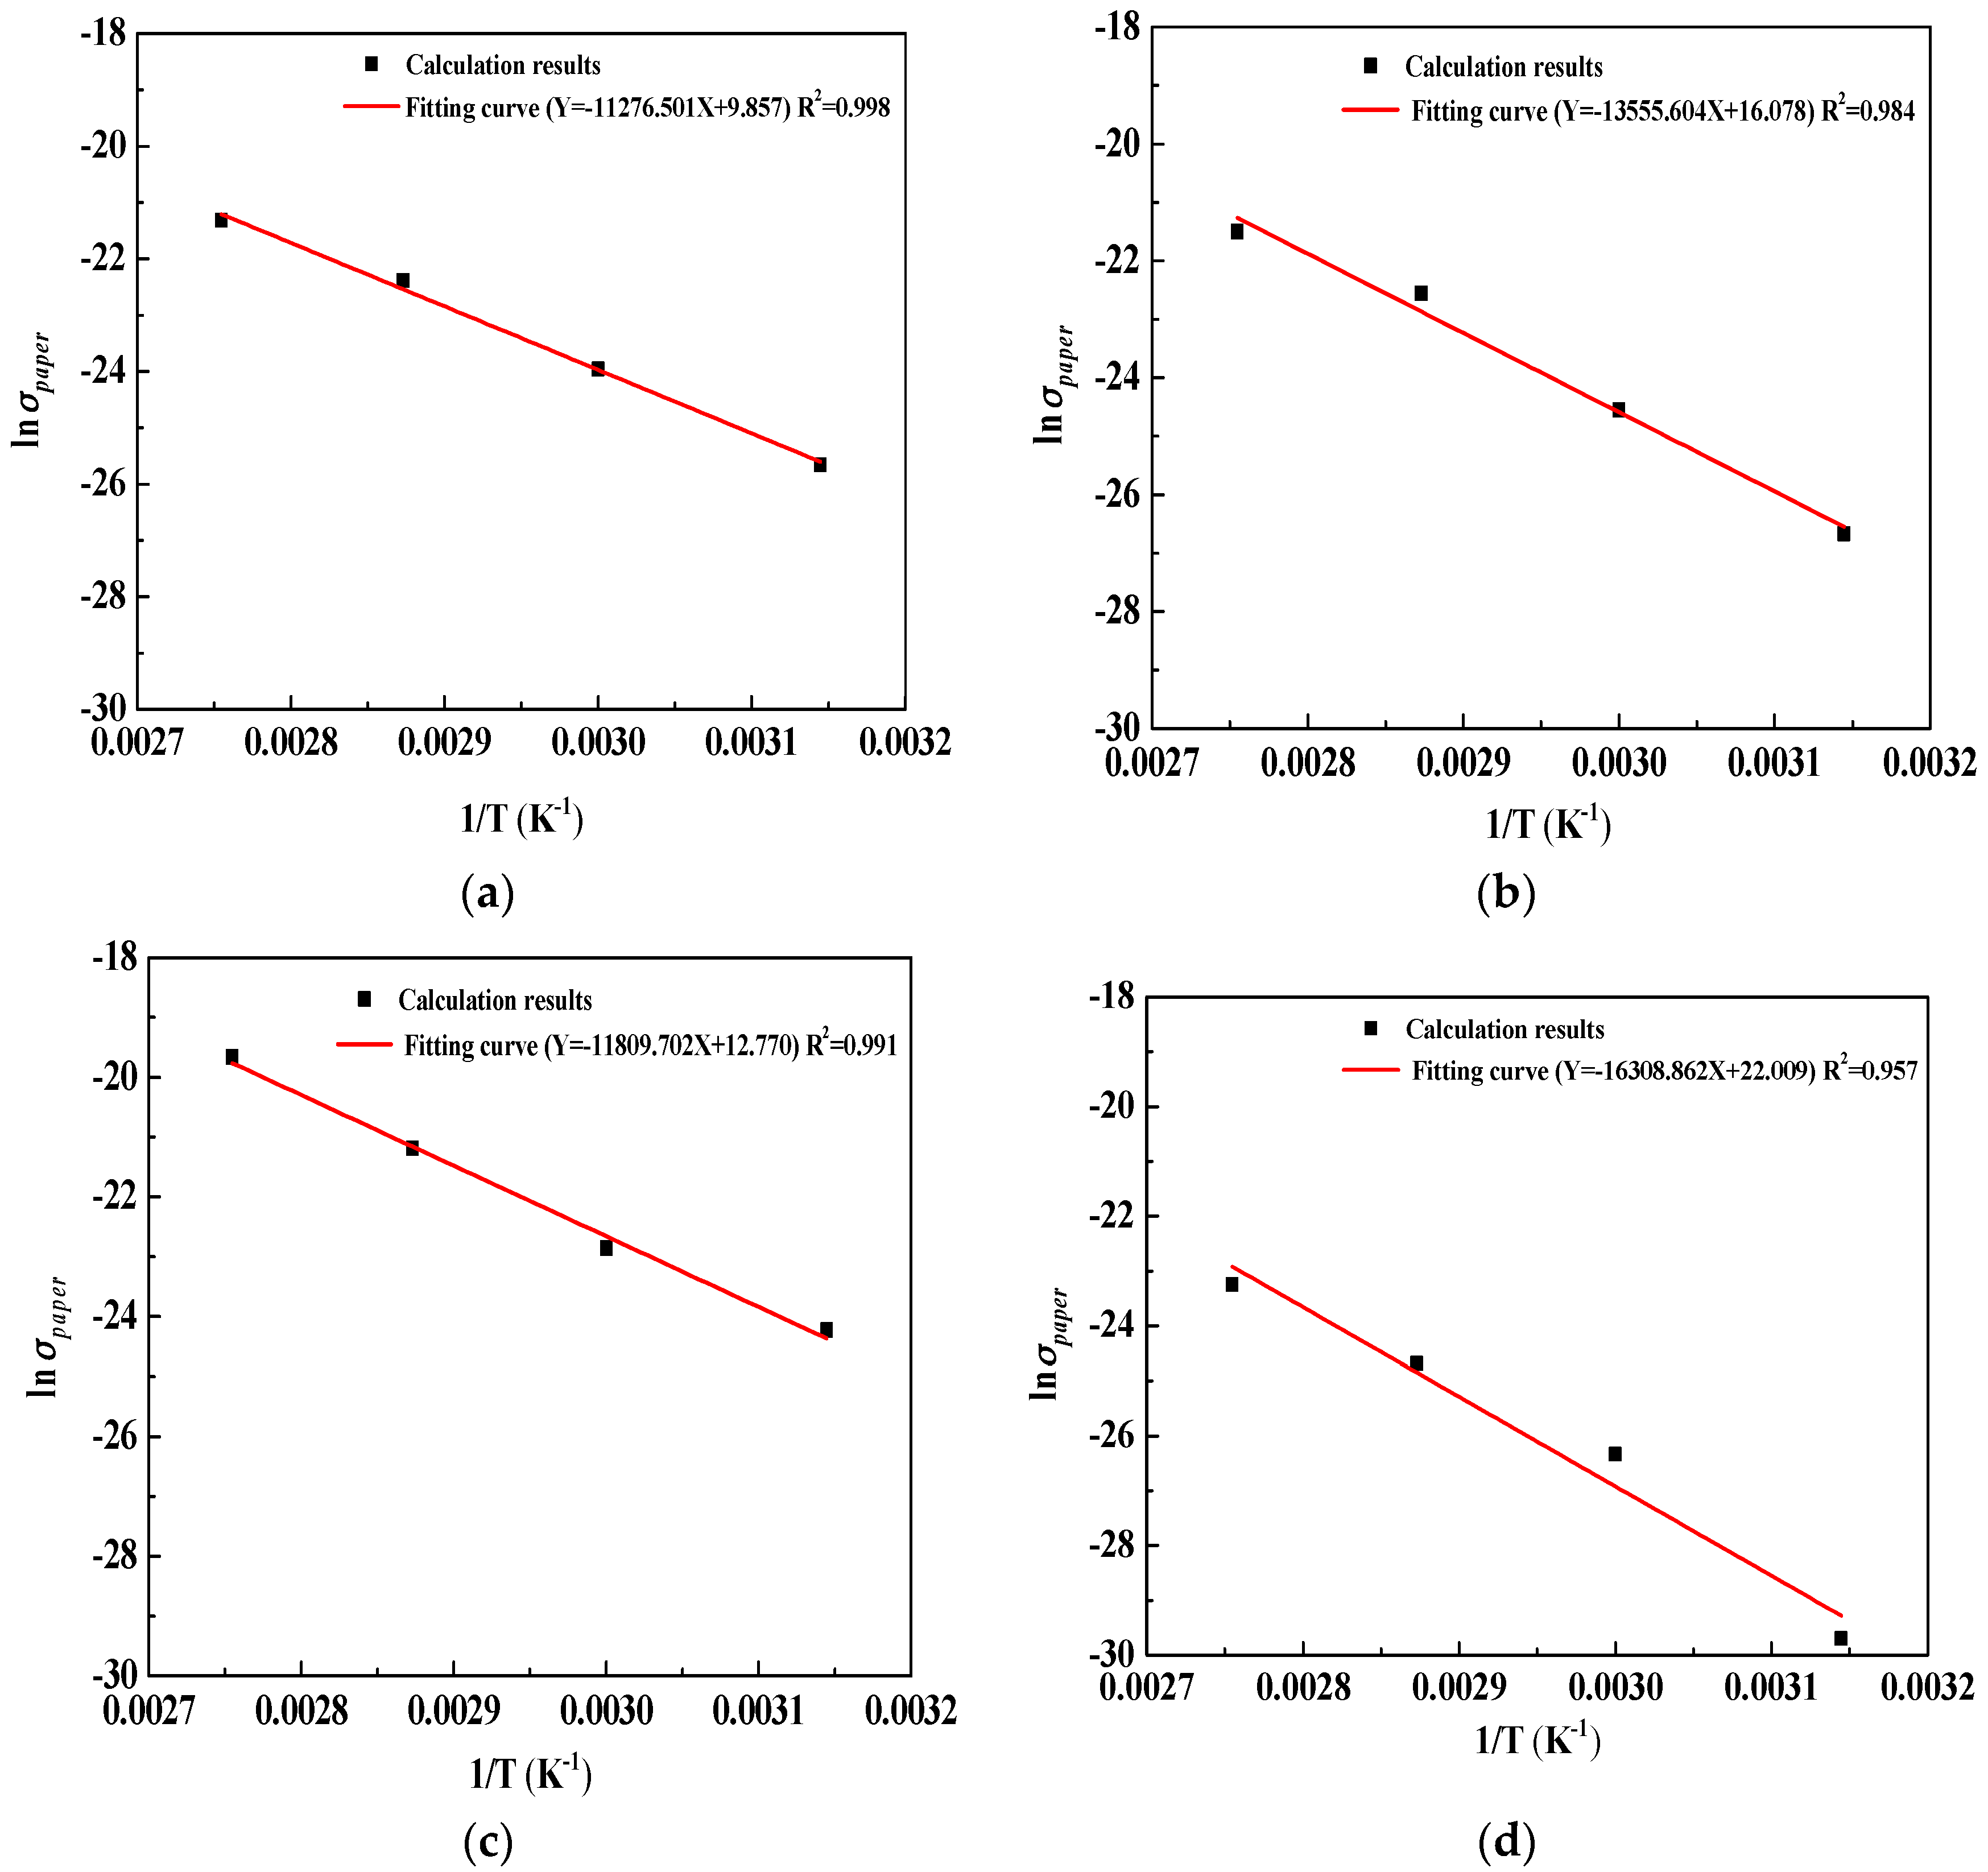
The chemical and electric-based transformer insulation diagnostic parameters reported in this work can be calculated from PDC measurement and their effectiveness can be effectively verified by the activation energy obtained from the well-known Arrhenius relationship between paper conductivity/insulation resistance and absolute temperature. Moreover, the fluctuation range of the activation energy using the linear relation between lnR60s (T) and 1/T is smaller than using the linear relation between lnσpaper (T) and 1/T due to the better goodness of fit on fitting curves between lnR60s (T) and 1/T.
(3)
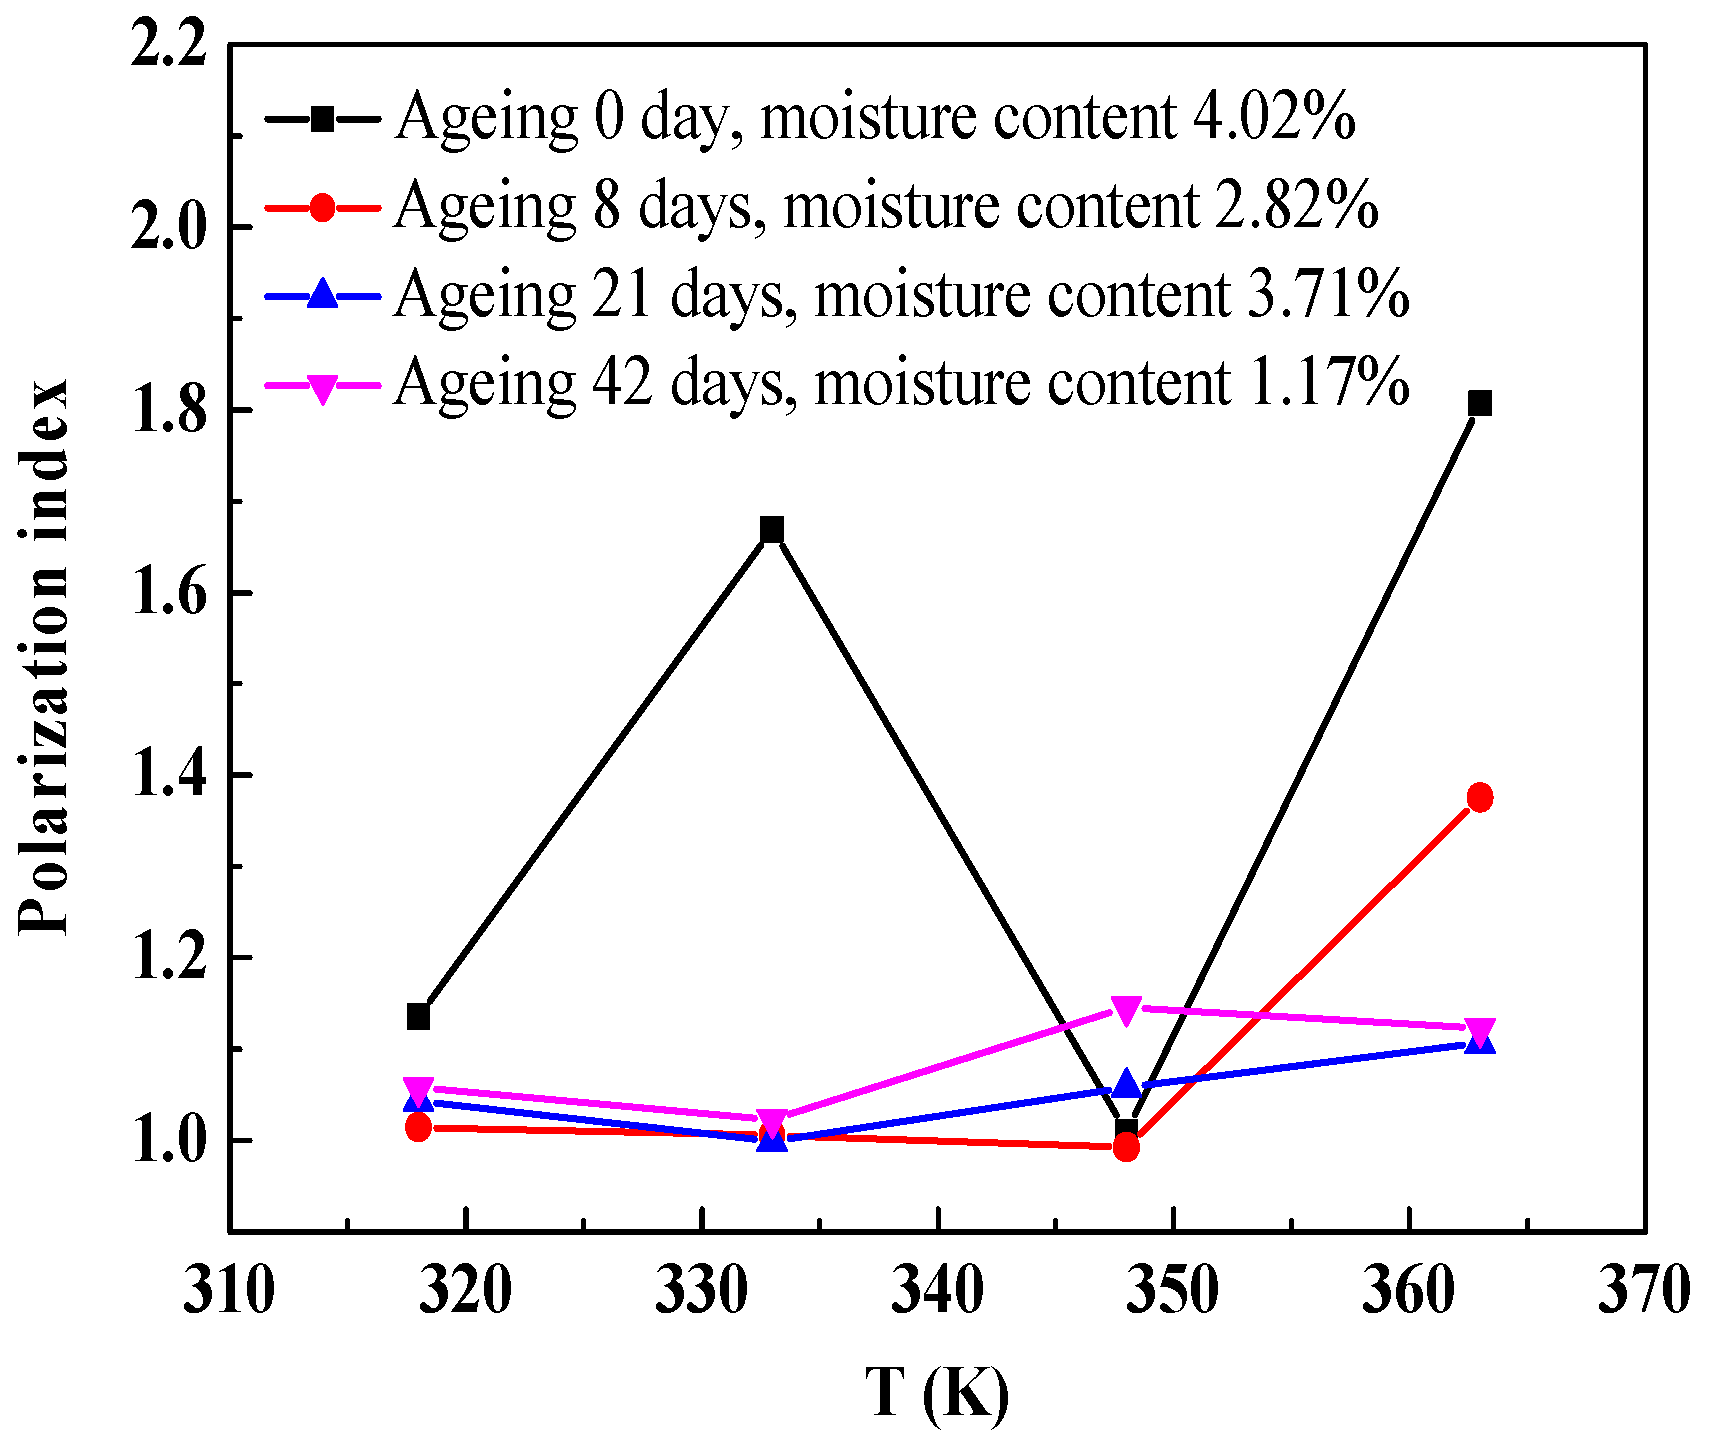
The temperature effect on paper conductivity and insulation resistance can be effectively eliminated by using the well-known Arrhenius equation. The two parameters are suitable for field application. While the absorption ratio and polarization index obtained from polarization and depolarization current measurement are irregular and it is indicated that these parameters are not suitable for field application.

Acknowledgments

The authors acknowledge the National Basic Research Program of China (973 Program, 2013CB228205), and the National High-tech R & D Program of China (863 Program, 2015AA050204), the Natural Science Foundation of Guangxi (2015GXNSFBA139235), the Foundation of Guangxi Science and Technology Department (AE020069), and the Foundation of Guangxi Education Department (T3020097903), and the National Key Research and Development Program of China (2016YFB0900101) and National Demonstration Center for Experimental Electrical Engineering Education (Guangxi University) in support of this work.

Author Contributions

Jiefeng Liu and Yiyi Zhang designed the experiments, and performed the PDC measurement; Hanbo Zheng, Jiefeng Liu and Yiyi Zhang analyzed the data; Hanbo Zheng performed the writing; Yijie Ma, Yang Shen, Xiaochen Zhen and Zilai Chen contributed the literature search, discussion and paper modification; All authors have approved the submitted manuscript.

Conflicts of Interest

The authors declare no conflict of interest.

References

  1. Fofana, I.; Hemmatjou, H.; Meghnefi, F.; Farzaneh, M.; Setayeshmehr, A.; Borsi, H.; Gockenbach, E. On the frequency domain dielectric response of oil-paper insulation at low temperatures. IEEE Trans. Dielectr. Electr. Insul. 2010, 17, 799–807. [Google Scholar] [CrossRef]
  2. Fofana, I.; Hadjadj, Y. Electrical-based diagnostic techniques for assessing insulation condition in aged transformers. Energies 2016, 6, 697. [Google Scholar] [CrossRef]
  3. Hadjadj, Y.; Meghnefi, F.; Fofana, I.; Ezzaidi, H. On the feasibility of using poles computed from frequency domain spectroscopy to assess oil impregnated paper insulation conditions. Energies 2013, 6, 2204–2220. [Google Scholar] [CrossRef]
  4. Zhang, Y.; Liu, J.; Zheng, H.; Wei, H.; Liao, R. Study on quantitative correlations between the ageing condition of transformer cellulose insulation and the large time constant obtained from the extended Debye model. Energies 2017, 10, 1842. [Google Scholar] [CrossRef]
  5. Fofana, I.; Hemmatjou, H.; Farzaneh, M. Low temperature and water effects on polarization and depolarization currents of oil-paper insulation. Electr. Power Syst. Res. 2010, 80, 91–97. [Google Scholar] [CrossRef]
  6. Sylvestre N’cho, J.; Fofana, I.; Hadjadj, Y.; Beroual, A. Review of physicochemical-based diagnostic techniques for assessing insulation condition in aged transformers. Energies 2016, 9, 367. [Google Scholar] [CrossRef]
  7. Koch, M.; Prevost, T. Analysis of dielectric response measurements for condition assessment of oil-paper transformer insulation. IEEE Trans. Dielectr. Electr. Insul. 2012, 19, 1908–1915. [Google Scholar] [CrossRef]
  8. Munajad, A.; Subroto, C.; Suwarno. Study on the effects of thermal aging on insulating paper for high voltage transformer composite with natural ester from palm oil using Fourier transform infrared spectroscopy (FTIR) and energy dispersive X-ray spectroscopy (EDS). Energies 2017, 10, 1857. [Google Scholar] [CrossRef]
  9. Zheng, H.; Zhang, Y.; Liu, J.; Wei, H.; Zhao, J.; Liao, R. A novel model based on wavelet LS-SVM integrated improved PSO algorithm for forecasting of dissolved gas contents in power transformers. Electr. Power Syst. Res. 2018, 40, 196–205. [Google Scholar] [CrossRef]
  10. Saha, T.K. Review of Modern Diagnostic Techniques for Assessing Insulation Condition in aged transformers. IEEE Trans. Dielectr. Electr. Insul. 2003, 10, 903–917. [Google Scholar] [CrossRef]
  11. Liu, J.; Zheng, H.; Zhang, Y.; Wei, H.; Liao, R. Grey relational analysis for insulation condition assessment of power transformers based upon conventional dielectric response measurement. Energies 2017, 10, 1526. [Google Scholar] [CrossRef]
  12. Saha, T.K.; Yao, Z.T. Experience with return voltage measurements for assessing insulation conditions in service-aged transformers. IEEE Trans. Power Deliv. 2003, 18, 128–135. [Google Scholar] [CrossRef] [Green Version]
  13. Saha, T.K. Review of time-domain polarization measurements for assessing insulation condition in aged transformers. IEEE Trans. Power Deliv. 2003, 18, 1293–1301. [Google Scholar] [CrossRef]
  14. Hao, J.; Liao, R.; Chen, G.; Ma, Z.; Yang, L. Quantitative analysis ageing condition of natural ester-paper insulation and mineral oil-paper insulation by polarization/depolarization current. IEEE Trans. Dielectr. Electr. Insul. 2012, 19, 188–199. [Google Scholar]
  15. Fofana, I.; Hemmatjou, H.; Meghnefi, F. Effect of thermal transient on the polarization and depolarization current measurements of oil-paper insulation. IEEE Trans. Dielectr. Electr. Insul. 2011, 18, 513–520. [Google Scholar] [CrossRef]
  16. Liu, J.; Liao, R.; Zhang, Y.; Gong, C.; Wang, C.; Gao, J. Condition evaluation for aging state of transformer oil-paper insulation based on time-frequency domain dielectric characteristics. Electr. Power Compon. Syst. 2015, 43, 759–769. [Google Scholar] [CrossRef]
  17. Liao, R.; Liu, J.; Yang, L.; Gao, J.; Zhang, Y.; Lv, Y.; Zheng, H. Understanding and analysis on frequency dielectric parameter for quantitative diagnosis of water content in paper-oil insulation system. IET Electr. Power Appl. 2015, 9, 213–222. [Google Scholar] [CrossRef]
  18. Liao, R.; Liu, J.; Yang, L.; Wang, K.; Hao, J.; Ma, Z.; Gao, J.; Lv, Y. Quantitative analysis of insulation condition of oil-paper insulation based on frequency domain spectroscopy. IEEE Trans. Dielectr. Electr. Insul. 2015, 22, 322–334. [Google Scholar] [CrossRef]
  19. Liao, R.; Liu, J.; Yang, L.; Zhang, Y.; Gao, J.; Ma, Z.; Hao, J. Extraction of frequency domain dielectric characteristic parameter of oil-paper insulation for transformer condition assessment. Electr. Power Compon. Syst. 2015, 43, 578–587. [Google Scholar] [CrossRef]
  20. Saha, T.K.; Purkait, P. Investigation of polarization and depolarization current measurements for the assessment of oil-paper insulation of aged transformers. IEEE Trans. Dielectr. Electr. Insul. 2004, 11, 144–154. [Google Scholar] [CrossRef] [Green Version]
  21. We, J.; Zhang, G.; Xu, H.; Peng, H.; Wang, S.; Dong, M. Novel characteristic parameters for oil-paper insulation assessment from differential time-domain spectroscopy based on polarization and depolarization current measurement. IEEE Trans. Dielectr. Electr. Insul. 2011, 18, 1918–1928. [Google Scholar] [CrossRef]
  22. Saha, T.K.; Purkait, P. Investigations of temperature effects on the dielectric response measurements of transformer oil-paper insulation system. IEEE Trans. Power Deliv. 2008, 23, 252–260. [Google Scholar] [CrossRef]
  23. Kumar, A.; Mahajan, S.M. Time domain spectroscopy measurements for the insulation diagnosis of a current transformer. IEEE Trans. Dielectr. Electr. Insul. 2011, 18, 1803–1811. [Google Scholar] [CrossRef]
  24. Gafvert, U.; Frimpong, G.; Fuhr, J. Modelling of dielectric measurements on power transformers. In Proceedings of the International Conference on Large High Voltage Electric Systems (CIGRE), Paris, France, 15–17 September 1998; pp. 15–103. [Google Scholar]
  25. Ekanayake, C.; Gubanski, S.M.; Graczkowski, A.; Walczak, K. Frequency response of oil impregnated pressboard and paper samples for estimating moisture in transformer insulation. IEEE Trans. Power Deliv. 2006, 21, 1309–1317. [Google Scholar] [CrossRef]
  26. Liao, R.; Hao, J.; Chen, G.; Yang, L. Quantitative analysis of ageing condition of oil-Paper insulation by frequency domain spectroscopy. IEEE Trans. Dielectr. Electr. Insul. 2012, 19, 821–830. [Google Scholar] [CrossRef]
  27. Linhjell, D.; Lundgaard, L.E.; Gafvert, U. Dielectric response of mineral oil impregnated cellulose and the impact of aging. IEEE Trans. Dielectr. Electr. Insul. 2007, 14, 156–169. [Google Scholar] [CrossRef]
  28. Gao, J.; Yang, L.; Wang, Y.; Liu, X.; Du, Y.; Yao, R. Effect of moisture and thermal degradation on the activation energy of oil–paper insulation in frequency domain spectroscopy measurement. IET Gener. Transm. Distrib. 2016, 10, 2042–2049. [Google Scholar] [CrossRef]
Figure 1. Cellulose pressboard disc specimens used in our experiments.
Energies 11 00146 g001
Figure 2. Vacuum oil impregnation tank.
Energies 11 00146 g002
Figure 3. Schematic diagram of three-electrode test cell.
Energies 11 00146 g003
Figure 4. DIRANA.
Figure 4. DIRANA.
Energies 11 00146 g004
Figure 5. Measurment results of polarization current of oil-impregnated pressboard specimens with various insulation statuses. (a) Ageing 0 day (DP = 1285), moisture content 4.02%; (b) Ageing 8 days (DP = 994), moisture content 2.82%; (c) Ageing 21 days (DP = 841), moisture content 3.71%; and, (d) Ageing 42 days (DP = 415), moisture content 1.17%.
Energies 11 00146 g005
Figure 6. Measurement results of depolarization current of oil-impregnated pressboard specimens with various insulation statuses. (a) Ageing 0 day (DP = 1285), moisture content 4.02%; (b) Ageing 8 days (DP = 994), moisture content 2.82%; (c) Ageing 21 days (DP = 841), moisture content 3.71%; and, (d) Ageing 42 days (DP = 415), moisture content 1.17%.
Energies 11 00146 g006aEnergies 11 00146 g006b
Figure 7. Cross-section diagram of the transformer main insulation system.
Energies 11 00146 g007
Figure 8. XY model of transformer main insulation system.
Energies 11 00146 g008
Figure 9. Variations of paper conductivity with the absolute temperature decrease.
Energies 11 00146 g009
Figure 10. Relations between lnσpaper and 1/T. (a) Ageing 0 day (DP = 1285), moisture content 4.02%; (b) Ageing 8 days (DP = 994), moisture content 2.82%; (c) Ageing 21 days (DP = 841), moisture content 3.71%; and, (d) Ageing 42 days (DP = 415), moisture content 1.17%.
Energies 11 00146 g010
Figure 11. Variations of insulation resistance (R60s) with the absolute temperature decrease.
Energies 11 00146 g011
Figure 12. Relations between lnR60s and 1/T. (a) Ageing 0 day (DP = 1285), moisture content 4.02%; (b) Ageing 8 days (DP = 994), moisture content 2.82%; (c) Ageing 21 days (DP = 841), moisture content 3.71%; and, (d) Ageing 42 days (DP = 415), moisture content 1.17%.
Energies 11 00146 g012
Figure 13. Relations between absorption ratio and absolute temperature T.
Energies 11 00146 g013
Figure 14. Relations between polarization index and absolute temperature T.
Energies 11 00146 g014
Table 1. Activation energy values of experimental pressboard specimens with various insulation statuses.
Insulation StatusEa (kJ/mol)
Ageing 0 day (DP = 1285), water content 4.02%93.75
Ageing 8 days (DP = 994), water content 2.82%112.70
Ageing 21 days (DP = 841), water content 3.71%98.19
Ageing 42 days (DP = 415), water content 1.17%135.59
Table 2. Activation energy values of oil-impregnated pressboard specimens with various insulation statuses.
Insulation StatusEa (kJ/mol)
Ageing 0 day (DP = 1285), water content 4.02%94.00
Ageing 8 days (DP = 994), water content 2.82%95.54
Ageing 21 days (DP = 841), water content 3.71%104.78
Ageing 42 days (DP = 415), water content 1.17%110.19

