Article

Biomass Production of Three Biofuel Energy Plants’ Use of a New Carbon Resource by Carbonic Anhydrase in Simulated Karst Soils: Mechanism and Capacity

1
Food and Pharmaceutical Engineering Institute, Guiyang University, Guiyang 550005, China
2
State Key Laboratory of Environmental Geochemistry, Institute of Geochemistry, Chinese Academy of Sciences, Guiyang 550002, China
3
Key Laboratory of Modern Agricultural Equipment and Technology, Ministry of Education & Jiangsu Province, Institute of Agricultural Engineering, Jiangsu University, Zhenjiang 212013, China
*
Authors to whom correspondence should be addressed.
Energies 2017, 10(9), 1370; https://doi.org/10.3390/en10091370
Submission received: 21 June 2017 / Revised: 29 August 2017 / Accepted: 1 September 2017 / Published: 10 September 2017
(This article belongs to the Section I: Energy Fundamentals and Conversion)

Abstract

:
To determine whether the bicarbonate in karst limestone soil could be used as a new carbon resource for biomass production by the catalysis of carbonic anhydrase (CA), a simulative karst drought stress experiment was designed and performed. Three plants used for biofuel energy, Orychophragmus violaceus L. (Ov), Brassica juncea L. (Bj), and Euphorbia lathyris L. (El), were grown under simulated karst drought stress. In response to drought stress, the photosynthesis of the three energy plants was inhibited, but their CA activity increased. The hypothesis was confirmed by plant physiological and stable isotope techniques. The obtained results showed that plant biomass was produced with atmospheric CO2 as well as bicarbonate under drought stress. Bicarbonate use was proportional to the CA activity of the plants. With high CA activity over a long period, El had the highest proportional bicarbonate use compared to Ov and Bj, reaching 26.95%. Additionally, a new method is proposed for the screening of plants grown for energy in karst habitats.

Graphical Abstract

1. Introduction

Currently, a deficiency in feedstock remains a principal barrier in the biomass industry. Due to limited land availability for cultivation, few countries can grow plants for biofuel without other considerations. Although marginal lands are not suited for agricultural production due to poor soil quality, harsh climates, rough terrain, and high levels of pollution, these lands are recommended for the production of biomass feedstock, which has garnered widespread attention [1,2,3,4,5,6,7,8]. As an important marginal land resource, karst landscapes occupy approximately 11.2% of the surface of the earth. Additionally, the karst landscapes in Southwestern China represent more than 30% of the total potentially available land in China [9,10]. In karst habitats, plants must tolerate stresses from high concentrations of bicarbonate, high pH, frequent arid–humid alternation, high concentrations of Ca2+ and Mg2+, and phosphorus deficiencies. Although these factors adversely affect the survival and growth of plants, the growth of some plants was improved by the regulation of carbonic anhydrase (CA, EC 4.2.1.1) gene expression, including pH regulation, ion exchange, respiration, CO2 transfer, and photosynthetic CO2 fixation. These plants are classified as karst-adapted and can grow across the karst regions in limestone soils [9,11].
In terms of the accumulation of biomass in plants, most researchers have only focused on the incorporation of atmospheric CO2 in photosynthesis. However, bicarbonate is another inorganic carbon source that can be used in photosynthesis, which is absorbed through the roots. In fact, plant growth in karst habitats is almost always adversely affected by high concentrations of HCO3 in the range of 3 mmol·kg−1 to 10 mmol·kg−1, and high pH values ranging from 7.4 to 8.3 [10]. In a recent study, the addition of an appropriate concentration of bicarbonate increased the biofuel production of microalgae (Scenedesmus sp. CCNM 1077) [12]. As a class of key regulatory and detoxifying enzymes, CA helps plants to mitigate the adverse effects pH and HCO3 with rapid catalysis of the reversible reaction HCO3 + H+ ⇋ CO2 + H2O. The resulting CO2 and H2O are used in photosynthesis. Additionally, in the guard cells of plant leaves, CA effectively regulates gas exchange between plants and the atmosphere [11,13,14,15]. Both lower plants and higher plants, CA has been attracting attention in the biomass field. Using the catalytic activity of CA, algal reactors (Chlorella sp. and Spirulina platensis) also increased the reversible conversion between bicarbonate and CO2 to develop biomass in a small raceway pond [16]. Although different from lower plants (algage), the CA of higher plants was also found have the similar function. According to Gu et al. [17], the activities of phosphoenolpyruvate carboxylase and CA in two transgenic rice genotypes increased three- to five-fold compared to those in an untransformed wild type cultivar, with the same level of drought stress. Notably, the biomass production of the transgenic plants was 7%–15% higher than that of the wild type cultivar. Jiang et al. also studied the effect of CA activity on biomass accumulation. They found that the expression of mitochondria-localized CA increased when the respiration rate of leaves decreased. Moreover, with an increase in the expression of CA activity, shoot biomass accumulated in Arabidopsis thaliana [18]. In our previous report [19], we found that microalgae promote the dissolution of limestone. Using a stable carbon isotope technique, we deduced that the CA in microalgae catalyzed the dissolution of bicarbonate from limestone for biomass production, with a three- to seven-fold increase in biomass production compared to those with an inhibited CA activity treatment. In the study of Swarnalatha et al. [20], biomass productivity and carbon dioxide bio-fixation increased two- to four-fold in treated cultures of indigenous freshwater microalgae compared to controlled cultures after 16 days. They attributed these results to the high CA activity in treatment cultures, which increased with the increase in pH and bicarbonate concentration, due to the high concentration of CO2 in a closed photo-bioreactor.
Plants in the harsh karst habitats of Southwestern China also face the strain of spring drought, which typically occurs in March and April and lasts several weeks. In response to drought stress, karst-adapted plants close stomata and these plants use the bicarbonate in limestone soils as an alternative inorganic carbon source to maintain continuous photosynthesis [15,21]. To distinguish between atmospheric CO2 and exogenous bicarbonate sources of carbon, a stable carbon isotope technique was successfully used to trace the metabolism of inorganic carbon sources during photosynthesis [22]. Using a method based on stable carbon isotopes, we quantified the proportion of bicarbonate use by plants [11]. Although the conversion to biomass from bicarbonate by the activity of CA has been proposed in studies of plant biomass production for energy [17,18,20], the mechanism and the capacity for bicarbonate use in plants in karst habitats are not fully understood. In this study, we hypothesized that CA activity of plants increased under drought stress, which produced H2O and CO2 from the bicarbonate (HCO3) in limestone dissolution of karst soils for use in photosynthesis and biomass production. With the integration of plant physiological and stable carbon isotope techniques, the effect of simulated drought stress in karst soil on plant physiological characteristics, biomass production, and capacity for bicarbonate use were investigated for three plant species used for biomass in biofuel energy production—Euphorbia lathyris L. (El), Orychophragmus violaceus L. (Ov), and Brassica juncea L. (Bj)—among which El belonged to Euphorbiaceae family (C4, annual herbs) that could thrive in drought, frost, and arid soils; while Ov and Bj belonged to Cruciferae family (C3, annual herbs), two kinds of common plants in karst area. We then attempted to elucidate the relationship between CA activity and bicarbonate use capacity of the three plants. Additionally, a new method is proposed to screen plants grown for energy in karst soils.

2. Materials and Methods

2.1. Plant Materials and Substrate

The El, Ov, and Bj seeds were provided by the Biomass Energy Research Institute of Guizhou Province, China, the Institute of Geochemistry, Chinese Academy of Sciences, China, and the Rapeseed Institute of Guizhou Province, China, respectively. The substrate used in plastic pots was a 1:1 quartz sand to vermiculite mixture (m/m) which was fertilized with modified Hoagland’s nutrient solution (pH 8.1 ± 0.1). To quantify the proportion of bicarbonate use of the three species, the plants in each treatment level of drought stress were divided into two groups that received additions of NaHCO3 with two different δ13C values, −27.28‰ Pee Dee Belemnite (PDB) or −18.81‰ PDB. The δ13C values of NaHCO3 were determined by gas isotope ratio mass spectrometry.
After air drying, the substrate contained 6 mmol·kg−1 KNO3, 4 mmol·kg−1 Ca(NO3)2, 2 mmol·kg−1 MgSO4, 2 mmol·kg−1 Fe(Na)EDTA, 0.25 mmol·kg−1 NH4H2PO4, 0.75 mmol·kg−1 NH4Cl, 2 mmol·kg−1 KCl, 0.05 mmol·kg−1 H3BO3, 0.04 mmol·kg−1 MnSO4, 0.04 mmol·kg−1 ZnSO4, 0.02 mmol·kg−1 CuSO4, and 0.02 mmol·kg−1 Mo(NH4)6MO7O24. To simulate karst substrate with high concentrations of bicarbonate and high pH [10,14], the concentration of NaHCO3 in the substrate was 10 mmol·kg−1, and the pH value was 8.1.

2.2. Experimental Design and Growth Conditions

A systematic experiment was conducted in a growth chamber under natural sunlight in the Institute of Geochemistry, Chinese Academy of Sciences, Guizhou Province, China (26.35° N, 106.42° E). The experiment was divided into growth and stress phases. During the growth phase from 21 September 2013 (autumn) to 18 February 2014 (spring), totaling 150 days, the room temperature and relative humidity were balanced with outside conditions using ventilators and were recorded with an intelligent temperature and humidity recorder at 60-minute intervals. The three species were treated similarly; for example, El seeds were surface sterilized with 5% (v/v) H2O2 for 30 min, washed with deionized water and sown with eight seeds per plastic pot (height: 24 cm; volume: 5 L), and filled with substrate. At 15 days after sowing, the pots were thinned to four uniform seedlings with good growth. A total of 256 plants in 64 pots, which were divided into two groups, were grown for 180 days in well-watered cultures. Based on gravimetric measurements of the pots, the moisture content of the substrate was maintained at 20 ± 1% with additions of NaOH solution (pH 8.1) every five days. Following the volumetric procedure used by Zuo et al. [23], the concentration of bicarbonate in the substrate at 10 cm was determined and modified 1/10 Hoagland’s nutrient solution with the NaHCO3 at one of two different δ13C values was added at 10-day intervals to maintain a concentration of 10 mmol·kg−1. During the growth phase, the room temperature ranged from 268.9 K to 303.9 K and the relative humidity ranged from 48.7% to 76.2%, with average values of 284.4 K and 63.1%. There were 23 days below 273 K.
Following the growth phase of 150 days, a 21-day stress phase occurred from 19 February to 10 March 2014. Room temperature ranged from 279.1 K to 305.9 K, relative humidity from 63.7% to 75.2%, and the average values were 290.9 K and 71.1%. Based on literature values for karst soils in drought conditions [4], four drought treatments were applied: well-watered (control, 20% moisture), mild drought stress (D1, 17% moisture), moderate drought stress (D2, 14% moisture), and severe drought stress (D3, 11% moisture). Therefore, the 64 pots were classified into 4 treatments. For each level of moisture, the 16 pots were further divided into 2 groups that were watered with NaOH solution that contained NaHCO3 at one of two different δ13C values, −27.28‰ PDB or −18.81‰ PDB, every two days. The bicarbonate concentration of the substrate was maintained at 10 mmol·kg−1 for the entire phase of the experiment.

2.3. Physiological Characteristics

On days 1, 7, 14, and 21 of the drought stress phase, malondialdehyde (MDA), net photosynthetic rate Pn (μmol·m2·s−1), and stomatal conductance Gs (mmol·m2·s−1) were determined. To obtain accurate data for these biological characteristics, the fourth fully expanded leaf from the top of the plant was used. For MDA determinations, 1 g of leaf tissue obtained from 10 randomly selected plants was homogenized and analyzed by UV spectrophotometry [24]. The Pn and Gs were determined between 9:30 and 11:00 a.m. using a portable LI-6400XT photosynthesis measurement system (LI-COR Inc., Lincoln, NE, USA). The photosynthetically active radiation, temperature, and CO2 concentration measurements taken were 600 μmol·m−2·s−1, 298 K, and 400 μmol·mol−1, respectively, which were determined from 10 random plants in different pots.

2.4. Biomass Production

At the end of the stress phase, 256 plants were harvested according to two differently labeled groups. Then were separated into four parts: roots, stems, leaves, and seeds. To determine dry biomass production (g), the samples were dried under a vacuum (335 K, 0.08 MPa) for 4 h. The oil content (wt %) and acid value (mg KOH/g) of seeds were determined according to ISO 659:1998 and ISO 660:1996, respectively. After methylation according to ISO 5509: 2001, the fatty acid composition (FAC) of oils was obtained using the external standard method and a Shimadzu GC/MS-QP2010E (Shimazhu, Kyoto, Japan) equipped with an HP-Innowax column (30 m × 0.32 mm, 0.5 μm) (Agilent, Palo Alto, CA, USA) and a flame ionization detector (Agilent, Palo Alto, CA, USA) [25]. Furthermore, the fuel properties were measured by cetane number (CN), higher heating value (HHV), and kinematic viscosity (KV) from each oil sample which were determined using the equations of Ramos et al. [26,27].

2.5. CA Activity

CA activity (WAU g−1 (FW)) of the leaf tissue was determined every seven days during the stress phase using the method reported previously [11]. The fourth youngest fully expanded leaf from the top of the plant was used. Immediately, leaf tissue samples, weighing 0.1 g–0.2 g, from each treatment were ground in liquid nitrogen with 3 mL of extraction buffer (0.01 M sodium barbitone with 0.05 M mercaptoethanol, pH 8.3). Homogenates were centrifuged at 10,000× g for 5 min at 273 K followed by standing for 20 min at 277 K. Then, 0.4 mL of homogenate was added to 4.5 mL of 0.02 M barbitone buffer (5,5-diethylbarbituric acid; pH 8.3). Using an electrochemical instrument (CHI 615C; Chenhua, Shanghai, China), the reaction was initialized with the addition of 3 mL of CO2-saturated deionized water. The CA activity was calculated using Equation (1)
CA   activity   ( WAU   g - 1 ( FW ) )   =   ( t 0 / t 1 )
where t0 and t are the reaction times (s) for the pH to change from 8.2 to 7.2 with buffer alone (t0) and with the sample (t).

2.6. Stable Carbon–Isotope Ratio Analysis

Plants were cultivated on two kinds of simulate karst substrate, which containing different NaHCO3 with different δ13C values (−27.28‰ PDB or −18.81‰ PDB). On days 1, 7, and 14 of the drought stress phase, the first fully expanded leaves from the tops of 10 random plants of each treatment were collected. On day 21 of the stress phase, seed samples were collected. The seeds were immediately deactivated at 383 K for 20 min and were dried at 353 K for 8 h. Dried samples were ground to pass through a 100-mesh sieve. Powdered samples, weighing 3.0 mg–3.2 mg, were enclosed in a quartz tube and converted to CO2 by combustion. The stable carbon isotope values (δ13C) were determined using a gas isotope ratio mass spectrometer (Mat-252; Finnigan MAT, San Jose, CA, USA). Stable carbon isotope values (δ) were expressed relative to the C reference materials (PDB) as ‰ and were calculated using Equation (2)
δ ( ) = ( R sample / R standard 1 ) × 1000

2.7. Proportion of Bicarbonate Use

In this study, the exogenous dissolved inorganic carbon from added NaHCO3 (NaHCO3 labels) was the focus. To minimize the contribution of other sources of isotope fractionation, such as photosynthetic fractionation and stomatal conductance, a bidirectional stable carbon isotope tracer technology was employed under the same culture conditions. Based on the results of stable carbon isotope ratio analyses, the proportion of bicarbonate use was quantified for the three plant species under drought stress. A bivariate isotope-mixture model was used, shown in Equation (3), which is described in detail in our previous report [11]
f B = δ T 1 δ T 2 δ C 1 δ C 2
where fB is the proportion of bicarbonate use, δT1 and δT2 are the δ13C values of samples from the two differently labeled groups at identical moisture levels, and δC1 and δC2 are the δ13C values of the two stable isotope-labeled NaHCO3 additions.

2.8. Statistical Analyses

All data are expressed as the mean values ± standard deviation, with the exception of biomass and seed production. Statistical analyses were performed using the SPSS 13.0 statistical software package (SPSS Inc., Chicago, IL, USA). Differences amongst means were compared with Duncan’s Multiple Range Tests (DMRT) at a significance level of p < 0.05.

3. Results and Discussion

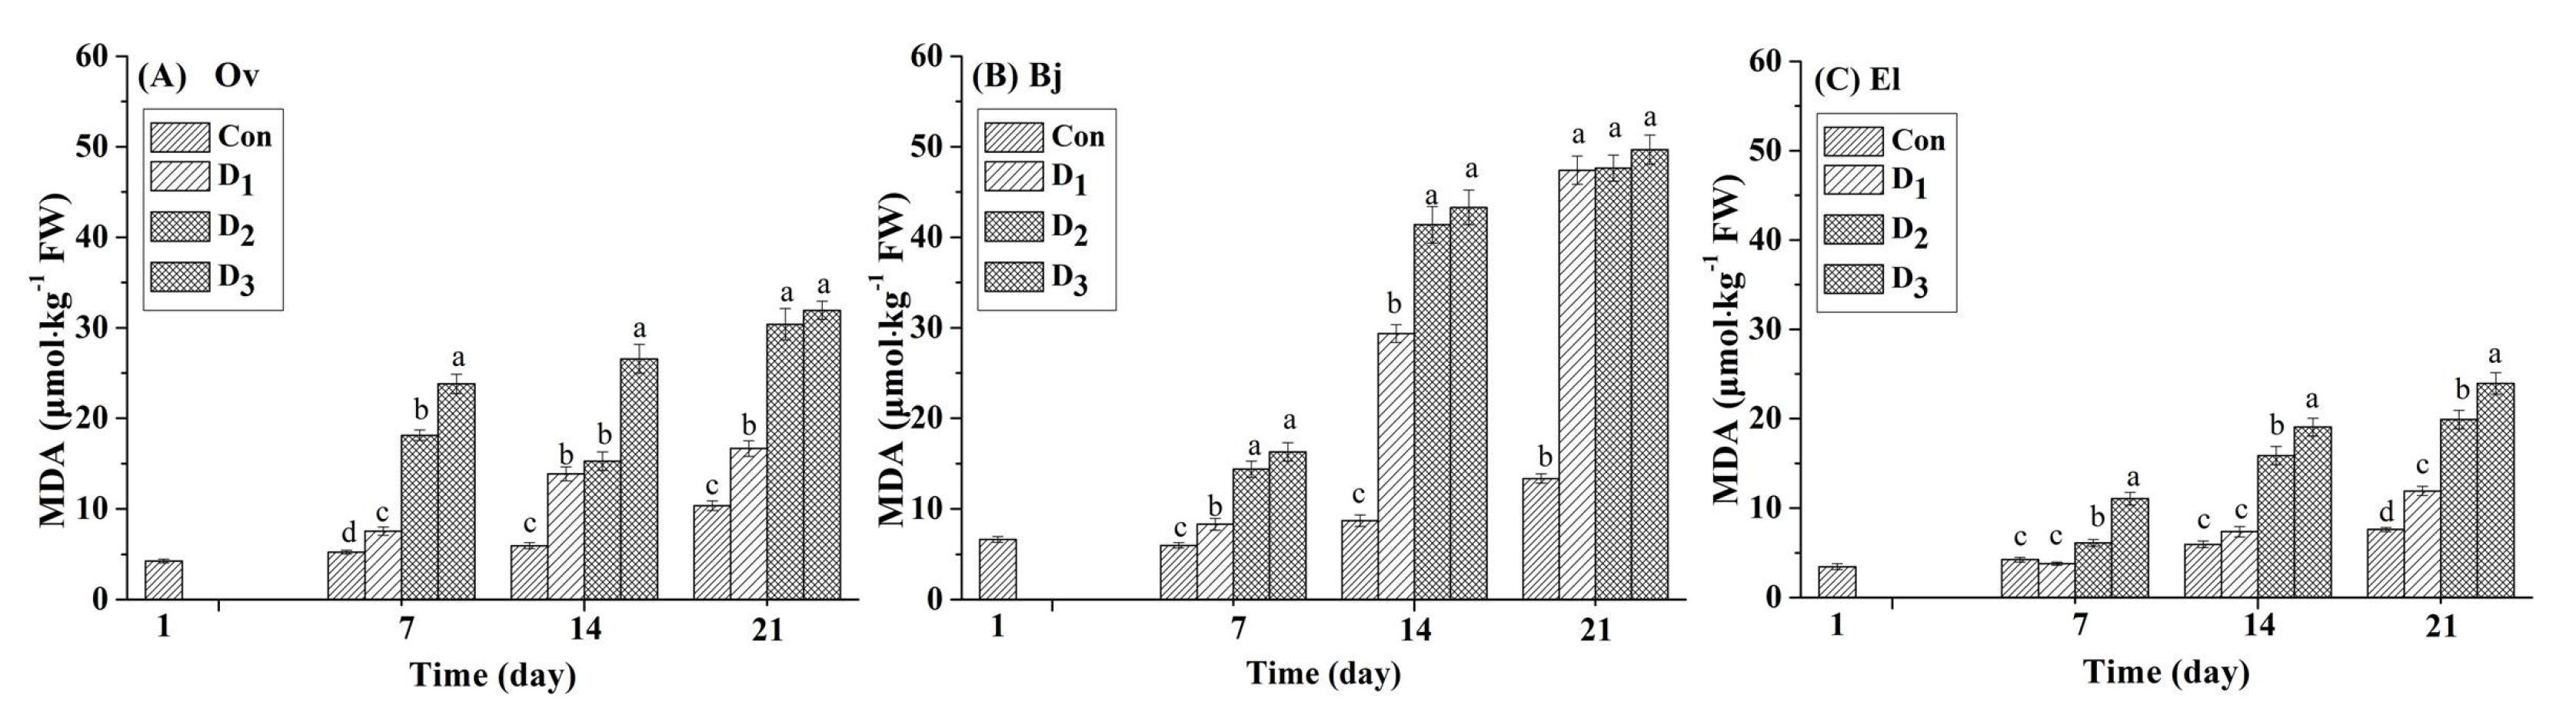
3.1. MDA Content of Plants Leaves Under Drought Stress

Malondialdehyde (MDA) is the main product of membrane lipid peroxidation, and its content is proportional to the degree of damage to cells. Therefore, it is frequently used as the indicator in studies on stress of plants. In this study, the MDA content in the leaves of the three energy plant species was determined every seven days. As shown in Figure 1, under drought stress (D1: 17% moisture, D2: 14% moisture, and D3: 11% moisture), the MDA content in the leaves of the three species increased significantly compared with that in the respective control. On day seven, compared to each controlled treatment, the MDA content in Ov leaves in the D2 and D3 treatments increased by 246.17% and 354.23%, respectively, which were larger increases than those in the leaves of Bj (140.47% and 172.41%, respectively) and El (44.43% and 160.61%, respectively). However, as the experiment continued, the MDA content of the Bj leaves in the three drought stress treatments increased dramatically by 252.29% to 272.13% on day 21 compared to the controls, whereas the increase for Ov and El leaves ranged from 56.50% to 208.51%. For the entire stress phase, the lowest accumulation of MDA occurred in El leaves, compared with those of Ov and Bj for the identical stress treatments. Based on the strong contrast in accumulation of MDA in the leaves of the three species, we speculated that Bj was more vulnerable to simulated drought stress in karst soils than Ov and El.

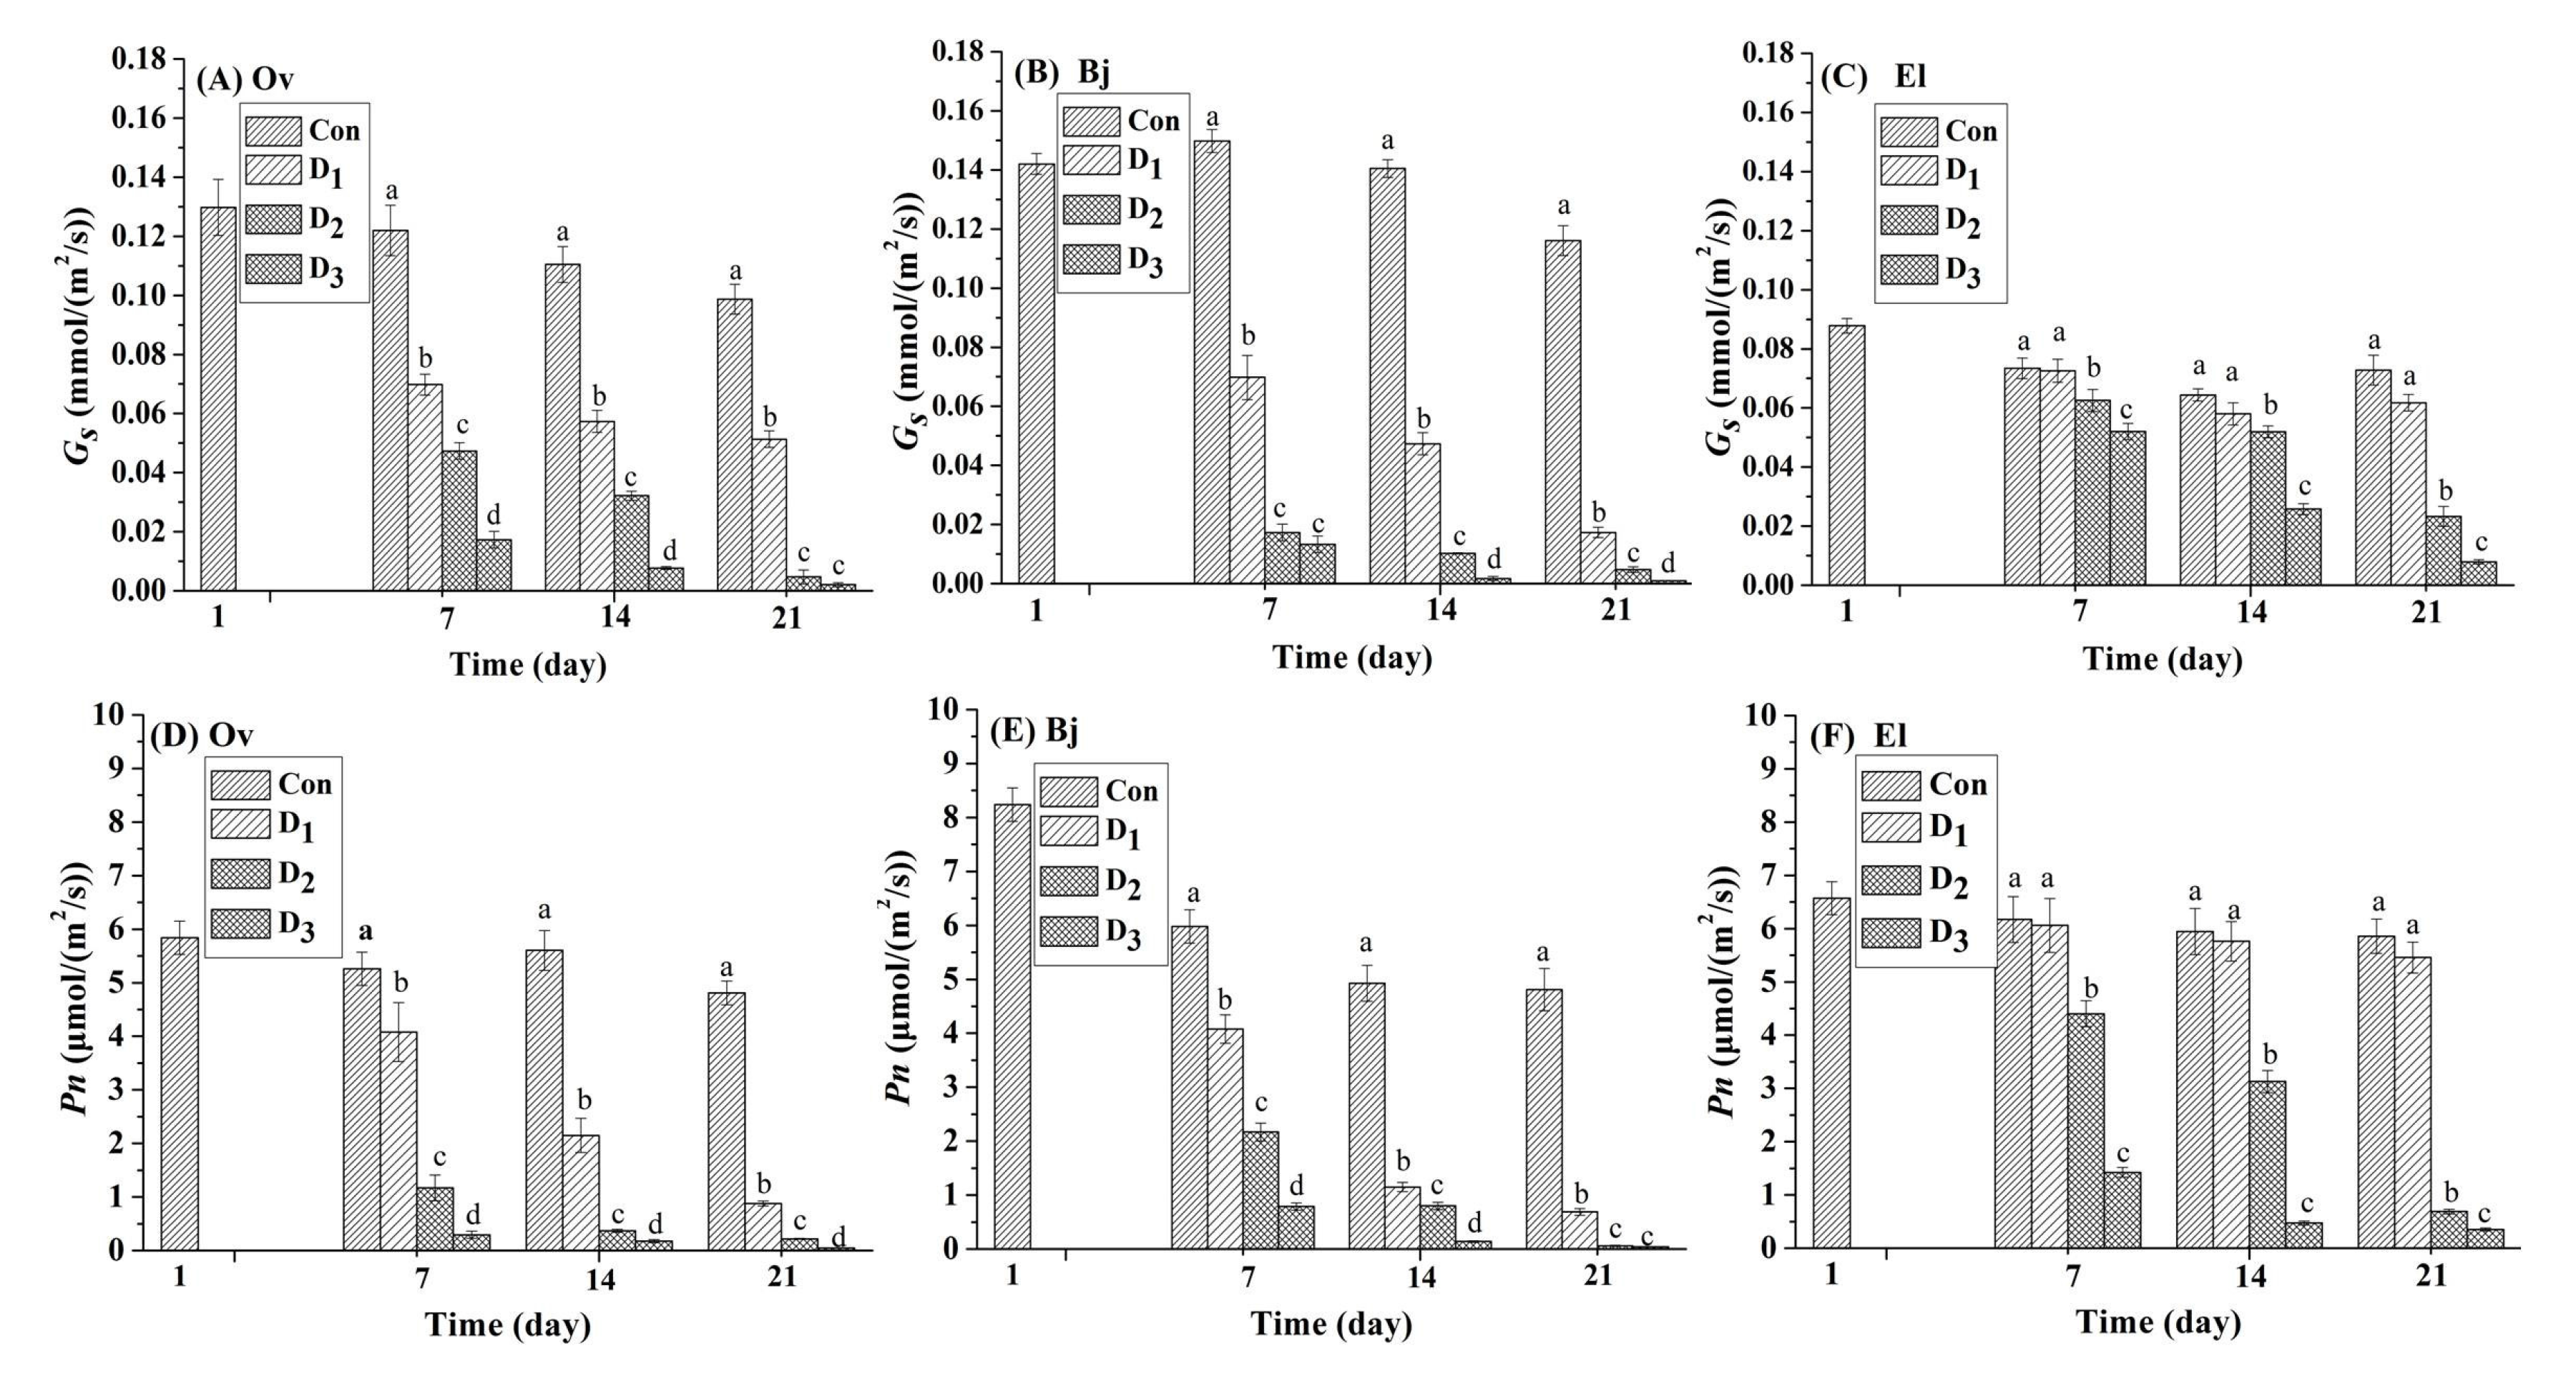
3.2. Photosynthesis of Plant Leaves under Drought Stress

Photosynthesis plays an important role in plant growth and biomass production, and stomatal closure is a common mechanism to avoid loss of water through transpiration when plants suffer from drought stress. Thus, drought-induced stomatal closure could inhibit photosynthesis. Net photosynthetic rate (Pn (μmol m2·s−1)), and stomatal conductance (Gs (mmol m2 s−1)) were employed as direct evaluation indexes [15]. Two important parameters of photosynthesis, Gs and Pn, for the three plants are displayed in Figure 2. Compared to those in the control, the values of Gs and Pn of the three energy plants declined at different rates with continuous drought stress. After drought stress was initiated, the Pn values of El were higher than Ov and Bj at the same level of stress. Bj had the lowest Pn value of the three plant species, except on the seventh day. A similar phenomenon was also observed in the Gs of the three plant species. At the beginning of the stress phase on day seven, Pn and Gs values of both Ov and Bj reduced significantly under the D1, D2, and D3 treatments (p < 0.05); However, the Pn and Gs of El did not decrease significantly (Figure 2C,F) under mild stress (D1) when compared to the controls during the entire stress phase. For Bj on day seven, under mild drought stress (D1), Gs and Pn decreased 53.69% and 31.77%, respectively, compared to the controls, and the parameters for Ov declined by 42.98% and 22.43%, respectively. Under the mild stress treatment at the end of the experiment on day 21, these two indices for Bj decreased by 85.08% and 83.06%, and those of Ov decreased 47.96% and 81.70%, respectively; whereas those of El declined only 1.14% and 1.78%, respectively. On day 21 of severe stress (D3), both Gs and Pn values of Bj and Ov decreased sharply by more than 96%; by contrast, those values for El decreased 89.14% and 89.15%, respectively. In contrast to Ov and Bj, El is in the Euphorbiaceae family, which can thrive drought and saline environments [25]. When combined with the results for MDA accumulation (Figure 1), we concluded that the drought resistance of El was superior to that of Ov and Bj under simulated drought stress in karst soil.

3.3. Biomass Production

Plants are an important biomass feedstock because of their biochemical composition and their biofuel-like compounds such as cellulose, hemicelluloses, lignin, and lipids, from root, stem, leaf, and seed, and so on. In this study, dry biomass production (g), oil content (wt %), and acid value of the oil samples (mg KOH/g) were determined, as shown in Table 1. In this experiment, the photosynthesis of three plants was inhibited when drought stress was imposed (Figure 2). Therefore, differences were observed in dry biomass production (g), oil content (wt %), acid value (mg KOH/g) of oil samples and seed production, especially in seed production (Table 1). Under the three drought treatments, Bj (111.38 g) and Ov (127.55 g) had higher average total biomass production than that of El (81.65 g). Compared to each control, El showed the lowest rate of decline (5.38%) compared with those of Bj (12.87%) and Ov (8.86%). When severe drought (D3) was imposed on Bj, seed production decreased sharply to 20.68% of the control, whereas those of Ov and El were 49.50% and 61.69%, respectively. Based on seed production, we concluded that El had the highest biomass production among the three plant species under drought stress, which we attributed to the higher Pn of El under all drought stress treatments (Figure 1). However, the total accumulation of biomass of Ov and Bj was higher during the growth phase than that of El. The accumulation of oil in the seeds of the three species was also inhibited at varying degrees of drought stress. However, the oil content of El seeds was not significantly affected in the D1 (29.13 wt % ± 1.51 wt %) and D2 (28.83 wt % ± 1.19 wt %) treatments compared to the controls (29.83 wt % ± 1.33 wt %).
Acid value is an important indicator in the evaluation of biodiesel feedstock and seed ripeness, which is proportional to the free fatty acid content of oil. As shown in the Table 1, the acid values for all the plant seed samples were affected by drought stress. Similar to MDA content and Pn values (Figure 1 and Figure 2), the acid values of Ov and Bj, under all levels of drought, were significantly different (P < 0.05). However, the acid values of El seed oil were significantly affected only under the D2 and D3 treatments (P < 0.05) compared to controlled and D1 tretments. Thus, at the same levels of drought stress, the ripeness of Ov and Bj seeds was inhibited more than that of El seeds. Additionally, the acid values of all the oil samples were higher than 3.0 mg KOH/g, which prevents the application of these materials in an alkali-catalyzed biodiesel process [25].
Drought stress at different levels also significantly affected the FAC of the three energy plants, compared with the respective controls (Table A1 and Table A2). Overall, in the seed oil samples of the three species, with the increase in stress, monounsaturation (Cn:1) and saturation (Cn:0) increased and polyunsaturation (Cn:2,3) and the degree of unsaturation decreased. For example, oleic acid (C18:1) and linoleic acid (C18:2) were the primary fatty acids in Ov seed oil samples, and in drought-stressed treatments, oleic acid increased 5.47%, from 22.47% in the controls to 27.94% in the D3 treatment, and linoleic acid decreased 8.64% from 42.58% in controls to 33.94% in the D3 treatment. In some previous studies, recommendations for ideal biodiesel included a high proportion of monounsaturated fatty acids (C16:1 and C18:1), a reduced proportion of polyunsaturated acids, and a controlled content of saturated acids [26,27]. CN is related to the ignition delay time and combustion quality. The higher the cetane number is, the better it is in its ignition properties [27]. HHV also regarded as the gross calorific value or gross energy, it is usually used to define the energy content of fuels. KV is a property of the fluid which opposes the relative motion between the two surfaces of the fluid in a fluid, low KV is better [28]. As shown in Table A2, the CN and HHV (MJ/kg) of the oil samples from the three species improved with the increase in stress level as a whole. However, the KVs (mm2/s; 40 °C) deteriorated. Based on the decrease in the degree of unsaturation, we predicted an improvement in the oxidation stability of all resulting biodiesel samples obtained from stressed cultures.

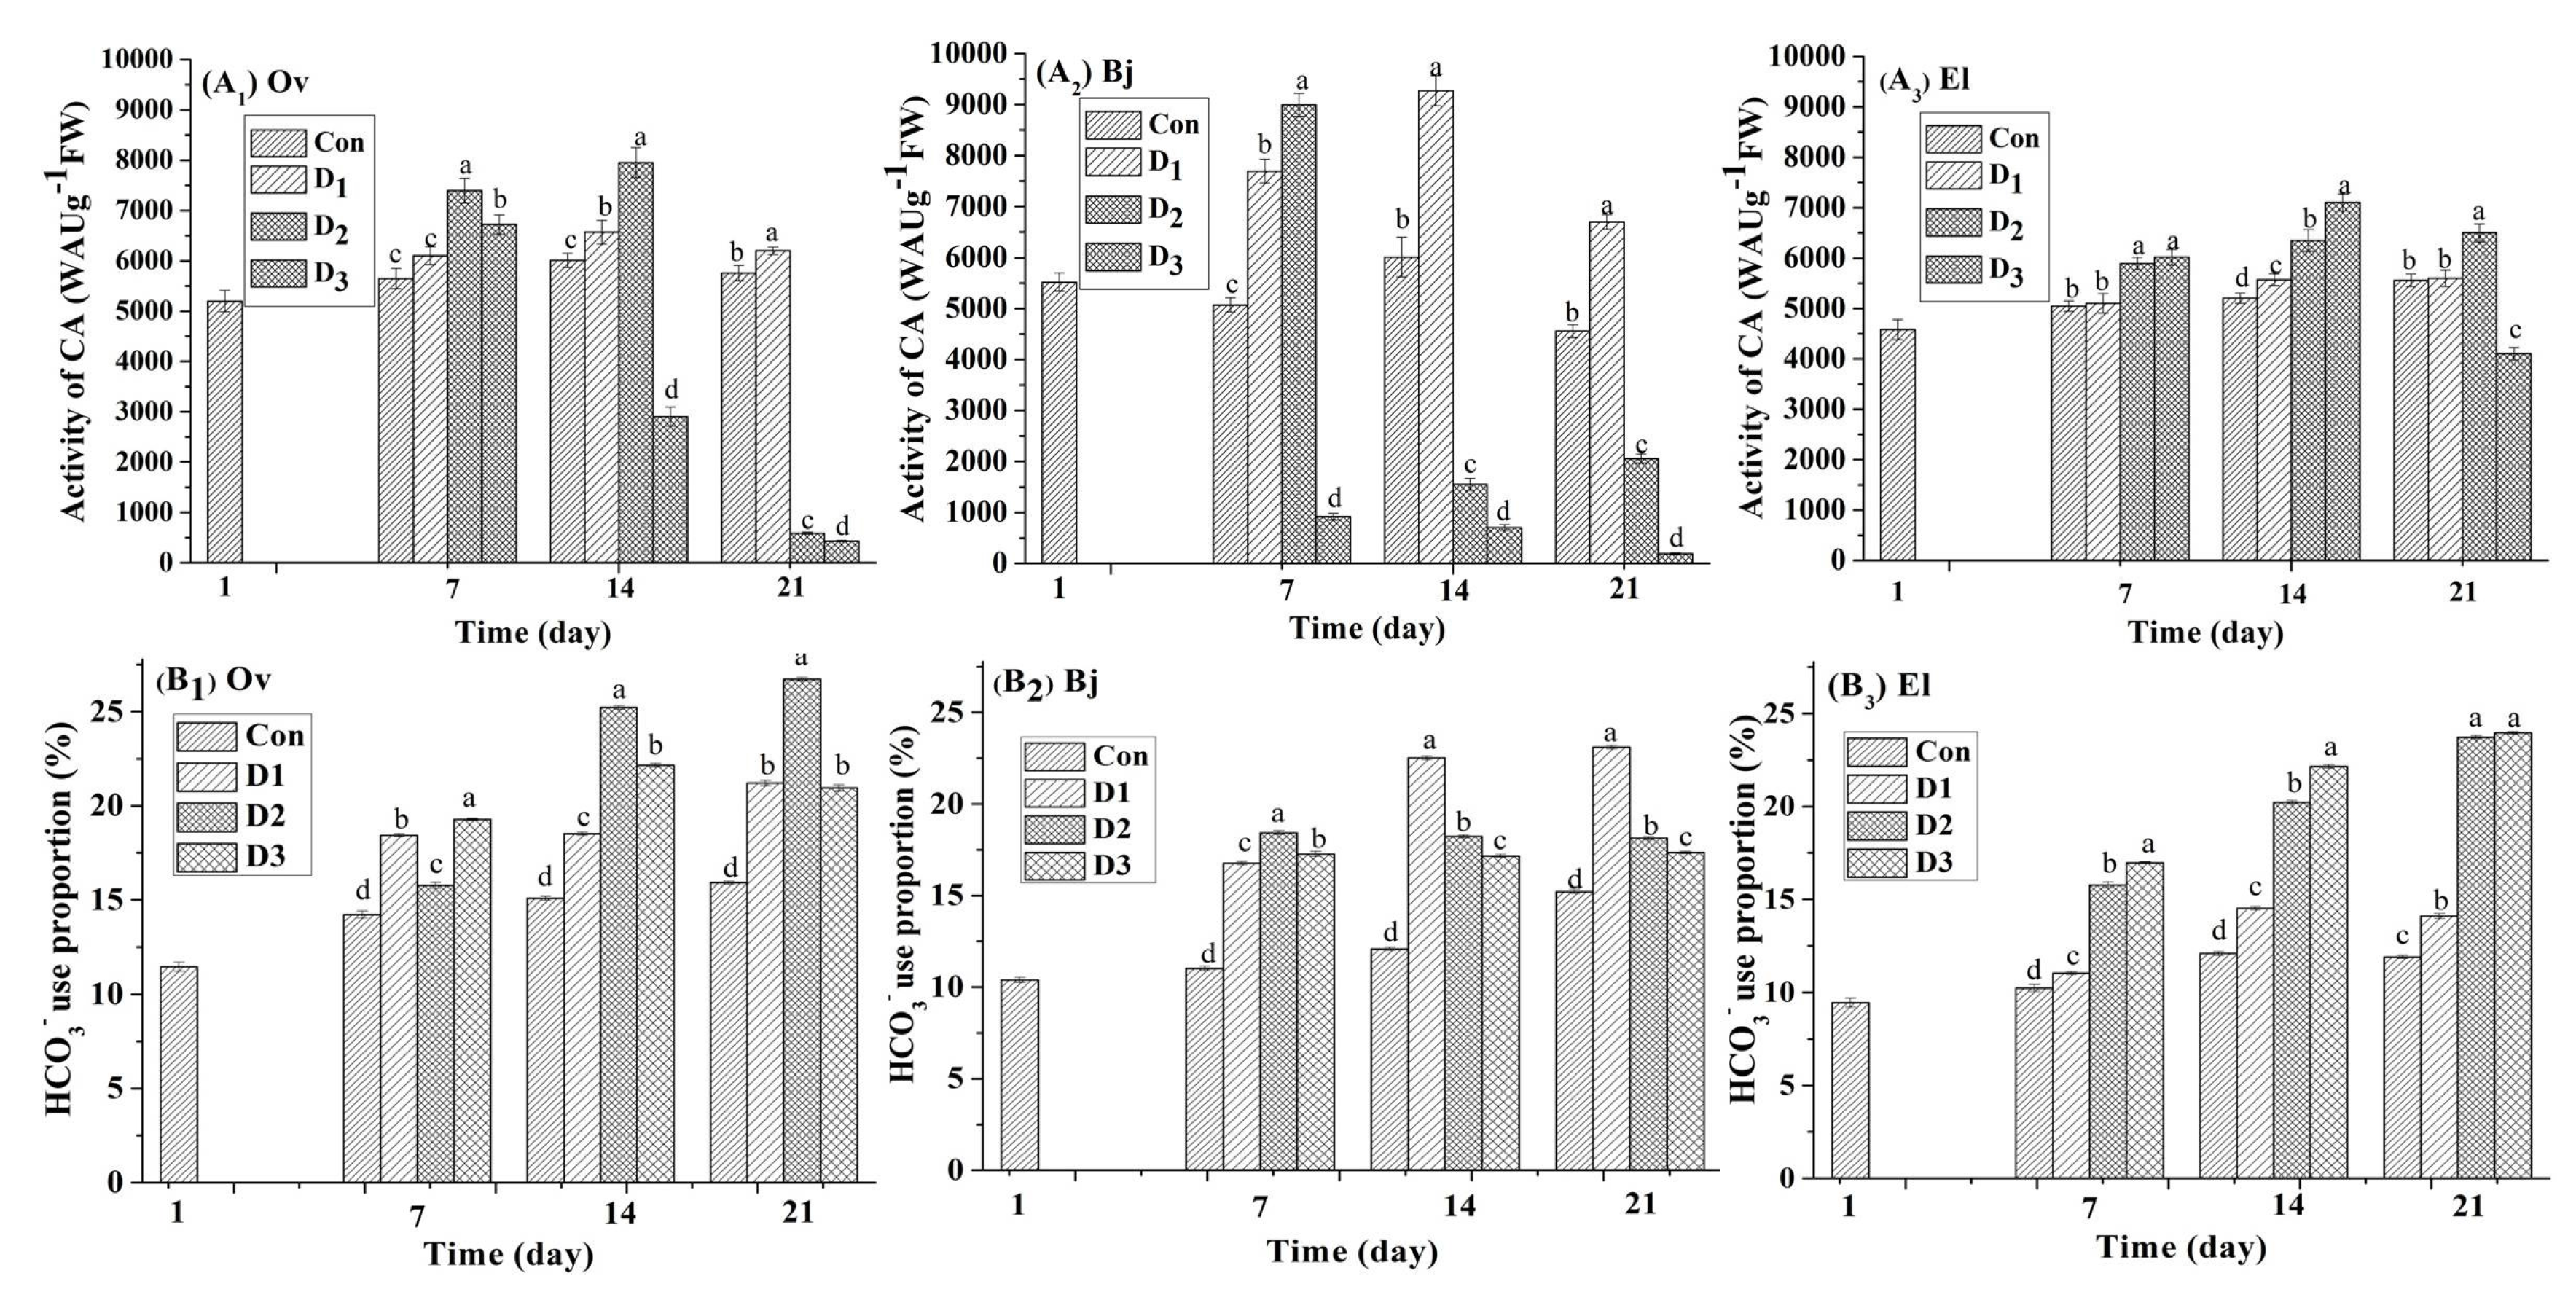
3.4. CA Activity and Proportion of Bicarbonate Use

Carbonic anhydrases are key regulatory and detoxifying enzymes for plants that are upstream regulators of CO2-controlled stomatal movements and are also an important tool for plants to assimilate HCO3 [12,14]. In this experiment, the CA activity profile of the three species was assayed at seven-day intervals during the drought stress phase. Drought stress clearly modulated the CA activity of the three energy plants (Figure 3). On day 1, the CA activity of the three plant species was in the range of 4580 WAU g−1 (FW)–5520 WAU g−1 (FW), and Bj had the highest CA activity at 5520.07 WAU g−1 (FW) ± 178.29 WAU g−1 (FW). On day seven, CA activity increased in all cultures under drought stress, with the exception of that of Bj in the D3 treatment. In sharp contrast to the control, CA activity was 8994 WAU g−1 (FW) ± 195 WAU g−1 (FW) for Bj in the D2 treatment, which was an increase of 38.62%, whereas the increase was 30.88% and 16.73% for Ov and El, respectively. However, CA activity was inhibited when Ov and Bj suffered from severe stress (D3); for example, the CA activity of Bj decreased 81.83% in the D3 treatment compared to the control. As the experiment continued, the CA activity for each of the three plant species was different in response to continuous stress. For example, the CA activity of Ov on day 14 was 6012 WAU g−1 (FW) ± 139 WAU g−1 (FW) (control), 6570 WAU g−1 (FW) ± 235 WAU g−1 (FW) (D1), 7950 WAU g−1 (FW) ± 297 WAU g−1 (FW) (D2), and 2904 WAU g−1 (FW) ± 190 WAU g−1 (FW) (D3). However, at the end of the stress phase on day 21, only the CA activity of the D1 treatment was higher than that of the control at 6201 WAU g−1 (FW) ± 75 WAU g−1 (FW) vs. 5760 WAU g−1 (FW) ± 151 WAU g−1 (FW), with the other two treatments, D2 and D3, showing a decrease in activity. When combined with the results for MDA content (Figure 1), we attributed the inhibition of activity to oxidative damage to plant cells from drought stress. Notably, the CA activity of El leaves in all treatments was higher than that in controls, with the exception of the leaves from the D3 treatment on day 21.
To investigate the capacity of the three energy plants for bicarbonate use, a stable isotope technique was used. The δ13C values of the leaves from the three species were determined regularly during the stress phase, and are listed in the Table A3. We observed that the δ13C values of the leaves showed a difference under different levels of drought. Then, the proportion of bicarbonate use by the three energy plants from all treatments was calculated using Equation (3), with the results shown in Figure 3. After the 180-day growth phase, the proportion of bicarbonate use in leaves of the three species was different: 11.45% for Ov, 10.39% for Bj, and 9.44% for El. After a 21-day drought stress phase, the highest proportion of bicarbonate use was reached for each species: 26.72% for Ov in D3, 22.10% for Bj in D2, and 26.95% for El in D3. Based on these results, under continuous drought stress, the accumulation of inorganic carbon derived from bicarbonate increased compared to the controls. Notably, El showed the highest capacity for bicarbonate use compared to Ov and Bj.
In this study, several distinct phenomena were observed. (1) MDA content (μmol/kg FW) in the leaves of the three species increased with the severity of stress and with time during the stress phase (Figure 1), which indicated that cell damage increased in the leaves of these three species with the increase in drought stress. (2) drought-induced stomatal closure in the three plants led to the inhibition of photosynthesis (Figure 2). (3) With the inhibition of photosynthesis, biomass production was effected, particularly that of seed production (Table 1), and compared to the respective controls, the decrease in seed production in descending order was Bj, Ov, and El. Additionally, the acid value and the degree of saturation of seed oils increased with the severity of drought stress. (4) CA activity of the leaves of the three species was clearly affected by drought stress, but the activity increased under drought stress, compared to the controls (Figure 3). (5) The bicarbonate use capacity of the three species was also different, and the highest proportion of bicarbonat use for Ov, Bj, and El occurred in those treatments with the highest CA activity for that species.
When these phenomena were examined collectively, most notably, the decreases were disproportionate for photosynthesis (Pn and Gs) and biomass production. In sharp contrast to the respective controls on day 21, the Pn values of Bj in the D2 and D3 treatments decreased by 98.97% and 99.41% (Figure 1 and Table 1), with decreases in seed production of 71.97% and 79.31%, respectively. For Ov with the same treatments, the decreases were 96.23% and 99.12% for Pn, and 25.20% and 50.50% for seed production, respectively; and for El, the decreases were 89.49% and 94.67% for Pn, and 13.48% and 38.80% for seed production, respectively. Both Bj and Ov are members of the Brassicaceae, and although the decrease in Pn was approximately similar in the D2 and D3 treatments, the decreases in seed production were significantly different compared to the respective controls. We hypothesized that this result could be explained, at least in part, by the high CA activity of Ov and Bj under drought stress compared to the respective controls. For example, the CA activity of Bj in the D2 treatment gradually decreased from day 7 to 21 and was lower than that in the control from day 14, indicating no further capacity to regulate photosynthesis. However, the CA activity of Ov in the D2 treatment was higher than that in the control on days 7 and 14 and decreased gradually after day 14. Combined with a high proportion of bicarbonate use at 22.10% (Figure 3), the primary conclusion was that, with the regulation and catalytic activity of CA, the conversion of bicarbonate in the substrate into biomass increased. Thus, the decrease in Ov seed production was lower than that of Bj at the same stress level. Similarly, compared to the controls, the CA activity of Bj in the D1 treatment and El in the three drought stress treatments were maintained at a higher level, with the exception of El in the D3 treatment on day 21. The leaves of Bj in the D1 and El in the D3 treatment had higher proportion of bicarbonate use at the end of the drought stress compared to Ov, reaching 26.72% and 26.95%. Moreover, the lowest decrease in seed production under drought stress occurred with El (Table 1). In summary, through the regulation and catalytic activity of CA, the three species of biofuel energy plants could continue to produce biomass from atmospheric CO2, but when under drought stress, alternatively, could do the same with bicarbonate. Additionally, the capacity for bicarbonate use of the three species was proportional to the CA activity under simulated drought stress in karst soil. Here, the present work just establishes the relationship between CA activity and bicarbonate-use capacity of the three energy plants. The mechanism and pathway for bicarbonate use in plants in karst habitats are not fully understood. We continue research by means of molecular biological technique in the future.

4. Conclusions

In karst habitats, high soil concentrations of bicarbonate are almost universally an adverse factor for the growth of plants. Drought is another stress factor for plants in the karst region of Southwestern China. In this study, three species of biofuel energy plants, Orychophragmus violaceus L. (Ov), Brassica juncea L. (Bj), and Euphorbia lathyris L. (El), were grown in soil simulating a karst habitat. As a result of integrating plant physiological and stable isotope techniques, the following results were obtained: (1) as a new carbon resource for biomass production, the use of bicarbonate in karst limestone soil was directly confirmed; (2) photosynthesis of the three plants was inhibited by drought stress, but the activity of CA increased; thus, the three energy plants could continue photosynthesis for biomass production with the alternate use of atmospheric CO2 and bicarbonate through the regulation and catalysis of CA; and (3) the capacity for bicarbonate use of the three energy plants was proportional to the activity of CA. Among the three species, the highest bicarbonate use proportion was reached by El, and given the high CA activity, the bicarbonate use proportion reached 26.95% under severe drought stress. To our knowledge, few studies have focused on the contribution of this carbon resource in karst soils toward biomass production or on the mechanism for this use. Additionally, a new method is proposed for the screening of energy plants for use in karst soils. It is worth considering that the adapted plants with high carbonic anhydrase activity and high bicarbonate-use capacity were used for energy plants in karst soils.

Appendix

Table A1. Fatty acid composition (FAC) of three energy plant species oil samples.
FAC (wt %)Palmitic (C16:0)Palmitoleic (C16:1)Stearic (C18:0)Oleic (C18:1)Linoleic (C18:2)Linolenic (C18:3)Gadoleic (C20:1)Erucic (C22:1)
Plants/Treatment
OvCon13.270.639.8222.4742.584.263.793.79
D113.220.659.7922.4141.914.274.624.62
D214.370.2311.5325.2340.432.123.943.95
D315.110.3713.7727.9433.940.994.514.51
BjCon5.952.023.0129.1720.4111.919.119.11
D16.702.492.9228.8921.1310.5410.0110.01
D26.922.912.6131.7715.197.4311.9711.97
D3- a- a- a- a- a- a- a- a
ElCon5.111.792.1779.583.832.371.731.73
D15.091.782.0280.512.592.490.941.74
D27.411.793.5179.133.411.311.451.45
D39.660.635.1982.791.020.881.631.63
a Not detected because the seed sample of Bj under D3 was too small.
Table A2. Effect of different levels (Con: 25% moisture, D1: 17% moisture, D2: 14% moisture, and D3: 11% moisture) of drought stress on the fatty acid composition and fuel properties of the oil samples from the three plant species.
FAC (wt %)Saturation (Cn:0)Mono-Unsaturation (Cn:1)Poly-Unsaturation (Cn:2,3)Degree of Unsaturation aCNHHV MJ/kgKV mm2/s; 40 °C
Plants/Treatment
OvCon23.0928.5646.84122.2449.5339.194.08
D123.0129.2746.18121.6350.7539.184.07
D225.930.0842.55115.1853.7539.214.13
D328.8834.7533.53101.8154.0839.264.18
BjCon8.9656.7732.32121.4149.2439.234.34
D19.6257.1131.67120.4550.8139.364.36
D29.5366.4422.62107.6850.1239.524.56
D3- b- b- b- b- b- b- b
ElCon7.2883.896.296.2959.1738.824.28
D17.1184.145.0894.360.2038.414.22
D210.9282.764.7292.258.6839.244.38
D314.8585.741.989.5460.0640.874.71
a Calculated according to the report of Romas et al.; b Not detected because the seed sample of Bj under D3 was too small.
Table A3. Effect of different levels (Con: 25% moisture, D1: 17% moisture, D2: 14% moisture, and D3: 11% moisture) of drought stress on the δ13C values for three plant species.
Indexesδ13C Values (‰)
Plants/Label Day 1Day 7Day 14Day 21
−27.28−18.81−27.28−18.81−27.28−18.81−27.28−18.81
OvCon−30.74 ± 1.47−29.77 ± 1.2830.53 ± 1.3229.32 ± 1.3230.88 ± 1.0529.60 ± 1.2830.99 ± 1.03−29.642 ± 1.08
D130.44 ± 1.2528.87 ± 1.1130.87 ± 1.5229.31 ± 1.0630.95 ± 0.89−29.15 ± 1.05
D229.68 ± 1.1328.34 ± 1.2830.60 ± 1.4028.46 ± 0.6730.80 ± 1.12−28.54 ± 1.00
D329.55 ± 1.4527.92 ± 1.0530.22 ± 1.2728.34 ± 0.8930.45 ± 1.23−28.68 ± 0.78
BjCon−33.57 ± 1.61−32.69 ± 1.5533.37 ± 1.6032.44 ± 1.3033.54 ± 1.0032.52 ± 0.8933.87 ± 1.54−32.58 ± 0.98
D132.68 ± 1.2931.26 ± 1.4332.78 ± 1.0332.87 ± 1.1532.90 ± 1.28−30.94 ± 1.04
D233.19 ± 1.5631.63 ± 1.6733.35 ± 0.9931.81 ± 0.7733.56 ± 1.11−32.03 ± 0.99
D332.93 ± 1.3431.47 ± 0.9933.18 ± 1.2331.73 ± 1.3533.43 ± 1.52−31.96 ± 1.30
ElCon−31.38 ± 1.52−30.58 ± 1.4031.58 ± 1.0730.72 ± 1.1031.76 ± 1.3730.51 ± 1.1431.77 ± 1.34−30.76 ± 0.96
D131.41 ± 1.6530.47 ± 1.2331.51 ± 1.4230.28 ± 1.0831.67 ± 1.22−30.47 ± 1.27
D231.22 ± 1.6629.88 ± 1.3031.30 ± 1.5029.59 ± 0.8931.44 ± 1.45−29.45 ± 0.94
D331.01 ± 1.2929.57 ± 1.1429.59 ± 1.03−29.23 ± 0.96−31.21 ± 1.03−29.18 ± 0.97

Acknowledgments

Authors acknowledge the grant of the National Natural Science Foundation of China (No. 41201577), the National Natural Science Foundation of China (No. 31302143), and the Postdoctoral Science Foundation of China (No. 2012M521720).

Author Contributions

Rui Wang designed and performed the experiments, and wrote the paper; Yanyou Wu designed the experiments and analyzed the data; Deke Xing, Hongtao Hang, Kaiyan Zhang, and Sen Rao performed the experiments; Xiaolin Xie and Xiuqun Yang contributed reagents/materials/analysis tools.

Conflicts of Interest

The authors declare no conflict of interest.

Nomenclature

CACarbonic anhydrase
OvOrychophragmus violaceus L.
BjBrassica juncea L.
ElEuphorbia lathyris L.
CNCetane number
HHVHigher heating value
KVKinematic viscosity
FACFatty acid composition

References

  1. Gelfand, I.; Sahajpal, R.; Zhang, X.; Izaurralde, R.C.; Gross, K.L.; Robertson, G.P. Sustainable bioenergy production from marginal lands in the US Midwest. Nature 2013, 493, 514–517. [Google Scholar] [CrossRef] [PubMed]
  2. Nitsche, M.; Hensgen, F.; Wachendorf, M. Using Grass Cuttings from Sports Fields for Anaerobic Digestion and Combustion. Energies 2017, 10, 388–399. [Google Scholar] [CrossRef]
  3. Cotana, F.; Cavalaglio, G.; Coccia, V.; Petrozzi, A. Energy Opportunities from Lignocellulosic Biomass for a Biorefinery Case Study. Energies 2016, 9, 748–758. [Google Scholar] [CrossRef]
  4. Roy, P.; Dutta, A.; Deen, B. An approach to identify the suitable plant location for Miscanthus-based ethanol industry: A case study in Ontario, Canada. Energies 2015, 8, 9266–9281. [Google Scholar] [CrossRef]
  5. Stehr, M.O. Sustainability assessment of a self-consumption wood-energy chain on small scale for heat generation in central Italy. Energies 2015, 8, 5182–5197. [Google Scholar]
  6. Zhao, L.L.; Zhang, X.L.; Xu, J.; Ou, X.; Chang, S.; Wu, M. Techno-economic analysis of bioethanol production from lignocellulosic biomass in China: Dilute-acid pretreatment and enzymatic hydrolysis of corn stover. Energies 2015, 8, 4096–4117. [Google Scholar] [CrossRef]
  7. Tang, Y.; Xie, J.S.; Geng, S. Marginal land-based biomass energy production in China. J. Integr. Plant Biol. 2010, 52, 112–121. [Google Scholar] [CrossRef] [PubMed]
  8. Zhuang, D.; Jiang, D.; Liu, L.; Huang, Y. Assessment of bioenergy potential on marginal land in China. Renew. Sustain. Energy Rev. 2011, 15, 1050–1056. [Google Scholar] [CrossRef]
  9. Liu, C.Q. Biogeochemical Processes and the Surface Material Cycle: The Cycles of Biogenic Elements of Soil–Vegetation System in the Southwestern Karst China; Science Press: Beijing, China, 2009. [Google Scholar]
  10. Yan, J.; Li, J.; Ye, Q.; Li, K. Concentrations and exports of solutes from surface runoff in Houzhai Karst Basin, southwest China. Chem. Geol. 2012, 304, 1–9. [Google Scholar] [CrossRef]
  11. Wu, Y.Y.; Xing, D.K. Effect of bicarbonate treatment on photosynthetic assimilation of inorganic carbon in two plant species of Moraceae. Photosynthetica 2012, 50, 587–594. [Google Scholar] [CrossRef]
  12. Pancha, I.; Chokshi, K.; Ghosh, T.; Paliwal, C.; Maurya, R.; Mishra, S. Bicarbonate supplementation enhanced biofuel production potential as well as nutritional stress mitigation in the microalgae Scenedesmus sp. CCNM 1077. Bioresour. Technol. 2015, 193, 315–323. [Google Scholar] [CrossRef] [PubMed]
  13. Hu, H.; Boisson-Dernier, A.; Israelsson-Nordstrom, M.; Bohmer, M.; Xue, S.; Ries, A.; Godoski, J.; Kuhn, J.M.; Schroeder, J.I. Carbonic anhydrases are upstream regulators of CO2-controlled stomatal movements in guard cells. Nat. Cell Biol. 2010, 12, 87–93. [Google Scholar] [CrossRef] [PubMed]
  14. Müller, W.G.; Qiang, L.; Schröder, H.; Hönig, N.; Yuan, D.; Grebenjuk, V.; Mussino, F.; Giovine, M.; Wang, X. Carbonic anhydrase: A key regulatory and detoxifying enzyme for Karst plants. Planta 2014, 239, 213–229. [Google Scholar] [CrossRef] [PubMed]
  15. Perez-Martin, A.; Michelazzo, C.; Torres-Ruiz, J.M.; Flexas, J.; Fernandez, J.E.; Sebastiani, L.; Diaz-Espejo, A. Regulation of photosynthesis and stomatal and mesophyll conductance under water stress and recovery in olive trees: Correlation with gene expression of carbonic anhydrase and aquaporins. J. Exp. Bot. 2014, 65, 3143–3156. [Google Scholar] [CrossRef] [PubMed]
  16. Ramanan, R.; Kannan, K.; Deshkar, A.; Yadav, R.; Chakrabarti, T. Enhanced algal CO2 sequestration through calcite deposition by Chlorella sp. and Spirulina platensis in a mini-raceway pond. Bioresour. Technol. 2010, 101, 2616–2622. [Google Scholar] [CrossRef] [PubMed]
  17. Gu, J.-F.; Qiu, M.; Yang, J.-C. Enhanced tolerance to drought in transgenic rice plants overexpressing C4 photosynthesis enzymes. Crop J. 2013, 1, 105–114. [Google Scholar] [CrossRef]
  18. Jiang, C.; Tholen, D.; Xu, J.; Xin, C.; Zhang, H.; Zhu, X.; Zhao, Y. Increased expression of mitochondria-localized carbonic anhydrase activity resulted in an increased biomass accumulation in Arabidopsis thaliana. J. Plant Biol. 2014, 57, 366–374. [Google Scholar] [CrossRef]
  19. Xie, T.; Wu, Y. The role of microalgae and their carbonic anhydrase on the biological dissolution of limestone. Environ. Earth Sci. 2014, 71, 5231–5239. [Google Scholar] [CrossRef]
  20. Swarnalatha, G.V.; Hegde, N.S.; Chauhan, V.S.; Sarada, R. The effect of carbon dioxide rich environment on carbonic anhydrase activity, growth and metabolite production in indigenous freshwater microalgae. Algal Res. 2015, 9, 151–159. [Google Scholar] [CrossRef]
  21. Wu, Y.; Xing, D.; Liu, Y. The characteristics of bicarbonate used by plants. Earth Environ. 2011, 39, 273–277. [Google Scholar]
  22. Motomura, H.; Ueno, O.; Kagawa, A.; Yukawa, T. Carbon isotope ratios and the variation in the diurnal pattern of malate accumulation in aerial roots of CAM species of Phalaenopsis (Orchidaceae). Photosynthetica 2008, 46, 531–536. [Google Scholar] [CrossRef]
  23. Zuo, Y.; Ren, L.; Zhang, F.; Jiang, R.F. Bicarbonate concentration as affected by soil water content controls iron nutrition of peanut plants in a calcareous soil. Plant Physiol. Biochem. 2007, 45, 357–364. [Google Scholar] [CrossRef] [PubMed]
  24. Mir, B.A.; Mir, S.A.; Khazir, J.; Tonfack, L.B.; Cowan, D.A.; Vyas, D.; Koul, S. Cold stress affects antioxidative response and accumulation of medicinally important withanolides in Withania somnifera (L.) Dunal. Ind. Crops Prod. 2015, 74, 1008–1016. [Google Scholar] [CrossRef]
  25. Wang, R.; Hanna, M.A.; Zhou, W.-W.; Bhadury, P.S.; Chen, Q.; Song, B.-A.; Yang, S. Production and selected fuel properties of biodiesel from promising non-edible oils: Euphorbia lathyris L., Sapium sebiferum L. and Jatropha curcas L. Bioresour. Technol. 2011, 102, 1194–1199. [Google Scholar] [CrossRef] [PubMed]
  26. Ramírez-Verduzco, L.F.; Rodríguez-Rodríguez, J.E.; del Jaramillo-Jacob, A.R. Predicting cetane number, kinematic viscosity, density and higher heating value of biodiesel from its fatty acid methyl ester composition. Fuel 2012, 91, 102–111. [Google Scholar] [CrossRef]
  27. Ramos, M.J.; Fernández, C.M.; Casas, A.; Rodríguez, L.; Pérez, Á. Influence of fatty acid composition of raw materials on biodiesel properties. Bioresour. Technol. 2009, 100, 261–268. [Google Scholar] [CrossRef] [PubMed]
  28. Pinzi, S.; Garcia, I.; Lopez-Gimenez, F.; Luque de Castro, M.; Dorado, G.; Dorado, M. The ideal vegetable oil-based biodiesel composition: A review of social, economical and technical implications. Energy Fuels 2009, 23, 2325–2341. [Google Scholar] [CrossRef]
Figure 1. Effect of different levels (Con: 25% moisture, D1: 17% moisture, D2: 14% moisture, and D3: 11% moisture) of drought stress on MDA content (μmol/kg FW) in the leaves of three plant species. The different letters above the bars represent significant differences among treatments on the same day (p < 0.05). (A) Orychophragmus violaceus L. (Ov); (B) Brassica juncea L. (Bj); (C) Euphorbia lathyris L. (El).
Energies 10 01370 g001
Figure 2. Effect of different levels (Con: 25% moisture, D1: 17% moisture, D2: 14% moisture, and D3: 11% moisture) of drought stress on Pn (net photosynthetic rate, (μmol·m2·s−1)) and Gs (stomatal conductance (Gs (mmol·m2·s−1)) in the leaves of the three plant species. The different letters above the bars represent significant differences among treatments on the same day (p < 0.05). (AC): Gs of Orychophragmus violaceus L. (Ov); Brassica juncea L. (Bj); and Euphorbia lathyris L. (El); (DF): Pn of Orychophragmus violaceus L. (Ov); Brassica juncea L. (Bj); and Euphorbia lathyris L. (El).
Energies 10 01370 g002
Figure 3. Effect of different levels (Con: 25% moisture, D1: 17% moisture, D2: 14% moisture, and D3: 11% moisture) of drought stress on CA activity (WAU g−1 (FW)) and proportion of HCO3 use in the leaves of three plant species. Different letters above the bars represent significant differences amongst treatments on the same day (p < 0.05). (A1A3) CA activity (WAU g−1 (FW)) of Orychophragmus violaceus L. (Ov), Brassica juncea L., and Euphorbia lathyris L. (EL); (B1B3) HCO3 use proportion of Orychophragmus violaceus L. (Ov), Brassica juncea L., and Euphorbia lathyris L. (EL).
Energies 10 01370 g003
Table 1. Effect of different levels (Con: 25% moisture, D1: 17% moisture, D2: 14% moisture, and D3: 11% moisture) of drought stress on the biomass production of three plant species. Different letters indicate a significant difference between treatments of the same plant (p < 0.05) and different lowercase letters in the same row denote significant differences among four drought treatments (p < 0.05).
IndexesDry Biomass Productivity (g)Oil Content (wt %)Acid Value (mg KOH/g)
Plants/Treatment SeedRoot/Stem/LeafTotal BiomassAverage Total Biomass Under Stress
OvCon8.93113.28122.21111.3830.17 ± 2.21a4.02 ± 0.09d
D17.27111.08118.3529.17 ± 1.34a4.61 ± 0.10c
D26.68103.54110.2222.35 ± 1.41b5.02 ± 0.07b
D34.42101.15105.5716.79 ± 0.73c7.41 ± 0.11a
BjCon11.31135.12146.43127.5531.42 ± 1.93a5.07 ± 0.14d
D16.22131.51137.7326.27 ± 1.58b5.74 ± 0.12c
D23.17125.47128.6413.46 ± 0.83c7.07 ± 0.07b
D32.34113.93116.2710.17 ± 1.83c9.17 ± 0.19a
ElCon10.9076.8886.2981.6529.83 ± 1.33a14.11 ± 0.13c
D19.5973.1484.1829.13 ± 1.51a13.90 ± 0.22c
D29.4374.7582.7328.83 ± 1.19a15.29 ± 0.21b
D36.6771.3878.0522.83 ± 2.07c16.11 ± 0.08a

