Abstract
Climate change could pose a significant threat to the energy sector in various countries. The objective of this study is to analyze the long-term impact of changes in precipitation and water availability on hydroelectric production. To do so, the study focuses on three hydroelectric power plants in Southern Spain combining climatological, technical and economic data and projections. A physical model has been designed that reproduces the plants’ operations and incorporates various scenarios for the evolution of contributions to the basin. The results predict a 10 to 49% drop in production by the end of the century, depending on the plant and scenario. This decrease in production, in accordance with our economic and operational hypotheses, would significantly affect the operating margins of the facilities and, in certain scenarios, could reach an economically unsustainable level by the end of the century. An investment analysis has been carried out as well, showing that climate change may jeopardize future investments in similar facilities.
1. Introduction
The energy sector is responsible for two-thirds of anthropogenic greenhouse gas emissions globally [1] and, therefore, is a very relevant contributor to climate change. At the same time, the impacts associated with this phenomenon may jeopardize the existence of a secure energy supply [2].
Within the sector, electricity generation may be impacted by, among other factors, rising global temperatures, changes in the frequency and intensity of extreme weather events, changes in air temperature, and most notably, changes in rainfall patterns. These impacts will have repercussions throughout the sector’s value chain, including the provision of raw materials, energy generation itself, and supply and distribution, and will occur in one form or another in nearly all energy generation technologies [3,4,5].
Despite the extent and importance of these effects, the sector has limited coverage in the principal studies developed in the field, as well as in the deployment of investments and adaptive measures [6]. Nevertheless, papers are beginning to emerge that offer an overview of the potential impacts on electricity generation technologies or in different geographic areas [7,8,9]. However, there is less available literature that presents a detailed analysis of specific projects or plants, or that analyzes the economic implications of climate change or how it can influence new investments in the sector [10]. A multidisciplinary approach is necessary so that economic, physical and regulatory issues are considered together.
In the case of hydroelectric power, apart from the sector’s overall vulnerability, the impacts on its primary resource, water, must be taken into account. By its very nature, hydroelectricity is sensitive to variations of this resource, both in terms of average rainfall patterns and relative changes in frequency and intensity [11]. In view of the existing literature, it is estimated that there will be significant local variations in hydroelectric generation, with greater generation in high latitudes and humid tropic regions, and less in middle latitudes and dry tropic regions [12]. According to available information, these variations will be compensated on a global level, with no large fluctuations expected in the technology’s total energy generation as a consequence of climate change by 2050 [12,13].
The south of Europe, Spain in particular, are among the regions that can expect a more significant decrease in the resource. According to the Intergovernmental Panel on Climate Change [14], runoff can decrease by 6 to 36% up to the 2070s compared to the period 1961–1990. In this regard, the Spanish government’s National Climate Change Adaptation Plan [15] and its successive working programs include industry, energy and water resources among the vulnerable sectors.
The objective of this study is to combine physical, technical and economic information to analyze to what extent a decrease in average rainfall and changes in temperature, as a consequence of climate change, could affect the long-term profit margins and operations of a hydroelectric plant. Therefore, the aim is to provide a multidisciplinary analysis combining climate data, technical calculations for electricity production and an economic assessment of the implications for utilities, energy planners and policy makers. The analysis has benefited greatly from greatly from the collaboration of several departments within the company that operates the power plants.
Accordingly, this paper is structured as follows: the next section gives a description of the plants and an overview of the methodological basis and the model. Section 3 presents the key assumptions of the projection and summarizes the most important results in terms of future production. Section 4 analyzes the economic implications of the projections, in terms of profitability and investments. Section 5 provides some insights on the discussion of the results in the context of climate change policy. The paper closes with some concluding remarks.
2. Methodology
2.1. Description of the Plants
Over the years, the company ENDESA (Madrid, Spain) has worked to better evaluate its vulnerability to climate change. In 2012, it conducted a broad study, internally and confidentially, that analyzed the vulnerability of its power plants worldwide, which included all utilized technologies. As a result of this top-down assessment, several businesses and countries were identified as hot spots for further analysis, including hydroelectric generation in Spain.
In 2014, as part of the Adapta initiative, coordinated by the Spanish Office of Climate Change, a multi-criteria study was conducted of three hydroelectric power plants. In that study, different climate impacts were considered and evaluated. In conclusion, the most relevant impacts identified were a rise in temperature, a decrease in rainfall, and the intensification of extreme rainfall events [16].
The same plants have been selected for this study, as their varied characteristics provide a good example of how climate change may impact each distinct type of plant. The most significant characteristics are outlined in Table 1.

Table 1.
Characteristics of the analyzed plants. Source: ENDESA.
The first two plants have considerably less operational flexibility in their management. Mengíbar, as a run-of-river plant, has hardly any water storage capacity and, when flow is high, it is forced to spill water without utilizing it. Cala, on the other hand, has a storage reservoir of limited capacity and is therefore forced to periodically release water so as not to exceed the hazard curve. Finally, Tranco de Beas has a greater storage capacity, in fact, it is considered unlimited in modeling, and manages water contributions to the basin over the course of several years, with the objective of optimizing energy production. However, the holder of the plant, the Guadalquivir Water Confederation, establishes strict limits on water usage during shortages.
All the plants are situated on different locations along the Guadalquivir River Basin, as shown in Figure 1. The Guadalquivir is one of the longest rivers in the Iberian Peninsula. Tranco de Beas, the largest plant, is located near the river source in the province of Jaen. Mengíbar, the run-of-river plant, is located near the middle course of the Guadalquivir in the same province. Cala is located along the course of Rivera de Cala, a tributary of the main river, in the province of Seville. All the plants have higher runoff in winter (ranging between 58% and 37% of the annual runoff) with Mengíbar showing less reductions during the summer.
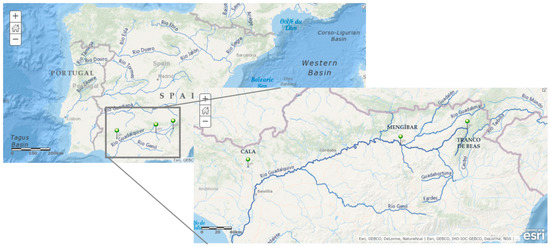
Figure 1.
Location of the three plants along the Guadalquivir Basin.
The company has provided information on daily water flow, rainfall, and monthly electricity production. While this varies by plant, the information is only considered complete since the end of the 1960’s. The SAIH (Automatic Hydrologic Data Collection System, of the Ministry of Agriculture, Food and Environmental Affairs) offers detailed information on many parameters for each location, but only since the year 2000. The historical information is considered adequate and consistent, and no adjustments have been made to it.
2.2. The Physical Model
A model (the Hydroclim model) has been constructed to evaluate the impact on the three hydroelectric power plants operated by the company ENDESA, as described in the previous subsection. Historical data have been collected from both the company as well as public sources. Said data have been used to reproduce the operations of each plant with the model, calibrating it to offer the most accurate results possible. The methodology is explained below.
The model was subsequently used to better understand the impact of the projected evolution of water resources on the plants, based on studies carried out by the Public Administration in Spain. Separately, an economic model has been created to determine to what extent changes in production may impact the plants, both in terms of operating margins and investment.
A ceteris paribus approach has been used, in which unitary costs and electricity prices are constant over time. Likewise, it has been assumed that the physical characteristics of the plants have not changed, nor have they taken any adaptive measures, apart from those stemming from their current operating systems.
The reason for this approach, bearing in mind the broad time range of the projections (2011–2100), is to avoid distortion in the analysis, derived from assumptions on future electricity market prices, or the evolution of costs. Similarly, by placing the analysis in operational margins, the impact of discount rates is avoided over such a long period. However, a discount rate has been considered in the investment analysis.
Simulations have been carried out through the model, developed specifically for this purpose. The model reproduces the physical operations of hydroelectric power plants, and is able to generate production outputs from daily flow data. A regression analysis between runoff and production for the same purpose (such as the one conducted in [8]) was conducted also but an engineering approach provided more accurate results, specifically in the plants with bigger reservoirs. This approach is also closer to the actual operation of the plants and to the decision making procedures in the sector.
This model takes into account the distinct characteristics of each plant, through a series of elements:
- Physical parameters, such as the storage capacity of a reservoir, if any, or the plant’s net head.
- Technical parameters, like the turbine power and discharge and efficiency factors.
- Operational elements such as the operating regime and external constraints.
The model can therefore be used for both storage and run-of-river plants, and accommodates daily, annual, and multiyear balancing regimes. Additionally, through external constraints, further limitations may be included. In the case of the pilot plants, the limitations are related to usage restrictions due to the need to store water for future agricultural use. Figure 2 provides a schematic description of the model.
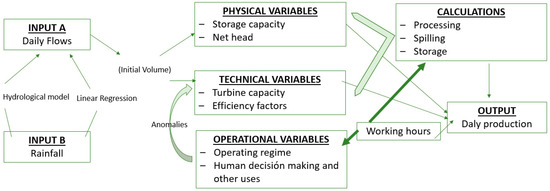
Figure 2.
Operation of HydroClim Physical Model.
From daily runoff data, the model calculates the daily flow that runs the turbines, spilling (water discharged directly into the river bed, and therefore not exploited), cumulative flow, and operating hours.
Daily production is calculated using the following formula [13,17]:
where:
- (specific weight of water).
- Tt is the average daily operation time (in hours) in day t.
- Hn is the plant’s net head (in m).
- QTt is the flow that runs the turbines in day t (in m3/s).
- ef is the plant’s aggregate efficiency factor, which always takes a value between 0 and 1.
- μ refers to contingencies. As the goal of the study is to provide future projections that are consistent with the historical performance of the plants, this parameter as well as the efficiency factor have been calculated for each plant and are considered together and assumed to remain constant in the future.
The variable Tt is obtained in the following way:
For each plant, the following data are known:
- which is the historic average flow to the plant (in m3/s).
- where is the average flow to the plant in day (in m3/s), and is the number of days.
- which is the historic average of operating hours per day.
In the model, it is assumed that in day with the constraint that .
Therefore:
The variable is obtained in the following way:
For a given plant the following parameters are defined:
- Minimum volume of stored water required to run the turbines (in m3).
- Maximum turbine capacity in the plant (in m3/s).
- Maximum storage capacity of the reservoir (in m3).
Let be the initial volume of water stored in the plant (in m3), at the beginning of day t.
- If
- If then:
If
If
The initial volume of water stored in the plant (in m3) at the beginning of each day must be updated, as follows:
Let’s define the amount of spilled flow (in m3/s):
- If then .
- If there is spilling. The volume of spilled flow (in m3) in day t is:
Therefore the volume for the following day can be calculated using the following equation:
2.3. Historical Reconstruction
The Hydroclim model has been used to reproduce the operations of each of the three plants. Each of them has specific characteristics that requires a distinctive treatment. Logically, it is more difficult to reproduce the operations of plants with a greater operational capacity, as the managers of these plants have the ability to store water and process it at the most economically opportune time, as well as to adjust usage based on expected shortages.
The case of Mengíbar, the run-of-river plant, is much simpler due to its smaller operational capacity. It does not have a reservoir in and of itself, and the biggest challenge is to determine on a daily basis how much water may be processed, and when it should be spilled. The model provides a 97% correlation between historical production and reconstructed production since 1975 (Figure 3), which is when the plant was renovated and took on its current configuration.
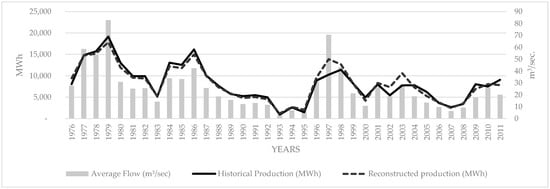
Figure 3.
Historical production and reconstruction at the Mengíbar plant. Source: Own elaboration and ENDESA.
The modelling of the Cala plant faces the challenge of managing a certain storage limit, along with the need to spill in the case that this limit is exceeded. The correlation obtained in this case, for the period of 1961 to 2012, is 87% (Figure 4), with no correction for historical anomalies or periods of renovation (such as in 1976, when production ceased).
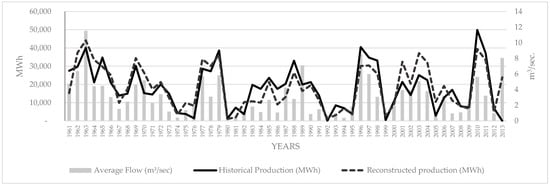
Figure 4.
Historical production and reconstruction at the Cala plant. Source: Own elaboration and ENDESA.
The remaining plant, Tranco de Beas, is the most complex due to its large reservoir (in fact, it is considered limitless in the model). Therefore, the operational capacity of the plant operator is much greater. In this case, it has been difficult to account for decisions to halt production during certain times of year, despite having an available supply and flow. This anomaly has been solved by including an additional restriction on the plant operator, requiring that production be cut if minimum reserves for the following year were not met at the end of the irrigation season. This is the μ parameter that was mentioned above. The correlation from 1966 to 2012 is 83% (Figure 5).
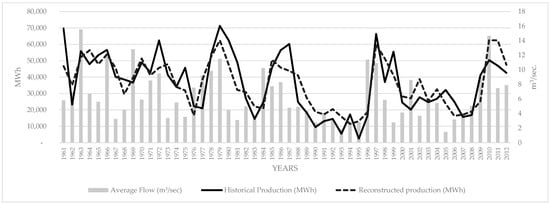
Figure 5.
Historical production and reconstruction at the Tranco de Beas plant. Source: Own elaboration and ENDESA.
3. Production Projections
3.1. Hypothesis for the Projections
Once the model has been tested and calibrated to provide an acceptable correlation with historical data, the next step is to use it as the basis from which to project the potential impacts of climate change.
Climate change scenarios have been primarily based on work done by the Center for Studies and Experimentation of Public Works (CEDEX) under the Ministry of Public Works. CEDEX carried out a series of studies between 2010 and 2012 aimed at assessing the impacts of climate change on water resources and bodies of water. One of these reports [18] centers on production systems, using the hydrological model SIMPA to assess changes in available water resources in the main Spanish rivers in the A2 and B2 scenarios of the Fourth Assessment Report (4AR) of the Intergovernmental Panel on Climate Change (IPCC). These studies have already been used as a reference to evaluate changes in the Spanish energy system due to climate change [19].
The report contains projections of resource availability for the periods 2011–2040, 2041–2070, and 2071–2100, in relation to the reference period 1961–1990. In this case, the average change in runoff for the six models studied for the Guadalquivir has been used under the assumption of uniform demand (Table 2). All models point towards a reduction in runoff, ranging from −37 to −62% (A2) and from −5 to −44% (B2) in the long term (2071–2100).

Table 2.
Variation of available resource (runoff) based on CEDEX average projections for the Guadalquivir, compared with 1961–1990. Scenarios A2 and B2. Source: CEDEX, 2012.
The results of the CEDEX study represent an aggregate sum of the whole basin, with no differentiation between its different parts. In the projections, for lack of better information, it has been assumed that reductions in availability are equally applicable to all plants, although they are located in different sections and their individual contributions depend on distinct sources. That is, the reductions in water resources provided by CEDEX for the different periods have been transferred to the daily flow data available for the plants from 1961 to 1990. Therefore, the seasonal distribution of flow has been kept as in the original record.
In contrast with this source of information, two additional references have been used. Firstly, historical information for each plant provided by the company has been used to confirm the consistency of the projections. Secondly, rainfall projections for each region, provided by the Andalusian Government, have been used for scenarios A2 and B1 of the 4AR of the IPCC [20].
The selected approach might underestimate climate change impacts for two reasons. On the one hand, due to the limitations of the model, these projections do not take into account the impact of changes to the contributions needed to maintain a minimal ecological flow, or to meet certain guarantee curves for other uses, and subsequently the potential impact of this on energy production. That is to say, it has been assumed that spilled flow will be managed under the same assumptions as during the historical period. On the other hand, due to lack of information, the impact of periods of intense rainfall have not been considered, although seasonal variations may affect the performance of the plant [21].
3.2. Results
The results of these projections show a significant decline in production, which is consistent with the decrease in contributions projected by CEDEX. Except in Tranco de Beas, the reduction in production is always inferior to the decrease in runoff. On the other hand, and consistent with the CEDEX projections, the A2 scenario shows a growing reduction in contributions. However, the B2 scenario, which begins with greater reductions than A2, then shows an inverted U-shape, with the best results in the period from 2040–2071. Contributions then fall again, but more slowly than in the first period.
The following Figure 6, Figure 7 and Figure 8 show the evolution of production at each plant for the A2 scenario, along with the moving average over the last 10 years and the linear trend.

Figure 6.
Projected production for Cala in MWh (A2).

Figure 7.
Projected production at Mengibar in MWh (A2).

Figure 8.
Projected production for Tranco in MWh (A2).
Figure 9 below offers a comparison of the changes in production from 1961–1990, along with the evolution of water availability reduction from CEDEX. As shown, the decrease in production is present in all scenarios and plants. By the end of the century this figure reaches a very noteworthy level, ranging between 30 and 49% for scenario A2 and 10 to 31% for scenario B2.
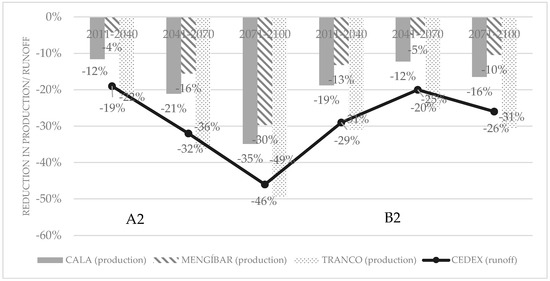
Figure 9.
Comparison of projections and climate trends. Source: Own elaboration and CEDEX (2012).
As shown above, the decrease in production is higher in plants with greater storage capacity. The plants that, in their current configuration, least efficiently utilize water and are forced to spill excess flow are the least affected. Part of the decrease in flow simply implies that there is less spilling, given that that plant could not exploit even the received flow in the initial period. However, where storage capacity is greater, the implications are more significant because the decrease affects water that was in fact being utilized. For this reason, production decreases are most notable in Tranco de Beas, followed by Cala, and finally by the run-of-river plant in Mengíbar.
This effect is also linked to the fact that Tranco de Beas, like many other storage plants, needs to have a high installed capacity factor to be able to produce enough power in certain periods of time. Table 3 displays the production/installed capacity ratio for the plants in the past and in the future, for the A2 scenario. The plant in Mengibar shows the best ratio, followed by Cala, then by Tranco de Beas. This fact will be relevant for the economic analysis as well.

Table 3.
Historical and projected production to power ratio (average annual production (MWh)/capacity (installed MW)). Source: Own elaboration based on data from ENDESA.
3.3. Historical Background
A relevant question for plant operators is, to what extent these data are consistent with the historical evolution of the plants, and their pertinence in the context of other studies.
With regard to the historical significance, as shown in the graphs below, the three plants already show a trend towards an important reduction in flow and production (the production for Mengíbar has been reconstructed with the current configuration for the years prior to 1975, given that only since then has the plant had this specific configuration). The first is more significant conceptually, as the second may stem from technical reasons or design changes. Despite some logical data dispersion, the consistent decrease can be observed in Figure 10 for Cala as the dotted line showing the linear tendency in flow evolution. The reduction in flow, according to the linear tendency, is substantial between 1961 and 2012 (44% in Cala, 82% in Mengibar and 28% in Tranco). This fact is influenced by the rainy start of the 1960’s. However, tracing back to 1930 for the plants where information is available, we find reductions as well (33% in Cala and 73% in Mengibar).
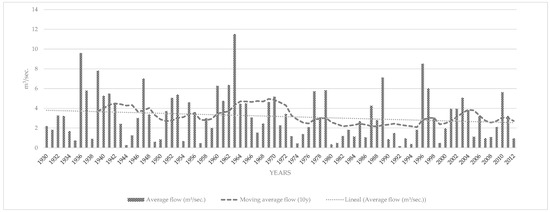
Figure 10.
Historical evolution of flow at the Cala center. Source. Own elaboration based on data from ENDESA.
Subsequently, the historical trend of reduced flow was extrapolated for the period of the projections, and compared to the flow hypotheses that were obtained by applying the CEDEX scenarios (A2). As can be seen in Figure 11, in the case of Cala the projection results and historical trends show relevant consistency. In the case of Mengíbar and Tranco de Beas (Figure 12 and Figure 13) the historical trend in flow reduction is much greater than that shown in the projections. In fact, following this trend, flow would reach zero in these plants before the end of the century.
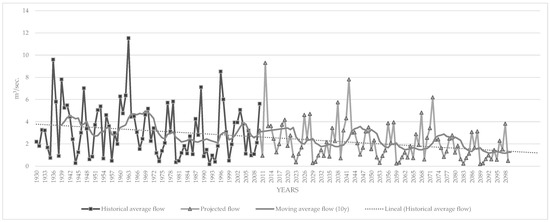
Figure 11.
Historical and projected flow (m3/s), Cala center. Source: Own elaboration and ENDESA.
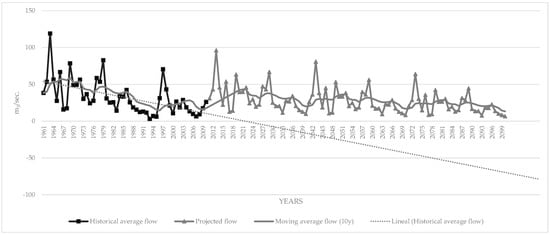
Figure 12.
Historical and projected flow (m3/s), Mengibar center. Source: Own elaboration and ENDESA.
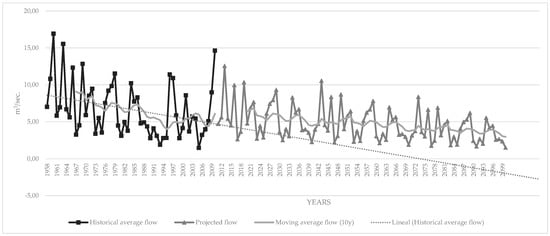
Figure 13.
Historical and projected flow (m3/s), Tranco center. Source: Own elaboration and ENDESA.
3.4. Alternative Sources of Information
There are only a few relevant sources with enough resolution to test these results. The results of the CEDEX projections that have been used above have been compared to those of the Regional Government of Andalusia. This government, as previously mentioned, conducted a study that offers data on rainfall reductions for each of the different Andalusian provinces for scenarios A2 and B1 of the 4AR of the IPCC [20]. Historical rainfall and flow data have been correlated, from a simple polynomial regression, to obtain flow data for each of the distinct rainfall scenarios. These data have been used in the model to project production until the end of the century.
Logically, this exercise implies greater uncertainty than the CEDEX projections, for various reasons. Firstly, because there are significant differences in rainfall within the provinces, and particularly because the contributions to each plant may be influenced by provinces located upstream.
Secondly, the historical correlation between flow and rainfall is relatively high in Cala and Tranco (83 and 85%, respectively), but much lower in Mengíbar (54%). In other words, considering existing historical information, rainfall can be an acceptable approximation to flow only in two plants. The relation between flow (m3/s) and rainfall (L/m2) in Tranco is represented in Figure 14.
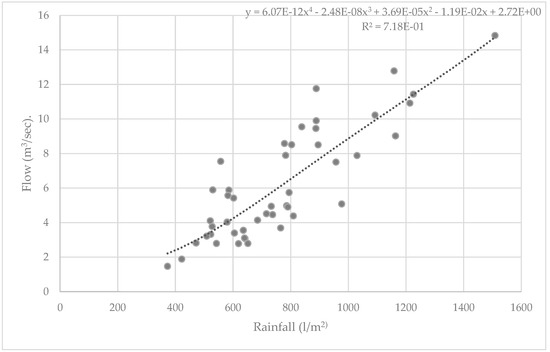
Figure 14.
Flow and rainfall data (1967–2012), Tranco de Beas center. Source: Own elaboration based on data from ENDESA.
Below are the projections made using data from the Regional Government of Andalusia, compared with the results from CEDEX (Table 4). Generally, projected reductions obtained with the government data are more moderate than those from CEDEX, although the overall trend is the same. It should also be noted that the compared scenarios are within the same family, but are not exactly the same (A2 and B2 for CEDEX, and A2 and B1 for the Regional Government of Andalusia).

Table 4.
Projected reductions in production (%). CEDEX vs. Regional Government of Andalusia.
4. Economic Analysis
4.1. Hypothesis
The company that runs these plants has not provided specific economic information for this analysis. Therefore, information is taken from literature and government standards developed along with the remuneration system for hydroelectric power plants in Spain under the so-called “Special Regime” (feed-in tariff). Although none of these plants operate under this special scheme, it has been assumed that their cost structure does not differ substantially from similar plants that operate under this regime.
As noted, the selected values remain constant over time, in accordance with the chosen ceteris paribus approach. Therefore, future changes have not been taken into account, such as changes in the electricity market, management upgrades, changes in the plants’ configurations, new technologies, or other variables that could impact the cost and revenue structure.
Two types of economic analyses have been performed, one on operating margins and another on investments. In the first, the costs of civil works and engineering have been omitted, as these plants are in operation and the analysis only considers the investment required to replace machinery, as suggested by the company. This equipment is assigned a useful lifespan of 25 years, based on the regulatory lifespan set out by the Ministerial Order.
With regard to capital costs, a study conducted by the Boston Consulting Group for the Spanish Government has been used [22], along with the Ministerial Order 1045/2014. This study provides a detailed analysis by installed capacity and plant type, disaggregated by cost category (Table 5). A linear interpolation of values has been calculated, with total investment costs of 841 €/kW for Cala, 1572 for Mengíbar, and 759 for Tranco de Beas.

Table 5.
Capital costs at hydropower plants. Source: Institute for Diversification and Saving of Energy (IDAE) (2011).
These estimates seem conservative in view of the literature, although the main sources do not offer such a detailed breakdown for Spain. On the other hand, existing studies show significant variations due to the fact that investments costs are, understandably, very different depending on the plant and location. IRENA estimates that 3/4 of investment costs are determined by the local physical characteristics, and gives values of 1000 to 8000 USD/kW for small power stations in the European Union [23]. More specifically, their curves depicting power and head show higher values than those of IDAE [22].
Meanwhile, while a study commissioned by the European Commission [24] do not offer a systematic classification of power, in categories equivalent to the analyzed plants it gives values of 1275–5025 €/kW, 975–1600 for medium sized plants, and 1450–5750 for the largest plants. The values do not greatly differ from those of IDAE, except in the case of Tranco de Beas, where they are substantially higher as, surprisingly, no economies of scale are reported for large plants.
Finally, a paper also commissioned by the Spanish Government [25] distinguishes between three types of plants, which can be linked to those mentioned here (run-of-river to 10 MW, storage plants of less than 10 MW, and storage plants of between 10 and 50 MW). Investment costs fluctuate between 2000, 1400, and 1100 €/kW, greater than those of IDAE [22].
For the estimation of operation and maintenance costs, IDAE [22] has been chosen in line with Order 1045/2014, which includes a separate analysis per plant type, size, and commissioning date. In this regard, costs are fixed per unit of power (between 40–50 €/MW, according to IDAE and are then adjusted for each plant so that historical costs per MWh produced resemble as closely as possible the estimates of Ministerial Order 1045/2014.
In the case of Tranco, corrections have been made, as the plant is operating well below capacity, and only two of the three groups are operating stably. It has therefore been estimated that operation and maintenance costs are 2/3 of what would correspond to the plant’s theoretical installed capacity.
These data are consistent with the literature, despite the fact that there are very different reference values, given the large disparity in costs for hydroelectric plants depending on the type, size, and location. Furthermore, many of the pertinent papers have a different scope and consider different cost categories.
IRENA [23], for example, estimates a similar range of costs, of 45 to 53 USD/kW/year. De Jager et al. [24] give lower values for Europe, of 35 €/kW for the largest plants, and 40 €/kW for the smaller ones.
Several taxes have been considered in the assessment. The tax on electricity production has been taken into account, introduced by Law 15/2012, which records production and incorporation into the Spanish Electricity System (at a rate of 7% of the total revenues obtained by the taxpayer). Also considered is the currently applicable charge for the use of inland water for energy production (2.2% in plants of less than 50 MW, owing to article 8 of Royal Decree 198/2015). Finally, a charge of the Water Confederation, estimated at 3% (the value is not published in the concession), is added.
Of lesser importance, local taxes such as those on economic activities and property have not been taken into account. The Special Tax on electricity has not been considered, given that in its current form it taxes energy supply for consumption, rather than production. Finally, the Added Value tax is not included, due to its neutral impact on businesses.
Regarding revenue, Order 1045/2014 assumes an average market price of 52 €/MWh from 2017 which has served as the primary reference. However, some hydroelectric power plants, due to their operational capacity can choose the time to produce considering existing prices in the electricity market. To take this into consideration, an alignment ratio has been calculated to reflect the difference between the average daily electricity market price since 2011, and the weighted average that hydroelectric energy has been sold at (Table 6). This ratio is estimated at 6.672%, and has been applied to all of the analyzed centers, as it has been calculated with data from all existing hydroelectric power stations.

Table 6.
Alignment ratio for hydroelectric power stations. Own elaboration based on data from The Spanish Electricity System.
By reason of the ceteris paribus approach explained above, these costs and revenues remain stable over time. It has also been assumed that concessions do not change over time, as any change in the company managing concessions is not relevant to the objectives of this study. Similarly, no costs related to the hypothetical end of operating life of the plants have been considered.
4.2. Analysis of Operating Margin
With these presuppositions in mind, results concerning the plants’ margins are shown below. The period from 1961–1990, on which CEDEX projections are based, is considered a Business As Usual scenario, and has been compared with the results for all plants for each distinct scenario.
As shown in the historical period, in accordance with the above-mentioned hypotheses, Mengíbar is the center with the highest operating profit. This is because it is the center with the best ratio of production to installed power capacity, and operating and maintenance costs have been estimated as fixed. Tranco de Beas shows the worst results, as it needs a higher capacity factor per unit of electricity produced, when valued in light of its historical performance.
Concerning future evolution, in the A2 scenario the two plants with a reservoir, Cala and Tranco de Beas, end up being unprofitable. In the B2 scenario this only occurs with Tranco de Beas. Mengíbar is, once again, the least affected plant as the projections show a small drop in production and because it is, historically, the plant with better operating margins. The results are shown in Table 7.

Table 7.
Evolution of operating margins at pilot centers.
If the analysis is disaggregated by periods of time, (as shown in Table 8) in scenario A2, Cala would cease to have a positive margin for the period of 2041–2070, and Tranco the Beas even from 2011–2040. In the B2 scenario, Cala would continue to be profitable while Tranco would be unprofitable again from the first period (2011–2040).

Table 8.
Evolution of operating margins (%) over time.
4.3. Investment Analysis
Lastly, an analysis has been carried out regarding a hypothetical investment from scratch. That is to say, to what extent a full investment to build the plants in their current configuration would be profitable at each of the plants, considering the expected decrease in electricity production. In this case therefore, the full set of capital cost categories has been considered, including civil works and engineering. The period of the investment analysis is fifty years, beginning in 2011, the first year projected.
A discount rate of 2% has been used, consistent with other studies in the sector in Spain [26]. Two financing options have been analyzed. In the first, funding is considered to be purely internal, and no opportunity cost is applied. In the second, following the same sources, there is external funding of 80% of capital, at an interest rate of 6%, under an equated yearly installment (equal payments during the loan life cycle to pay off interests and capital).
Table 9 shows the current net values for the different plants, considering A2 and B2 scenarios. Consistent with the results of the profitability analysis, only the Mengíbar plant shows positive values for such an investment, and just for the 100% internal financing assumption.

Table 9.
Net present values of investments in pilot centers, A2 and B2 scenarios.
5. Discussion
This article has analyzed to what extent decreases in average rainfall due to climate change could affect the margins and operations of hydroelectric power plants in the long term. As a result, in the absence of adaptive measures, a decrease in the plants’ productivity is to be expected, which will significantly impact their margin, except in the case of the run-of-river plant at Mengíbar.
With regards to the physical approach, the primary reference has been public projections on the availability of water resources. The main uncertainty stems from projections on contributions. In this sense, it will be important to improve upon and update these projections over time, as new information becomes available.
A common limitation in the projections of CEDEX and of the Andalusian Government is that they are based on scenarios from the 4AR of the IPCC. Future analysis would benefit from more geographically precise projections, based on the Fifth Assessment Report (5AR) of the IPCC. In the case of CEDEX, it is important to note that the utilized models, when applied to the historical data, show results that are lower than the actual contributions. This is the best reference to date for the impact of climate change on water resources in Spain, but remains a work in progress and could be improved upon.
Additionally, the potential impact that current or future guarantee curves may have on the management of the plant has not been taken into account. Incorporating this could further reduce the expected production. Interaction of users in water scarcity scenarios is becoming very relevant in recent literature [27,28].
One of the most relevant methodological decisions was the ceteris paribus approach. As explained above, the reason was to avoid distortions due to other factors in the results, especially considering the long-term framework of the assessment. However, it is to be expected that the electricity production sector will change substantially over time taking into account, for instance, the growing share of renewable energies in the electricity mix, which may require a bigger involvement from storage plants for regulation. The conclusions of this paper could benefit from other studies that shed light on the future evolution of the sector.
From an economic standpoint, the main uncertainty is that associated with the evolution of the electricity market in Spain, which is outside the scope of this article. What is more, this study has operated under the assumptions of the government’s economic model, which do not necessarily coincide with real costs and benefits.
6. Conclusions
The study has shown that the reduction in availability of water resources linked to climate change may pose a significant risk for hydroelectric production in southern Spain. Three hydroelectric power plants have been studied. In all of them the expected reduction in runoff will significantly affect the production of the plants. Depending on the scenario, reductions in production by the end of the century range between 30% and 49% (A2) and between 10% and 31% (B2). This trend is not, nevertheless, inconsistent with historical data, which already show a significant decrease in flow at the plants.
The reduction in production, according to our economic and financial hypothesis, will substantially affect the operating margins of the plants. Under the A2 scenario, two of the plants would even cease to have positive margins. Under the B2 scenario one of them would be in this situation. This reduction in water resources would potentially affect new investments in the sector as our model shows only positive values in one of the plants in a hypothetical investment from scratch.
The run-of-river plant of Mengibar performs better under these scenarios whereas Tranco de Beas, the plant with higher storage capacity, is the most affected. However, the authors believe this is not so much related to having a reservoir or not, but rather to the ratio between production and installed capacity, according to our assumptions. In this regard, the plants with more operational capacity may have an additional advantage on the market price, which has not been considered here.
These conclusions will benefit from further improvements that can reduce the uncertainty of the analysis. More updated and accurate projections would help as well as a more detailed assessment that integrates the needs of the energy sector with needs of other sectors that will face a shortage as well.
In any case, the time horizon of the study is long-term and many changes are to be expected in the energy sector during that time. Generally, this allows for time to address potential adaptive measures, and to continue improving upon the informational groundwork of these projections.
Concerning public policy design, the logical conclusion of this paper is that climate change may have a decisive impact on the profitability of hydroelectric power plants, which represents an essential pillar in policies to mitigate climate change in Spain. Despite existing uncertainties, the magnitude of the expected changes suggests that this factor should be closely monitored by energy planners and decision makers in a context where climate change may impact as well other generation technologies [3,4]. The combination of our methodology with an assessment at country level based on a top-down methodology would shed more light on this matter, following recent research (such as [7] or [8]).
Acknowledgments
Financial support from the Spanish Ministry of Economy and Competitiveness (ECO2015-70349-P) is acknowledged. We deeply appreciate the valuable support from the ENDESA staff, especially from the South Hydroelectric Production Unit (David Zafra and Manuel Medina), but also from the Climate Change Corporate Unit (David Corregidor, Jorge Pina, Alejandro Rodríguez). The technical and economic analysis of this paper benefited from the contribution of Enrique Losada (ENDESA), Carmen López and Luis Posse (IDEA) as well as from Maria del Mar Vich (Meteoclim). We are also grateful for the comments from the participants in the Seminar of the Department of Foundations of Economic Analysis II, of the University of the Basque Country (March, 2016), the IX Iberian Congress on Water Planning and Management (September, 2016), the XII Congress of the Spanish Association for Energy Economics (February, 2017) and Madrid Aqua Energy Forum (MAEF 17, March, 2017). Helen Poliquin and Christina Garcia reviewed the use of English in the manuscript.
Author Contributions
Both authors conceived and designed the model. Emilio Cerdá set the mathematical foundations for it. Kepa Solaun implemented the model and carried the calculations for the case study. Kepa Solaun wrote the paper, which was subsequently thoroughly reviewed by Emilio Cerdá.
Conflicts of Interest
The authors declare no conflict of interest.
References
- OECD/International Energy Agency (IEA). Energy and Climate Change. World Energy Outlook Special Report; International Energy Agency: Paris, France, 2015; ISBN 978-0-470-85313-9. [Google Scholar]
- Arent, D.J.; Tol, R.S.J.; Faust, E.; Hella, J.P.; Kumar, S.; Strzepek, K.M.; Tóth, F.L.; Yan, D. Key economics sectors and services. In Climate Change 2014: Impacts, Adaptation, and Vulnerability. Part A: Global and Sectoral Aspects. Contribution of Working Group II to the Fifth Assessment Report of the Intergovernmental Panel on Climate Change Change; Cambridge University Press: Cambridge, NY, USA, 2014. [Google Scholar]
- Johnston, P.C. Climate Risk and Adaptation in the Electric Power Sector Electric Power Sector; Asian Development Bank: Manila, Phillippines, 2012; ISBN 978-92-9092-730-3. [Google Scholar]
- Schaeffer, R.; Szklo, A.S.; Pereira de Lucena, A.F.; Moreira Cesar Borba, B.S.; Pupo Nogueira, L.P.; Fleming, F.P.; Troccoli, A.; Harrison, M.; Boulahya, M.S. Energy sector vulnerability to climate change: A review. Energy 2012, 38, 1–12. [Google Scholar] [CrossRef]
- Ansuategui, A. Climate Change and the Energy Power Sector. Impacts and Adaptation. In Routledge Handbook of the Economics of Climate Change Adaptation; Markandya, A., Galarraga, I., Sainz de Murieta, E., Eds.; Routledge: London, UK; New York, NY, USA, 2014; ISBN 978-0-415-63311-6. [Google Scholar]
- Ebinger, J.; Vergara, W. Climate Impacts on Energy Systems: Key Issues for Energy Sector Adaptation; The World Bank: Washington, DC, USA, 2011; ISBN 9780821386972. [Google Scholar]
- Sample, J.E.; Duncan, N.; Ferguson, M.; Cooksley, S. Scotland’s hydropower: Current capacity, future potential and the possible impacts of climate change. Renew. Sustain. Energy Rev. 2015. [Google Scholar] [CrossRef]
- Kao, S.C.; Sale, M.J.; Ashfaq, M.; Uria Martinez, R.; Kaiser, D.P.; Wei, Y.; Diffenbaugh, N.S. Projecting changes in annual hydropower generation using regional runoff data: An assessment of the United States federal hydropower plants. Energy 2015. [Google Scholar] [CrossRef]
- Maran, S.; Volonterio, M.; Gaudard, L. Climate change impacts on hydropower in an alpine catchment. Environ. Sci. Policy 2014, 43, 15–25. [Google Scholar] [CrossRef]
- Schaefli, B.; Hingray, B.; Musy, A. Climate change and hydropower production in the Swiss Alps: Quantification of potential impacts and related modelling uncertainties. Hydrol. Earth Syst. Sci. 2007, 11, 1191–1205. [Google Scholar] [CrossRef]
- Koch, F.; Bach, H.; Reiter, A.; Mauser, W. Climate Change effects on hydropower plants in the Upper Danube watershed. In Proceedings of the Hydropredict 2010, Prague, Czech Republic, 20–23 September 2010. [Google Scholar]
- Ahenkorah, A.; Caceres-Rodriguez, R.; Devernay, J.M.; Freitas, M.; Hal, D.; Killingtveit, Å.; Zhiyu, L. Hydropower. In IPCC Special Report on Renewable Energy Sources and Climate Change Mitigation; Cambridge University Press: Cambridge, NY, USA, 2011. [Google Scholar]
- Hamududu, B.; Killingtveit, A. Assessing climate change impacts on global hydropower. Energies 2012, 5, 305–322. [Google Scholar] [CrossRef]
- Intergovernmental Panel on Climate Change (IPCC). Climate Change 2007: Impacts, Adaptation and Vulnerability. Contribution of Working Group II to the Fourth Assessment Report of the Intergovernmental Panel on Climate Change; Parry, M.L., Canziani, O.F., Palutikof, J.P., van der Linden, P.J., Hanson, C.E., Eds.; Cambridge University Press: Cambridge, NY, USA, 2007; ISBN 9780521880107.
- Spanish Office of Climate Change. National Climate Change Adaptation Plan; NIPO 31008; Oficina Española de Cambio Climático: Madrid, Spain, 2006.
- Solaun, K.; Gómez, I.; Urban, J.; Liaño, F.; Pereira, S.; Genovés, A. Integración de la adaptación al cambio climático en la estrategia empresarial. Evaluación de los impactos y la vulnerabilidad en el sector privado. Caso piloto: Endesa; NIPO 28016; Ministry of Agriculture, Food and Environmental Affairs, Spanish Government: Madrid, Spain, 2014.
- Castro, A. Minicentrales hidroeléctricas; Instituto para la Diversificación y Ahorro de la Energía: Madrid, Spain, 2006. [Google Scholar]
- Centro de Estudios y Experimentación de Obras Públicas (CEDEX). Estudio de los impactos del cambio climático en los recursos hídricos y las masas de agua; Centro de Estudios Hidrográficos: Madrid, Spain, 2012. [Google Scholar]
- Linares, P.; Zarrar, K. Nuevas tecnologías de generación eléctrica a partir de la disponibilidad de recursos hídricos en escenarios de cambio climático; Fundación Canal de Isabel II: Madrid, Spain, 2015. [Google Scholar]
- Moreira, J.M. El cambio climático en andalucía. Escenario actuales y futuros del clima. Rev. Medio Ambient. 2008, 59, 35–41. [Google Scholar]
- Harrison, G.; Whittington, H.; Gundry, S. Climate Change Impacts on Hydroelectric Power. In Proceedings of the Fourth International Conference on Hydropower, Bergen, Norway, 20–22 June 2001; A. A. Balkema: Lisse, The Netherlands, 2001. [Google Scholar]
- Instituto para la Diversificación y Ahorro de la Energía (IDAE). Evolución tecnológica y prospectiva de costes por tecnologías de energías renovables. Estudio Técnico PER 2011-2020; Instituto para la Diversificación y Ahorro de la Energía: Madrid, Spain, 2011. [Google Scholar]
- International Renewable Energy Agency (IRENA). Renewable Energy Technologies: Cost Analysis Series. Hydropower; International Renewable Energy Agency: Abu Dhabi, UAE, 2012; Volume 1. [Google Scholar]
- Jager de, D.; Klessmann, C.; Stricker, E.; Winkel, T.; Visser de, E.; Koper, M.; Ragwitz, M.; Held, A.; Resch, G.; Busch, S.; et al. Financing Renewable Energy in the European Energy Market Financing Renewable Energy in the European Energy Market; European Commission: Brussels, Belgium, 2011. [Google Scholar] [CrossRef]
- Instituto para la Diversificación y Ahorro de la Energía (IDAE). Análisis de estándares de proyectos de producción de electricidad en régimen especial; Instituto para la Diversificación y Ahorro de la Energía: Madrid, Spain, 2014; ISBN 2710879549. [Google Scholar]
- Mir-Artigues, P.; Cerdá, E.; Del Río, P. Analyzing the impact of cost-containment mechanisms on the profitability of solar PV plants in Spain. Renew. Sustain. Energy Rev. 2015, 46, 166–177. [Google Scholar] [CrossRef]
- Spalding-Fecher, R.; Chapman, A.; Yamba, F.; Walimwipi, H.; Kling, H.; Tembo, B.; Nyambe, I.; Cuamba, B. The vulnerability of hydropower production in the Zambezi River Basin to the impacts of climate change and irrigation development. Mitig. Adapt. Strateg. Glob. Chang. 2016, 21, 721–742. [Google Scholar] [CrossRef]
- Bozorg-Haddad, O.; Garousi-Nejad, I.; Loáiciga, H.A. Extended multi-objective firefly algorithm for hydropower energy generation. J. Hydroinform. 2017, jh2017114. [Google Scholar] [CrossRef]
© 2017 by the authors. Licensee MDPI, Basel, Switzerland. This article is an open access article distributed under the terms and conditions of the Creative Commons Attribution (CC BY) license (http://creativecommons.org/licenses/by/4.0/).