Article

Electrochemical-Thermal Modelling and Optimisation of Lithium-Ion Battery Design Parameters Using Analysis of Variance

Warwick Manufacturing Group, International Digital Laboratory, University of Warwick, Coventry CV4 7AL, UK
*
Author to whom correspondence should be addressed.
Energies 2017, 10(9), 1278; https://doi.org/10.3390/en10091278
Submission received: 4 July 2017 / Revised: 24 August 2017 / Accepted: 25 August 2017 / Published: 28 August 2017
(This article belongs to the Section D: Energy Storage and Application)

Abstract

:
A 1D electrochemical-thermal model of an electrode pair of a lithium ion battery is developed in Comsol Multiphysics. The mathematical model is validated against the literature data for a 10 Ah lithium phosphate (LFP) pouch cell operating under 1 C to 5 C electrical load at 25 °C ambient temperature. The validated model is used to conduct statistical analysis of the most influential parameters that dictate cell performance; i.e., particle radius ( r p ); electrode thickness ( L p o s ); volume fraction of the active material ( ε s , p o s ) and C-rate; and their interaction on the two main responses; namely; specific energy and specific power. To achieve an optimised window for energy and power within the defined range of design variables; the range of variation of the variables is determined based on literature data and includes: r p : 30–100 nm; L p o s : 20–100 μm; ε s , p o s : 0.3–0.7; C-rate: 1–5. By investigating the main effect and the interaction effect of the design variables on energy and power; it is observed that the optimum energy can be achieved when (rp < 40 nm); (75 μm < Lpos < 100 μm); (0.4 < εs,pos < 0.6) and while the C-rate is below 4C. Conversely; the optimum power is achieved for a thin electrode ( L p o s < 30 μm); with high porosity and high C-rate (5 C).

1. Introduction

The creation of battery models is essential for better understanding of the impact of design variables as well as operating conditions on battery performance, in terms of efficiency, degradation and safety. They are also cost effective tools for determination of an optimised battery design that can reduce the need for experimental trial and error. Beyond that, most variables that underpin the operation of a battery are not directly measurable, whereas they can be predicted through a validated model [1].
Battery models can be broadly categorised into four groups, namely: empirical models (equivalent circuit and neural network), electrochemical engineering models, multiphysics models, and molecular/atomistic models [1,2]. These battery models include different levels of details and differ in terms of complexity, computational cost and reliability. They can be chosen based on the particular needs for a specific application. Due to the complexity of batteries, electrochemical models are often viewed as the best approach for investigating the impact of design variables on battery performance during a charge and discharge process.
The most common electrochemical models in the literature [3] are single particle models (SPM) [4,5] porous-electrode models [6,7] and pseudo-two-dimensional models (P2D) [8,9]. The main difference is the level of complexity and the computational time associated with their use. Once an efficient model is developed, it can be employed to address a number of real-world challenges, such as the identification of transport and kinetic parameters, the occurrence of capacity fade, improving life time, and improving energy/power density [1]. The energy/power density can be improved by manipulating either the design parameters or operating protocols [1]. Much of the previous work on improving the performance of batteries has focused on battery packs rather than a single battery cell design [10]. The important design parameters which can be varied within the manufacturing process to achieve the optimal battery performance are known to be: electrode thickness [11,12,13,14], porosity [6,10,11,12,15], particle size [14,16], electrode surface area, geometry and the dimensions of current collectors [6,17,18].
Given the importance of battery design, Newman et al. and co-workers [11,12] developed an analytical model of a lithium ion battery to optimise porosity and thickness of the positive electrode for maximum specific energy, while holding other parameters constant. In another study, Singh et al. [13] investigated experimentally the amount of energy that may be extracted from a cell manufactured using thick electrodes (320 μm) compared to cells that employ a thinner electrode (70 μm) for a graphite/lithium nickel manganese cobalt oxide (Gr/NMC) chemistry. They observed a significant capacity loss when using the thicker cells at C-rates of C/2 due to poor kinetics. The authors suggest that the proposed thick electrodes could be advantageous for certain applications where a continuous low C-rate is required. Research presented by Wu et al. [14], employed an electrochemical-thermal model of a lithium ion battery for a LiyMn2O4 chemistry. The model was used to investigate the impact of particle size and electrode thickness on heat generation and the performance of the battery. They found that a battery containing a thin electrode showed a better performance in terms of temperature rise and material utilisation, but the effect of particle size was not monotonic across the discharge rates. In a recent study published by Ramadesigan et al. [6] a multi-layered porosity distribution was investigated rather than optimising a uniform porosity in a lithium ion battery design. They developed a simple electrochemical porous electrode model, which did not include the solid-phase intercalation mechanism. The model was applied for a cathode made of lithium cobalt oxide. For a fixed value of active material, optimal multi-layered porosity distribution across the positive electrode was found. The authors managed to decrease the ohmic resistance by circa: 15–33%, employing the optimal porosity distribution. Golmon et al. [15] applied a gradient-based optimisation method on a multi-scale battery model to maximise the usable capacity. The electrochemical-mechanical multi-scale model was an extension of Doyle and Newman’s electrochemical battery model [19,20]. The variables were particle size and porosity, with constraints placed on the stress levels in the cathode particles. Other examples can be seen in [16,18]. Darling et al. [16], developed a 1D theoretical model to investigate the influence of different particle size distributions on the operation of porous intercalation electrodes. Chen et al. [18] developed a technique to enhance the achieved capacity of Li-based batteries through improvements in both electronic and ionic conductivity of materials.
Parameter sensitivity study is another area of research performed in modelling approaches for finding the influential design variables which could potentially improve battery performance [14,21,22,23,24,25]. Zhang et al. [21,23] developed a coupled P2D electrochemical-thermal model for a 2.3 Ah cylindrical Li-ion battery by improving the open source FORTRAN code maintained by Newman’s research group. They established a parameter sensitivity matrix and used clustering theory to group the parameters according to their average sensitivity. They performed a sensitivity study of up to 30 parameters under different operating conditions. Out of the 30 parameters, 10 were found to be highly sensitive, seven of those were sensitive, along with 10 low sensitivity and three insensitive parameters. The most sensitive parameters were found to be anode particle radius, diffusion coefficient in the negative electrode, stoichiometry of the anode, volume fraction of the electrolyte and active material in the negative electrode, contact resistance, reaction rate of the negative and positive electrode as well as the activation energy of the electrolyte ionic conductivity. Moreover, it was found that the sensitivity of the parameters is strongly dependent on the operating conditions. Edouard et al. [22] developed a single particle (SP) electrochemical-thermal model applying the pseudo-2D mathematical structure. The model was applied to evaluate the sensitivity of the key parameters that are involved in battery aging. They pointed out that the limiting mechanism in a battery can switch depending on the operating conditions and battery design [14]. Moreover, the combined effect of design parameters can be even more significant than their individual effect. This presents a great challenge for experimentally optimising a battery design. Du et al. [24] introduced a surrogate modelling framework to map the effect of design parameters, such as cathode particle size, diffusion coefficient and electrical conductivity on battery performance. They quantified the relative impact of various parameters through global sensitivity analysis employing a cell-level model in conjunction with tools such as kriging, polynomial response, and radial-basis neural networks. Ghaznavi et al. [25] applied a mathematical approach to conduct a sensitivity study on a lithium-sulfur cell. They focused on the effects of discharge current and conductivity of the positive electrode over a wide range of values.
To date, much progress has been made in modelling and design optimisation of lithium ion batteries to map the trade-off between power and energy density. However, in most studies only a few design variables have been selected and the optimisation is limited to a narrow range of operating conditions. Moreover, the interaction effect of influential parameters has not been comprehensively studied. Therefore, there exists a critical need to stablish a framework to access both the individual and the interaction effect of various parameters on the energy and power of a cell. This study attempts to quantify the strength of design factors and the combined effect of variables on specific energy as well as specific power of a battery.
Within this paper, a 1D electrochemical-thermal model of an electrode pair of a lithium ion battery is developed in Comsol Multiphysics. Each pair is assumed to be a sandwiched model of different layers, a negative current collector, a negative electrode, a separator, a positive electrode and a positive current collector. The anode is made of graphite and the cathode material is lithium phosphate (LFP). The mathematical model is validated against the literature data for a 10 Ah LFP pouch cell operating under 1 C to 5 C electrical load at 25 °C ambient temperature. It is a commercial cell and can be employed for vehicle applications as it is a large format cell. The validated model is used to conduct statistical analysis of the most influential parameters that dictate cell performance, i.e., particle size ( r p ), electrode thickness ( L p o s ), volume fraction of the active material ( ε s , p o s ) and C-rate, and their interaction on the two main responses, namely; specific energy and specific power. This is to achieve an optimised window for energy and power within the defined range of design variables. The design factors are chosen in a way that they can be varied during the manufacturing process of a cell, in order to make the developed statistical model more applicable for industry.
In Section 2, the mathematical modelling approach is explained and contains the derivation of the electrochemical-thermal model along with the statistical analysis. Section 3 presents the model validation accompanied by simulation results of analysis of variance (ANOVA), which elaborates the main and combined effect of the factors as well as the optimised design of the cell. Further work and conclusions are discussed in Section 4 and Section 5, respectively.

2. Mathematical Modelling

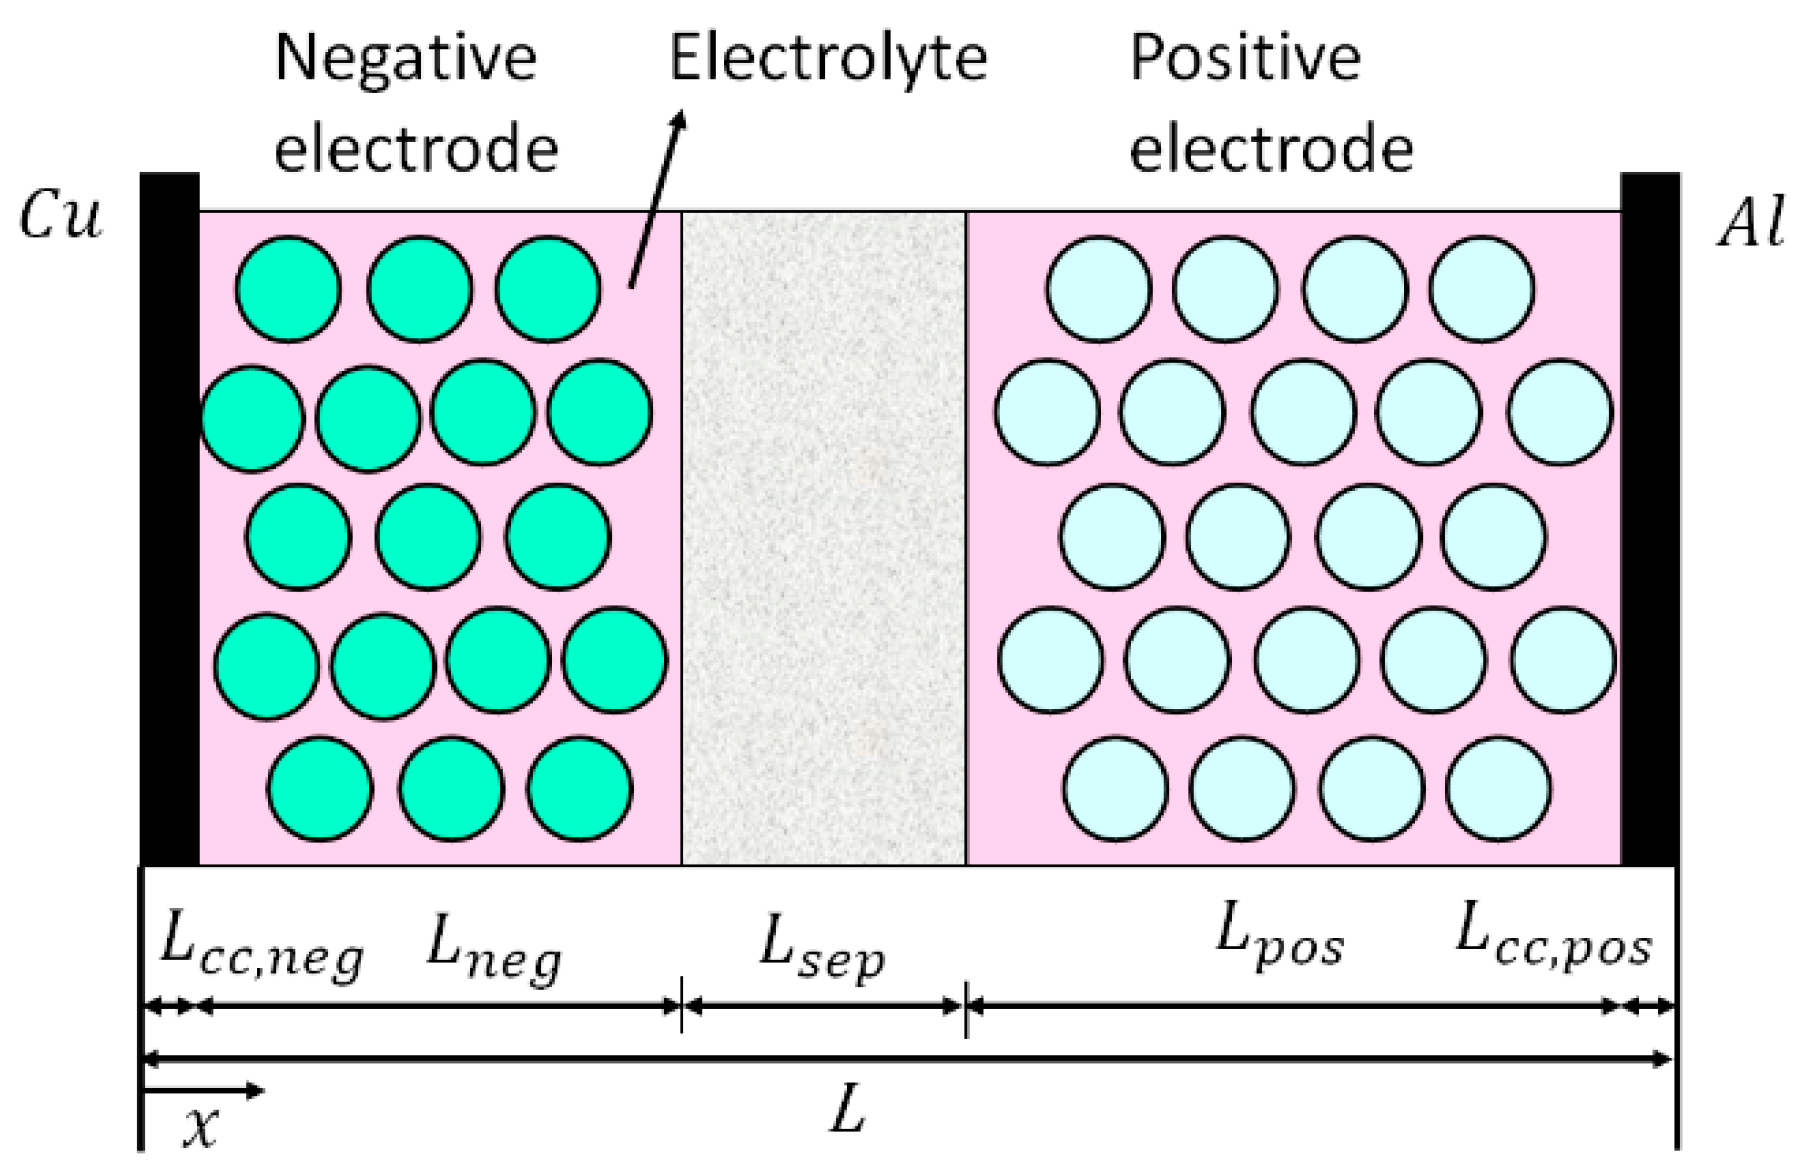
2.1. Electrochemical-Thermal Model

A single cell is made up of a number of pairs, connected in parallel by current collectors of both electrodes, and the collective behaviour of these pairs represents the overall cell performance. Each pair is assumed to be a sandwiched model of different layers, a negative current collector, a negative electrode, a separator, a positive electrode and a positive current collector. The electrodes are composed of porous materials, which are filled with electrolyte. The electrolyte can be liquid, solid or polymer. The porous separator is a membrane between the negative and the positive electrodes, which allows the transport of lithium ions from one electrode to the other one. Therefore it needs to be ionically conductive and electrically insulating to prevent the cell from short circuiting [26,27]. Current collectors are made from conductive materials. Typical materials for negative and positive current collectors are copper and aluminium, respectively. During a discharge event of a lithium ion battery the lithium is deintercalated from the anode, resulting in an equal number of electrons and ions at the particles/electrolyte interface. The chemical reaction only takes place at the surface of electrode particles that are in contact with the electrolyte. Lithium ions pass through the electrolyte and the separator and migrate to the cathode side where they react with the positive electrode. Diffusion of ions is driven by the lithium ion concentration. Electrons pass through the current collectors and the external circuit and generate electricity.
In this study, a 1D electrochemical-thermal model is developed for a single electrode-pair of a lithium ion battery with a LFP cathode. The model is based on a similar, experimentally validated model presented within Li et al. [28]. The inputs to the model are load current, geometrical design parameters, material properties and ambient operating temperature, while the outputs from the model are the responses of the cell to the load, i.e., terminal voltage (V), generated heat (Q), temperature profile (°C) and state of charge (SOC). Additional internal variables include: lithium concentration in the electrodes and the separator, potential distribution of different phases, reaction current, electronic and ionic current. The primary motivation for using Li et al.’s model [28] for verification, is because the authors have presented a complete set of electrochemical parameters for the cell along with a definition of parameter variations with temperature. Since the electrochemical model contains temperature dependent variables, coupling it with a thermal model yields more accurate results. Furthermore, the model presented in [28] has been validated using experimental data. The schematic geometry of a single electrode-pair is shown in Figure 1.
The current flowing through a single pair is calculated as follows:
I p a i r = δ c e l l N p a i r s
where δ c e l l is the capacity of a battery cell (including all pairs) and N p a i r s represents the number of electrode-pairs in the cell. The dynamic performance of the cell is characterized by the solution of four partial differential equations describing the time evolution of the lithium concentration profile in the electrode and electrolyte phases. The field variables to be calculated are C s , C e , ϕ s , ϕ e [26,28]. C s and C e are lithium concentration in the solid and the electrolyte phase, ϕ s and ϕ e represents the potential in the solid and electrolyte phase respectively. The variables are evaluated through solving electric charge conservation, mass conservation, electrochemical kinetics and energy conservation equations [26,29,30,31,32,33].

2.1.1. Mass Balance

Lithium in the Solid Phase

Identical particle size of active materials is assumed in the model. The distribution of lithium in the electrode is described by Fick’s second law:
( C s ) d t = D s r 2 r ( r 2 C s r )
where C s , is the lithium ion concentration at the surface of the electrode and D s is the lithium diffusion coefficient in the solid phase. No species source exists at the centre of the electrode particles, hence the boundary condition is defined as follows:
C s r | r = 0 = 0 , D s   C s r | r = r p = j L i a s F
where r p is the radius of the active material, a s is the reaction surface area and j L i represents the reaction current density.

Lithium in the Electrolyte Phase

The lithium ion distribution in the electrolyte is dependent on the lithium diffusion in the electrolyte ( C e ) , the electrode porosity ( ε e ), and the reaction current density ( j L i ). This phenomenon is expressed by Fick’s second law:
( ε e C e ) d t = · ( D e e f f C e ) + 1 t + 0 F j L i
where F is Faraday’s constant and t + 0 represents the initial transference number. Lithium cannot diffuse through the current collectors, as set by the following boundary condition:
C e x | x = L c c , n e g = C e x | x = L L c c , p o s = 0

2.1.2. Electronic Charge Balance

During a charge and discharge event lithium ions and electrons flow in reverse directions, charge conservation states that the amount of lithium ions has to be equivalent to the amount of electronic charge transfer.

Potential in the Solid Phase

The potential in the solid phase is a function of electrode conductivity, current collector conductivity and reaction current density as presented by the following equation:
( σ e f f ϕ s ) = j L i
At the electrode/current collector interface, the charge flux represents the external current, as expressed by:
ϕ c c | x = 0 = 0 ,     σ c c ϕ c c | x = L = I p a i r
Also, there is no charge flux at the electrode/separator interface as stated below:
ϕ s | x = L c c , n e g + L n e g = ϕ s | x = L c c , n e g + L n e g + L s e p = 0

Potential in the Electrolyte Phase

The potential in the electrolyte phase is dependent on the reaction current density as well as the local concentration of lithium as expressed in the following equation:
( k e f f ϕ e ) + ( k D e f f l n C e ) + j L i = 0
where k D e f f is the effective diffusional conductivity of the species. A zero gradient boundary condition is imposed at the electrode/current collector interfaces:
ϕ e x | x = L c c , n e g = ϕ e x | x = L L c c , p o s = 0

2.1.3. Electrochemical Kinetics—Reaction Current Density

The lithium concentration and charge distribution in the electrode and electrolyte phases, which are described through Equations (1)–(10), are coupled through the Butler-Volmer equation:
j L i = a s i 0 [ exp ( α a F R T η ) exp ( α c F R T η ) ]
The reaction surface area ( a s ), is the interfacial area between the two phases, i.e., the solid active material and the liquid electrolyte. The interfacial area can be calculated by treating the solid phase as a collection of uniform spheres, as displayed by the following equation:
a s = N p ( 4 π r p 2 )
where N p is the number of spheres per unit volume. The volume fraction of the active material ( ε s ) is given by:
ε s = N p ( 4 / 3 π r p 3 )
By combining the two equation the reaction surface area is evaluated as follows [34]:
a s = 3 ε s r P = ( 1 ε e ε f ) r p
where ε f is the volume fraction of the fillers. The exchange current density ( i 0 ) is a function of temperature and SOC and is expressed as:
i 0 = k i ( C e ) α a ( C s u r f , m a x C s u r f , e ) α a ( C s u r f , e ) α c
k i is the reaction rate which is temperature dependent. α is a dimensionless parameter, called the symmetry factor and defines the ratio between oxidation and reduction. The overpotential ( η ), is defined as the difference between the open circuit voltage (OCV) and the operating voltage of the positive/negative electrode.
η i = ϕ s , i ϕ e , i U r e f , i
The potential of the positive and negative electrodes are a function of local lithium concentration and are defined by using empirical expressions. The parameters and equations employed in this study for developing the electrochemcial-thermal model are elaborated in Appendix A.

2.2. Statistical Analysis of Design Variables

A statistical model is developed by ANOVA of the numerical data in a full factorial design framework [35,36,37,38,39]. ANOVA is primarily designed for the analysis of experimental data. However it is noteworthy that a number of comparable studies have also employed ANOVA on the numerical results from verified simulation models, for example: [24,40,41,42,43,44,45]. A full factorial design methodology is undertaken to analyse the results of the 1D electrochemical-thermal model and to determine the optimum energy and power by manipulating key design variables of the positive electrode. As highlighted in recent studies, cells that employ a LFP cathode material, the operation of the cell is more sensitive to the design of the cathode rather that the anode. This is due to the poor electronic conductivity and low solid diffusion coefficient of the LFP material [46]. For this reason, this study focused on understanding the optimisation of the cathode rather than the anode. It is noteworthy that the methodology employed is transferable to the anode.

2.2.1. Full Factorial Design

The most influential parameters that dictate cell performance are known to be particle size ( r p ), electrode thickness ( L p o s ), volume fraction of the active material ( ε s , p o s ) and C-rate. The effects of these four factors and their interaction on the two main responses, namely; specific energy and specific power are investigated. The design factors are chosen in a way that they can be varied during the manufacturing process of a cell, in order to make the developed statistical model more applicable for industry. In a 3-level full factorial design, each factor is varied over three levels within the determined ranges, as summarised in Table 1.
The range of variation of the design variables for LFP lithium ion battery is determined based on the data from literature [11,28,29,33,47,48,49], which is: r p : 30–100 nm, L p o s : 20–100 μm, ε s , p o s : 0.3–0.7, C-rate: 1–5. The number of required simulations in a 3 level full factorial design for four design variables is equal to 34, i.e., 81 numerical case studies. It is clear that investigating 81 test cases, having different designs is not feasible through traditional physical design and experimentation. A simulation based approach highlights one of the advantages of ANOVA in terms of cost and time. As discussed within [48], for the experimentalist it is very challenging to optimise the cell when facing with numerous variables. The model can assist in identifying limiting cell properties and once identified, the experiments can be designed.

2.2.2. Analysis of Variance

The contribution of each factor to the response (energy/power) is evaluated by the ANOVA, based on which the response is expressed as follows:
y = f ( r p ,   L i , ε s , C - rate )
A semi-empirical regression model is employed for analysing the responses, as given by [35,36]:
y = β 0 + β j x j + β i j x i x j + ϵ
where y is the predicted response, the β ’s are the coefficients to be determined, the x values are the factors and ϵ defines a random error term. The quality of the fitness of the regression model is defined by the value of the correlation coefficient ( R 2 ) value as well as the normal probability plot of the residuals. For an adequate model R 2 should be close to 1 [50]. In general for a well fitted model R 2 value should be above 0.9 [35]. Other important outputs from ANOVA are F-values (Fisher variation ratio) and p-values (probability value) [36]. p-Values define whether the effect of a term is significant or not. The calculations are based on the confidence level of 95%, meaning that if the (p-value < 0.05), the factor is significant. In addition, the order of significance for the influential factors is found by comparing the F-values. A higher F-value indicates that the factor is more significant.

3. Results and Discussion

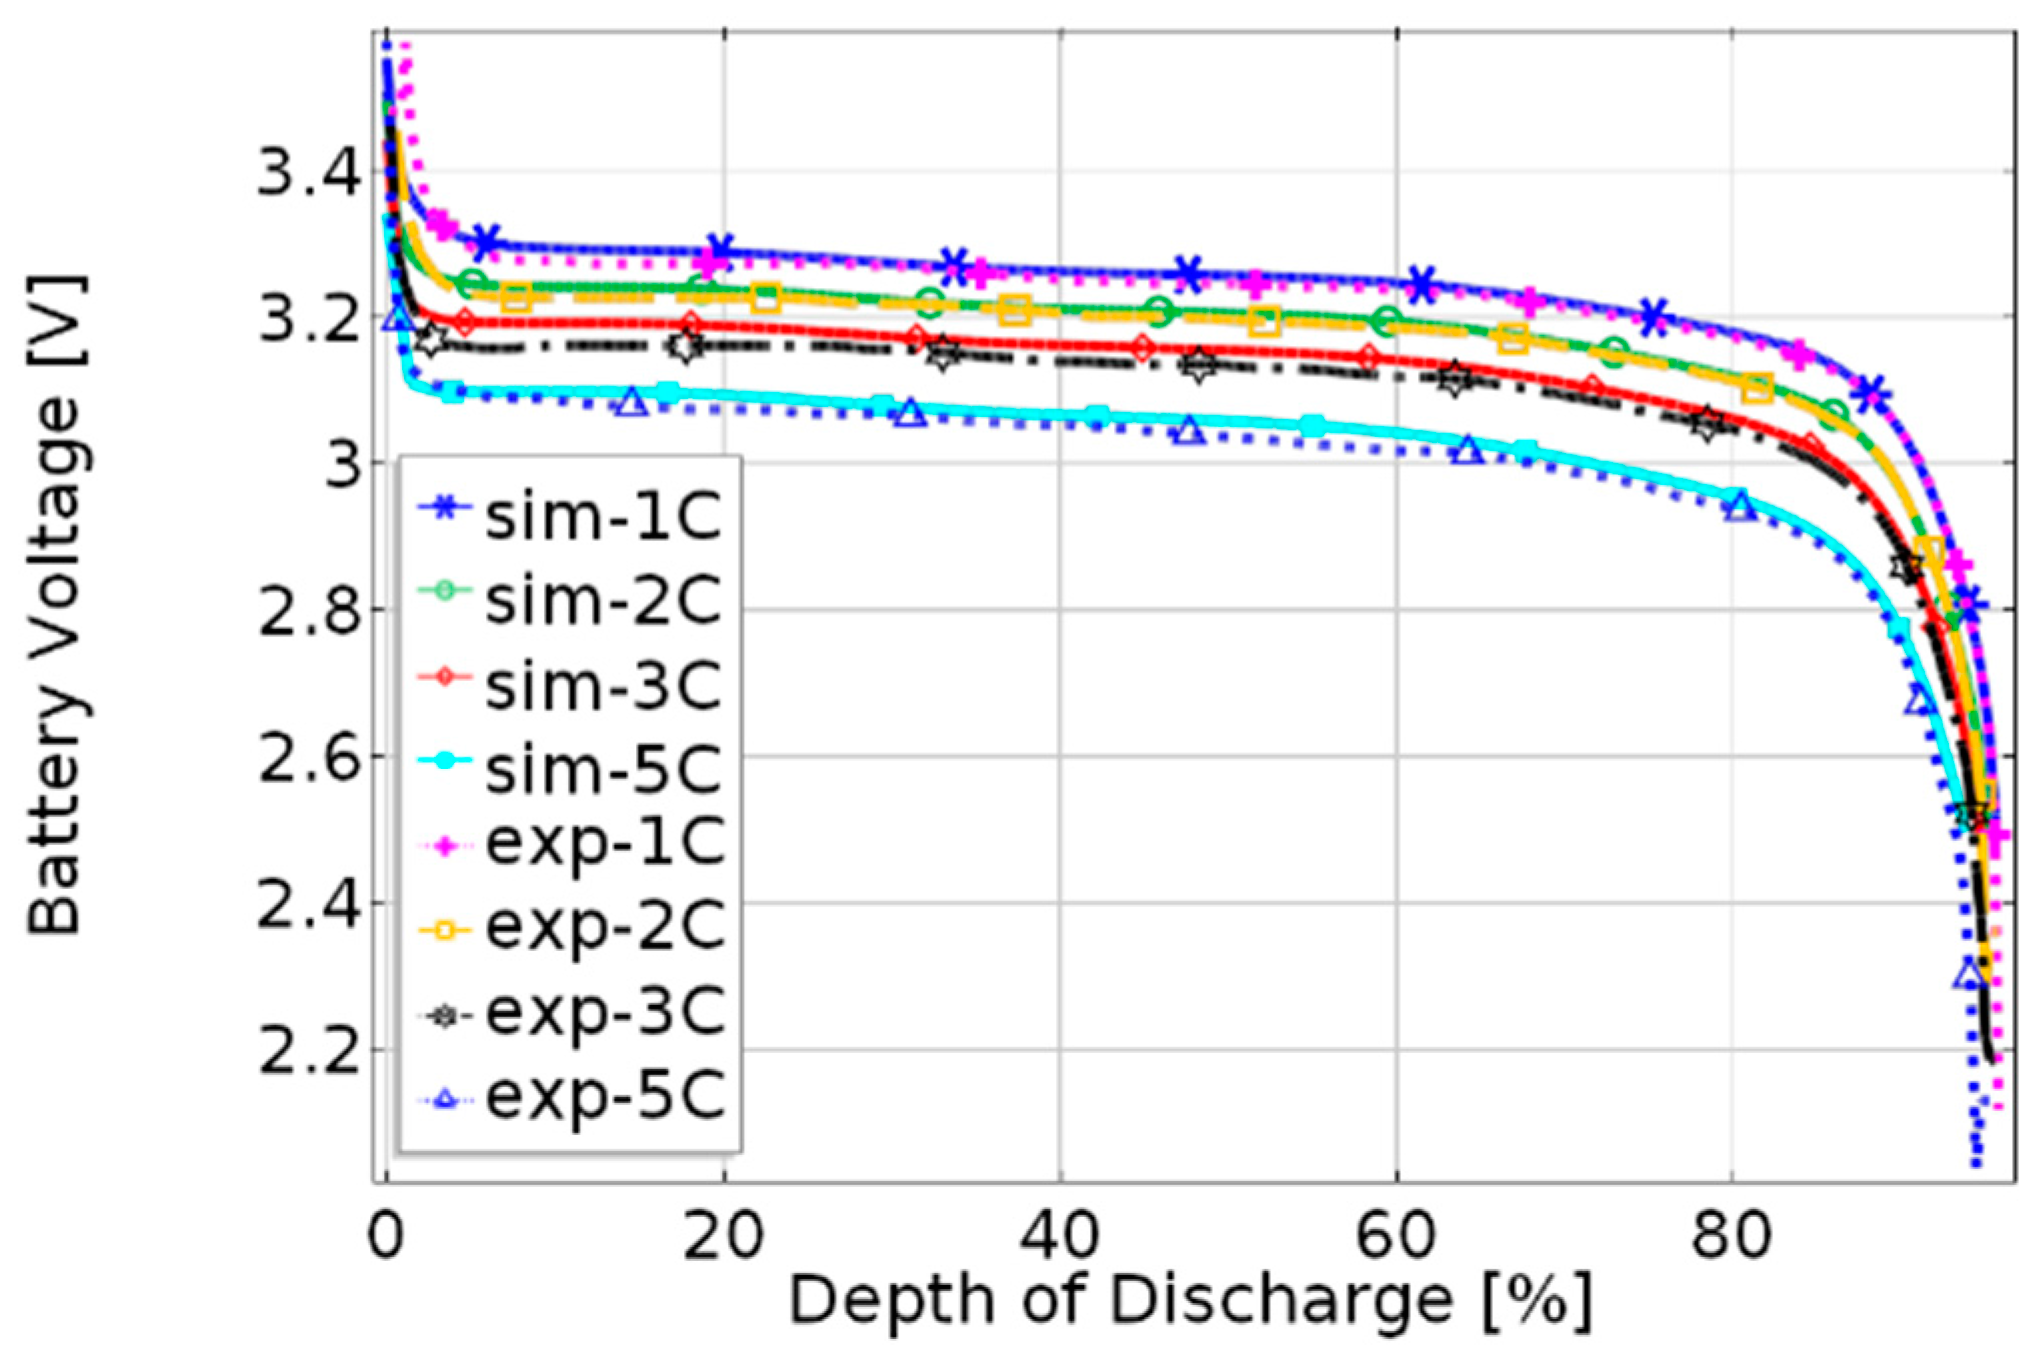
3.1. Validation of the Coupled Electrochemical—Thermal Model

A 1D electrochemical-thermal model is developed for a single electrode-pair of a lithium ion battery with LFP cathode. The model is based on a similar, experimentally validated model presented within Li et al. [28]. The input to the model is load current, geometrical design parameters, material properties and ambient operating temperature. The parameterisation data and experimental results presented within [28] allow for the creation of a reference model to ensure the accuracy and robustness of the model, before proceeding with the statistical analysis. The design parameters of the reference case are those reported by [28] and are summarised in Table 2.
The output from the model shows a high degree correlation with the results published within [28] in terms of the terminal voltage response when the cell is discharged, the surface temperature gradient and other internal parameters (e.g., local SOC, lithium concentration, potential and internal current). The discharge curve for the 10 Ah LFP pouch cell under 1 C to 5 C at 25 °C is presented in Figure 2. It is seen that there is a good agreement between the simulation results and the experimental data. The simulation results are generated by the 1D COMSOL model used in this study and the experimental data are those reported by Li et al. [28].
The validated model is used as a tool for simulating the 81 case studies (defined within Table 1) which are required for conducting the statistical analysis. For each case study the specific energy ( E c e l l ) and specific power ( P c e l l ) of the cell are defined as [51]:
E c e l l = 1 / m c e l l 0 t d i s V ( t ) · I · d t
P c e l l = 1 / ( t d i s · m c e l l ) 0 t d i s V ( t ) · I · d t
where m c e l l is the total weight of the cell and t d i s is the final time when the cell reaches the cut off voltage of 2.5 V.

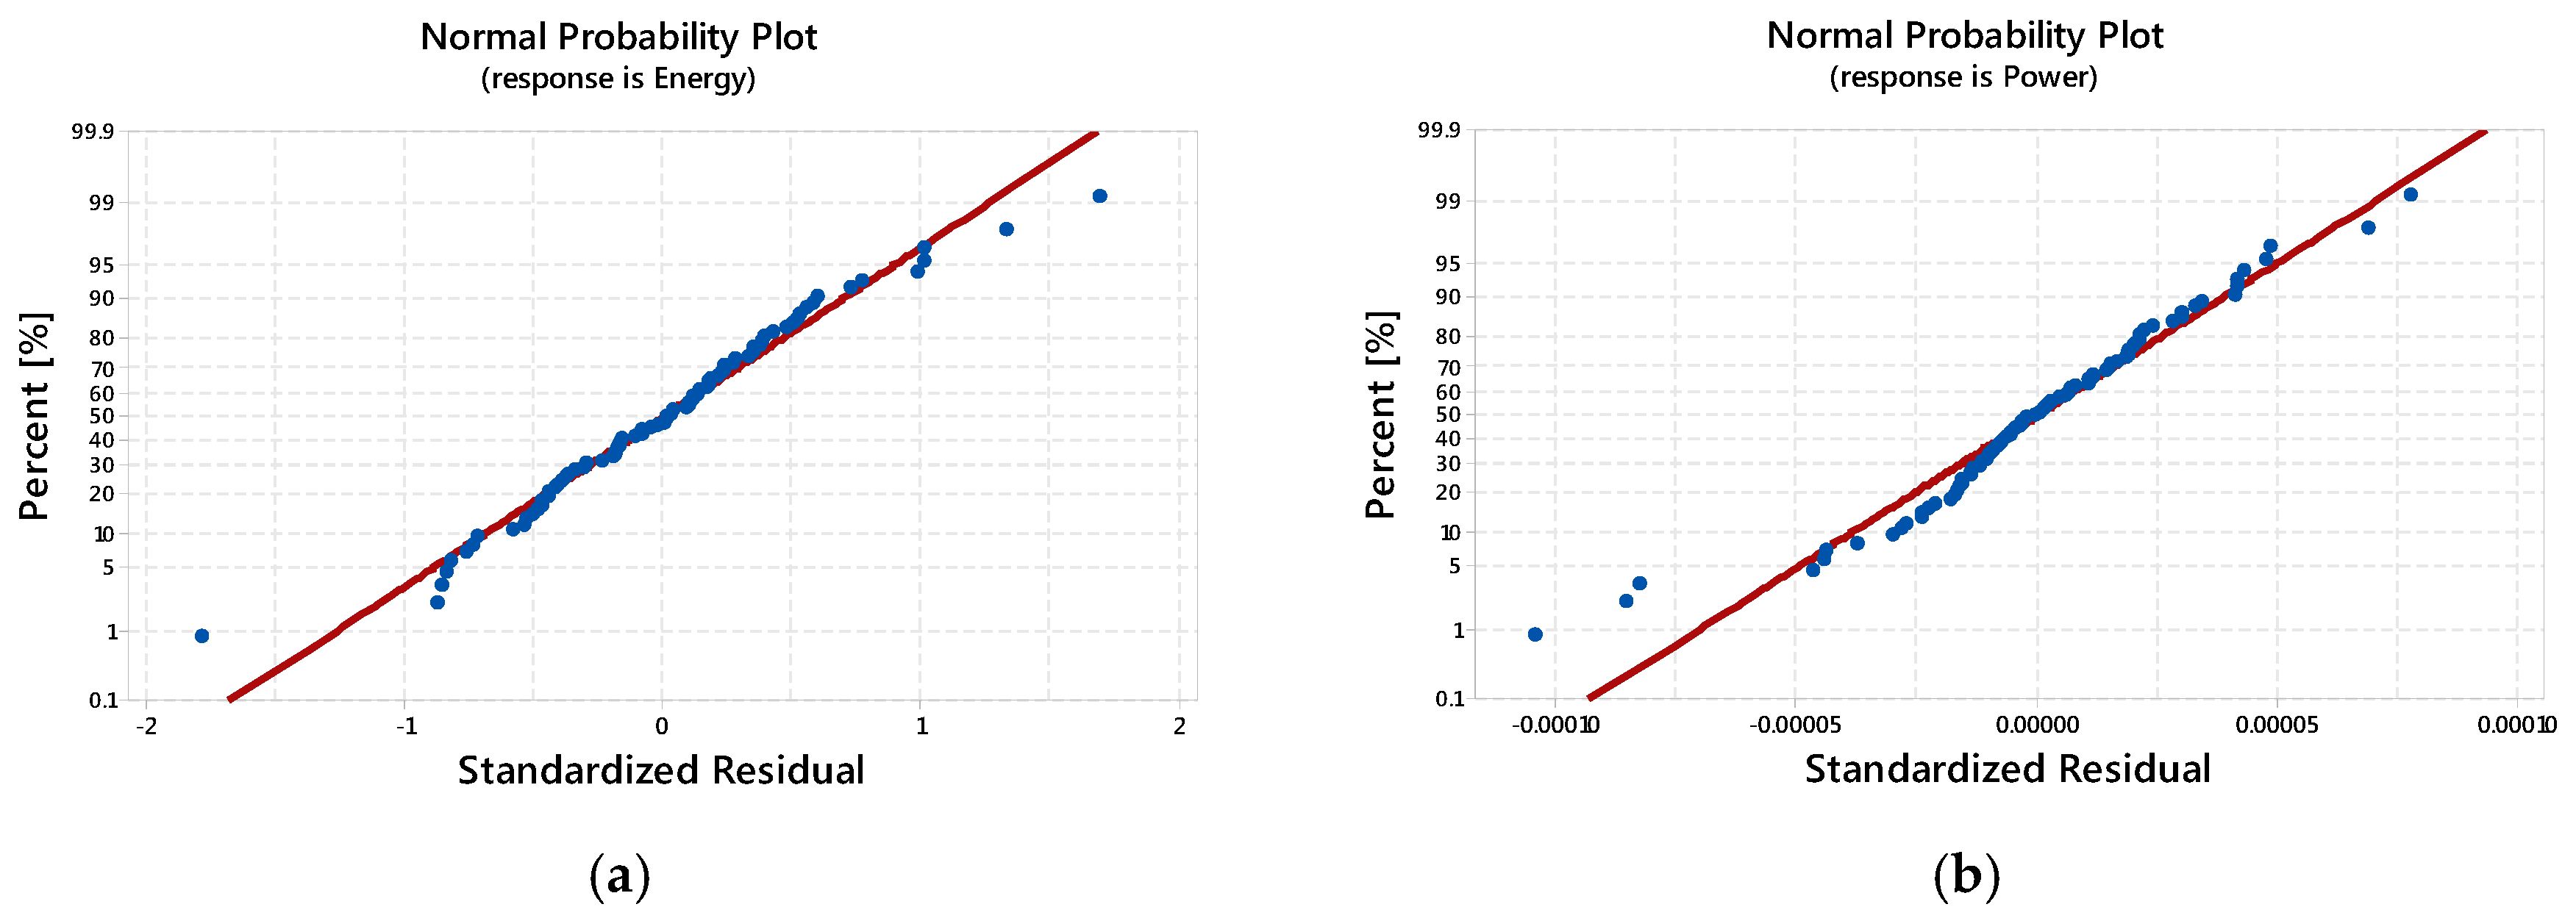
3.2. Results of ANOVA

The results of the fitted model derived from ANOVA for the selected responses, i.e., specific energy and specific power are shown in Table 3. In this study the R 2 values for the specific energy and power are equal to 96.04% and 100% respectively, verifying the high accuracy of the model.
As mentioned earlier, another important issue to check for the adequacy of the model is the normal probability plot of the residuals, as illustrated in Figure 3 for the specific energy and the specific power. The residuals follow a straight line, revealing that the fitted regression models are valid [50,52].
The p-values provide a cut-off beyond which it is asserted that the terms are statistically significant. Based on the displayed results for R1 in Table 3, except for ( r p × L p o s ), for which the p-value is higher than 0.05, the rest of the factors are significant and the achieved specific energy of the cell is highly influenced by those factors.
The ranking of the effective factors in the regression model, within the determined range, based on their impact on specific energy, R1 is as follows:
R 1 :   L p o s > r p > ε s , p o s > C > L p o s × ε s , p o s > r p × ε s , p o s > r p × C > L p o s × C > ε s , p o s × C
In respect to the specific power, based on the presented results for R2 in Table 3, all the factors except for ( r p   × C) are significant and the order of significance is as follows:
R 2 :   C > L p o s > L p o s × C > ε s , p o s > L p o s × ε s , p o s > r p > r p × ε s , p o s > ε s , p o s × C > r p × L p o s

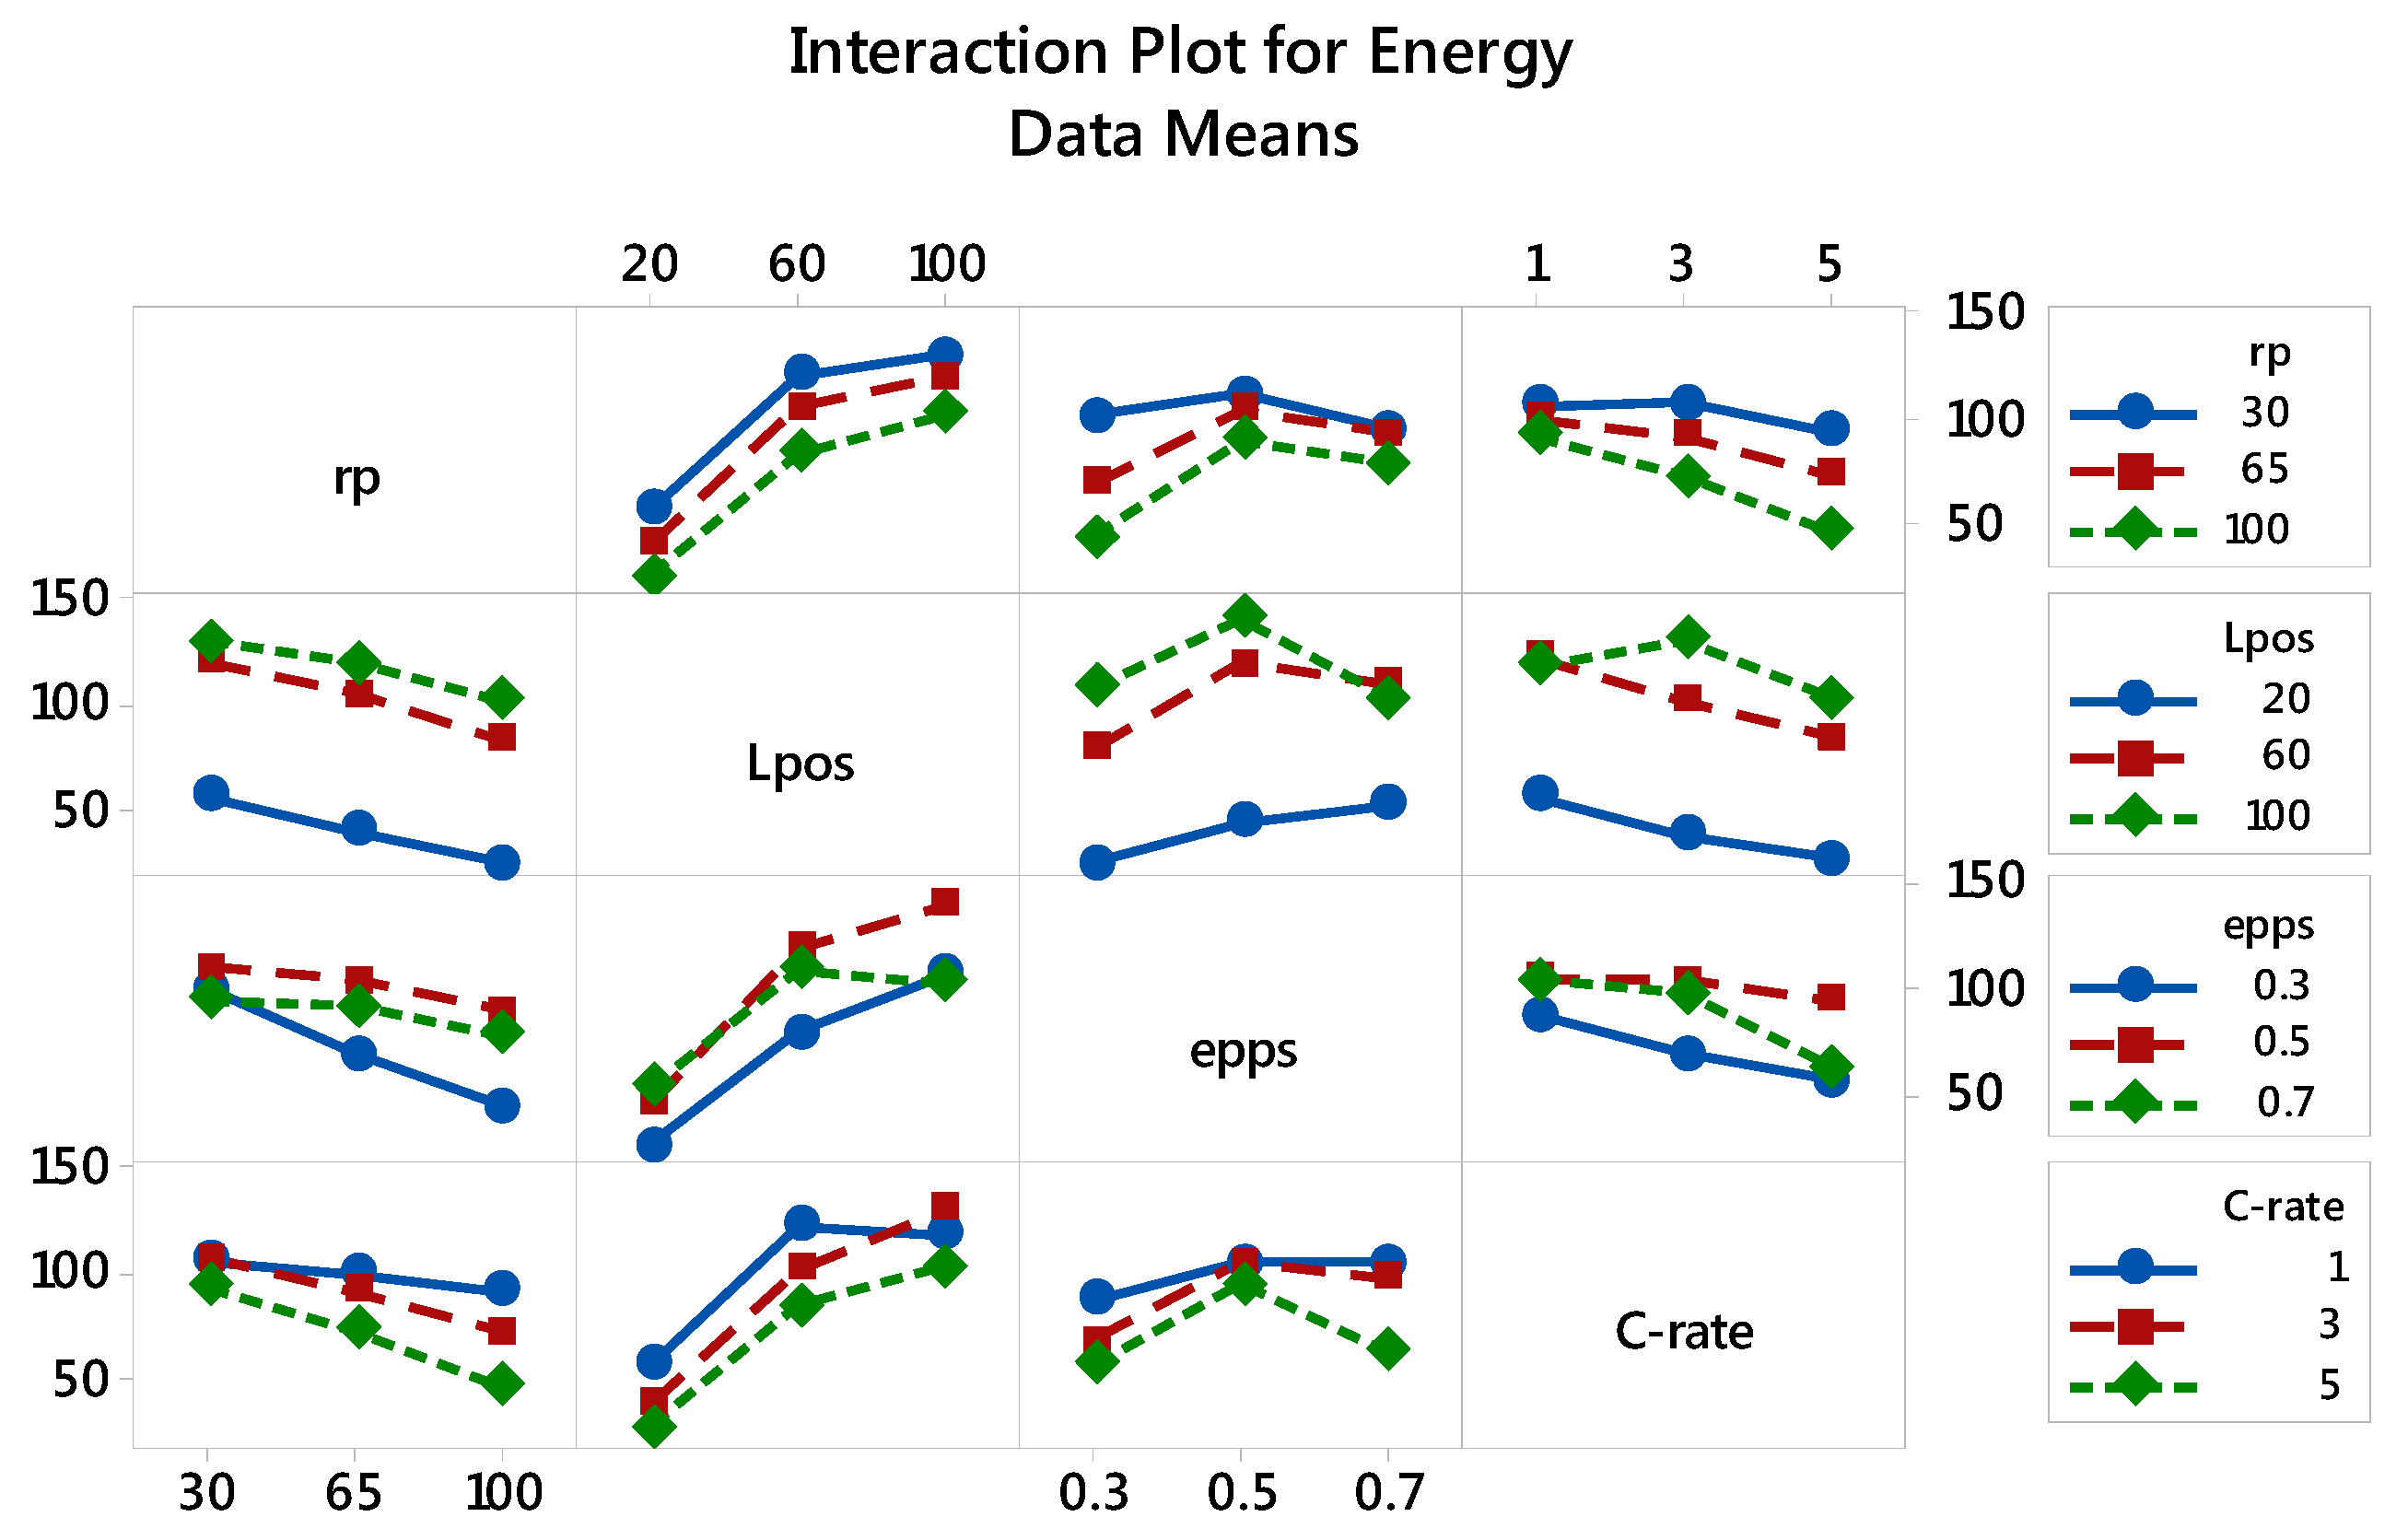
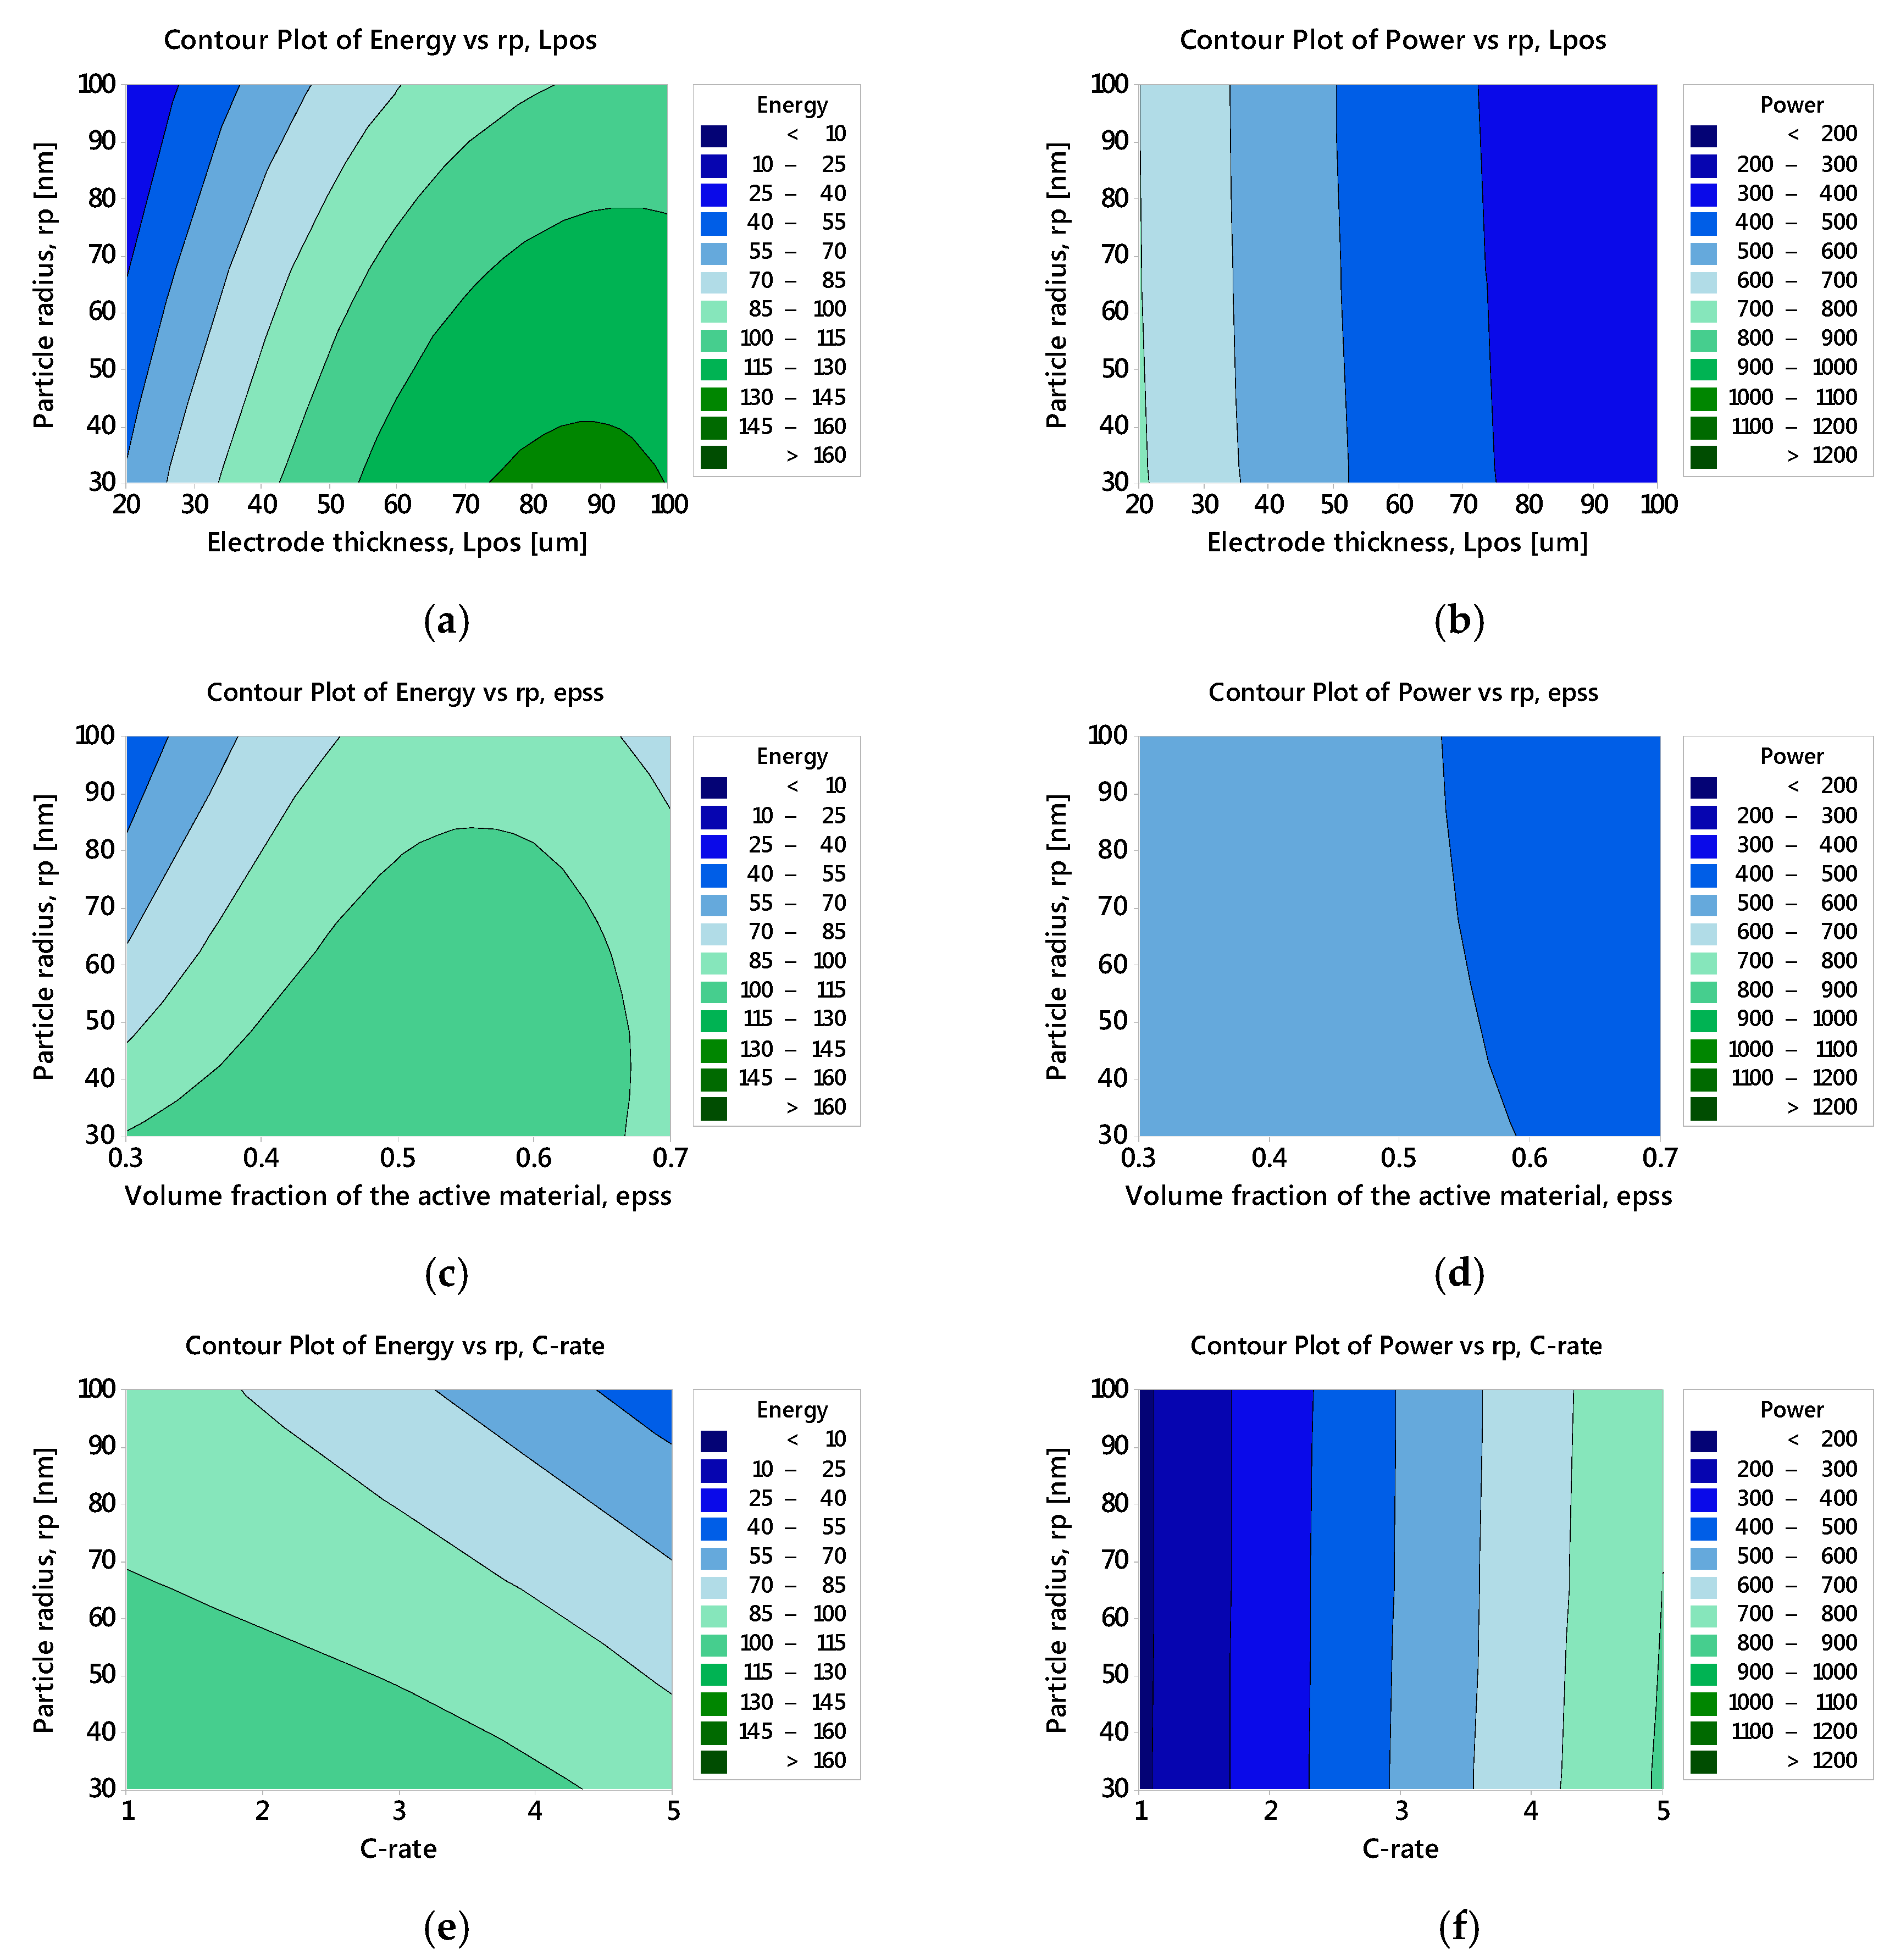
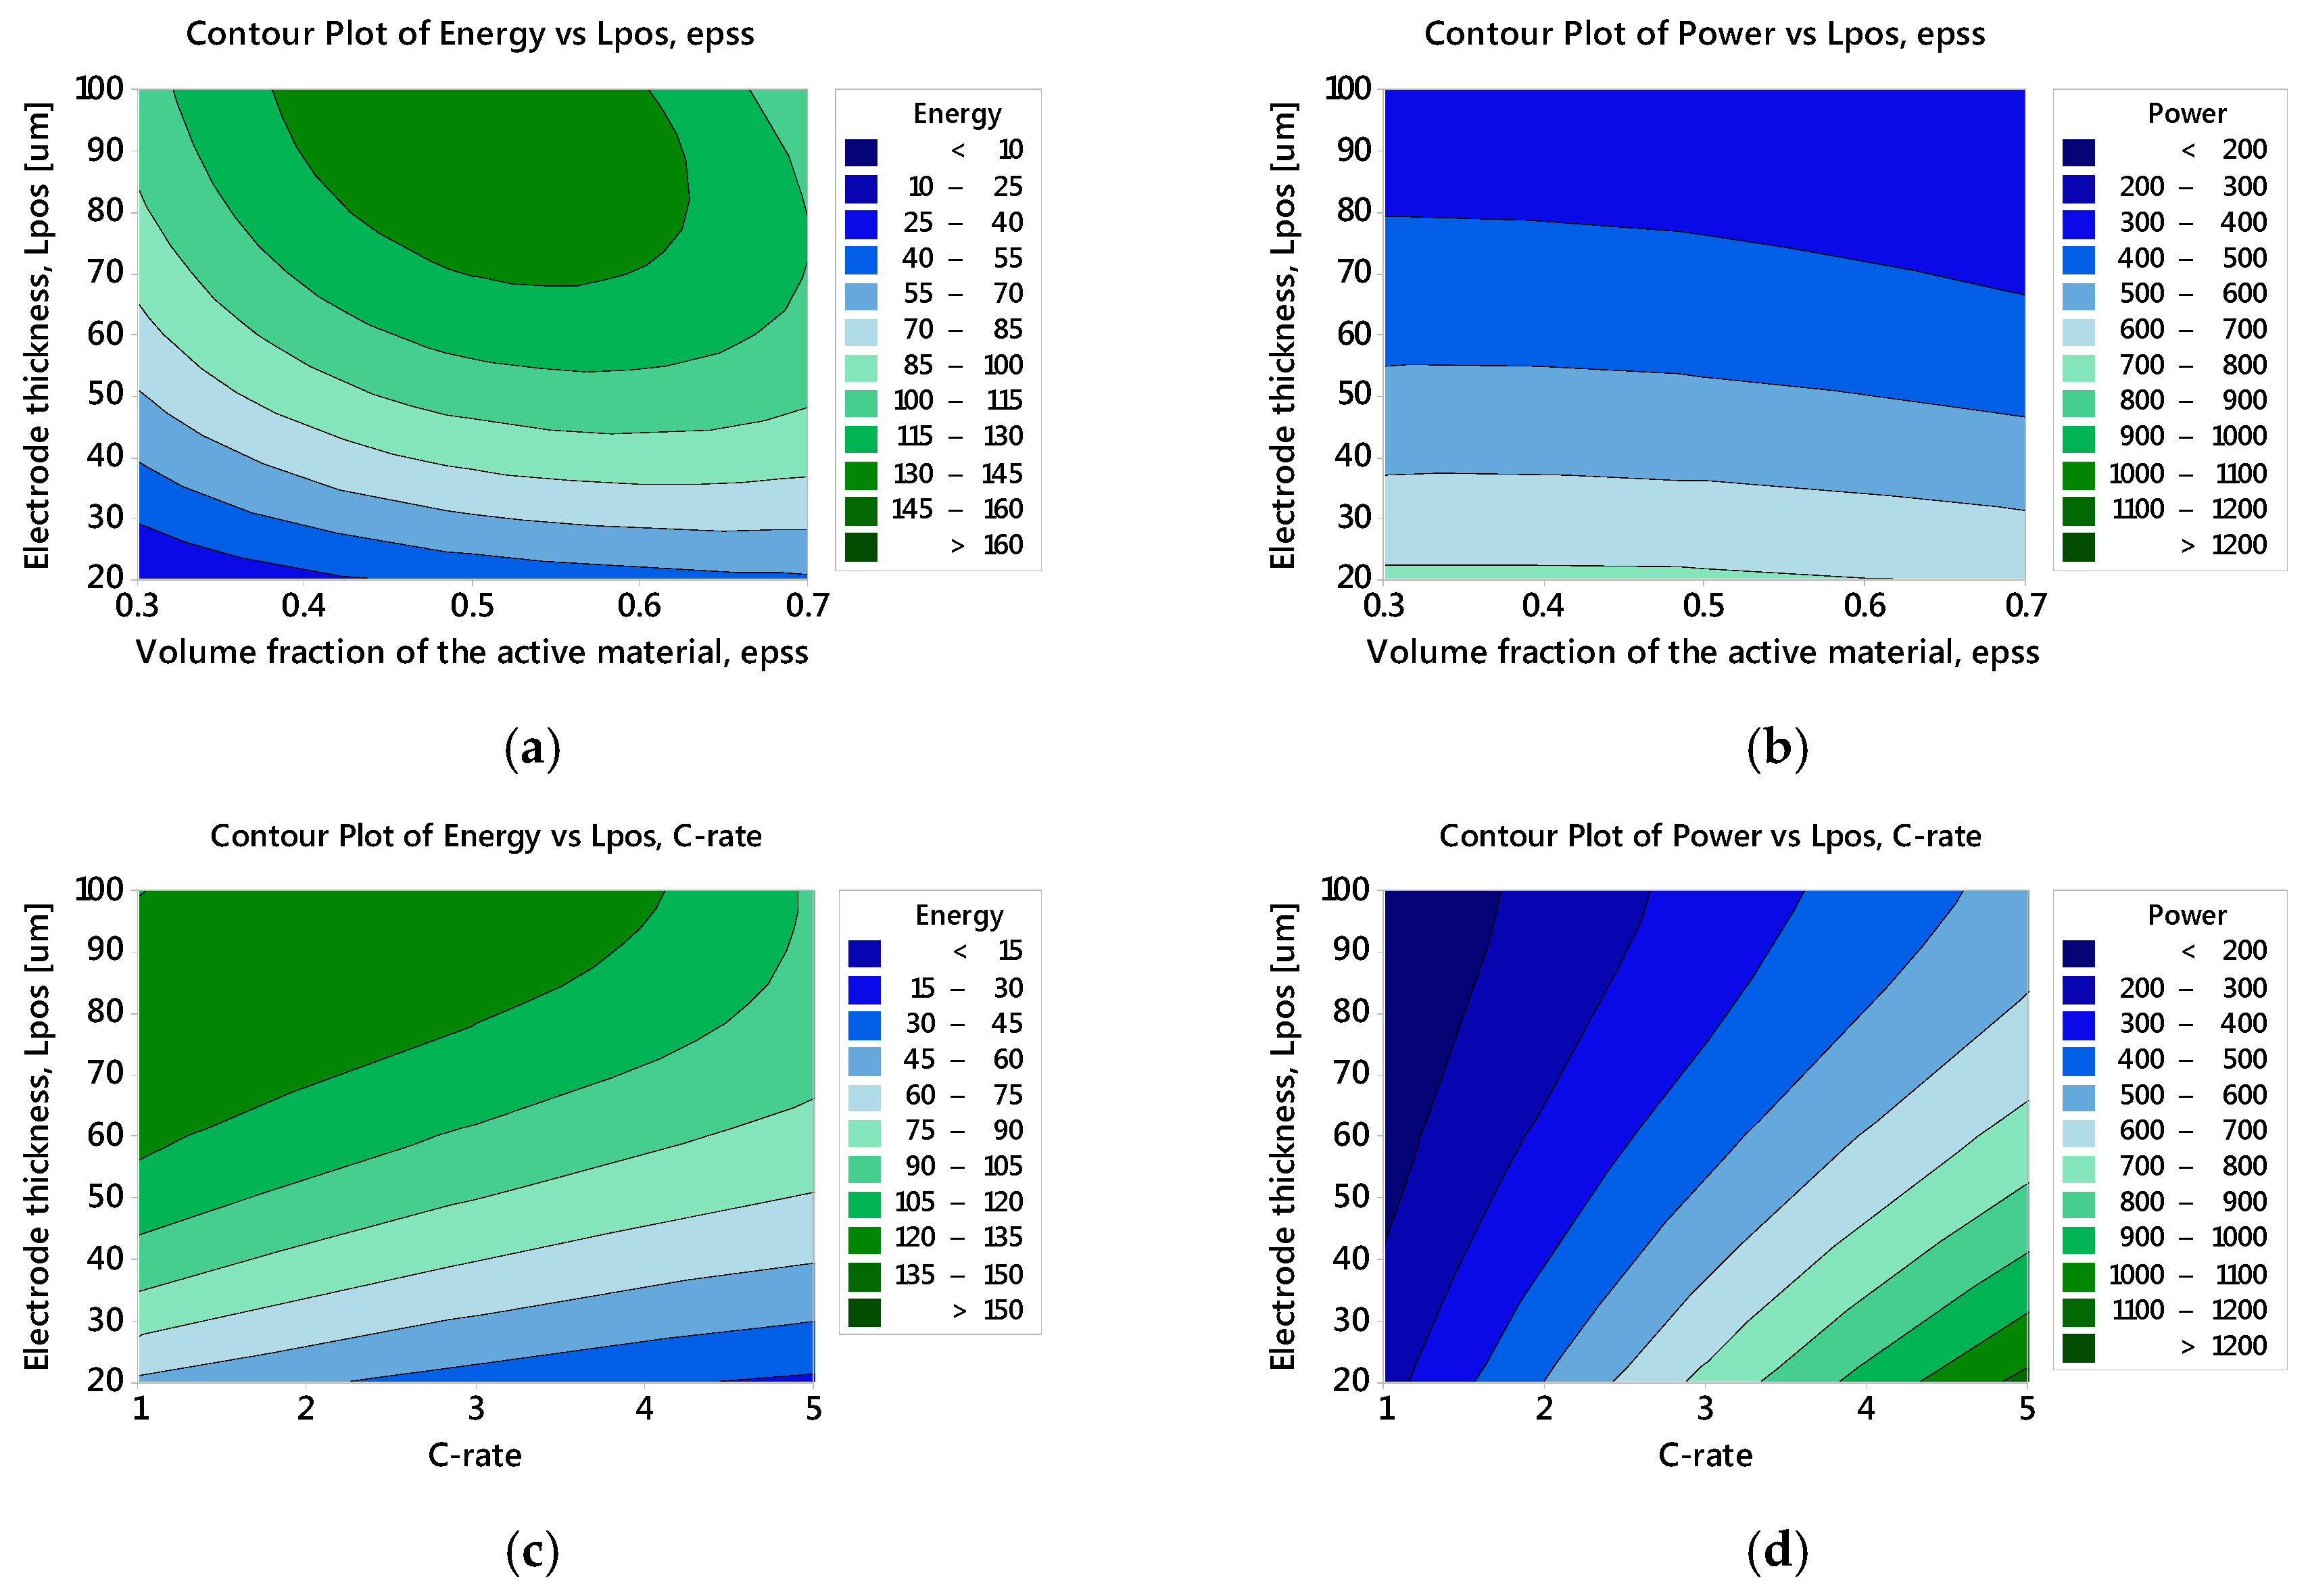
3.2.1. Specific Energy: The Main and Interaction Effects of Factors

The main effect plot reveals the sole effect of the factors individually on a response, in which the mean value of the response is displayed for each factor level. Figure 4 shows the main effect plot of the factors on the specific energy. It is seen that as r p increases from 30 nm to 100 nm the specific energy decreases significantly. This can be attributed to the diffusion time ( t d i f ), which is defined as:
t d i f =   r p 2 / D s , p o s
where D s , p o s is the lithium ion diffusion coefficient in the positive electrode [24]. Using smaller particles can reduce the diffusion time, which in turn increases the intercalation rate. Consequently, it can enhance the rate of the electrochemical reaction. On the other hand smaller particles have a larger surface area per unit volume which leads to a lower kinetic resistance [53].
The proper cell design requires a right balancing of the electrodes and it is known that the capacity of the electrodes is proportional to the weight of the active materials which itself is function of electrode thickness and volume fraction of the active materials. Hence, in this study the thickness of the negative electrode was varied proportional to the film thickness of the positive electrode to keep the right balancing. By increasing the thickness, the energy keeps increasing as more active material is available. As shown in Figure 4, by increasing L p o s from 20 μ m to 60 μ m the energy increases quite rapidly, but from 60 μ m to 100 μ m the rate of energy improvement reduces significantly which can be attributed to the higher transport resistance of the thick electrodes.
By increasing ε s , p o s from 0.3 to 0.7, the energy increases first until it reaches to the point at which the capacity of the positive and the negative electrodes are identical. After that, further increasing of the active volume fraction of the positive electrode cannot improve the energy any more as the capacity of the negative electrode will be the limiting factor.
Higher C-rates replicate a higher current, and it is known that the rate of the electrochemical reaction is higher under this condition. Hence, due to limitations in the ionic and electrical conductivities, higher kinetic resistances is observed, which in turn causes a significant energy loss [54]. This is in agreement with the results in presented Figure 4, which illustrates by increasing the C-rate from 1 C to 5 C, the energy drops significantly.
One of the key findings from ANOVA is, clarifying the interplay between the different factors, and hence establishing a process window for a desired range of a certain predefined response, specific energy and power in this study. Figure 5 illustrates the second order interactions of any two factors on the specific energy.
Based on the ANOVA results presented in Table 3, among the second order interactions, ( L p o s × ε s , p o s ) was found to be the most significant factor, and it is clearly displayed in Figure 5. From the main effect plot, Figure 4, L p o s has a positive effect on the specific energy. However, ( L p o s × ε s , p o s ) plot reveals that at ε p o s = 0.3–0.5, by increasing L p o s , higher energy can be achieved, whereas the energy does not follow the same pattern at higher ε p o s values. For ( ε p o s > 0.5 ) , increasing both ε p o s and L p o s at the same time leads to an energy drop and the reduction rate is higher for higher active volume fraction.
The next important factor is the interaction of ( r p × ε p o s ). As seen r p has a negative impact while L p o s does not show a monotonic effect on the energy. The interaction plot shows that by increasing the particle size (from 30 to 100 nm ) at low ε s , p o s the energy drops rapidly. However, the sensitivity of the energy to the particle size is less pronounced at higher ε s , p o s , where a higher portion of active material is available and it will compensate the energy loss. r p and C rate both have a negative effect on the energy. The same trend is displayed in their interaction plot, ( r p × C ). Moreover, the derived results show that at higher C-rates the energy is more sensitive to the particle size. Meaning that for high C-rate application small particle are more desirable while at lower C-rates there is a bigger window for the optimum r p . Lower r p increases the intercalation rate, which in turn it takes a shorter time for the lithium ions to diffuse through the solid particles. This is particularly advantageous for high C-rate application where the discharge time is quite short.

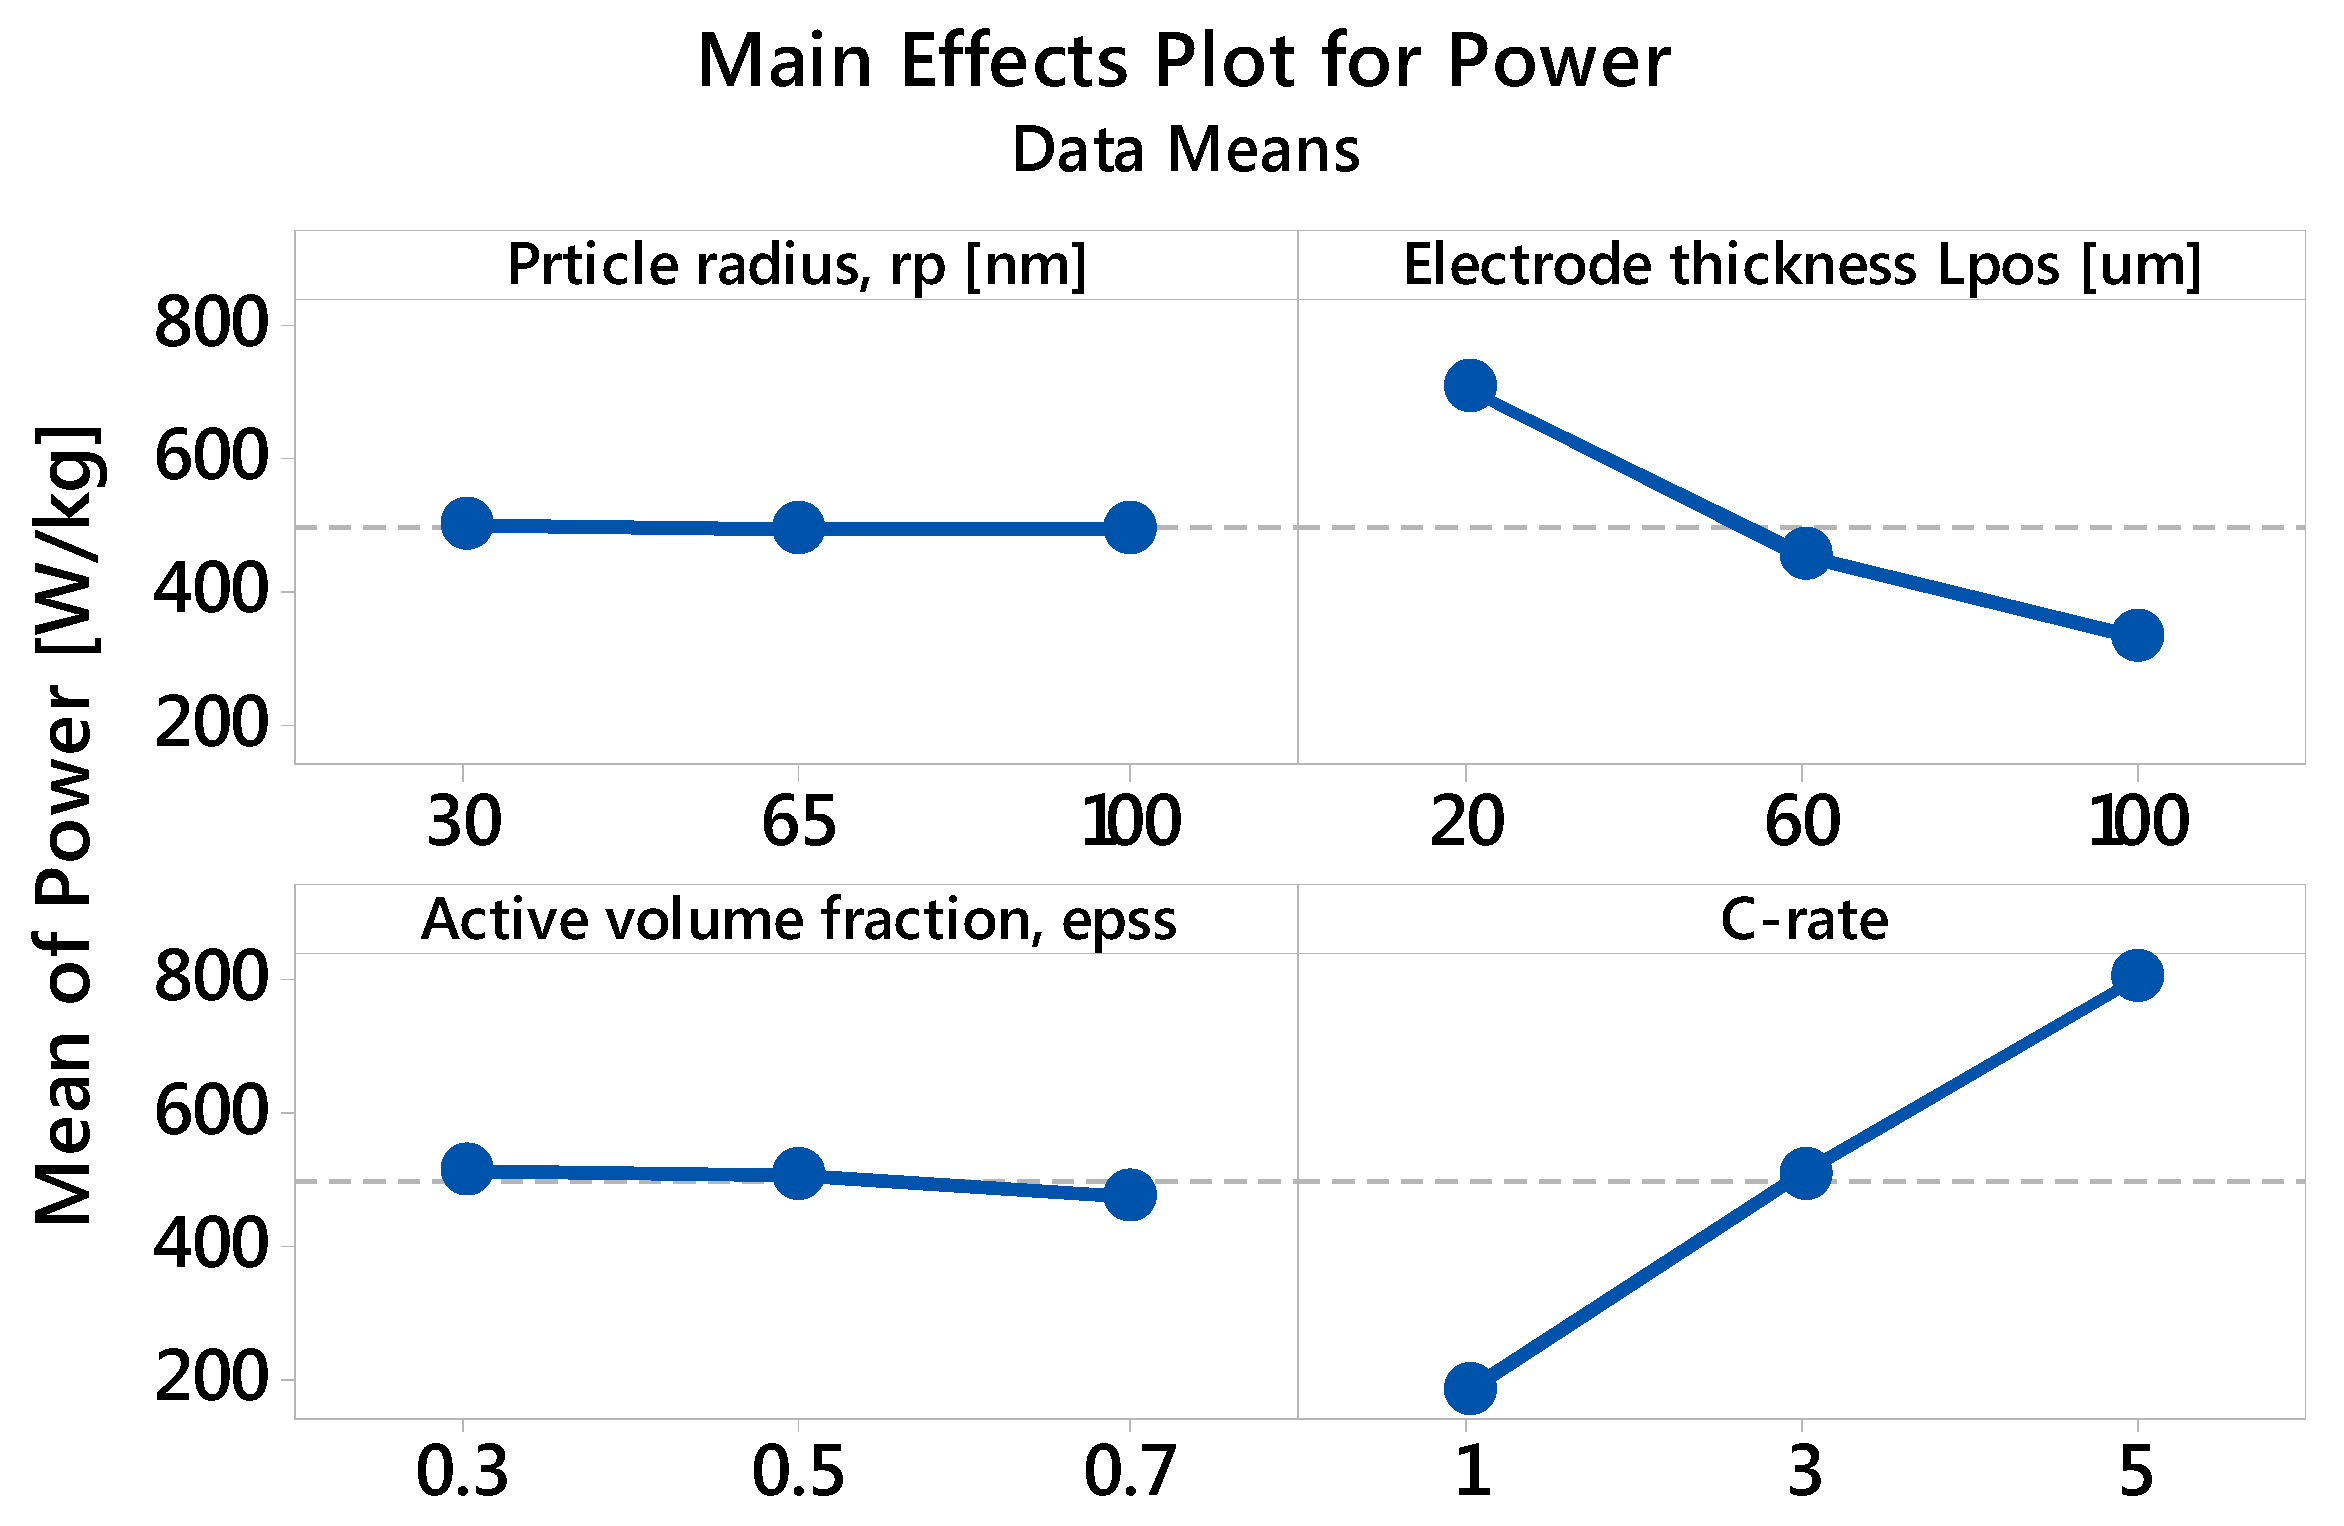
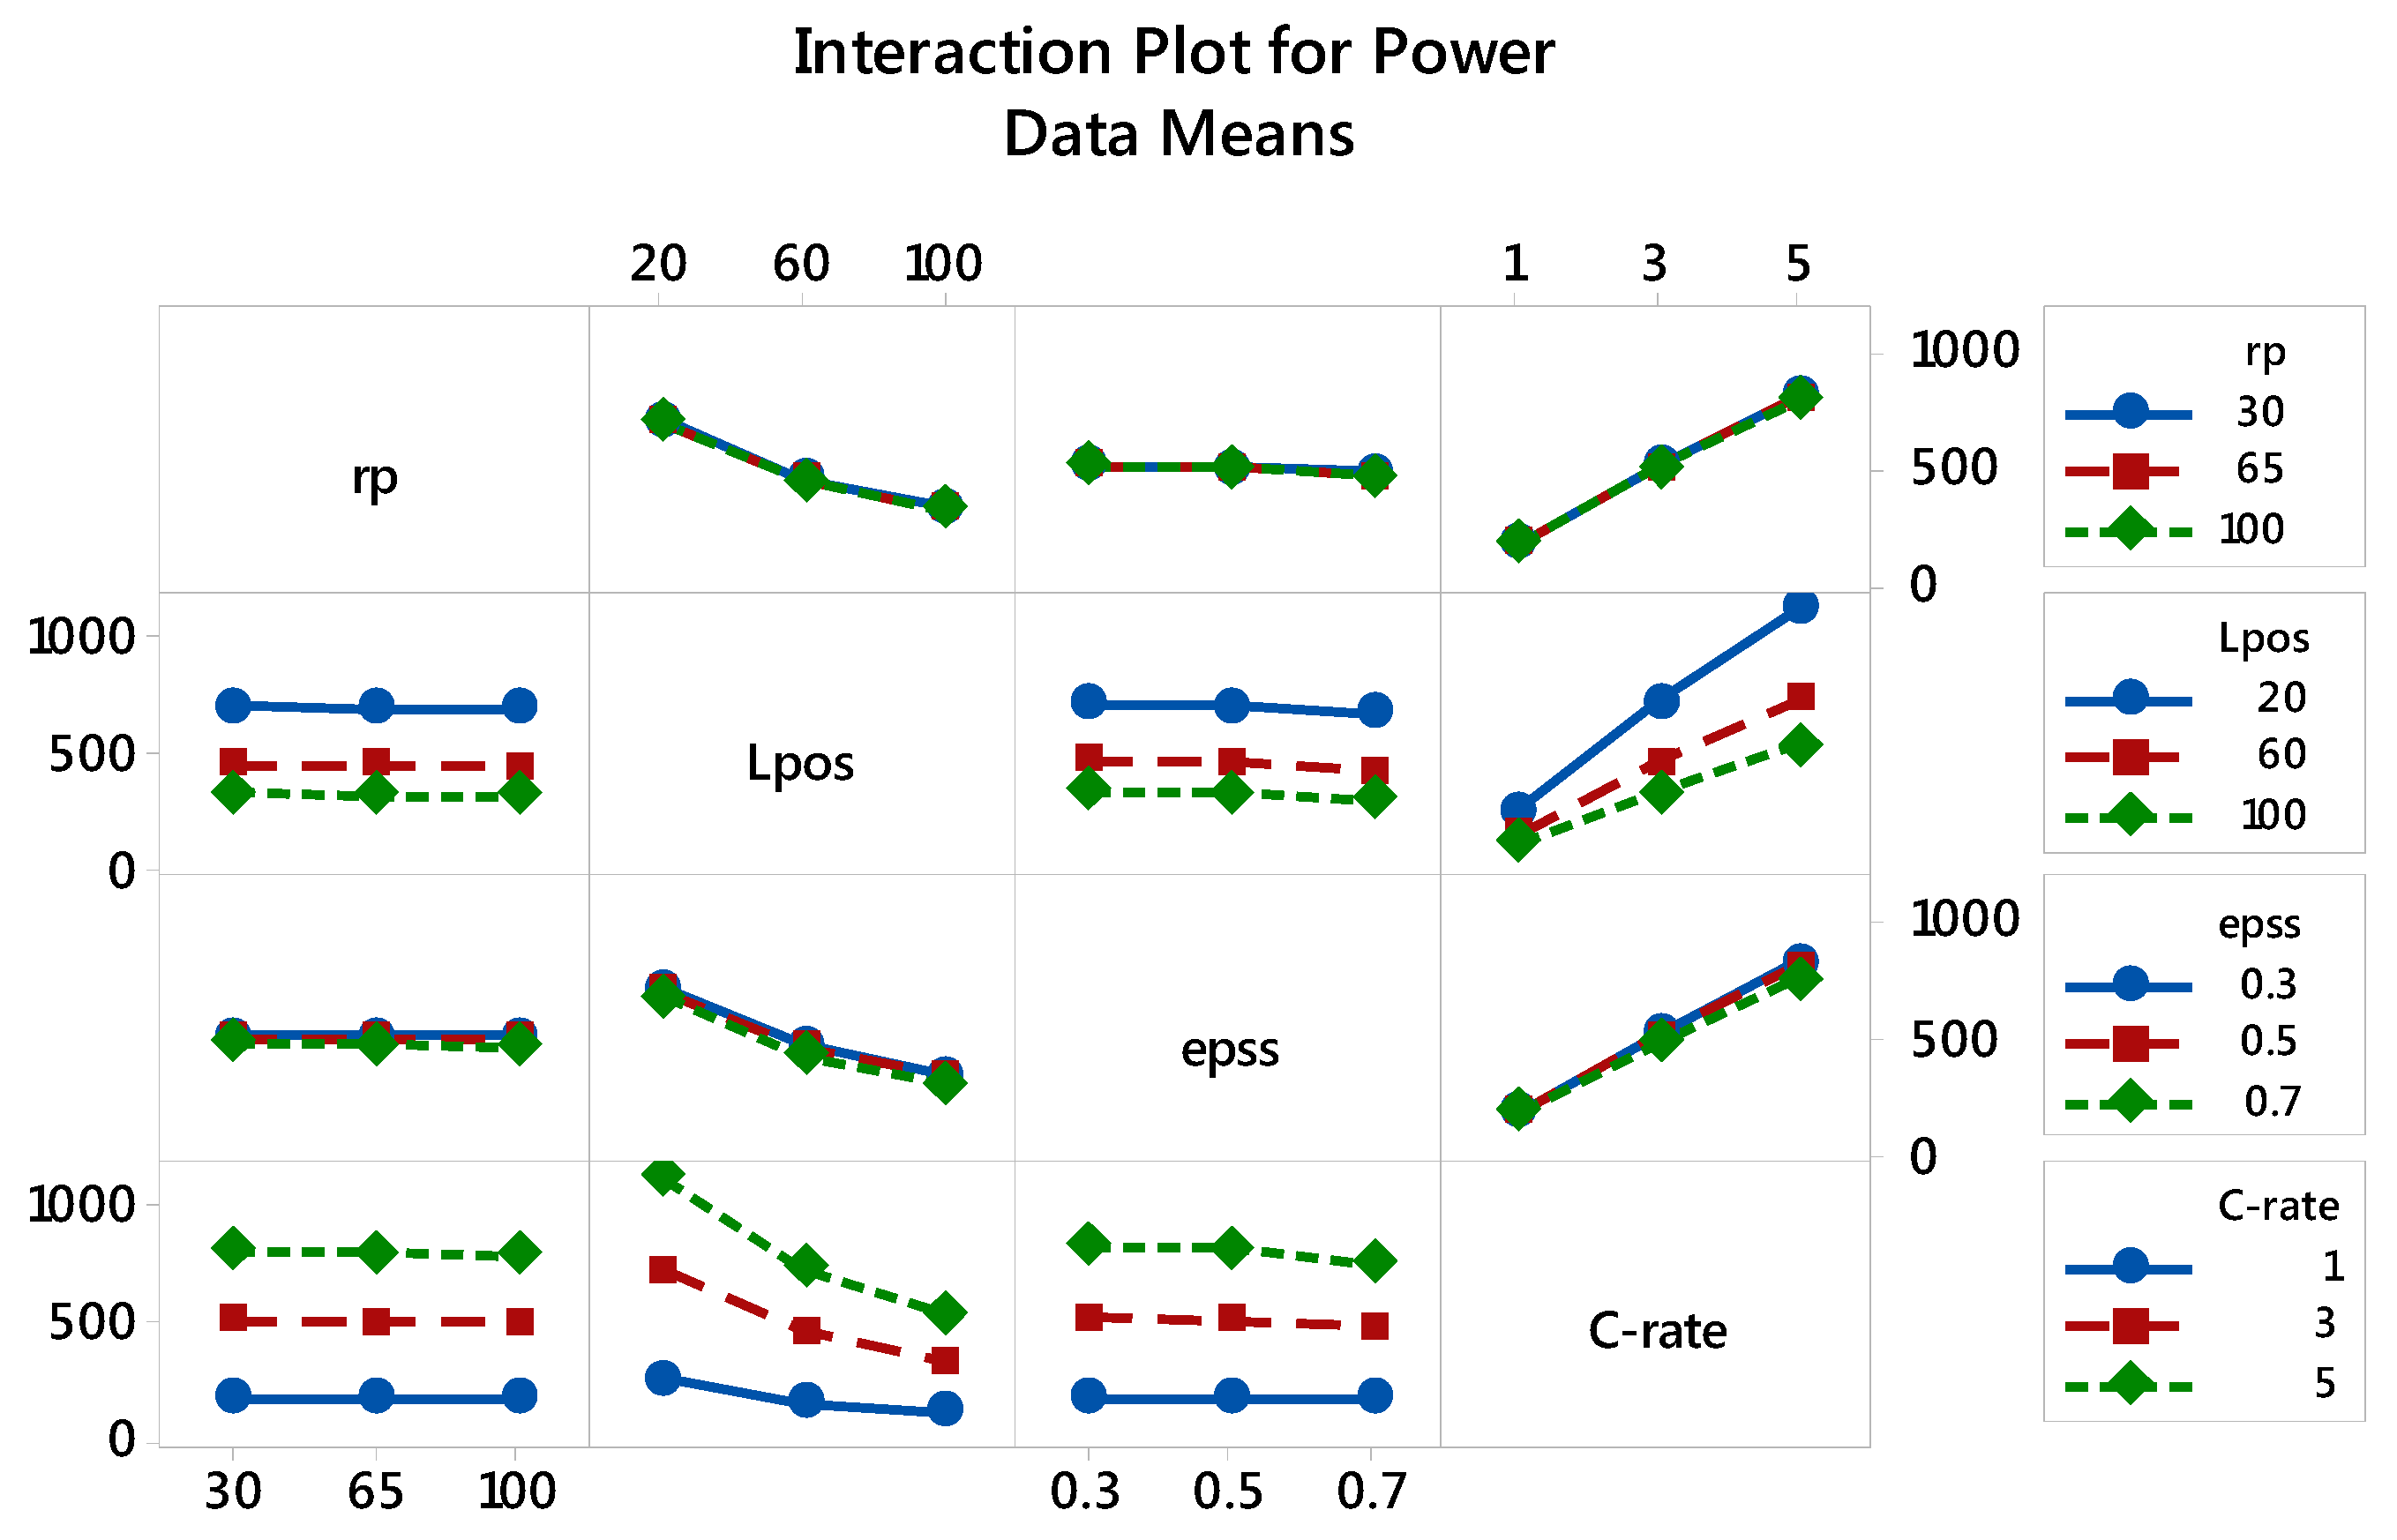
3.2.2. Specific Power: The Main and Interaction Effects of Factors

Figure 6 presents the main effect plot of the design parameters on the specific power. It is shown that the particle size of the positive electrode does not have a significant effect on the power. Moreover, the power reduces for thicker electrodes, which is due to longer transport length of the ions and electrons. In addition to that, the electrode volume fraction does not have a significant effect on the power, however by increasing ε s , p o s from 0.3 to 0.7 the power is slightly reduced. That is because of the lower ionic conductivity of the positive electrode at high ε s , p o s . Finally, it is clearly observed that, the power linearly increases by the C-rate, which is in agreement with the Ohm’s law.
The same kind of combined influence as for energy, is shown for the specific power (see Figure 7). L p o s has a negative effect on the power, whereas C-rate has a positive effect. Their interaction, ( L p o s ×   C ), shows that the thickness of the electrode becomes a more influential factor as the C-rate increases, whereas at 1C the thickness does not have a significant impact on the power.
The behaviour of the power to the interaction of ε p o s and C-rate, ( ε p o s ×   C ), is not monotonic. For example by varying ε p o s from 0.3 to 0.5, the power does not change irrespective of the C-rate. However, their combined effect is more pronounced at high active volume fraction when the C-rate is high. By increasing ε p o s from 0.5 to 0.7 under 5 C discharge load, the power drops with a higher rate in comparison to lower C-rates.

3.2.3. Optimised Battery Response

The optimised response is derived from the developed regression model through statistical analysis with much less simulation effort [45]. Such results help to understand the existing interactions between the variables and to achieve the optimum design for a particular application. Figure 8 presents the contour plot of the specific energy and the specific power as a function of electrode thickness and particle size (Figure 8a,b), volume fraction of active material and particle size (Figure 8c,d), as well as C-rate and particle size (Figure 8e,f).
Discrete regions represent different energy or power levels as stated in the plots. The plots highlight the impact of two factors on the response simultaneously. By analysing the combined effect of different factors on the response the optimum range can be achieved. Having r p and L p o s as variables (Figure 8a,b), the maximum energy is attained for 75 < L p o s < 100 and r p < 40 nm. For r p > 40 nm the energy constantly reduces. From the power contour, it is observed that as the thickness of the electrode increases the power decreases. Hence, it is important to select a range of design variables in which the energy to power ratio is satisfactory for a specific application.
Besides r p and L p o s , ε p o s has also a significant effect on the energy. As displayed for porous electrodes, the particle size should be very small, below 40 nm, to achieve the optimum energy and yet the optimum region is quite restricted. On the other hand, from the power graph it is observed that, the power is not very sensitive to the interaction of these factors ( r p and ε p o s ). On the other hand, from the power graph it is observed that, the power is not very sensitive to the interaction of these factors ( r p and ε p o s ), and irrespective of the particle size, a higher power is obtained as the porosity increases. C-rate is another important factor to be considered when designing a battery. In general, the design of batteries operating at high C-rates is more crucial for achieving high power and energy. For example, at 1 C-rate, by changing the particle size from 30 nm to 100 nm, the energy drops by 21.6%, whereas the energy reduction reaches 55% when operating under a 5C discharge. In contrast to the energy, the power is not highly affected by the particle size. However, C-rate has a greater impact on it and as the C-rate increases the power is monotonically increasing.
The combined effect of ( L p o s , ε s , p o s ) as well as ( L p o s , C ) on the batteries responses is presented in Figure 9. The energy plot based on ( L p o s and ε s , p o s ) shows a circle for the optimum energy where 70   <   L p o s   <   100 and 0.4   <   ε s , p o s   <   0.62 , and outside this area the energy decreases. Moreover, from the power contour it is observed that for low porous electrode, 0.6 < ε s , p o s < 0.7 , a lower power is obtained. In general, for having a reasonable power at high ε s , p o s , the electrode should be quite thin. Otherwise the power reduction is substantially high, especially at higher C-rates.
The maximum energy is achieved for C-rates less than 4. It is observed that as the C-rate increases the energy decreases and the optimum range for the energy becomes restricted. At 5C, to achieve the maximum energy, L p o s has to be higher than 60 μ m . In contrast to the energy, the power is higher at higher C-rates. However, it is very sensitive to the electrode thickness. For example the highest power can be achieved for L p o s < 20 μ m and as the thickness increases the cell will end up to a lower power region.

4. Further Work

In this paper, we employed a 3-level full factorial design on the numerical results obtained from an electrochemical-thermal model. The influence of four design variables were investigated to achieve the optimal responses (here specific energy and power). However, the developed model is not limited to the defined design variables and responses. By changing the factors, or adding new design variables to the existing model, a new set of simulation studies can be run and used for further analysis. As an example, it would be of interest to investigate whether the optimal design for achieving the highest energy and power is influenced by the operating temperature of the cell. Another area of interest is to investigate the impact of particle size as well as porosity distribution on the obtained energy and power.
Moreover, battery degradation rate is another interesting system response to be considered. However, studying the degradation process, needs improvements to the current model by adding the impact of solid-electrolyte interface (SEI) growth and its effect on the capacity fade within the battery.
Finally, as mentioned earlier in this study, the optimised design of the cell was achieved through analysing 81 test cases. Given this number, it seems quite unlikely to get all the required data through experiments. On the other hand, to make a comparable test case, all of the materials (including the separator and electrolyte) must be similar to those of the commercial cell. Furthermore, the production procedure for the cell itself has to be similar. Understanding such detailed design information for a commercial cell is known to be difficult because of issues of confidentiality. However, manufacturing a new proto-type cell (manufactured by the University) with optimised design accompanied by an experimental evaluation is another step to be considered to ultimately validate the proposed optimised cell design and simulation framework.

5. Conclusions

In this study a 1D electrochemical-thermal model of an electrode pair of a lithium ion battery is developed in Comsol Multiphysics. The mathematical model is validated against the literature data for a 10 Ah LFP pouch cell operating under 1 C to 5 C electrical load at 25 °C ambient temperature. The validated model is used to conduct statistical analysis of the most influential parameters that dictate cell performance, i.e., particle size ( r p ) , electrode thickness ( L p o s ), volume fraction of the active material ( ε s , p o s ) and C-rate, and their interaction on the two main responses, namely; specific energy and specific power. This is to achieve an optimised window for energy and power within the defined range of design variables. The range of variation of the design variables for LFP lithium ion battery is determined based on data from literature ( r p : 30–100 nm , L p o s : 20–100 μ m , ε s , p o s : 0.3–0.7, C-rate: 1–5). A statistical model is developed by ANOVA of the numerical data in a full factorial design frame work. A full factorial design methodology is carried out to analyse the obtained results of the 1D electrochemical-thermal model and to determine the optimum energy and power by manipulating key design variables of the positive electrode. The summary of the statistical results are as follows:
The significant factors for the specific energy are ranked as:
L p o s > r p > ε s , p o s > C > L p o s × ε s , p o s > r p × ε s , p o s > r p × C > L p o s × C > ε s , p o s × C
Similarly, for the specific power it is defined as:
C > L p o s > L p o s × C > ε s , p o s > L p o s × ε s , p o s > r p > r p × ε s , p o s > ε s , p o s × C > r p × L p o s
In conclusion, the main effect and the interaction effect of all design variables on the energy and power, it is observed that the optimum energy can be achieved when ( r p < 40 nm ), ( 75   μ m < L p o s < 100   μ m ), ( 0.4 < ε s , p o s < 0.6 ) and while the C-rate is below 4 C. The optimum power is achieved for a thin electrode ( L p o s < 30   μ m ), with high porosity and high C-rate (5 C). It is clear that the optimum energy and power cannot be achieved at the same time, hence the battery should be designed so that the power to energy ratio for a specific application is satisfactory. Finally, it should be mentioned that the developed model is not limited to the defined design variables and the responses. By changing the factors, or adding new design variables to the existing model, a new set of simulation can be run and used for further analysis.

Acknowledgments

The research was undertaken as a part of ELEVATE project (EP/M009394/1) funded by the Engineering and Physical Science Research Council (EPSRC).

Author Contributions

Elham Hosseinzadeh developed the model and proposed the optimisation approach, analysed the results and wrote the manuscript. James Marco and Paul Jennings guided and revised the manuscript.

Conflicts of Interest

The authors declare no conflict of interest.

Nomenclature

List of Symbols
a s reaction surface area
C Li + concentration ( mol · m 3 )
Ddiffusion coefficient ( m 2 · s 1 )
E c e l l specific energy ( Wh / kg )
F Faraday’s constant ( C · mol 1 )
I current load ( A )
I p a i r current of a single-pair electrode ( A )
i 0 exchange current density ( A · m 2 )
j L i reaction current density ( A · m 2 )
k i reaction rate
L thickness of the electrode ( μ m )
m c e l l total weight of the cell ( kg )
N p a i r s number of electrode-pairs
P c e l l specific power ( W / kg )
Q heat generation ( W )
R universal gas constant ( J ·   mol 1 · K 1 )
r radial coordinate in spherical particle ( μ m )
r p particle radius ( μ m )
T temperature °C
t time (s)
t d i s discharge time ( s )
t + 0 transference number
U r e f , i Open Circuit Voltage
V terminal voltage ( V )
Greek Letters
α symmetry factor
δ c e l l capacity of a cell ( Ah )
ε volume fraction
η Overpotential ( V )
k D e f f diffusional conductivity ( S   · m 1 )
σ electronic conductivity ( S · m 1 )
κ ionic conductivity ( S · m 1 )
ϕ Potential ( V )
Subscripts/Superscripts
ccCurrent collector
eelectrolyte
ffiller
effeffective
negnegative
pospositive
ssolid
sepseparator
surfsurface
Terms and Abbreviation
ANOVAanalysis of variance
expexperimental
OCVopen circuit voltage
simsimulation
SOCstate of charge

Appendix A

The design parameters of the reference case are presented Table A1 below. The following parameters have been employed to develop the reference model.
Table A1. Electrochemical parameters applied for modelling of the 10 Ah LFP pouch cell.
ParameterNegative ElectrodeSeparatorPositive Electrode
Thickness, L ( μ m ) 342570
Particle size, r p ( μ m ) 3.5-0.0365
Volume fraction of the active material, ε s 0.55-0.43
Volume fraction of the electrolyte, ε e 0.330.540.332
aximum lithium concentration in the solid phase, C s ,   m a x ( mol · m 3 ) 31,370-22,806
Electrolyte lithium concentration, C e ,   m a x ( mol · m 3 ) -1200-
Bruggeman porosity exponent, b r u g g n 1.51.51.5
Dynamic Parameters
Lithium diffusion coefficient in the negative electrode, D s ,   n e g ( m 2 · s 1 ) D s ,   n e g = 3.9 × 10 14   exp   ( 35000 R ( 1 T 1 298.15 ) )
Lithium diffusion coefficient in the positive electrode, D s ,   n e g ( m 2 · s 1 ) D s ,   p o s = 1.18 × 10 18 ( 1 + y ) 1.6   exp   ( 35000 R ( 1 T 1 298.15 ) )
Lithium diffusion coefficient in the electrolyte, D s ,   n e g ( m 2 · s 1 ) D e = 1 e 4 × 10 4.43 ( 54.0 T 229.0 .05 C e ) 2.2 × 10 4 C e
Reaction rate in the negative electrode, k n e g ( m · s 1 ) k n e g = 3 × 10 11   exp   ( 20000 R ( 1 T 1 298.15 ) )
Reaction rate in the positive electrode, k p o s ( m · s 1 ) k p o s = 1.4 × 10 12 exp ( y ) exp     ( 30000 R ( 1 T 1 298.15 ) )
Open circuit potential of the negative electrode U n e g ,   r e f = 0.6379 + 0.5416 exp ( 305.5309 x ) + 0.044 tanh ( x 0.1958 0.1088 ) 0.1978 tanh ( x 0.0117 0.0529 ) 0.0175 tanh ( x 0.5692 0.0875 )
Open circuit potential of the positive electrode U p o s ,   r e f = 3.4323 0.4828 exp ( 80.2493 ( 1 y ) 1.3198 ) 3.2474 × 10 6 exp ( 20.2645 ( 1 y ) 3.8003 ) + 3.2482 × 10 6 exp ( 20.2646 ( 1 y ) 3.7995
Entropy change of the negative electrode d U n e g d T = 344.1347148 × exp ( 32.9633287 x + 8.316711484 ) 1 + 0.749.07566003   exp ( 34.79099646 x + 8.887143624 ) 0.8520278805 x + 0.362299229 x 2 + 0.2698001697
Entropy change of the positive electrode d U p o s d T = 0.35376 y 8 + 1.3902 y 7 2.2585 y 6 + 1.9635 y 5 0.98716 y 4 + 0.28857 y 3 0.046272 y 2 + 0.0032158 y 1.9186 × 10 5
Local state of charge of the negative electrode x = S O C n e g = C s ,   s u r f , n e g C s , m a x , n e g
Local state of charge of the positive electrode y = S O C p o s = C s ,   s u r f , p o s C s , m a x , p o s

Appendix B

The simulated case studies used in this study are summerised in the Table A2.
Table A2. The simulated case studies for the full factorial design.
Case StudyParticle Size
r p o s ( n m )
Electrode Thickness
L p o s ( μ m )
ε p o s C-Rate
130200.31
230200.33
330200.35
430200.51
530200.53
630200.55
730200.71
830200.73
930200.75
1030700.31
1130700.33
1230700.35
1330700.51
1430700.53
1530700.55
1630700.71
1730700.73
1830700.75
19301000.31
20301000.33
21301000.35
22301000.51
23301000.53
24301000.55
25301000.71
26301000.73
27301000.75
2835200.31
2935200.33
3035200.35
3135200.51
3235200.53
3335200.55
3435200.71
3535200.73
3635200.75
3735700.31
3835700.33
3935700.35
4035700.51
4135700.53
4235700.55
4335700.71
4435700.73
4535700.75
46351000.31
47351000.33
48351000.35
49351000.51
50351000.53
51351000.55
52351000.71
53351000.73
54351000.75
55100200.31
56100200.33
57100200.35
58100200.51
59100200.53
60100200.55
61100200.71
62100200.73
63100200.75
64100700.31
65100700.33
66100700.35
67100700.51
68100700.53
69100700.55
70100700.71
71100700.73
72100700.75
731001000.31
741001000.33
751001000.35
761001000.51
771001000.53
781001000.55
791001000.71
801001000.73
811001000.75

References

  1. Ramadesigan, V.; Northrop, P.W.C.; De, S.; Santhanagopalan, S.; Braatz, R.D.; Subramanian, V.R. Modeling and Simulation of Lithium-Ion Batteries from a Systems Engineering Perspective. J. Electrochem. Soc. 2012, 159, R31–R45. [Google Scholar] [CrossRef]
  2. Franco, A. A Multiscale modelling and numerical simulation of rechargeable lithium ion batteries: Concepts, methods and challenges. RSC Adv. 2013, 3, 13027–13058. [Google Scholar] [CrossRef]
  3. Santhanagopalan, S.; Guo, Q.; Ramadass, P.; White, R.E. Review of models for predicting the cycling performance of lithium ion batteries. J. Power Sources 2006, 156, 620–628. [Google Scholar] [CrossRef]
  4. Santhanagopalan, S.; Guo, Q.; White, R.E. Parameter Estimation and Model Discrimination for a Lithium-Ion Cell. J. Electrochem. Soc. 2007, 154, A198. [Google Scholar] [CrossRef]
  5. Tanim, T.R.; Rahn, C.D.; Wang, C.-Y. A Temperature Dependent, Single Particle, Lithium Ion Cell Model Including Electrolyte Diffusion. J. Dyn. Syst. Meas. Control 2014, 137, 11005. [Google Scholar] [CrossRef]
  6. Ramadesigan, V.; Methekar, R.N.; Latinwo, F.; Braatz, R.D.; Subramanian, V.R. Optimal Porosity Distribution for Minimized Ohmic Drop across a Porous Electrode. J. Electrochem. Soc. 2010, 157, A1328–A1334. [Google Scholar] [CrossRef]
  7. Doyle, M.; Newman, J. Modeling the performance of rechargeable lithium-based cells: Design correlations for limiting cases. J. Power Sources 1995, 54, 46–51. [Google Scholar] [CrossRef]
  8. Bizeray, A.M.; Zhao, S.; Duncan, S.R.; Howey, D.A. Lithium-ion battery thermal-electrochemical model-based state estimation using orthogonal collocation and a modified extended Kalman filter. J. Power Sources 2015, 296, 400–412. [Google Scholar] [CrossRef]
  9. Lawder, M.T.; Northrop, P.W.C.; Subramanian, V.R. Model-Based SEI Layer Growth and Capacity Fade Analysis for EV and PHEV Batteries and Drive Cycles. J. Electrochem. Soc. 2014, 161, A2099–A2108. [Google Scholar] [CrossRef]
  10. Lee, T.; Leok, M.; McClamroch, N.H. Geometric numerical integration for complex dynamics of tethered spacecraft. In Proceedings of the 2011 American Control Conference, San Francisco, CA, USA, 29 June–1 July 2011; pp. 1885–1891. [Google Scholar]
  11. Srinivasan, V.; Newman, J. Design and Optimization of a Natural Graphite/Iron Phosphate Lithium-Ion Cell. J. Electrochem. Soc. 2004, 151, A1530. [Google Scholar] [CrossRef]
  12. Christensen, J.; Srinivasan, V.; Newman, J. Optimization of Lithium Titanate Electrodes for High-Power Cells. J. Electrochem. Soc. 2006, 153, A560. [Google Scholar] [CrossRef]
  13. Singh, M.; Kaiser, J.; Hahn, H. Thick Electrodes for High Energy Lithium Ion Batteries. J. Electrochem. Soc. 2015, 162, A1196–A1201. [Google Scholar] [CrossRef]
  14. Wu, W.; Xiao, X.; Huang, X. The effect of battery design parameters on heat generation and utilization in a Li-ion cell. Electrochim. Acta 2012, 83, 227–240. [Google Scholar] [CrossRef]
  15. Golmon, S.; Maute, K.; Dunn, M.L. A design optimization methodology for Li+ batteries. J. Power Sources 2014, 253, 239–250. [Google Scholar] [CrossRef]
  16. Darling, R.; Newman, J. Modeling a Porous Intercalation Electrode with Two Characteristic Particle Sizes. J. Electrochem. Soc. 1997, 144, 4201–4208. [Google Scholar] [CrossRef]
  17. Newman, J. Optimization of Porosity and Thickness of a Battery Electrode by Means of a Reaction-Zone Model. J. Electrochem. Soc. 1995, 142, 97. [Google Scholar] [CrossRef]
  18. Chen, Y.H.; Wang, C.W.; Zhang, X.; Sastry, A.M. Porous cathode optimization for lithium cells: Ionic and electronic conductivity, capacity, and selection of materials. J. Power Sources 2010, 195, 2851–2862. [Google Scholar] [CrossRef]
  19. Doyle, C.M. Design and Simulation of Lithium Recharable Batteries. Ph.D. Thesis, University of California, Berkeley, CA, USA, August 1995. [Google Scholar]
  20. Zimmerman, R.W.; Chen, D.-W.; Cook, N.G.W. Lawrence Berkeley Laboratory. J. Hydrol. 1992, 139, 79–96. [Google Scholar] [CrossRef]
  21. Zhang, L.; Lyu, C.; Wang, L.; Luo, W.; Ma, K. Thermal-electrochemical modeling and parameter sensitivity analysis of lithium-ion battery. Chem. Eng. Trans. 2013, 33, 943–948. [Google Scholar] [CrossRef]
  22. Edouard, C.; Petit, M.; Forgez, C.; Bernard, J.; Revel, R. Parameter sensitivity analysis of a simplified electrochemical and thermal model for Li-ion batteries aging. J. Power Sources 2016, 325, 482–494. [Google Scholar] [CrossRef]
  23. Zhang, L.; Lyu, C.; Hinds, G.; Wang, L.; Luo, W.; Zheng, J.; Ma, K. Parameter Sensitivity Analysis of Cylindrical LiFePO4 Battery Performance Using Multi-Physics Modeling. J. Electrochem. Soc. 2014, 161, A762–A776. [Google Scholar] [CrossRef]
  24. Du, W.; Gupta, A.; Zhang, X.; Sastry, A.M.; Shyy, W. Effect of cycling rate, particle size and transport properties on lithium-ion cathode performance. Int. J. Heat Mass Transf. 2010, 53, 3552–3561. [Google Scholar] [CrossRef]
  25. Ghaznavi, M.; Chen, P. Sensitivity analysis of a mathematical model of lithium e sulfur cells part I: Applied discharge current and cathode conductivity. J. Power Sources 2013, 257, 4–11. [Google Scholar] [CrossRef]
  26. Wu, B.; Yufit, V.; Marinescu, M.; Offer, G.J.; Martinez-Botas, R.F.; Brandon, N.P. Coupled thermal-electrochemical modelling of uneven heat generation in lithium-ion battery packs. J. Power Sources 2013, 243, 544–554. [Google Scholar] [CrossRef]
  27. Yazdanpour, M. Electro-thermal Modeling of Lithium-ion Batteries. Ph.D. Thesis, Simon Fraser University, Burnaby, BC, Canada, 2015. [Google Scholar]
  28. Li, J.; Cheng, Y.; Ai, L.; Jia, M.; Du, S.; Yin, B.; Woo, S.; Zhang, H. 3D simulation on the internal distributed properties of lithium-ion battery with planar tabbed configuration. J. Power Sources 2015, 293, 993–1005. [Google Scholar] [CrossRef]
  29. Li, J.; Cheng, Y.; Jia, M.; Tang, Y.; Lin, Y.; Zhang, Z.; Liu, Y. An electrochemical-thermal model based on dynamic responses for lithium iron phosphate battery. J. Power Sources 2014, 255, 130–143. [Google Scholar] [CrossRef]
  30. Samba, A.; Omar, N.; Gualous, H.; Capron, O.; Van Den Bossche, P.; Van Mierlo, J. Impact of tab location on large format lithium-ion pouch cell based on fully coupled tree-dimensional electrochemical-thermal modeling. Electrochim. Acta 2014, 147, 319–329. [Google Scholar] [CrossRef]
  31. Gerver, R.E. 3D Thermal-Electrochemical Lithium-Ion Battery Computational Modeling. Master’s Thesis, University of Texas, Austin, TX, USA, August 2009. [Google Scholar]
  32. Xiao, M.; Choe, S.-Y. Dynamic modeling and analysis of a pouch type LiMn2O4/Carbon high power Li-polymer battery based on electrochemical-thermal principles. J. Power Sources 2012, 218, 357–367. [Google Scholar] [CrossRef]
  33. Xu, M.; Zhang, Z.; Wang, X.; Jia, L.; Yang, L. Two-dimensional electrochemical-thermal coupled modeling of cylindrical LiFePO4 batteries. J. Power Sources 2014, 256, 233–243. [Google Scholar] [CrossRef]
  34. Smith, K.; Wang, C.-Y. Power and thermal characterization of a lithium-ion battery pack for hybrid-electric vehicles. J. Power Sources 2006, 160, 662–673. [Google Scholar] [CrossRef]
  35. Nasirabadi, P.S.; Conseil, H.; Mohanty, S.; Jabbari, M.; Ambat, R.; Hattel, J.H. Semi-Empirical Prediction of Moisture Build-up in an Electronic Enclosure Using Analysis of Variance (ANOVA). In Proceedings of the IEEE 18th Electronics Packaging Technology Conference, Singapore, 30 November–3 December 2016. [Google Scholar]
  36. Su, L.; Zhang, J.; Wang, C.; Zhang, Y.; Li, Z.; Song, Y.; Jin, T.; Ma, Z. Identifying main factors of capacity fading in lithium ion cells using orthogonal design of experiments. Appl. Energy 2016, 163, 201–210. [Google Scholar] [CrossRef]
  37. Guo, J.; Li, Z.; Pecht, M. A Bayesian approach for Li-Ion battery capacity fade modeling and cycles to failure prognostics. J. Power Sources 2015, 281, 173–184. [Google Scholar] [CrossRef]
  38. Zaccaria, M.; Gualandi, C.; Fabiani, D.; Focarete, M.L.; Croce, F. Effect of oxide nanoparticles on thermal and mechanical properties of electrospun separators for lithium-ion batteries. J. Nanomater. 2012, 2012, 119. [Google Scholar] [CrossRef]
  39. Zhang, Y.G.; Ma, L.L.; Li, J.L.; Yu, Y. In situ Fenton reagent generated from TiO2/Cu2O composite film: A new way to utilize TiO2 under visible light irradiation. Environ. Sci. Technol. 2007, 41, 6264–6269. [Google Scholar] [CrossRef] [PubMed]
  40. Cheng, S.J.; Miao, J.M.; Wu, S.J. Investigating the effects of operational factors on PEMFC performance based on CFD simulations using a three-level full-factorial design. Renew. Energy 2012, 39, 250–260. [Google Scholar] [CrossRef]
  41. Calì, M.; Santarelli, M.G.L.; Leone, P. Computer experimental analysis of the CHP performance of a 100 kWe SOFC Field Unit by a factorial design. J. Power Sources 2006, 156, 400–413. [Google Scholar] [CrossRef]
  42. Wong, N.H.; Heryanto, S. The study of active stack effect to enhance natural ventilation using wind tunnel and computational fluid dynamics (CFD) simulations. Energy Build. 2004, 36, 668–678. [Google Scholar] [CrossRef]
  43. Yang, Y.-T.; Wang, Y.-H.; Tseng, P.-K. Numerical optimization of heat transfer enhancement in a wavy channel using nanofluids. Int. Commun. Heat Mass Transf. 2014, 51, 9–17. [Google Scholar] [CrossRef]
  44. Cervantes, M.J.; Engström, T.F. Factorial Design Applied to CFD. J. Fluids Eng. 2004, 126, 791. [Google Scholar] [CrossRef]
  45. Jabbari, M.; Shojaee Nasirabadi, P.; Jambhekar, V.A.; Hattel, J.H.; Helmig, R. Drying of a tape-cast layer: Numerical investigation of influencing parameters. Int. J. Heat Mass Transf. 2017, 108, 2229–2238. [Google Scholar] [CrossRef]
  46. Mstali, M.; Farkhondeh, M.; Farhad, S.; Fraser, R.; Fowler, M. Electrochemical Modeling of Commercial LiFePO4 and Graphite Electrodes: Kinetic and Transport Properties and Their Temperature Dependence. J. Electrochem. Soc. 2016, 163, 2803–2816. [Google Scholar] [CrossRef]
  47. Amiribavandpour, P.; Shen, W.; Mu, D.; Kapoor, A. An improved theoretical electrochemical-thermal modelling of lithium-ion battery packs in electric vehicles. J. Power Sources 2015, 284, 328–338. [Google Scholar] [CrossRef]
  48. Stewart, S.B.D.; Albertus, P.D.; Srinivasan, V.D.D.; Plitz, I.; Pereira, N.D.D.; Amatucci, G.D.D.; Newman, J.D.B.D. Optimizing the performance of lithium titanate spinel paired with activated carbon or iron phosphate. J. Electrochem. Soc. 2008, 155, A253–A261. [Google Scholar] [CrossRef]
  49. Jiang, F.; Peng, P.; Sun, Y. Thermal analyses of LiFePO4/graphite battery discharge processes. J. Power Sources 2013, 243, 181–194. [Google Scholar] [CrossRef]
  50. Yang, K.; Tan, F.; Wang, F.; Long, Y.; Wen, Y. Response Surface Optimization for Process Parameters of LiFePO4/C Preparation by Carbothermal Reduction Technology. Chin. J. Chem. Eng. 2012, 20, 793–802. [Google Scholar] [CrossRef]
  51. Suthar, B.; Northrop, P.W.C.; Rife, D.; Subramanian, V.R. Effect of Porosity, Thickness and Tortuosity on Capacity Fade of Anode. J. Electrochem. Soc. 2015, 162, A1708–A1717. [Google Scholar] [CrossRef]
  52. Heidarzadeh, A.; Saeid, T.; Khodaverdizadeh, H.; Mahmoudi, A.; Nazari, E. Establishing a mathematical model to predict the tensile strength of friction stir welded pure copper joints. Metall. Mater. Trans. B Process Metall. Mater. Process. Sci. 2013, 44, 175–183. [Google Scholar] [CrossRef]
  53. Thorat, I.V.; Joshi, T.; Zaghib, K.; Harb, J.N.; Wheeler, D.R. Understanding Rate-Limiting Mechanisms in LiFePO4 Cathodes for Li-Ion Batteries. J. Electrochem. Soc. 2011, 158, A1185–A1193. [Google Scholar] [CrossRef]
  54. Braun, P.V.; Cho, J.; Pikul, J.H.; King, W.P.; Zhang, H. High power rechargeable batteries. Curr. Opin. Solid State Mater. Sci. 2012, 16, 186–198. [Google Scholar] [CrossRef]
Figure 1. Schematic of the 1D geometry of a single pair.
Energies 10 01278 g001
Figure 2. Discharge curve of the 10 Ah pouch cell at different C-rates, at room temperature, T a m b = 25   with natural cooling condition.
Energies 10 01278 g002
Figure 3. Normal probability plot of standardized residual for: (a) the specific energy; (b) the specific power.
Energies 10 01278 g003
Figure 4. Main effect plot for the specific energy as a function of particle size ( r p ), electrode thickness ( L p o s ), volume fraction of the active material ( ε s , p o s ), C-rate, at different levels.
Energies 10 01278 g004
Figure 5. Interaction effect of design parameters, particle size ( r p ), electrode thickness ( L p o s ), volume fraction of the active material ( ε s , p o s ) and (C-rate) at different levels on the specific energy.
Energies 10 01278 g005
Figure 6. Main effect plot for the specific power, as a function of particle size ( r p ), electrode thickness ( L p o s ), volume fraction of the active material ( ε s , p o s ), C-rate, at different levels.
Energies 10 01278 g006
Figure 7. Interaction effect of design parameters, particle size ( r p ), electrode thickness ( L p o s ), volume fraction of the active material ( ε s , p o s ) and C-rate) at different levels on the specific power.
Energies 10 01278 g007
Figure 8. Contour plot of: (a) the specific energy as a function of ( r p and L p o s ); (b) the specific power as a function of ( r p and L p o s ); (c) the specific energy as a function of ( r p and ε s , p o s ); (d) the specific power as a function of ( r p and ε s , p o s ); (e) the specific energy as a function of ( r p and C -rate); (f) the specific power as a function of ( r p and C -rate).
Energies 10 01278 g008
Figure 9. Contour plot of: (a) the specific energy as a function of ( L p o s , ε s , p o s ); (b) the specific power as a function of ( L p o s , C-rate); (c) the specific energy as a function of ( L p o s , ε s , p o s ); (d) the specific power as a function of ( L p o s , C-rate).
Energies 10 01278 g009
Table 1. Different factors and their range, used in the factorial design—positive electrode of a 10 Ah lithium phosphate (LFP) pouch cell.
FactorLevel 1Level 2Level 3
Particle radius, r p , ( nm )3065100
Electrode thickness L i , ( μ m )2060100
Volume fraction of the electrode ε s , p o s 0.30.50.7
C-rate135
Table 2. Design parameters of the reference case [28], 10 Ah LFP pouch cell.
ParameterNegative ElectrodePositive Electrode
Particle radius, r p ( μ m )3.50.0365
Thickness, L i ( μ m )3470
Active material volume fraction ε s , p o s 0.550.43
Electrolyte volume fraction/Porosity ( ε e ) 0.330.332
Table 3. The analysis of variance (ANOVA) results of the responses, R 1 (Specific energy) and R 2 (specific power) for the full factorial design.
R1R2
FactorsF-Valuep-ValueF-Valuep-Value
r p 62.410.00039.180.000
L p o s 339.360.000132,788.790.000
ε s , p o s 50.680.0001113.130.000
C49.530.000604,485.140.000
r p × L p o s 2.390.0642.840.034
r p × ε s , p o s 9.620.0009.830.000
r p × C6.490.0000.470.756
L p o s × ε s , p o s 11.300.000154.150.000
L p o s × C5.060.00219,7000.000
ε s , p o s × C4.860.0024.280.005

