Article

Multi-Objective Optimal Charging Method for Lithium-Ion Batteries

1
College of Electrical and Electronics Engineering, Harbin University of Science and Technology, Harbin 150080, China
2
State Key Laboratory of Power Transmission Equipment & System Security and New Technology, Chongqing University, Chongqing 400044, China
3
State Key Laboratory of Automotive Safety and Energy, Tsinghua University, Beijing 100084, China
*
Author to whom correspondence should be addressed.
Energies 2017, 10(9), 1271; https://doi.org/10.3390/en10091271
Submission received: 1 August 2017 / Revised: 18 August 2017 / Accepted: 23 August 2017 / Published: 26 August 2017

Abstract

:
In order to optimize the charging of lithium-ion batteries, a multi-stage charging method that considers the charging time and energy loss as optimization targets has been proposed in this paper. First, a dynamic model based on a first-order circuit has been established, and the model parameters have been identified. Second, on the basis of the established model, we treat the objective function of the optimization problem as a weighted sum of charging time and energy loss. Finally, a dynamic programming algorithm (DP) has been used to calculate the charging current of the objective function. Simulation and experimental results show that the proposed charging method could effectively reduce the charging time and decrease the energy loss, compared with the constant-current constant-voltage charging method, under the premise of exerting little influence on the attenuation of battery capacity.

Graphical Abstract

1. Introduction

As the key technology of battery management systems, the charging strategy influences the battery life and safe operation [1,2,3]. Their long charging time is one of the main obstacles for the popularization of lithium batteries [4,5]. Moreover, the battery loses energy in the form of heat dissipation during the charging process, and the literature [6] indicates that within a certain temperature range, the higher the battery temperature, the more serious the battery life decay. Therefore, effective reduction of the charging time and battery energy losses during the charging period has become one of the important directions for the research on lithium-ion battery charging strategies [7,8,9].
The constant-current constant-voltage (CCCV) charging method is one of the most widely used charging methods; further, it is simple and easy to control. However, different charging rates and cut-off voltages result in battery aging [10]. Accordingly, a multi-stage constant current charging method for multi-objective optimization has been studied [11,12]. The target optimization mainly aims to reduce the charging time, improve the charging efficiency, and prolong the battery life; however, it is necessary to calibrate numerous experimental data and therefore, such a method is difficult to use. Reference [13] proposed a fast charging method for a lithium battery close to complete discharge. However, such a method can result in an overheated battery at the expense of battery life and requires a better solid electrolyte interface or unique electrode structures to mitigate any potential lithium plating [14,15,16]. References [17,18,19,20] involved the study of a pulse charging method, wherein the battery was stationary or discharged for a short period of time in order to slow down the polarization phenomenon during the charging process. However, the proposed method has higher requirements for the design of the charging power supply.
In order to improve the charging efficiency and prolong the battery life, a general charging voltage protocol based on battery state-of-health was proposed in [21], which aims to study the optimization of charging current. Moreover, the battery charging method has also been studied in optimization problems related to charging time, battery energy loss, and temperature rise in some studies. The effect of cut-off voltage, ambient temperature, and battery aging on the charging optimization results was also discussed in [22], whereas the influence of charge current on the Ohmic resistance, polarization resistor, and polarization capacitance of the battery has not been fully considered yet. Although battery charging current has been optimized from the perspective of charging time and battery energy losses in [23,24], the battery model that has been adopted is the voltage-resistor model, which ignores the influence of polarization phenomena on charging.
In summary, previous battery charge management studies mainly concentrated on the optimization of the charging current. In spite of the fact that some of them considered charging time and energy loss as characteristics of the charging method, the effect of the change of battery model parameters on the optimization of charging current was not considered during the optimization process. Based on the dynamic model of the equivalent circuit, a lithium cobalt-acid battery has been considered as the research objective in this study. Moreover, considering the influence of the model parameters on the state of charge (SOC) and charging current and considering the charging time and battery energy loss as the optimal targets, over-voltage is employed as a state variable, and a dynamic programming algorithm is also adopted to obtain the optimized charging current. Further, the influence of variable weighting factors on the optimization result is also discussed in this paper.

2. Lithium-Ion Battery Testing and Modeling

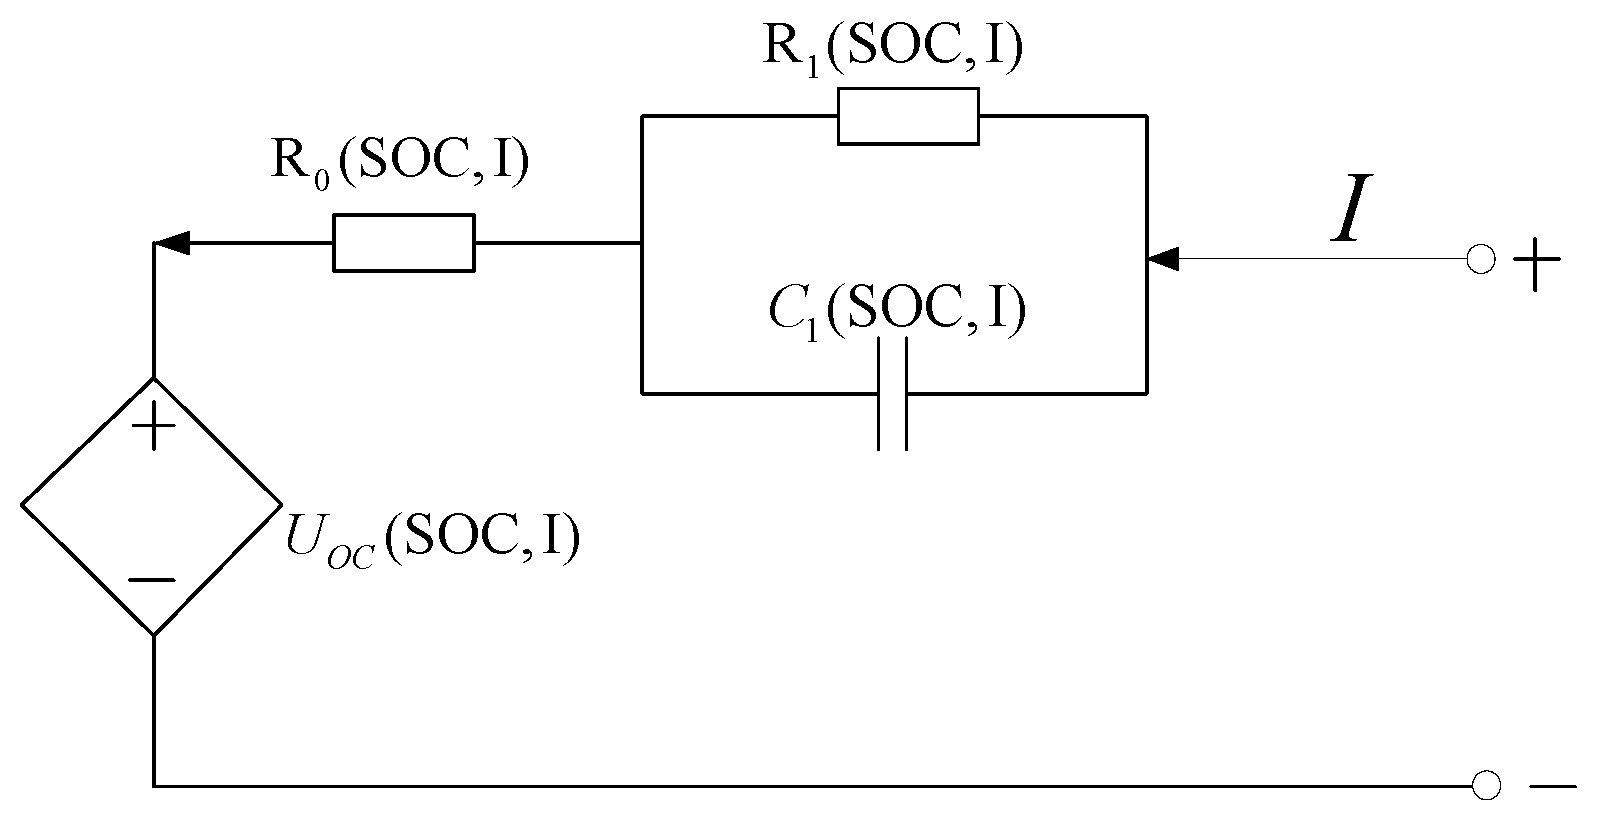
2.1. Charging Principle and Model Selection

In this study, a lithium cobalt acid battery is selected as the research object. Its details are listed in Table 1.
A lithium-ion battery consists of three parts: the anode lithium compound, its intermediate electrolyte membrane, and cathode carbon. When it is charged, lithium ions are generated at the anode and embedded through the electrolyte membrane into the cathode material. As more lithium ions are embedded into the cathode material, the SOC level of the battery becomes higher. The chemical reaction during the lithium-ion battery charging process is given as follows:
3 C + L i C o O 2 0.5 L i C 6 + L i 0.5 C o O 2
Moreover, during the battery charging process, since the lithium ion concentration fails to reach a balance within a short period of time, a voltage difference, i.e., the over-voltage, arises. In order to describe the charging process accurately, many battery models have been established in previous studies in order to reflect the mechanism changes in the charging process. Common lithium battery models include an equivalent circuit model and an electrochemical model; further, the equivalent circuit model is simple and can accurately reflect the running state of the battery [25,26]. Therefore, this study refers to literature [27,28], and the first-order equivalent circuit model has been chosen as the research object, as shown in Figure 1.
As shown in Figure 1, the equivalent circuit model of the battery consists of the following parts: open-circuit voltage which is a controlled voltage source UOC, Ohmic resistance R0, polarization resistance R1, and polarization capacitance C1. According to [29], all the parameters in the model are related to the SOC and charge-discharge ratio of the battery under the condition of fixed ambient temperature.

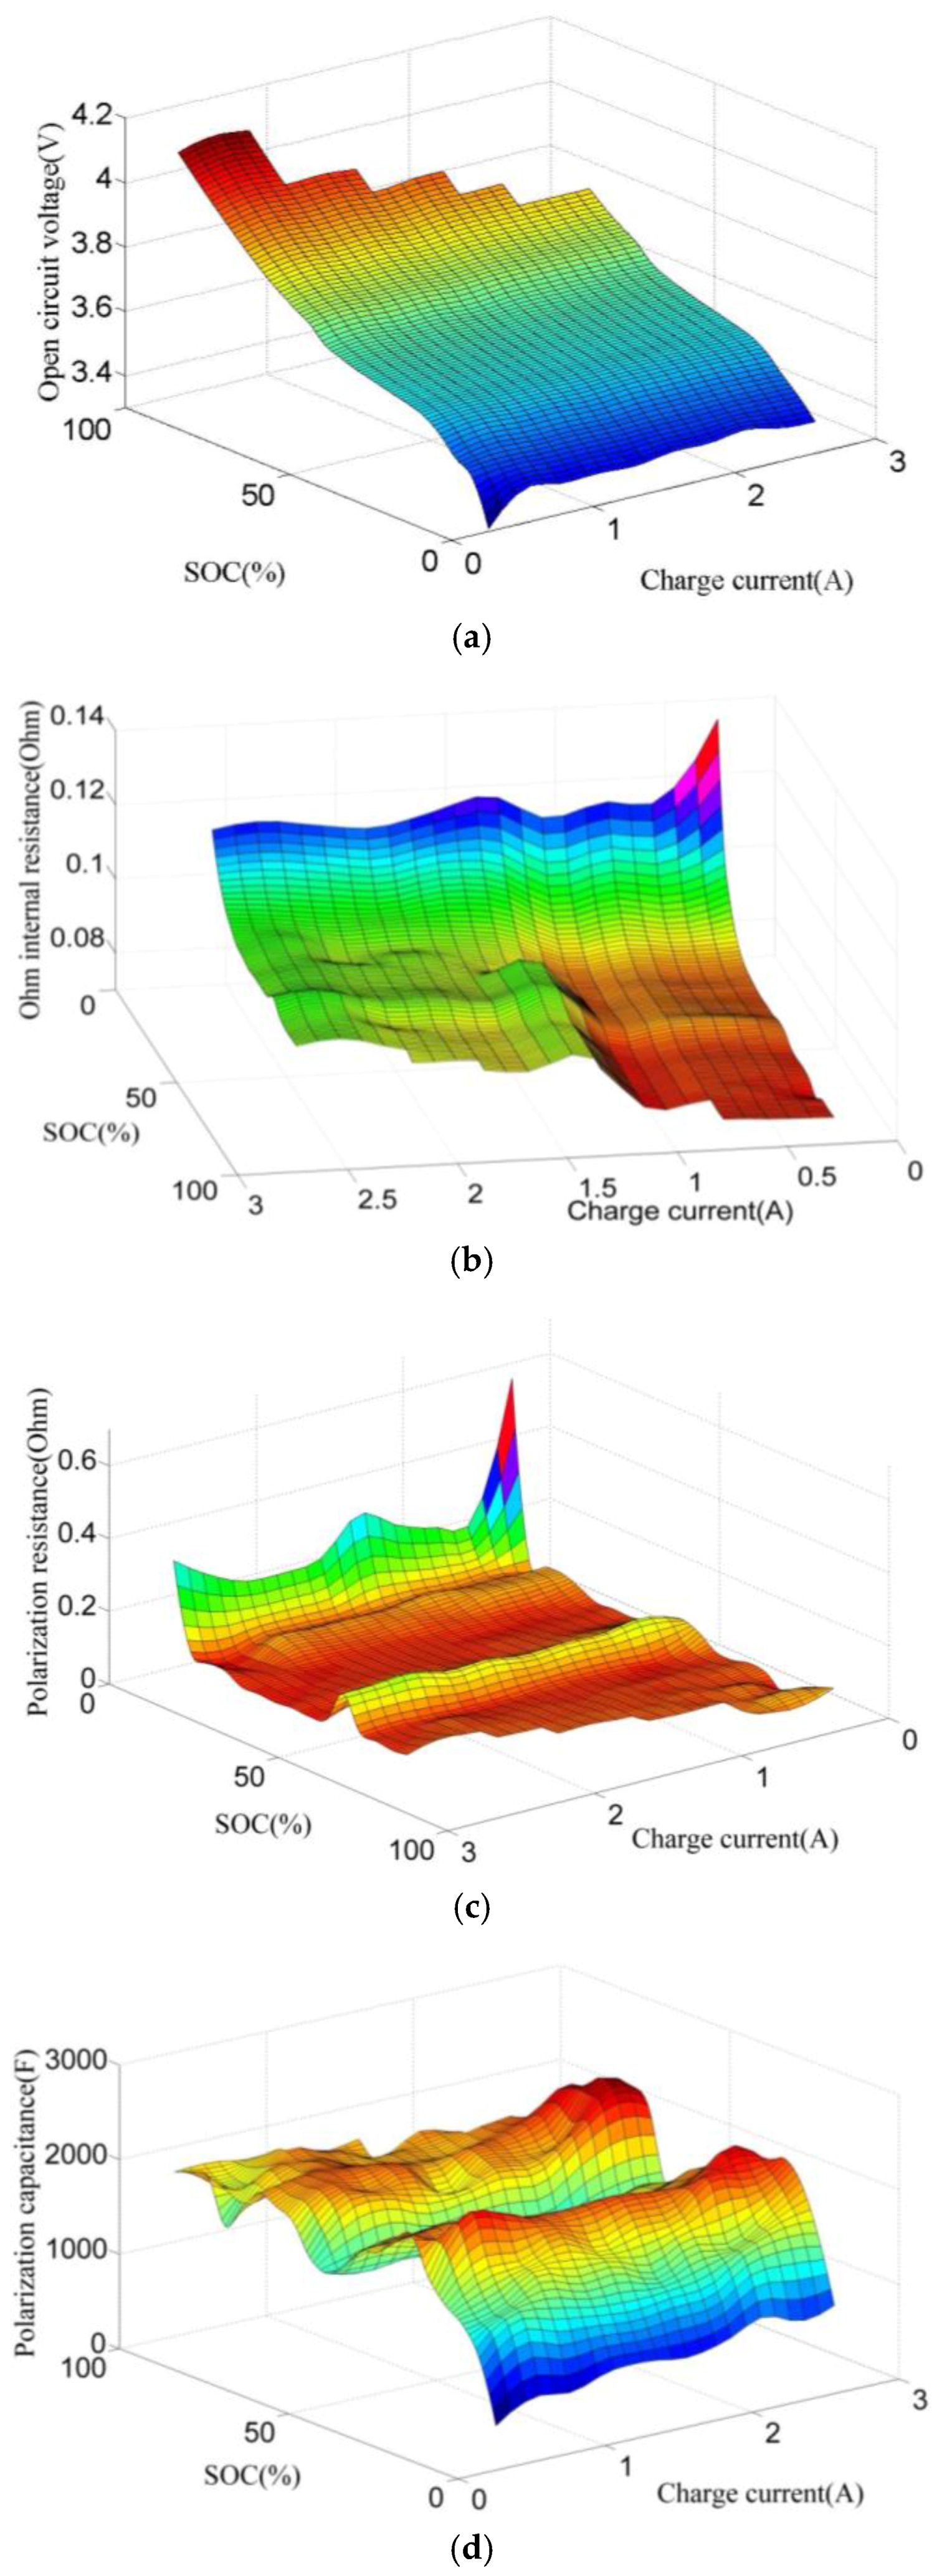
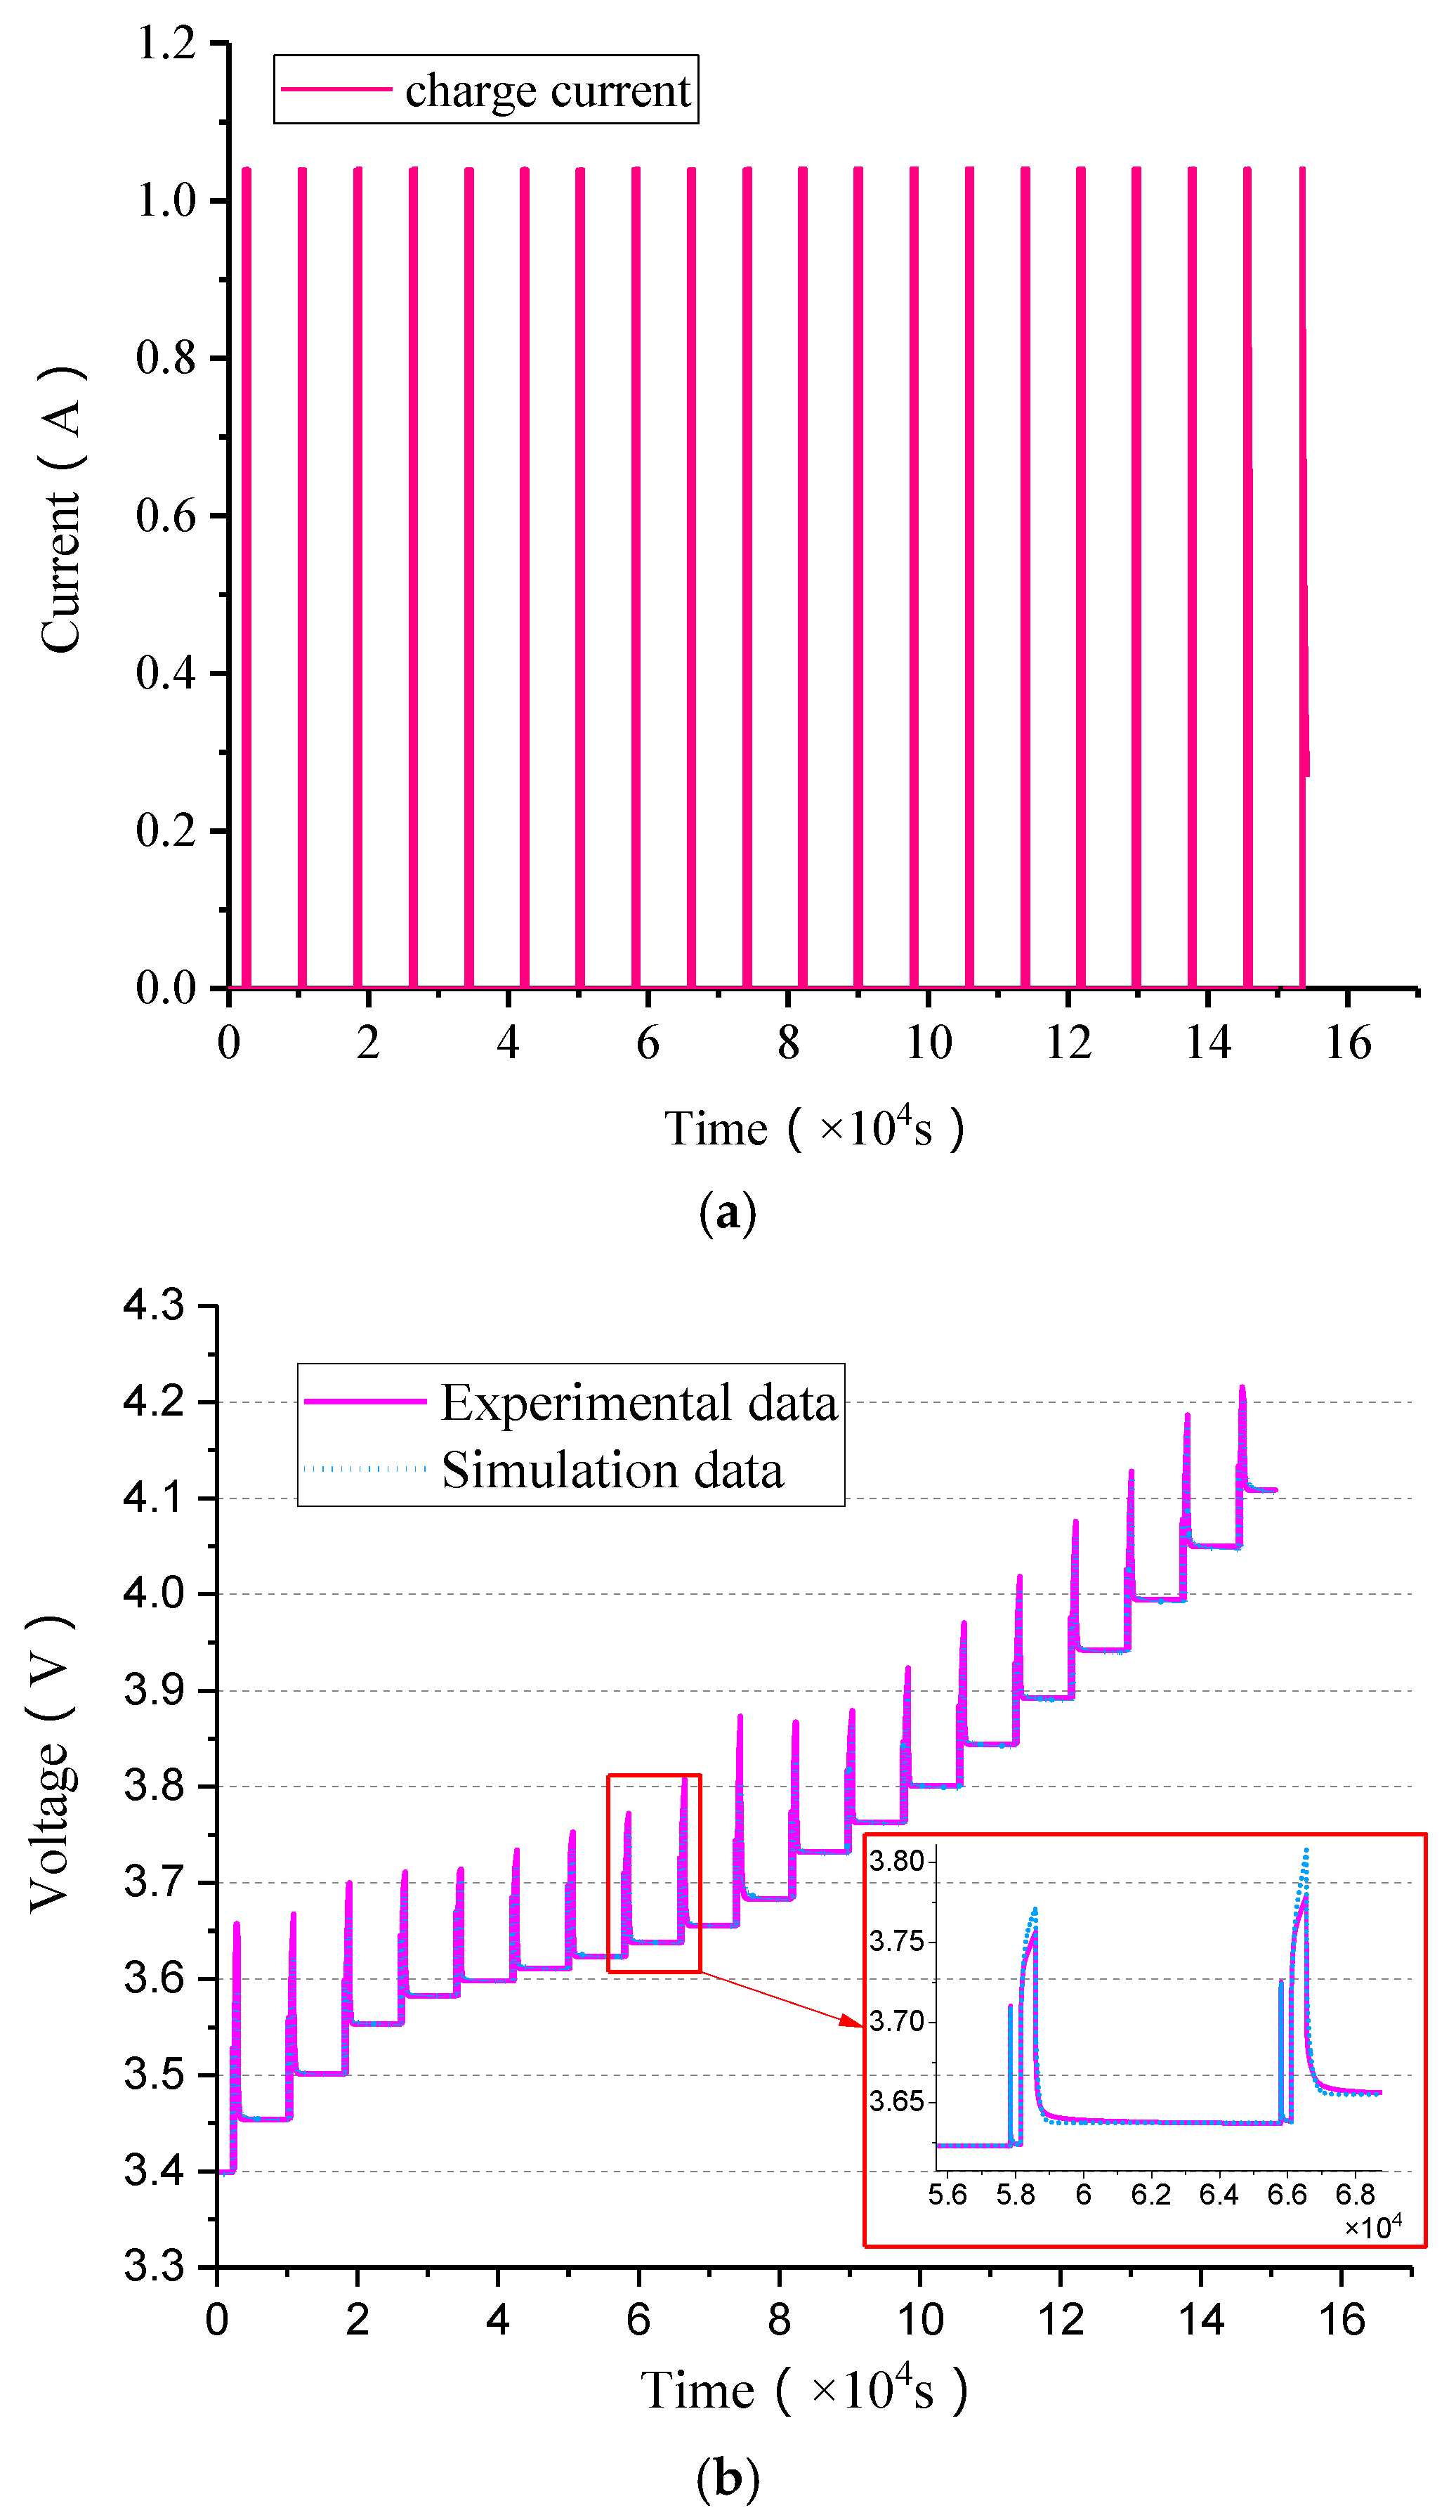
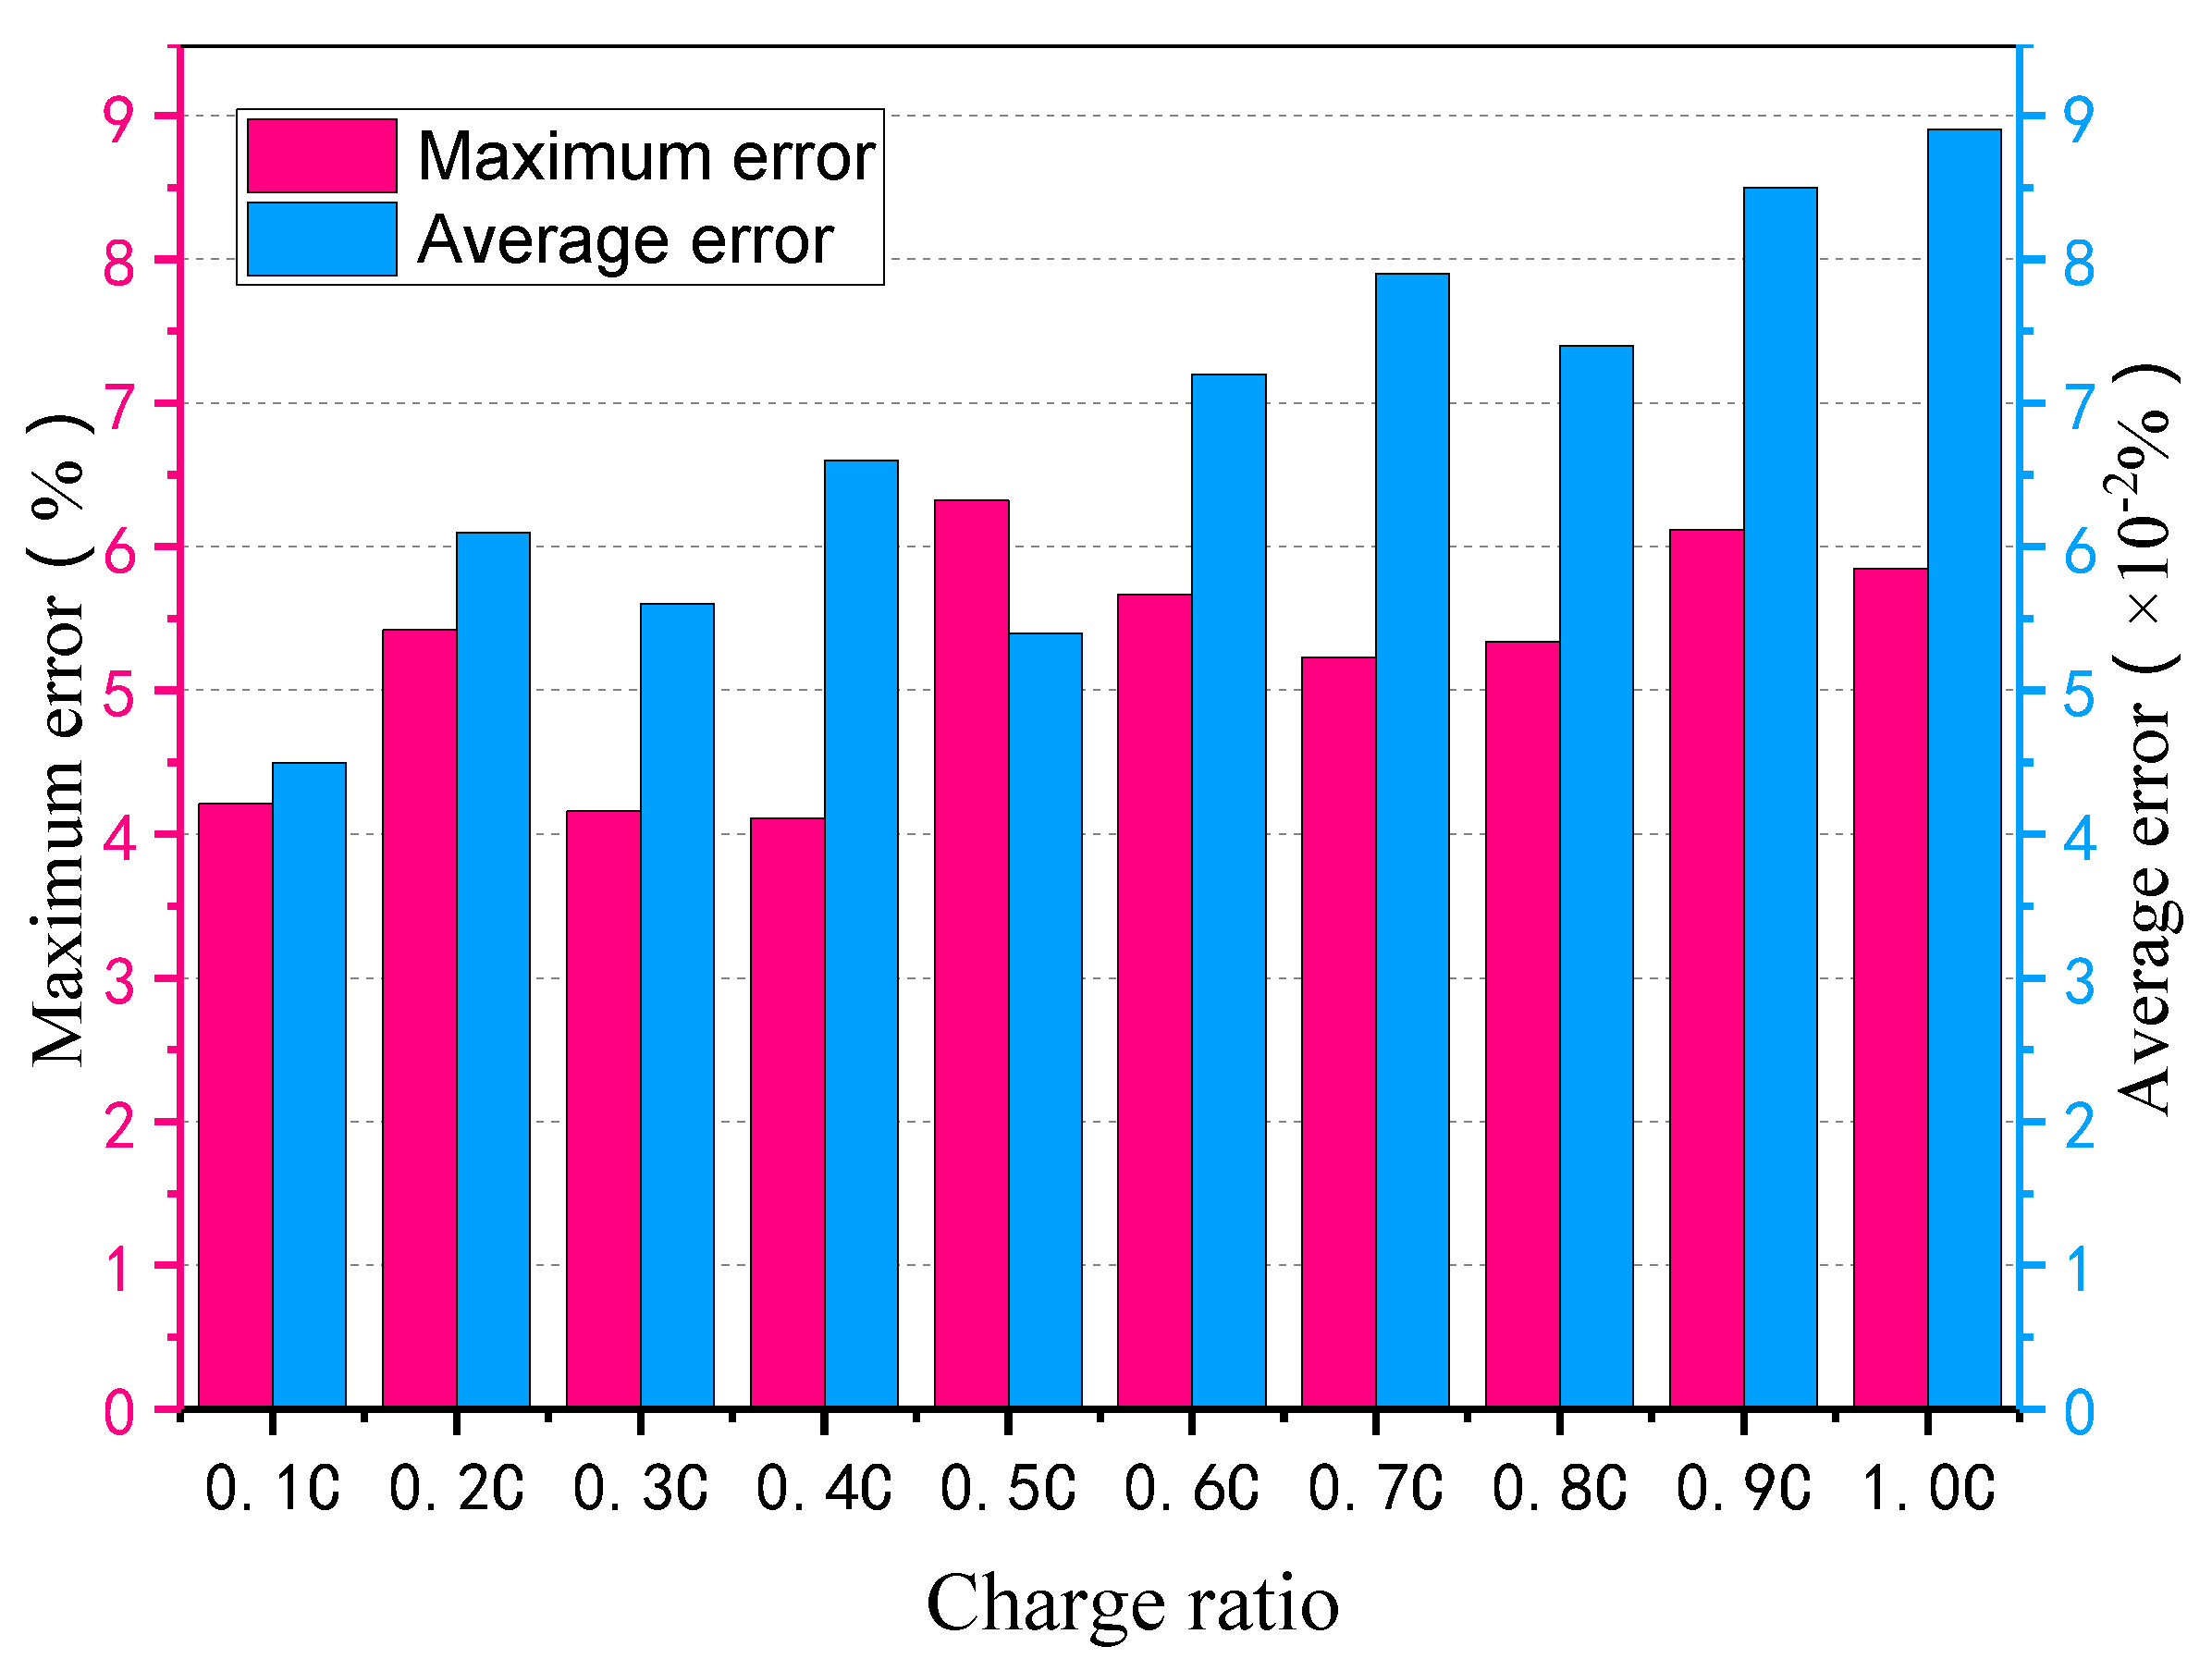
2.2. Parameter Identification and Verification of Battery Model

In order to identify the parameters of the model for different SOC and charging ratios, the battery have been tested with several sets of specific charging ratios by adopting the flowchart shown in Figure 2.
As evident from the test flow in Figure 2, in each test, the battery has been subjected to a charge process with a pulse of 10 s for every SOC of 5%. After the charging test is completed, the relationship between the battery terminal voltage and charging current corresponding to each pulse charging stage is fitted by using the least squares method mentioned in [30]. The corresponding parameter identification results of the battery model are shown in Figure 3.
In order to verify the accuracy of the model parameters, this study selects charging current with different specific ratios to simulate the intermittent charging of the battery based on the targeted dynamic model. Firstly, the equivalent circuit model of a battery was established under Matlab/Simulink, and the charging simulation was carried out by using some specific current. Secondly the battery is tested with the same current as the simulation. Finally we compare the battery terminal voltage between simulation and test. Considering the simulation and actual test with charging ratio of 0.4C as an example, the current and voltage curves are shown in Figure 4. Figure 5 illustrates a comparison between the errors of the calculated model value and the actual test battery result with various charging ratios. The error is calculated as:
τ t = | U t , r U t , s | U t , r × 100 %
where Ut,r is the actual value of the battery terminal voltage at time t and Ut,s is the simulation value.
It is evident from Figure 4 that the battery terminal voltage of the targeted model is quite close to the actual battery test results when the charging ratio is 0.4C. It can be observed from Figure 5 that the average error of the battery terminal voltage calculated using the targeted model relative to the actual voltage is less than 0.1%, and the maximum error is less than or equal to 6.12% with different charging ratios. Therefore, it can be demonstrated that the targeted battery dynamic model can accurately represent the parameter change of the battery charging process.

3. Multi-Objective Optimal Charging Method

During the battery charging, the charging time and battery energy loss are important indexes to evaluate the charging method. When analyzing the charging process using the first-order equivalent circuit battery model, the battery’s energy loss originates from the Ohmic resistance and polarized internal resistance. However, the charging time is usually inversely proportional to the charging ratio [31]. The key problem of the charging method is to balance the charging time and battery energy loss.

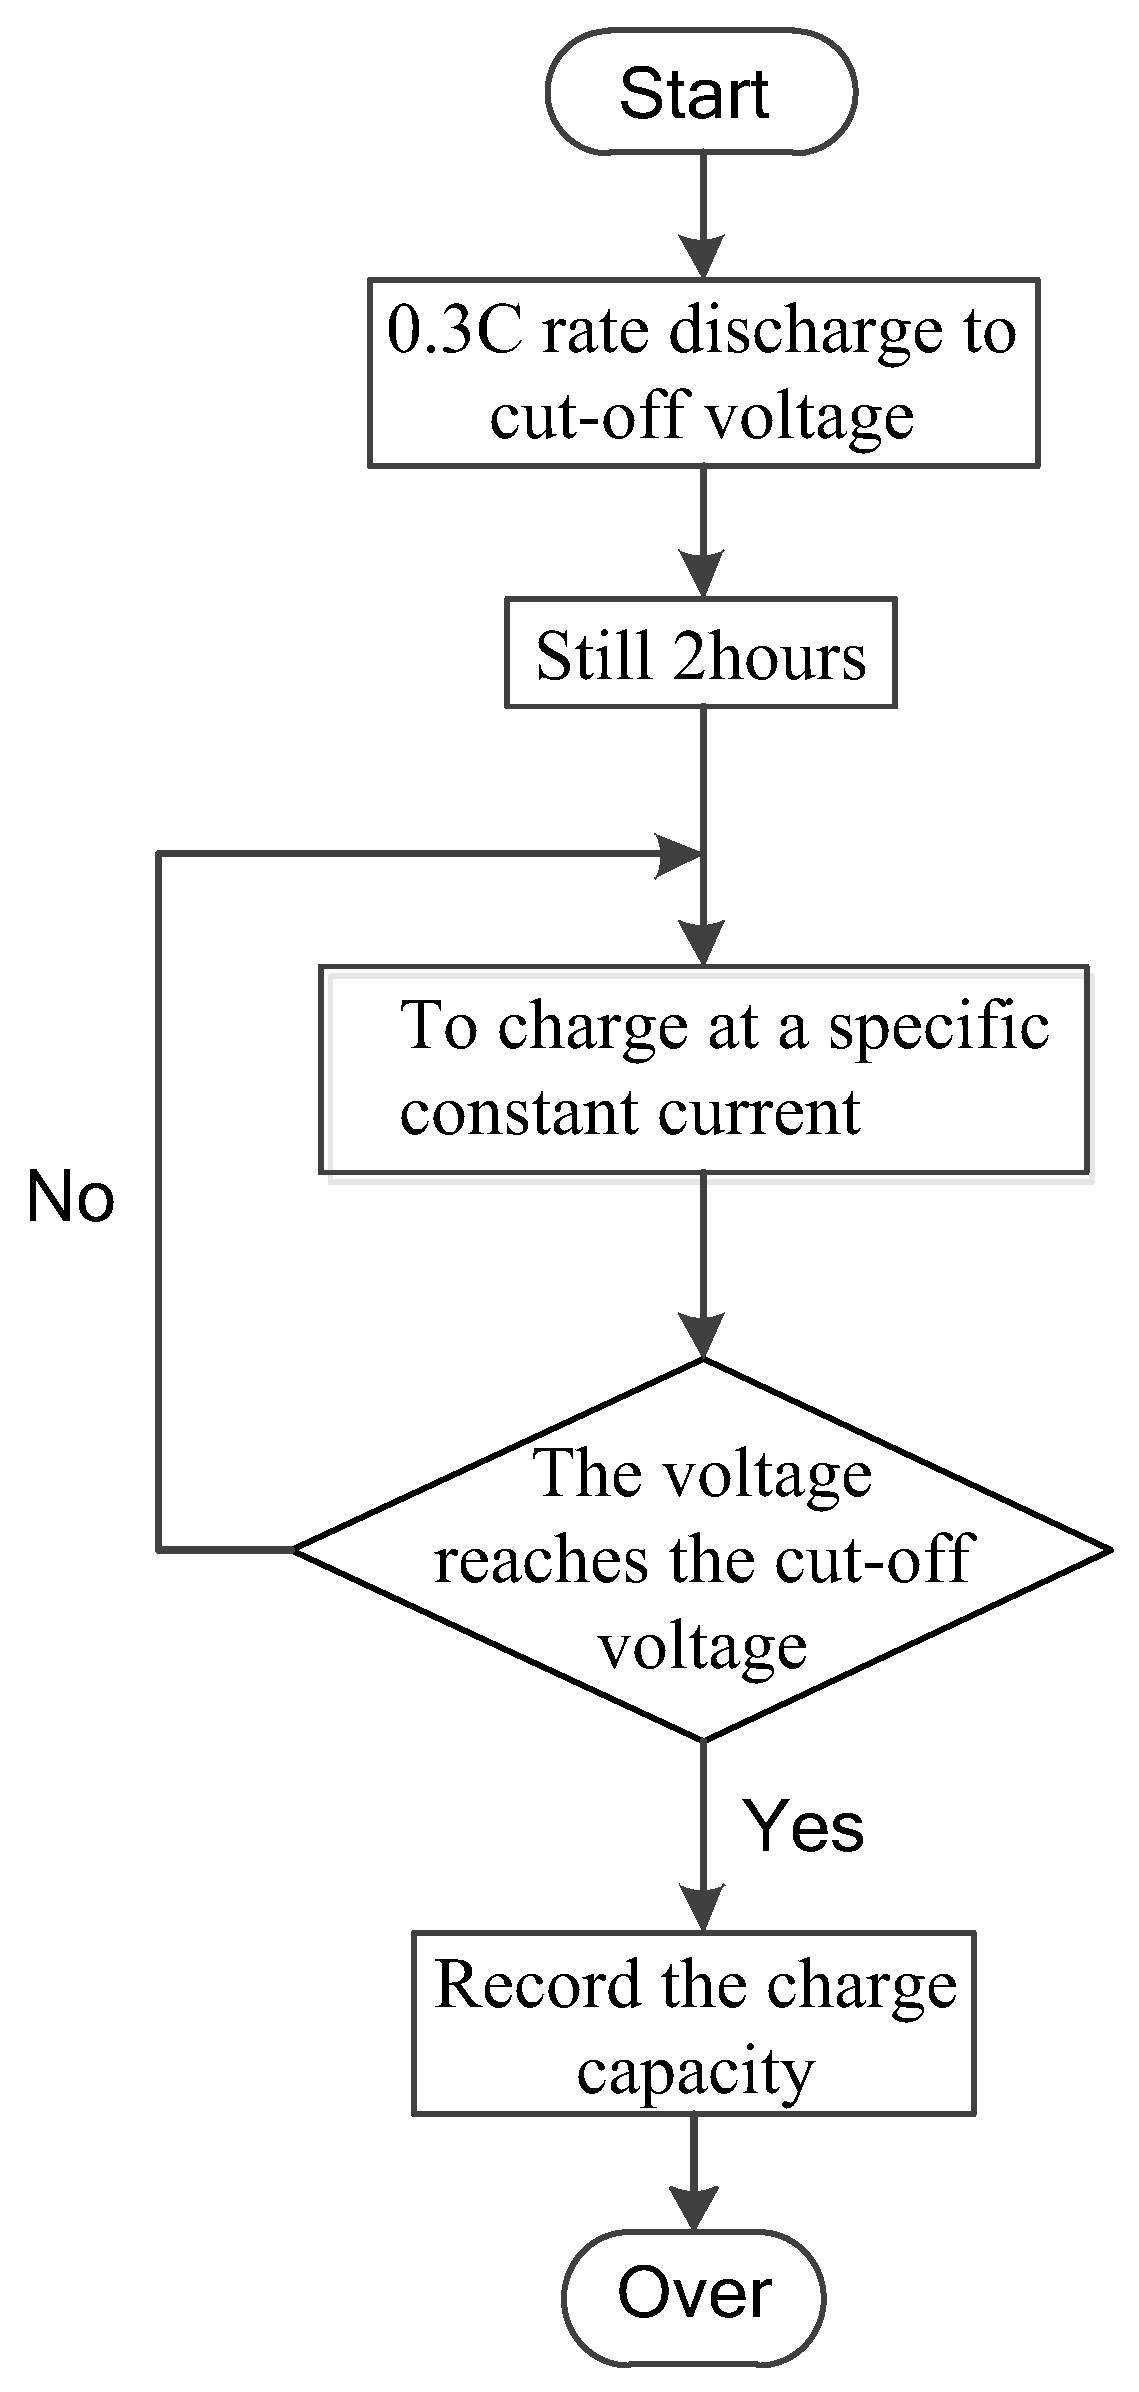
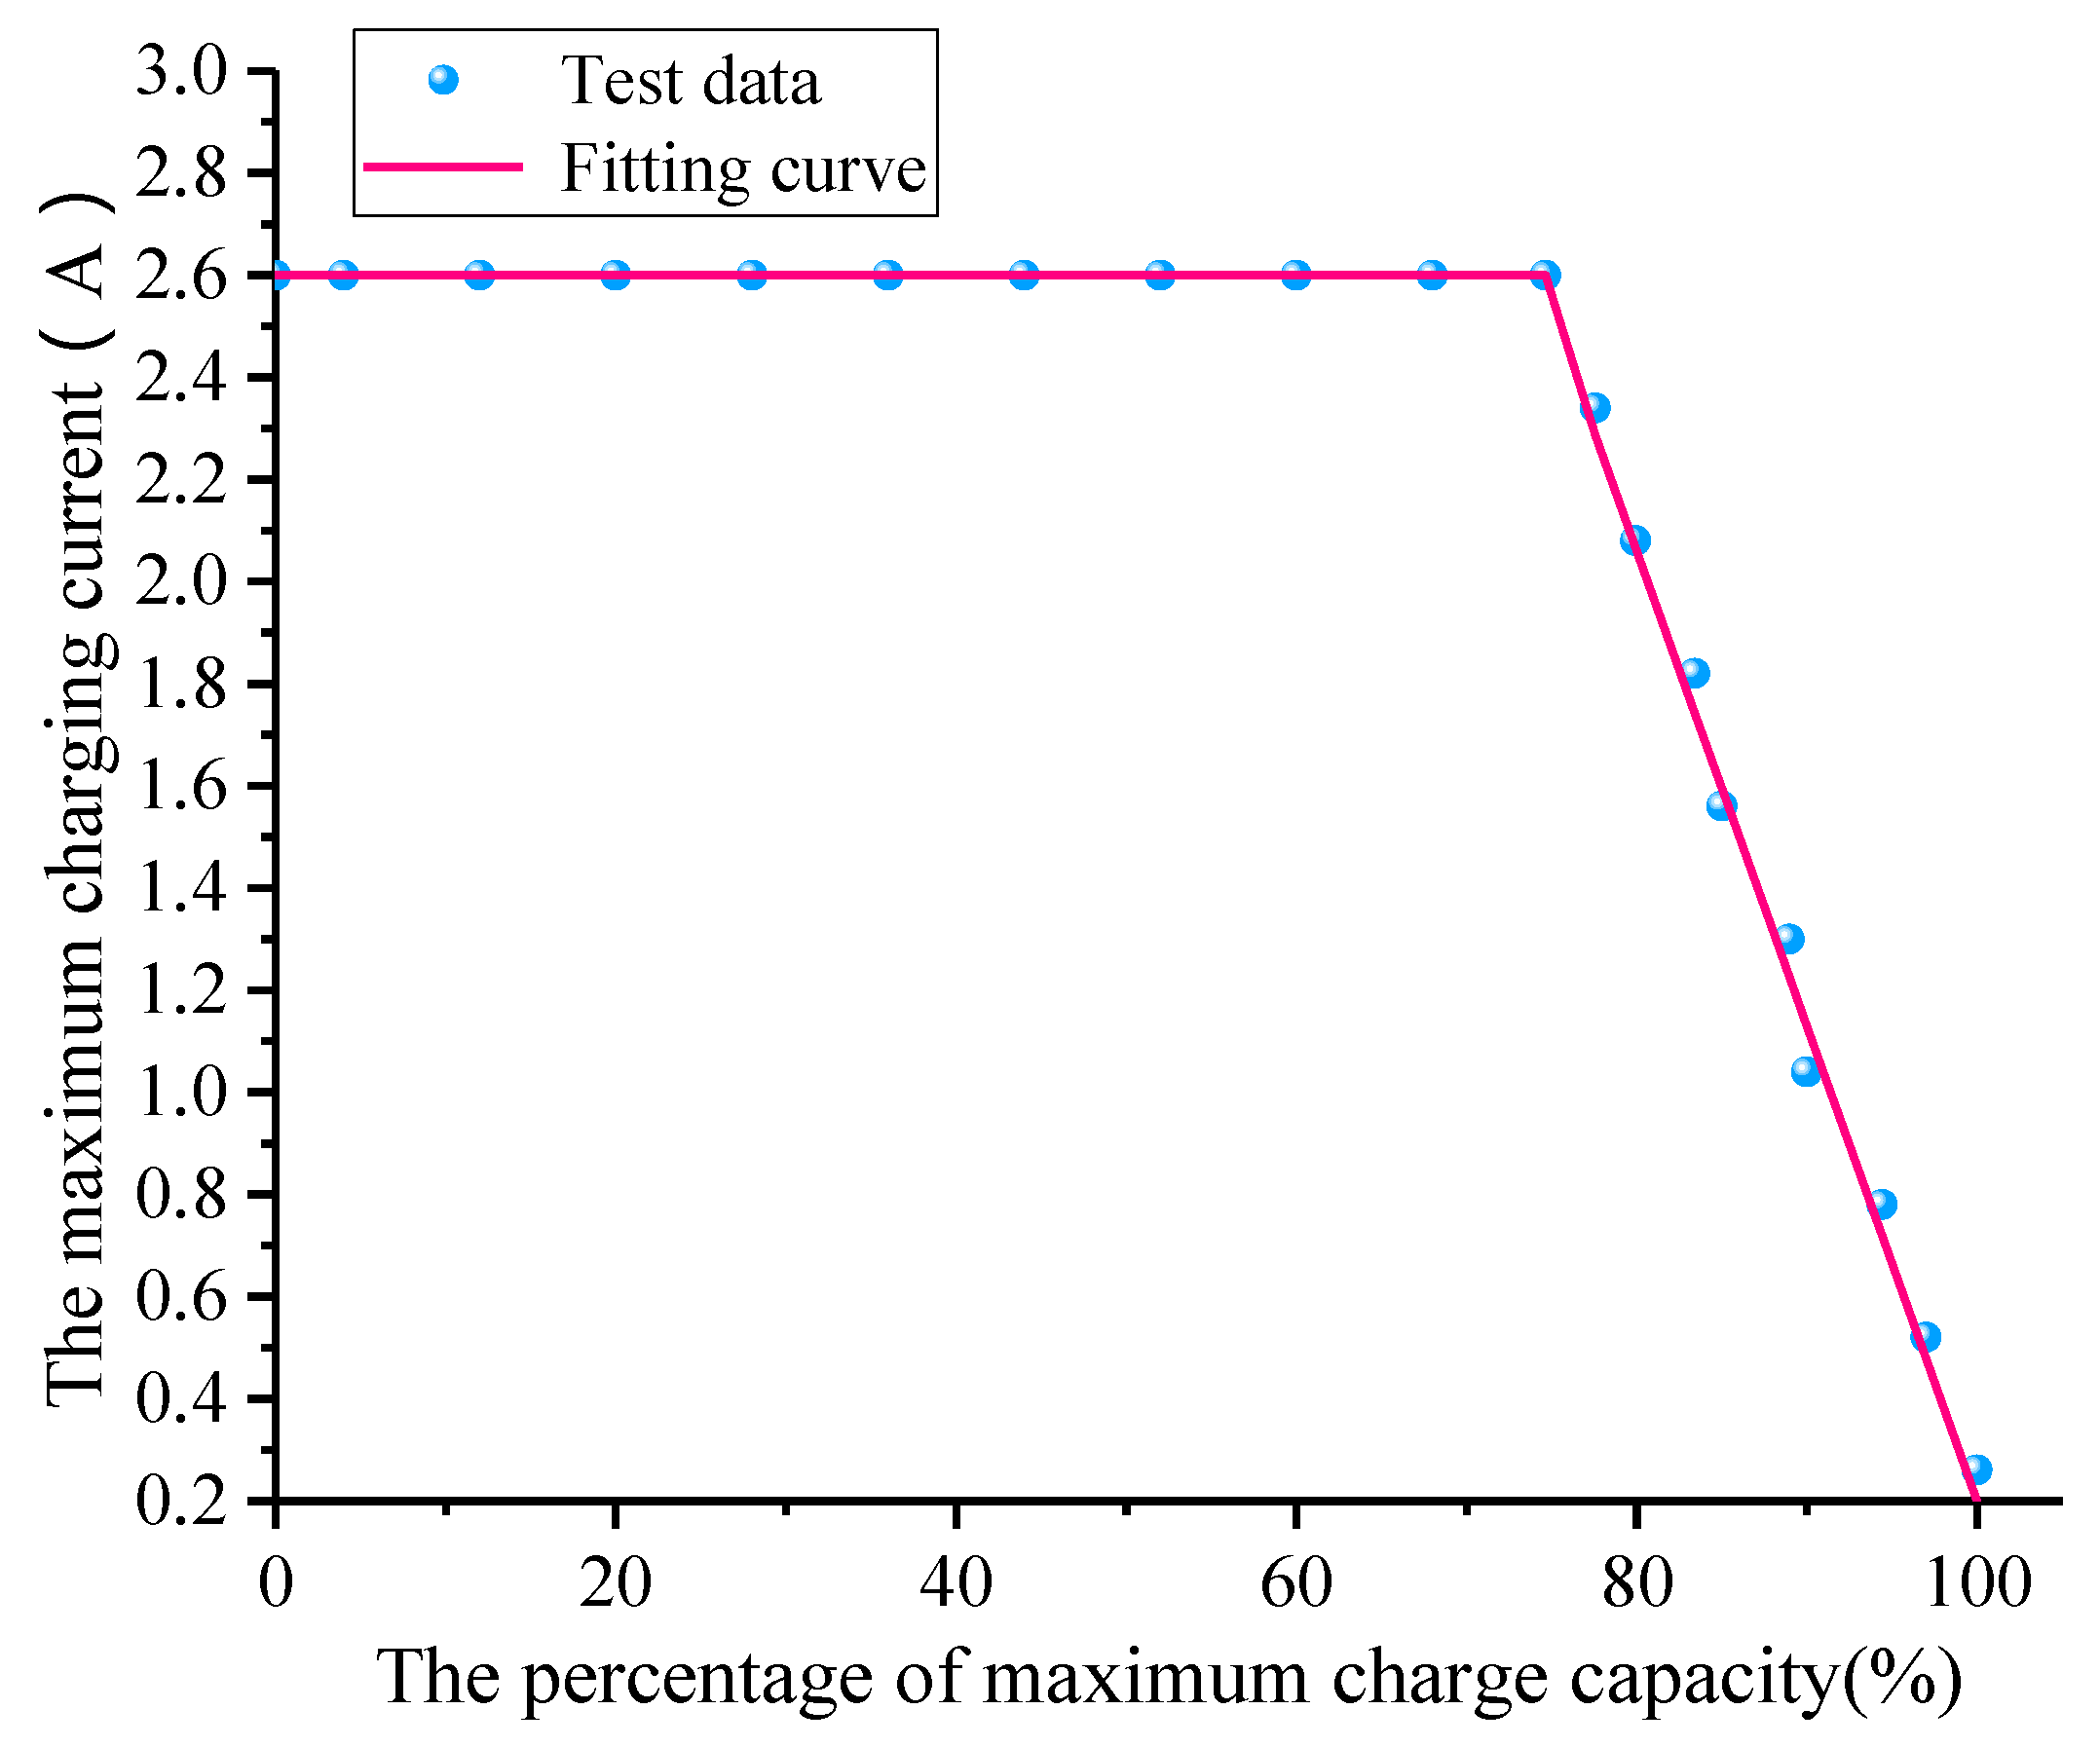
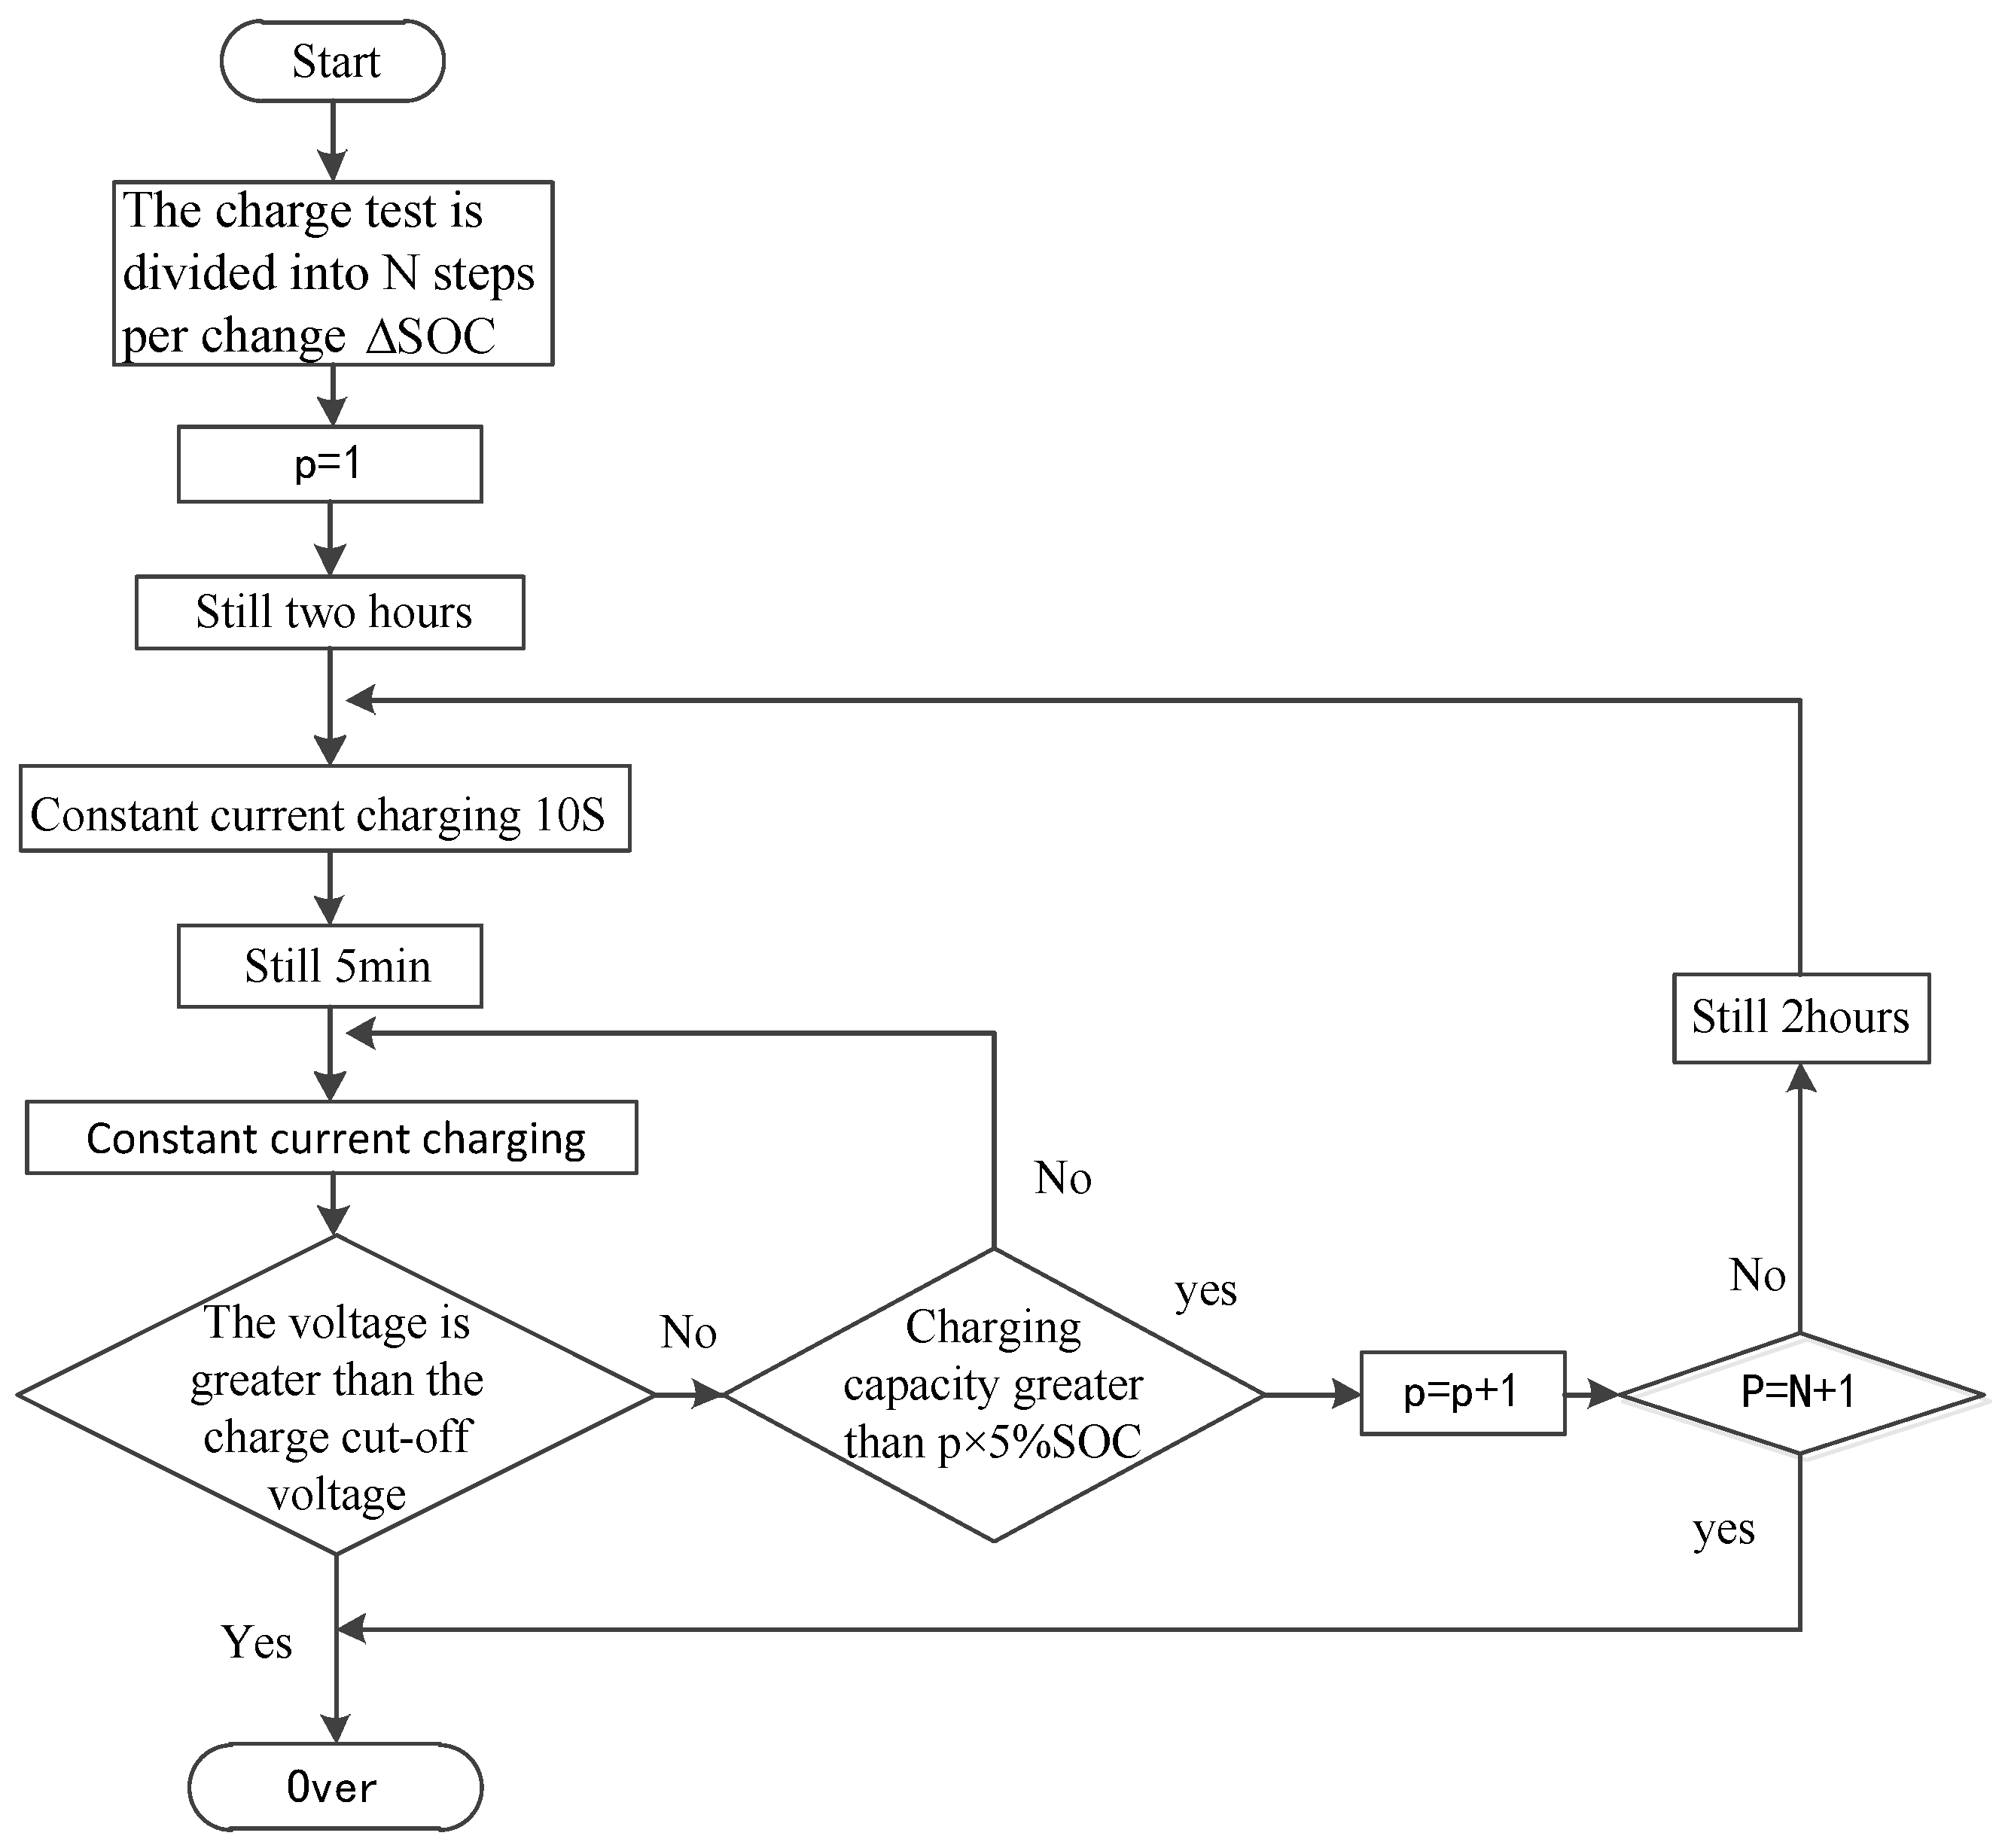
3.1. Determination of the Boundary Condition of Charging Current

Zhang et al. [32] observed that the maximum charge current of a lithium-ion battery is usually related to the current SOC. Accordingly, this study performs many charging tests, and subsequently, the test results are fitted; finally, the maximum charge current corresponding to the SOC is obtained. By using the test flow shown in Figure 6, the maximum charge capacity corresponding to the charge current ratio in the range of 0.1C–1C can be obtained. The ratio of maximum charge capacity to the rated capacity, i.e., ξ , or in other words, the percentage of maximum charge capacity, serves as an independent variable, and the charging current acts as a dependent variable to obtain a fitting. Thus, the fitted curve shown in Figure 7 is obtained, and the results are given as follows:
I max ( ξ ) = { 1 ξ 74.65 % 0.093 ξ + 9.5 ξ > 74.65 %
According to [33,34], when the charging current is greater than the security threshold corresponding to the current SOC, the battery aging accelerates or heat might arise out of the control. In order to avoid damage to the battery, the maximum charge current corresponding to the aforementioned charge capacity ξ is considered as the boundary condition of the charging current selection for different SOCs, i.e.,
I max ( S O C ) = { 1 SOC 74.65 % 0.093 × SOC + 9.5 SOC > 74.65 %

3.2. Establishment of Optimization Objective Function

This study considers the battery energy loss and charging time as the optimization objective function. During the process of formulating this function, the charging process is first divided into N constant current charging stages, and the parameters of the model are constant in each charging stage. During the entire charging process, the battery’s energy loss can be expressed as:
W = j = 1 N [ I j 2 R 0 , j ( I j ) Δ j + W 1 , j ]
where Ij represents the charge current in the jth charging phase, and R0,j(Ij) represents the corresponding Ohmic resistance of the jth phase, which is affected by the current SOC and charging current. Furthermore, W1,j is the energy loss of the polarization resistance in the jth phase, which is related to the charging current Ij, polarization capacitance C1,j(Ij), and polarization resistance R1,j(Ij) of the current stage; further, ∆j indicates the time duration of the jth charging phase.
The SOC changes in each charging phase are expressed as follows:
Δ S O C = 0 Δ j η I j ( t ) d t 3600 C a p
where Cap represents the battery rated capacity with the unit of ampere hour and η is the Coulomb efficiency. In this paper, 1 has been taken [30], and when the charging process is divided by 1% of Δ S O C , the charging time of each charging phase is:
Δ j = 36 C a p I j
When the sampling time of the charging system is Δ t , the number of samples in each charging phase is:
M j = Δ j Δ t = 36 C a p I j Δ t
The energy loss of the polarization resistance at each charging stage separated by the sampling time Δ t is given as:
W 1 j = k = 1 M j I 1 , j , k 2 R 1 , j ( I j ) Δ t
where I1,j,k is the current of the polarization resistance R1,j(Ij) at the K-sampling moment in the jth charging phase. According to the full response equation of the first-order circuit, the following can be obtained:
I 1 , j , k = I j ( 1 e k Δ t R 1 , j ( I j ) C 1 , j ( I j ) ) + U 1 , j R 1 , j ( I j ) e k Δ t R 1 , j ( I j ) C 1 , j ( I j )
where U1,j represents the polarization voltage at the starting point of the jth charging phase. By substituting (10) into (9), the following can be obtained:
W 1 , j = k = 1 M j ( I j ( 1 e k Δ t R 1 , j ( I j ) C 1 , j ( I j ) ) + U 1 , j R 1 , j ( I j ) e k Δ t R 1 , j ( I j ) C 1 , j ( I j ) ) 2 R 1 , j ( I j ) Δ t
Substituting (11) into (5), the total energy consumption of the battery during multi-stage constant current charging can be obtained as:
W = j = 1 N [ k = 1 M j ( I j ( 1 e k Δ t R 1 , j ( I j ) C 1 , j ( I j ) ) + U 1 , j R 1 , j ( I j ) e k Δ t R 1 , j ( I j ) C 1 , j ( I j ) ) 2 R 1 , j ( I j ) Δ t     + I j 2 R j ( I j ) Δ j ]
During the entire charging process, the charging time of the battery is:
T = j = 1 N 36 C a p I j
By setting the sampling time of the system as Δ t = 1 s , the objective function of the optimized charging method presented in this paper can be expressed as:
f = min { α j = 1 N ( I j 2 R j ( I j ) 36 C I j + k = 1 36 C I j [ I j ( 1 e k R 1 , j ( I j ) C 1 , j ( I j ) ) + U 1 , j R 1 , j ( I j ) e k R 1 , j ( I j ) C 1 , j ( I j ) ] 2 R 1 , j ( I j ) )   + ( 1 α ) M j = 1 N 36 C I j }
The following can be obtained after further simplification:
f = min { j = 1 N α ( I j 2 R j ( I j ) 36 C I j + k = 1 36 C I j [ I j ( 1 e k R 1 , j ( I j ) C 1 , j ( I j ) ) + U 1 , j R 1 , j ( I j ) e k R 1 , j ( I j ) C 1 , j ( I j ) ] 2 R 1 , j ( I j ) ) + ( 1 α ) M 36 C I j }
where α is the obtained weighting factor, which could be adjusted between 0 and 1 to achieve the optimization of different focus on charging time and energy loss. M serves as the compensating coefficient, which allows the charging time and energy loss to share the same order of magnitude. The control variable is Ij, i.e., the charging current in the charging stage, and the state variable is the voltage U1,j at the ends of the polarization resistance R1,j(Ij) at the beginning of each charging stage.
Owing to the parallel connection of polarization resistance and polarization capacitor in the equivalent circuit model, the voltage drop in the polarization resistance cannot be changed suddenly, and hence, the initial over-voltage of each charging stage is equal to the termination over-voltage of the corresponding previous charging stage. Accordingly, the initial over-voltage U1,j of each charging stage is chosen as the state variable, and the state transfer equation is:
[ I j ( 1 e 36 C / I j R 1 , j ( I j ) C 1 , j ( I j ) ) + U 1 , j R 1 , j ( I j ) e 36 C / I j R 1 , j ( I j ) C 1 , j ( I j ) ] R 1 , j ( I j ) = U 1 ( j + 1 ) j = 1 , 2 ..... N 1
The boundary conditions of the charge currents indicate that, when the SOC is large, the charging current is small, which leads to the slow charging of the last few stages. At the end of the charge, it is believed that the current in the polarization resistance reaches the steady state value IN. Thus, according to (16), the initial over-voltage during the final charging phase can be obtained, i.e., the state variables U1,N = R1,N(IN) × IN At the initial stage of charging, the state variable of such a phase is U1,1 = 0, because the voltage of polarization resistance is zero.

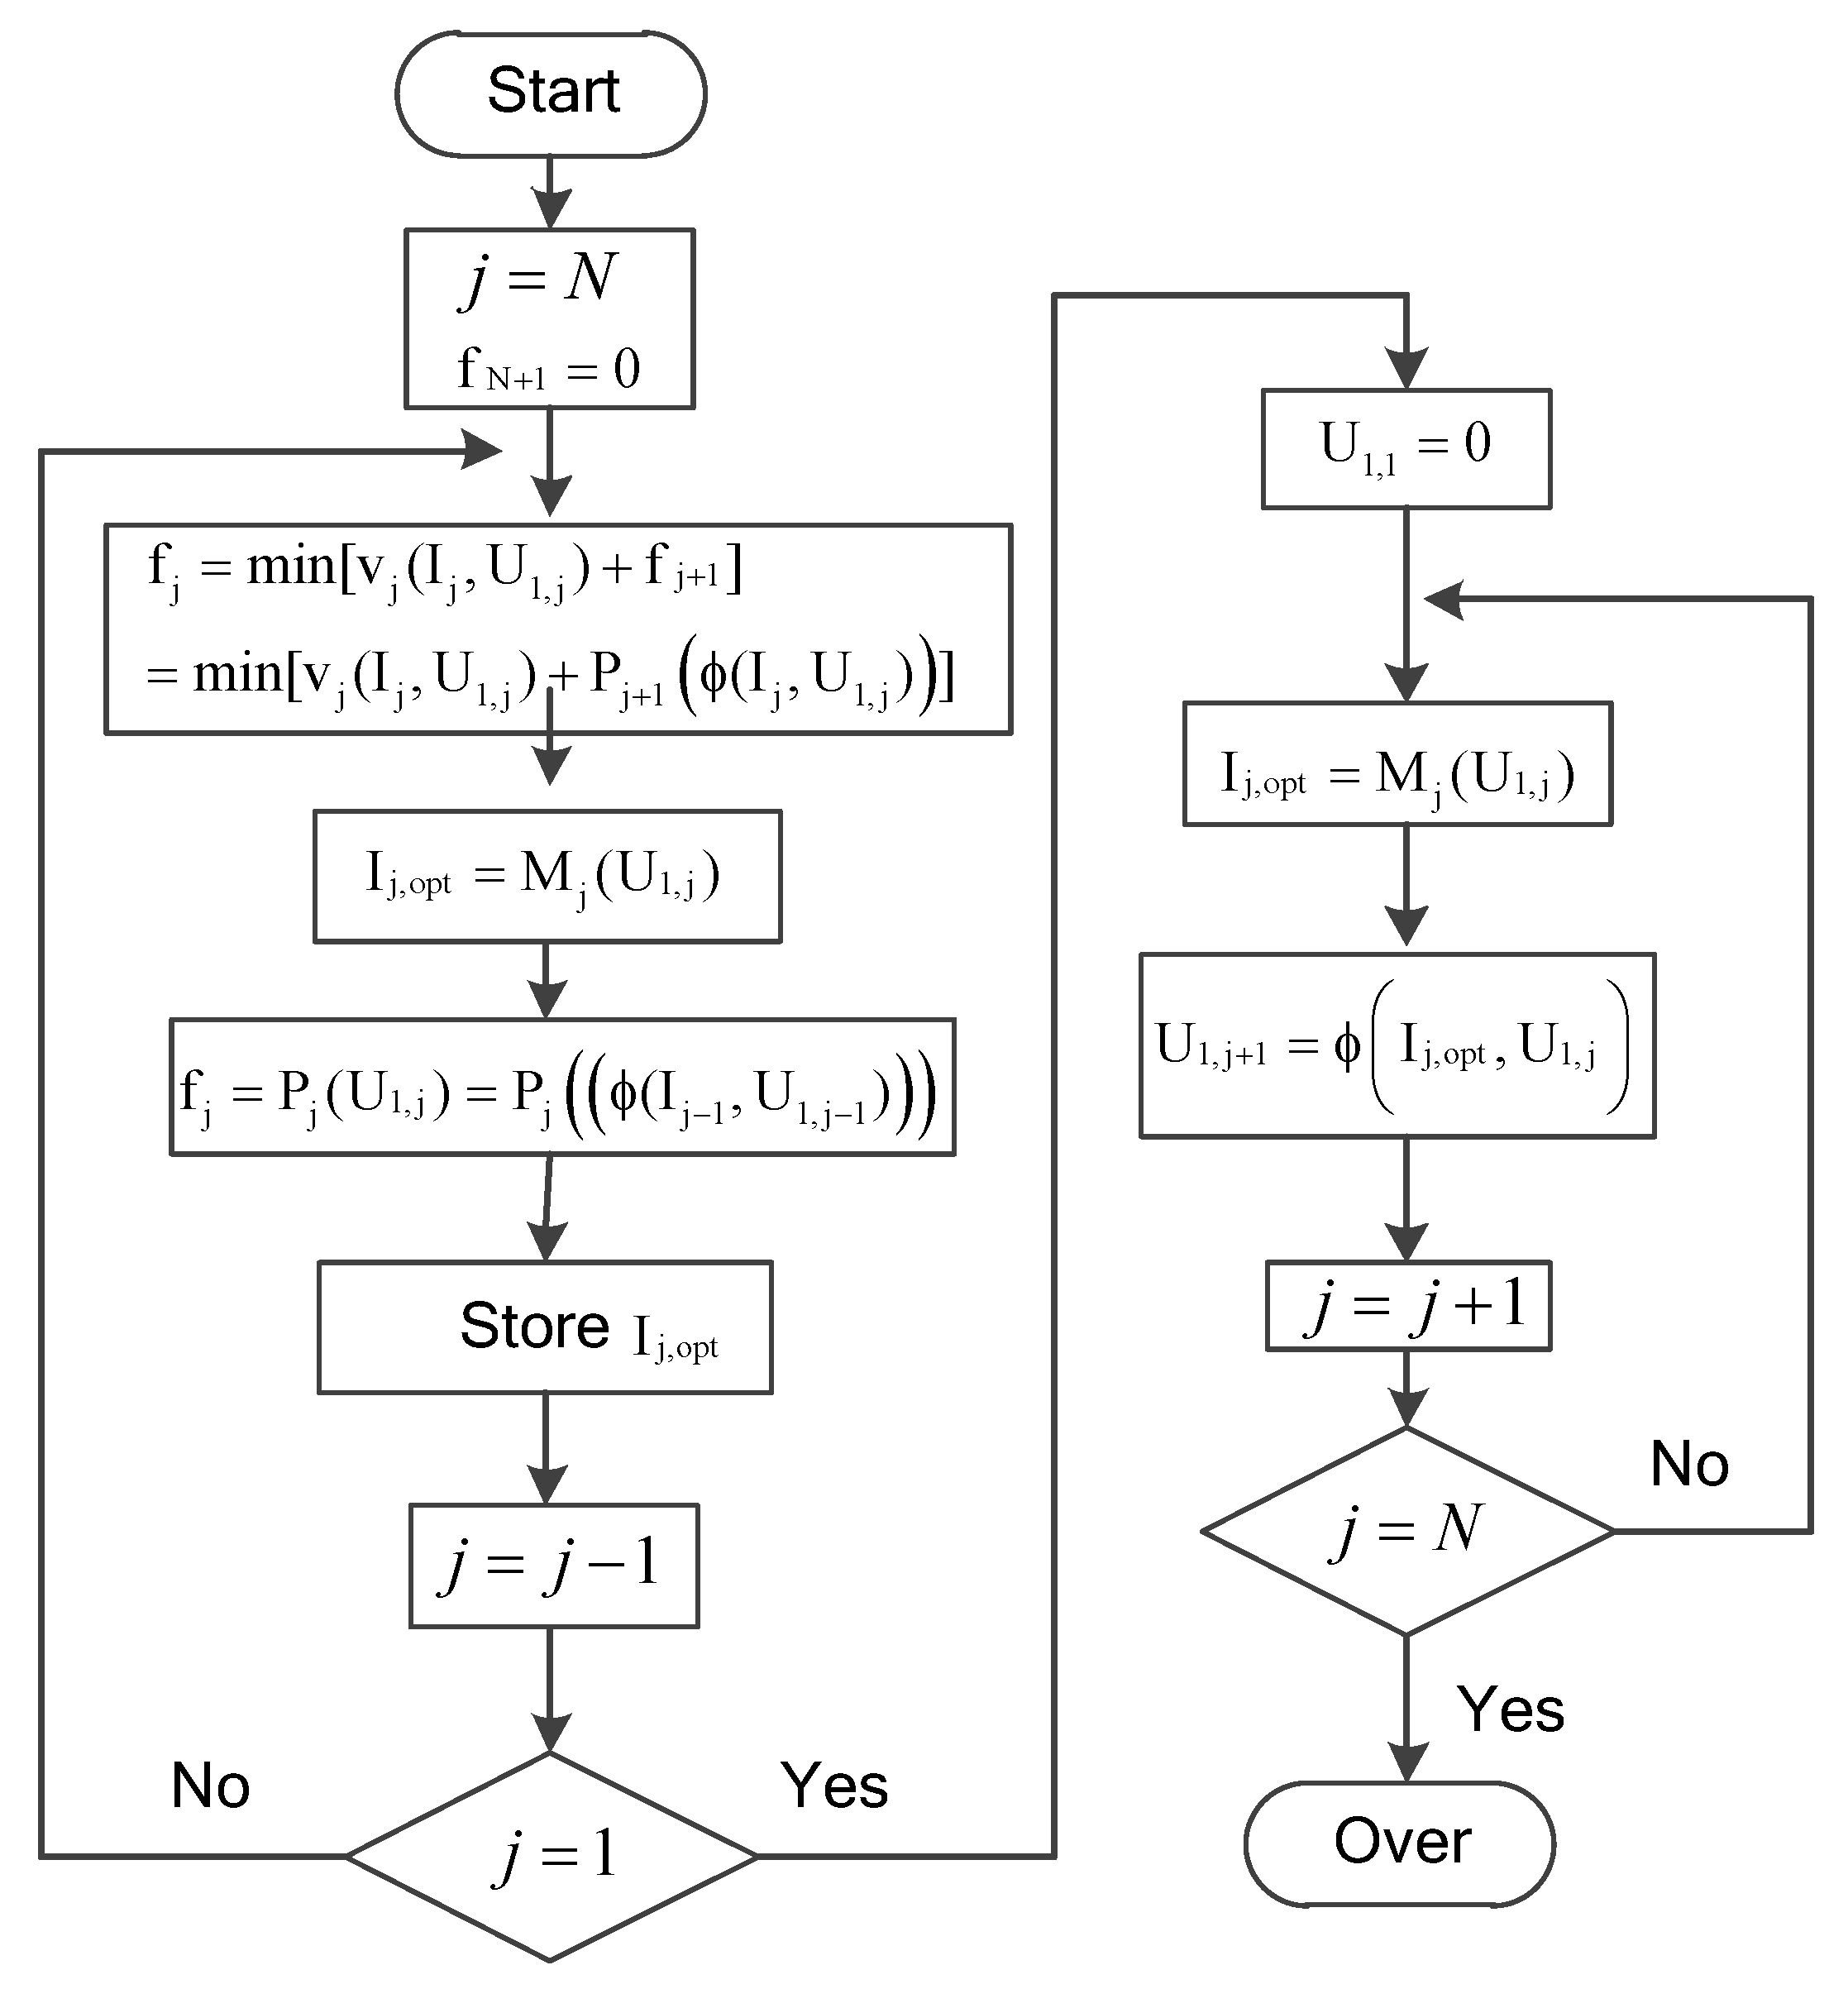
3.3. Solution of Charging Current using a Dynamic Programming Algorithm

Dynamic programming theory, proposed by the U.S. mathematician R. Bellman, is an overall optimization method aiming to transform complex decision problems into a series of sub-stage decision problems, and it has been widely used in offline global optimization of nonlinear systems. In this study, the charging method is based on the battery equivalent dynamic model, and the parameters of the model are nonlinear with the changes of SOC and charging current. Therefore, the dynamic programming algorithm is suitable for solving the current of the proposed charging method. The dynamic programming model for obtaining the charging current is shown in Table 2.
The inverse solution method is used to solve the problem. The N + 1 charging stage is added as the boundary condition and the objective value function at this stage is zero, i.e., fN+1 = 0. First, the extreme value of fN is obtained; further, the expression of optimal charging current in the N stage is obtained, which is IN,opt = MN(U1,N). Second, if U1,N and IN,opt are used for obtaining fN, the fN expression about U1,N is obtained, which is PN(U1,N), According to the state transfer equation, PN(U1,N) can be further expressed as PN(φ(U1,N-1,IN-1)). After storing IN,opt and fN , the same method is used to calculate fN-1, and the expressions of IN-1,opt and fN-1 are represented as MN-1(U1,N-1,opt) and PN-1(φ(U1,N-2,IN-2)), respectively. After storing IN-1,opt and fN-1, fN-2 is calculated. Thus, this process is performed step by step, obtaining each stage of the charging current Ij,opt in the expression for U1,j, i.e., Mj(U1,j). According to the initial condition U1,1 = 0 and the state transition equation U1,j = φ(U1,j-1,Ij-1), the optimal charging current Ij at each stage is calculated. The solution flow is shown in Figure 8.

4. Analysis of Simulation and Experimental Results

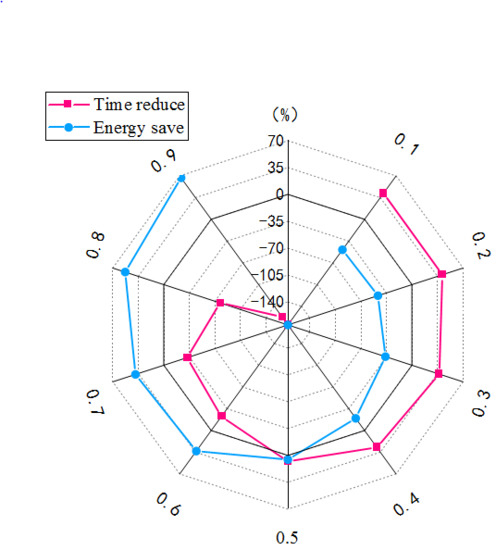
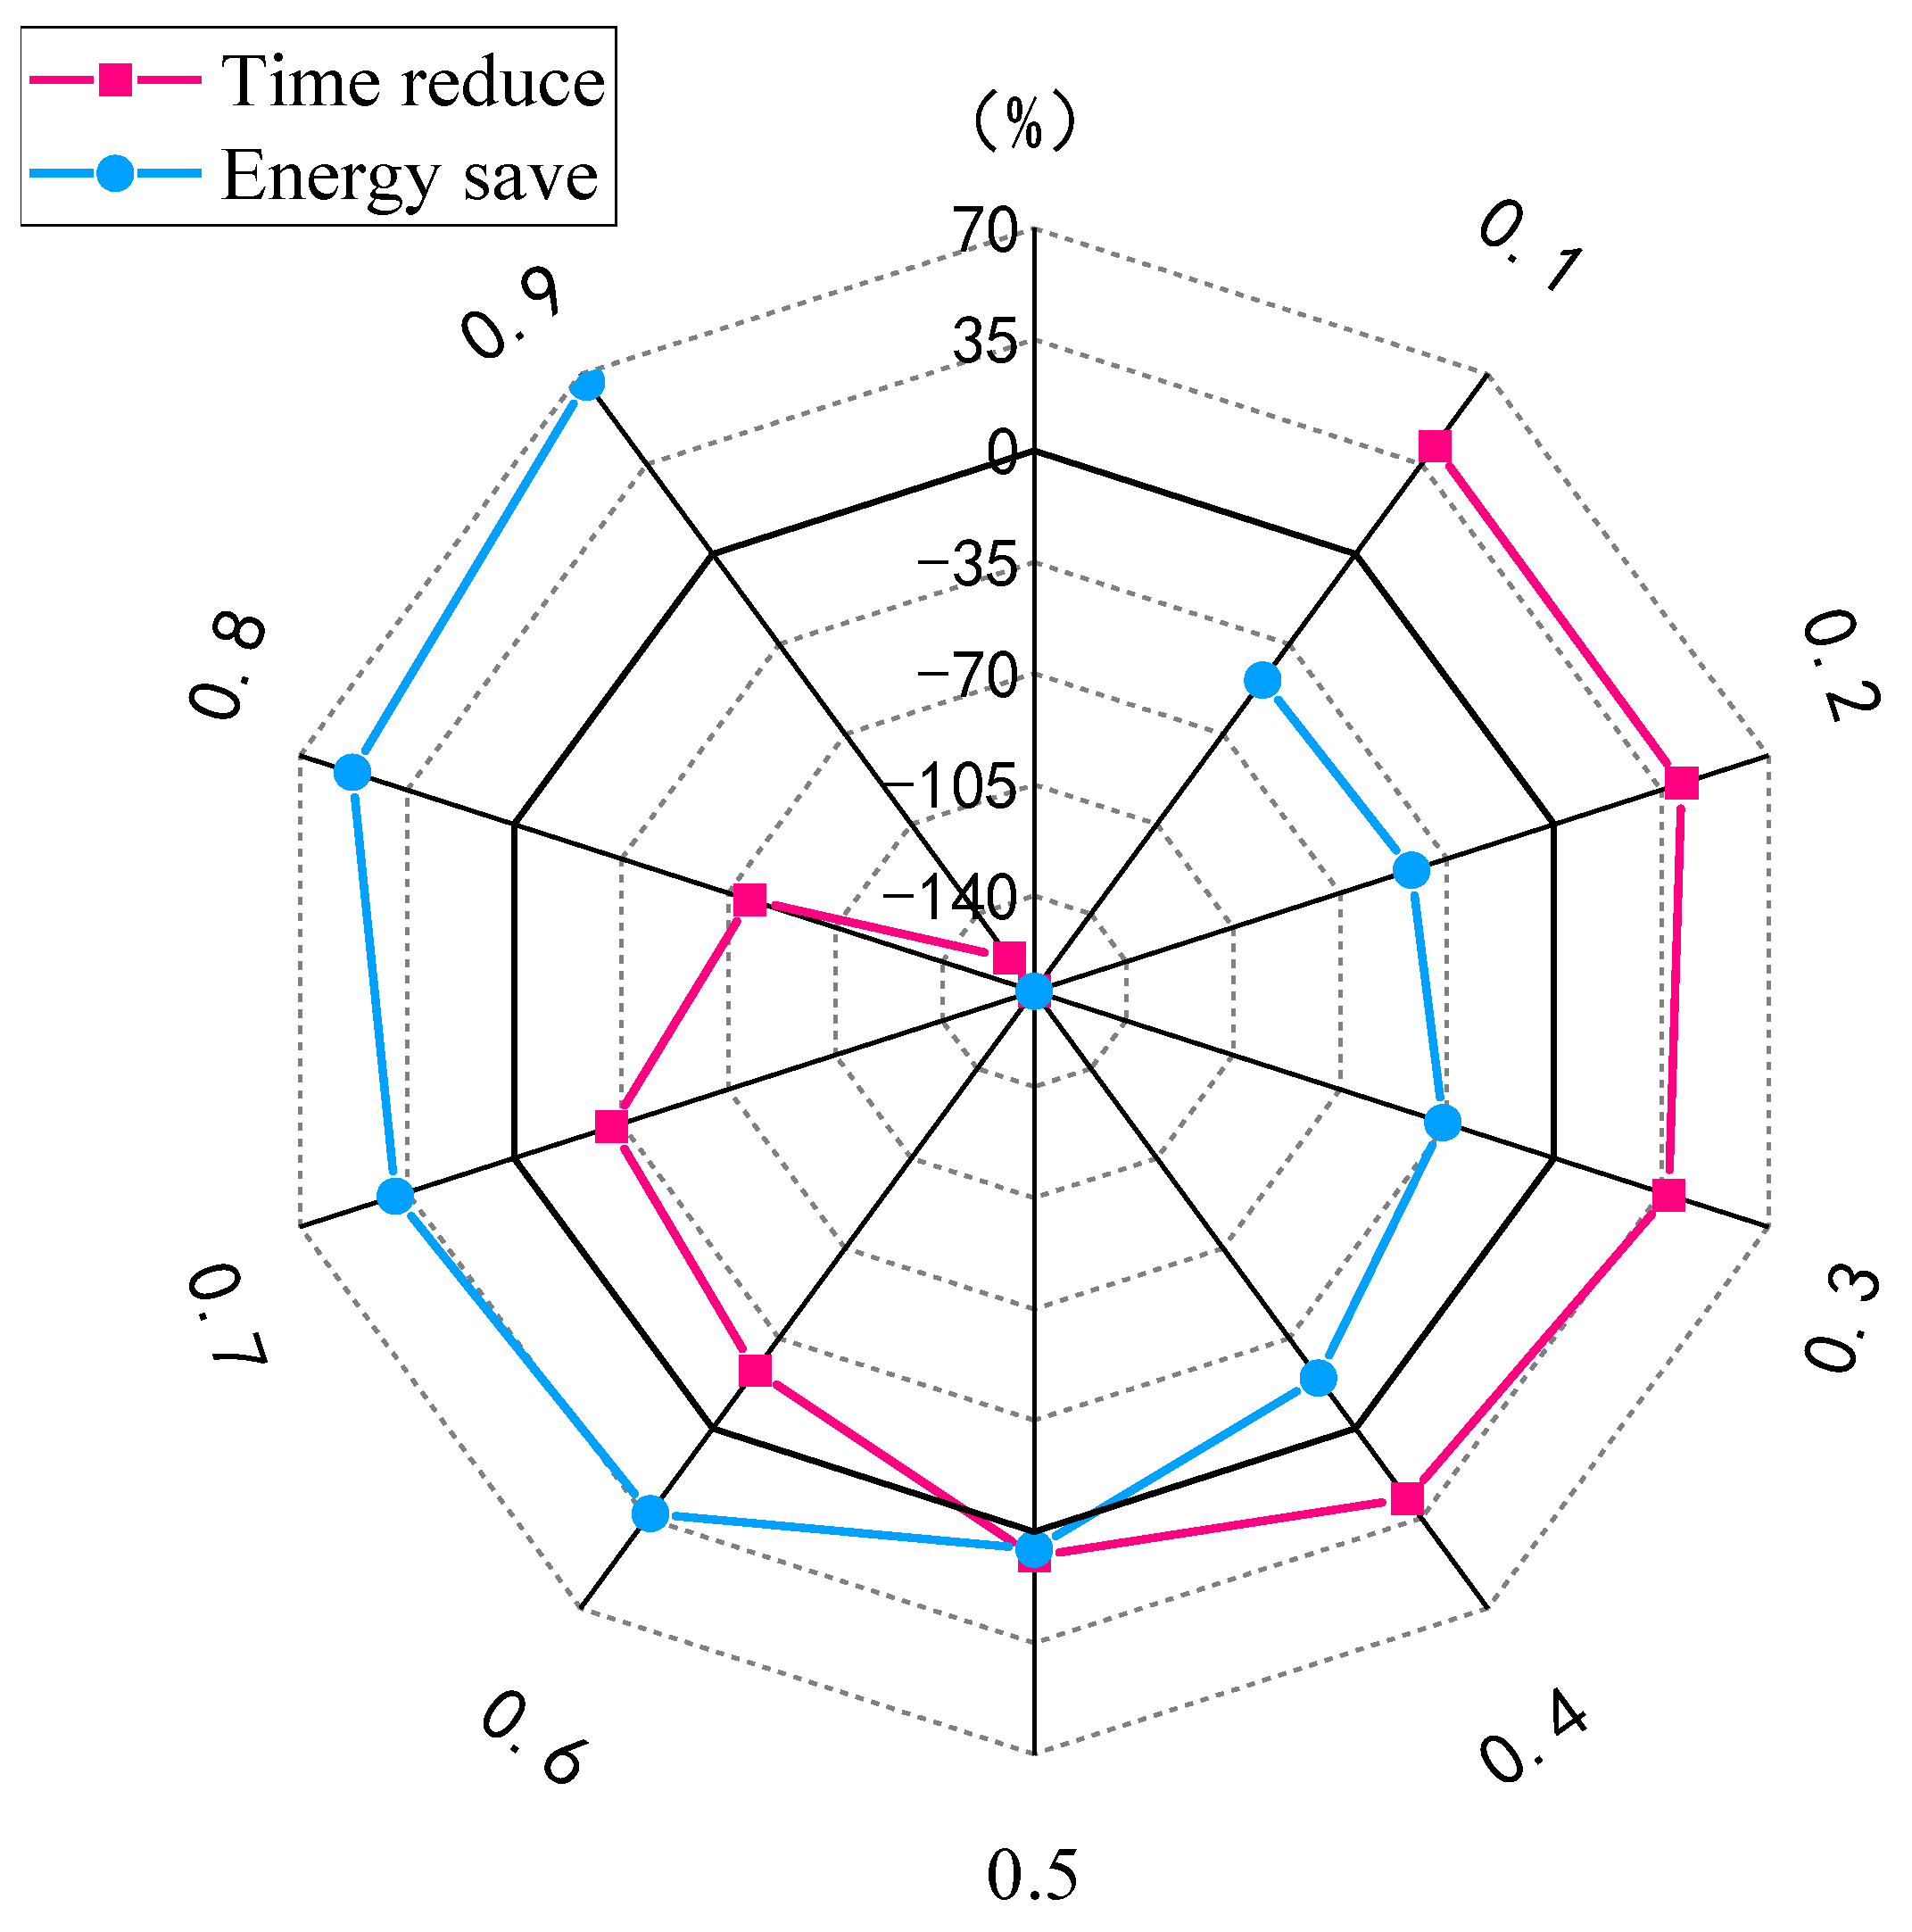
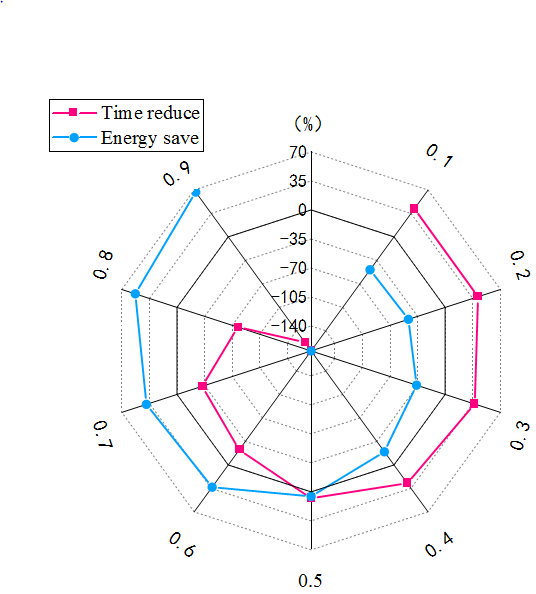
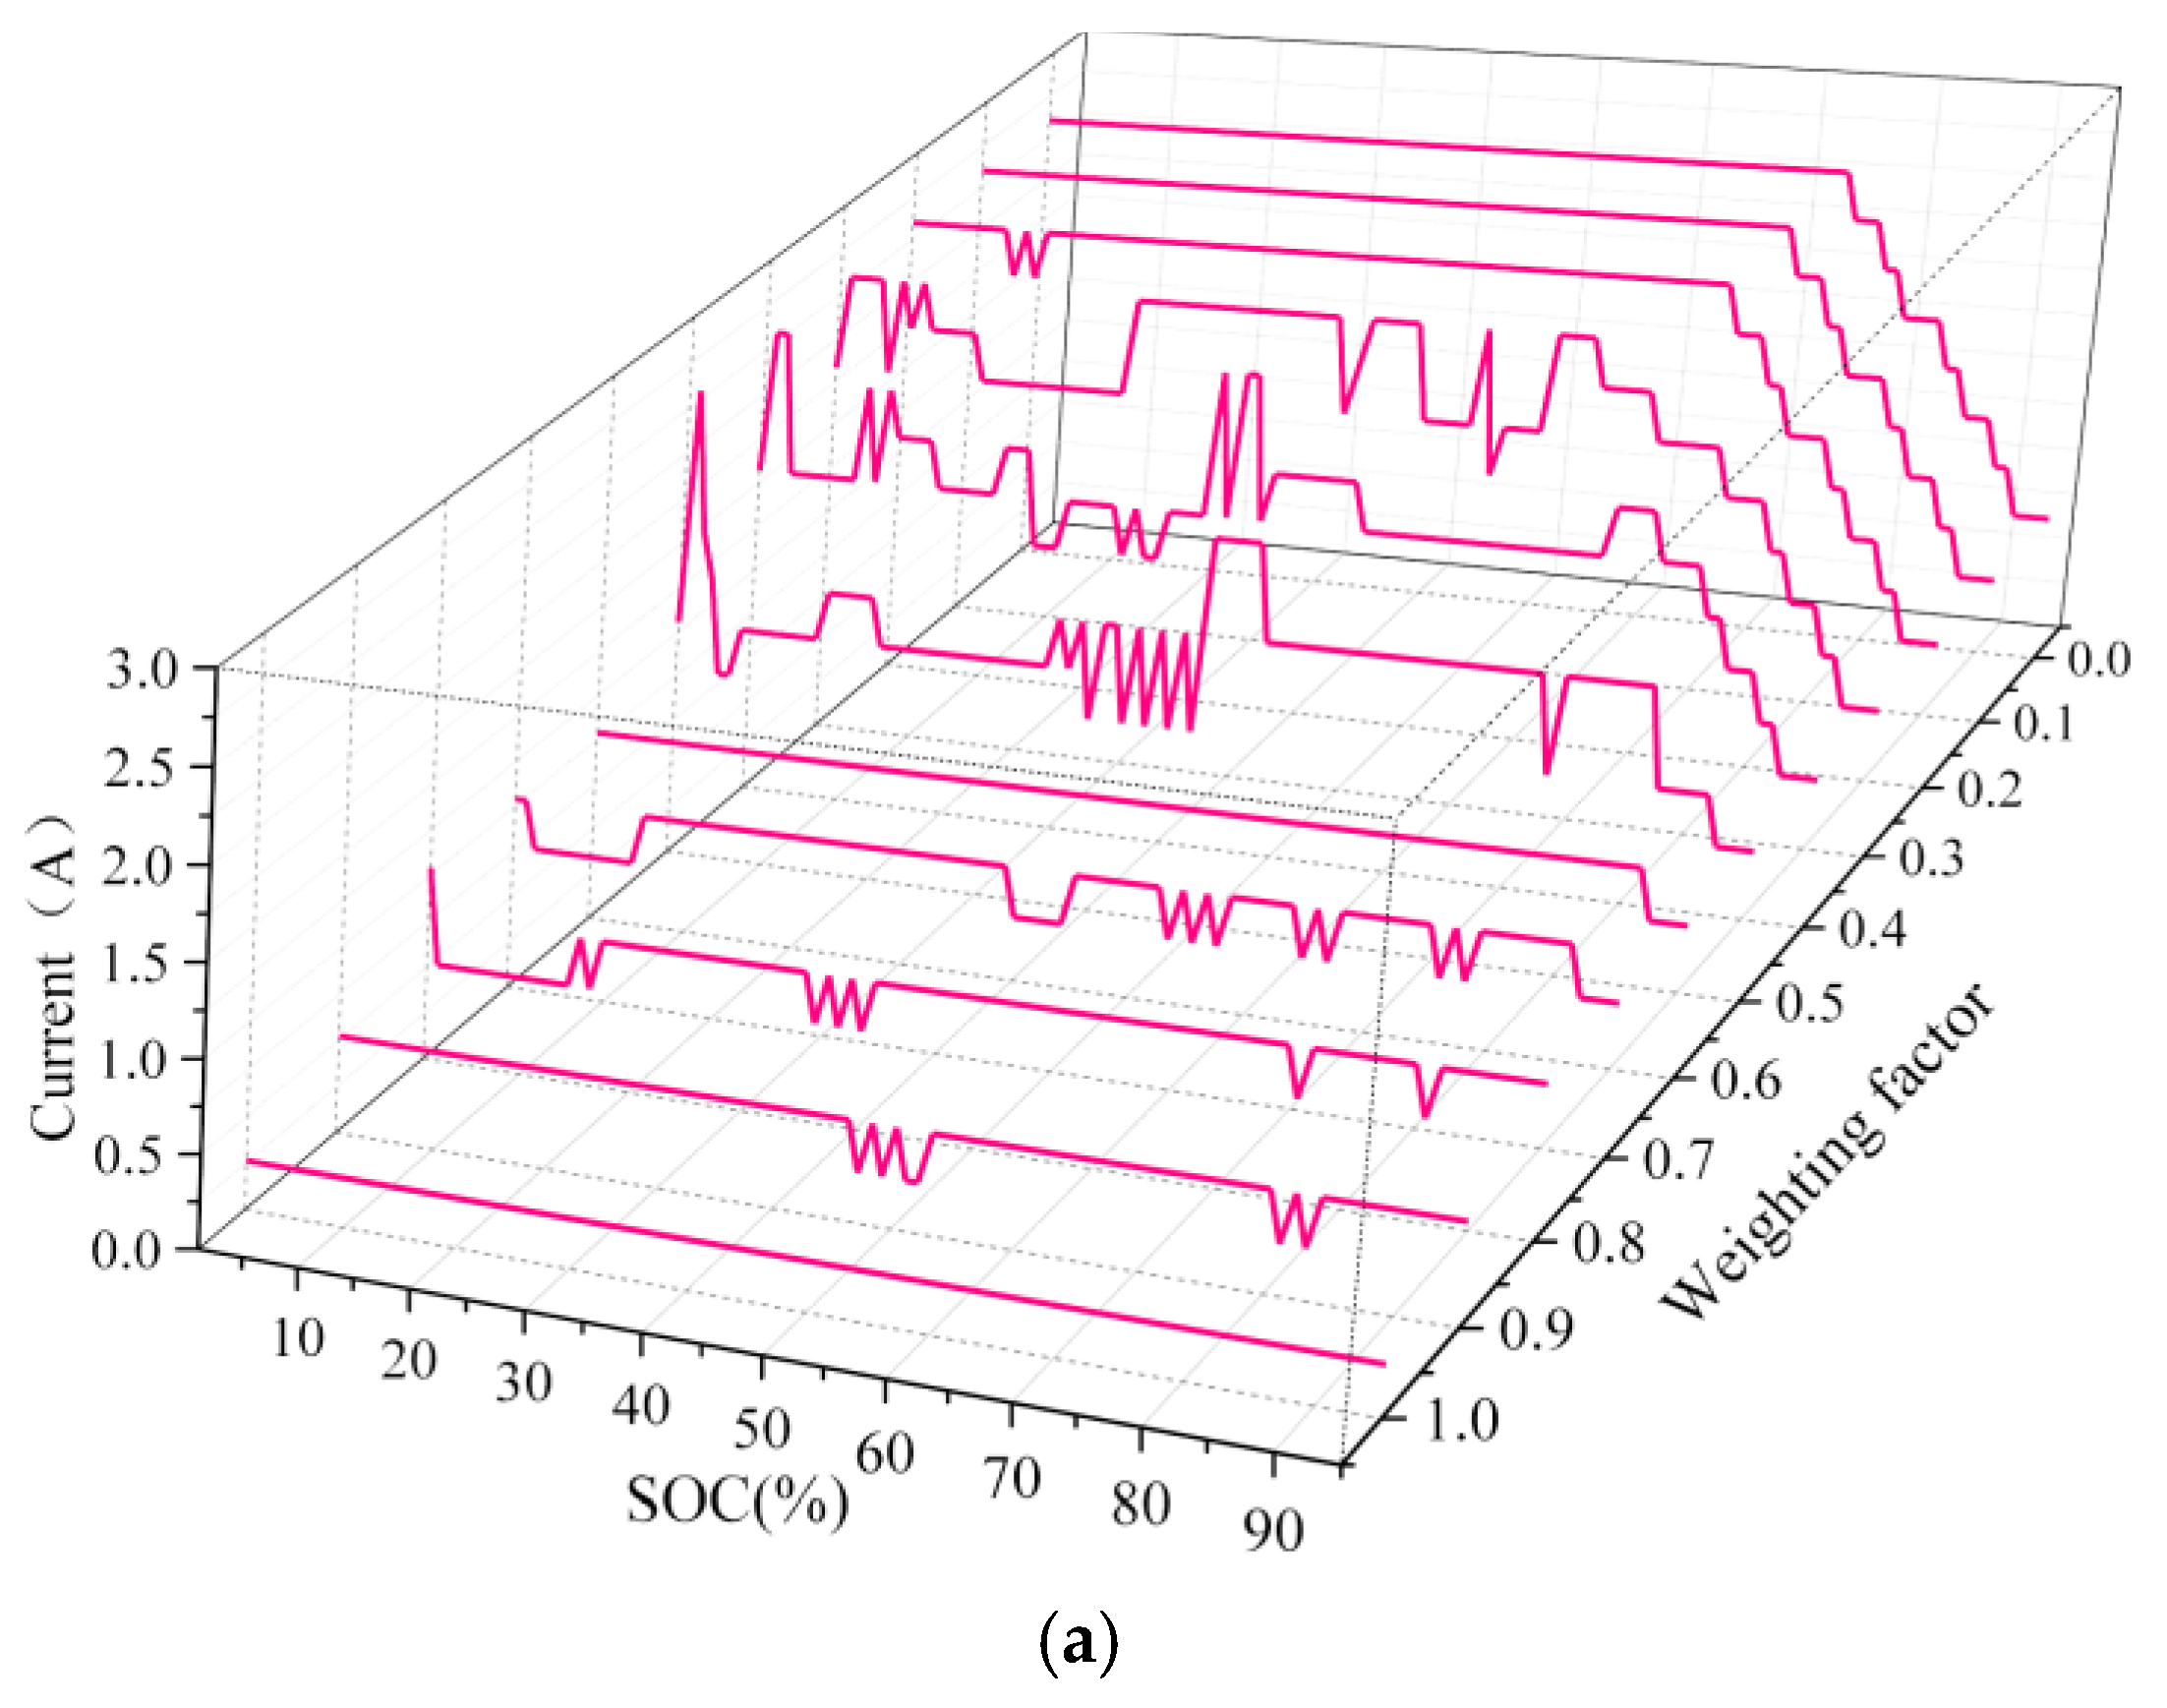
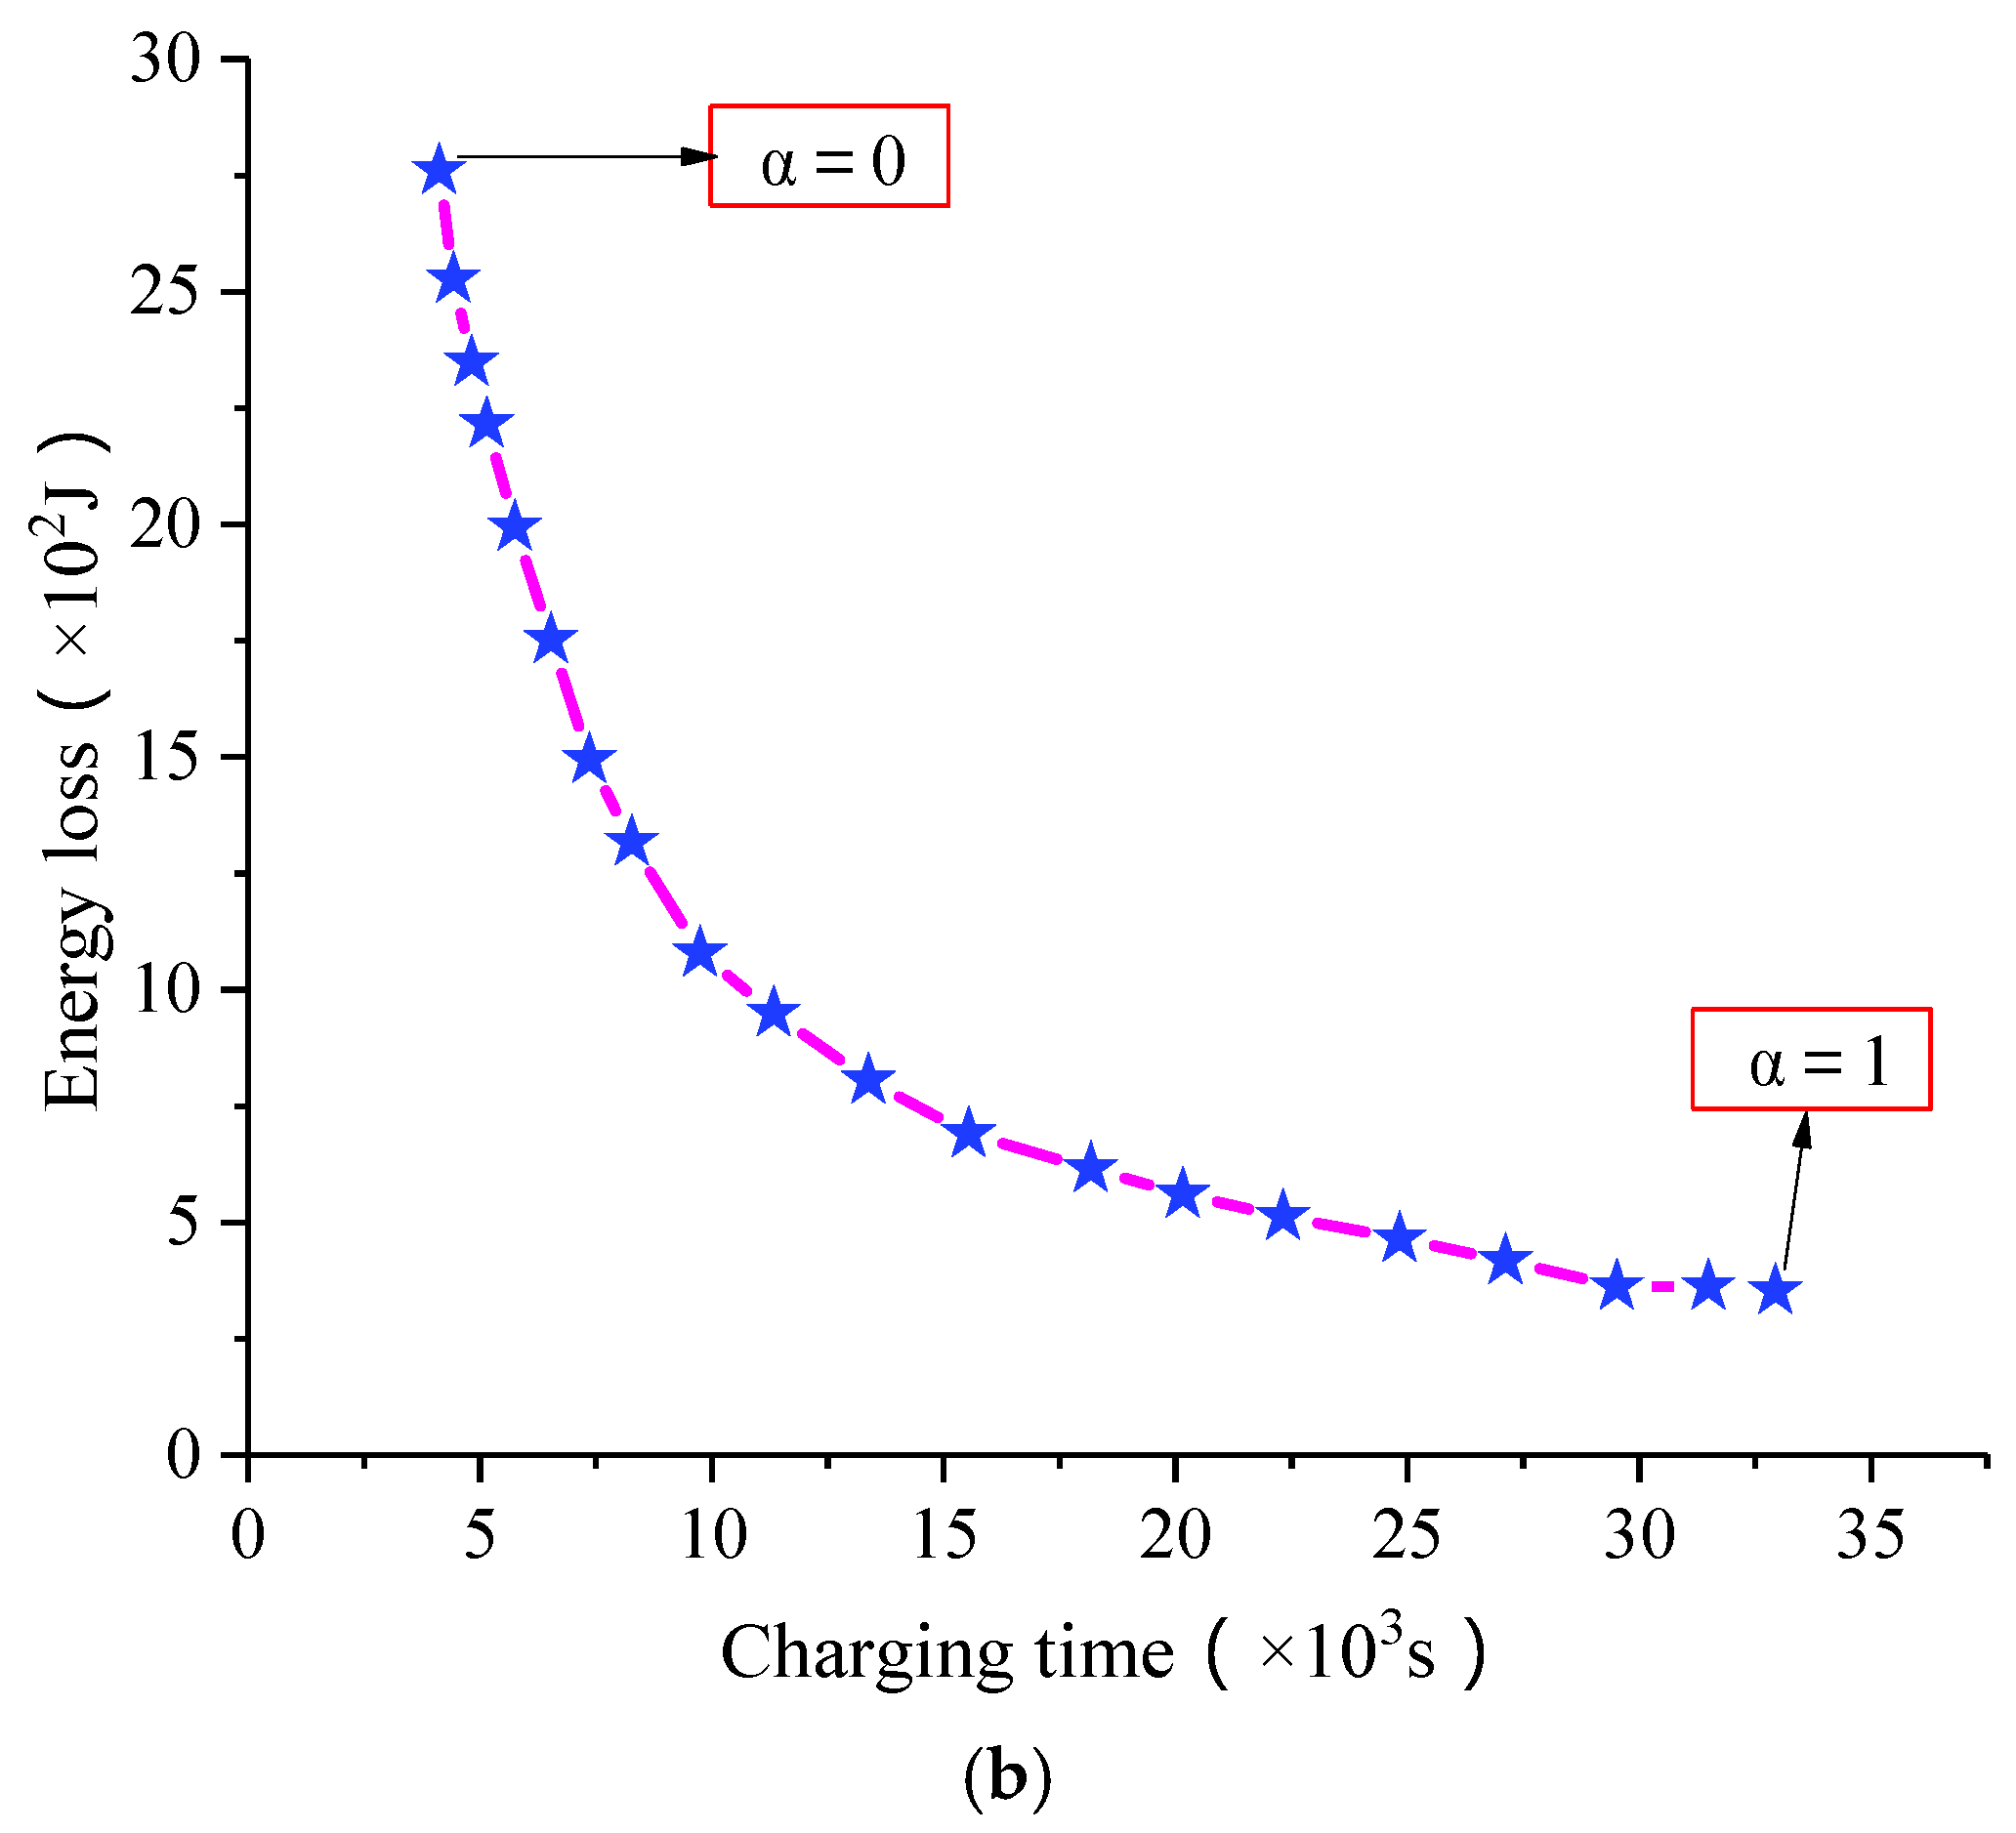
4.1. Optimization Results for Different Weighting Factors

When the weighting factor changes from 0 to 1 in the optimization target, the optimization result of the proposed charging method is shown in Figure 9. The charging range of the battery corresponding to each weighting factor is in the range of 0 to 95% of SOC.
Figure 9a illustrates an optimized charge current curve for different weighting factors, and Figure 9b illustrates the time and energy loss for different weighting factors corresponding to the proposed charging method. It can be observed from the graph that, when the charging time decreases, the battery energy loss increases, which indicates that the two problems are contradictory with respect to the optimization of battery charging.

4.2. Analysis of the Weighting Factors

In order to verify the effectiveness of the proposed charging method and to provide reference for selecting the optimum weighting factor, this study has compared the proposed method and the CCCV charging method. The weighting factor of the proposed method is in the range of 0.1–0.9, whereas the charging current ratio of the CCCV charging method is 0.5C. The charging range is in the SOC range of 0 to 95%. The charging time and battery energy loss of both these methods are demonstrated in Table 3.
The comparison between the two charging methods assumes the following approach:
γ α , t = t c c c v t α t c c c v × 100 %
γ α , E = E c c c v E α E c c c v × 100 %
The aforementioned equations present the percentage time and energy consumption, respectively, of the optimal charging method when compared to the CCCV charging method; tα and Eα, respectively, represent the time and energy loss of the proposed charging method corresponding to the weighting factor α; tCCCV and ECCCV, respectively, represent the time and energy loss of the CCCV charging method of 0.5C. The comparison results are shown in Figure 10. When ‘Energy save’ or ‘Time reduce’ is positive, it means that the proposed charging method is superior to the constant current constant voltage charging method in reducing the energy loss or reducing the charging time, and the greater the absolute value of ‘Energy save’ or ‘Time reduce’, the better the optimization effect and vice versa.
As evident from Figure 10, compared with the CCCV charging method of 0.5C, when the weighting factor is 0.1–0.4, the charging method can reduce the charging time, but the energy loss is increased. However, when the weighting factor is 0.6–0.9, the charging method can reduce the energy loss, but the charging time increases. It is only at the weighting factor of 0.5 that the energy loss decreases by 5.45% and the charging time decreases by 7.66%. This results in a trade-off in optimizing charging time and energy loss in order to change the charging current according to the changes of the internal parameters of the battery along with the changes of the SOC When the internal resistance of the SOC is relatively large, the charging current of the optimized calculation can be relatively reduced in order to reduce the energy consumption of the battery. When the resistance value corresponding to the SOC is small, the optimized calculation of the charging current can be appropriately improved in order to reduce the charging time.
This study uses the surface temperature of the battery to reflect the energy loss in the charging process indirectly. Figure 11 illustrates the comparison between the proposed charging method with weight factor of 0.5 and CCCV charging method of 0.5C in the charging. The charging range is the SOC of 0 to 95%.
As evident from Figure 11, the maximum temperature rise, average temperature rise, and charging time of the proposed charging method for the weighting factor of 0.5 are reduced, as compared to the CCCV charging method of 0.5°C. The effectiveness of the charging method proposed in this paper and the rationality behind choosing the charging method with the weighting factor of 0.5 to optimize the charging time and energy loss are explained.

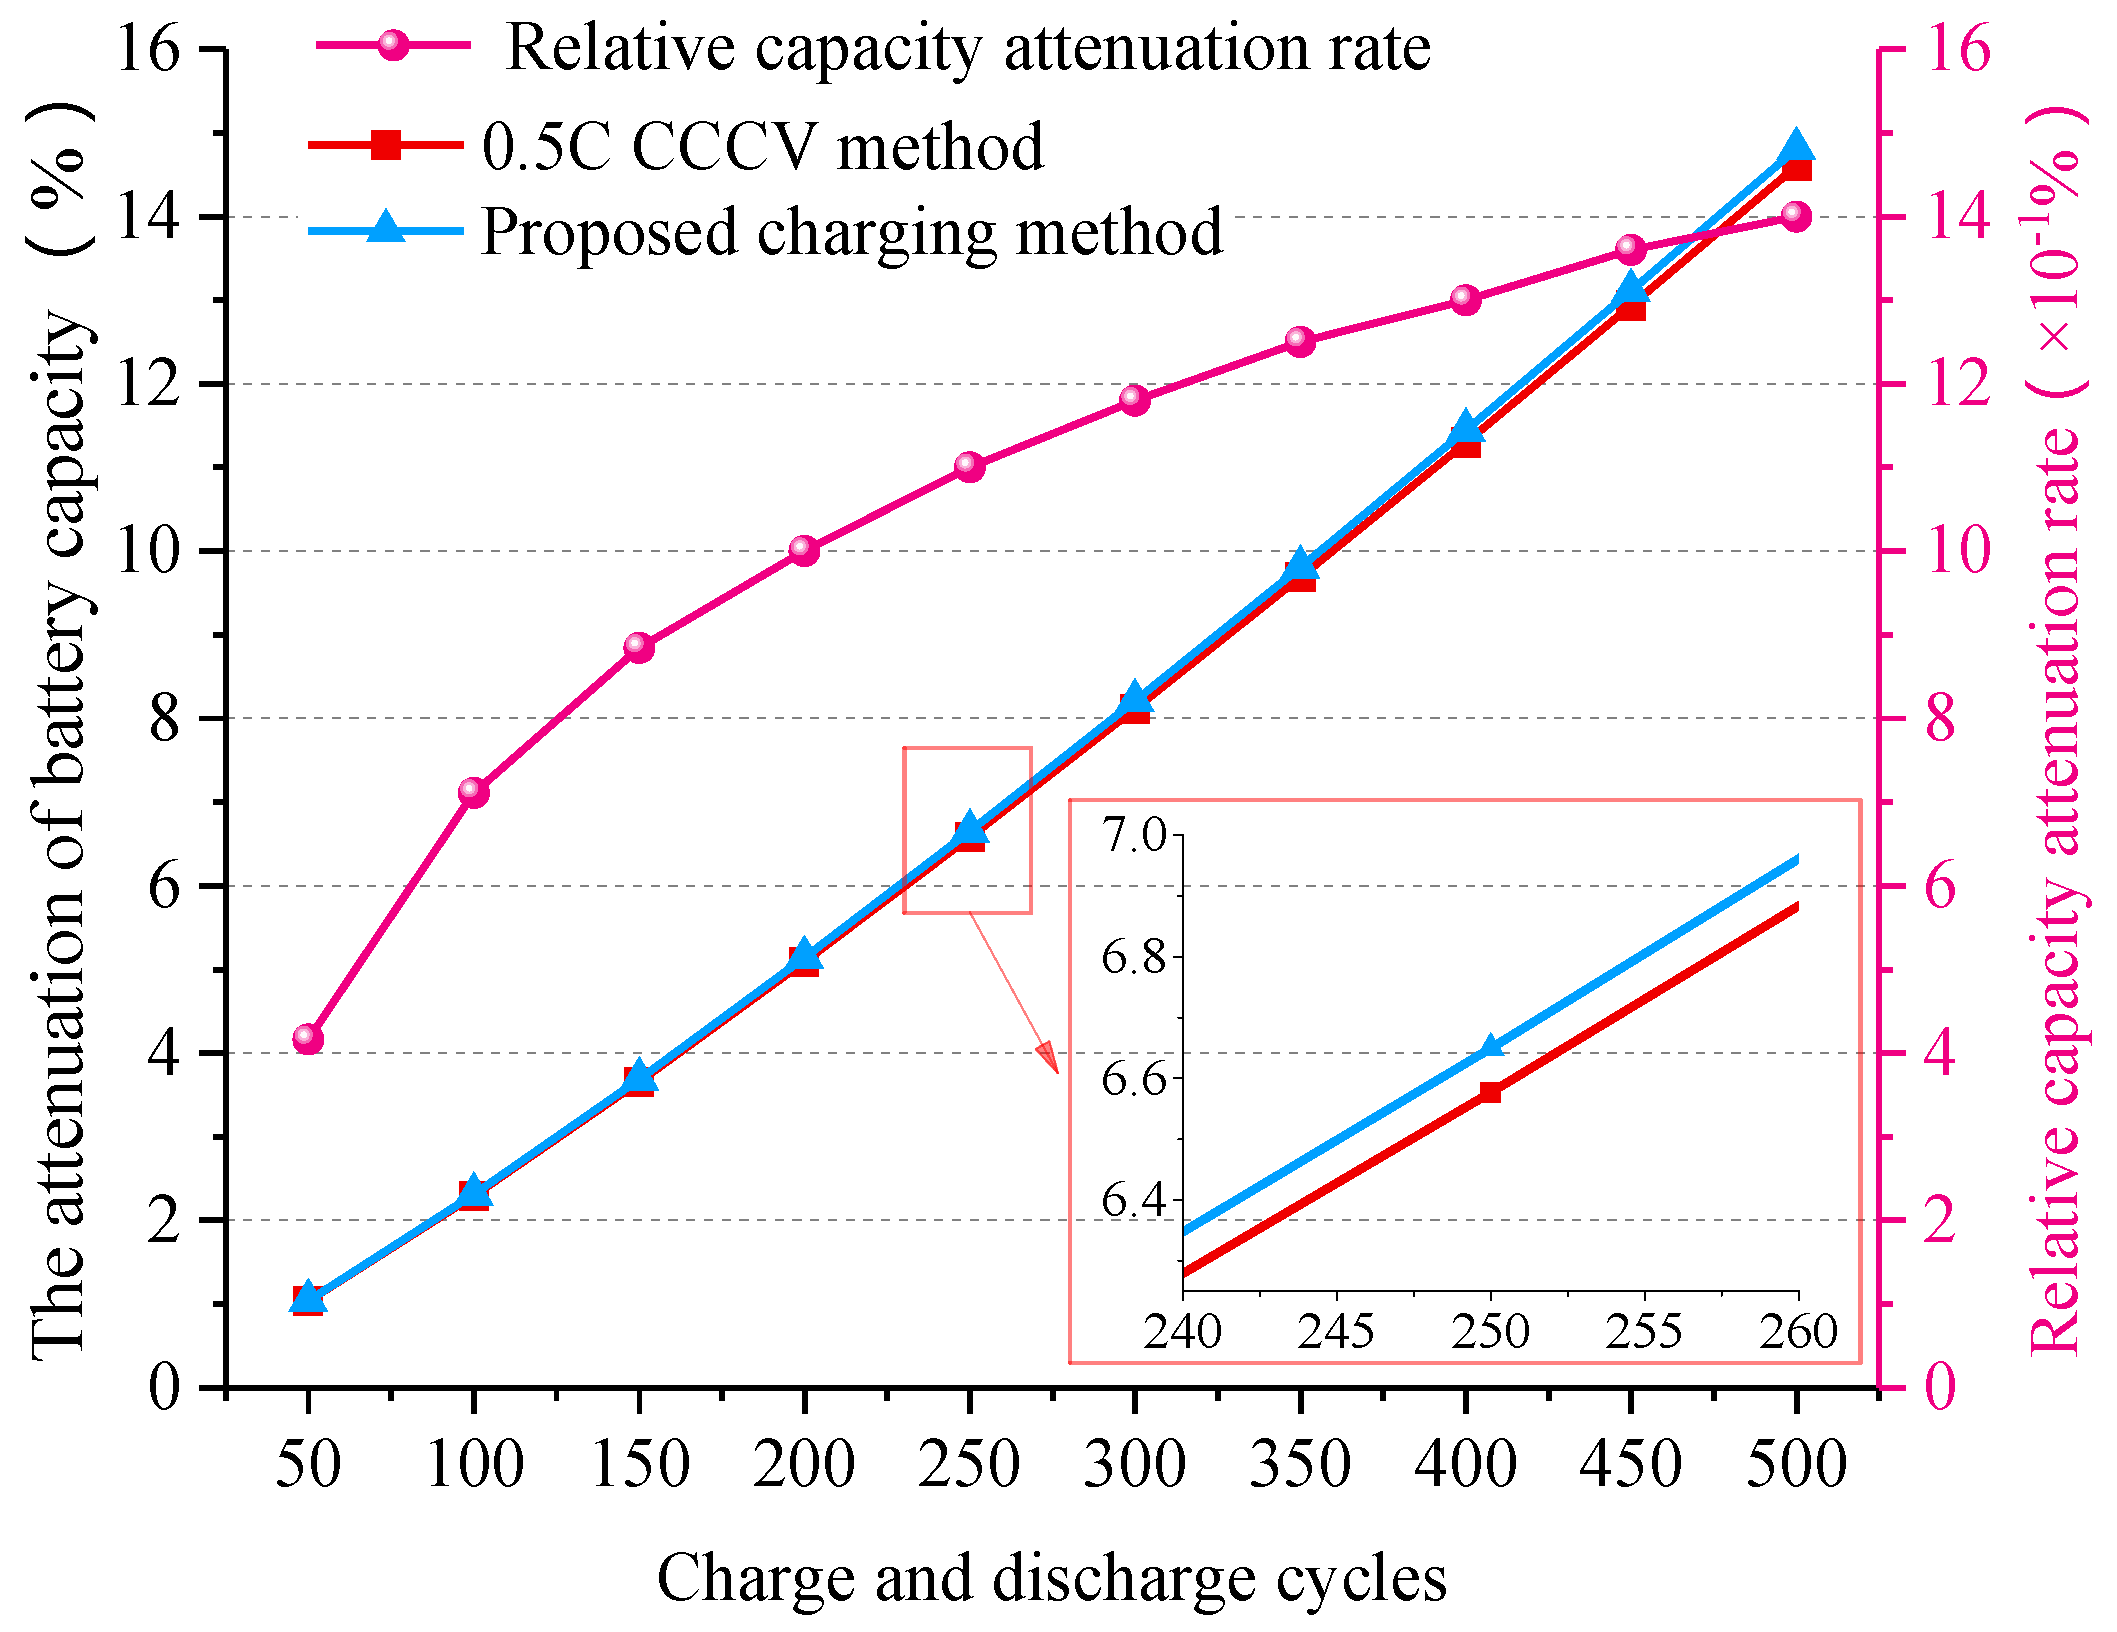
4.3. Attenuation Comparison of Battery Capacity

In order to evaluate the charging method objectively, this study performs a comparative analysis between the charging method and CCCV charging method from the perspective of battery capacity attenuation. The empirical formula describing the decay of battery life can be obtained from literature [35]:
C a p l o s s = k × x δ
where Caploss is the percentage of battery capacity attenuation, and K and δ represent the parameters related to battery charge-discharge ratio and charge-discharge cut-off voltage and temperature; further, x represents the battery charge-discharge cycles or the throughput capacity of the battery. In literature [35], the relationship between the parameters and the charge-discharge ratio was calibrated at 25 °C with the lithium-ion battery which considers the cathode material as LiCoO2 and the anode material as graphite. Specifically, x represents charge-discharge cycles and the calibration results are shown in Table 4.
In order to apply the model of battery decay and calibration parameters of [35] to the research in this study, the aging model has been further deduced, and (19) can be changed to:
C a p l o s s = k × ( A h 2 C a p ) δ
where Ah represents the throughput capacity of the battery. Further, (20) can be modified to:
A h = 2 C a p × ( C a p l o s s k ) 1 δ
By using (20) to achieve the derivation of Ah, we obtain:
C a p l o s s = δ k 2 C a p ( A h 2 C a p ) δ 1
Substituting (21) into (22) in order to achieve difference, we obtain:
C a p l o s s , p + 1 = C a p l o s s , p + δ ( I p ) k ( I p ) 2 C a p ( C a p l o s s , p k ( I p ) ) δ 1 δ Δ A h p
where Caploss,p+1 and Caploss,p, respectively, represent the cumulative loss of the battery at p and p + 1 moments, and ΔAhp represents the throughput capacity of the battery during the p to p + 1 interval, i.e.,
Δ A h p = 1 3600 t p t p + 1 | I p | d t
According to (20), we obtain:
C a p l o s s , 1 = k ( I 1 ) × ( Δ A h 1 2 C a p ) δ ( I 1 )
In the battery attenuation model adopted in this study, the charge-discharge current of the battery has a significant influence on the battery attenuation. In order to evaluate the advantages of the charging method proposed in this paper, the 0.5C current ratio will be unified used when discharging during the battery charge and discharge testing process. After multiple charge and discharge cycles, compared with the optimized charging method corresponding to the weighting factor of 0.5 and the CCCV charging method, the decay of battery capacity attenuation is shown in Figure 12. Further, the relative capacity decay rate μ is calculated as:
μ = C a p l o s s , o p t C a p l o s s , c c c v C a p l o s s , c c c v × 100 %
where Caploss,opt and Caploss,cccv represent the percentage of the battery capacity attenuation of the proposed charging method and CCCV voltage charging method of 0.5C, respectively,
It can be observed in Figure 12 that, compared with the traditional CCCV charging method, a similarity can be observed in the effect of the optimized charging method on the declining battery life. Reference [36] indicates that lithium cobalt acid batteries are mainly applied in portable mobile electronics. If the electronic products are only used for one year and the daily charge is indispensable, compared to the CCCV charging method, the proposed method reduces the charging time and energy consumption by 7.66% and 5.45%, respectively, by adopting the charging method proposed in this paper, whereas the capacity attenuation increases by merely 1.25%.
Therefore, considering the influence of charging time, battery energy consumption, and capacity attenuation, the charging method proposed in this paper can effectively reduce the charging time and battery energy loss without accelerating the attenuation of the battery capacity.

5. Conclusions

By establishing a first-order dynamic equivalent circuit model of the battery and realizing parameter identification, a charging method that considers the battery charging time and battery energy loss as the optimized objectives has been proposed in this paper, and the optimal current value has been obtained by using dynamic programming. According to the simulation and experimental results, during charging, reducing the time and reducing the energy loss are contradictory problems; therefore, the charging curve can be obtained with different emphasis on charging time and energy loss by changing the weighting factor. The results of discussion on the weighting factors in this paper are as follows. Compared with the CCCV charging method, when the weighting factor is 0.5, the energy loss and time are reduced by 5.45% and 7.66%, respectively, whereas the effect of the two charging methods on the attenuation of the battery capacity is almost the same. Therefore, the multi-objective optimal charging method can effectively solve the comprehensive optimization problem of the charging time and energy loss.

Acknowledgments

This work is sponsored by the National Key Technologies R&D Program of MOST (2016YFB0101801); Scholarship of State Key Laboratory of Power Transmission Equipment & System Security and New Technology (Chongqing University) (2007DA10512716416); Science Funds for the Young Innovative Talents of HUST, No. 201503.

Author Contributions

Xiaogang Wu and Wenwen Shi conceived and designed the Testing and simulations; Xiaogang Wu analyzed the data; Wenwen Shi wrote the paper; Jiuyu Du checked the paper.

Conflicts of Interest

The authors declare no conflict of interest.

Appendix

List of symbols.
SymbolSignificanceSymbolSignificance
R0Ohmic resistance I max Maximum charging current
R1polarization resistance   ξ percentage of maximum charge capacity
C1polarization capacitance W energy loss
UOCopen-circuit voltageICharging current
τ t voltage errorW1energy loss of the polarization resistance
U t , r actual value of the battery terminal voltageCapbattery rated capacity
U t , s simulation value of the battery terminal voltageηCoulomb efficiency
SOCState of charge Δ j charging time of each charging phase
Δ t sampling time γ α , t Time reduce
T charging time γ α , E Energy save
f objective functionxthroughput capacity
αweighting factor C a p l o s s percentage of battery capacity attenuation
Mcompensating coefficient μ relative capacity decay rate
jcharging stage

References

  1. Du, J.; Ouyang, M.; Chen, J. Prospects for Chinese electric vehicle technologies in 2016–2020: Ambition and rationality. Energy 2017, 120, 584–596. [Google Scholar] [CrossRef]
  2. Pattipati, B.; Sankavaram, C.; Pattipati, K. System Identification and Estimation Framework for Pivotal Automotive Battery Management System Characteristics. IEEE Trans. Syst. Man Cybern. Part C 2011, 41, 869–884. [Google Scholar] [CrossRef]
  3. Xiong, R.; Zhang, Y.; He, H.; Zhou, X.; Pecht, M.G. A double-scale, particle-filtering, energy state prediction algorithm for lithium-ion batteries. IEEE Trans. Ind. Electron. 2017, PP, 1. [Google Scholar] [CrossRef]
  4. Sun, X.; Yamamoto, T.; Morikawa, T. Charge timing choice behavior of battery electric vehicle users. Transp. Res. Part D 2015, 37, 97–107. [Google Scholar] [CrossRef]
  5. Du, J.; Chen, J.; Song, Z.; Ouyang, M. Design method of a power management strategy for variable battery capacities range-extended electric vehicles to improve energy efficiency and cost-effectiveness. Energy 2017, 121, 32–42. [Google Scholar] [CrossRef]
  6. Wang, J.; Liu, P.; Hicks-Garner, J.; Sherman, E.; Soukiazian, S.; Verbrugge, M.; Tataria, H.; Musser, J.; Finamore, P. Cycle-life model for graphite-LiFePO4 cells. J. Power Sources 2011, 196, 3942–3948. [Google Scholar] [CrossRef]
  7. Zhang, C.; Jiang, J.; Gao, Y.; Zhang, W.; Liu, Q. Charging optimization in lithium-ion batteries based on temperature rise and charge time. Appl. Energy 2017, 194, 569–577. [Google Scholar] [CrossRef]
  8. Nafisi, H.; Askarian Abyaneh, H.; Abedi, M. Energy loss minimization using PHEVs as distributed active and reactive power resources: A convex quadratic local optimal solution. Int. Trans. Electr. Energy Syst. 2016, 26, 1287–1302. [Google Scholar] [CrossRef]
  9. Du, J.; Ouyang, D. Progress of Chinese electric vehicles industrialization in 2015: A review. Appl. Energy 2017, 188, 529–546. [Google Scholar] [CrossRef]
  10. Han, X.; Ouyang, M.; Lu, L.; Li, J. A comparative study of commercial lithium ion battery cycle life in electric vehicle: Capacity loss estimation. J. Power Sources 2014, 268, 658–669. [Google Scholar] [CrossRef]
  11. Ikeya, T.; Sawada, N.; Murakami, J.; Kobayashi, K.; Hattori, M.; Murotani, N.; Ujiie, S.; Kajiyama, K.; Nasu, H.; Narisoko, H.; et al. Multi-step constant-current charging method for an electric vehicle nickel/metal hydride battery with high-energy efficiency and long cycle life. J. Power Sources 2002, 105, 6–12. [Google Scholar] [CrossRef]
  12. Vo, T.T.; Chen, X.; Shen, W.; Kapoor, A. New charging strategy for lithium-ion batteries based on the integration of Taguchi method and state of charge estimation. J. Power Sources 2015, 273, 413–422. [Google Scholar] [CrossRef]
  13. Notten, P.H.L.; Veld, J.H.G.O.; Beek, J.R.G.V. Boostcharging Li-ion batteries: A challenging new charging concept. J. Power Sources 2005, 145, 89–94. [Google Scholar] [CrossRef]
  14. An, S.J.; Li, J.; Du, Z.; Daniel, C.; Wood, D.L. Fast formation cycling for lithium ion batteries. J. Power Sources 2017, 342, 846–852. [Google Scholar] [CrossRef]
  15. An, S.J.; Li, J.; Daniel, C.; Mohanty, D.; Nagpure, S.; Wood, D.L. The state of understanding of the lithium-ion-battery graphite solid electrolyte interphase (SEI) and its relationship to formation cycling. CARBON 2016, 105, 52–76. [Google Scholar] [CrossRef]
  16. Li, J.; Du, Z.; Ruther, R.E.; AN, S.J.; David, L.A.; Hays, K.; Wood, M.; Phillip, N.D.; Sheng, Y.; Mao, C.; et al. Toward Low-Cost, High-Energy Density, and High-Power Density Lithium-Ion Batteries. JOM-US 2017, 69, 1484–1496. [Google Scholar] [CrossRef]
  17. James, M.; Grummett, J.; Rowan, M.; Newman, J. Application of pulse charging techniques to submarine lead-acid batteries. J. Power Sources 2006, 62, 878–883. [Google Scholar] [CrossRef]
  18. Chen, L.R. Design of Duty-Varied Voltage Pulse Charger for Improving Li-Ion Battery-Charging Response. IEEE Trans. Ind. Electron. 2012, 56, 480–487. [Google Scholar] [CrossRef]
  19. Kalla, U.K.; Suthar, R.; Singh, B.; Sharma, K.; Singhal, J. Generalized electronic controller for multi-pulse battery charging systems. In Proceedings of the 6th IEEE International Conference on Power Systems, New Delhi, India, 4–6 March 2016. [Google Scholar]
  20. Savoye, F.; Venet, P.; Millet, M.; Groot, J. Impact of Periodic Current Pulses on Li-Ion Battery Performance. IEEE Trans. Ind. Electron. 2012, 59, 3481–3488. [Google Scholar] [CrossRef]
  21. Guo, Z.; Liaw, B.Y.; Qiu, X.; Gao, L.; Zhang, C. Optimal charging method for lithium ion batteries using a universal voltage protocol accommodating aging. J. Power Sources 2015, 274, 957–964. [Google Scholar] [CrossRef]
  22. Hu, X.; Li, S.; Peng, H.; Sun, F. Charging time and loss optimization for LiNMC and LiFePO4 batteries based on equivalent circuit models. J. Power Sources 2013, 239, 449–457. [Google Scholar] [CrossRef]
  23. Abdollahi, A.; Han, X.; Avvari, G.V.; Raghunathan, N.; Balasingam, B.; Pattipati, K.R.; Bar-Shalom, Y. Optimal battery charging, Part I: Minimizing time-to-charge, energy loss, and temperature rise for OCV-resistance battery model. J. Power Sources 2016, 303, 388–398. [Google Scholar] [CrossRef]
  24. Liu, W.; Wu, C.; He, Z.; Sun, X.; Yang, G. A Multi—Stage Constant Current Charging Method Considering Internal Energy Loss and Charging Speed of Lithium Batteries. Trans. China Electrotech. Soc. 2017, 32, 112–120. [Google Scholar]
  25. He, H.; Xiong, R.; Guo, H.; Li, S. Comparison study on the battery models used for the energy management of batteries in electric vehicles. Energy Convers Manag. 2012, 64, 113–121. [Google Scholar] [CrossRef]
  26. Sun, F.; Xiong, R.; He, H. A systematic state-of-charge estimation framework for multi-cell battery pack in electric vehicles using bias correction technique. Appl. Energy 2016, 162, 1399–1409. [Google Scholar] [CrossRef]
  27. Hu, X.; Li, S.; Peng, H. A comparative study of equivalent circuit models for Li-ion batteries. J. Power Sources 2012, 198, 359–367. [Google Scholar] [CrossRef]
  28. Xiong, R.; Yu, Q.; Wang, L.Y.; Lin, C. A novel method to obtain the open circuit voltage for the state of charge of lithium ion batteries in electric vehicles by using H infinity filter. Appl. Energy 2017. [Google Scholar] [CrossRef]
  29. Tsang, K.M.; Sun, L.; Chan, W.L. Identification and modelling of Lithium ion battery. Energy Convers Manag. 2010, 51, 2857–2862. [Google Scholar] [CrossRef]
  30. Zahid, T.; Li, W. A Comparative Study Based on the Least Square Parameter Identification Method for State of Charge Estimation of a LiFePO4 Battery Pack Using Three Model-Based Algorithms for Electric Vehicles. Energies 2016, 9, 720. [Google Scholar] [CrossRef]
  31. Zhang, S.; Zhang, C.; Xiong, R.; Zhou, W. Study on the Optimal Charging Strategy for Lithium-Ion Batteries Used in Electric Vehicles. Energies 2014, 7, 6783–6797. [Google Scholar] [CrossRef]
  32. Zhang, B.; Chen, M.; Yang, D. Investigation of the polarization effect in lithium iron phosphate battery for electric vehicles. In Proceedings of the 2014 IEEE Conference and Expo Transportation Electrification Asia-Pacific (ITEC Asia-Pacific), Beijing, China, 31 August–3 September 2014. [Google Scholar]
  33. Groot, J.; Swierczynski, M.; Stan, A.I.; Kær, S.K. On the complex ageing characteristics of high-power LiFePO 4/graphite battery cells cycled with high charge and discharge currents. J. Power Sources 2015, 286, 475–487. [Google Scholar] [CrossRef]
  34. Xiong, R.; Tian, J.; Mu, H.; Wang, C. A systematic model-based degradation behavior recognition and health monitoring method for lithium-ion batteries. Appl. Energy 2017. [Google Scholar] [CrossRef]
  35. Gao, Y.; Jiang, J.; Zhang, C.; Zhang, W.; Ma, Z. Lithium-ion battery aging mechanisms and life model under different charging stresses. J. Power Sources 2017, 356, 103–114. [Google Scholar] [CrossRef]
  36. Huang, L.; Li, T.; Liu, C.; Quan, X.; Chen, L. Synergetic interactions improve cobalt leaching from lithium cobalt oxide in microbial fuel cells. Bioresour. Technol. 2013, 128, 539–546. [Google Scholar] [CrossRef] [PubMed]
Figure 1. First-order circuit model of battery.
Energies 10 01271 g001
Figure 2. Test flow of battery model parameters.
Energies 10 01271 g002
Figure 3. Identification results of battery model parameters. (a) Open circuit voltage identification results; (b) Ohmic resistance identification results; (c) Polarization resistance identification results; (d) Polarization capacitance identification results.
Energies 10 01271 g003
Figure 4. Simulation and test results with charging ratio of 0. 4C. (a) Charging current curve; (b) Voltage curves for simulation and testing.
Energies 10 01271 g004
Figure 5. Comparison between the errors of the calculated value and the test result of the equivalent circuit model.
Energies 10 01271 g005
Figure 6. Test flow for the maximum charge capacity with different charging currents.
Energies 10 01271 g006
Figure 7. Relationship between the maximum charge capacity and its corresponding maximum charge current.
Energies 10 01271 g007
Figure 8. Flowchart of dynamic programming algorithm adopted to obtain current.
Energies 10 01271 g008
Figure 9. Comparison between charging current curves for different weights and charging time and energy loss for different weights. (a) Charging current curve; (b) Charging time and energy loss.
Energies 10 01271 g009aEnergies 10 01271 g009b
Figure 10. Comparison between charging method and CCCV charging method for different weight factors.
Energies 10 01271 g010
Figure 11. Surface temperature rise of the battery during the charging process.
Energies 10 01271 g011
Figure 12. Effect of the two charging methods on the attenuation of battery capacity.
Energies 10 01271 g012
Table 1. Nominal specifications of the battery.
ItemSpecification
Cathode materialLiCoO2
Anode materialGraphite
Rated capacity2.6 Ah
Maximum charging current1C
Maximum discharging current2C
Charging cut-off voltage4.2 V
Discharging cut-off voltage3.75 V
Table 2. Mathematical model of dynamic programming algorithm.
Phase
variables
The charge stage is divided according to ∆SOC; each charging stage is denoted by j = 1, 2, ..., N.
State variablesU1,j is the over-voltage at the initial moment of the jth charging phase.
Decision variableIj is the charging current during the jth charging phase.
Enable decision collectionDj(Ij) = {0 ≤ Ij ≤ Imax(∆SOC) × j}
State
transfer equation
{ U 1 , j + 1 = ϕ ( U j , I j ) = [ I j ( 1 e 36 C / I j R 1 , j ( I j ) C 1 , j ( I j ) ) + U 1 , j R 1 , j ( I j ) e 36 C / I j R 1 , j ( I j ) C 1 , j ( I j ) ] R 1 , j ( I j ) j = 1 , 2 ..... N 1 U 1 , N = R 1 , N ( I N ) I N U 1 , 1 = 0
Reward function V j ( I j , U j ) = α ( I j 2 R j ( I j ) 36 C I j + k = 1 36 C I j [ I j ( 1 e k R 1 , j ( I j ) C 1 , j ( I j ) ) + U 1 , j R 1 , j ( I j ) e k R 1 , j ( I j ) C 1 , j ( I j ) ] 2 R 1 , j ( I j ) )     + ( 1 α ) M 36 C I j
Objective value function f j ( U 1 , j ) = m i n I j D j ( I j ) [ v j ( I j , U 1 j ) + f j + 1 ( U j + 1 ) ]
Table 3. Time and energy loss of the proposed charging method and CCCV charging method.
Charging MethodTime (s)Energy Loss (J)
Proposed charging methodWeigh-ting factor0.141112760
0.241192715
0.344332527
0.451432216
0.565341752
0.686701239
0.793301146
0.812,510871
0.918,180615
CCCV70761853
Table 4. Calibration results for parameters k and δ .
Charge-Discharge Rate0.5C0.8C1C
k 0.01210.01160.0141
δ 1.1521.1831.17

