Improving Tube Design of a Problematic Heat Exchanger for Enhanced Safety at Minimal Costs

1
Environment Technology and Safety Technology Convergence, Inha University, Incheon 22212, Korea
2
School of Civil, Architectural & Environmental Engineering, Sungkyunkwan University, Suwon 16419, Korea
*
Author to whom correspondence should be addressed.
Energies 2017, 10(8), 1236; https://doi.org/10.3390/en10081236
Submission received: 29 June 2017
/
Revised: 12 August 2017
/
Accepted: 15 August 2017
/
Published: 21 August 2017
Abstract
:As part of a preliminary hazard analysis for a new phenol plant, the results of a hazard and operability study (HAZOP) conducted in the initial stages of the project design were re-evaluated due mechanical failure detected during the test operation. Out of the possible mechanical defects for the crude phenol column (CPC), the fact that the lowest risk grade was given to the column without consideration for any safety devices, was recognized as the cause of failure. After examining the design specifications of the safety valves of CPC, it was confirmed that the tube rupture case of the overhead condenser was also not taken into consideration. With this case included in HAZOP, the size of the safety valve had to be increased from 6Q8 to 8T10. In summary, when taking into consideration the economic impact on modification and re-purchase of the safety valve and the redesign of the piping system might have, it was determined that completely removing any possibility for the tube rupture case by mechanically reinforcing the overhead condenser would be the most economic decision. Therefore, the overhead condenser was mechanically reinforced in areas determined to require strengthening according to the results of the vibration analysis, and by adding these results to the safety device factors of the mechanical defects of CPC, the lowest safety risk grade could have been maintained.
1. Introduction
In the early stages of constructing a phenol plant, the potential risk factors which can affect the process are evaluated by listing the general causes, results, and remedies for each known risk factor, and determining its frequency and severity. This analysis, also known as preliminary hazard analysis (PrHA), is a recommended evaluation method to ensure the process safety management of highly hazardous chemicals [1]. However, PrHA mainly focuses on risk factors associated with hazardous materials and the main process elements, rather than examining the complete details of the processes within the plant. Studies indicate that some PrHAs may not completely include all the accident scenarios, and this can lead to devastating results [2]. Another safety review is recommended before the plant is put into service. The second review will double-check the safety of processes and hazardous chemicals used, and make the safety assessment more complete.
The plant investigated in this study was a phenol plant which possessed mechanical defects in the node connected to the top of the crude phenol column (CPC). The problem remained undiscovered in the initial PrHA. Without a second safety review, the plant was tested when the issue became apparent in the form of excess vibration. Upon reviewing the design specifications of the pressure safety valve (PSV) of CPC, it was confirmed that the tube rupture case of the overhead condenser was not taken into account in the initial safety analysis [3,4]. If the tube rupture case had been considered, the size of the safety valve would have to be larger. Repair and modifications were inevitable for the safe launch of the plant. Examining the cost and time required to re-purchase the modified PSV and to re-design the piping and flare stacks, it was determined that mechanically reinforcing the overhead condenser to eliminate the tube rupture case would be one of the safest decisions while minimizing the cost. Therefore, the overhead condenser needed to be mechanically reinforced in the areas that were determined to require strengthening, as per the results of the vibration analysis. Including these modifications would lower the safety risks.
In this study, the safety of the phenol plant was re-evaluated to investigate the cause of mechanical defects which occurred during the trial run in the top of CPC and to question the validity of the PrHA, as its results showed that the risk level of this column was at the lowest level of 1, which was clearly not the case. By verifying the safety of potential risk factors through re-evaluation, this study attempted to confirm the importance of re-evaluating the design, construction, and trial run processes.
2. Problem Statement
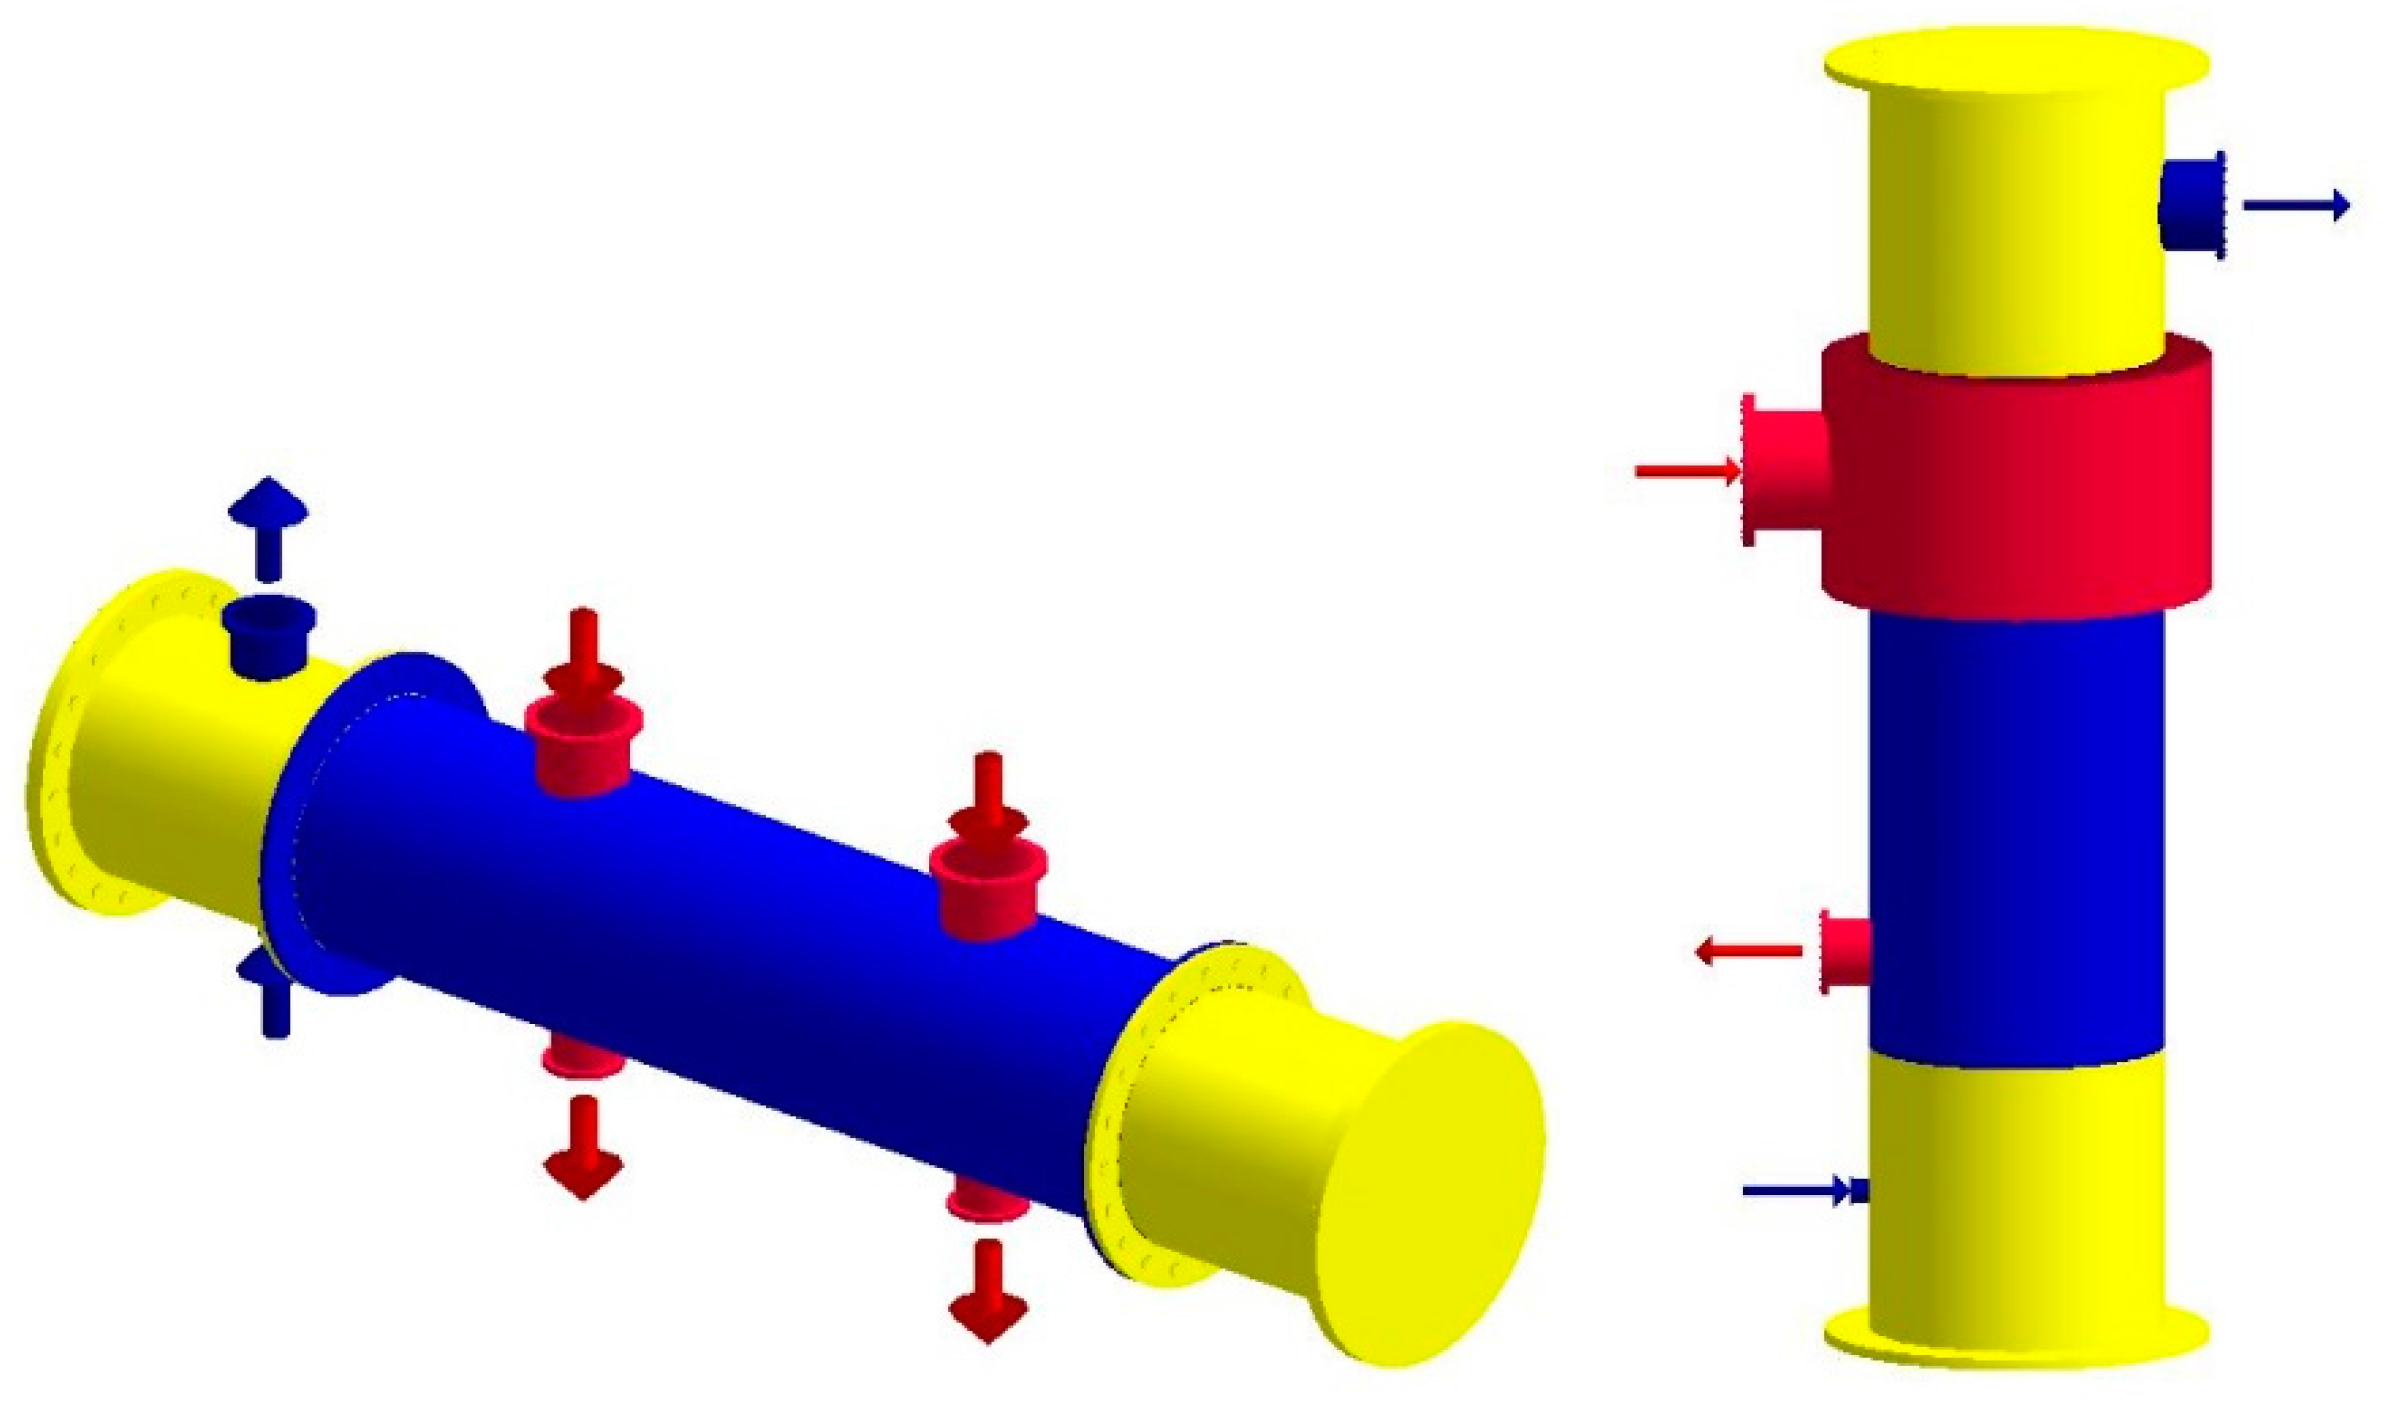
In general, condensers located at the top of columns in a vacuum are designed in a horizontal ‘X’ shaped form to reduce frictional loss and the line size of the shell side. The original condenser design at the top of the CPC was also of a horizontal design. Due to its high heat capacity, it was designed with two parallel shells. Because this ‘X’ type dual shell design had a complex manifold and piping layout, and required a significant amount of space for additional machinery, the maintenance of such a CPC was very difficult. To address this issue, the project owner and the company that provided the plant design and engineering specifications agreed to change the heat exchanger design to a vertical one with an inlet vapor belt, as shown in Figure 1.
This vertical type condenser improved upon the previous design in many ways. This included the enabling of a smaller internal piping footprint, reduction of the size of overall machinery, and simplification of maintenance. However, a drawback to this design existed in the form of significantly higher frictional loss due to its vertical design, as opposed to its frictionless horizontal counterpart. In a vertical condenser design, it is structurally impossible to use an ‘X’ type shell, and therefore, the double segmental baffle type was used [5]. Further efforts were made to find practical remedies that can be implemented during the preparation stage of the test operation.
When the risk factors were first evaluated, the company that provided engineering specifications and designs for the plant determined that there would be no vibrations in the heat exchanger, and calculated the capacity of PSV. This company failed to take into account the vibrations caused by the flow of vapor and liquid into the vertical heat exchanger. The vibration-induced tube rupture could lead to vapor leak in the flash state, and cause serious damage to the plant. These hazards necessitated a safety re-evaluation, and a system that could monitor the real-time situation of parts of the plant during the pre-analysis of risk factors, trial operations, and normal operations, in order to preserve the fundamental safety of this plant.
3. Methodology
3.1. PrHA Safety Review of Crude Phenol Column
The crude phenol column is a fractionation unit in the phenol process. The purpose of this column is to separate phenol product and heavy residues (acetophenon, cumyl phenol, residues, etc.). In the overhead section of this column, there are two condensers: the crude phenol column auxiliary condenser and the crude phenol column overhead condenser. The function of the CPC auxiliary condenser is to control the final condensing temperature to prevent the fluctuation of the cooling medium. The CPC overhead condenser (E-2413 in Figure 2) is the main condenser and has a larger capacity than the auxiliary condenser (E-2428 in Figure 2). This vertical NEN TEMA type overhead condenser is operated at vacuum condition (gauge pressure of −0.851 kg/cm2) and the cooling medium is a cumene/water mixture which is pumped from another column in the facility. These parts are shown in the overall process flow diagram of the CPC in Figure 2.
3.1.1. Risk Level Review of Tube Rupture Case in CPC Overhead Condenser
During PrHA of the crude phenol column, the tube rupture case of the overhead condenser was defined with Risk Level 1, as shown in Table 1. Scenarios identified during this PrHA study were categorized based on the severity of consequences and the probability of occurrence with the given available safeguards. The criteria for probability assessment is shown in Table 2. The likelihood is given ranks from one to four, with one being very unlikely, or once in 10+ years, and four being likely, or once a year. The severity assessment in Table 3 shows the severity level for a given incident. Severity is assessed based on various factors including the health, assets, environment, and reputation. PrHA utilizes these two factors, severity and likelihood, to set the risk level of an incident case. This ranges from one to four, one being least severe or likely, and four being the most severe and probable, as shown in Table 4. The meaning and desirability of each risk level is shown in Table 5.
3.1.2. PSV Relieving Case Review of Crude Phenol Column
PrHA results on CPC showed that the tube rupture case of overhead condenser was defined as Risk Level 1 without any consideration of significant safeguards, such as the overall PSV relieving case review, mechanical protection devices, or emergency safety logics. As per the PSV relieving data sheet of CPC shown in Table 6, cooling water failure, reflux stop, pressure control valve fail close, and reboiler tube rupture cases are considered, but an overhead condenser tube rupture case is not included, and the required orifice size (66.67 cm2) is based on the maximum relieving load of the reboiler tube rupture case (22,406 kg/h). Based on this condition, the PSV size is specified as 6Q8 (inlet nozzle size/orifice size/outlet nozzle size) as guided by API Standard 526 [6].
If the tube leak occurs in the overhead condenser, the cooling medium will be leaked into the shell side with full flashing, as calculated by Aspen HYSYS (ver.8.6) [7]. The operation condition of shell and tube side is shown in Table 7.
The flow rate of leakage from the tube into the shell side can be calculated using the equation of flow rate across an orifice as in Equation (1):
where F is the flow rate through a leaking hole, c is the coefficient of discharge, β is the ratio of orifice diameter to pipe diameter, is the expansibility factor, d is the orifice diameter, ρ1 is the upstream fluid density in the orifice, PH is the operating gauge pressure at high pressure side, and PL is the operating gauge pressure at the low pressure side [8]. Equation (1) simplifies down to Equation (2), and the resulting flow rate is 21,389 kg/h.
As calculated in Equation (2), 21,389 kg/h of full flashed vapor would be leaked into the shell side through one hole of tube leakage. Considering that the vapor would be leaked through two holes, which is the general engineering practice in a leakage scenario, a total flow rate of 43,778 kg/h of flashed vapor would leak into the shell side. This vapor flow rate will exceed the maximum relieving load of reboiler tube rupture case (22,406 kg/h), and the current PSV orifice size (6Q8) would not be sufficient to cover the tube rupture of overhead condenser. Also, the increased relieving load would affect the total flare relieving load, flare header size, and flare stack capacity. The insufficient PSV size renders the risk level defined by the PrHA unacceptable, and the risk level should be checked again with reliable safeguards such as an increase in PSV size or mechanical reinforcement of the overhead condenser to prevent tube rupture.
3.1.3. Safeguards Review for Tube Rupture Case in CPC Overhead Condenser
PSV size increase and mechanical reinforcement can both provide a reliable safeguard for tube rupture. Each method needs to be reviewed for cost and feasibility. Among the many factors involved in changing the size of PSV, the conditions listed in Table 8 should be considered for the schedule of engineering/procurement/construction.
If the mechanical reinforcement of overhead condenser is chosen, the following conditions in Table 9 should be considered to prevent a tube rupture case.
Comparing the two safeguards, mechanical reinforcement was determined to be more efficient and reasonable when considering the schedule and cost impact to engineering, procurement, and construction. Therefore, the specific vibration analysis for CPC overhead condenser needs be performed to check the probability of tube vibration. Detailed vibration analysis can provide information on how the mechanical reinforcement will be conducted.
3.2. Mechanism of Flow-Induced Vibration
Shell-side flow contributes to flow-induced vibration in shell-and-tube heat exchangers, by exciting tubes at their natural frequency. When the frequency of vibration caused by shell side flow matches with the tube’s natural frequency, large amplitudes of tube vibrations are generated due to resonance [9]. This form of vibration can lead to serious tube damage and rupture.
Flow-induced vibration is divided into vortex shedding and fluid-elastic instability, and Figure 3 shows the proportional relationship between vibration amplitude and flow rate.
3.2.1. Vortex Shedding
Flow across a tube produces a series of vortices downstream as the flow separates, alternating between opposite sides of the tube. This alternate shedding of vortices produces alternating forces that occur more frequently, as the velocity of the fluid increases [10]. Vortex shedding can lead to tube collision and failure at baffles, near the tubesheet and at U-bends.
Crossflow vibration amplitude prediction, Xv, uses the assumption that vortex shedding causes vibration. The magnification factor multiplied by the midspan static deflection gives crossflow vibration amplitude as described in Figure 4 and Equation (3) [11]:
where Xv is the crossflow vibration amplitude caused by vortex shedding in [mm], CMF is the magnification factor for crossflow vibration amplitude, and Xs is the midspan static deflection in [mm].
The magnification factor (CMF) depends on the ratio (fvs/fN) of the vortex shedding frequency (fvs) to the natural frequency of the tubes (fN), and on the level of system damping as shown in Figure 5 [12].
The midspan static deflection is usually assumed to result from the fluid flowing steadily along the tube, producing a uniform drag that acts along the length of a tube span and causes the tube to bend. The following equation gives the midspan static deflection (Xs).
where Xs is the midspan static deflection in [mm], Fdrag is the drag force per unit length acting on tubes in [N/mm], L is the unsupported span length [mm], Em is the modulus of elasticity of tube material in [Pa], and I is the moment of inertia of the tube in [mm4].
3.2.2. Fluidelastic Instability
Fluidelastic instability is the most problematic vibration among flow-induced vibrations. An array of fluidelastically instable tubes vibrate in an orbital motion produced by a combination of lift and drag displacements at their natural frequencies. Such phenomena can be expected for cases in which the average crossflow velocity is equal to or greater than the critical velocity. If the flow is further increased above the instability threshold, the vibration amplitude increases until tubes collide with each other. Fluidelastic instability is the primary cause of the tube damage and rupture [13]. Fluidelastic instability can be predicted by the critical velocity with Connors’ equation:
where Vc is the Connors’ critical crossflow velocity in [m/s], βs is the fluidelastic instability constant, fN is the tube’s natural frequency in [Hz], Do is the tube’s outside diameter in [mm], Ca1 is the unit conversion constant in [1000 mm/m], We is the effective mass per unit length in [kg/mm], δo is the log decrement, and ρsf is the density of shell-side fluid in [kg/m3].
3.2.3. HTRI Vibration Analysis Program and Criteria
HTRI (Heat Transfer Research Inc., Navasota, TX, USA) programs are widely recognized as the industrial standard for the design, rating and simulation of heat transfer equipment [14,15]. Especially, Xist is the industrial standard for shell-and-tube exchangers and has the function of flow-induced vibration screening. Xist transfers applicable case data to Xvib for more detailed vibration analysis. Xvib performs flow-induced vibration analysis of a single tube in a heat exchanger bundle. The program uses a rigorous structural analysis approach to calculate the tube’s natural frequency for the first and higher modes. It can properly handle any tube support arrangement.
To prevent flow-induced vibration resulted from vortex shedding and fluidelastic instability, HTRI programs provide the vibration analysis criteria as below.
- -
- The criterion used to determine the existence of potential problems resulting from fluidelastic instability is the value of the crossflow velocity to critical velocity ratio. If this ratio exceeds 0.8 at any location, a fluidelastic instability vibration problem is probable.
- -
- The vortex shedding amplitude is less than 10% of the tube gap is needed to prevent flow-induced vibration problems caused by this mechanism. Xvib provides the vortex shedding amplitude with the maximum value, and the span where it occurs.
With these criteria, the HTRI programs can pinpoint the probable cause of failure and offer guidelines to eliminate the chance of failure.
4. Results
The vertical type overhead condenser required a 32-inch inlet line size on the shell side (instead of the manifold), as calculated when designing the condenser. Using HTRI, it was shown that the large line size increased tube inlet spacing and it may cause flow-induced vibration and tube damage due to the thermal rating. Tube damage leads to tube rupture, production loss, contaminated products, additional energy usage, and high repair costs.
As a reliable safeguard of tube rupture case in CPC overhead condenser, a vibration analysis using Xist was performed to check the probability of flow-induced vibration. The simulation result showed that potential tube vibration and damage were indicated due to following reasons: the inlet’s unsupported span length of 1917 mm exceeded the TEMA maximum requirement of 1880 mm, and there was a high crossflow velocity ratio in the inlet and center section, as shown in Table 10.
As specified by the results in Table 10, critical velocity ratios of the CPC overhead condenser inlet and center section exceeded 0.8, and this result indicated a high probability of fluidelastic instability, which could lead to large vibration amplitude and tube rupture. To prevent potential tube vibration and comply with TEMA’s maximum unsupported span length in the inlet section, installation of additional support grids was recommended, to lower the critical velocity ratios to below 0.8 in all the sections. Necessary parts were provided in the inlet vapor belt open area shown in Figure 6.
After installation of the additional support grid, detailed vibration analysis of CPC overhead condenser inlet, center, and bundle exit section was performed using Xvib (Version 7.0) [16]. For more accurate and specific vibration analysis, a single tube at the weakest point against vibration (baffle tip area) was selected, as shown in Figure 7.
Xist program does not provide the function for the additional support installation for the detailed vibration analysis, but Xvib program can provide this function to the maximum unsupported span, or according to the user's needs. All physical and thermal input data were transferred from Xist to Xvib.
The additional inlet support grids in Xvib program were installed to a location 600 mm from the tube sheet in the center of inlet vapor belt’s open area. Tube span profile from Xvib input data is summarized in Table 11.
5. Discussion
Vibration analysis result from Xvib after the additional support installation to inlet vapor belt is summarized in Table 12.
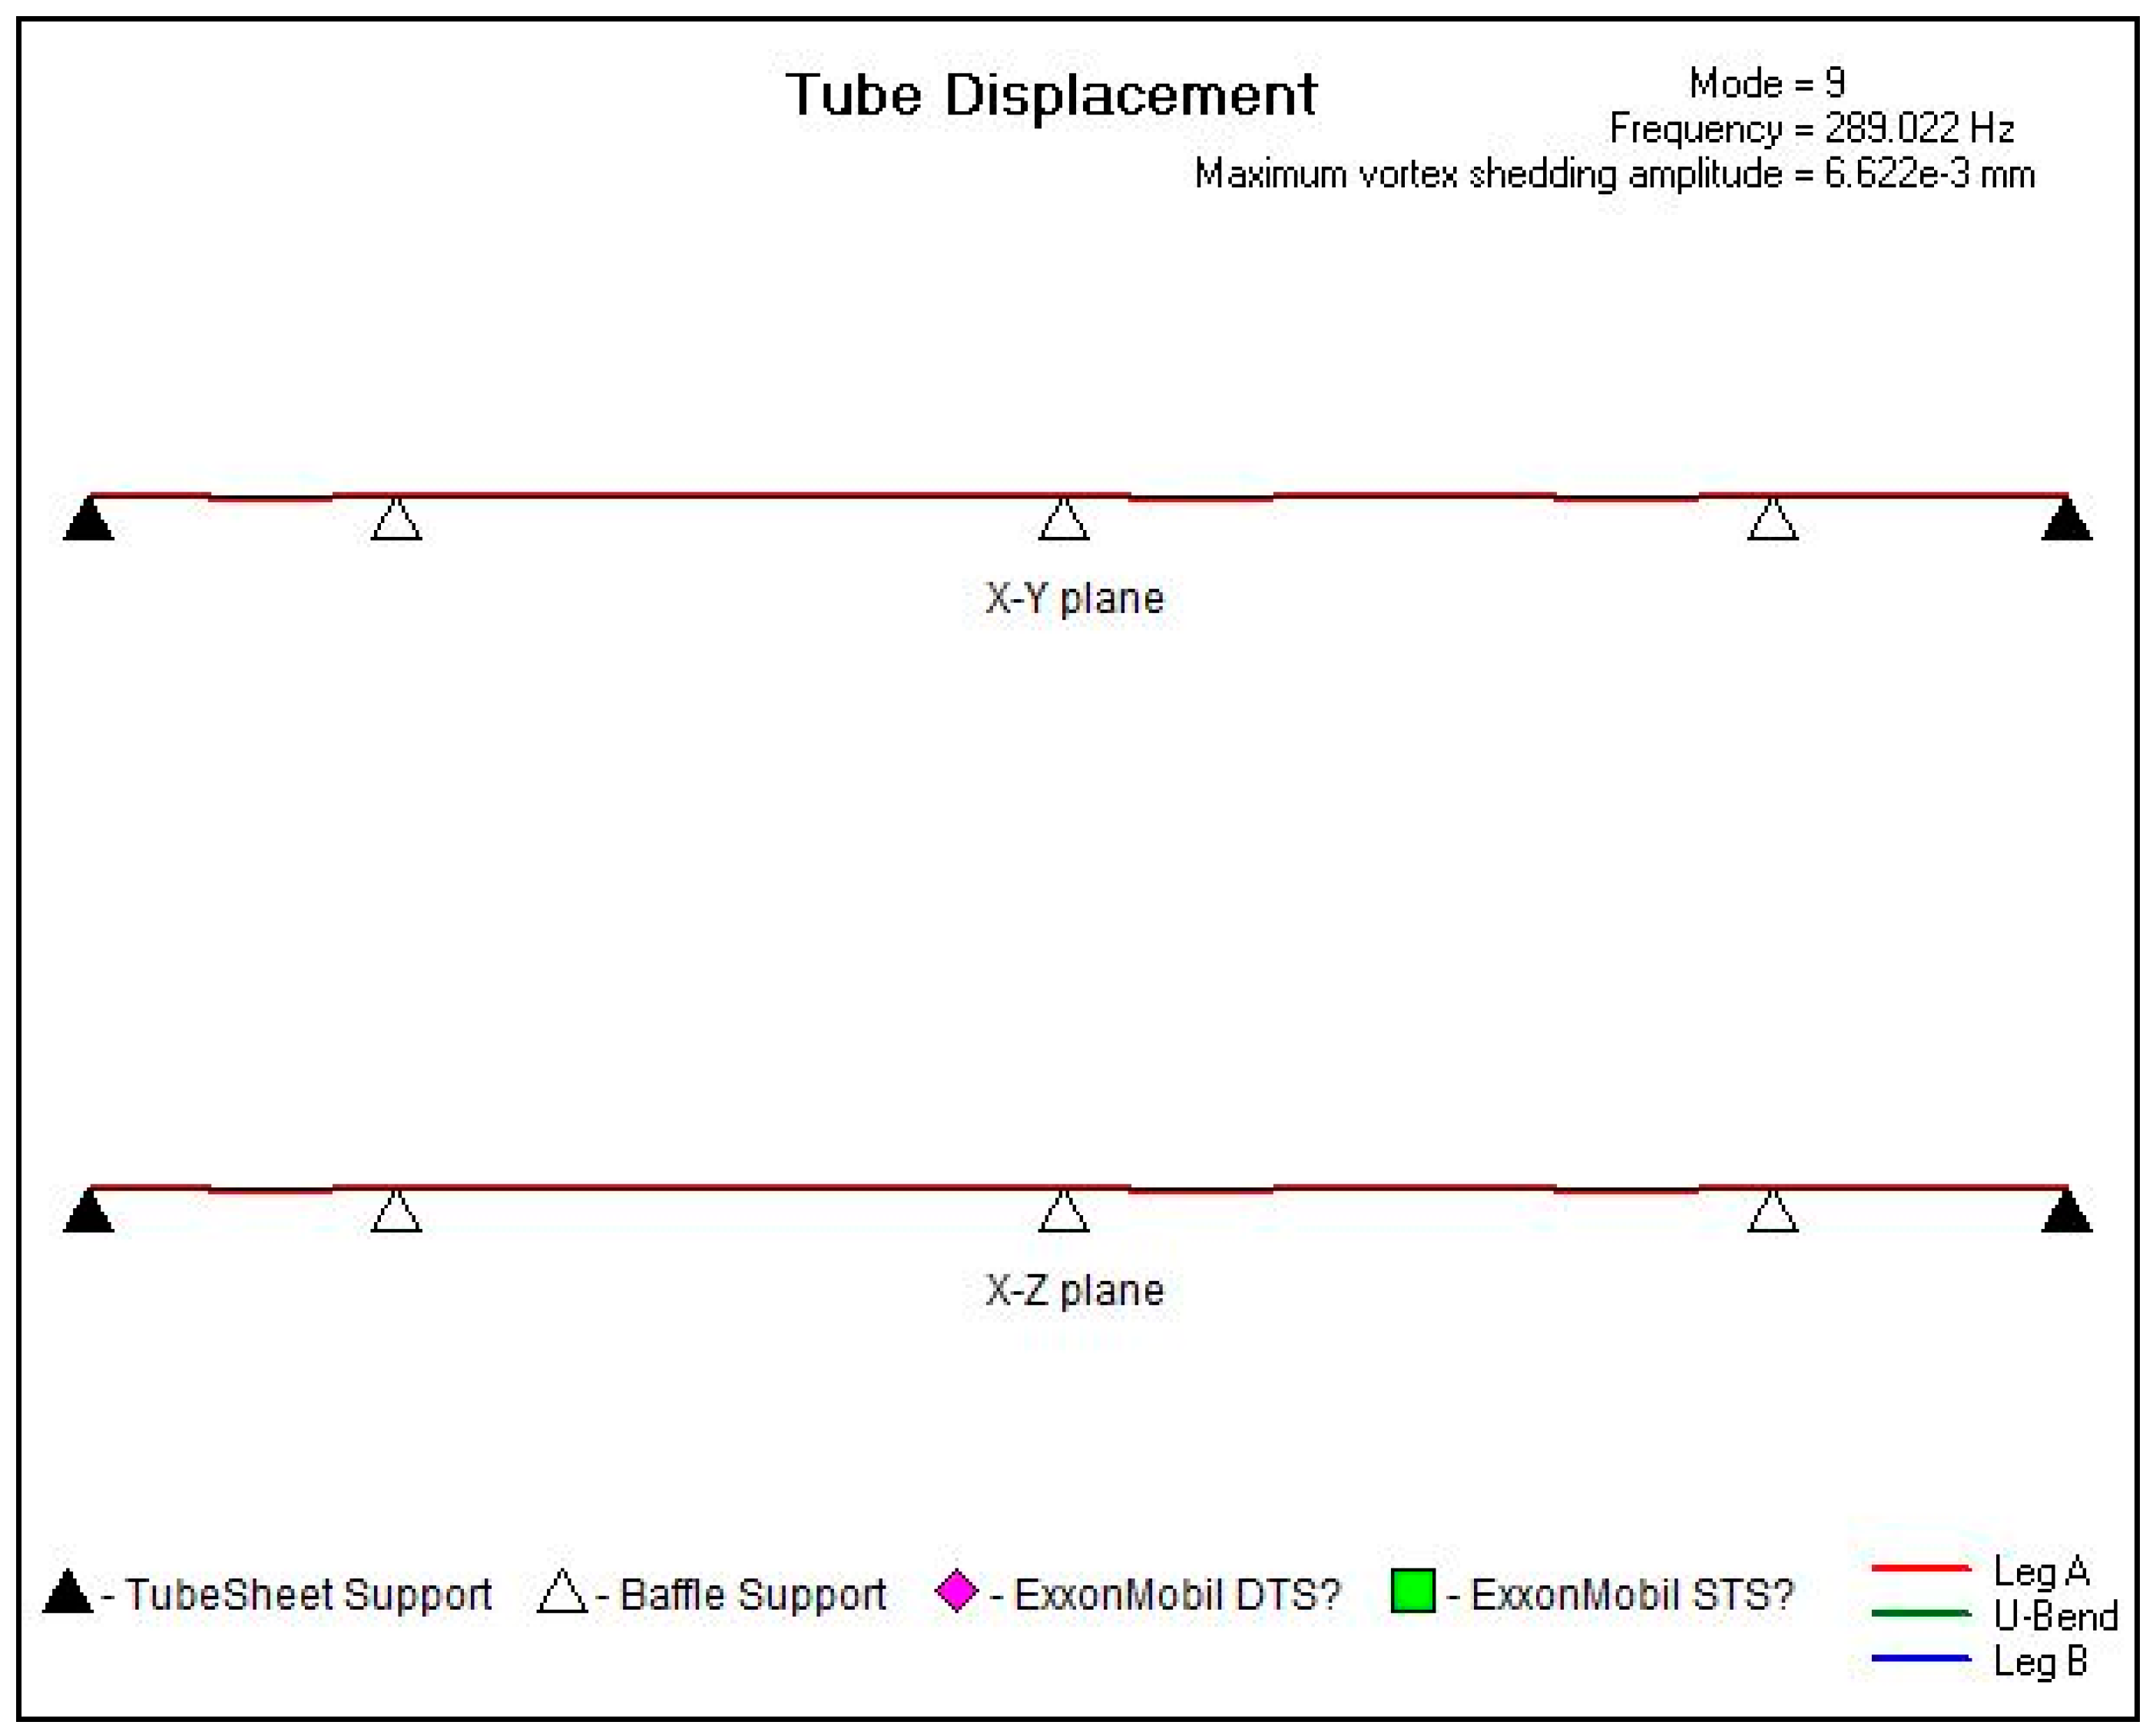
In addition, tube displacement profiles for each mode on the xy- and xz-planes are provided, as shown in Figure 8, Figure 9, Figure 10, Figure 11 and Figure 12. The vertical axes represent the displacement of the tube due to vibrations. The arrows on the horizontal axes are the positions of supports. These exact positions of these supports can be found in Table 11.
As specified in Table 12 and Figure 8, Figure 9, Figure 10, Figure 11 and Figure 12, the vibration analysis results using Xvib show the critical velocity ratio and maximum vortex shedding amplitude with various modes with the span number related to the maximum vortex shedding amplitude. The worst case was seen with modes 1 and 2 in Figure 8, where the critical velocity ratio was 0.7436 and the maximum vortex shedding amplitude was 0.342 mm at span No. 4. Critical velocity ratio is less than 0.8 and the maximum vortex shedding amplitude of 0.342 mm, were less than 10% of the 8.466 mm tube gap. Both values complied with the vibration analysis criteria.
6. Summary and Conclusions
After adding a baffle support to the extensively unsupported span, the vibration analysis results from Xvib did not show any excessive flow-induced vibration in the CPC overhead condenser inlet, center, and bundle exit section, and the maximum unsupported span length of the inlet section complied with TEMA’s requirements. This study has reached the following conclusions. After successive mechanical repair work as specified above, the possibility of tube rupture case in the CPC overhead condenser could be avoided. Given that this mechanical repair work is completed and the final results are specified in the PrHA and second safety review as an additional reliable safeguard, the risk level of tube rupture case in the CPC overhead condenser can be maintained at Level 1.
Acknowledgments
This research was supported by a grant (2017-MPSS31-001) from Supporting Technology Development Program for Disaster Management funded by Ministry of Public Safety and Security (MPSS) and the National Research Foundation of Korea (NRF) grant (MSIP) (No. NRF-2017R1A2B3007607) funded by the government of South Korea.
Author Contributions
In-Bok Lee and Seunghee Park conceived and designed the experiment; In-Bok Lee ran the simulations; In-Bok Lee and Seunghee Park analyzed the data and contributed thoughts to lead to the conclusions; In-Bok Lee wrote the paper.
Conflicts of Interest
The authors declare no conflict of interest.
References
- U.S. Department of Energy. DOE Handbook. Chemical Process Hazards Analysis; Order 703; U.S. Department of Energy: Washington, DC, USA, 1996; pp. 1–80.
- Tzou, T.L.; Edwards, D.W.; Chung, P.W.H. An explosion accident-causes and safety information management lessons to be learned. Inst. Chem. Eng. Symp. Ser. 1999, 149, 591–604. [Google Scholar]
- Liptak, B.G. Control and Optimization of Unit Operations. In Instrument Engineers’ Handbook: Process Control and Optimization, 4th ed.; Liptak, B.G., Ed.; CRC Press: Stamford, CT, USA, 2005; Volume 2, p. 2007. [Google Scholar]
- American Society of Mechanical Engineers (ASME). Boiler and Pressure Vessel Code: Section VIII, Division 1; ASME: New York, NY, USA, 2001. [Google Scholar]
- Palen, J.W. S-SS-3–12 Non-Segmental Baffles in Shell and Tube Heat Exchangers; HTRI: Navasota, TX, USA, 1999. [Google Scholar]
- API Standard 526—Flanged Steel Safety Relief Valves; American Petroleum Institute: Washington, DC, USA, 2002.
- Aspen HYSYS 8.6; Aspen Technology: Bedford, MA, USA, 2014.
- Measurement of Fluid Flow by Means of Pressure Differential Devices Inserted in Circular Cross-Section Conduits Running Full; ISO 5167:2003; ISO: Geneva, Switzerland, 2003.
- Pettigrew, M.J.; Sylvestre, Y.; Campagna, A.O. Vibration analysis of heat exchanger and steam generator designs. Nucl. Eng. Des. 1978, 48, 97–115. [Google Scholar] [CrossRef]
- Bearman, P.W. Vortex Shedding from Oscillating Bluff Bodies. Ann. Rev. Fluid Mech. 1984, 16, 195–222. [Google Scholar] [CrossRef]
- Païdoussis, M.P. Fluidelastic vibration of cylinder arrays in axial and cross flow: State of the art. J. Sound Vib. 1981, 76, 329–360. [Google Scholar] [CrossRef]
- Flow-Induced Tube Vibration. In HTRI Design Manual; HTRI: Navasota, TX, USA, 2009; Volume C.
- Païdoussis, M.P. Flow induced vibration in nuclear reactors and heat exchangers: Practical experiences and state of knowledge. In Practical Experiences with Flow-Induced Vibration; Naudascher, E., Rockwell, D., Eds.; Springer-Verlag: Berlin, Germany, 1980; pp. 1–81. [Google Scholar]
- Xist® HTRI Xchanger Suite, HTRI: Navasota, TX, USA. Available online: https://www.htri.net/xist.aspx (accessed on 19 September 2016).
- Xvib® Version 7.0, HTRI Xchanger Suite, HTRI. Available online: https://www.htri.net/xvib.aspx (accessed on 19 September 2016).
- Axial Flow in Tube Bundles with Rod-type Tube Support. In HTRI Design Manual; HTRI: Navasota, TX, USA, 2009; Volume B.
Figure 1.
Previous horizontal design (left) and improved vertical design (right).

Figure 2.
Process flow diagram of crude phenol column.

Figure 3.
Relationship between vibration amplitude and flow rate.
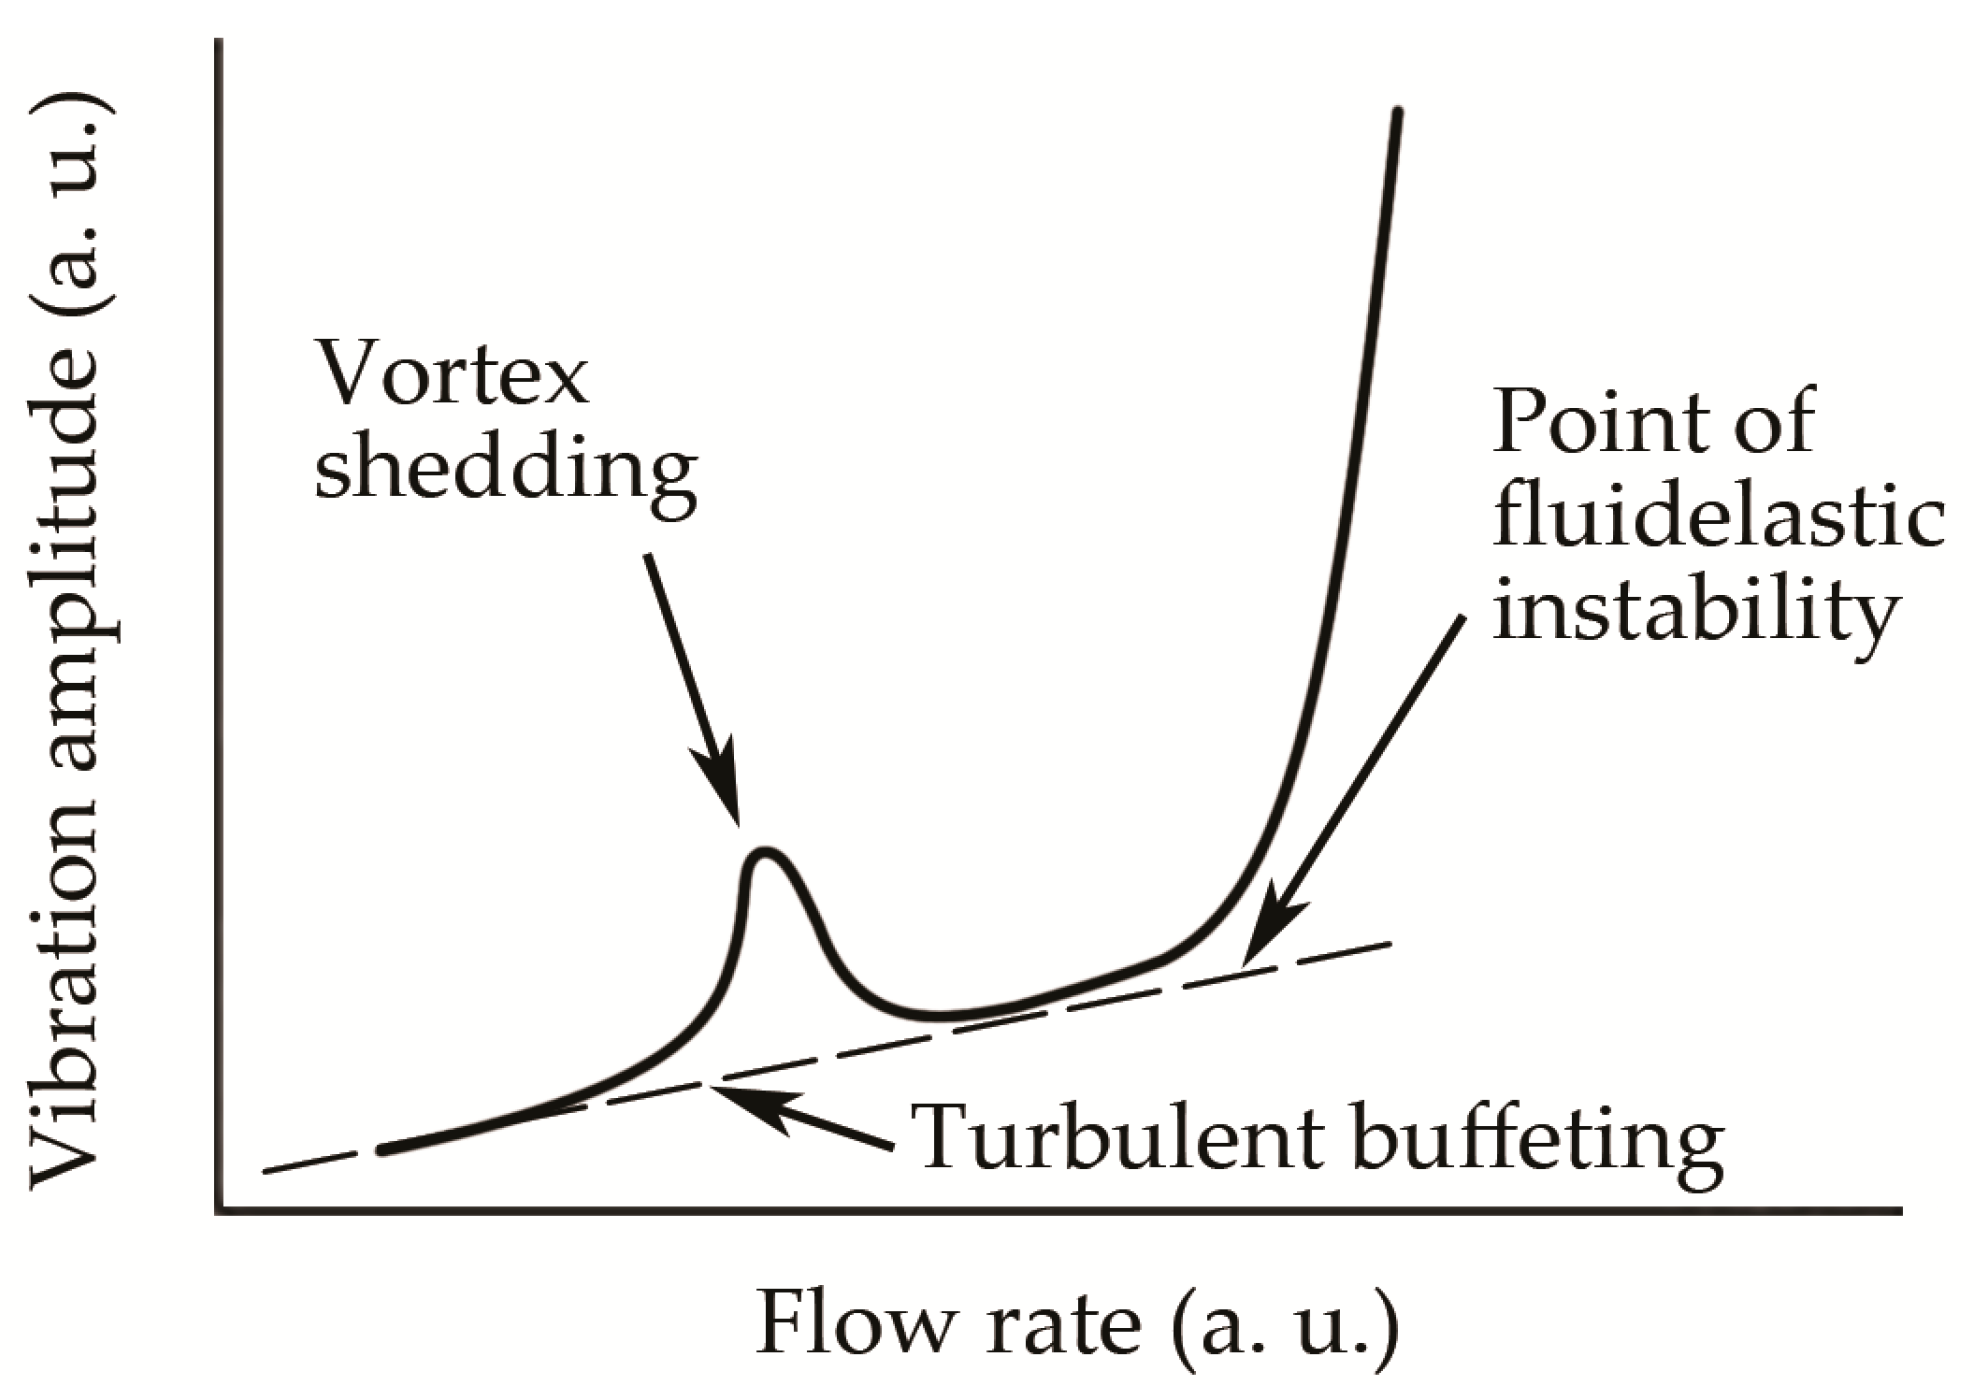
Figure 4.
Mechanism of crossflow vibration amplitude.
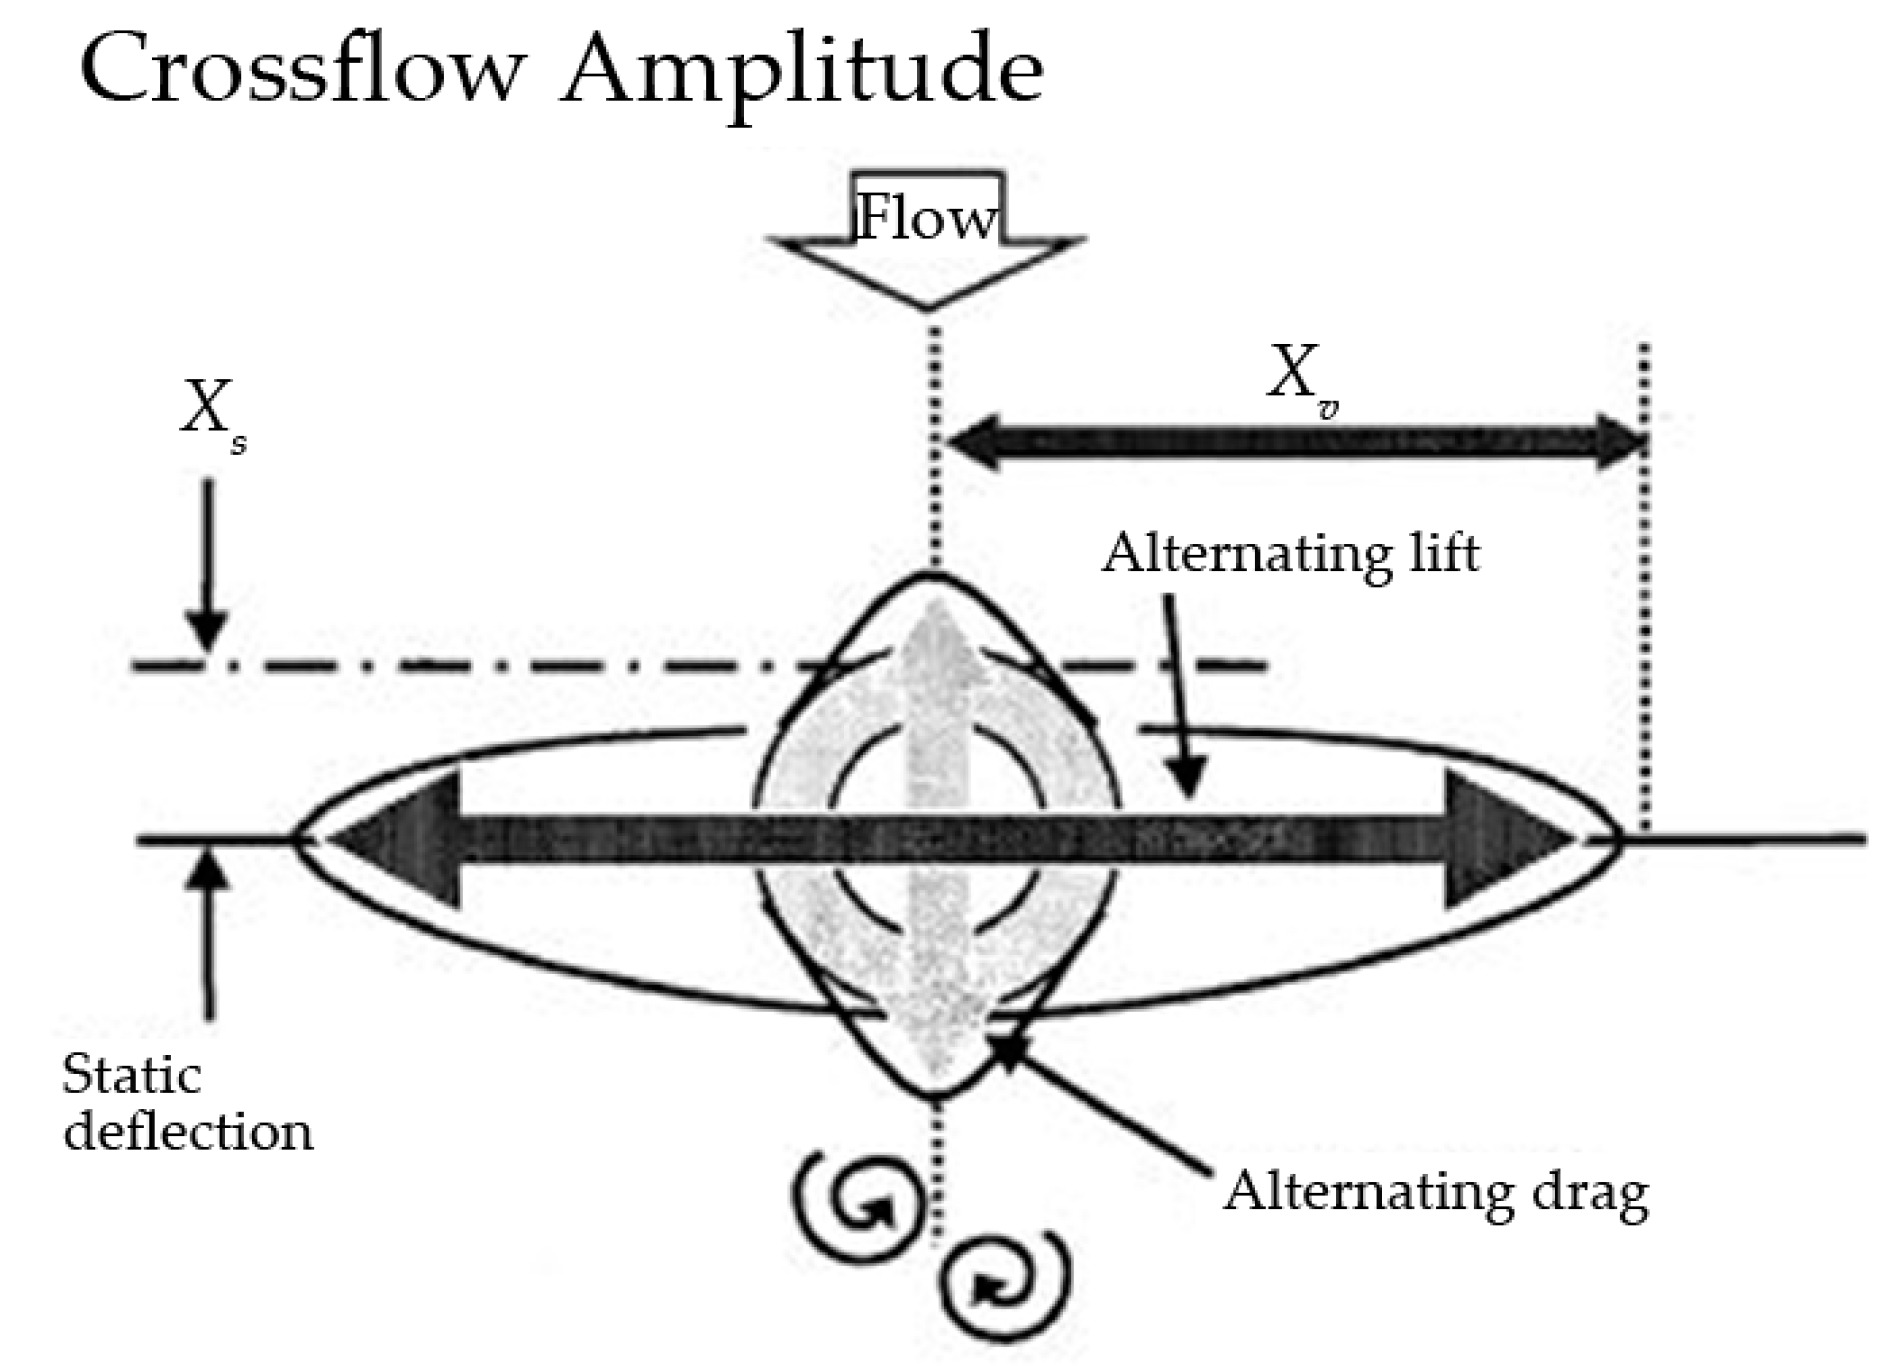
Figure 5.
Magnification factor, CMF.
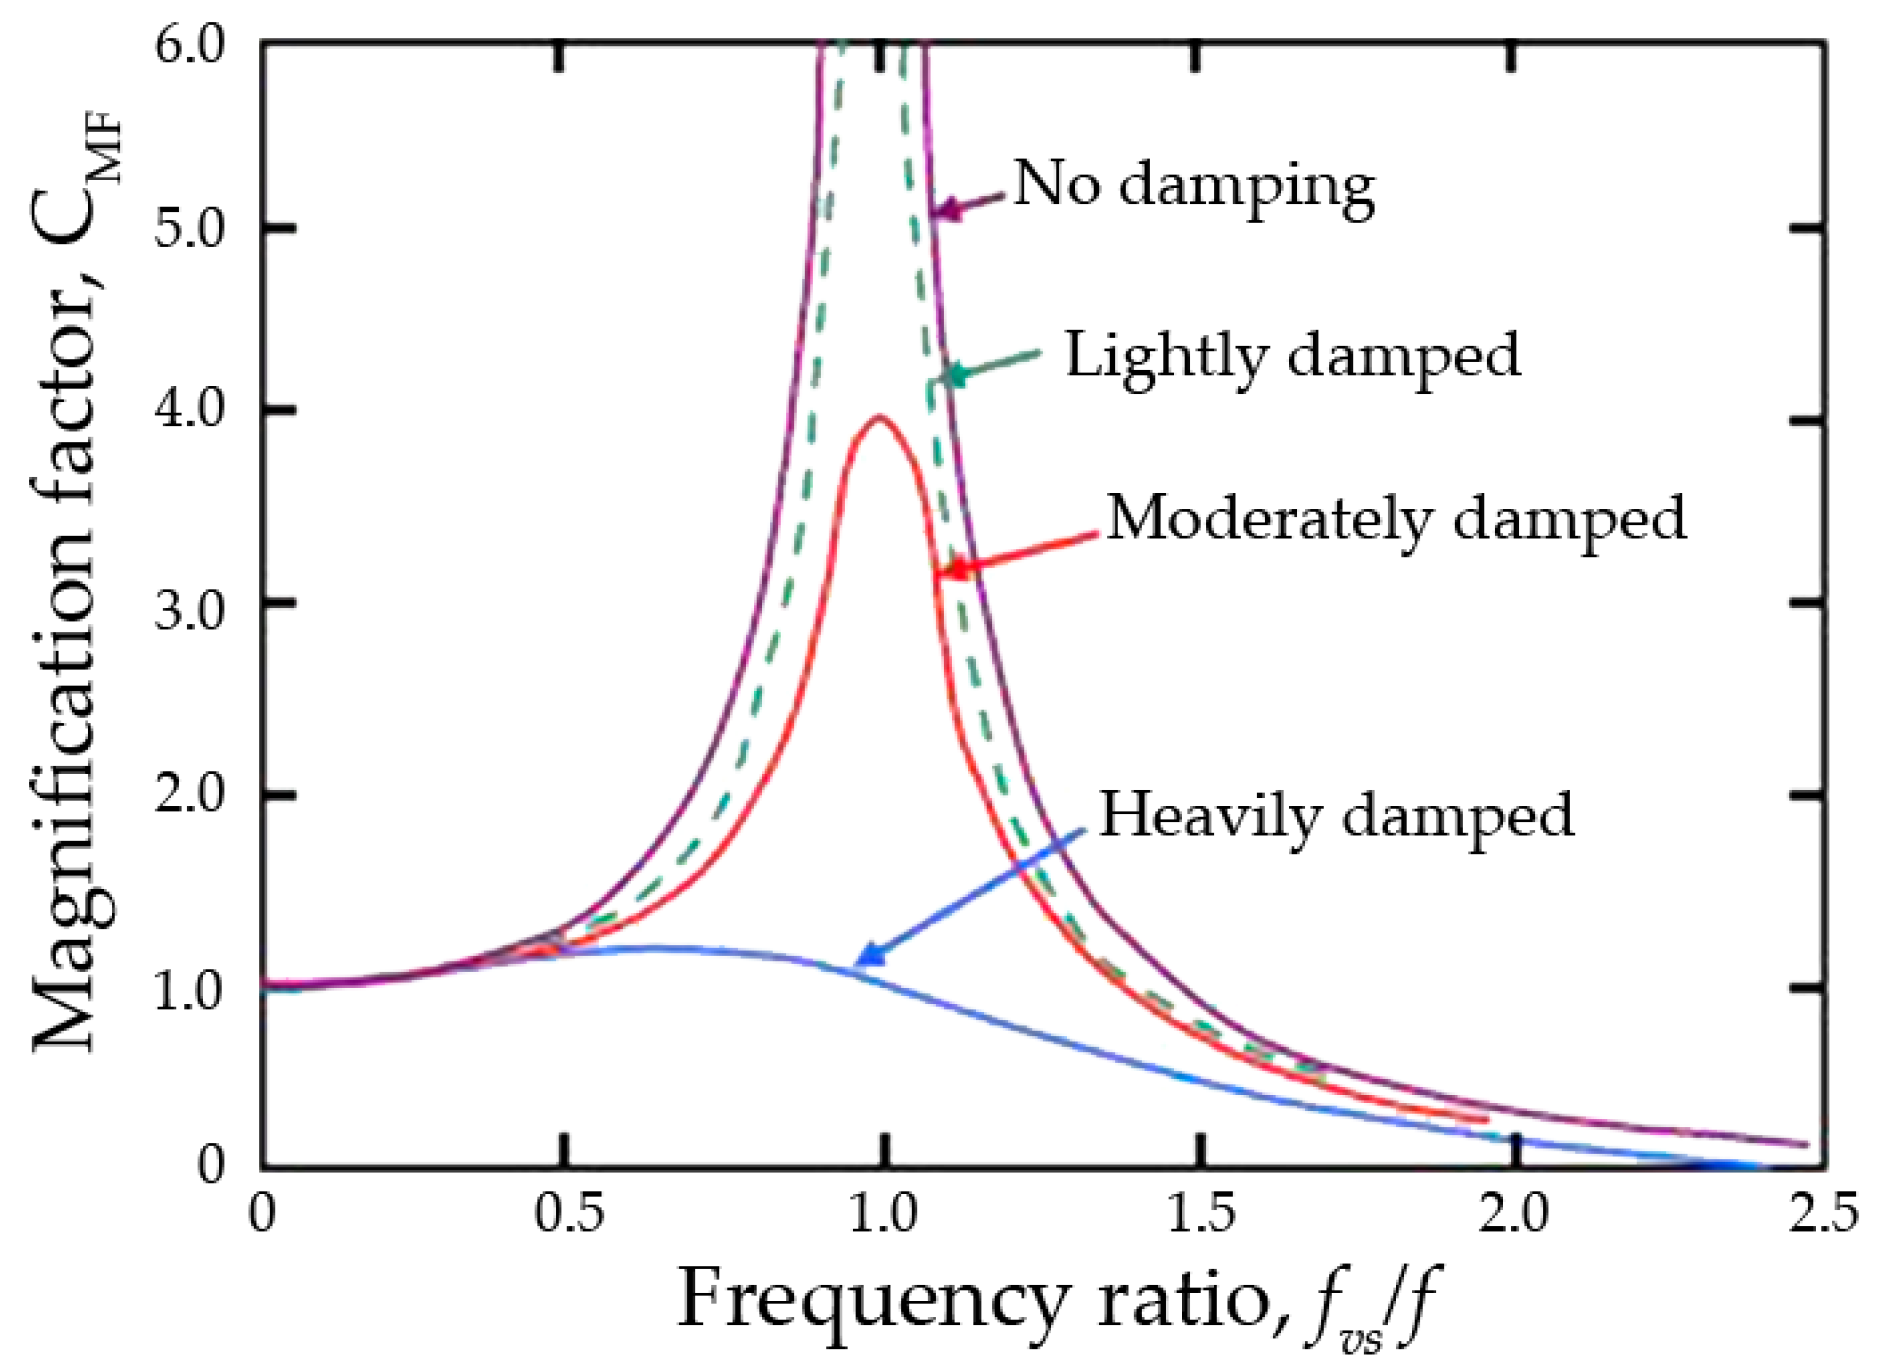
Figure 6.
The side of the heat exchanger was open to install additional support grids to inlet vapor belt.
Figure 6.
The side of the heat exchanger was open to install additional support grids to inlet vapor belt.
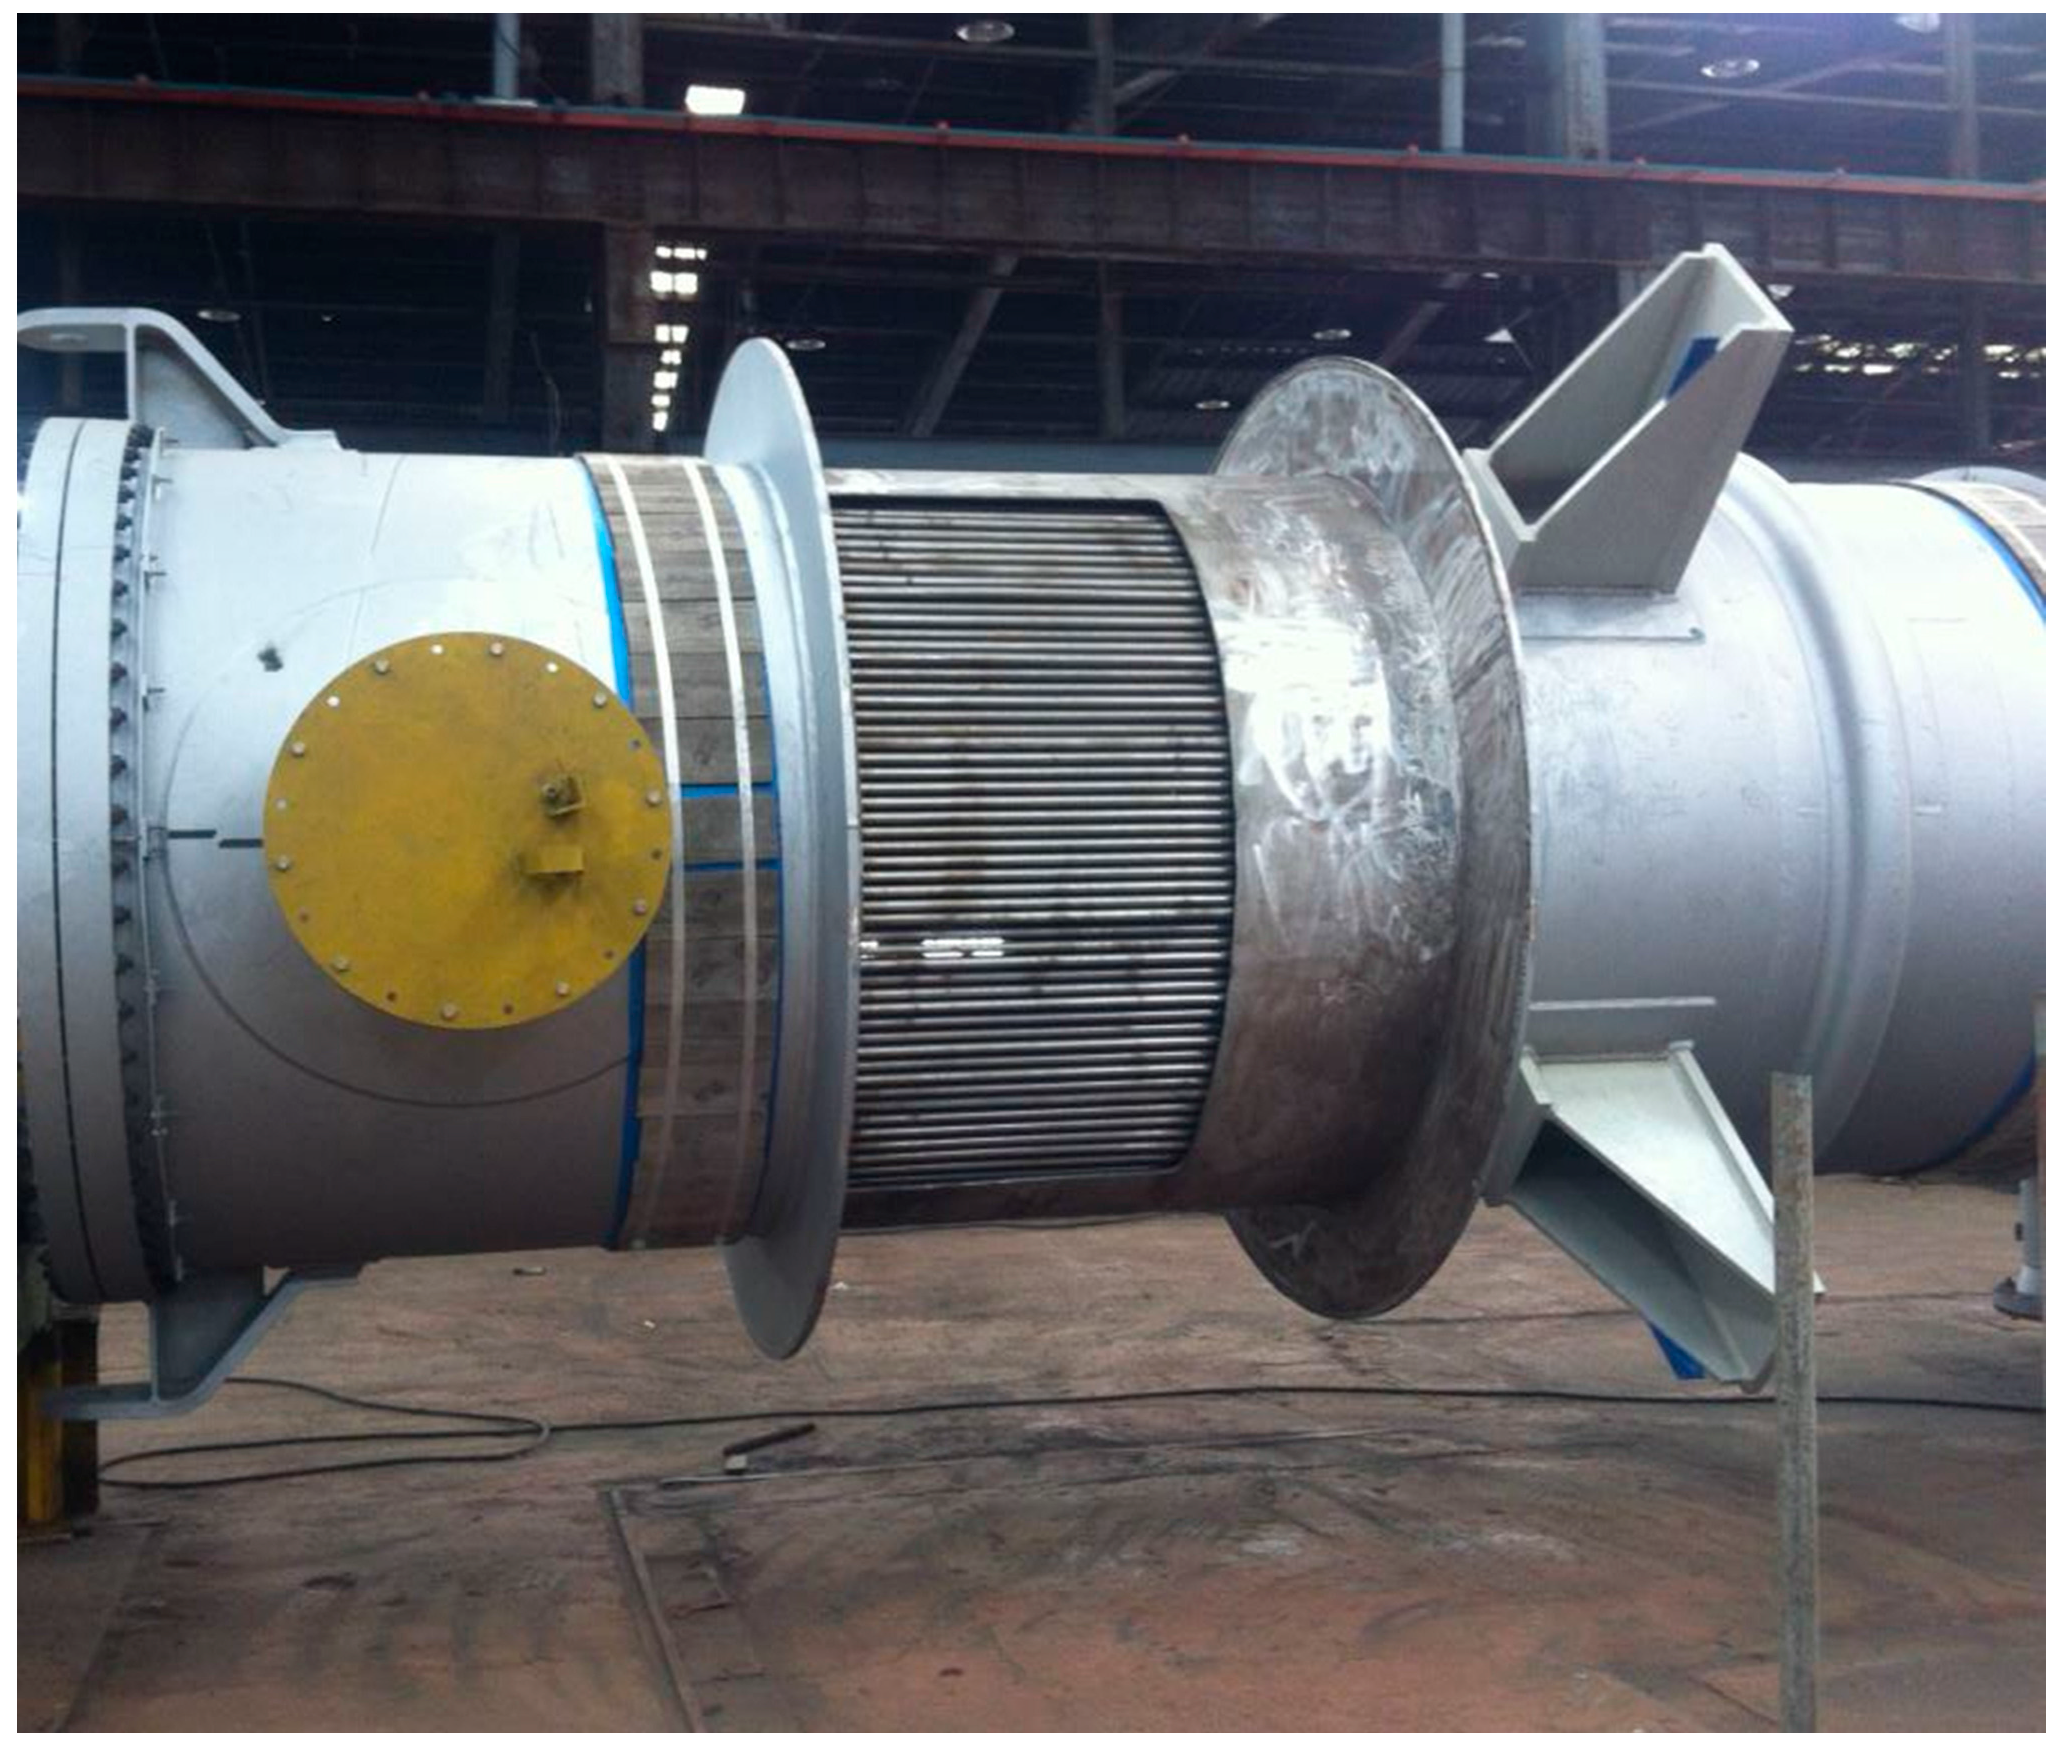
Figure 7.
Selected tube for vibration analysis at baffle tip area.
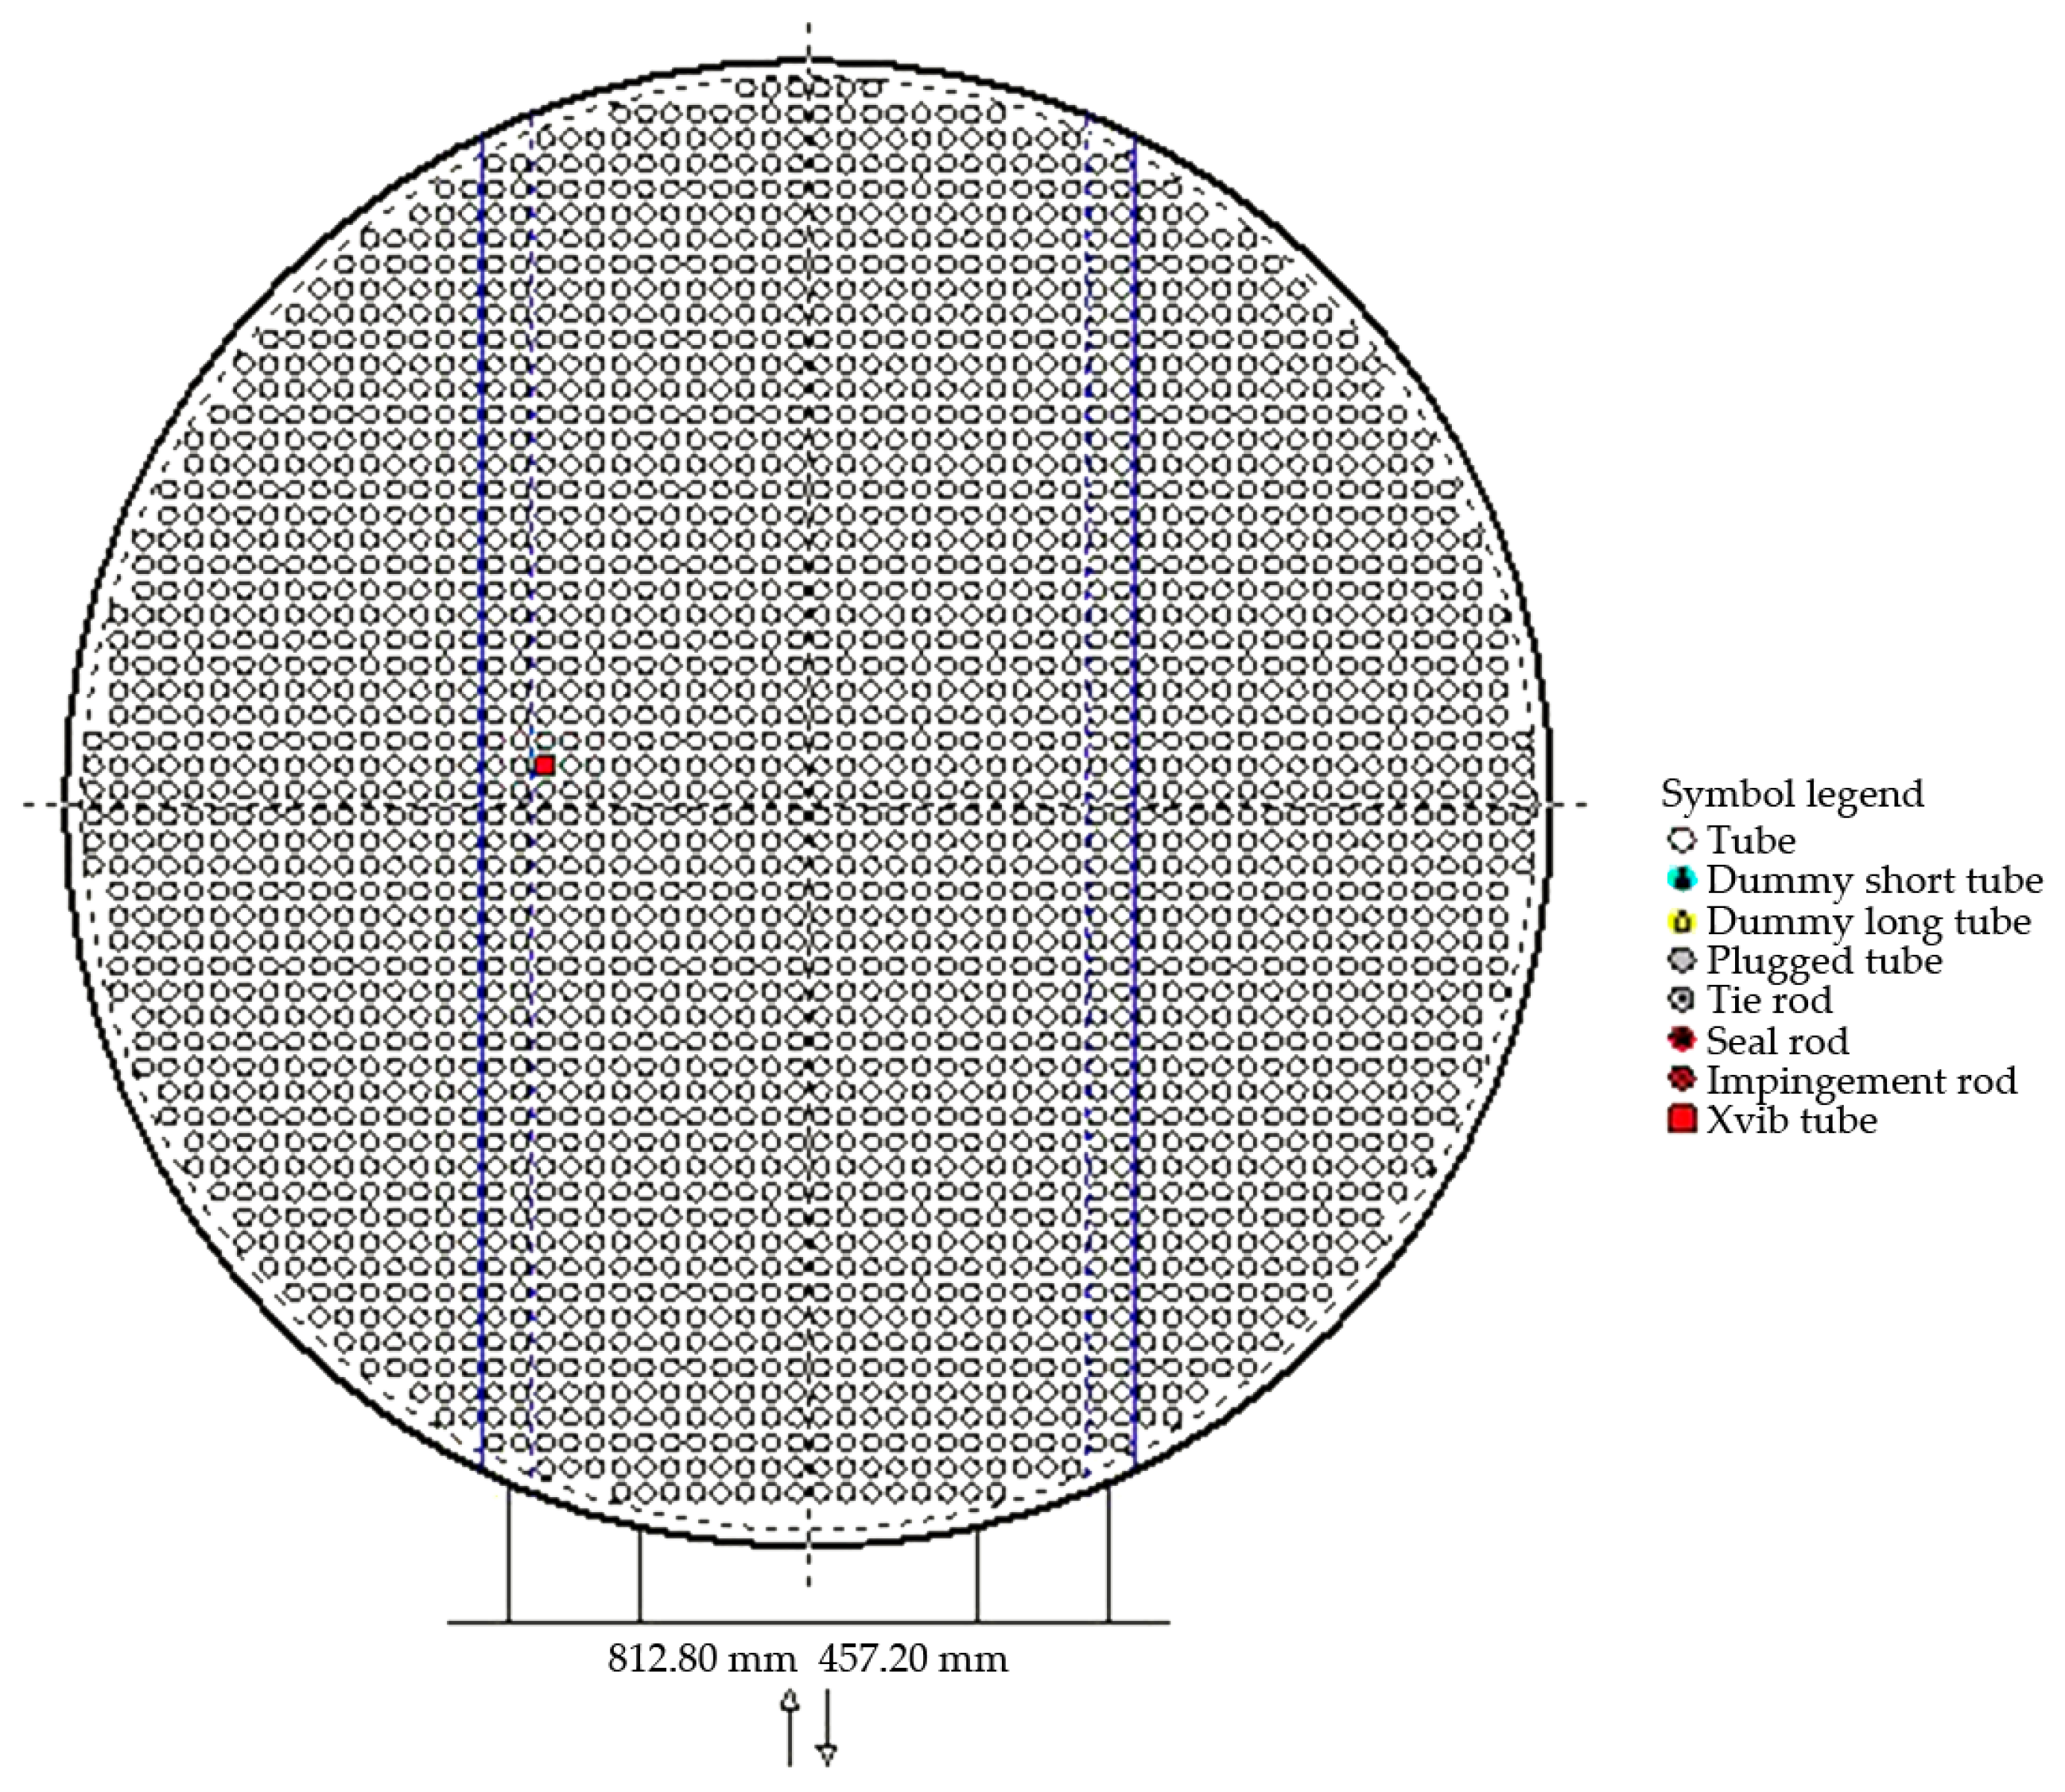
Figure 8.
Tube displacement profiles of modes 1 and 2, 44.56 Hz (worst case).
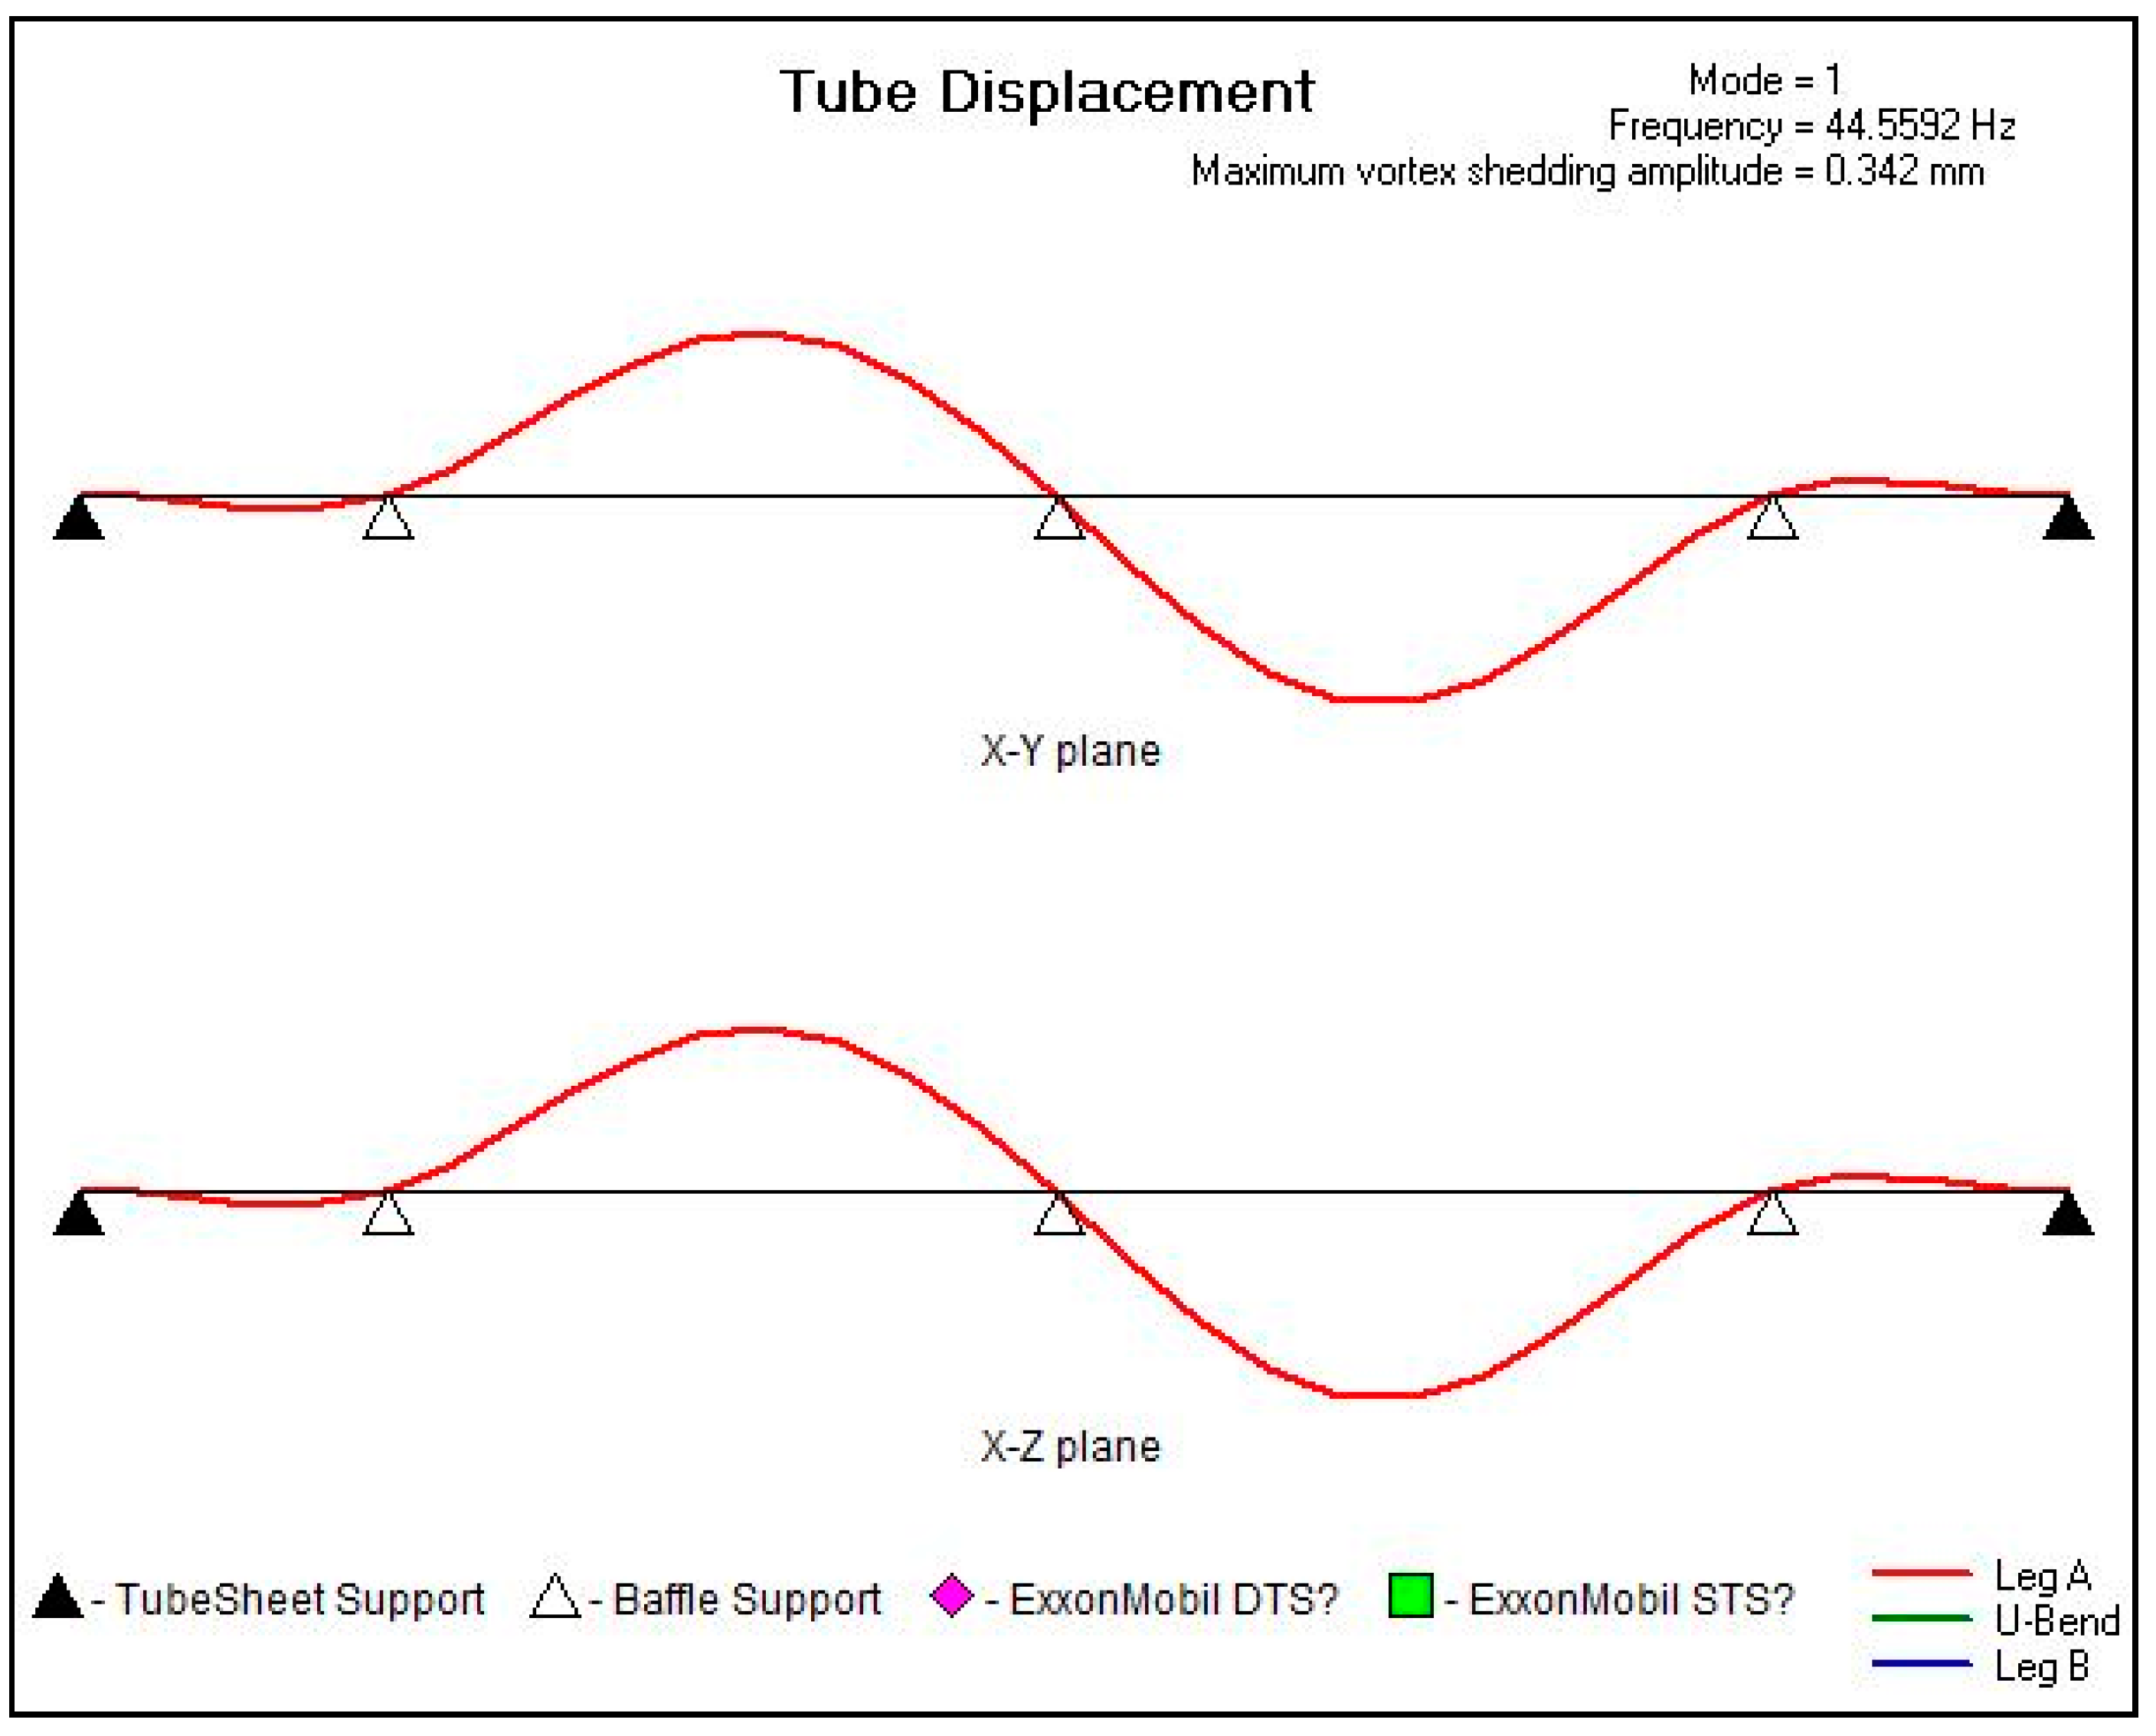
Figure 9.
Tube displacement profiles of modes 3 and 4, 65.94 Hz.
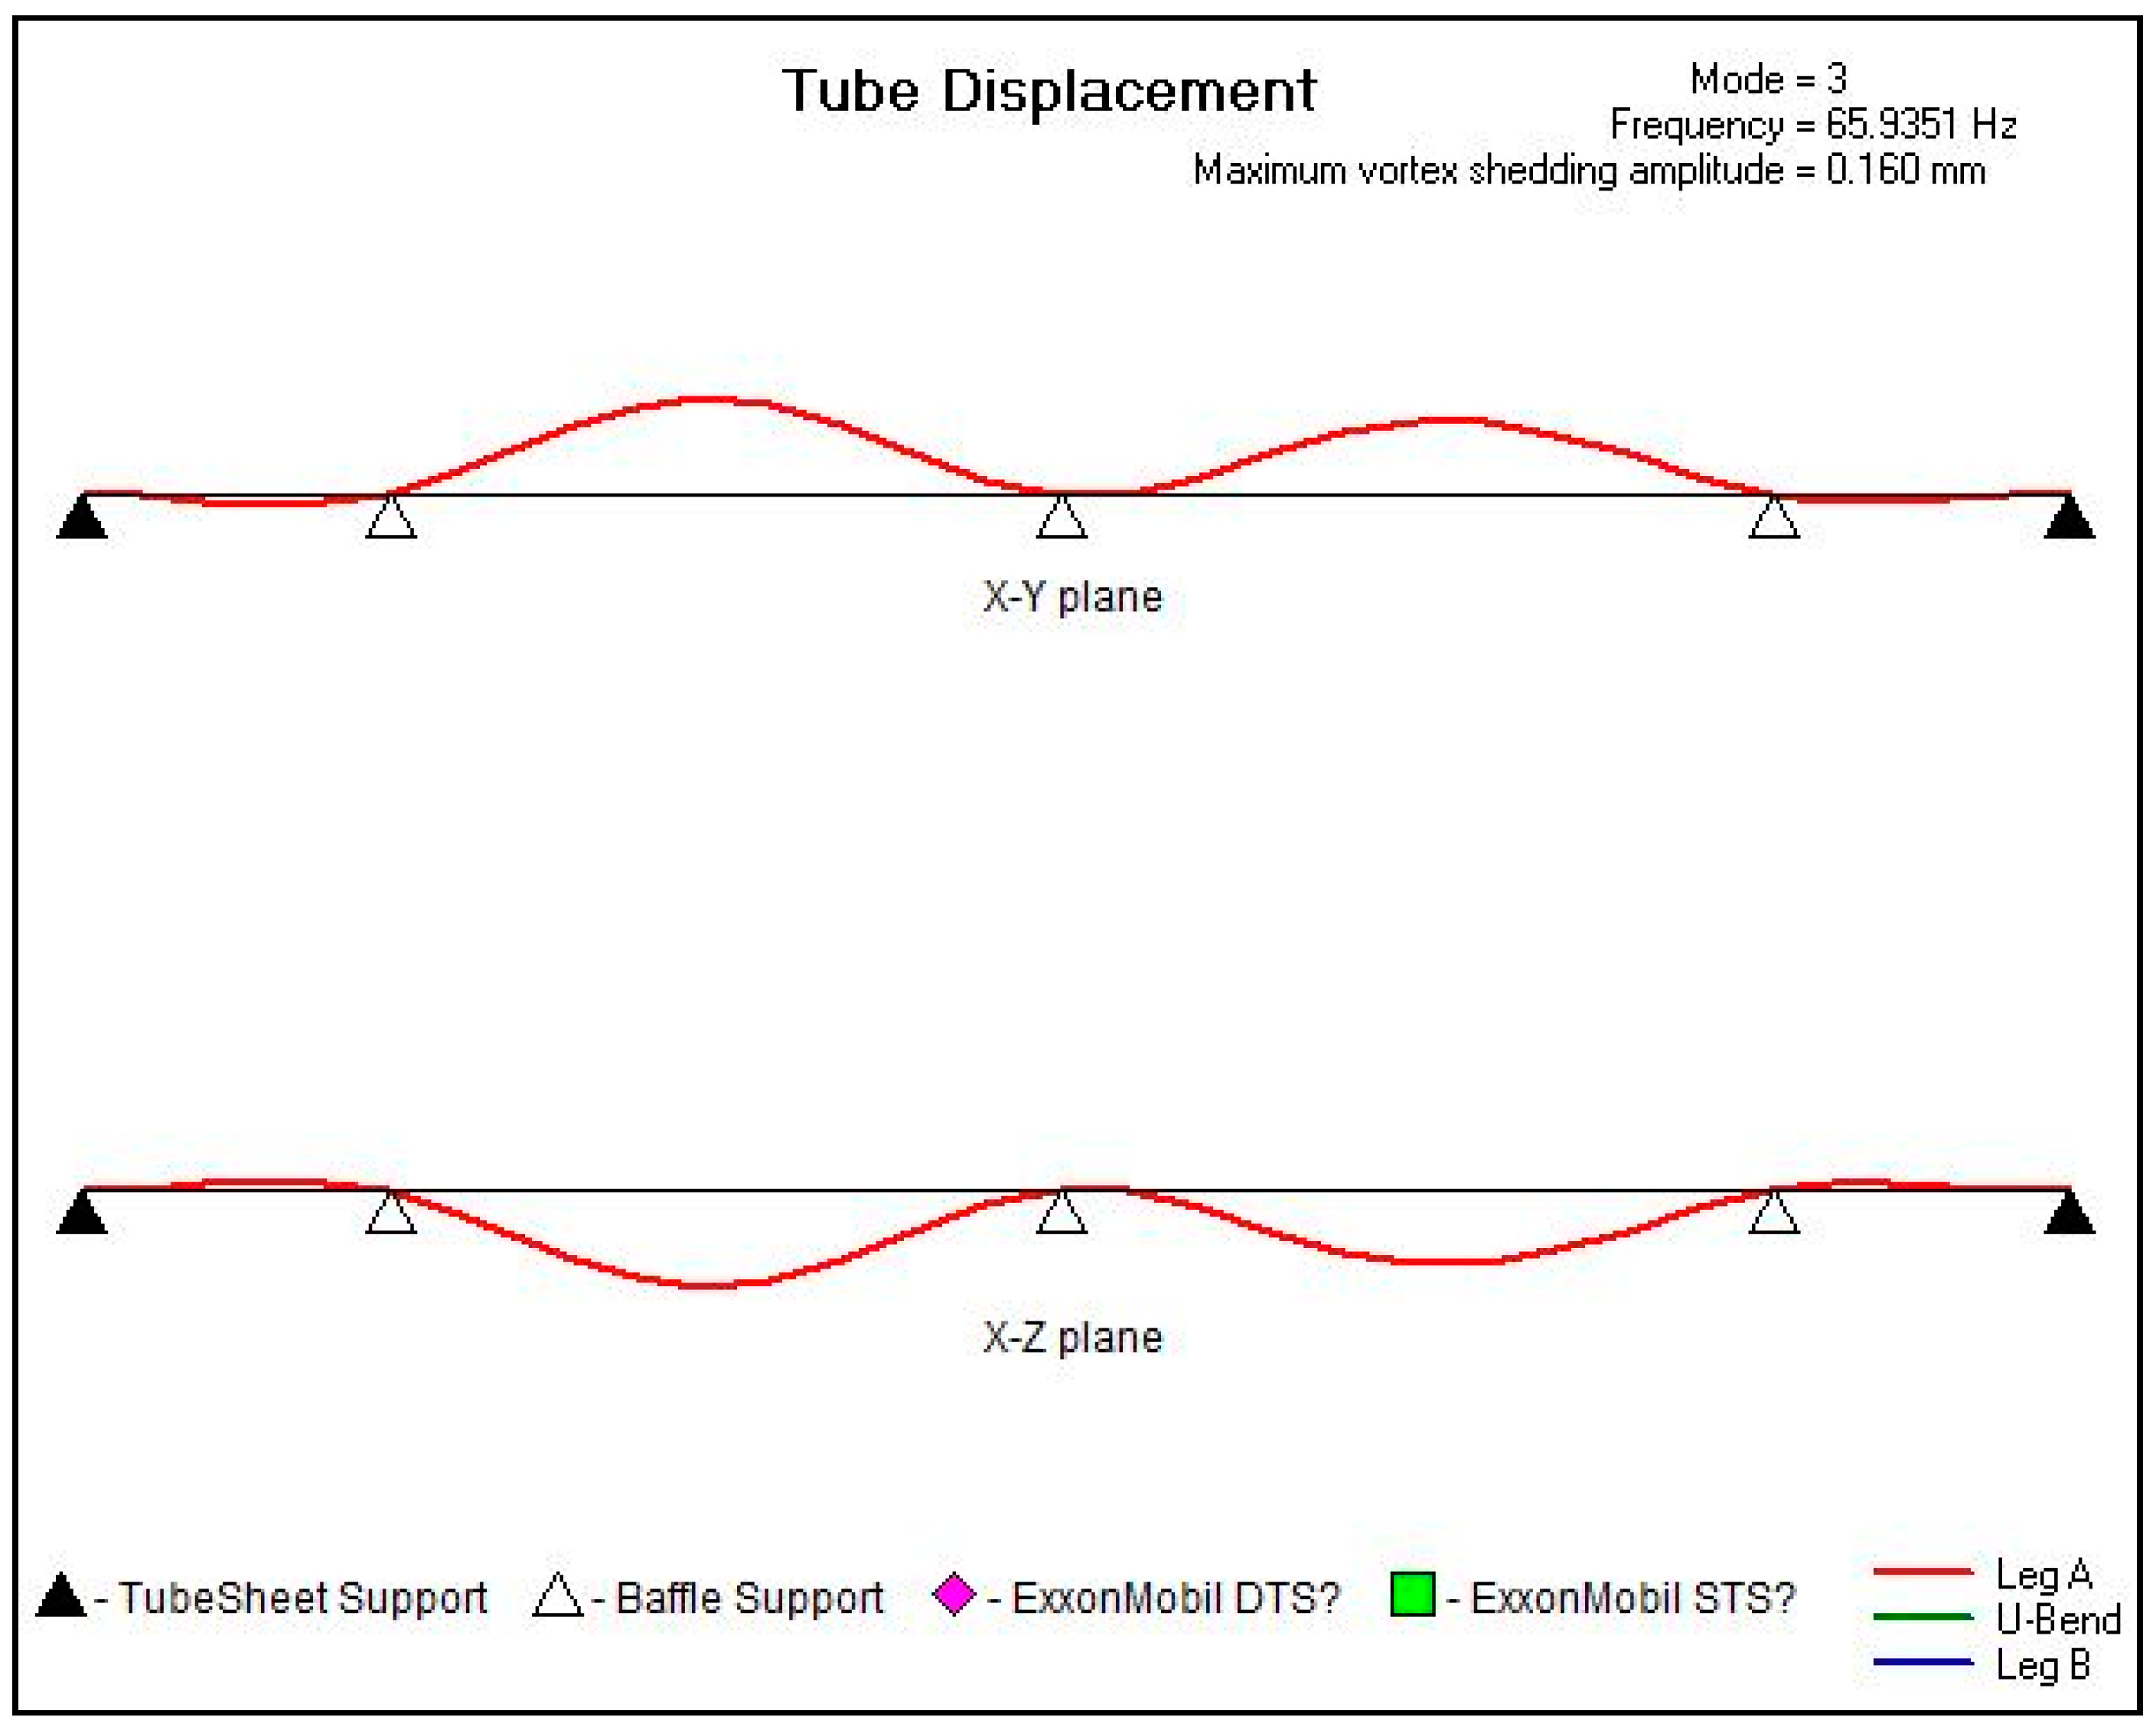
Figure 10.
Tube displacement profiles of modes 5 and 6, 146.48 Hz.

Figure 11.
Tube displacement profiles of modes 7 and 8, 184.54 Hz.
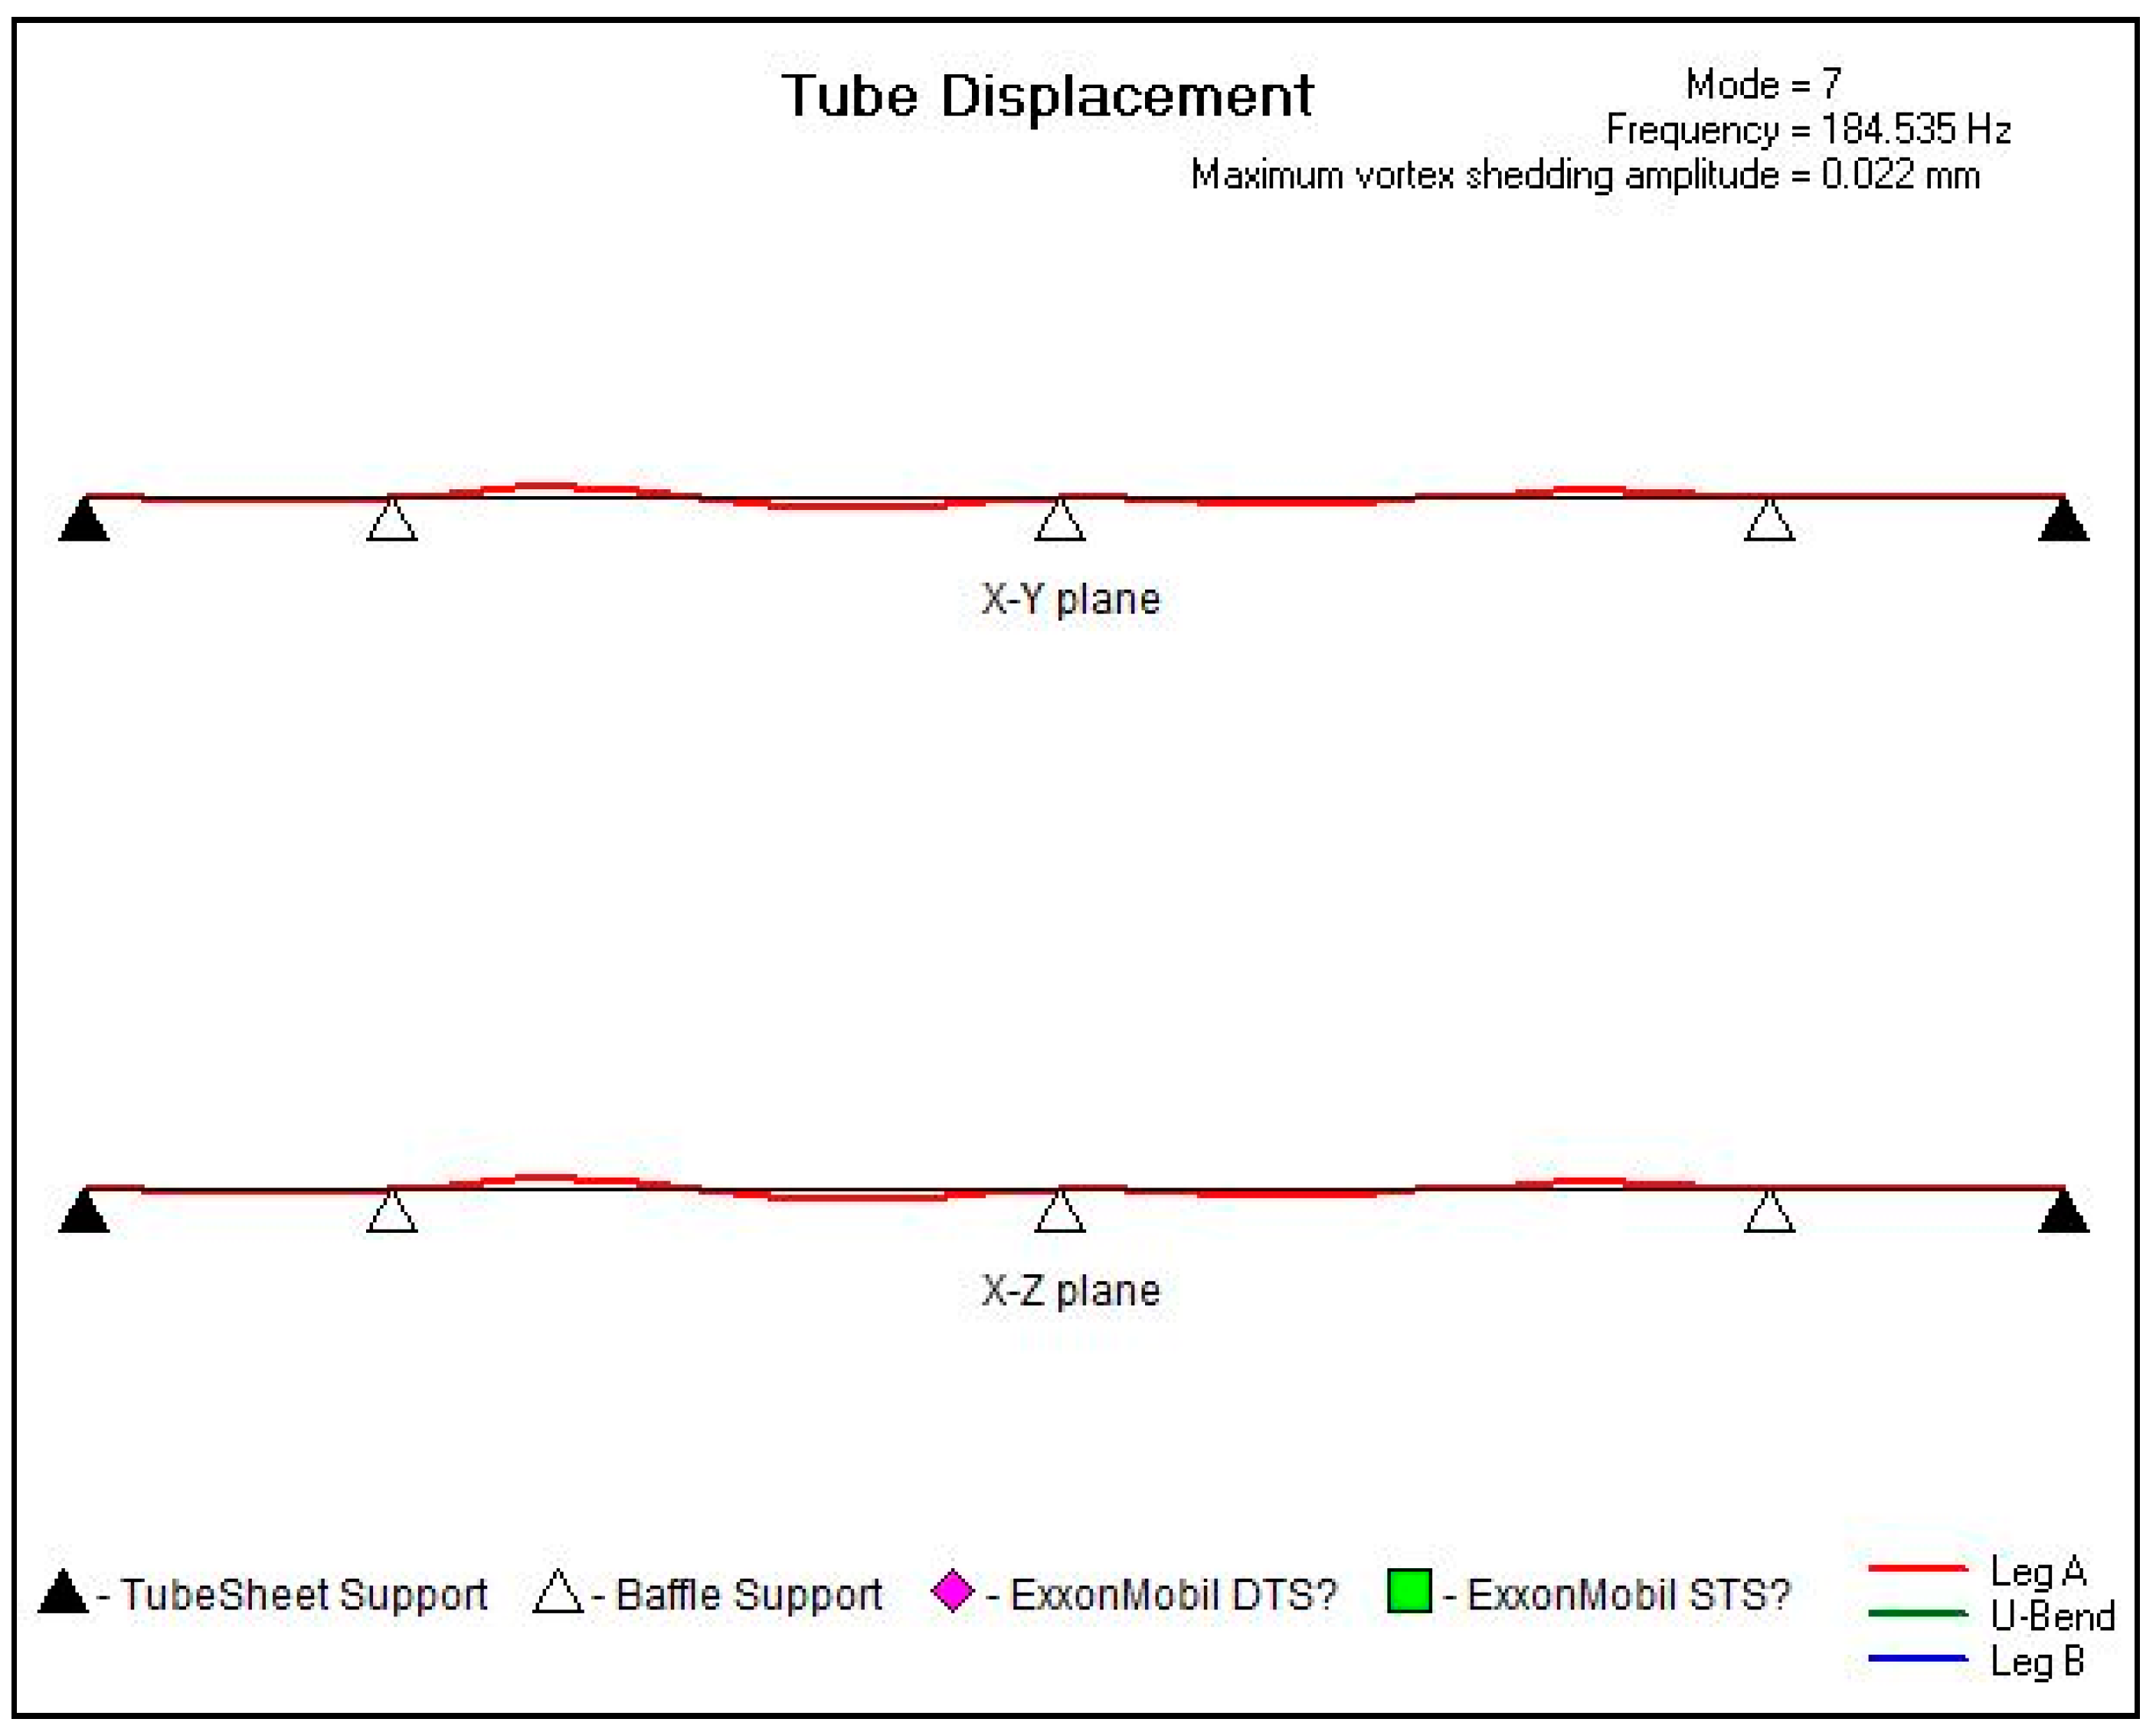
Figure 12.
Tube displacement profiles of modes 9 and 10, 289.02 Hz.

Table 1.
PrHA result of the overhead condenser tube rupture case.
| Deviation | Causes | Consequences | Safeguards | Severity | Likelihood | Risk Level |
|---|---|---|---|---|---|---|
| Tube rupture | Tube leaks in overhead condenser of crude phenol column | Cumene/water leaks into crude phenol column overhead system. Potential cumene carryover to column side-cut. Potential off-spec phenol product | 1. Crude phenol column overhead cumene separation; 2. Phenol rectifier overhead cumene separation; 3. Manual sampling on phenol product rundown tank | 2 | 1 | 1 |
Table 2.
Probability assessment.
| Likelihood | Criteria |
|---|---|
| 1 | Very unlikely; once in more than 10 years |
| 2 | Not likely; once in 5–10 years |
| 3 | May occur; once in 1–5 years |
| 4 | Likely; once in 1 year |
Table 3.
Severity assessment.
| Severity | People | Assets | Environment | Reputation |
|---|---|---|---|---|
| 1 | Slight health effect/injury | Slight damage (less than US $100,000) | Slight effect | Slight impact |
| 2 | Minor health effect/injury | Minor damage (US $100,000–$1,000,000) | Minor Effect | Limited impact |
| 3 | Major health effect/injury | Localized damage (US $1,000,000–$10,000,000) | Localized effect | Considerable impact |
| 4 | Disabilities/fatalities | Major damage (greater than US $10,000,000) | Major effect | National impact |
Table 4.
Risk assessment matrix.
| Caption | Likelihood → | ||||
|---|---|---|---|---|---|
| Risk Rank | 1 | 2 | 3 | 4 | |
| Severity ↓ | 1 | 1 | 1 | 2 | 2 |
| 2 | 1 | 2 | 2 | 3 | |
| 3 | 2 | 2 | 3 | 4 | |
| 4 | 2 | 3 | 4 | 4 | |
Table 5.
Risk level.
| Risk Level | Description |
|---|---|
| 1 | Acceptable as is—No action is necessary (low risk) |
| 2 | Acceptable with controls—Verify that procedures, controls and safeguards are in place (medium risk) |
| 3 | Undesirable—Should be mitigated to risk rank 2 or lower within reasonable period (high risk) |
| 4 | Unacceptable—Should be mitigated to risk rank 2 or lower as soon as possible (highest risk) |
Table 6.
PSV relieving cases of crude phenol column.
| Relief Conditions | Units | General Tempered Water Failure | Reflux Stops | Pressure CV Fails Closed | Reboiler Tube Rupture | |
|---|---|---|---|---|---|---|
| Max accumulated pressure | % | 110 | 110 | 110 | 110 | |
| Accumulated pressure | kg/cm2 [a] | 4.88 | 4.88 | 4.88 | 4.88 | |
| Max allowable inlet line loss | kg/cm2 | 0.105 | 0.105 | 0.105 | 0.105 | |
| Pressure safety valve inlet condition | Inlet relieving pressure | kg/cm2 [a] | 4.88 | 4.88 | 4.88 | 4.88 |
| Inlet temperature | °C | 249 | 254 | 254 | 259 | |
| Vapor mass rate | kg/h | 52 | 48 | 56.6 | 22406 | |
| Molecular weight | - | 30.3 | 30.3 | 30.3 | 93.9 | |
| Compressibility factor | - | 0.938 | 0.938 | 0.938 | 0.938 | |
| K = Cp/Cv | - | 1.05 | 1.05 | 1.05 | 1.05 | |
| Liquid volume rate | m3/h | - | - | - | - | |
| Sp Gr (water = 1.000) | - | - | - | - | - | |
| Liquid viscosity | cP | - | - | - | - | |
| Relief header condition | Temperature | °C | - | - | - | - |
| Vapor mass rate | kg/h | - | - | - | - | |
| Molecular weight | - | - | - | - | - | |
| Liquid volume rate | m3/h | - | - | - | - | |
| Sp Gr (water = 1.000) | - | - | - | - | - | |
| Kd, coefficient of discharge | - | 0.975 | 0.975 | 0.975 | 0.975 | |
| Kb, BP correction factor (vap) | - | 0.680 | 0.680 | 0.680 | 0.680 | |
| Kw, BP correction factor (liq) | - | - | - | - | - | |
| Kv, viscosity correction factor (liq) | - | - | - | - | - | |
| KSH, steam superheat correction factor | - | - | - | - | - | |
| Required relief orifice area | cm2 | 0.27 | 0.25 | 0.25 | 66.67 | |
[a]: Absolute pressure unit.
Table 7.
Operating condition of overhead condenser.
| Process Condition | Shell Side (Hot); (Phenol, Heavy Residues) | Tube Side (Cold); (Cumene, Water) | |||
|---|---|---|---|---|---|
| In | Out | In | Out | ||
| Operating temperature (°C) | 127.8 | 113.6 | 94.6 | 98.1 | |
| Operating gauge pressure (kg/cm2) | −0.851 | −0.874 | 0.333 | 0.115 | |
| Flow Rate (kg/h) | Vapor | 51,955 | 688 | 0 | 23,730 |
| Liquid | 5241 | 56,508 | 121,082 | 97,352 | |
| Density (kg/m3) | Vapor | 0.495 | 0.340 | - | 1.624 |
| Liquid | 987.5 | 1004.0 | 893.9 | 887.7 | |
Table 8.
Description of the pressure safety valve (PSV) change list.
| PSV Change List | Description |
|---|---|
| PSV size | To cover the excessive relieving load of overhead condenser tube rupture case, PSV size should be increased from 6Q8 to 8T10. |
| PSV cost | Two sets of new PSVs (8T10) are USD $7 985 (informed by PSV vendor) |
| PSV delivery time | New PSV delivery time to the site is 9–10 weeks (informed by PSV vendor) |
| PSV inlet/outlet pipe size | Main overhead pipe line size to be increased from 36 inch to 40 inch (SUS 304L) PSV inlet line size to be increased from 8 inch to 12 inch (SUS 304L) PSV outlet line size to be increased from 12 inch to 16 inch (SUS 304L) |
| Flare header size/flare stack capacity | Current flare header size (26 inch) and flare stack capacity (218.6 ton/h) will not be changed because tube rupture case is a single relieving case. |
| PSV inlet/outlet pipe arrangement | Thermal stress, pipe supports, and pipe arrangement of PSV inlet and outlet pipe should be designed again because the PSV inlet and outlet pipe size are increased. It is too difficult to specify the schedule delay impact to engineering, procurement, and construction due to above piping modification. |
Table 9.
Description of mechanical repair list.
| Mechanical Repair List | Description |
|---|---|
| Tube vibration analysis | Most of tube rupture cases are caused by tube vibration. To prevent tube vibration, the specific vibration analysis should be performed using Heat Transfer Research Inc. (HTRI) programs (Xist and Xvib) |
| Mechanical repair cost | If overhead condenser has a probability of tube vibration, an additional support grid should be provided to the longest tube spans. This repair cost is estimated to be USD $3250 (informed by a vendor) |
| Mechanical repair time | It will take about one week to finish providing the additional support grid (informed by a vendor) |
| Pipe modification works | For mechanical repair works, there are no related pipe modification works. |
Table 10.
High cross-flow velocity ratio in inlet and center section.
| Fluidelastic Instability Check | Condenser Inlet | Condenser Center | Condenser Bundle Exit |
|---|---|---|---|
| Critical velocity 1 (m/s) | 18.16 | 20.28 | 4.11 |
| Baffle tip cross-flow velocity ratio 2 | 1.3995 | 0.8797 | 0.2229 |
| Average cross-flow velocity ratio 3 | 1.3951 | 0.8770 | 0.2222 |
1 Critical velocity is calculated by the tube natural frequency and can predict fluidelastic instability vibration; 2 Ratio between cross-flow velocity at baffle tip and critical velocity; 3 Ratio between average cross-flow velocity and critical velocity.
Table 11.
Tube span profile from Xvib input data.
| Span No. | Span Length (mm) | Element No. | Span Support | In-Plane Velocity (m/s) | Out-Plane Velocity (m/s) | Shellside Fluid Density (kg/m3) |
|---|---|---|---|---|---|---|
| 1 | 600 | 1 | Tubesheet | 23.6 | 0.6822 | |
| 2 | 23.6 | 0.6822 | ||||
| 3 | 23.6 | 0.6822 | ||||
| 4 | 23.6 | 0.6822 | ||||
| 5 | Additional Support | 23.6 | 0.6822 | |||
| 2 | 617 | 1 | 23.6 | 0.6822 | ||
| 2 | 23.6 | 0.6822 | ||||
| 3 | 23.6 | 0.6822 | ||||
| 4 | 23.6 | 0.6822 | ||||
| 5 | None | 23.6 | 0.6822 | |||
| 3 | 700 | 1 | −26.79 | 0.8145 | ||
| 2 | −26.79 | 0.8145 | ||||
| 3 | −26.79 | 0.8145 | ||||
| 4 | −26.79 | 0.8145 | ||||
| 5 | Baffle | −26.79 | 0.8145 | |||
| 4 | 700 | 1 | 18.3 | 1.4668 | ||
| 2 | 18.3 | 1.4668 | ||||
| 3 | 18.3 | 1.4668 | ||||
| 4 | 18.3 | 1.4668 | ||||
| 5 | None | 18.3 | 1.4668 | |||
| 5 | 700 | 1 | −10.06 | 1.9449 | ||
| 2 | −10.06 | 1.9449 | ||||
| 3 | −10.06 | 1.9449 | ||||
| 4 | −10.06 | 1.9449 | ||||
| 5 | Baffle | −10.06 | 1.9449 | |||
| 6 | 580 | 1 | −1.59 | 11.9024 | ||
| 2 | −1.59 | 11.9024 | ||||
| 3 | −1.59 | 11.9024 | ||||
| 4 | −1.59 | 11.9024 | ||||
| 5 | Tubesheet | −1.59 | 11.9024 |
Table 12.
Vibration analysis results after the additional support installation.
| Mode 1 | Frequency 2 (Hz) | Ratio of Gap Velocity to Critical Gap Velocity 3 | Max. Vortex Shedding Amplitude 4 (mm) | Span Number 5 |
|---|---|---|---|---|
| 1, 2 | 44.56 | 0.7436 | 0.342 | 4 |
| 3, 4 | 65.94 | 0.4989 | 0.160 | 2 |
| 5, 6 | 146.48 | 0.2282 | 0.0310 | 5 |
| 7, 8 | 184.54 | 0.1964 | 0.0220 | 3 |
| 9, 10 | 289.02 | 0.1019 | 0.00662 | 6 |
1 Contains values from 1 to the number of modes requested; 2 Natural frequency of the tube (Hz) for each mode; 3 Maximum value of ratio between fluid gap velocity and critical velocity for each mode; 4 Maximum amplitude (tube deflection) caused by vortex shedding for each mode; 5 Tube span associated with maximum amplitude reported. Occurs due to vortex shedding for each mode.
© 2017 by the authors. Licensee MDPI, Basel, Switzerland. This article is an open access article distributed under the terms and conditions of the Creative Commons Attribution (CC BY) license (http://creativecommons.org/licenses/by/4.0/).
Share and Cite
MDPI and ACS Style
Lee, I.-B.; Park, S. Improving Tube Design of a Problematic Heat Exchanger for Enhanced Safety at Minimal Costs. Energies 2017, 10, 1236. https://doi.org/10.3390/en10081236
AMA Style
Lee I-B, Park S. Improving Tube Design of a Problematic Heat Exchanger for Enhanced Safety at Minimal Costs. Energies. 2017; 10(8):1236. https://doi.org/10.3390/en10081236
Chicago/Turabian StyleLee, In-Bok, and Seunghee Park. 2017. "Improving Tube Design of a Problematic Heat Exchanger for Enhanced Safety at Minimal Costs" Energies 10, no. 8: 1236. https://doi.org/10.3390/en10081236
Note that from the first issue of 2016, this journal uses article numbers instead of page numbers. See further details here.