Article

Optimizing the District Heating Primary Network from the Perspective of Economic-Specific Pressure Loss

1
Institute of Building Environment and Facility Engineering, School of Civil Engineering, Dalian University of Technology, Dalian 116024, China
2
Department of Energy Technology, Aalto University School of Engineering, P.O. Box 14100, FI-00076 Aalto, Finland
*
Author to whom correspondence should be addressed.
Energies 2017, 10(8), 1095; https://doi.org/10.3390/en10081095
Submission received: 20 June 2017 / Revised: 17 July 2017 / Accepted: 19 July 2017 / Published: 26 July 2017

Abstract

:
A district heating (DH) system is one of the most important components of infrastructures in cold areas. Proper DH network design should balance the initial investment and the heat distribution cost of the DH network. Currently, this design is often based on a recommended value for specific pressure loss (R = ∆P/L) in the main lines. This will result in a feasible network design, but probably not be optimal in most cases. The paper develops a novel optimization model to facilitate the design by considering the initial investment in the pipes and the heat distribution costs. The model will generate all possible network scenarios consisting of different series of diameters for each pipe in the flow direction of the network. Then, the annuity on the initial investment, the heat distribution cost, and the total annual cost will be calculated for each network scenario, taking into account the uncertainties of the material prices and the yearly operating time levels. The model is applied to a sample DH network and the results indicate that the model works quite well, clearly identifying the optimal network design and demonstrating that the heat distribution cost is more important than the initial investment in DH network design.

1. Introduction

A district heating (DH) system is one of the most important components of infrastructures in cold areas. DH energy consumption and heat demands have been increasing in many countries in recent years, even though the specific DH energy consumption rate is gradually decreasing. For example, in Finland the number of DH customers increased from 85,000 to 140,000 during the years 2000–2013, while the total length of networks increased from less than 9000 km to 14,000 km [1]. The situation is similar in China; for example, the hot water and vapor systems in DH networks have been increasing in number quite rapidly of late [2,3]. Therefore, we can anticipate that more DH networks will be designed and constructed around the world in the near future.
The dimensioning of the DH network is strongly coupled with existing hydraulic conditions [4]; but for simplicity’s sake, in DH engineering the network design is often based on a recommended value of R = ∆P/L (specific pressure loss, i.e., the pressure drop per unit length) in the main lines. For example, in China R is recommended as 30~70 Pa/m [5], whereas in Finland R should be less than 1 bar/km namely 100 Pa/m. These recommendations will result in feasible network designs, but probably not the optimal design in most cases, since DH installations and DH demands and requirements may differ in different areas. Therefore, it is necessary to optimize the network design based on many factors to ensure its capacity and efficiency. In general, there is usually a trade-off when selecting the diameters of the DH pipes and the capacities of the circulating pumps. Frederiksen and Werner [6] reported that there is a total cost minimum to keep in mind when considering the pipe investment cost and pumping power cost. In addition, the impact of heat losses in the main lines (primary network) accounts for approximately 2% to 5% of the total distributed heat if the insulation is in good condition [7,8,9], but in the secondary network they can account for 12% to 37% of the distributed heat [10,11]. Therefore, heat losses should be considered when calculating the energy consumption of a DH network [12] as well as the network optimization.
Several previous studies have addressed the issue of DH network design and optimization. Mertz et al. [13] optimized the structure of a simple DH network using the general algebraic modeling system (GAMS) in combination with mixed integer non-linear programming (MINLP). The objective was to minimize the total sum of the operating costs and investment costs. Morvaj et al. [14] investigated the optimal design and operation of distributed energy systems as well as optimal heating network layouts with respect to different economic and environmental objectives. A mixed integer linear programming (MILP) model was used to minimize the total costs and carbon emissions. Haikarainen et al. [15] also adopted the MILP method to optimize the total investment costs related to the construction of a network and the operating costs at the heating plant. Hassine and Eicker [16] described a German DH network based on graph theory and used the Newton algorithm to solve the system of nonlinear equations. The same optimization method was adopted by Wang et al. [17]. In addition, Zeng et al. [18] used a genetic algorithm (GA) to compare the differences between a centralized conventional circulating pump and distributed variable-speed pumps in a district heating and cooling system. The objective was again to minimize the annualized total costs. The results indicated that the pipe diameters in the two cases were nearly the same as in a case study done in Changsha, China.
In addition to linear programming, GA, and Newton algorithms, several application-oriented methods have also been developed for different kinds of DH networks. Tol and Svendsen [19] tried to improve the dimensioning of piping networks and network layouts in low-energy DH systems connected to low-energy buildings in Roskilde, Denmark. Pirouti et al. [20] carried out an analysis of the energy consumption and economic performance for a DH network. They found that the supply and return temperatures and operating strategies influenced the annual energy consumption and the equivalent annual cost. The design case with the minimum annual total energy consumption and equivalent annual cost had different pipe diameters and pump sizes under different operating strategies and temperature regimes. Koiv et al. [21] proposed a new dimensioning method for a DH network with a tree-shaped network. The method is based on a probabilistic determination of the flow rate for hot water heating. They calculated the heat losses and the heat distribution costs. After assessing ten consumers, they discovered that the dimensioning method can decrease the power of boilers by 45%, the cost of the DH network by 12%, and the pumping cost by 35%. Ancona et al. [22] introduced a technical-economical optimization procedure for DH network design in order to minimize the pumping energy consumption and thermal energy losses as well as to maximize the annual revenue. Likewise, Jie et al. [23] optimized a tree-shaped DH network in Hebei Province, China, by taking into account the heat demands at five different outdoor temperatures and with different operating strategies. The objective was to minimize the sum of the annualized costs, including the heat distribution cost relating to pumping and heat losses as well as the pipe investment cost.
It can be concluded from the above literature review that most of the previous studies either used a single optimization objective that combined the operating costs and investment costs using different accounting methods. However, the properties can be different for different costs, while optimization based on a single objective can lead to information losses. Therefore, this paper proposes a novel optimization method for DH network design and optimization. The design is influenced by many factors, though the initial investment in pipes (construction and material costs) and the heat distribution cost (pumping cost and heat losses) are two of the main considerations. The initial investment will have a great impact on the construction of the network, whereas the heat distribution cost constitutes the main operating cost after the construction. However, these two factors present conflicting objectives: if we use big pipes in the network, then the heat distribution cost will be lower, but the initial investment will increase dramatically, and vice versa. This means that we cannot superficially optimize the network using just single objective; instead, we should consider the optimal balance or trade-off between the pipe investment and heat distribution costs. The aim of this paper is to develop such an optimization model for a newly built DH network to optimize the design by considering the initial investment in the pipes and the heat distribution cost, including heat losses resulting from heat distribution.

2. Methods

In the DH network optimization study, we cannot provide dimensions for the network using the already known value for R because our purpose is to determine the value for a specific DH network through optimization. Therefore, this paper develops a novel optimization model in the following manner. Although this model looks straightforward, which ensures a good level of accuracy, it is actually quite challenging to solve when considering the large number of pipe segments and nodes, even in the main lines.

2.1. Calculate the Mass Flow Rate in Each Pipe

DH systems can be divided into low-pressure steam and hot water systems according to the heat transportation fluid [24], and we are focusing on the latter in this study. The heat load profile and the network layouts of the connected heat users (consumers) are already known before the network optimization phase, so we can begin the optimization by calculating the mass flow rate in each pipe using Equation (1), and thus determine the flow rate in the pump.
G i = Q l o a d , i c ( τ 1 τ 2 )
where G i is the mass flow rate of pipe i, kg/s; Q l o a d , i is the heat load for pipe i, W; c is the specific heat capacity of water; and τ 1 and τ 2 are the design supply and return water temperatures, °C.

2.2. Determine the Possible Combinations of Diameters for the Pipes

Step 2.2 (corresponding to Section 2.2 and the same to other steps) is somewhat troublesome because the diameters are discrete nominal diameters in DH engineering, and we will need to consider a large number of combinations if the number of the pipes is not so small. From this standpoint, the problem is similar to the combinatorial optimization problem [25], which consists of finding an optimal object from a finite set of objects. However, not all combinations will be used in the optimization phase to solve our optimization problem; instead, only the possible combinations will be selected in the next steps. The possible combinations are defined by the following rules:
  • The diameters of upstream pipes are larger or equal to the consecutive downstream pipes in the main supply line, and the order is reversed in the main return line;
  • The main supply and return lines are symmetrical.
If there are dozens of heat users, then the combination size that can be treated by computers is still reasonable, although not at a simple level. For a real-life, normal, tree-shaped DH network, it is common to have dozens of pipes in the main lines that can be more than ten kilometers long. However, in the case of too many heat users the problem size can be reduced via several aggregating methods used in a DH simulation [26,27].

2.3. Calculate the Water Flow Velocity, Pressure Loss ∆P in Each Pipe, and Specific Pressure Loss R

In this step, we will calculate these variables for each feasible combination of pipe diameters obtained in step 2.2. The water flow velocity can be calculated quite quickly if the pipe diameter and corresponding mass flow rate are known. However, one constraint is that the water flow velocity should be less than or equal to 2 m/s according to the design code for heating ventilation and air conditioning in civil buildings [28]. Specific pressure loss R (Pa/m) in each pipe can be calculated using Equation (2) [29],
R = 8 π 2 λ G i 2 ρ d i 5
where λ is the friction factor of the inner pipe surface, Gi is the mass flow rate in each pipe, kg/s; ρ is the water density, kg/m3; d is the inner diameter of pipe i, m. In general, λ is a function of Reynolds number Re and relative pipe roughness ε; where Re = ρvd/μ, μ is the dynamic viscosity coefficient of water, kg/(m∙s) and ε = K/d, K are the inner surface roughness, m. The value of λ can be obtained from the Moody diagram, but in the optimization model we propose calculating it using Equation (3) [29]:
λ = 0.11 ( K d + 68 R e ) 0.25
In addition to the frictional pressure loss, we still need to consider the local pressure loss, which is caused by other components in the network, for instance valves, joints, or compensators. In this study, the local pressure loss is assumed to be 30% of the frictional pressure loss. However, there is another constraint on the available pressure loss in each heat user, and we chose to adopt 50 kPa for the purposes of this study.

2.4. Sort the Pipe Combination Scenarios According to R

In this step, R reflects the pipe size used in the network, that is, the size used for a specific mass flow rate, with the larger R values corresponding to the smaller pipes, and vice versa. Therefore, sorting the pipe combinations based on R means dividing them by pipe diameters. Although there are too many feasible pipe combinations, we only have a relatively small number of network scenarios consisting of different series of pipe diameters for each pipe in the network. For example, we may have network scenarios with large pipes, intermediate level pipes and small pipes, and the pipes in each scenario can have different diameters according to the mass flow rate in them, but their R values will still remain within the same scale. Take one pipe as an example: it is possible to select more than three diameter levels for this pipe, with the R value varying from a little more than zero up to as much as 600 Pa/m. However, if we take into account the combination rules stated in step 2.2, then the number of possible diameter levels for this pipe is reduced, and this is happening to all pipes in the network. Overall, we will have fewer network scenarios that will need to be optimized after this step.

2.5. Calculate the Initial Investment for Each Network Scenario Using the Variable Prices of Insulated District Heating Pipes

After we obtain the pipe diameters (the thickness is known) in each network scenario, we can calculate at a general level the steel consumption in cubic meters, and then the initial investment in each network scenario can also be computed using variable prices of insulated district heating pipes, in which the construction and material costs of laying down the pipes have already been considered. Pipes of different sizes will have different construction and material costs per unit length, but we assume the construction and material costs are in proportion to the steel consumption rates based on the price levels for many pipes with different diameters in China. It is possible to use different price levels to reflect the uncertainty of district heating pipe prices in this optimization model. The initial investment is the first objective in this study.

2.6. Determine the Lift Head and Equivalent Full Operating Time of the Pump Using a Variable, Full Operating Percentage for the Year

First, we should calculate the lift head of the pump for each network scenario by adding the pressure loss in main supply and return lines, the available pressure in the heat users, the pressure drop in the heat plant, and the static pressure to avoid any evaporation in the network. Second, we want to examine the impact of the operating time; we set up three full operating percentages, that is to say, 40%, 60%, and 80%, in a given year (8760 h if not a leap year). It is possible to use other operating percentages if needed for the optimization.

2.7. Calculate the Pump Power and Electric Motor Power

The pump power and electric motor power can be calculated using Equations (4) and (5),
P a = ρ g Q H η
P e = S η m P a
where Pa is the pump shaft power, W; g is the gravity constant, g = 9.81 m/s2; Q is the volume flow, m3/s; H is the lift height of the pump, m; η is the pump efficiency (0.7–0.9); Pe is the electric motor power, W; S is the assurance coefficient larger than 1; and ηm is the efficiency of motor.

2.8. Calculate the Electricity Consumption, Pumping Cost, Heat Loss, and Heat Distribution Cost for Different Network Scenarios

The electricity consumption for heat distribution is calculated using Equation (6),
E = P e n 0 = 0.001 ρ g Q H S η η m n 0 ( kWh )
where n0 is the full power operating time of the pump, h; and 0.001 is the coefficient of W to kW. Then, the pumping cost can be obtained by taking into account the electricity price. Note that the lift height, volume flow, and efficiency may vary according to the working point of the pump, but we consider all the effects in defining different operating percentages in step 2.6 to make the optimization easier to apply.
Heat losses should be calculated separately for the supply and return pipelines [30,31]. In order to make the calculation consistent with this optimization, the method based on thermal resistance has been adopted. We assume the thermal resistance of the steel pipe is so small compared to other thermal resistances that can be neglected. However, this method considers the heat transfer between supply and return pipelines and thus an additional thermal resistance is used [31],
R a = 1 2 π λ s o i ln ( 2 H d ) 2 + 1 , H = h + λ s o i α s o i
where Ra is the additional thermal resistance, m K/W; λsoi is the coefficient of heat conductivity, W/(m K), and it is 1.5 W/(m K) in this study; H is the equivalent depth of the pipelines in meters; d is the distance of supply and return pipelines in meters, 0.2 m in this study; h is the distance from the upper part of the pipelines to the surface in meters, 1.2 m in this paper; αsoi is the heat transfer coefficient on the surface of the ground, W/(m2 K), and we adopt 13.5 W/(m2 K).
The heat loss of the unit length (one meter) for the supply pipe can be calculated by [31],
q s = ( t s t 0 ) ( R r + R s o i ) ( t r t 0 ) R a ( R s + R s o i ) ( R r + R s o i ) R a 2 ,   R r = R s = R i + R P
where ts and tr are the supply and return water temperatures, °C; t0 is the average outdoor temperature, °C; Rs and Rr are the thermal resistances of the supply and return pipes, and they are equal for the pipes with same diameters; Rsoi, Ri and RP are the thermal resistances of the soil, insulation layer and protection (mantel) layer.
Similarly, heat loss of the unit length for the return pipe is written as [31],
q r = ( t r t 0 ) ( R s + R s o i ) ( t s t 0 ) R a ( R s + R s o i ) ( R r + R s o i ) R a 2 ,   R r = R s = R i + R P
The thermal resistances of soil, insulation layer and protection layer can be written as follows [31],
R s o i = 1 2 π λ s o i ln [ H D o + ( 2 H D o ) 2 + 1 ]
R i = 1 2 π λ i ln D P , i n D i , i n
R P = 1 2 π λ P ln D o D P , i n
where Do is the outer diameter of the protection layer in meters; DP,in is the inner diameter of the protection layer in meters; Di,in is the inner diameter of the insulation layer in meters; λi and λP are the coefficients of heat conductivity for insulation materials and protection layer, W/(m K), λi is 0.027 W/(m K) and λP is 0.041 W/(m K). The thickness of insulation layer is 0.05 m. Then we can calculate the total thermal resistance for supply and return pipelines. We found that the heat loss of the unit length for the supply pipe varies dramatically with different diameters, and they are about 2~4 times as that of the return pipe with same diameters.
To conclude, the cost of the heat losses has the same unit as the pumping cost; therefore, we can calculate the heat distribution costs by adding them together. The heat distribution cost is the second objective in this optimization.

2.9. Calculate the Annuity on the Initial Investment and the Total Annual Cost

The idea here is that we assume investment I is financed by taking a loan for n years with effective interest rate r, and the loan is paid back at fixed constant annual amounts A. Then, the net present value (NPV) of a payment after i years is (1 + r)iA. To determine the annual payment, the NPV of payments are equal to the loan:
N P V = i = 1 n ( 1 + r ) i A = I A = ( 1 i = 1 n ( 1 + r ) i ) I = a I
Here, annuity factor a is obtained by computing the sum of the geometric series:
a = 1 i = 1 n ( 1 + r ) i = r [ 1 ( 1 + r ) n ]
Now, the annuity on initial investment A can be calculated using Equation (12), while the total annual cost can then be obtained by adding together the annuity on the initial investment and the heat distribution cost. Note that the interest rate can affect the annuity on the investment and thus the total annual cost. A high interest rate may result in smaller pipes if the influences are aggregated at a large enough level.

2.10. Show the Optimization Results

In the last step, we will show the optimization results and ascertain the optimal DH network design. To conclude, the general flowchart and algorithm steps of the proposed DH network optimization model is shown in Figure 1.

3. Results and Discussion

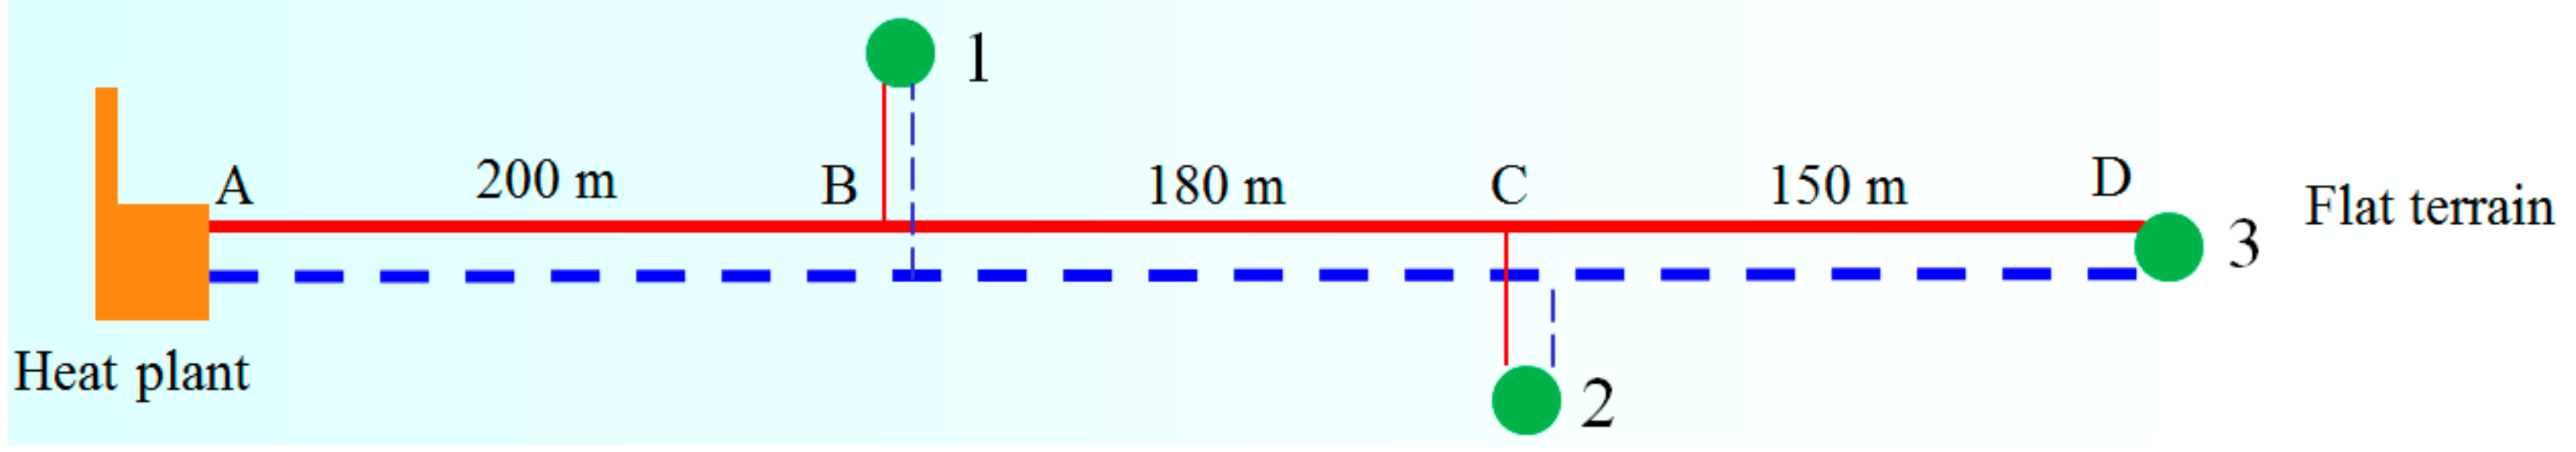
3.1. The DH Network Used in the Case Study

We demonstrate here our optimization method via a sample DH network design. The network layout is shown in Figure 2, where the length of each pipe is already known. The design’s indoor and outdoor temperatures are 18 °C and −9.8 °C; the design’s supply and return water temperatures are 130/70 °C, while the available pressure in each heat user (filled circle) is 50 kPa. The heat demands of all heat users are shown in Table 1. Our objective is to determine the diameters of the main line using the optimization method.
Other technical and economic parameters used in the optimization model are shown in Table 2.

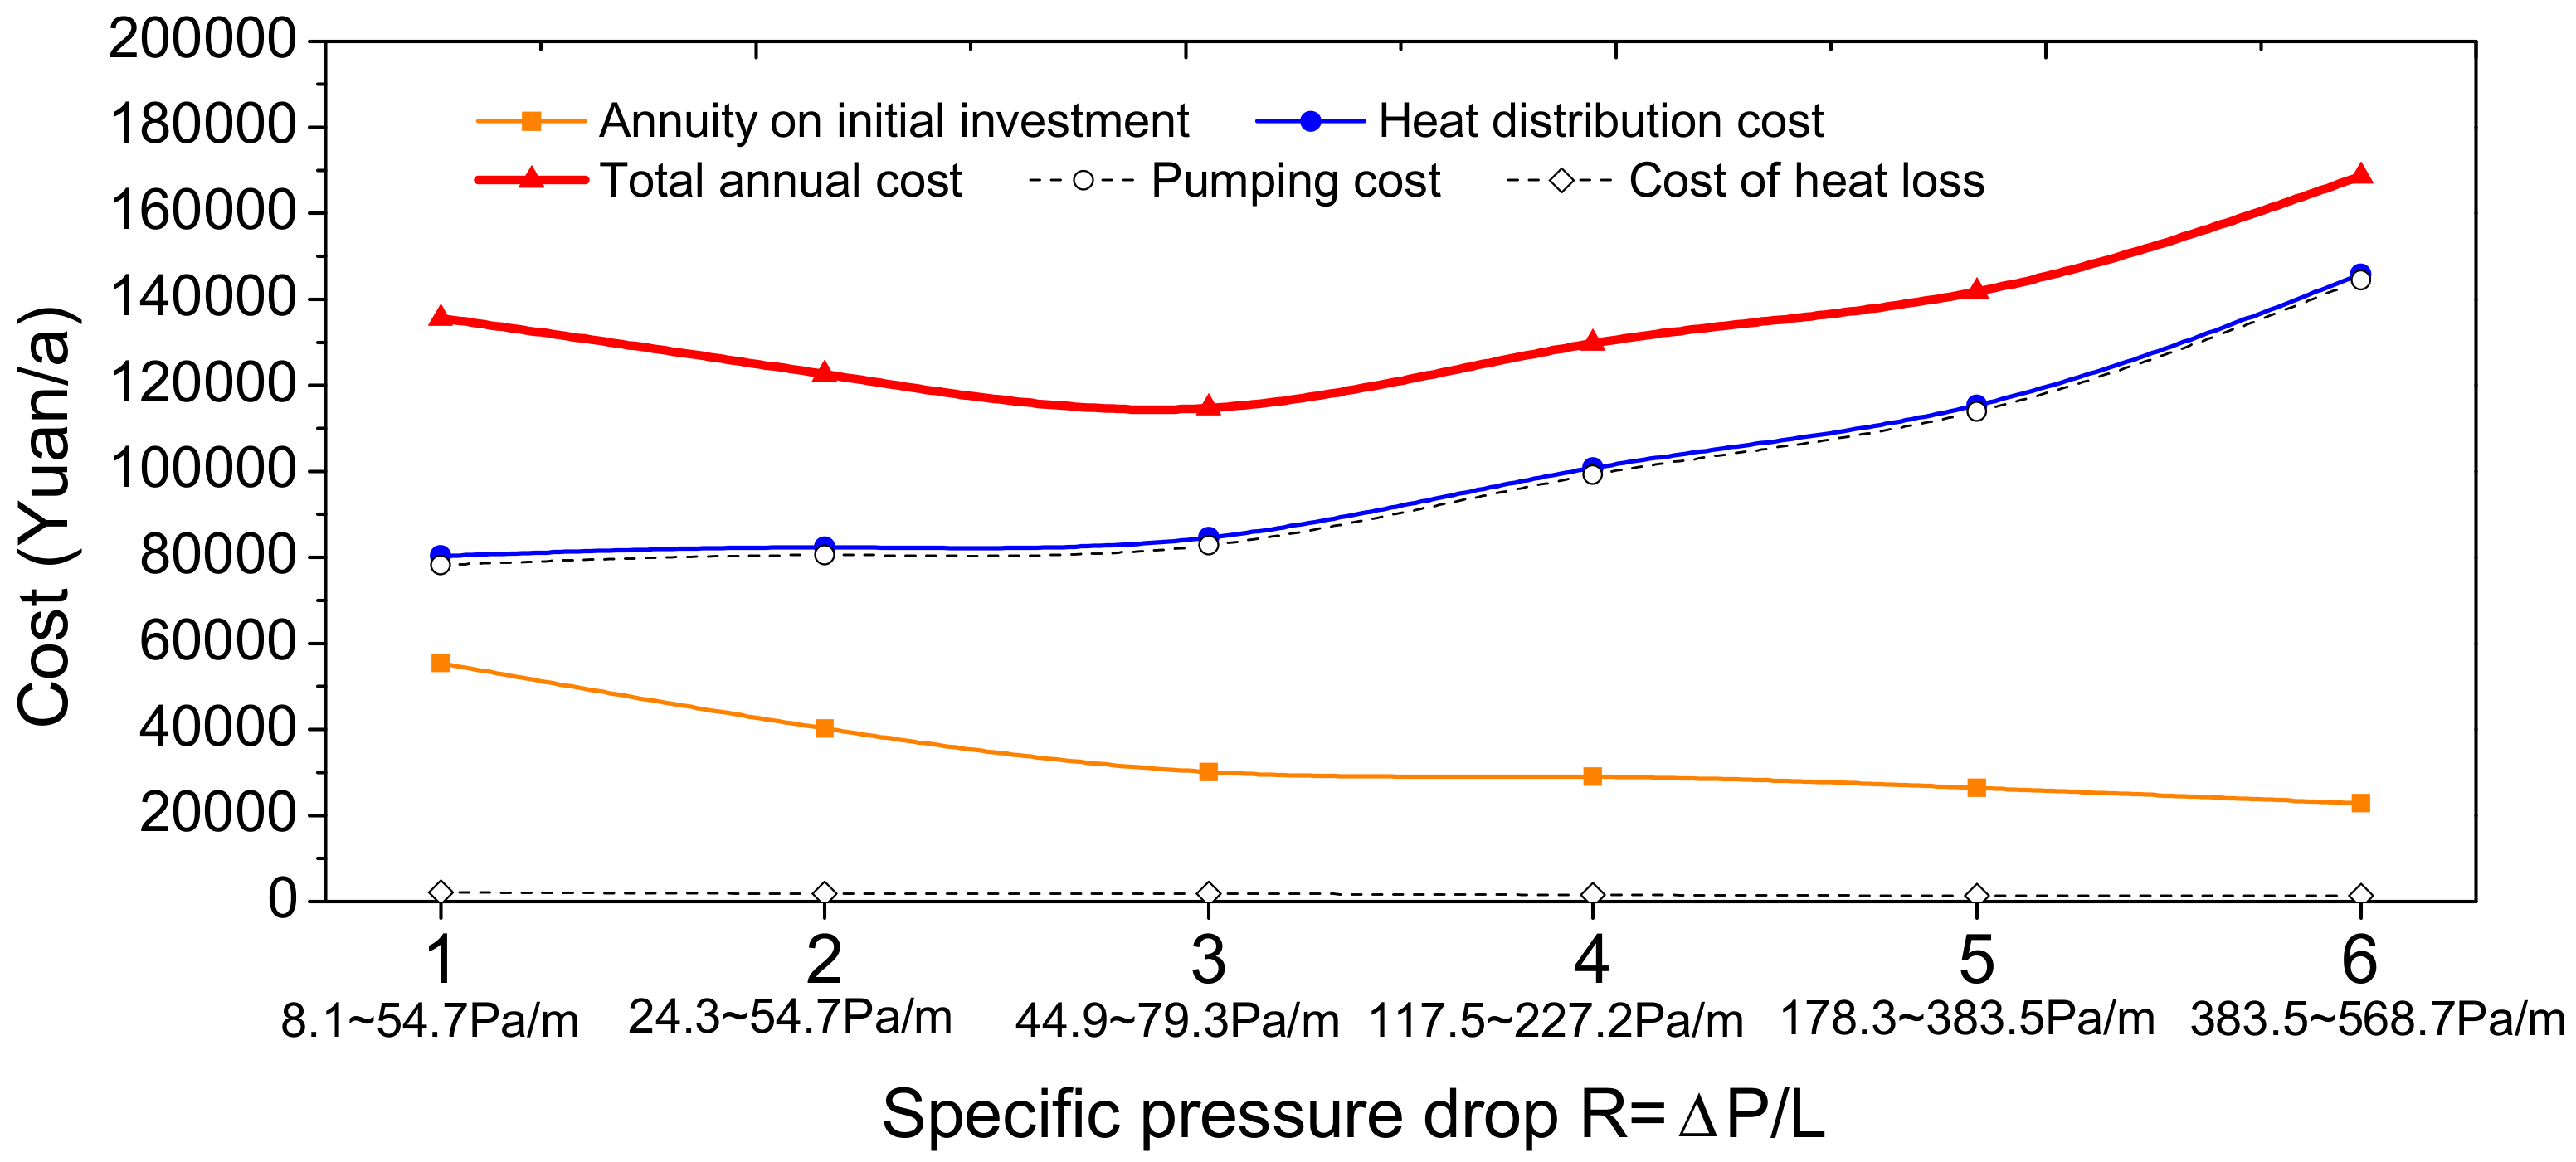
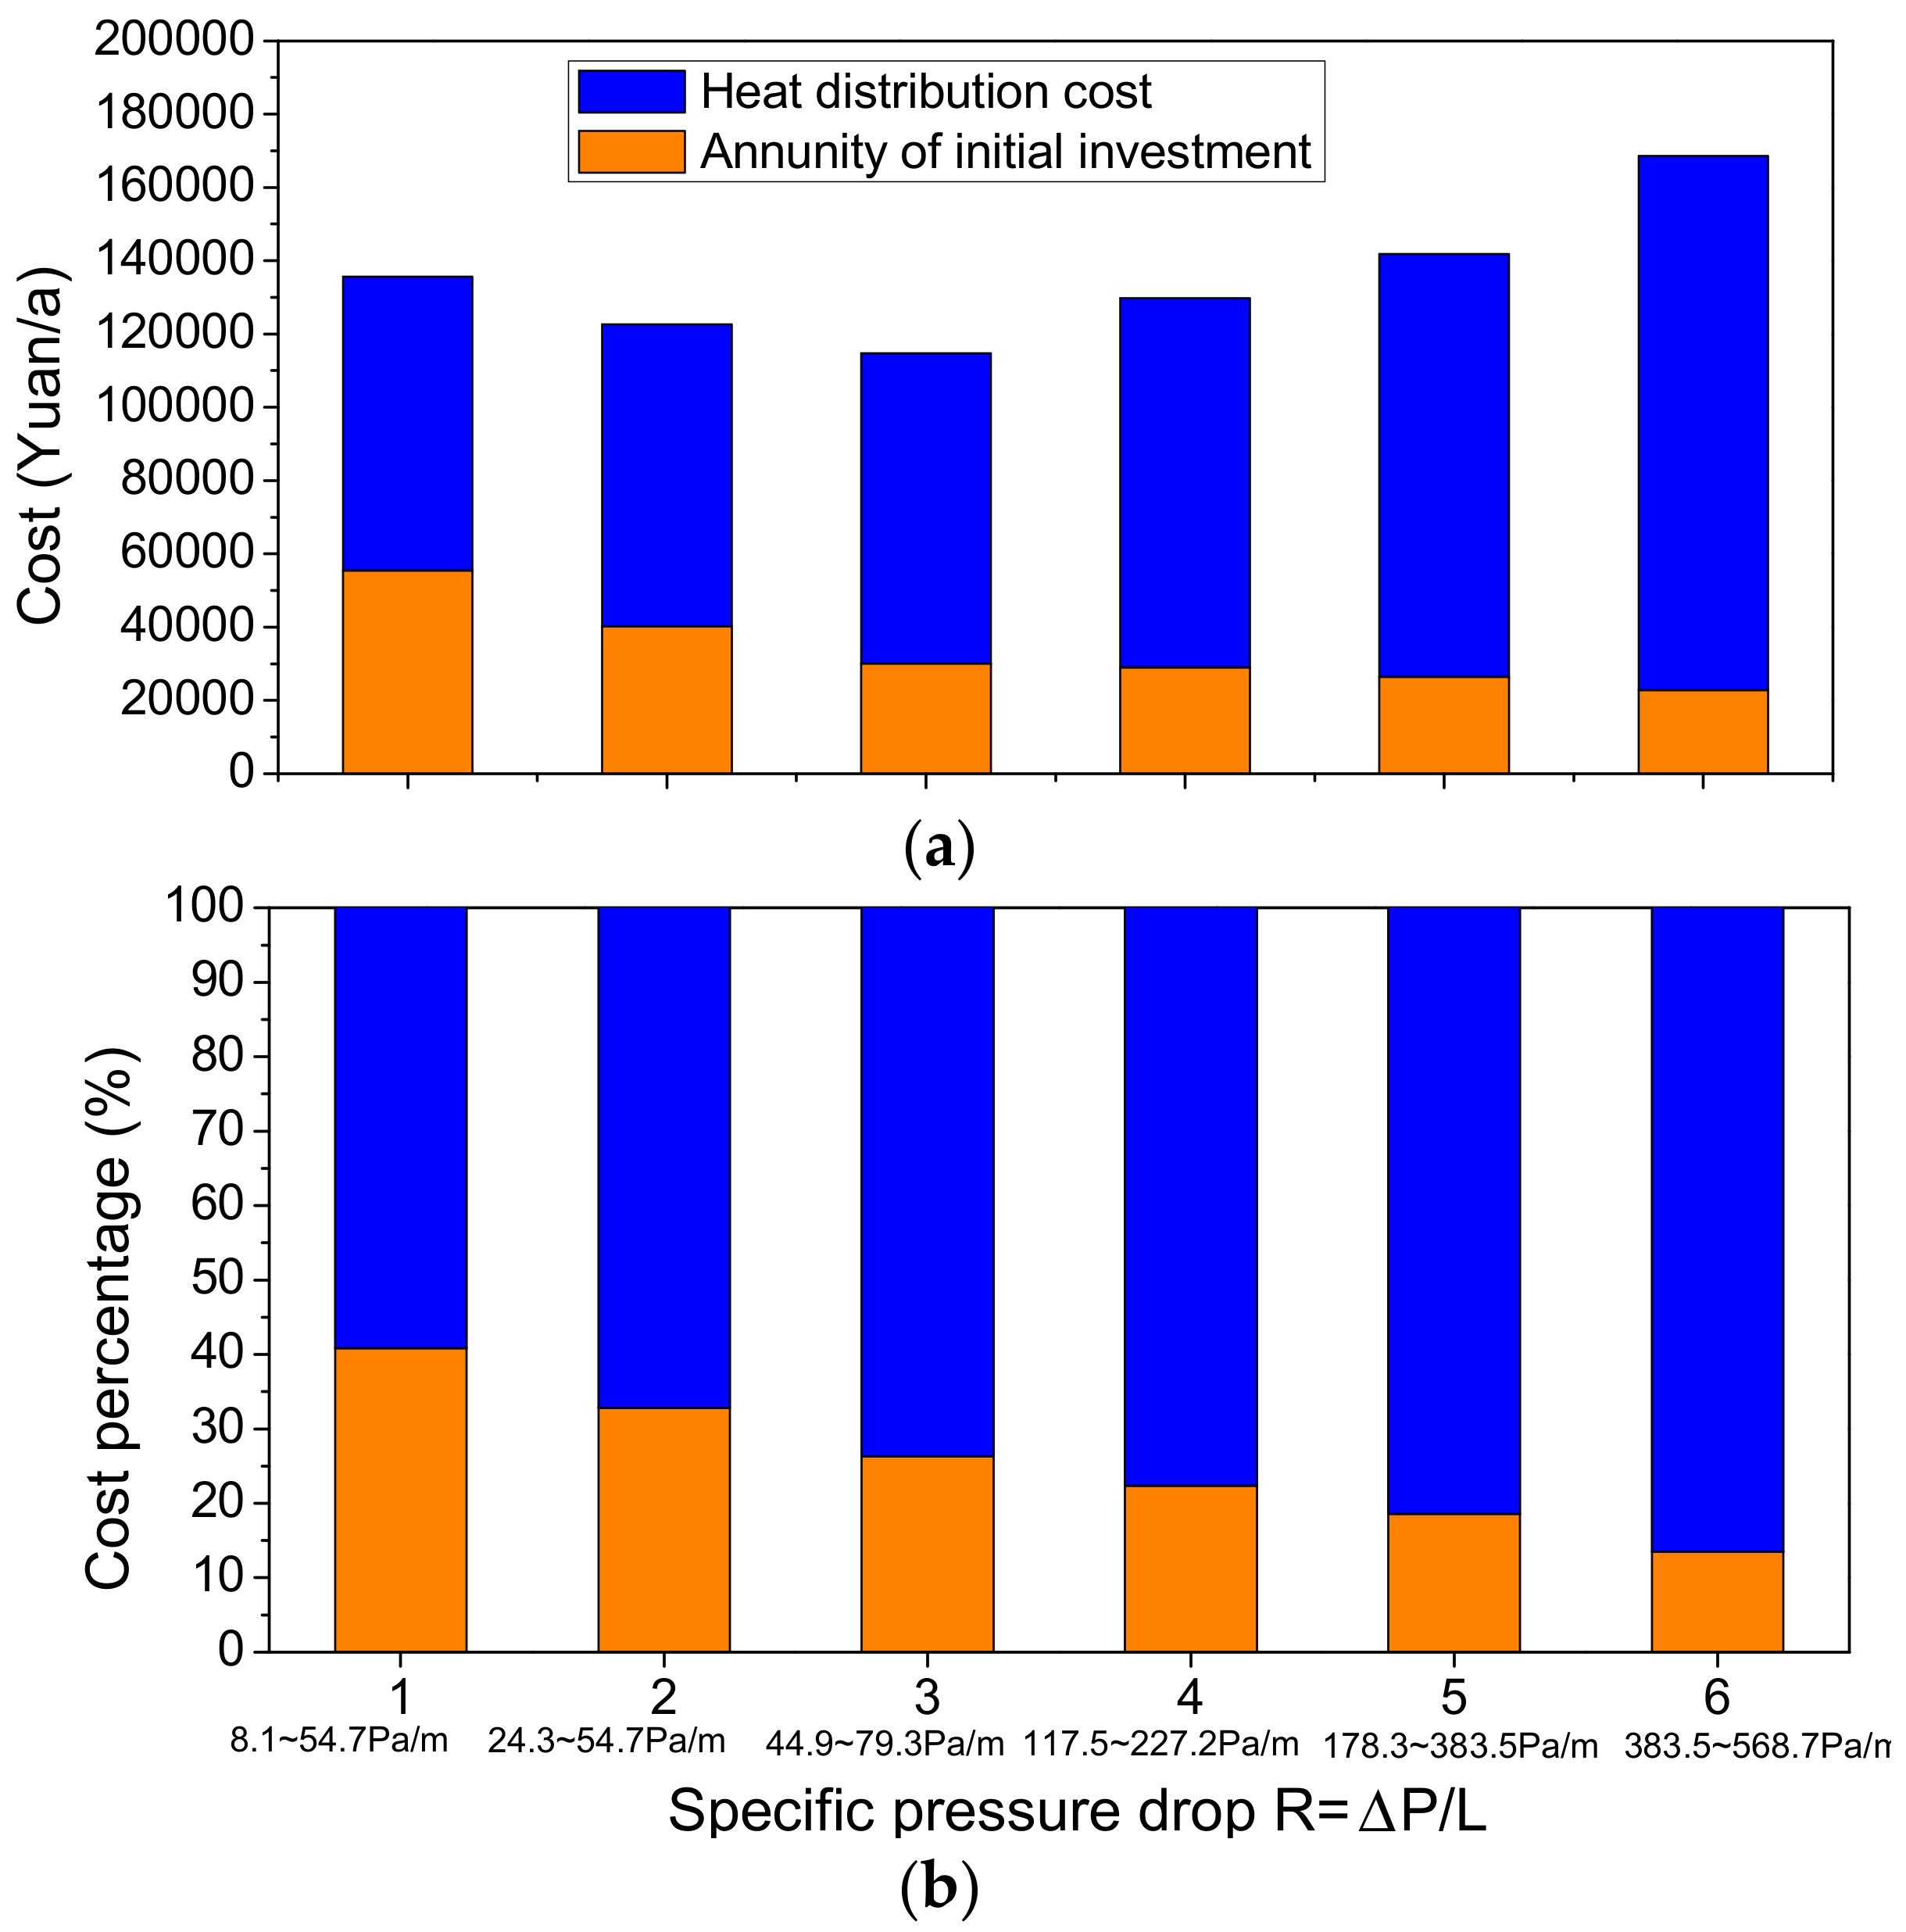
3.2. Optimization Results

The first three optimization steps were easy to perform for this sample DH network design, but in the future we will develop more general routines to speed up the optimization process for a DH network with more heat users. In step 2.4, we divided the network scenarios according to the R values shown in Table 3. This resulted in six network scenarios, with the R values ranging from 8.1 Pa/m to 568.7 Pa/m, which covers a wide range of specific pressure losses.
Then, in the following steps 2.5–2.8 we calculated the initial investment in pipes and the heat distribution cost by considering different combinations of steel and material prices and the full-power operating time percentages of the pump. Subsequently, in step 2.9 we calculated the annuity on the initial investment using Equations (12) and (13), and then obtained the total annual cost by adding together the annuity on the initial investment and the heat distribution cost, which is divided into pumping cost and cost of heat loss, but the latter is very small compared to the pumping cost. For example, the results when using the intermediate pipe price (420,000 Yuan/m3) and pump operating time (60% of a year) are shown in Figure 3 and Figure 4.
Note that the R values are not consecutive within the 6 scenarios, and there may be some overlap between two successive scenarios. This is already explained in Table 3. In addition, the reason that we connected all calculation points in Figure 3 was to show the trends for each variable. As can be seen from Figure 3, the annuity on the initial investment is a monotone decreasing function with increasing R values, while the heat distribution cost is an increasing function. However, the total annual cost, which is the sum of the previous two variables, has a minimum value when R is 44.9~79.3 Pa/m in scenario 3.
Figure 4a shows their cost value, while Figure 4b illustrates the cost percentage for different network scenarios. We found that the heat distribution cost percentage always increases together with increasing R values. This percentage increased from 59.2% to 86.5% within the six network scenarios. That is to say, if we use pipes that are too thin in the DH network (R values are large), the heat distribution cost will increase quite quickly. However, the cost percentage of the annuity on the initial investment ranged from only 13.5% to 40.8%, which means that the heat distribution cost is a more important factor when designing a DH network and it should be given more consideration compared to the initial investment.
Figure 3 and Figure 4 only indicate one possible scenario in the optimization process. Figure 5, however, shows the overall optimization results for all network scenarios and all possible combinations of pipe prices and pump operating times. It is unnecessary to calculate the annuity on the initial investment in Figure 5; therefore, it is more straightforward to examine all of the results and ascertain the optimal design scenario. For this sample DH network, the optimal design was network scenario 3, with R values ranging from 44.9 Pa/m to 79.3 Pa/m.

3.3. Discussion

In fact, the model already contains the result that would be obtained via the traditional method, which corresponds to scenario 2, shown in Table 3. The only difference between scenario 2 and the optimal scenario is that the pipe between nodes C and D is one size larger in the traditional method. This will result in an R value of 24.3 Pa/m, which is closer to the recommended values, and thus, will be chosen in the traditional design. Scenario 2 will have a slightly lower heat distribution cost, but at the expense of an obvious increase in the investment. Moreover, in Figure 5 the green dots representing scenario 2 are apparently dominated by the blue dots, which represent the optimal scenario. Therefore, our model clearly identified a better scenario than that obtained with the traditional method. The model was able to identify a globally optimal scenario because it enumerates all possible combinations of the pipe diameters and thus searches a much wider solution space.
Designing a DH network with the recommended R values will result in a feasible solution, but probably not the optimal solution in most cases. This means that it is still possible to improve the network design when considering different DH parameters and configurations. The optimization method generated all possible network scenarios consisting of different series of diameters for each pipe in the network. While there are many possible diameters for one pipe, disregarding the upstream and downstream pipes, the series of diameters for any single network scenario are strongly constrained by the two rules applied in step 2.2. Therefore, the number of network scenarios is much less than the number of possible combinations of pipe diameters. This optimization method is probably not the most efficient one, but it is able to identify the overall optimal network design.

4. Conclusions

The proposed optimization method was demonstrated in a sample DH network, and the optimal R values ranged from 44.9 Pa/m to 79.3 Pa/m, which are close to the recommended values. The results also indicate that the traditional design method results in a feasible but not optimal network design, which is dominated by the model’s results. We conclude that the R value should not be too small because the total annual cost can increase due to the large initial investment. In addition, the heat distribution cost plays a more important role in DH primary network design because it accounts for more than half of the total annual cost, that is, from 59.2% to 86.5% depending on the increasing R values. Therefore, if we use pipes that are too thin in the DH network (with large R values), the heat distribution cost will increase quite quickly. This means that the heat distribution cost is a more important factor when designing a DH network and it should be given more consideration compared to the initial investment. In the next step, we will develop the method further to make it easier to execute for complicated DH systems and for the pipeline extension.

Acknowledgments

This work was supported by the China national key research and development program—China-Finland intergovernmental cooperation in science and technology innovation (Funding No. 2016YFE0114500) and the Academy of Finland (grant number No. 299186). We would also like to thank the ‘Xinghai’ talent project of the Dalian University of Technology.

Author Contributions

Haichao Wang and Risto Lahdelma conceived and designed the method; Lin Duanmu contributed some materials and valuable suggestions; Haichao Wang and Xiangli Li analyzed the data; Haichao Wang wrote the paper.

Conflicts of Interest

The authors declare no conflict of interest.

References

  1. Finnish Energy Industries. Energy Year 2013—District Heat. Available online: http://energia.fi/en/statistics-and-publications (accessed on 7 April 2017).
  2. Wang, H.C.; Jiao, W.L.; Zou, P.H.; Liu, J.C. Analysis of an effective solution to excessive heat supply in a city primary heating network using gas-fired boilers for peak-load compensation. Energy Build. 2010, 42, 2090–2097. [Google Scholar] [CrossRef]
  3. Wang, H.C.; Jiao, W.L.; Lahdelma, R.; Zou, P.H. Techno-economic analysis of a coal-fired CHP based combined heating system with gas-fired boilers for peak load compensation. Energy Policy 2011, 39, 7950–7962. [Google Scholar]
  4. Calì, M.; Borchiellini, R. District heating networks calculation and optimization. In Exergy, Energy System Analysis, and Optimization; EOLSS: Paris, France, 2013; Volume 2. [Google Scholar]
  5. Ministry of Housing and Urban-Rural Development of the People’s Republic of China. Design Code for City Heating Network (CJJ34-2010); Achitecture & Building Press: Beijing, China, 2010.
  6. Frederiksen, S.; Wener, S. District Heating and Cooling; Studentlitteratur: Lund, Sweden, 2013. [Google Scholar]
  7. Lahdelma, R.; Wang, H.C. District Heating Distribution, 2nd International DHC + Summer School Course, a Bridge towards Future Energy System; Aalto University: Helsinki, Finland, 2014. [Google Scholar]
  8. Jiang, Y.; Yang, X. Current status of building energy consumption in China and problems in building energy saving. China Constr. 2006, 2, 12–18. [Google Scholar]
  9. Jiang, Y. Measures to Increase the Energy Efficiency of District Heating Energy Sources; Building Energy Saving Research Center of Tsinghua University: Beijing, China, 2014. [Google Scholar]
  10. Wang, C.Q.; Wang, S.Z.; Xu, K.; Cao, D.D.; Wang, Y.F.; Bai, L.; Dai, X. Heat loss measurement anlaysis of central heating pipe network. J. Jinlin Jianzhu Univ. 2015, 32, 39–41. [Google Scholar]
  11. Vesterlund, M.; Sandberg, J.; Lindblom, B.; Dahl, J. Evaluation of losses in district heating syste, a case study. In Proceedings of the International Conference on Efficiency, Cost, Optimization, Simulation & Environmental Impact of Energy Systems, Guilin, China, 16–19 July 2013. [Google Scholar]
  12. Çomaklı, K.; Yüksel, B.; Çomaklı, Ö. Evaluation of energy and energy losses in district heating network. Appl. Therm. Eng. 2004, 24, 1009–1017. [Google Scholar] [CrossRef]
  13. Mertz, T.; Serra, S.; Henon, A.; Reneaume, J. A MINLP optimization of the configuration and the design of a district heating network: Academic study cases. Energy 2016, 117, 450–464. [Google Scholar]
  14. Morvaj, B.; Evins, R.; Carmeliet, J. Optimising urban energy systems: Simultaneous system sizing, operation and district heating network layout. Energy 2016, 116, 619–636. [Google Scholar]
  15. Haikarainen, C.; Pettersson, F.; Saxén, H. A model for structural and operational optimization of distributed energy systems. Appl. Therm. Eng. 2014, 70, 211–218. [Google Scholar]
  16. Hassine, I.B.; Eicker, U. Impact of load structure variation and solar thermalenergy integration on an existing district heating network. Appl. Therm. Eng. 2013, 50, 1437–1446. [Google Scholar]
  17. Wang, W.H.; Cheng, X.T.; Liang, X.G. Optimization modeling of district heating networks and calculation by the Newton method. Appl. Therm. Eng. 2013, 61, 163–170. [Google Scholar]
  18. Zeng, J.; Han, J.; Zhang, G. Diameter optimization of district heating and cooling piping network based on hourly load. Appl. Therm. Eng. 2016, 107, 750–757. [Google Scholar] [CrossRef]
  19. Tol, H.I.; Svendsen, S. Improving the dimensioning of piping networks and network layouts in low-energy district heating systems connected to low-energy buildings: A case study in Roskilde, Denmark. Energy 2012, 38, 276–290. [Google Scholar] [CrossRef] [Green Version]
  20. Pirouti, M.; Bagdanavicius, A.; Ekanayake, J.; Wu, J.; Jenkins, N. Energy consumption and economic analyses of a district heating network. Energy 2013, 57, 149–159. [Google Scholar] [CrossRef]
  21. Koiv, T.A.; Mikola, A.; Palmiste, U. The new dimensioning method of the district heating network. Appl. Therm. Eng. 2014, 71, 78–82. [Google Scholar] [CrossRef]
  22. Ancona, M.A.; Melino, F.; Peretto, A. An Optimization procedure for District Heating networks. Energy Procedia 2014, 61, 278–281. [Google Scholar] [CrossRef]
  23. Jie, P.; Kong, X.; Rong, X.; Xie, S. Selecting the optimum pressure drop per unit length of district heating piping network based on operating strategies. Appl. Energy 2016, 177, 341–353. [Google Scholar] [CrossRef]
  24. Rezaie, B.; Rosen, M.A. District heating and cooling: Review of technology and potential enhancements. Appl. Energy 2012, 93, 2–10. [Google Scholar] [CrossRef]
  25. Mavrotas, G.; Figueira, J.R.; Siskos, E. Robustness analysis methodology for multi-objective combinatorial optimization problems and application to project selection. Omega 2015, 52, 142–155. [Google Scholar] [CrossRef]
  26. Larsen, H.V.; Pálsson, H.; Bøhm, B.; Ravn, H.F. Aggregated dynamic simulation model of district heating networks. Energy Convers. Manag. 2002, 43, 995–1019. [Google Scholar] [CrossRef]
  27. Larsen, H.V.; Bøhm, B.; Wigbels, M. A comparison of aggregated models for simulation and operational optimisation of district heating networks. Energy Convers. Manag. 2004, 45, 1119–1139. [Google Scholar] [CrossRef]
  28. National Standard of the People’s Republic of China. Design Code for Heating Ventilation and Air Conditioning of Civil Buildings; China Architecture & Building Press: Beijing, China, 2012.
  29. He, P.; Sun, G.; Wang, F.; Wu, H.X. District Heating Engineering, 4th ed.; Architecture & Building Press: Beijing, China, 2009. [Google Scholar]
  30. Fang, T.; Lahdelma, R. State estimation of district heating network based on customer measurements. Appl. Therm. Eng. 2014, 73, 1211–1221. [Google Scholar] [CrossRef]
  31. Zhang, H.; Xi, J.; Guo, H. Calculation and analysis of heat loss and temperature drop along directly buried hot water heating pipeline. Gas Heat 2014, 34, A36–A38. [Google Scholar]
  32. Terhan, M.; Comakli, K. Energy and exergy analyses of natural gas-fired boilers in a district heating system. Appl. Therm. Eng. 2017, 121, 380–387. [Google Scholar] [CrossRef]
Figure 1. The flowchart of DH network optimization. (a) General flowchart; (b) Algorithm steps.
Energies 10 01095 g001
Figure 2. The layout of a DH network (the solid and dashed lines denote the supply and return pipes).
Energies 10 01095 g002
Figure 3. The annuity on the initial investment, heat distribution cost, and total annual cost at different R for the sample DH network with the intermediate pipe price and pump operating time.
Energies 10 01095 g003
Figure 4. Comparison of the annuity on the initial investment and pump operating cost at different R values for the sample DH network with the intermediate pipe price and pump operating time. (a) Cost value; (b) cost percentage.
Energies 10 01095 g004
Figure 5. Optimization results for the heat distribution cost and initial investment in the sample DH network.
Energies 10 01095 g005
Table 1. The design heat demand profile for all heat users.
Heat User No.123
Heat demand (GJ/h)3.5182.5135.025
Heat demand (kW)9776981396
Table 2. Relevant parameters used in the optimization model.
ParameterDescription
Heat season 150 d
Pressure drop in the heat plant80 kPa
Static pressure40 mH2O (1 kPa ≈ 0.102 mH2O) 1
Local resistance pressure loss rate30%
Interest rate7.56%
Heat price50 Yuan/GJ
Electricity price0.8 Yuan/kWh
Calculation period20 years
Pipe prices based on steel consumption360,000 (L); 420,000 (I); 480,000 (H) Yuan/m3 2
Pump operating time percentage40% (L); 60% (I); 80% (H) of full power operating time 3
Pump efficiency70%
Water density (average)958.4 kg/m3
Inner surface roughness0.005 m
Assurance coefficient S1.15
Efficiency of motor ηm80%
1 The boiling points of water at the temperature levels in the DH system have been considered to determine the static pressure so as to avoid water evaporation and gas leakage in the DH pipes [32]. 2 Chinese currency RMB, 1 US dollar ≈ 6.7 Yuan; L = low price scenario, I = intermediate price scenario, and H = high price scenario, which can reflect uncertainty and changes in the price of steel; prices already include the construction work and material costs. 3 Equivalent full power operating time percentage in a year (8760 h, if not a leap year); L, I, and H have the same meanings as the pipe price.
Table 3. The network scenarios for the sample DH network.
Scenario No.123456
R = ∆P/L (Pa/m) 18.1~54.724.3~54.744.9~79.3117.5~227.2178.3~383.5383.5~568.7
Pipe diameter (mm) 2A->B219 × 6159 × 4.5159 × 4.5133 × 4108 × 4108 × 4
B->C133 × 4133 × 4133 × 4108 × 4108 × 489 × 3.5
C->D133 × 4133 × 4108 × 489 × 3.589 × 3.576 × 3.5
1 We used the R values to define the network scenarios, but these R values are not integers or an arithmetic sequence, because the pipe diameters are not consecutive values and the hydraulic calculations are nonlinear. 2 The diameters are nominal values with wall thicknesses, while the inner diameters were used for the hydraulic calculations.

