1. Introduction
The gearbox is an important mechanical component in a wind turbine (WT). Its availability and reliability attract attention due to the ultimate long downtime if it fails. The difficult accessibility of offshore wind farms further brings challenges to gearbox maintenance which requires an advanced operational and maintenance strategy for WTs [
1,
2]. Properly scheduled corrective and preventive maintenance both require effective WT fault detection, precise fault diagnosis and accurate prognosis techniques. To achieve efficient wind farm maintenance and competitive wind life-cycle cost, structural health monitoring techniques of WT system are being quickly developed through intelligent condition monitoring technique that integrates on-line fault detection and prognosis [
3]. A model-based approach has been developed for WT gearbox fault detection [
4]. Suitable methods and approaches are crucial for WT damage detection and fatigue accumulation estimation. Related technologies such as machine fatigue damage prognosis would greatly increase the value of condition monitoring in the drive train of WTs [
5]. Different techniques have been developed for WT gearbox prognosis, which include using angular velocity measurements for bearing failure [
6], hidden Markov models, neural networks and particle filter methods [
7].
Currently, most WT gearbox designs are based on the ISO-6336 series [
8] or IEC 61400 [
9] in order to satisfy the minimum safety factors during the design stage. The question arises as to how to quantify WTs’ long-term fatigue life when they are operating under variable and turbulent wind conditions. In the standards only the short-term WT gearbox fatigue is considered [
10]. Models and approaches to calculate WT gearbox long-term fatigue damage are developed based on linear fatigue theory and wind speed statistical distribution [
10,
11]. The most vulnerable components of the WT gearbox are compared and summarized to assist reliability-based maintenance [
12]. The main reason for the randomness of fatigue damage lies in the characteristics of the material, the geometric dimensions of the test pieces, and the uncertainty of external loads [
13]. Internal excitation can be considered by a detailed rigid and flexible multi-body model of a WT drive train which is normally used to study the internal dynamics of the mechanical transmission system [
14,
15,
16]. However, external excitation of the gearbox coming from short-term scale rapid wind speed variation which is essentially correlated to wind turbulence effects attracts little research attention [
17]. Irregular stress amplitudes of WT gearboxes due to WTs’ response to both external and internal excitation causes further complexity and difficulty for predicting gear damage and fatigue life. In addition, cost-effective gearbox damage quantification relies on a realistic measurement or implementation solution to enable the calculation.
Fatigue, wear or plastic deformation are common gearbox failure modes, of which the most common cause of gear failure is tooth bending fatigue [
18]. Contact fatigue failure (pitting) and bending fatigue failure (tooth breakage) could be two of the main gear failure reasons [
19]. Bending fatigue failure is a common failure mode in engineering and it happens when variable loads appear act a gear which leads to fatigue stress [
20]. This paper is limited on studying bending stress fatigue analysis rather than micropitting and pitting fatigue life, that is bending stress is taken into account for gear fatigue life prediction without considering assembly errors and geometry defects.
This paper is focused on the mechanism of a gearbox’s gear bending fatigue failure to develop a method to predict the fatigue life with practical supervisory control and data acquisition (SCADA) data. A dynamic model of the planetary gear system and a wind speed model that considers wind turbulence impacts is used. Time domain short-term WT gear meshing forces under different wind turbulence scales are obtained by a simulation model, which couples the WT model and the gearbox dynamic model. Load cycle distribution is then assessed for fatigue damage prediction based on linear fatigue damage theory. According to the low sampling rate characteristics of SCADA data, a practical approach is then proposed to quantify long-term gearbox gear fatigue damage, which is derived from the theoretical calculations and analysis results.
2. SCADA Data for Long Term Fatigue Quantification
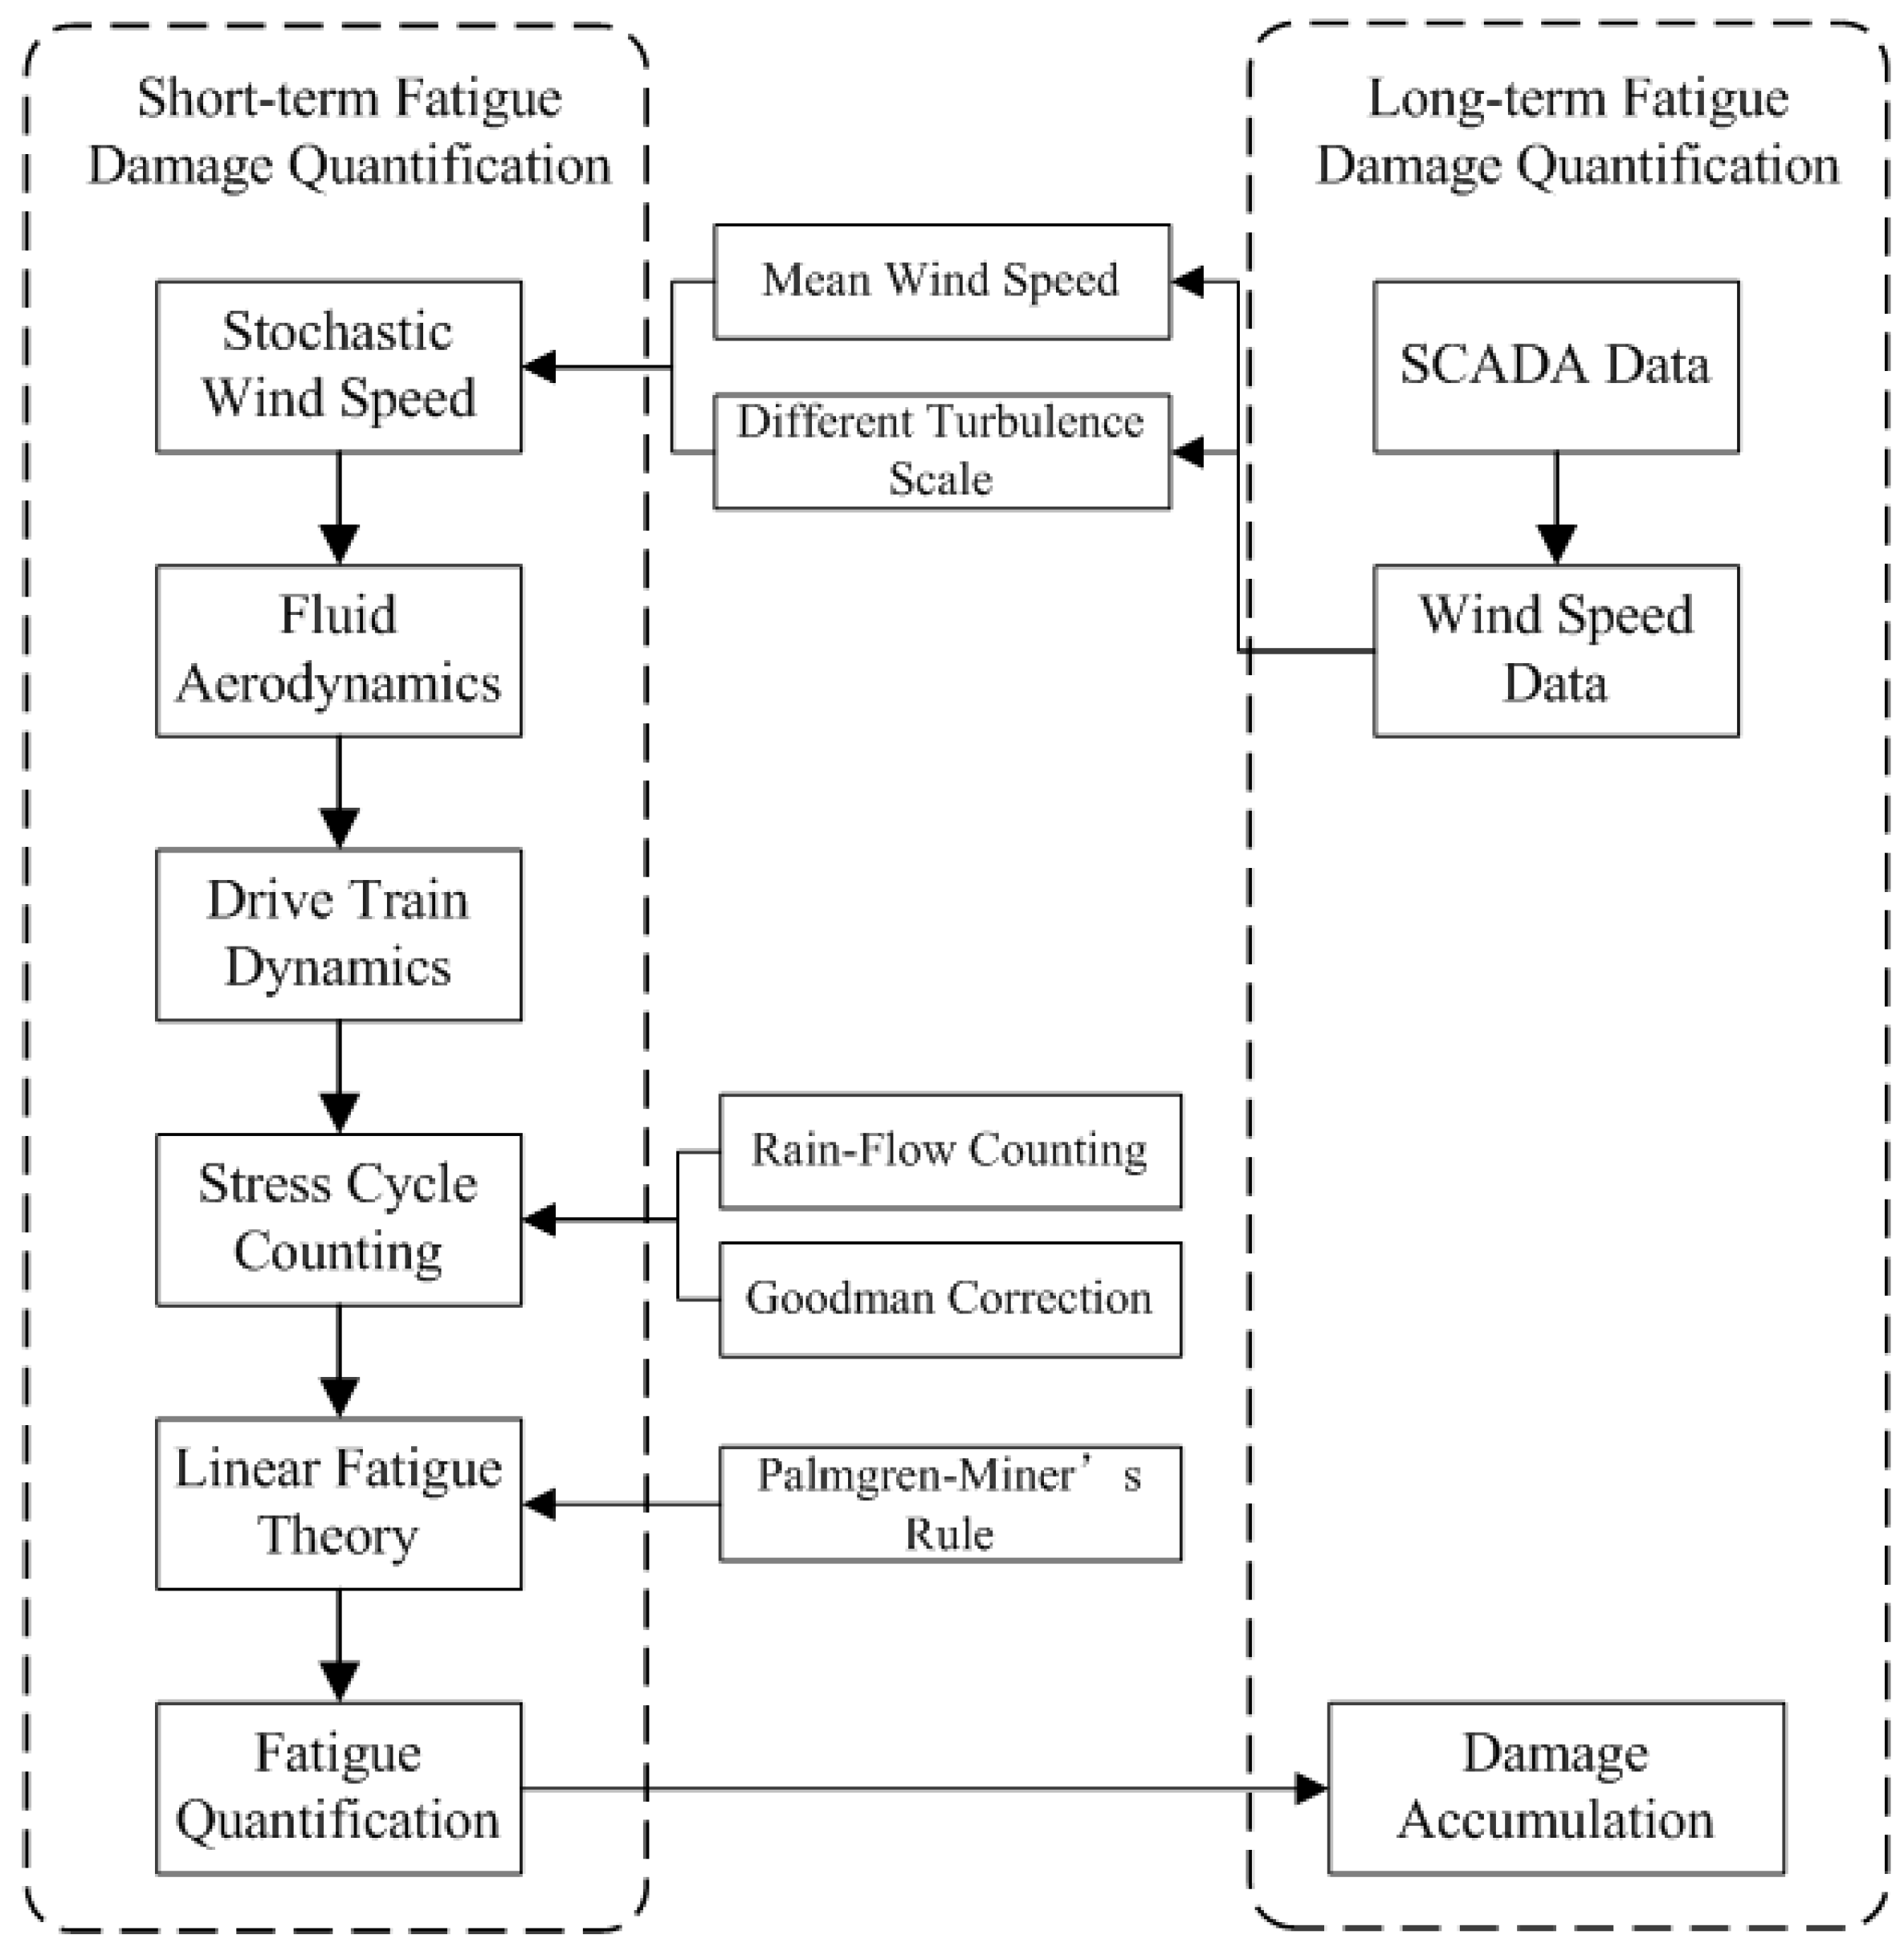
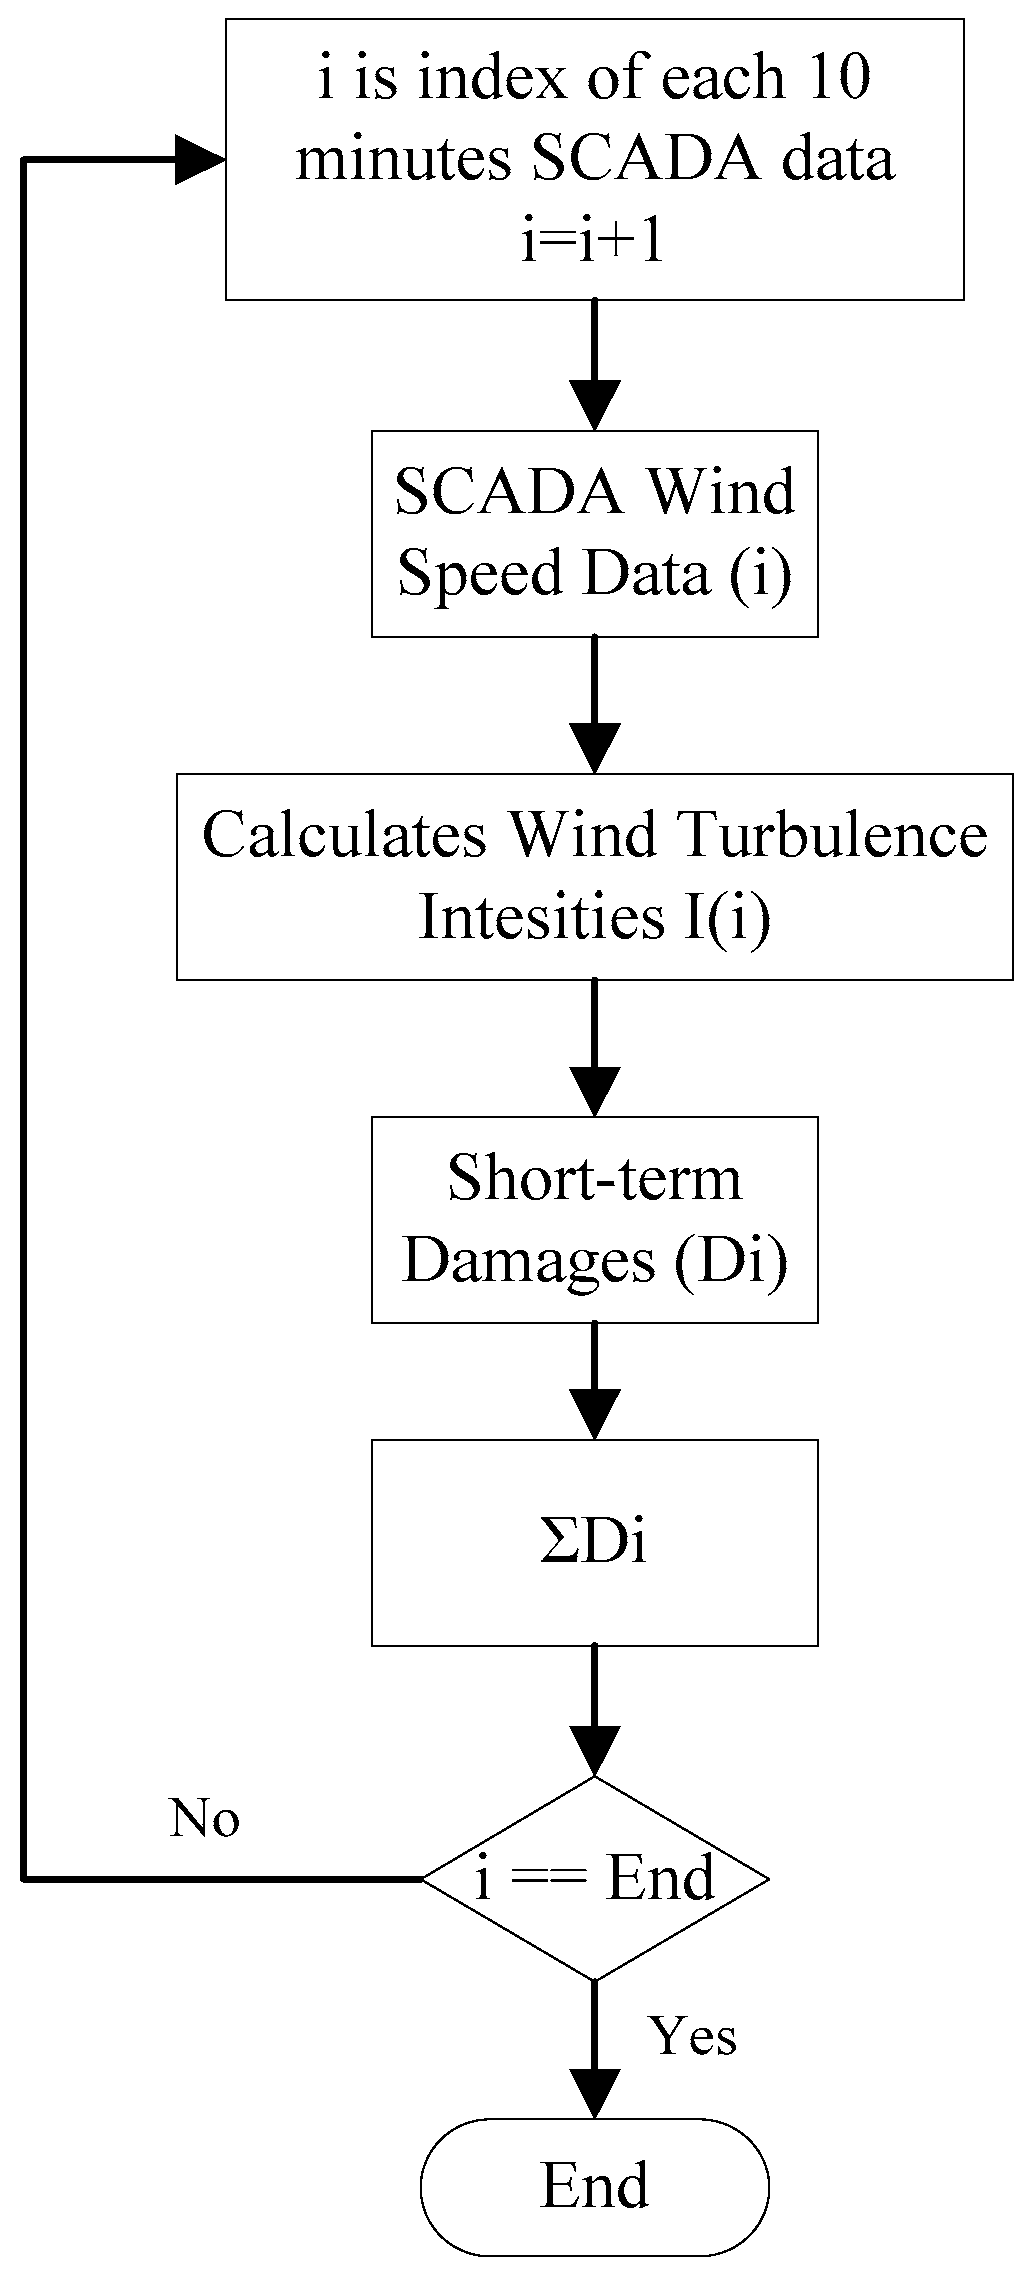
The approach proposed in this paper to quantify WT gearbox is illustrated in
Figure 1. Firstly, short-term gearbox damage under stochastic wind speed conditions is investigated by the calculation procedure shown in the left column in
Figure 1. The short-term wind speed variation is characterized by the mean wind speed with different turbulence scale that represents the external excitation in the gearbox dynamics. The torque generated by the WT rotor is simulated by a fluid aerodynamic model, which is used as input of the drive train dynamic model. Internal excitation of WT gearbox is considered by taking varying meshing stiffness into account in calculating the time domain bending stress amplitudes. Stress cycles are counted by a rain-flow counting algorithm. As only the stress variation amplitudes are considered during cycle counting, Goodman corrections are adopted to account for the stress level influence. Finally, short-term fatigue damage of gears is obtained according to linear fatigue theory.
Secondly, a procedure of using SCADA data to quantify long-term damage of gearbox is presented. The WT SCADA data recorded ten minute average wind speeds and also the maximum and minimum values during this period. Accordingly wind turbulence scales within those ten minutes are calculated based on a mathematical derivation by assuming that the wind speed distribution is in accordance with statistics. This mathematical model is presented in
Section 6. Corresponding short-term damage quantification results are obtained, in terms of wind speed parameters, and then further accumulated for long-term damage quantification.
Finally, a real case of using SCADA data to quantify gearbox damage is presented for a realistic WT that had suffered a catastrophic gear failure. It provides a cost-effective solution for gearbox damage quantification and performance monitoring from a practical point of view.
4. Wind Turbine Short-Term Fatigue Damage Quantification
WT gears are subjected to irregular stress which is due to its unique external condition of random and turbulentwind. This is an irregular random process, in which the magnitude of the random variable loads, fatigue damage estimation and service life time prediction are complex. Fatigue damage estimation of gears is performed by tooth root bending stress cycle counting, which essentially assumes that failure mechanism of a gear is a cumulative process. Normally this is calculated by Palmgren-Miner’s linear damage rule [
31].
The rain-flow (RF) cycle method [
32] assumes that the plasticity of materials results in fatigue damage which can be reflected on the stress-strain hysteresis loop. The rain-flow cycle algorithm records the amplitude and means value of the stress, so that it obtains all the information of the stress cycle of the material. A full RF cycle [
33] was defined as a stress range formed by two points which are bounded within adjacent points of higher and lower magnitude.
The Palmgren-Miner theory is based on two assumptions: (1) the materials’ fatigue damages under different stress levels are independent of each other; (2) the materials fatigue damage can be linearly accumulative. Damage is calculated with Equation (15):
Stress cycle are counted by the rain-flow cycle method and its amplitude should be normalized to a zero-mean stress level before applying the Palmgren-Miner theory. When the critical value D of linear cumulative fatigue damage approaches 1, the theory predicts the material is broken. In this process, as only the cycles with the same stress variation amplitude are counted for the full cycles, the influences of mean stress values actually are not reflected in the rain flow counting process. To consider the mean stress value effects, a Goodman linear equation is used to calculate equivalent loads as shown in Equation (16) [
34]:
where
is the zero-mean equivalent stress level;
is stress limit of material;
is the amplitude of stress;
is the mean stress. Using Goodman equation asymmetric stress levels are transformed into symmetric stress (zero-mean) levels.
5. Simulation
This paper studies a WT with rated power of 1.5–2 MW. The design parameters of the WT include: rotor diameter of 79.2 m, air density of 1.225 kg/m
3, the tip speed ratio of 6.3, wind energy utilization coefficient of 0.32. The WT configuration parameters are listed in
Table 1 and the gearbox geometry parameters are listed in
Table 2. The calculation is for a WT which has failed during operation due to broken teeth observed in the planetary stage gears.
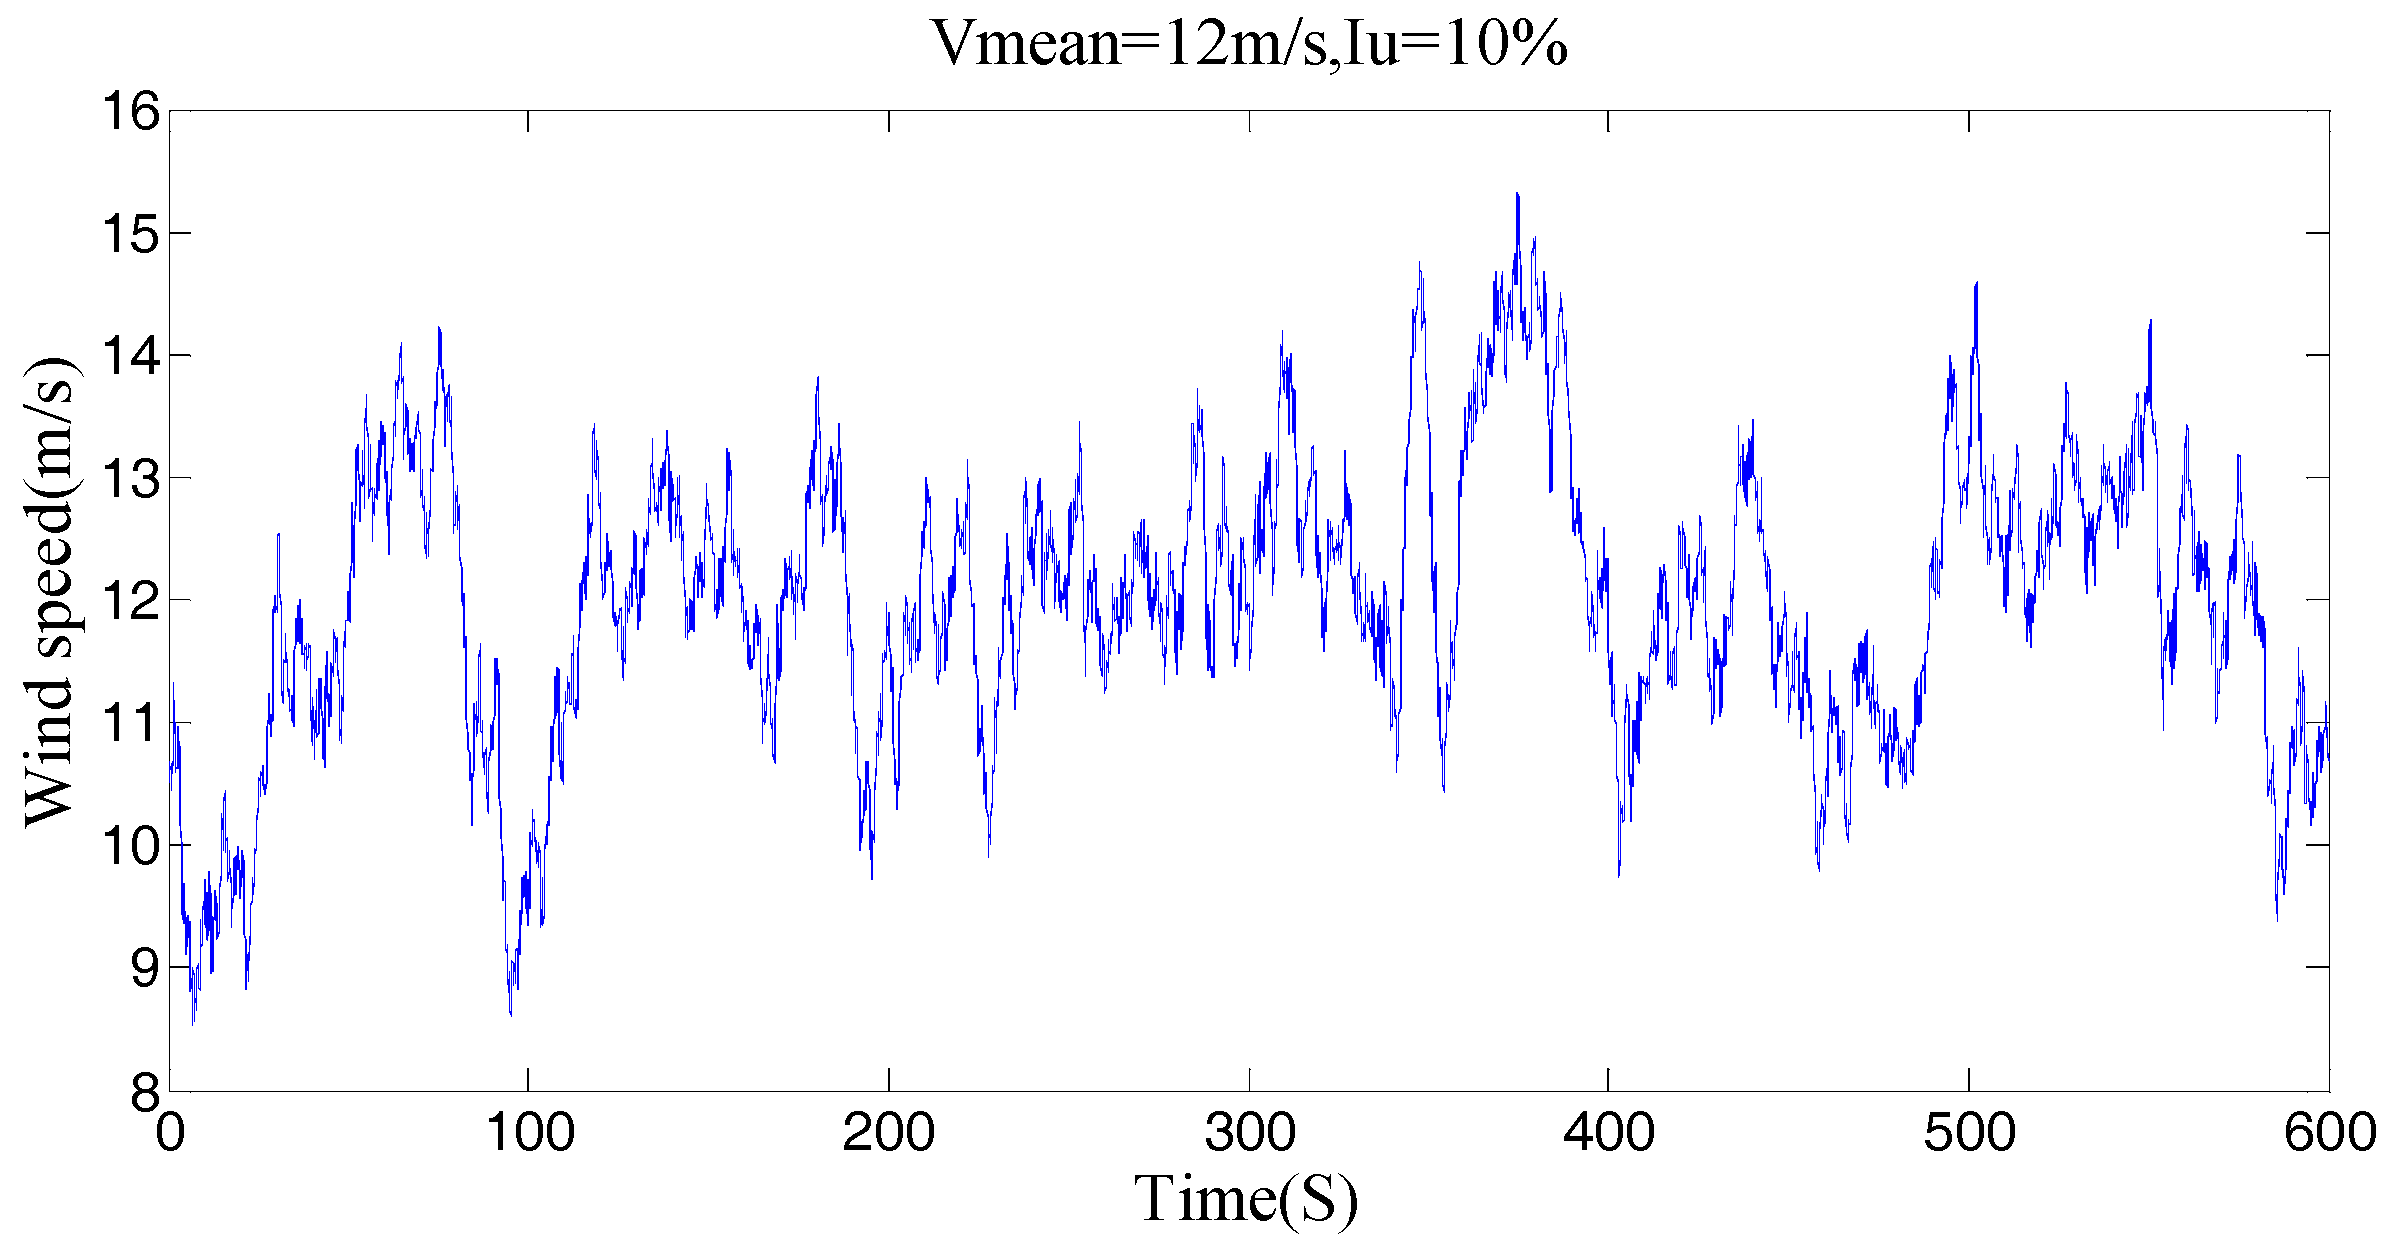
For demonstration purposes, the time domain wind speed variation with a mean wind speed of 12 m/s and turbulence intensity of 10% generated by the GH Bladed software is shown in
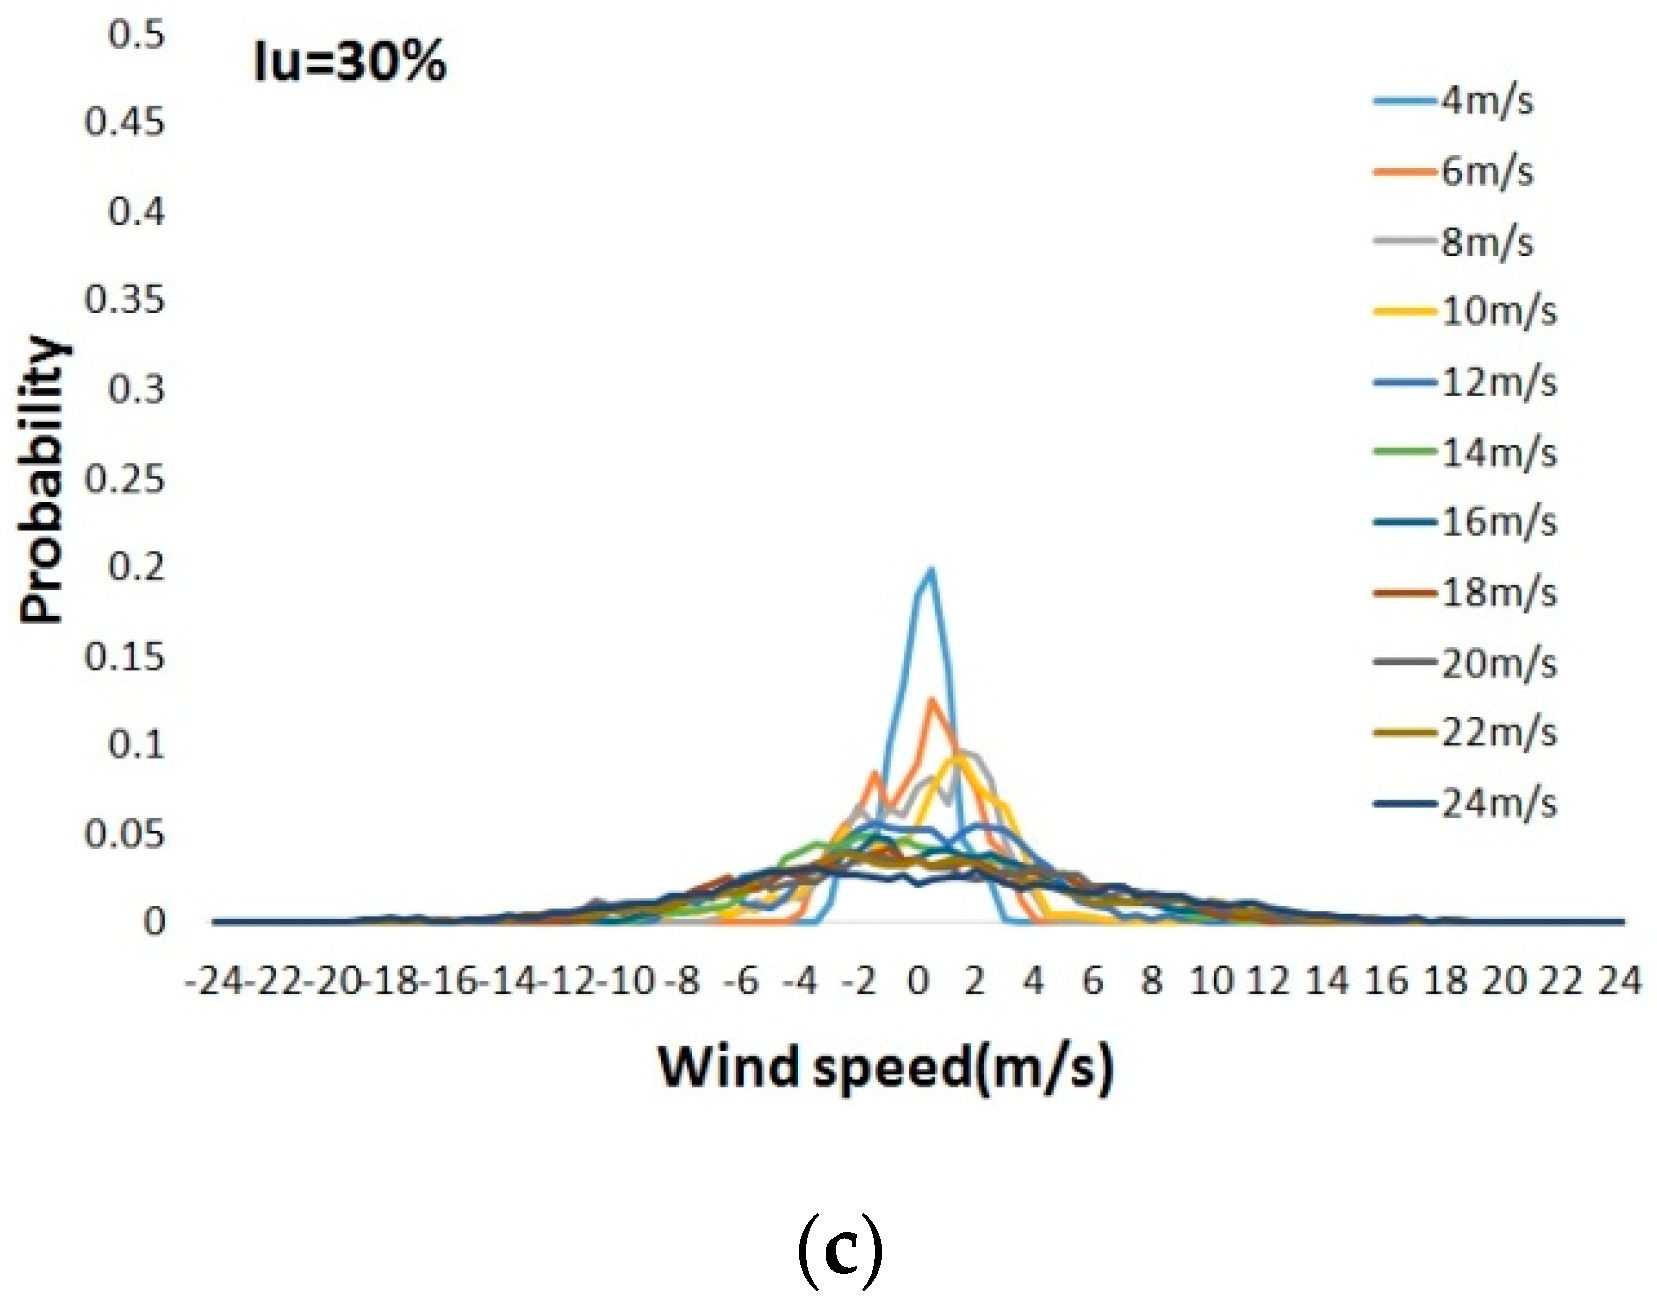
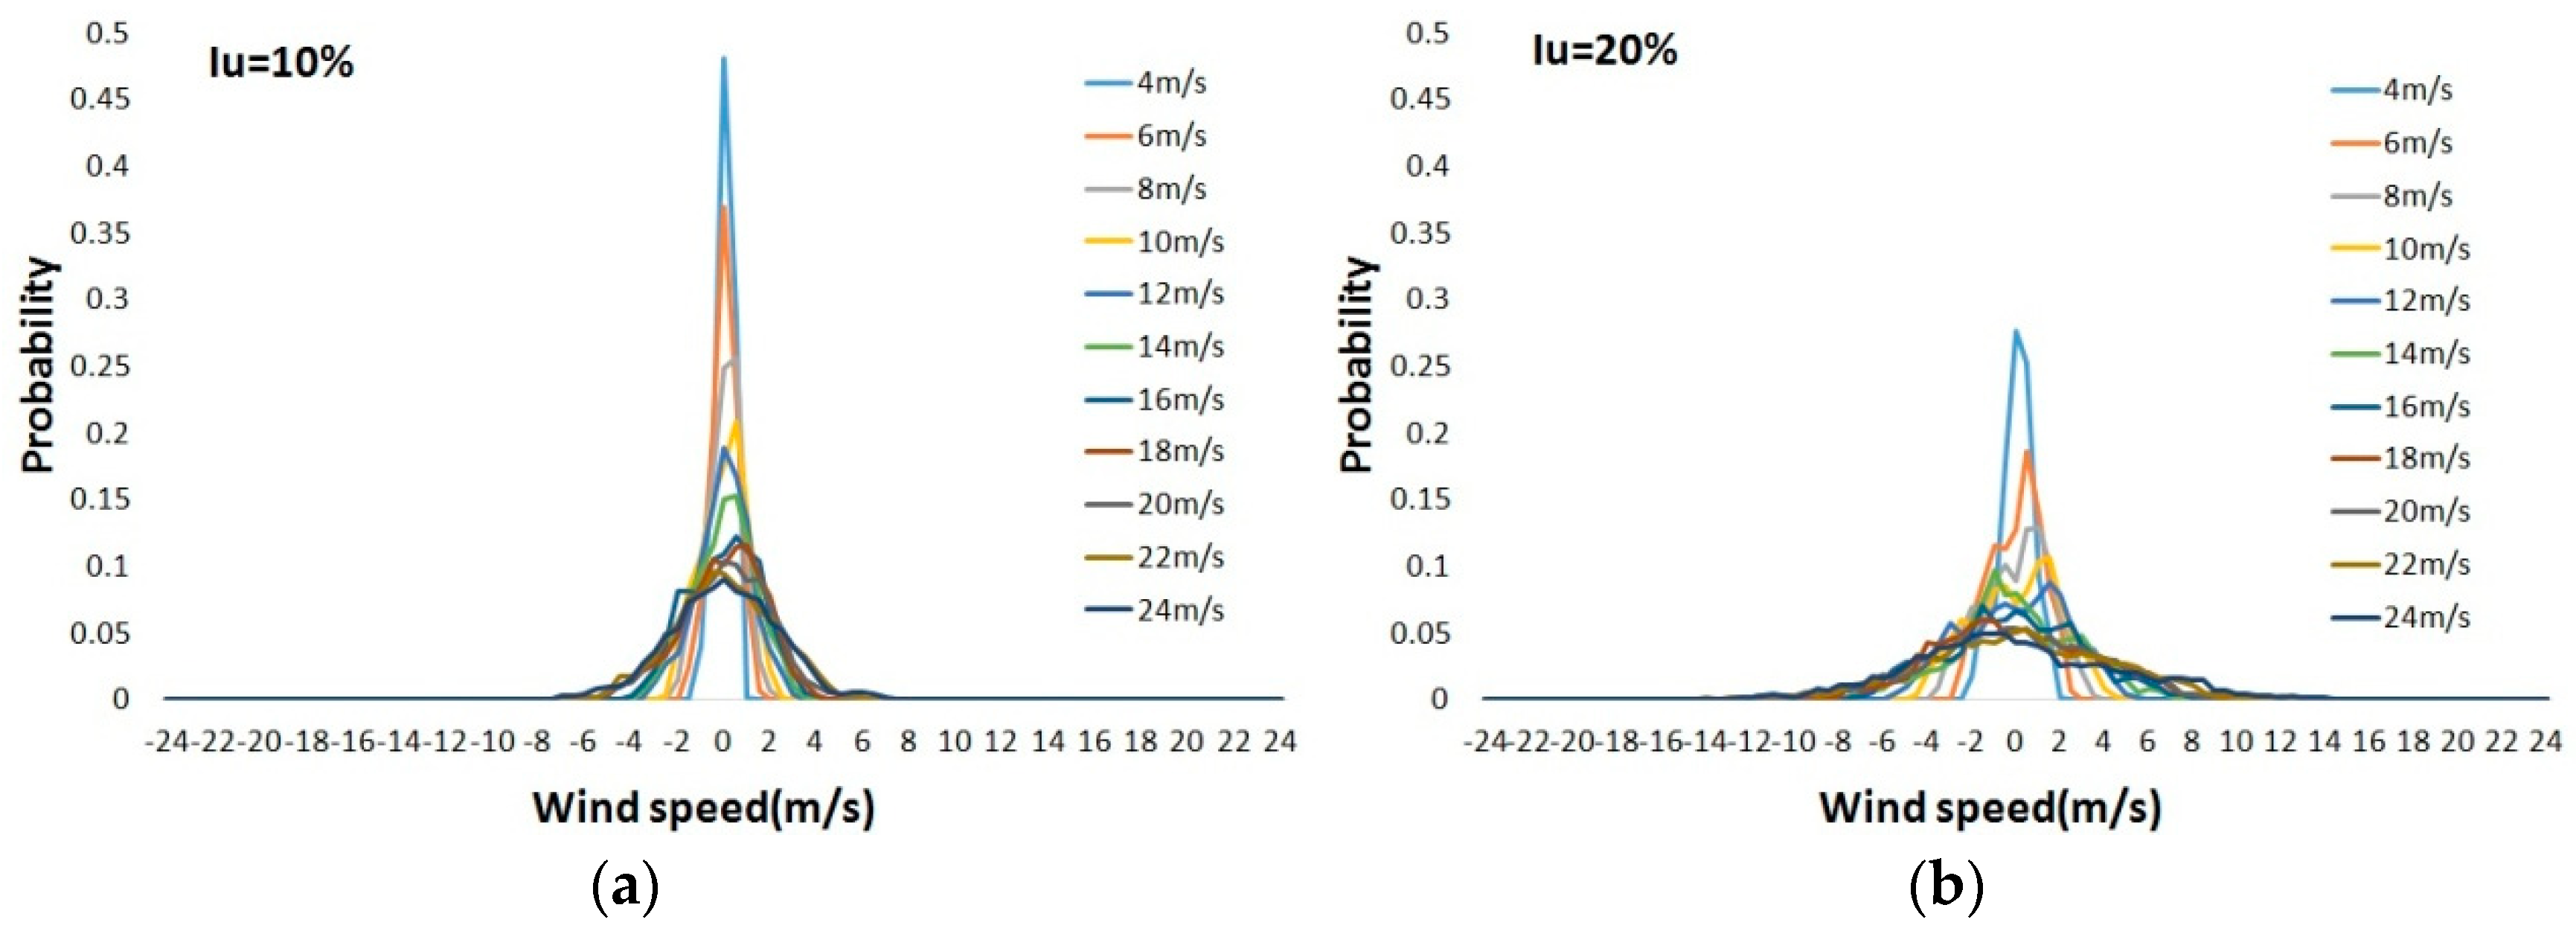
Figure 4. Normalized wind speed statistical distributions for different mean wind speeds at different turbulence scales of 10%, 20% and 30% are plotted in
Figure 5. It shows that with the increase of the wind turbulence intensity the 10 min wind speed statistical distribution covers a wider range, which essentially presents a wider range of wind speed variation.
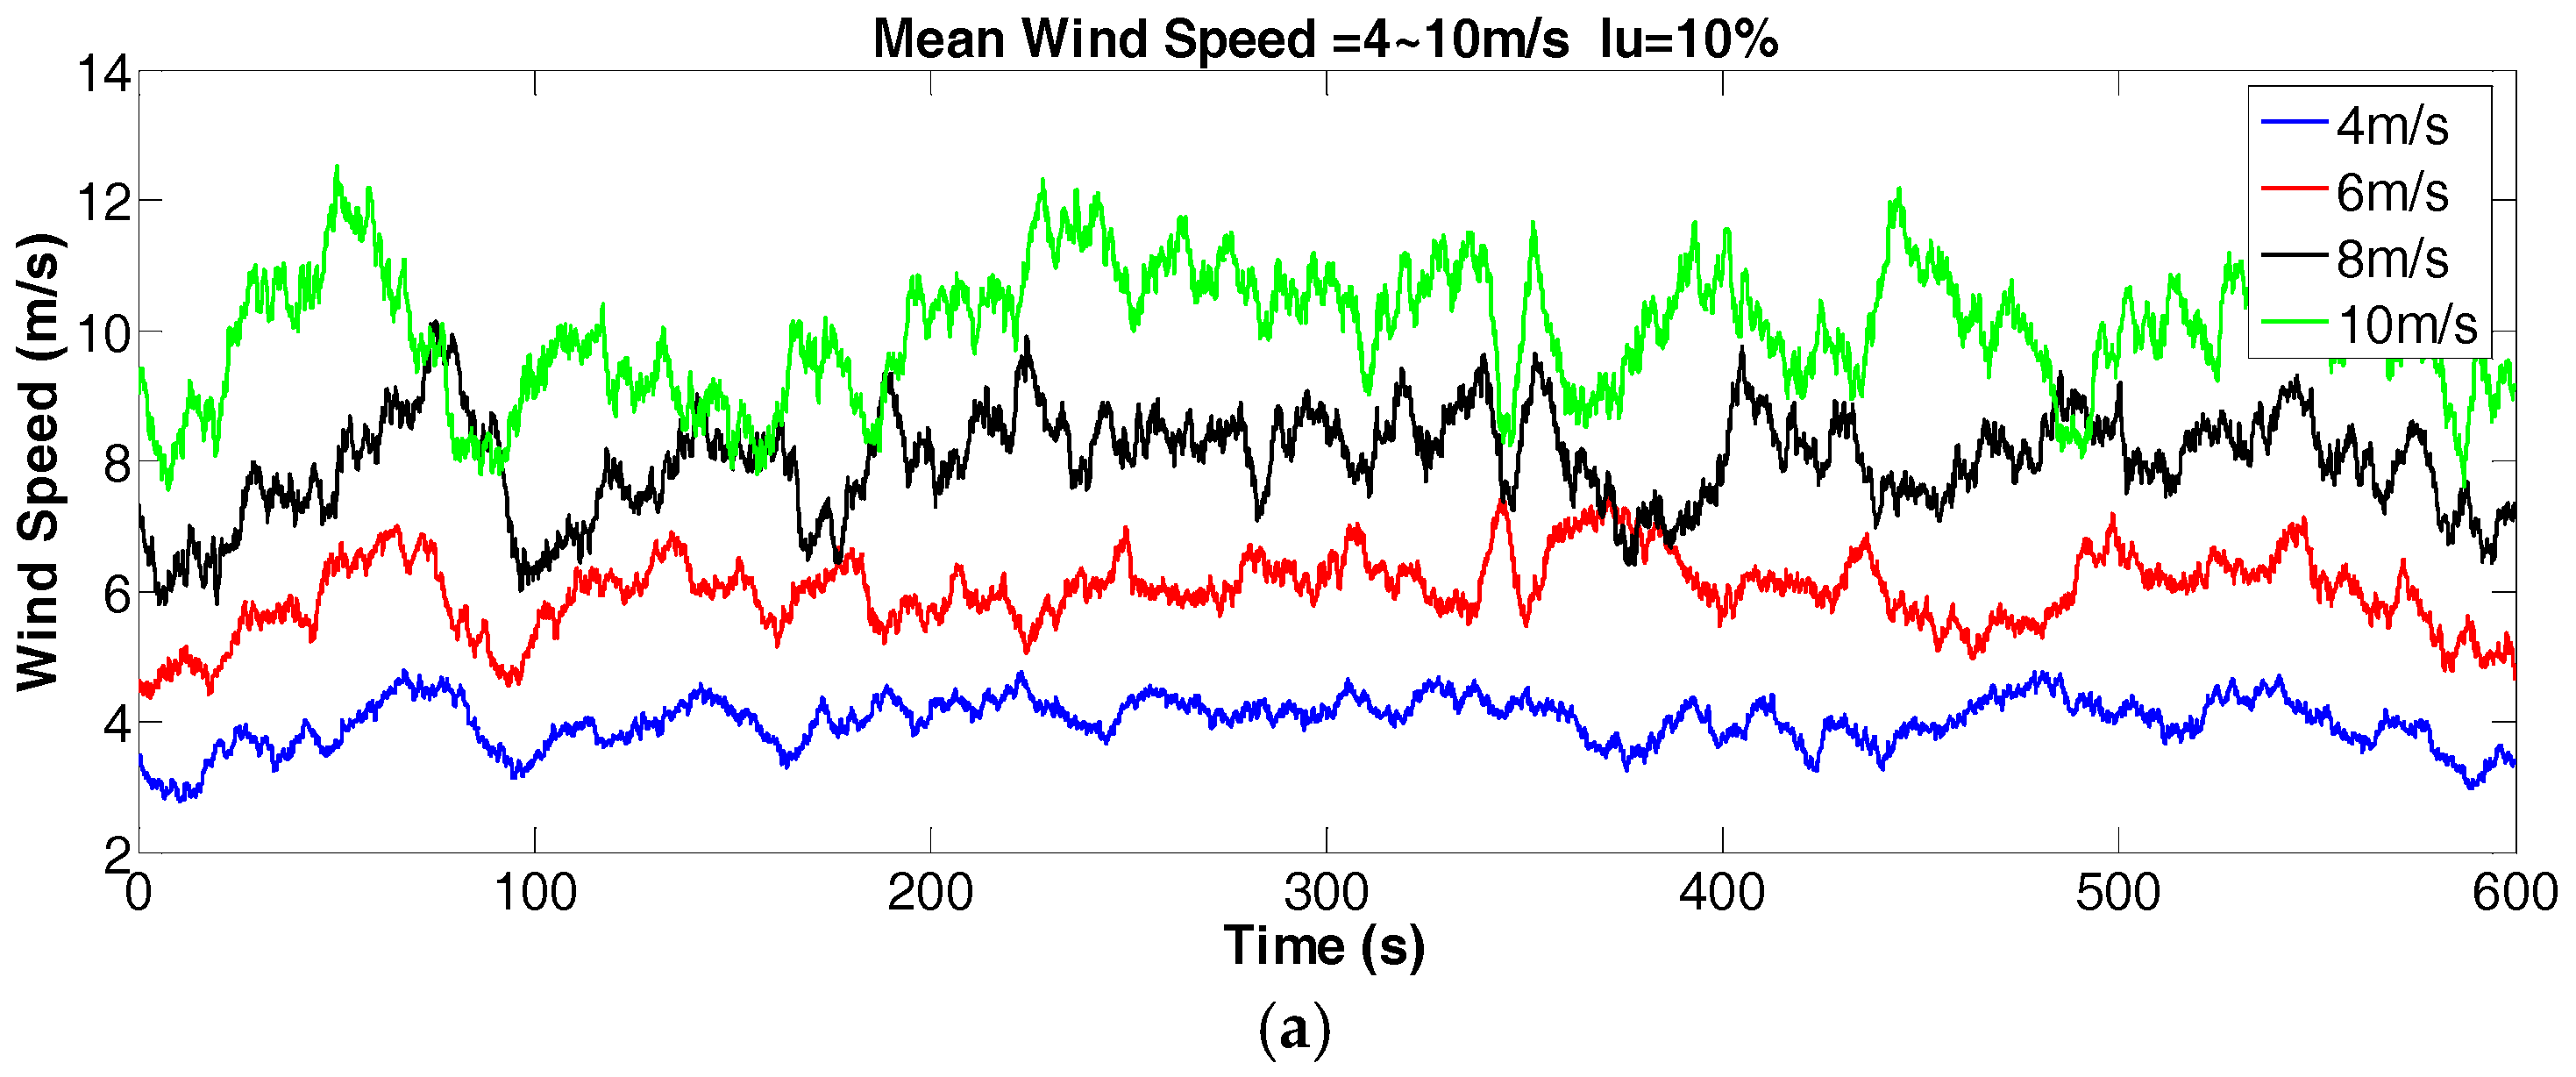
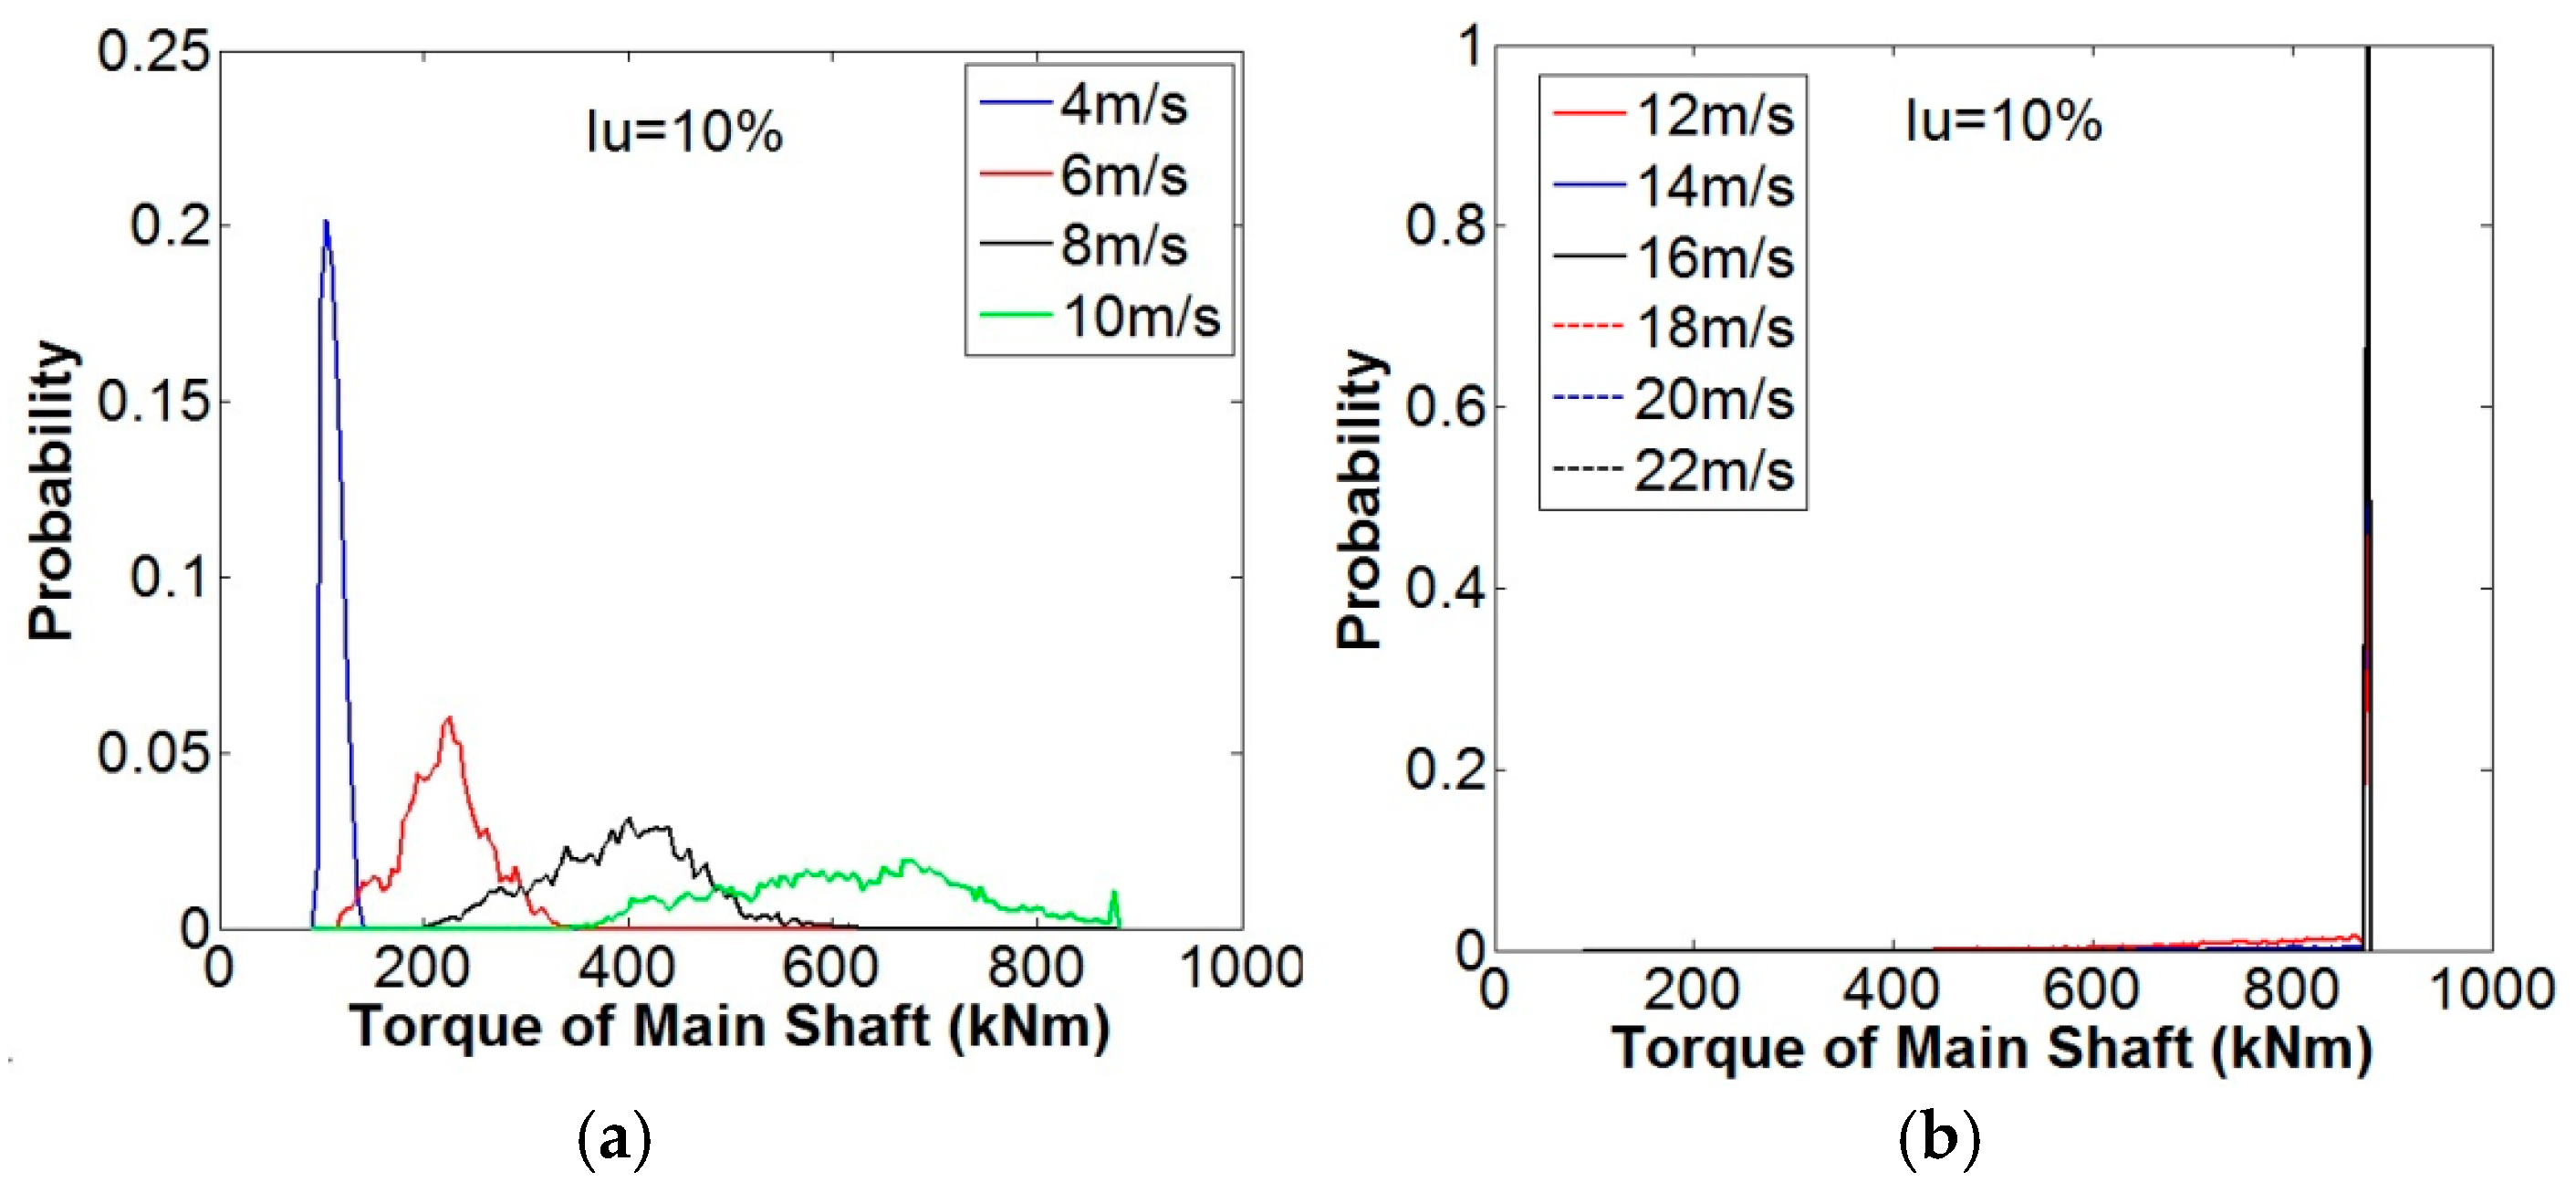
With 10% wind turbulence scale, the WT aerodynamic torques of the main shaft in response to different external wind conditions are shown in
Figure 6a,b.
Figure 6a shows the torque variation of the WT main shaft under wind speeds from 4 to 10 m/s (under the rated wind speed range). The torques’ magnitudes increase with the increase of mean wind speed under this situation.
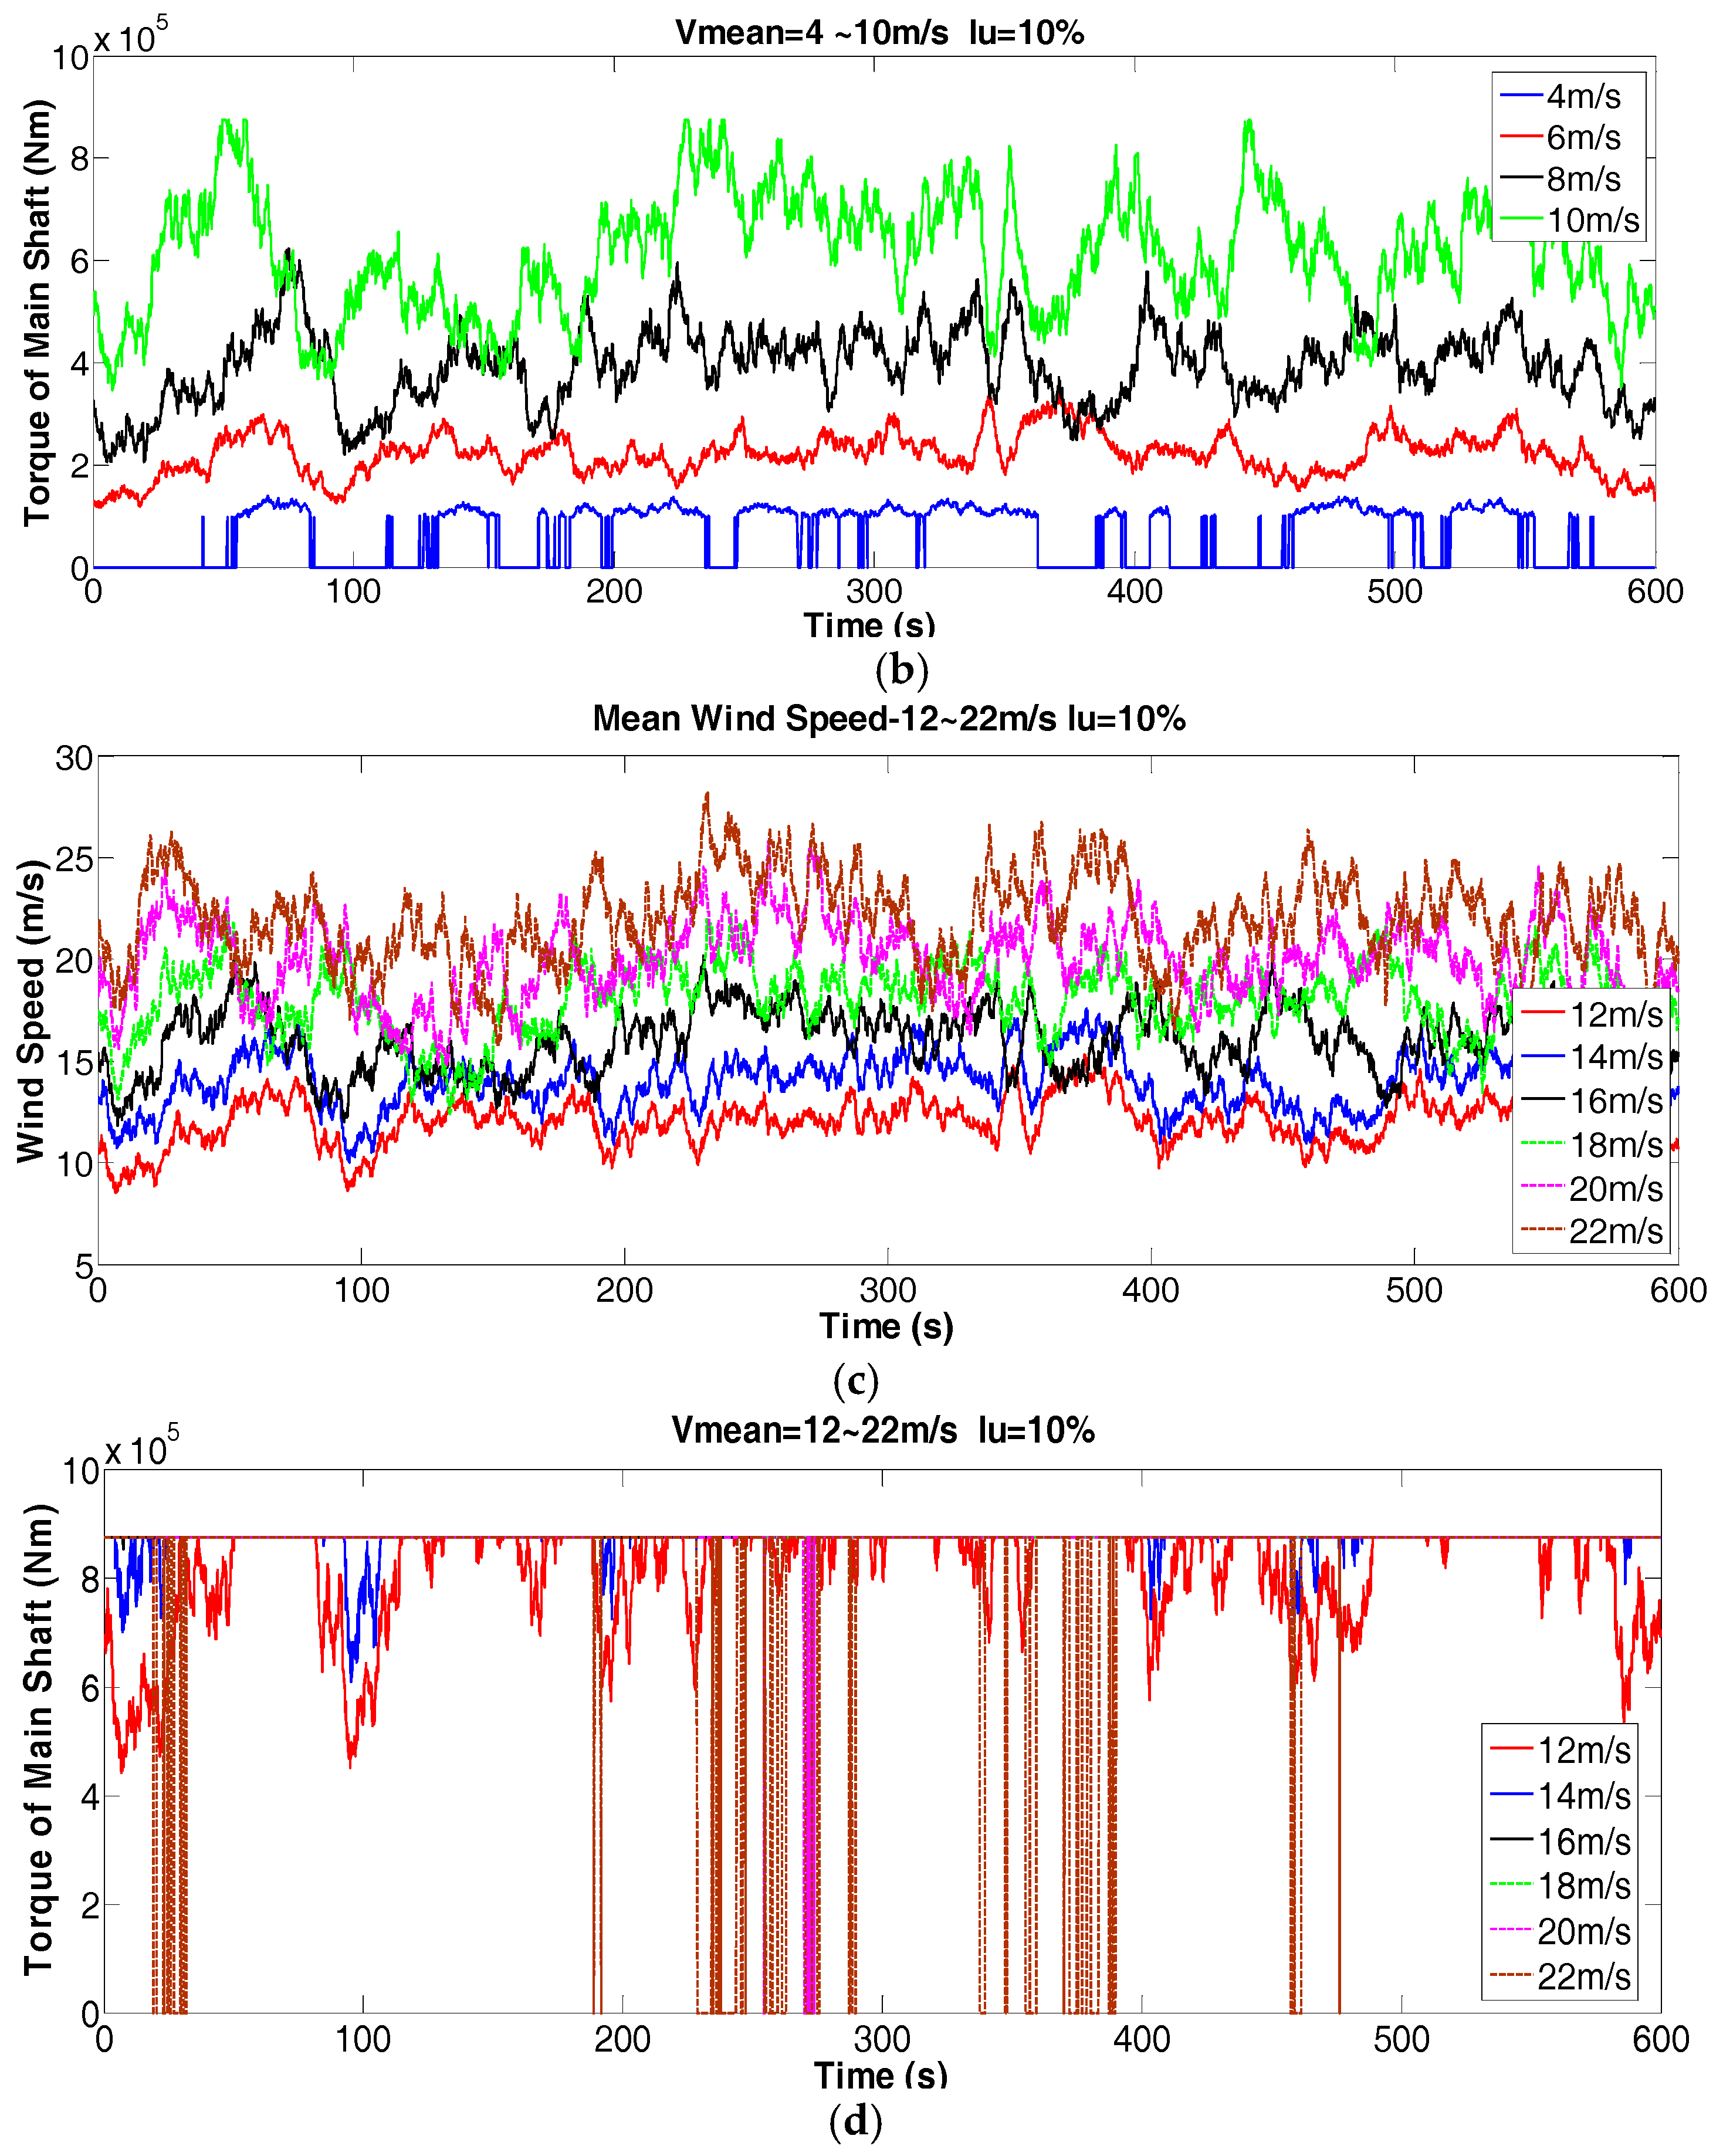
Figure 6b shows its variation under wind speeds from 10 to 22 m/s (above the rated wind speed range). When the wind speed is below the rated range, the WT controls the rotational speed to maintain maximum output power. When the wind speed is above the rated range, the WT controls the blade pitch angle to maintain constant output power. Therefore, when the wind speed is above the rated range as shown in
Figure 6a,b, the torques’ magnitudes are maintained due to the constant output power and rotational speed under the WT’s constant speed control mode. However, there are sudden drops of torque magnitudes for the high mean wind speed condition which is when the wind speed is above the cut-out range, as shown in
Figure 6c,d. Under this situation, the WT stops operating.
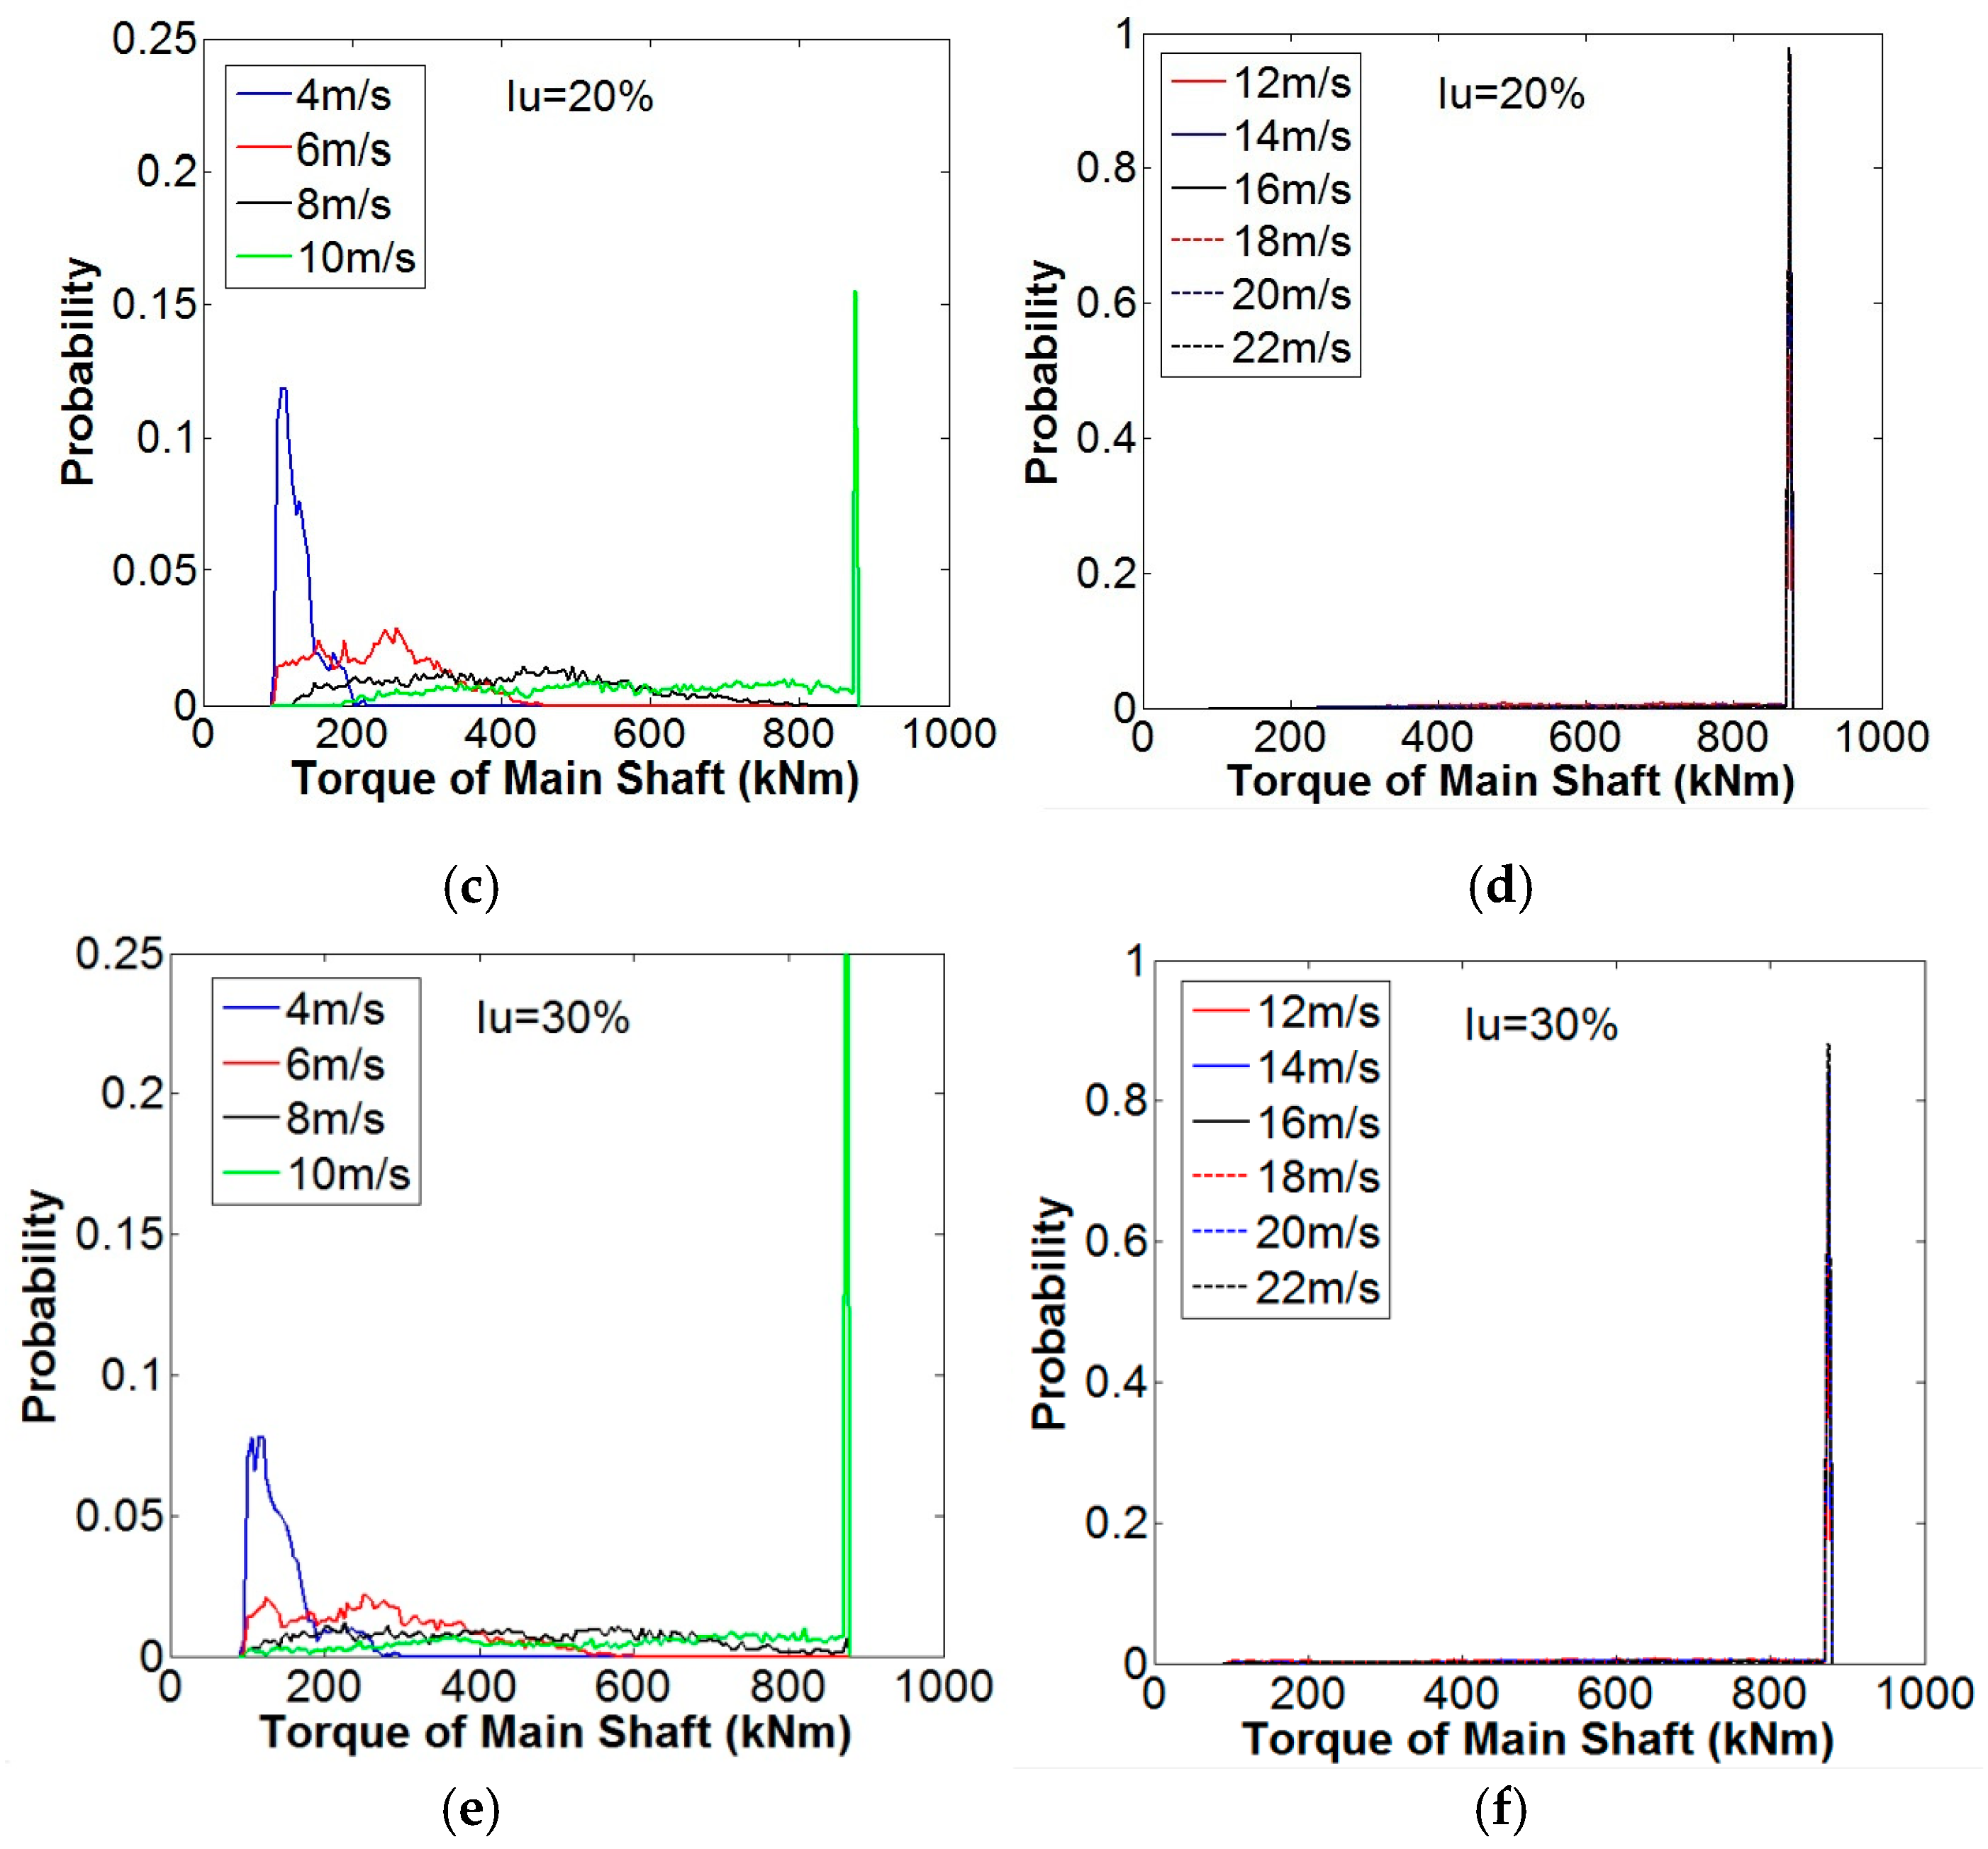
Figure 7 shows the statistical result of the main shaft torque for varying mean wind speed and wind turbulence intensity. It shows that when the mean wind speed is below the rated range the main shaft torque values increase with the increase of mean wind speed. When the wind turbulence intensity increases the main shaft torques’ variation magnitudes increase, while when the mean wind speed is above the rated range, the main shaft torques remain constant.
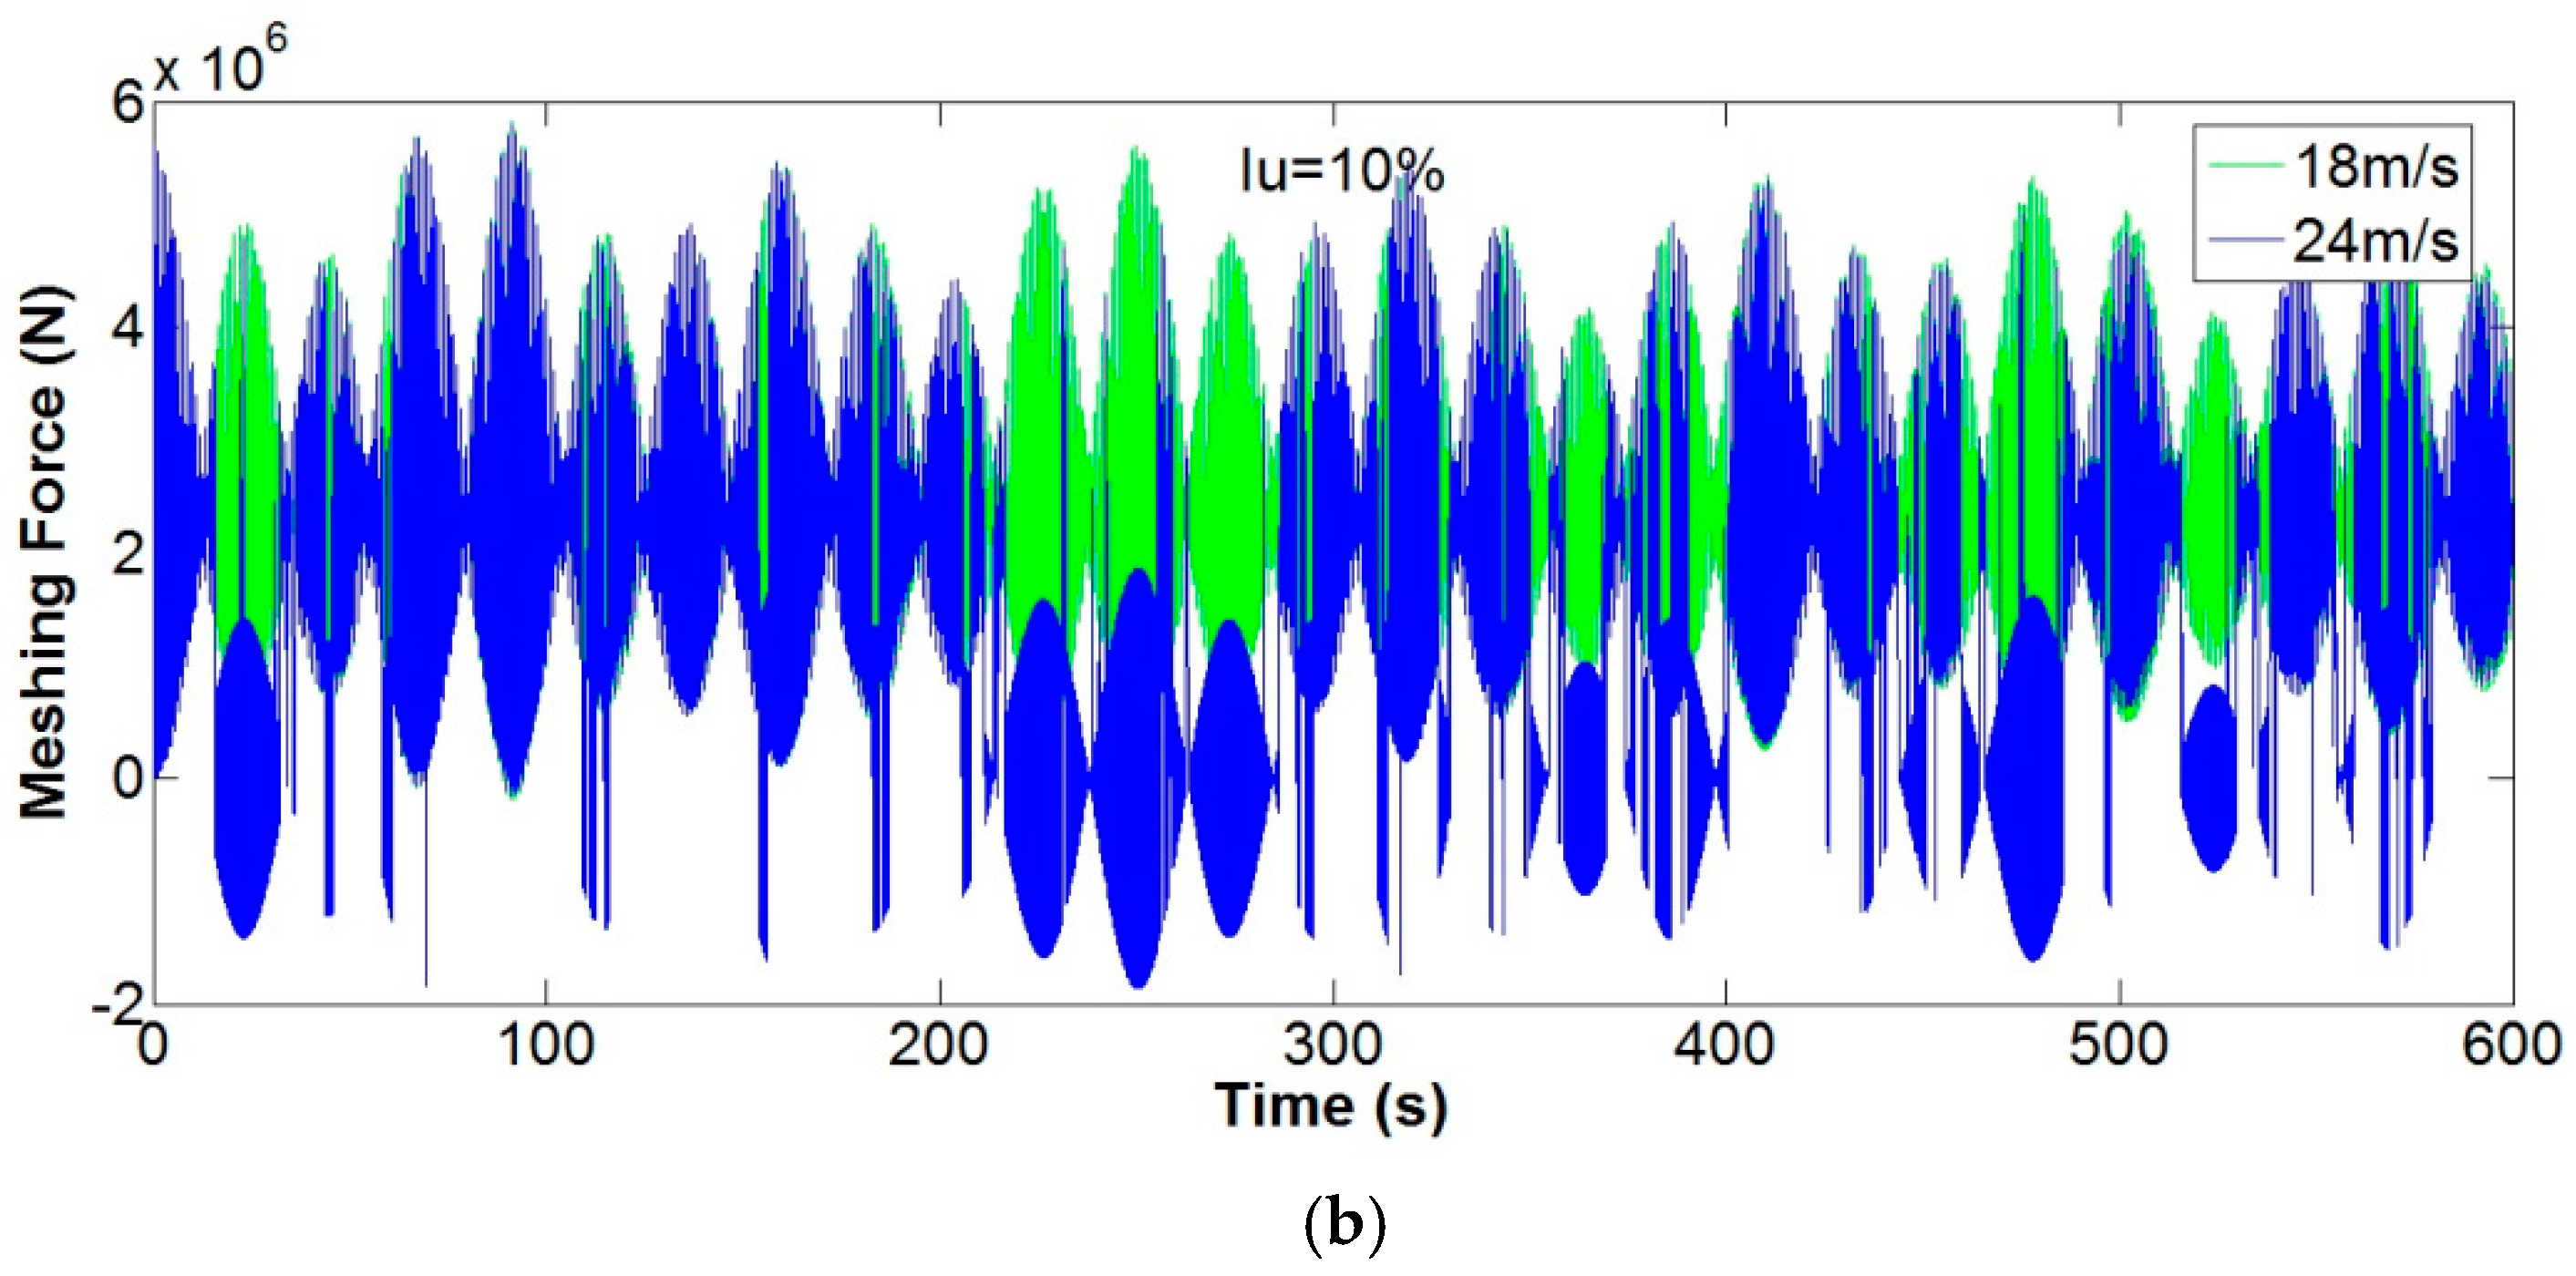
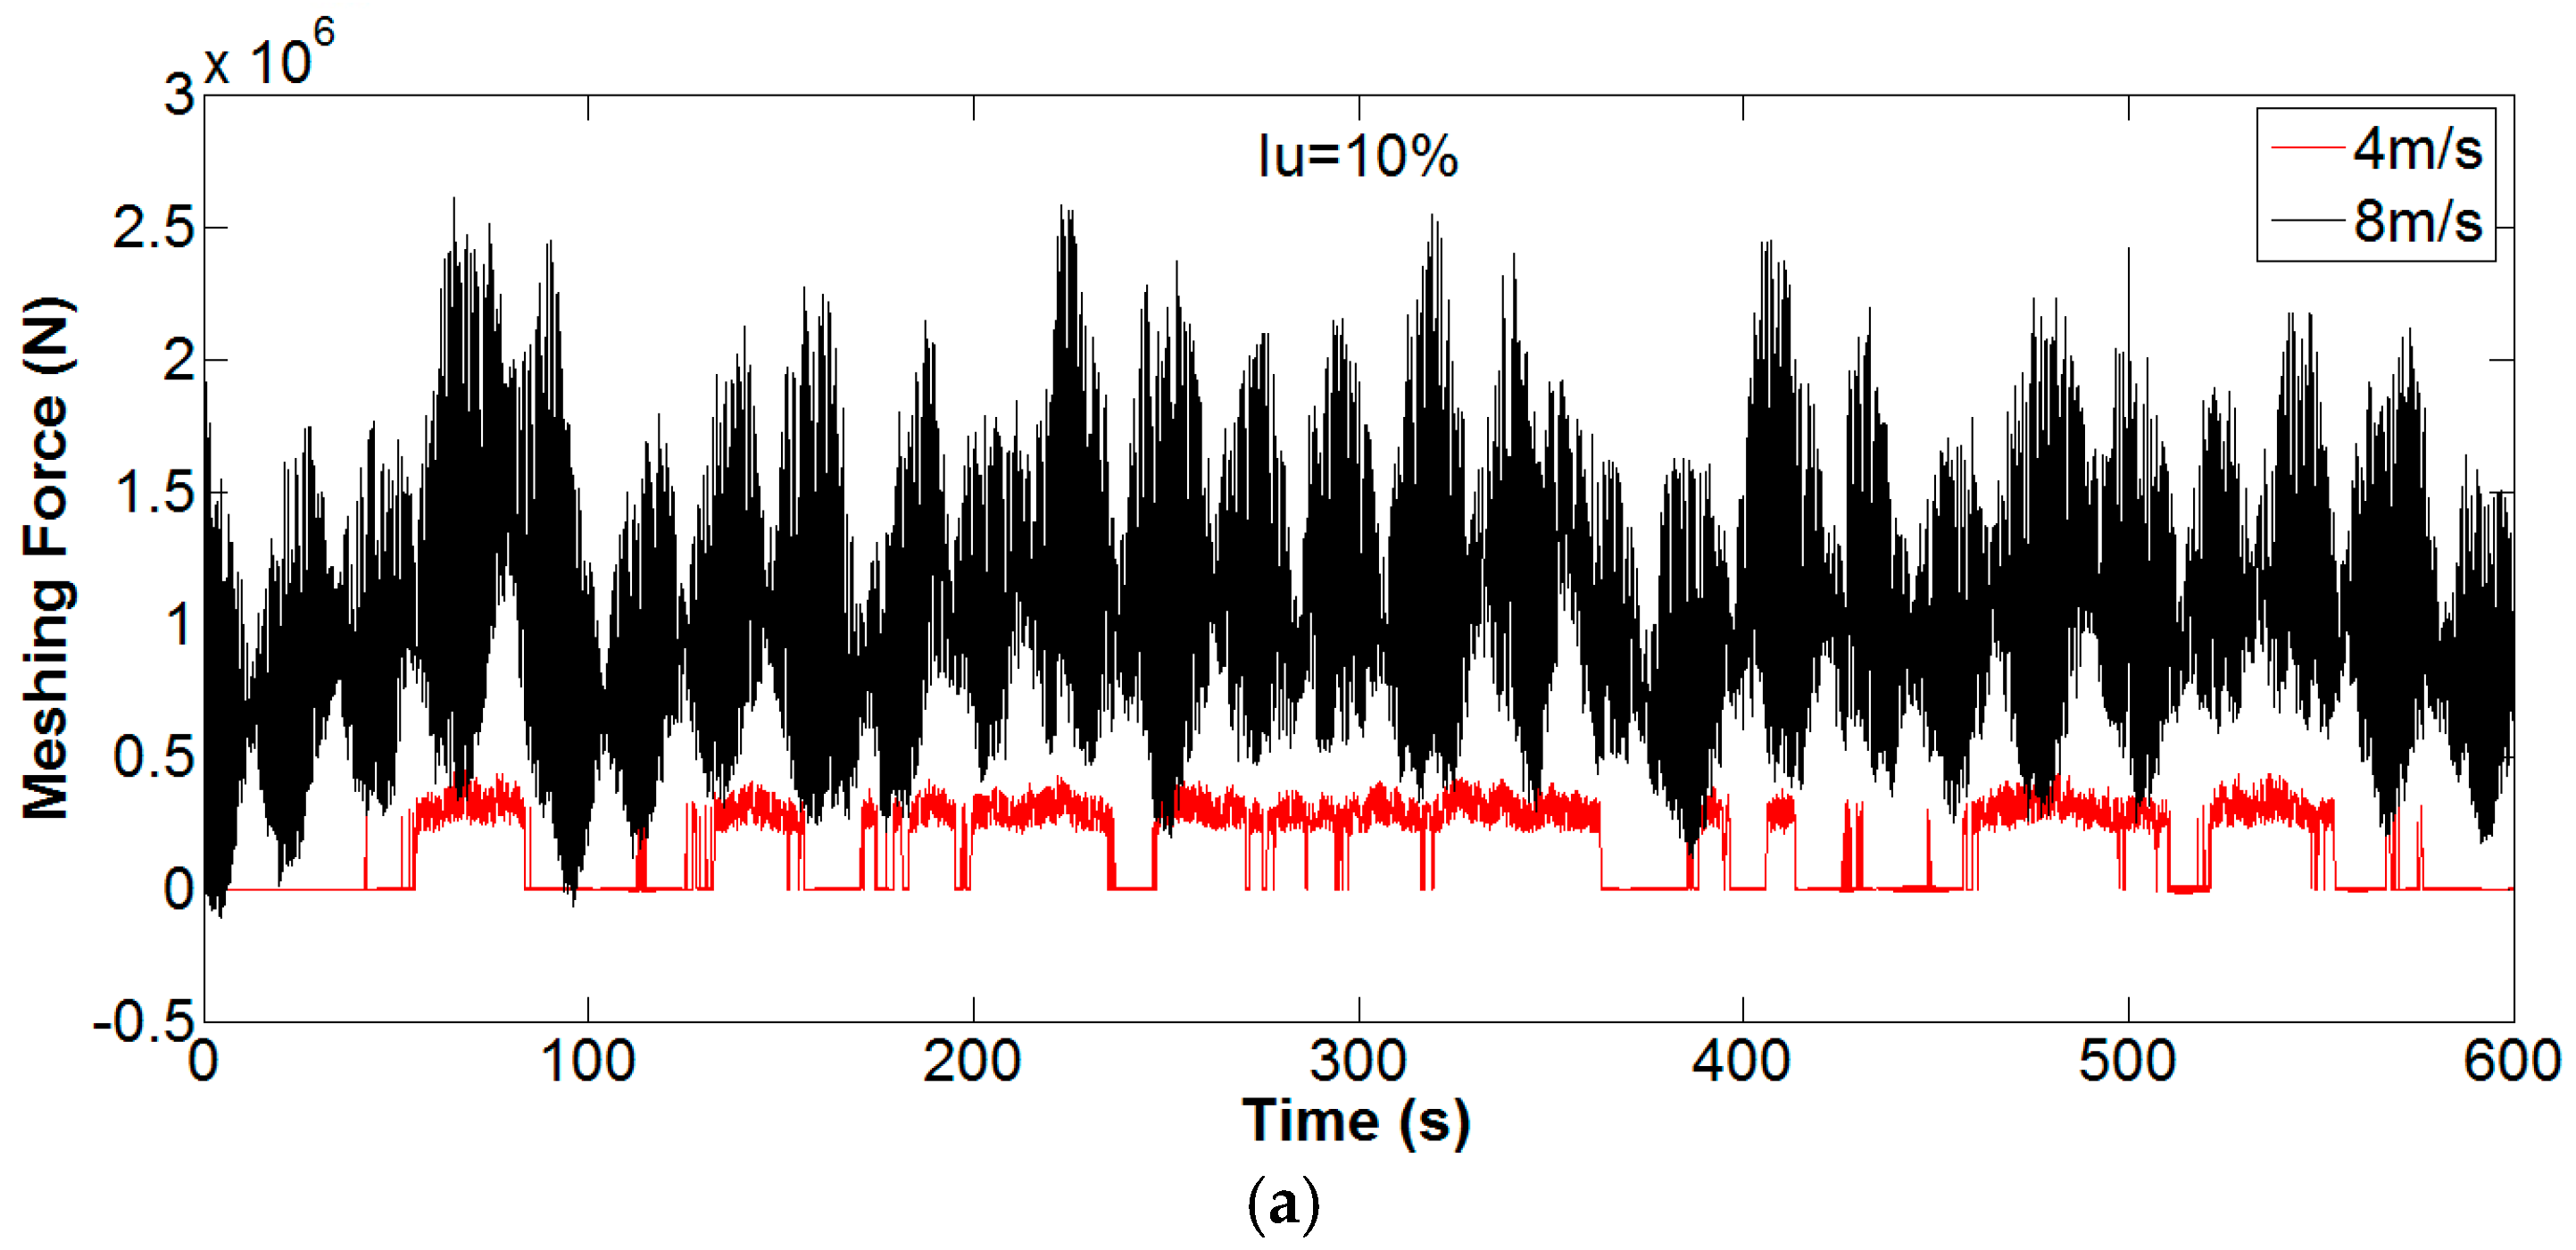
The meshing force and bending stress between the planetary gear and sun gear calculated by the multi-body dynamics model of the gearbox are shown in
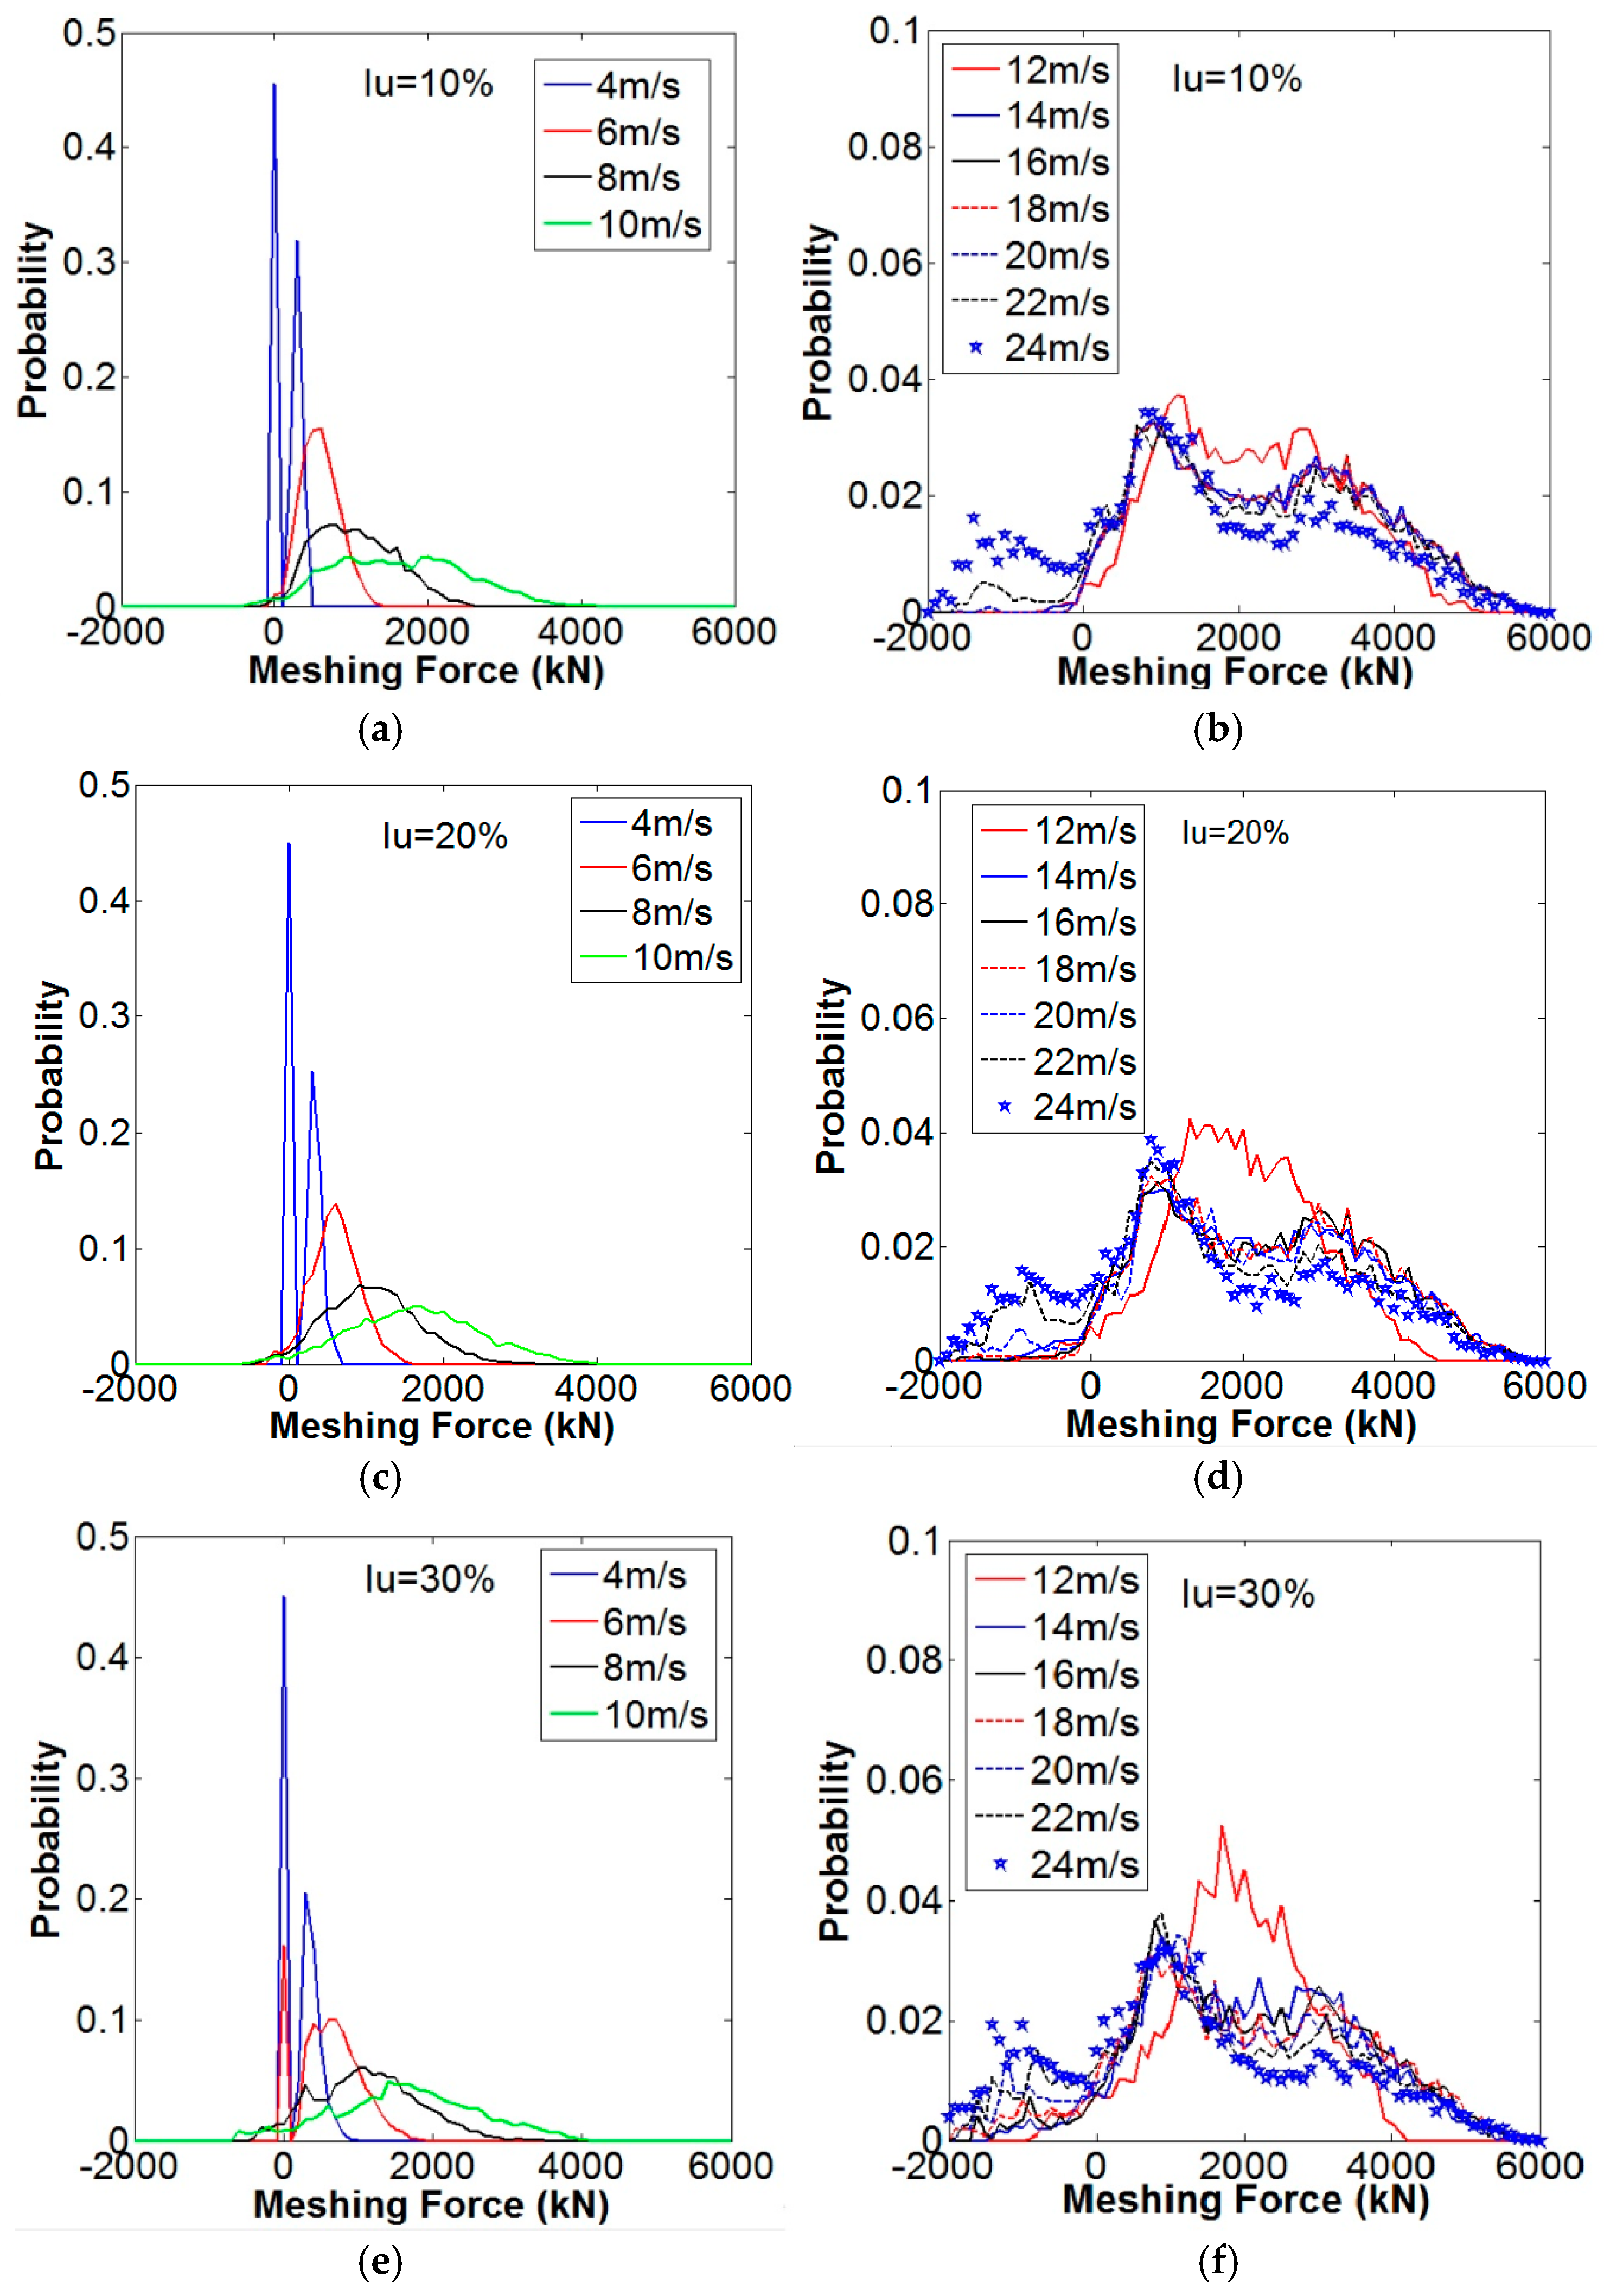
Figure 8. The results of two cases are shown individually for wind speeds below and above the rated range. It shows that due to the gear meshing process, the meshing force exhibits obvious periodical features. The mean meshing force increases when the wind speed is below the rated range while it remains constant when the wind speed is above the rated range. The variation amplitude of meshing forces are higher for wind speeds above the rated range compared to the case where the wind speed is below the rated range. Its statistical results, as shown in
Figure 9, indicate that with the increases of turbulence intensities the meshing force variation covers a wider range at the below rated wind speed range while they exhibit a similar distribution at above the rated wind speed range. The negative meshing forces observed in
Figure 8 and
Figure 9 are due to the force direction variation.
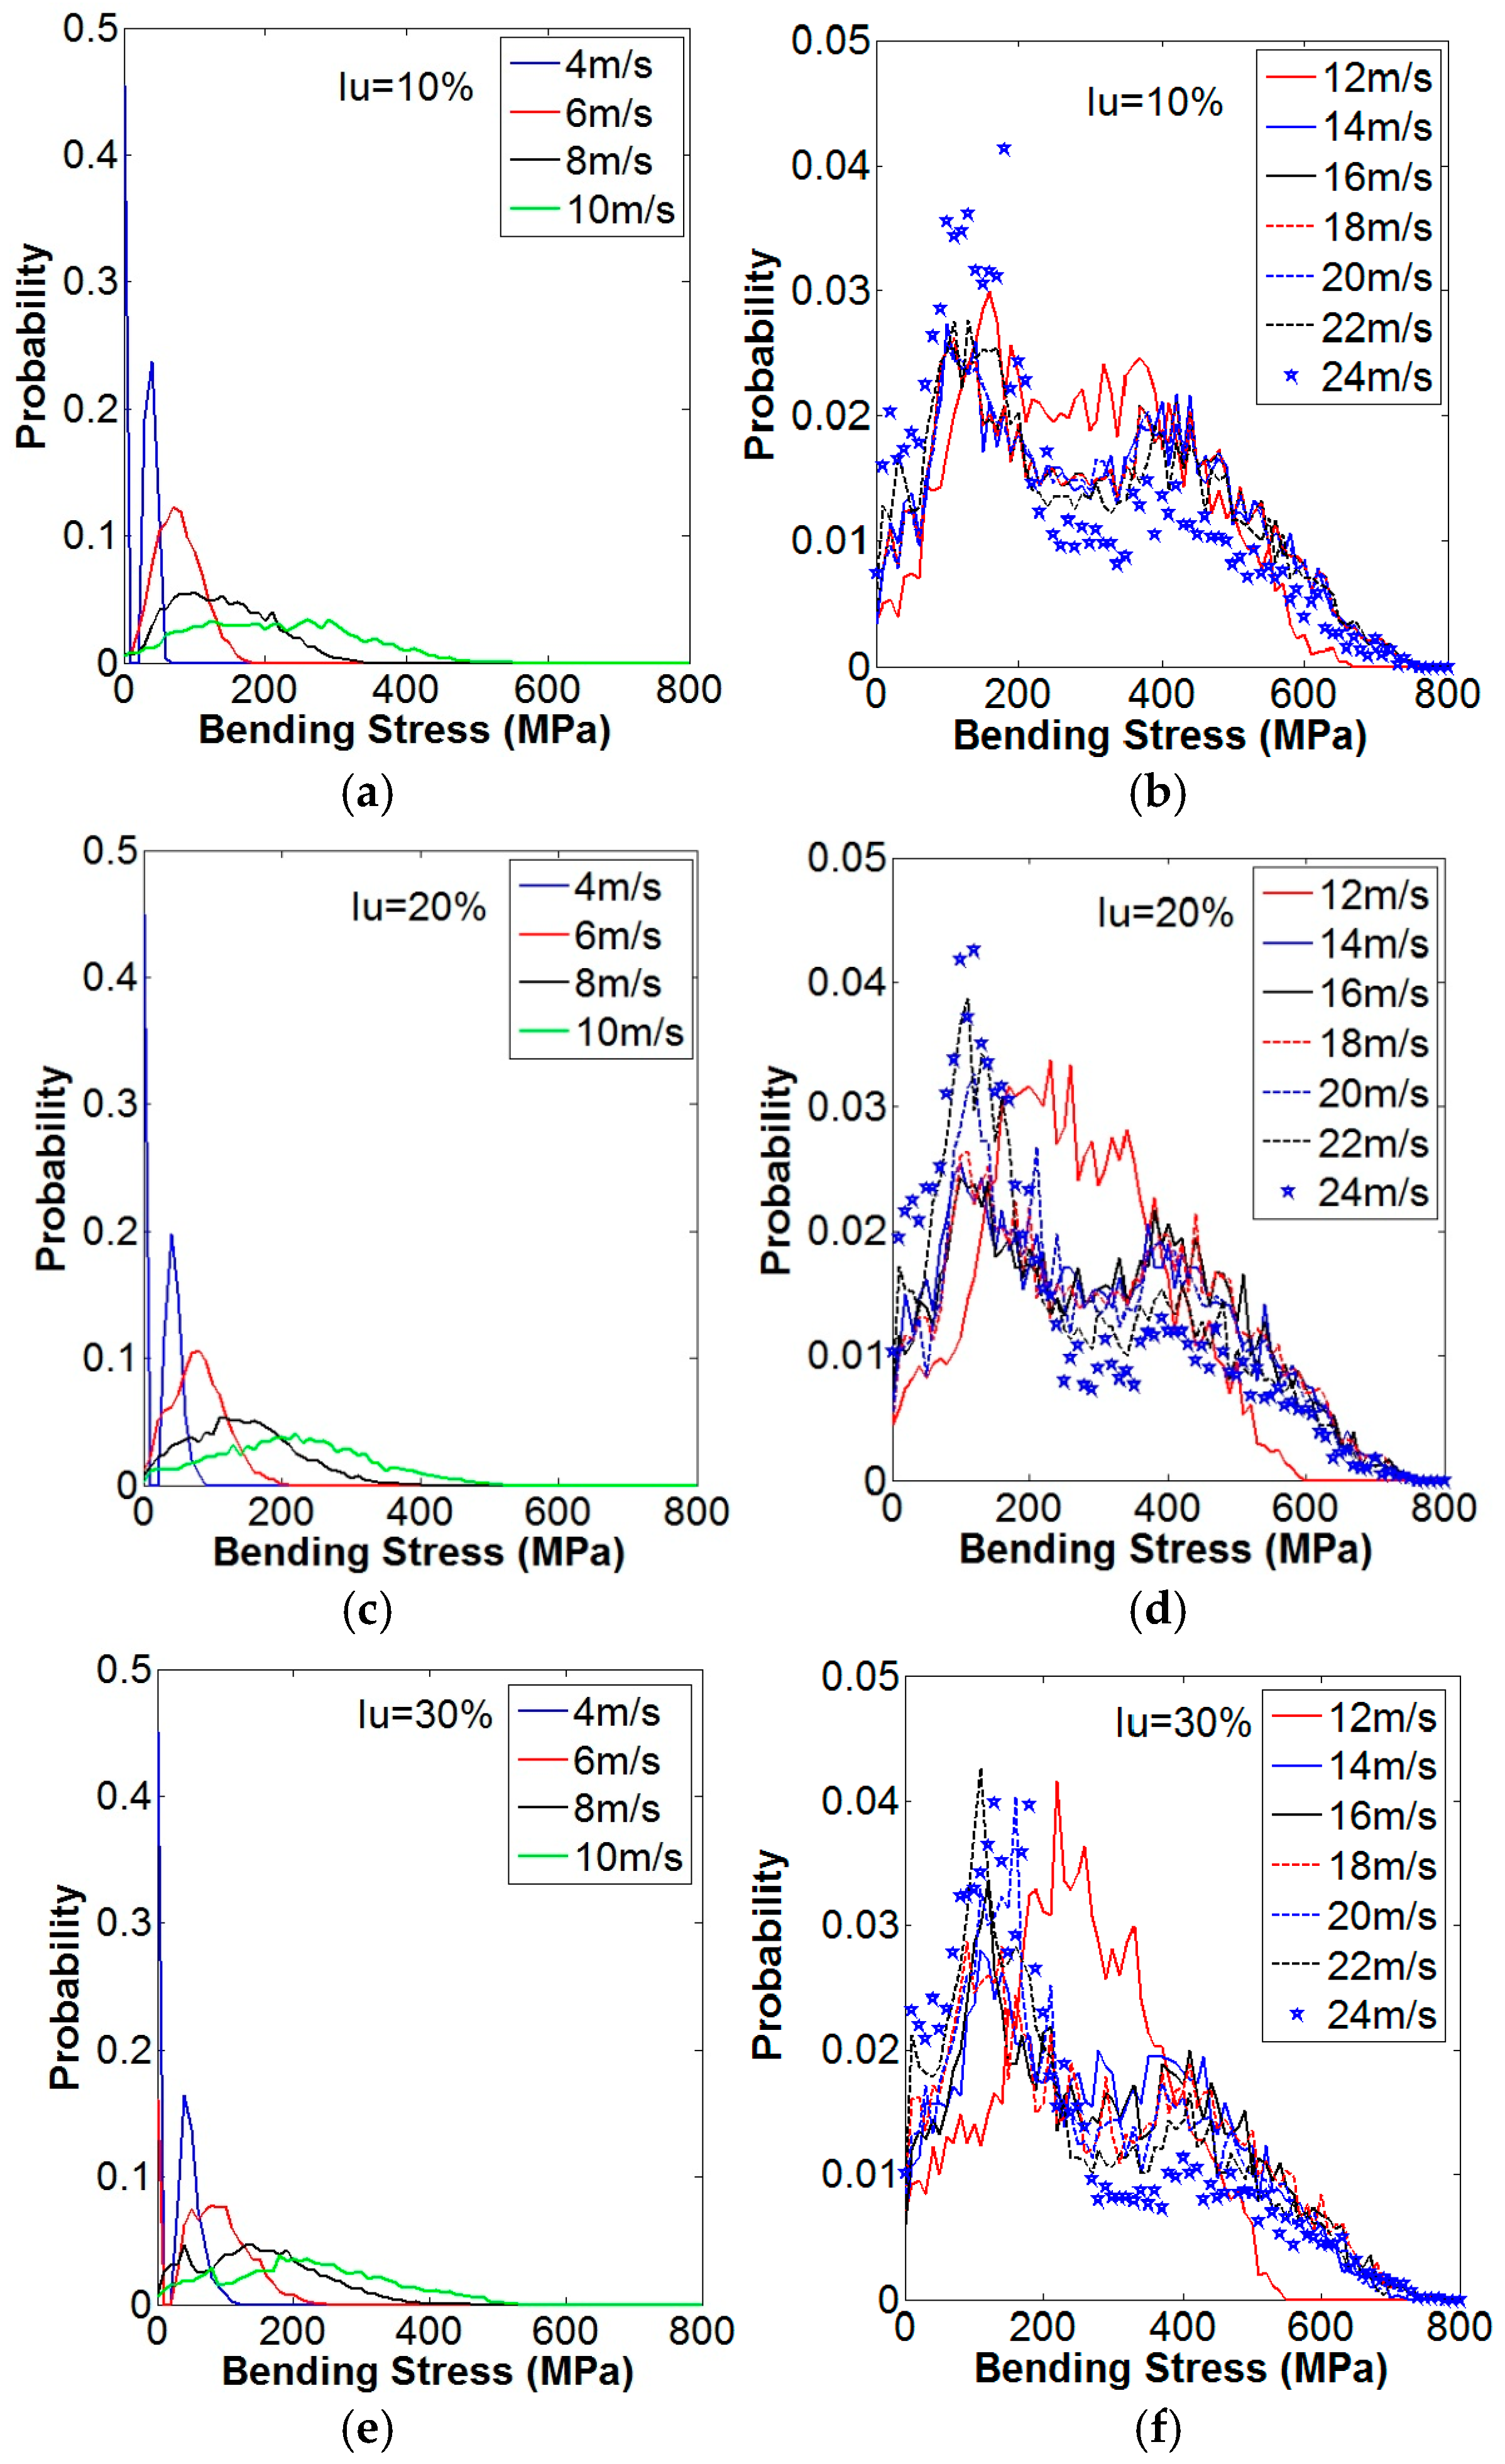
The calculated bending stress of the sun gear is shown in
Figure 10. This bending stress shows a similar variation of meshing force as observed in
Figure 9.
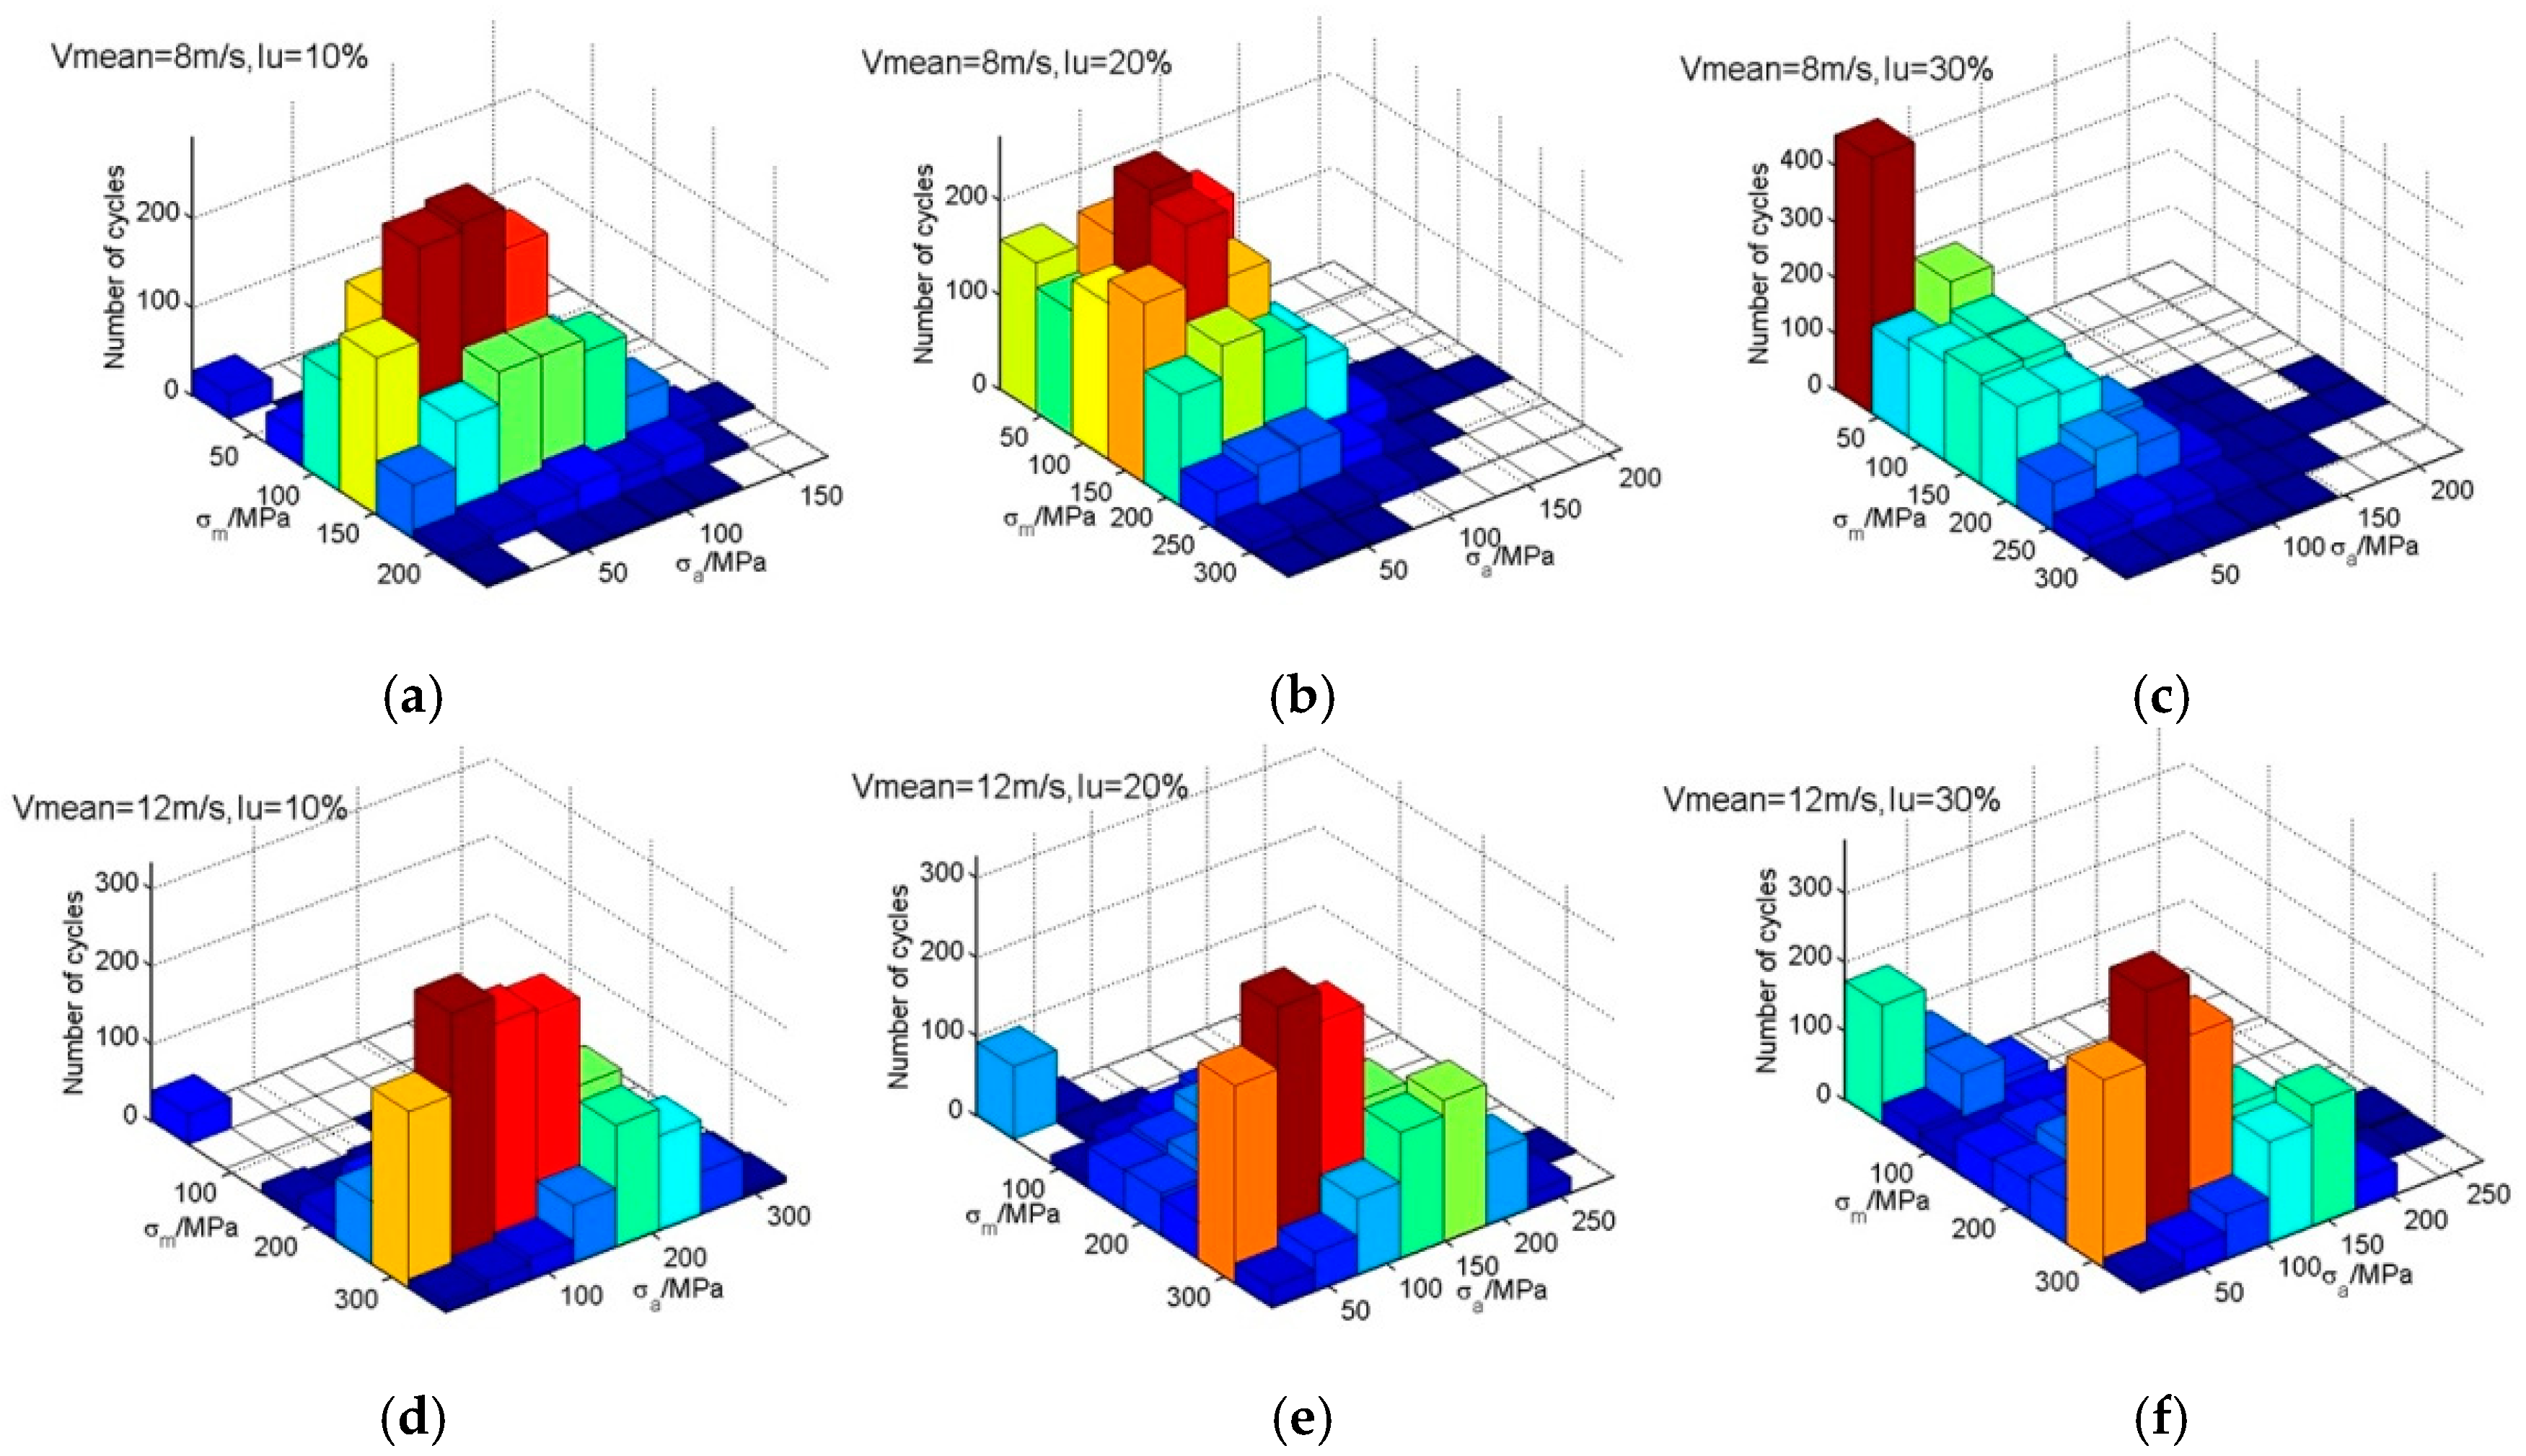
Figure 11 shows the rain-flow counting results of mean wind speeds of 8 and 12 m/s. It shows that for mean wind speeds of 8 and 12 m/s the mean and amplitude of the bending stress between the planetary gear and sun gear are both in the range of 0–300 MPa. Bending stress is the main cause of gearbox fatigue damage.
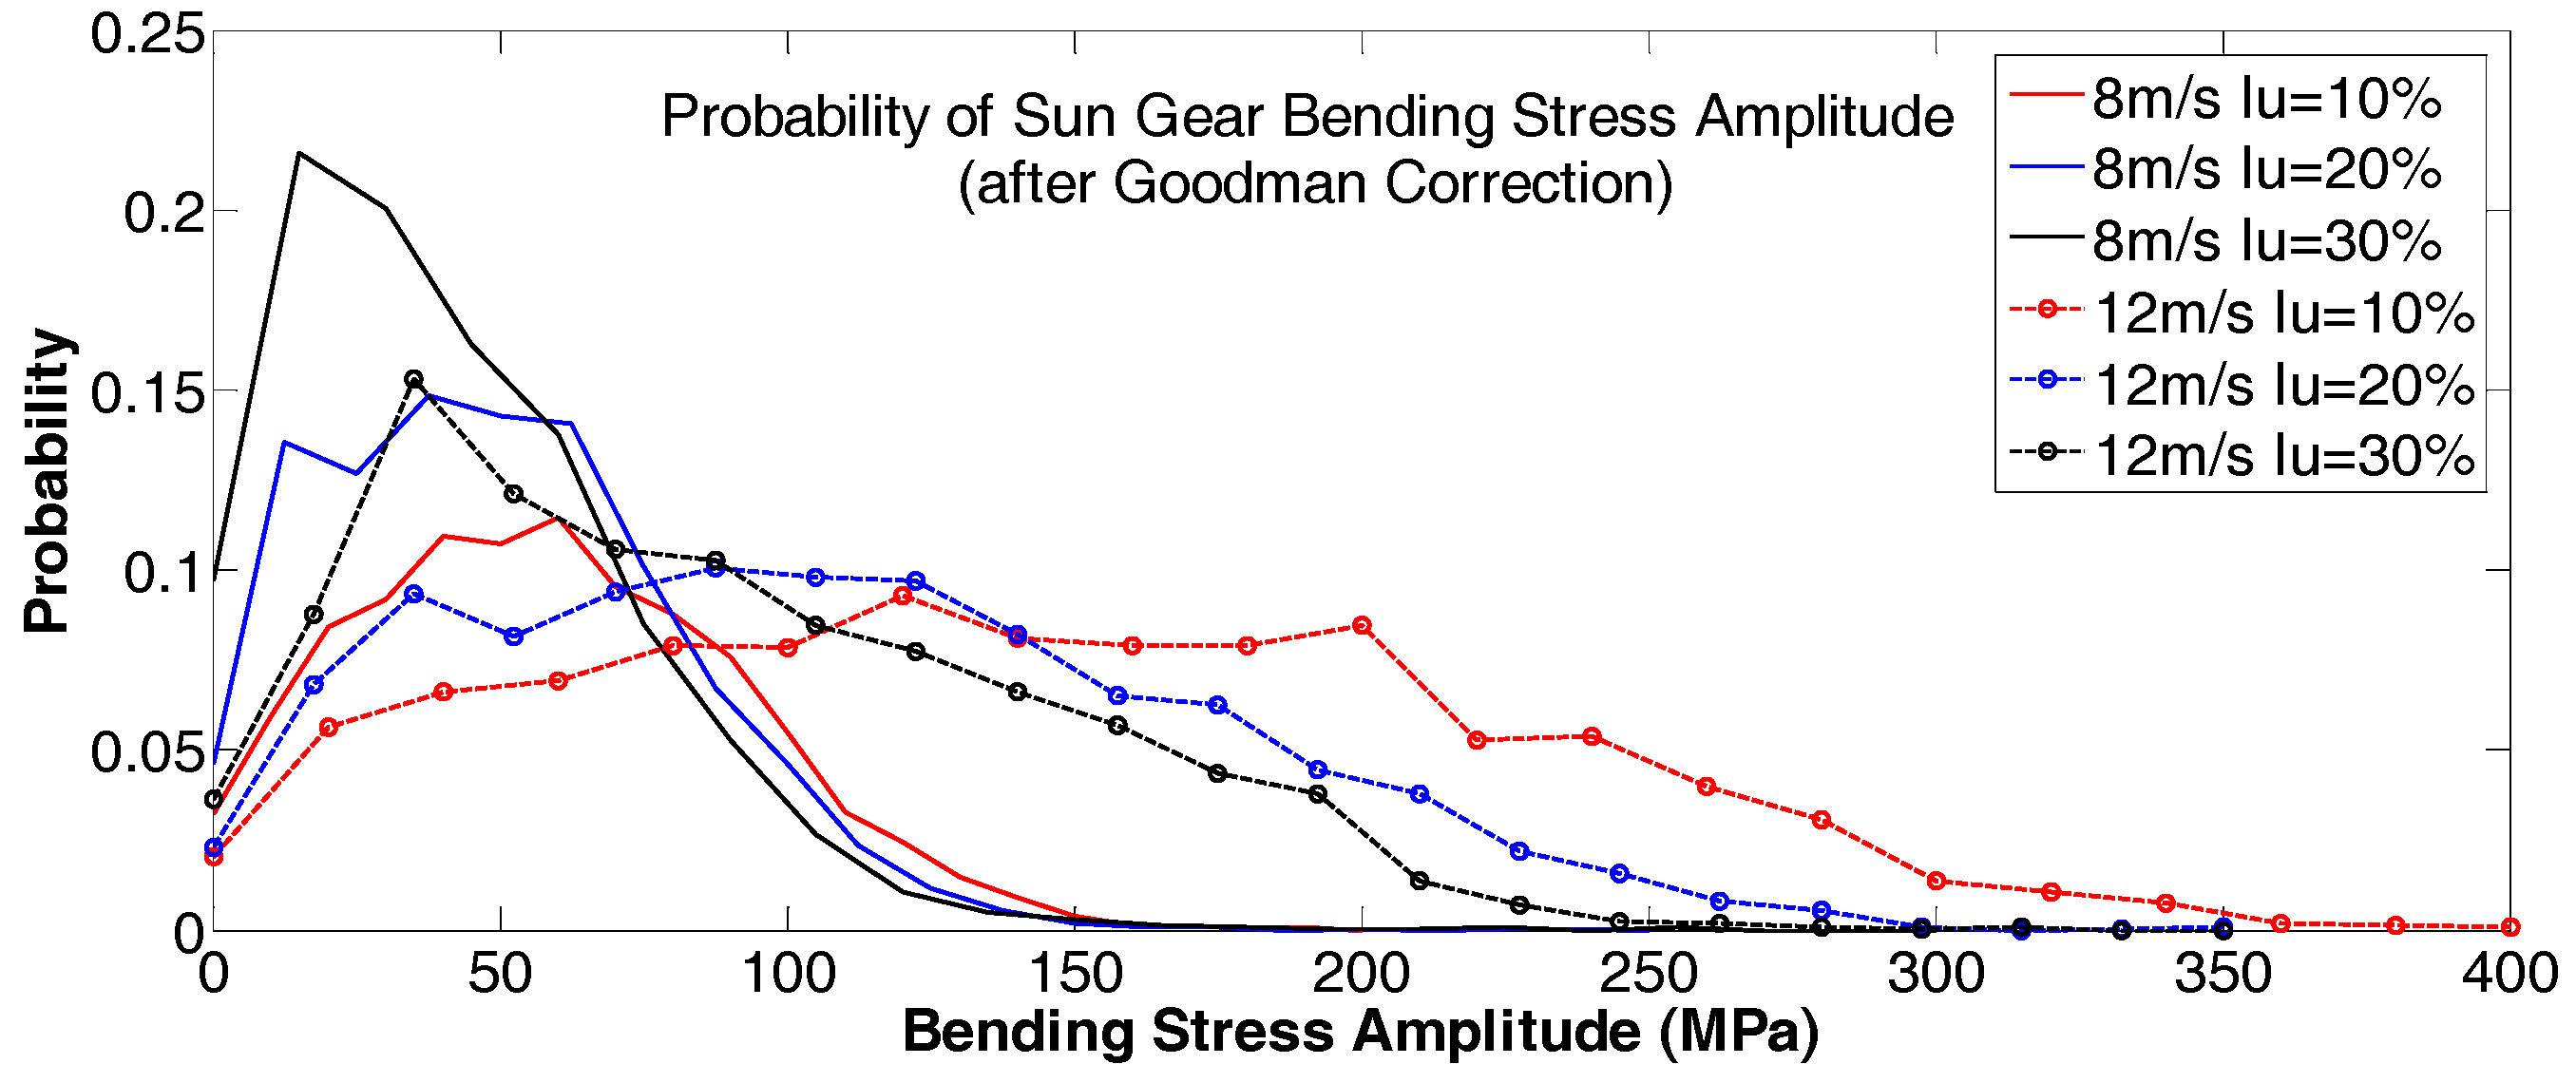
Figure 12 shows the probability of the sun gear’s bending stress amplitude after Goodman correction. It shows that the probability of large bending stress amplitudes decrease with the increase of wind turbulence intensities. With the increase of mean wind speed (
v = 12 m/s) an increase of probability of the large bending stress amplitudes is observed.
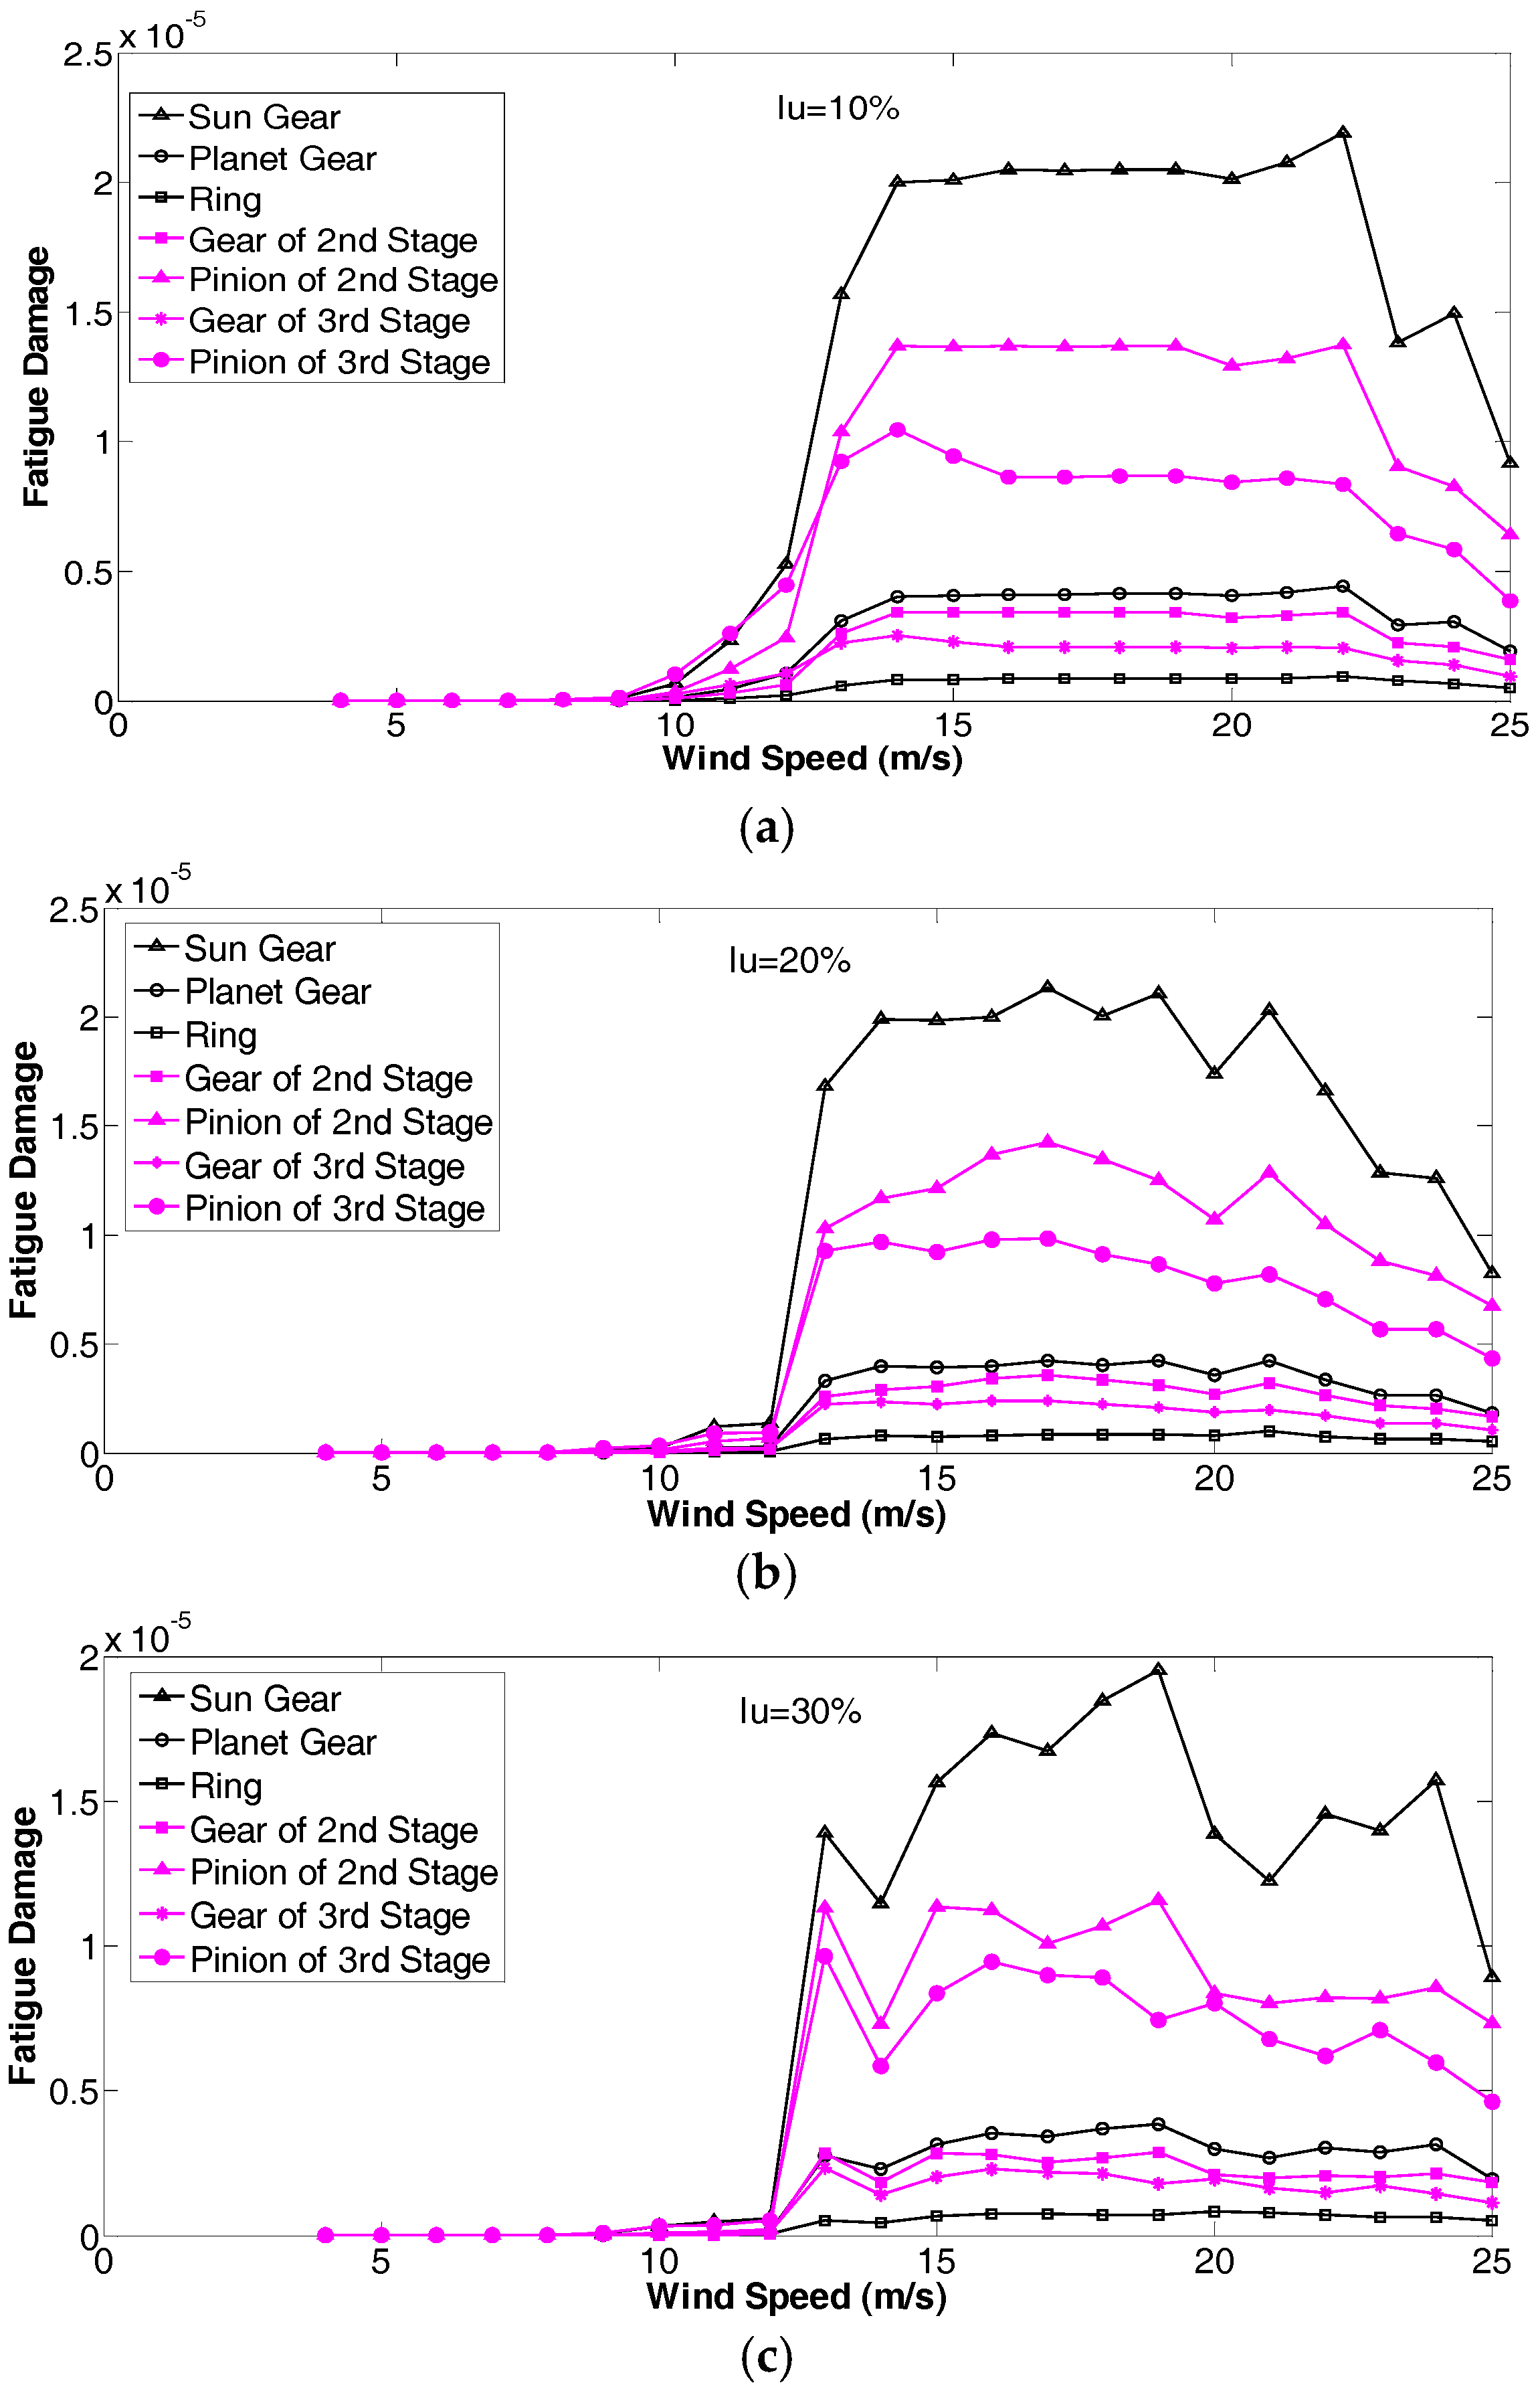
Figure 13 shows the calculated result of gearbox fatigue damage under stochastic external excitation within 10 min. In each subfigures it shows the damage quantification result for the same turbulence scale with mean wind speeds ranging from 4 to 25 m/s. It is observed that the most vulnerable part within a gearbox is the sun gear, which shows greater damage than other components under the same conditions. For the second and third stages of a WT gearbox, the pinions are more vulnerable than gears. The results show significant differences in short-term fatigue damage at different gearbox stages for the case of mean wind speeds above 10 m/s in 10 min. The fatigue damage of different gearbox stages increases with the increase of wind turbulence scale while their tendencies are similar. A sharp increase of damage occurs when the wind speeds are above the rated range, which is due to the increased probability of the bending stress amplitude (in
Figure 12) which comes from large bending stress variation amplitude (in
Figure 10).
The sun gear damage is larger than that of the other parts, which is due to its large torque as a result of the low rotational speed compared to the gears at High Speed Intermidiate Stage (HSIS) and High Speed Stage (HSS). Therefore the force in the planetary stage is larger than in the other parts. There are also three contact points in a sun gear (contacts with the three planetary gears), therefore it has a higher damage risk than the planetary gears. To further investigate sun gear fatigue damage variation tendency under different external environments,
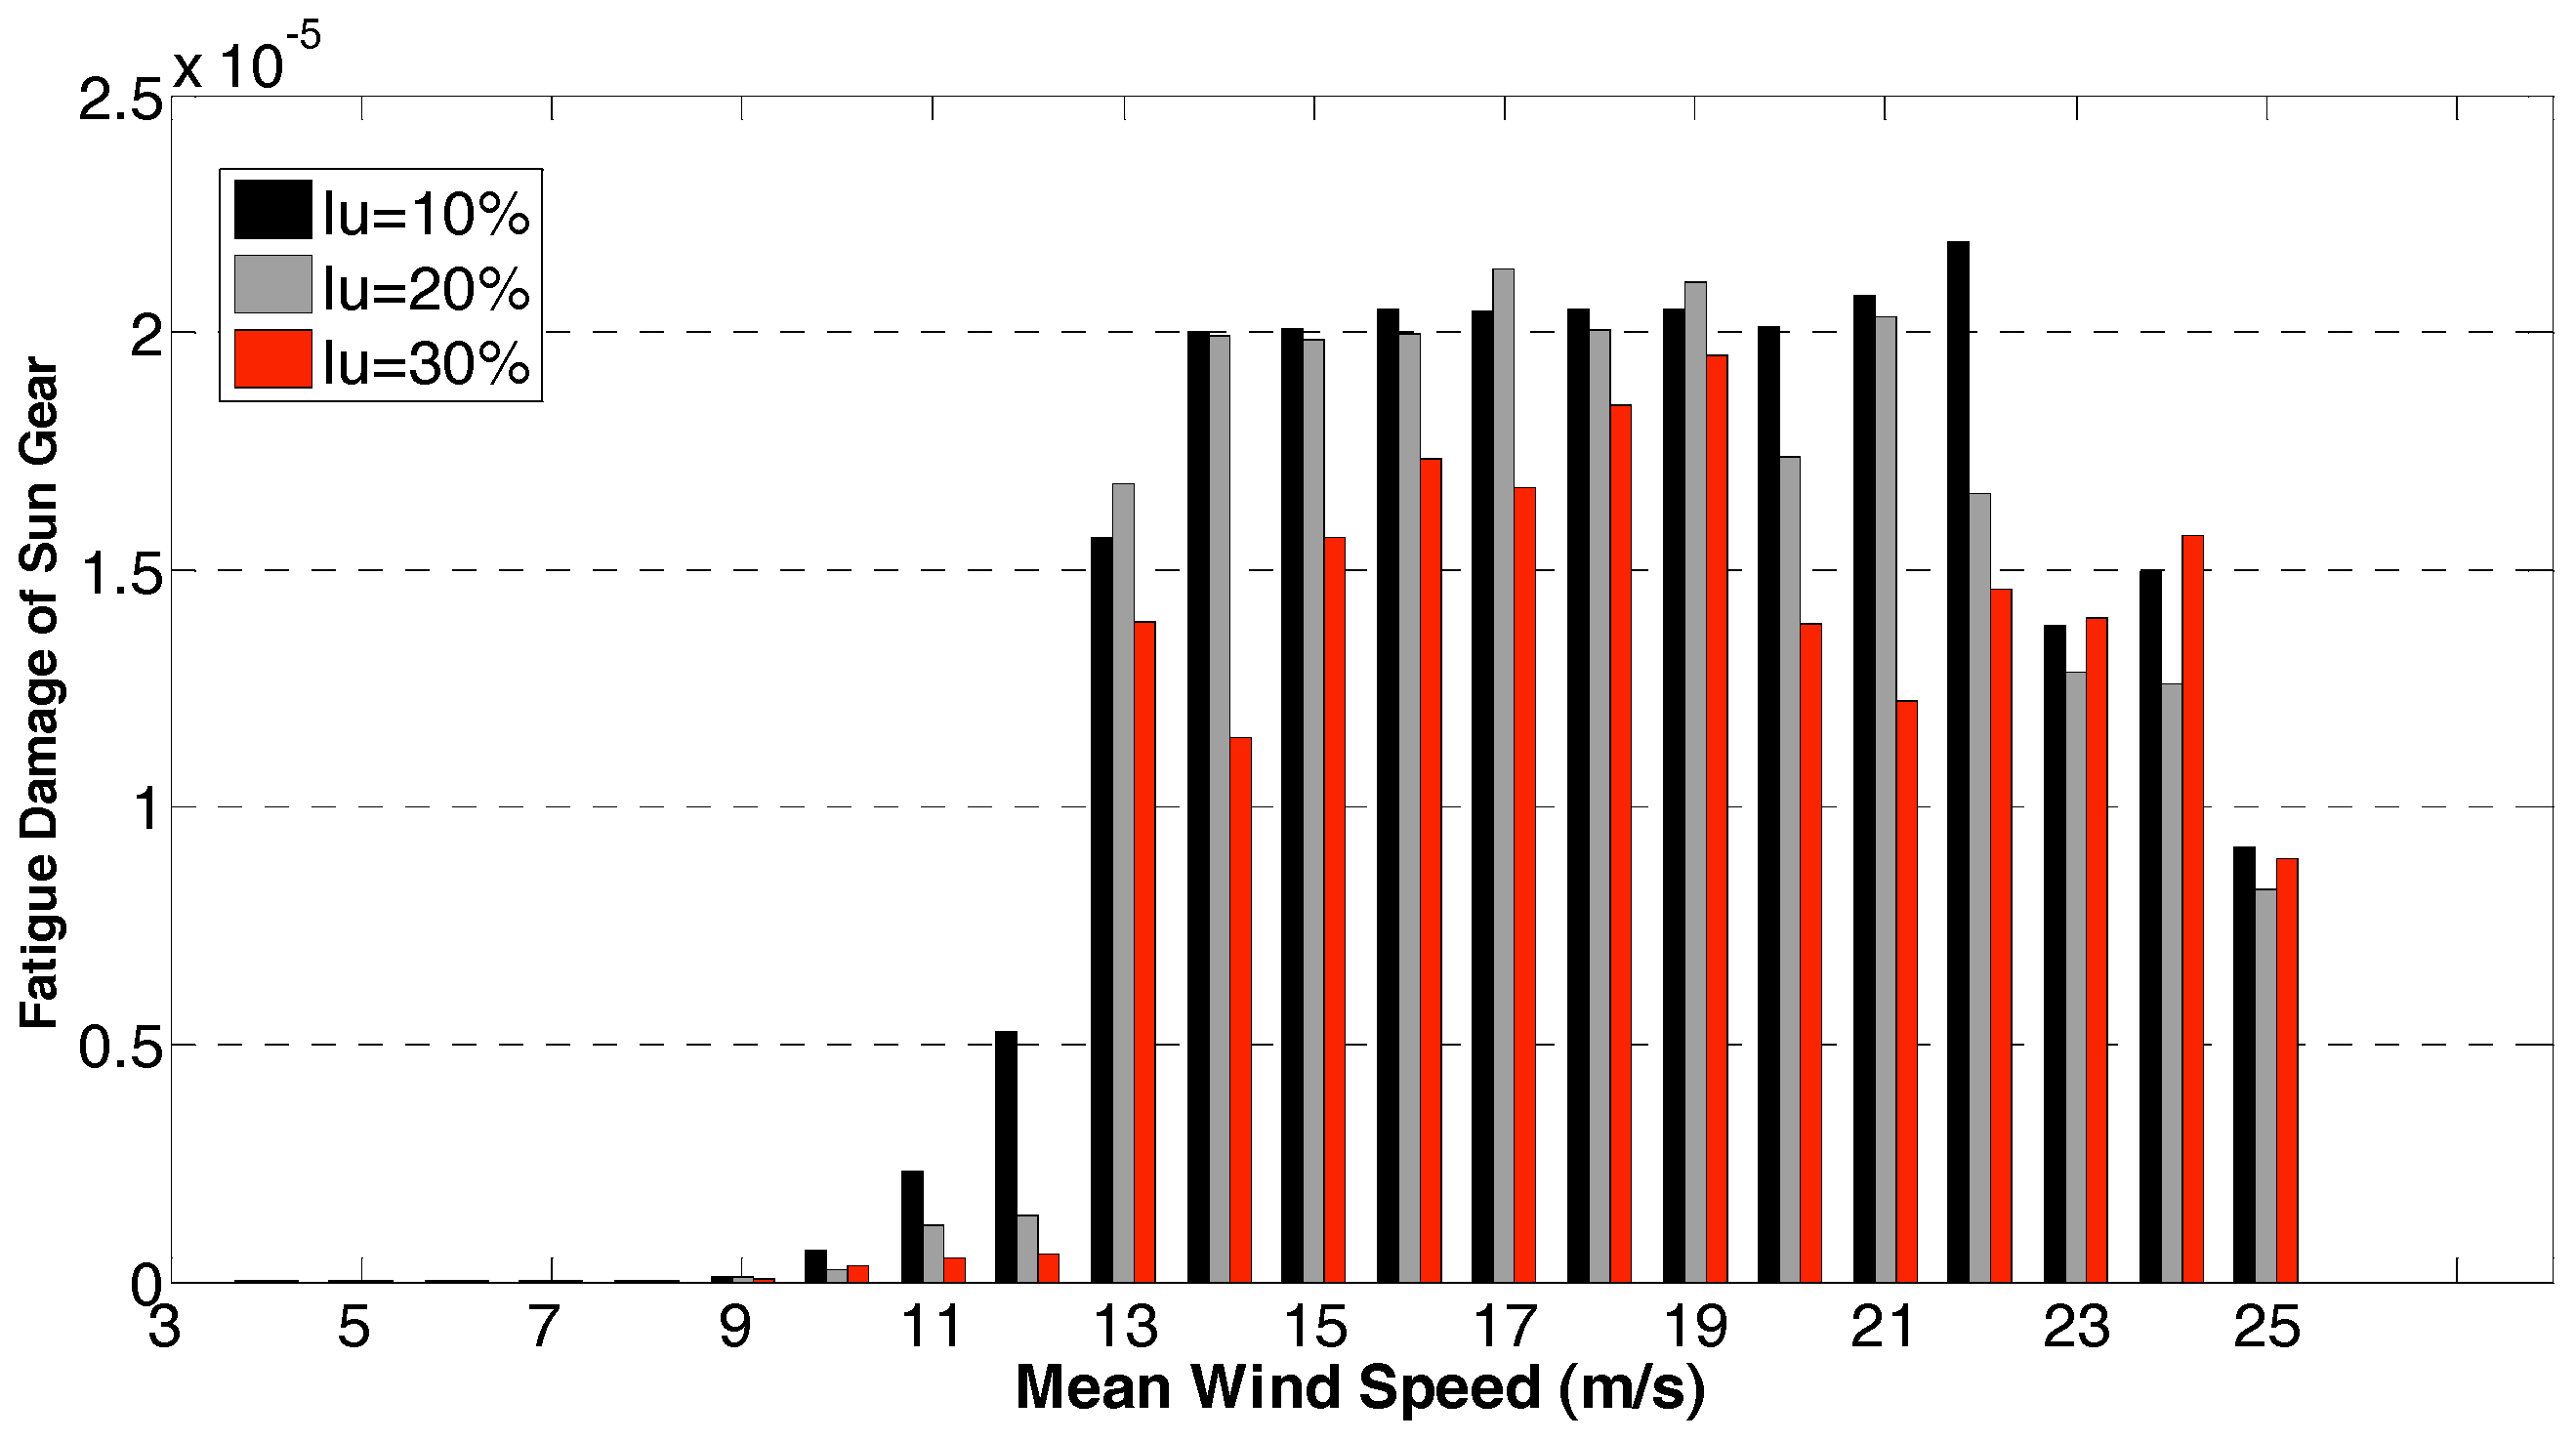
Figure 14 shows the calculation result for a sun gear when the mean wind speeds range from 4 m/s to 25 m/s and with turbulences changing from 10% to 30%. It is observed that when the mean wind speed is above 13 m/s, the fatigue damage increases quickly compared to the case of wind speed below the rated range. The magnitude of the fatigue damage is maintained for wind speeds above 13 m/s. and the damage starts to decrease when the mean wind speed is approaching 25 m/s. The damage variation tendencies for different turbulent scales are observed to be similar.
From
Figure 14, it is also observed that damages to the sun gear due to wind speeds with 30% turbulence intensity are lower compared to the cases with 10% and 20% turbulence intensity. The reason for this can be explained by
Figure 11 and
Figure 12. Wind turbulences of 10% or 20% at wind speeds above the rated range cause a high probability of large mean bending stress and also large bending stress amplitude. These lead to further high stress cycles of large bending stress amplitude after Goodman correction, which results in significant damage to the gear, while for the case of wind speeds with 30% wind turbulence, the probability of appearance of large bending stress amplitudes is low which is due to the WT shutting down because the wind speeds are out of the operational range, that is either lower than the cut-in wind speed or higher than the cut-out wind speed. Essentially high bending stresses amplitude have more significant impact on fatigue damage than low bending stress amplitude. Therefore, 10% or 20% wind turbulences lead to higher sun gear damage than 30% wind turbulence. However, it should be pointed out that the result obtained here is by assuming that the WT has an instantaneous response to external excitation (wind speed variation). Lags in response of WT to transient wind speed variations may potentially expose the machine to high amplitude transient loads or bending stresses that may increase its damage risk. This transient effect is not considered in this paper and is a topic that may be worthy of future research.
6. Using SCADA Data for Long Term Damage Quantification
As shown in the previous sections, short-term damage is calculated by defining an average wind speed and turbulence intensity and simulation of gearbox dynamics. WT SCADA data is characterized by its low data sampling rates whereby only the average wind speed and the maximum, and minimum wind speed in ten minutes are recoded. Therefore, a statistical method is used to estimate the standard deviation of ten minutes’ wind speed and then the turbulence intensity. The equation below is used [
35]:
Wind speed data within the ten minutes being considered are taken as a sample data set with known mean, maximum and minimum values to derive the standard variation. Equation (17) is derived by transforming the median wind speed into mean wind speed referring to the formula given in [
32]. Therefore, mean wind speed and turbulence intensity are two necessary parameters for short term gearbox damage prediction, which can be calculated as shown in the previous sections. Long-term damages are quantified by summing up subsequent 10 min short-term damages which is illustrated in
Figure 15.
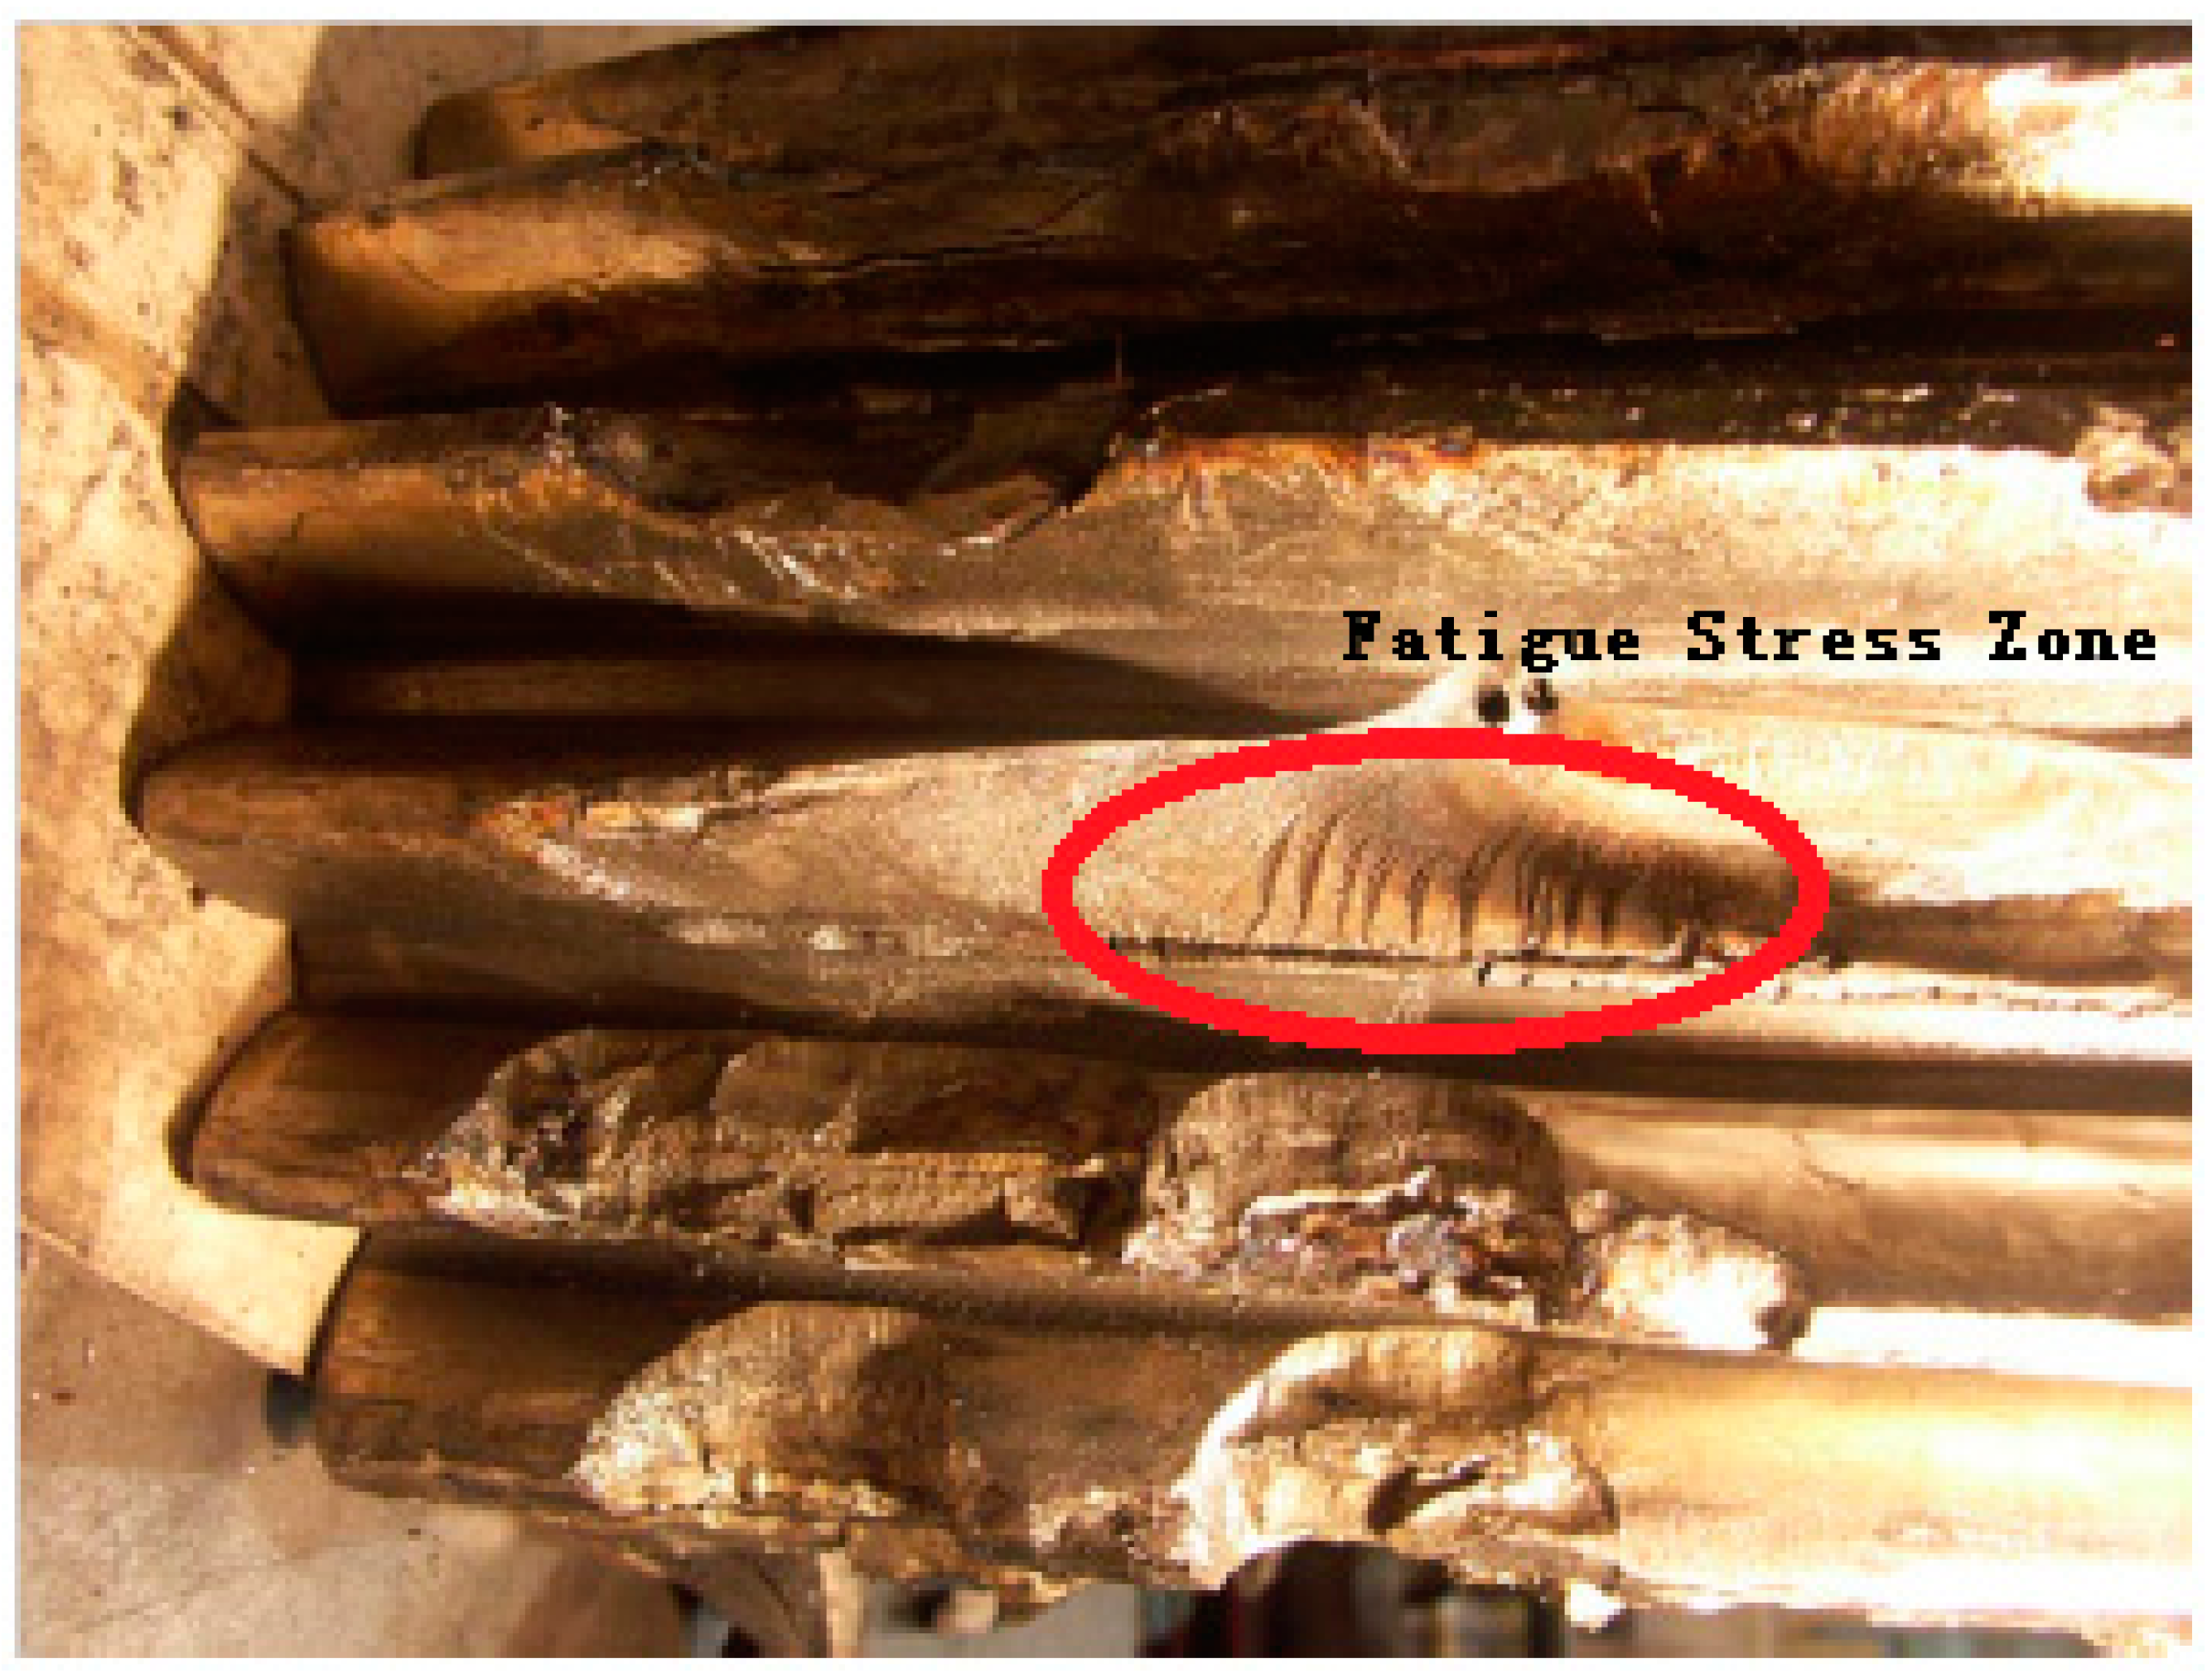
The gearbox being analyzed is a WT three stage gearbox. It suffered a catastrophic failure on the sun gear of the planetary stage. The parallel stage showed no obvious damage. The failure is shown in
Figure 16. Nearly all the teeth of the sun gear are broken. In some areas, an obvious fatigue stress zone is observed, which is highlighted in the figure. SCADA data from this gearbox is extracted for fatigue analysis.
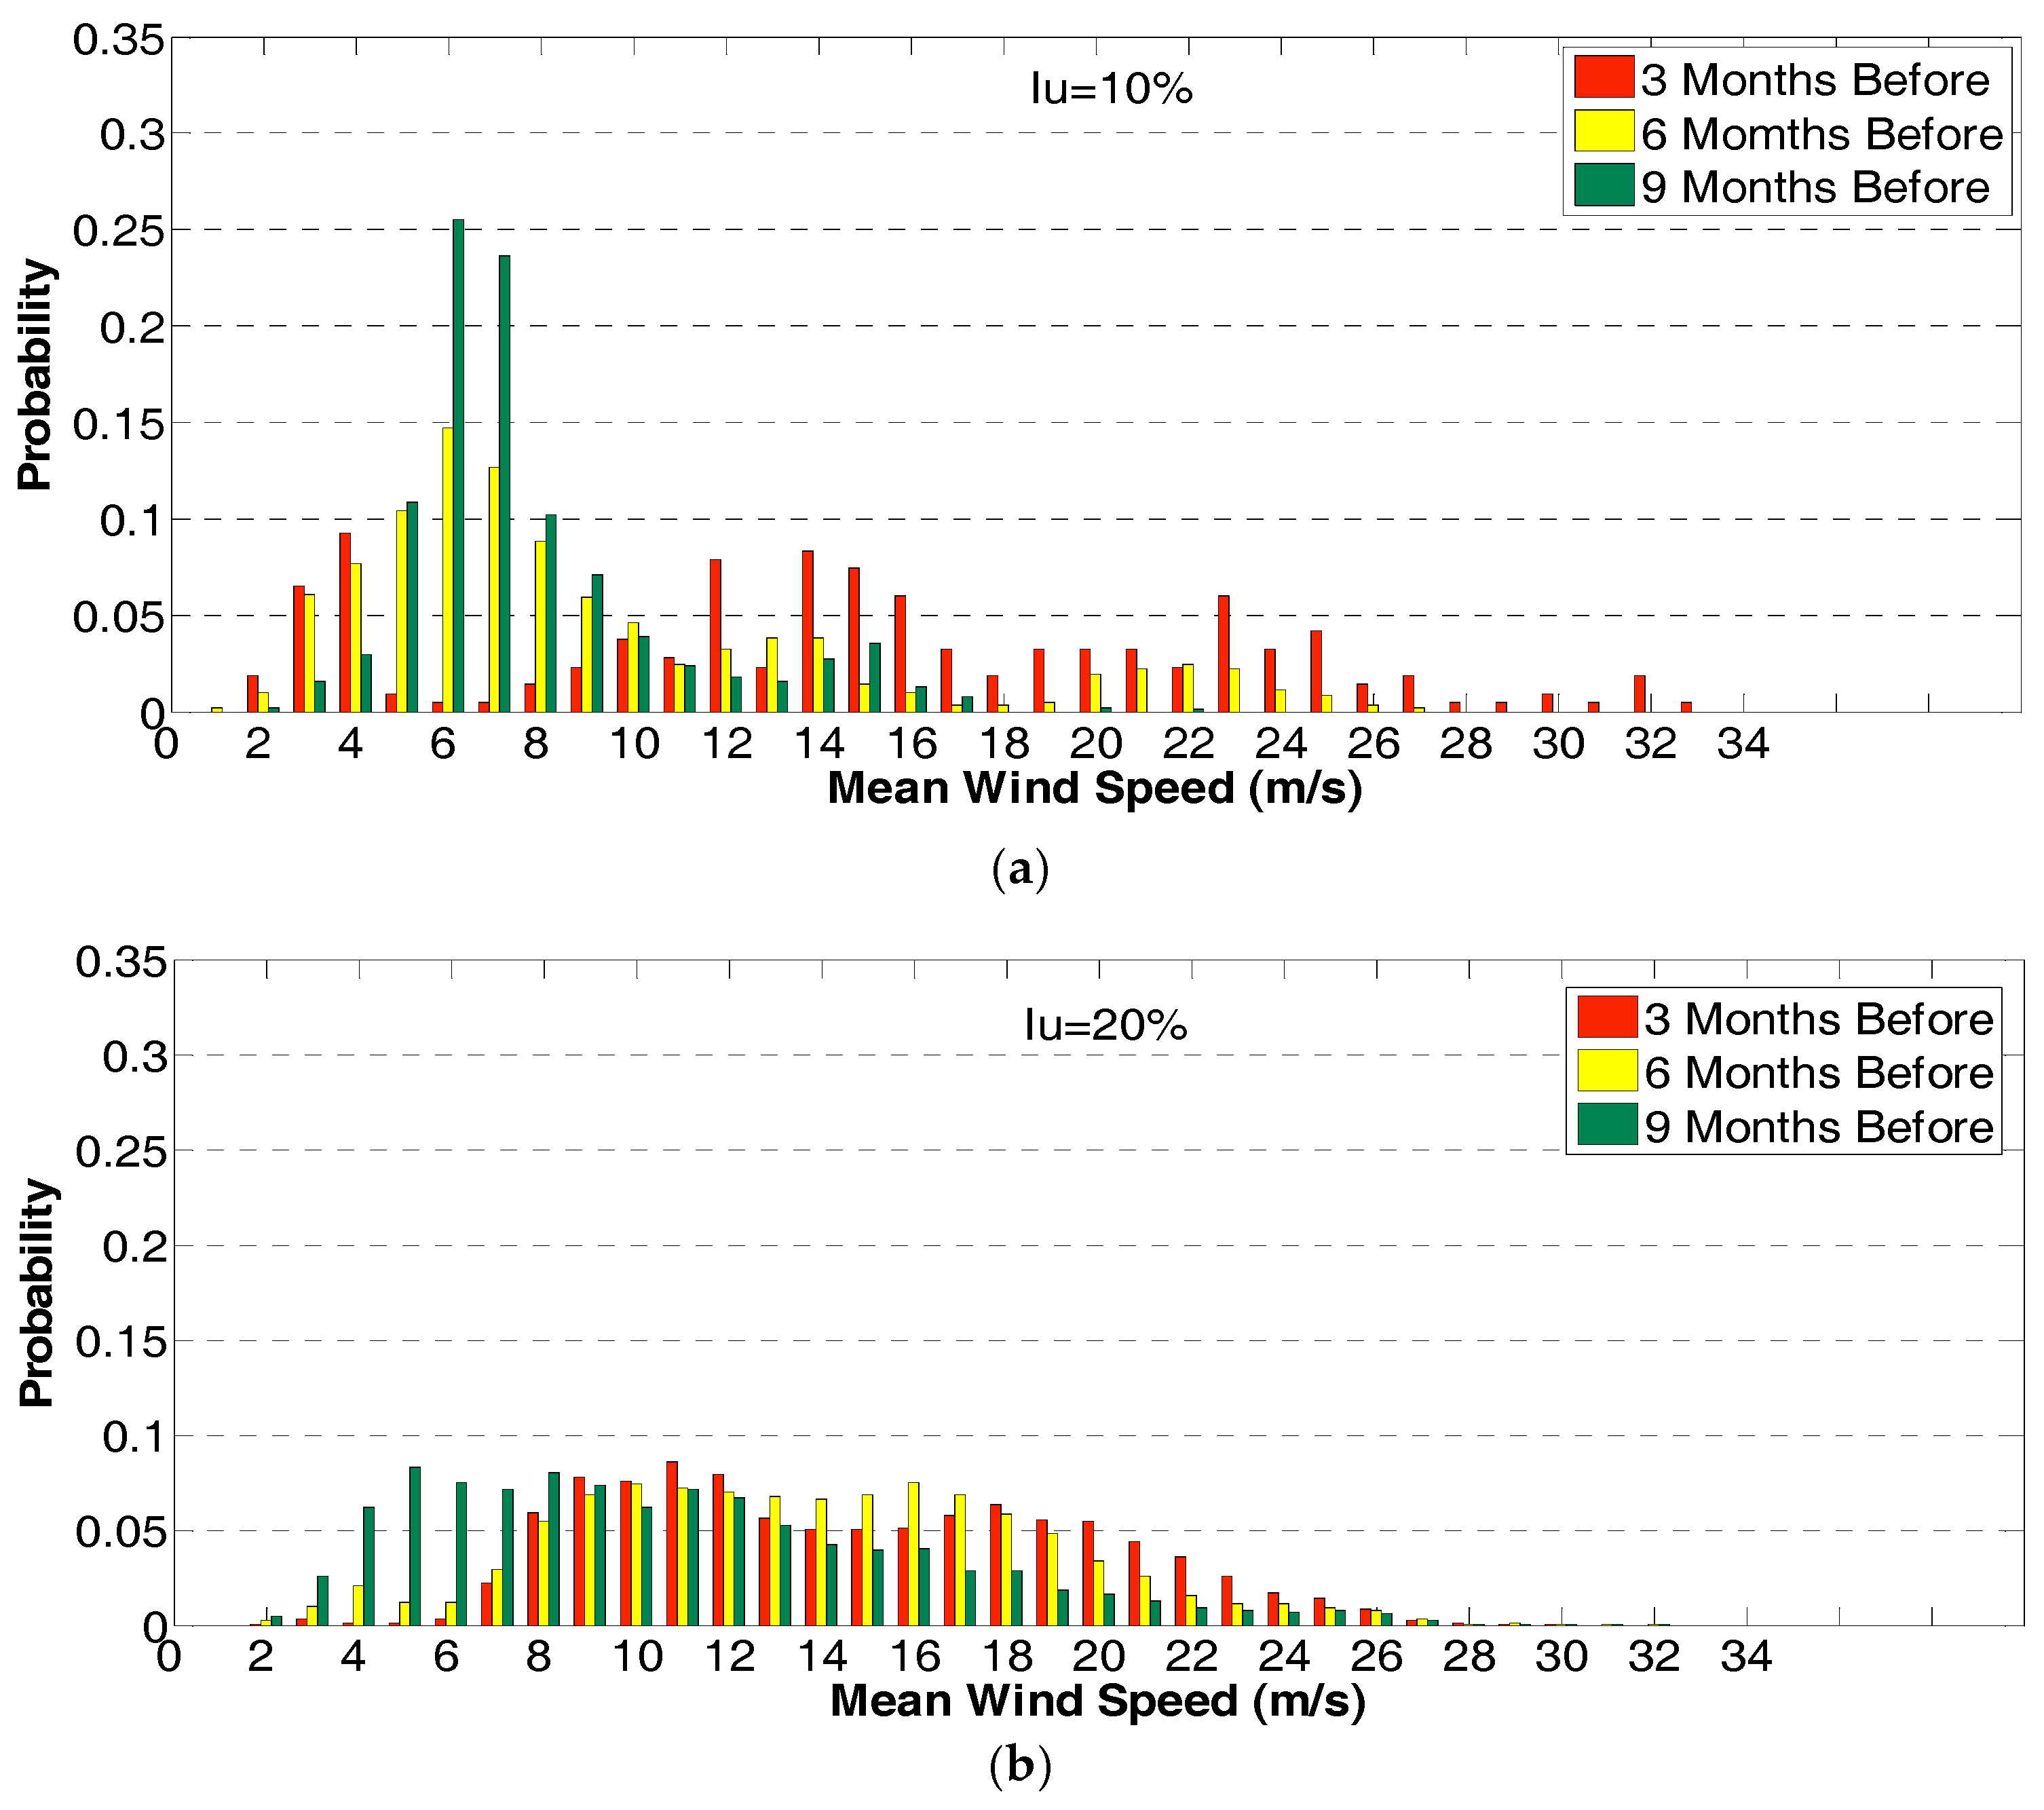
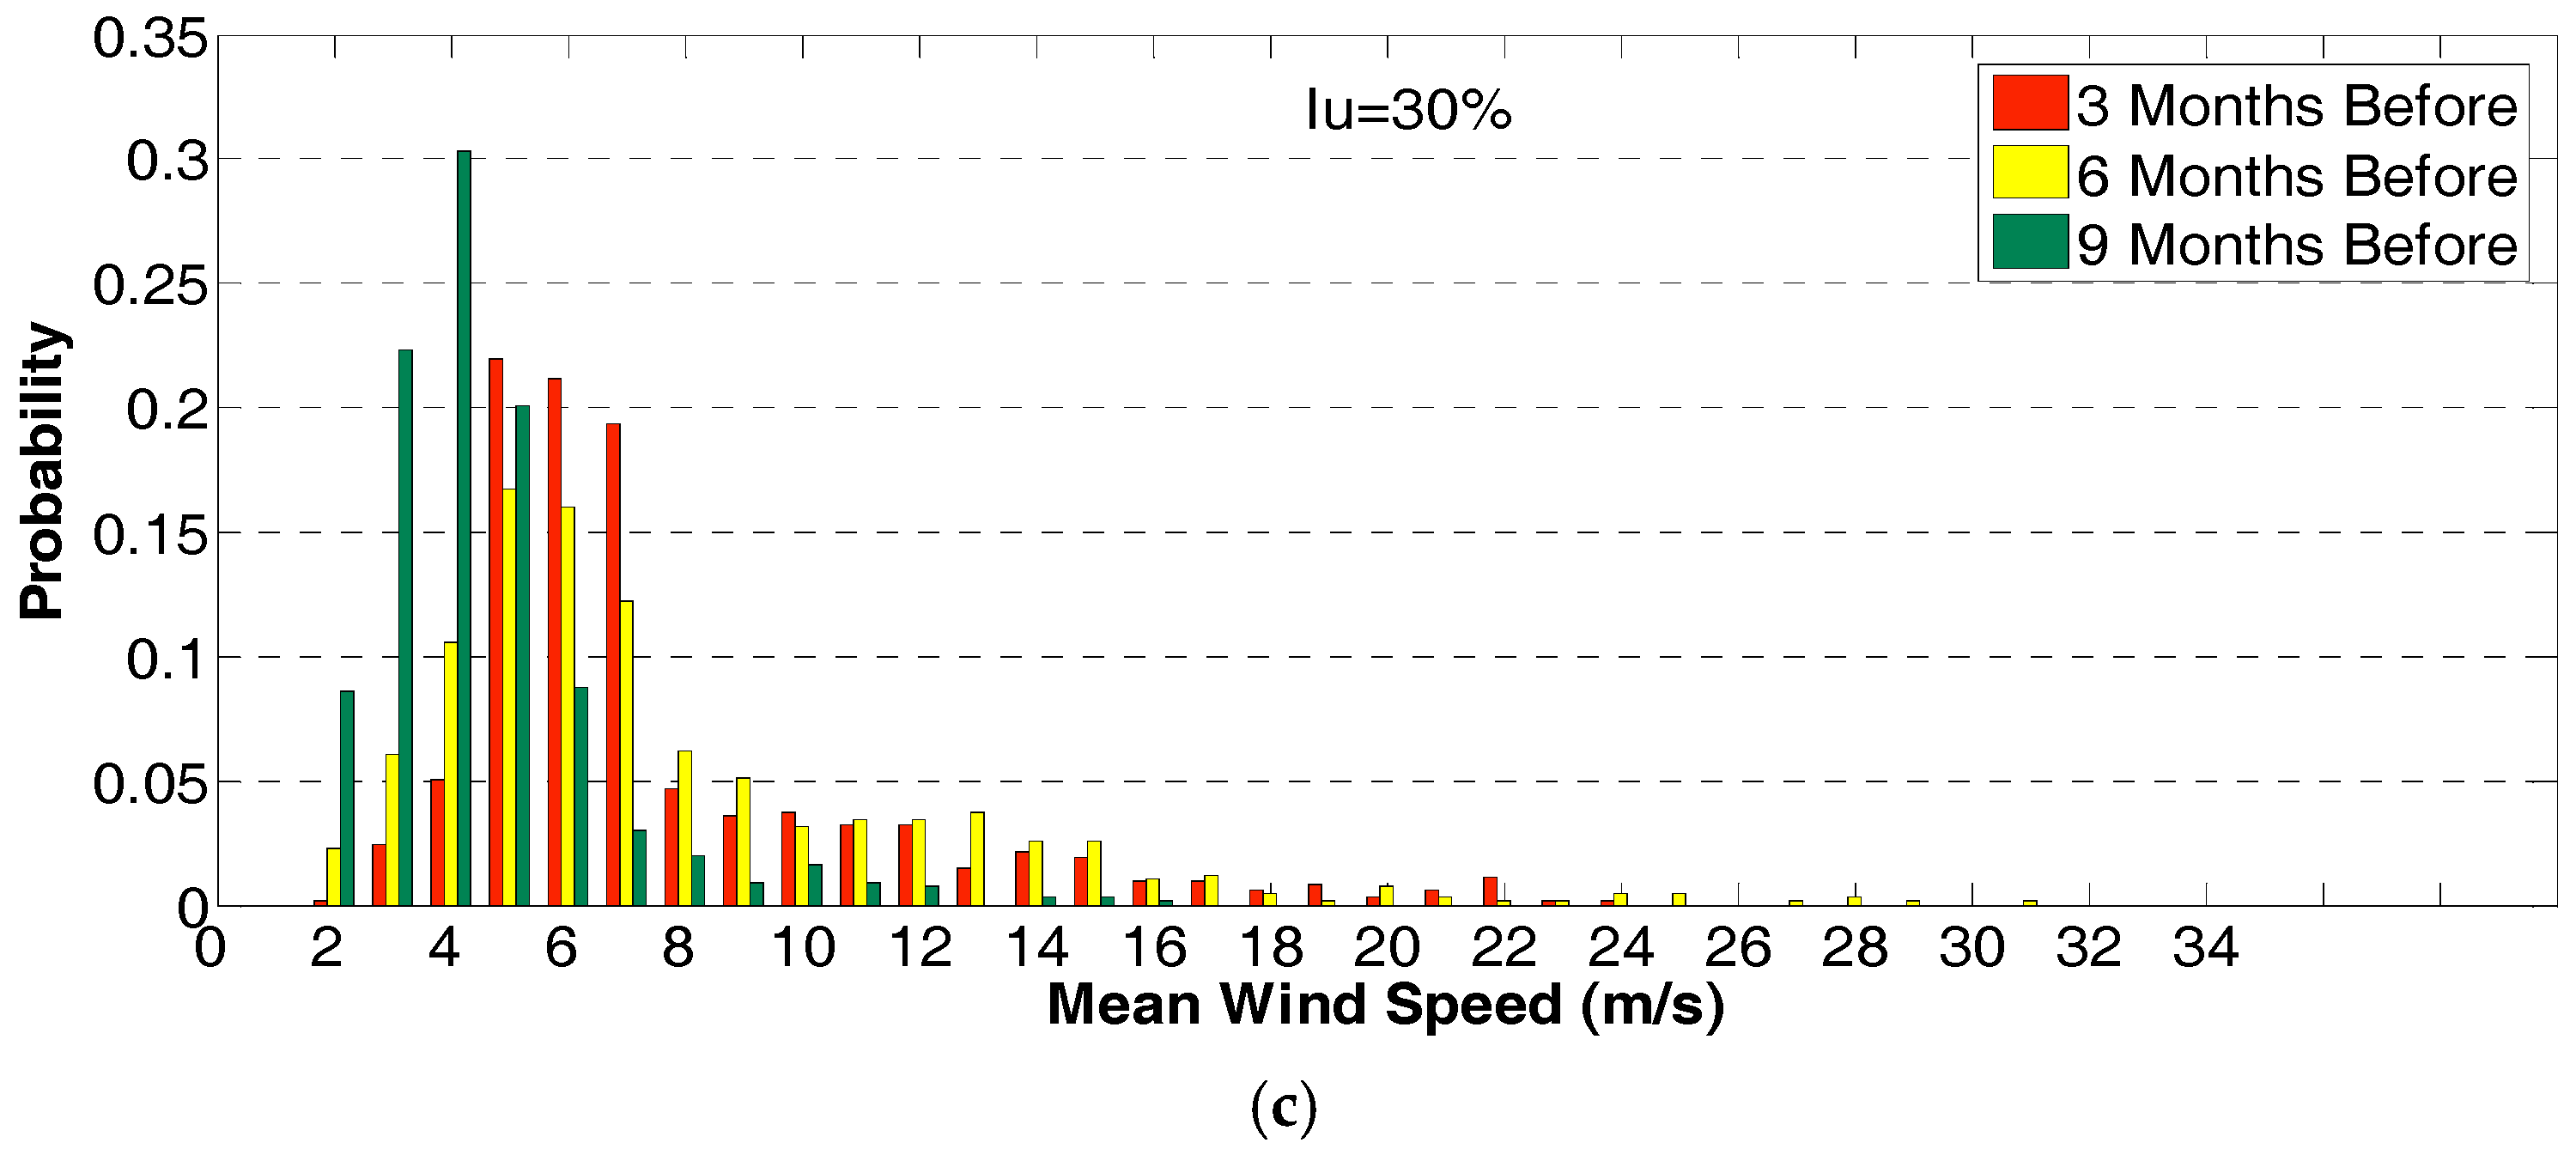
Although the SCADA data used here was not recorded from the first date when the WT was operating, the cumulative damage calculation is still validated as linear damage theory assumes that fatigue damage due to different stress levels are independent of each other and it can be linearly accumulated. The nine months SCADA data recorded before the WT failed are divided into three sections. Each section contains three months of SCADA data, which are further used to calculate the WT fatigue damage. The wind speed data are analyzed and shown in
Figure 17. The short-term damage of each ten minute period is indexed by the mean wind speed and the calculated wind turbulence intensities within this period. The corresponding wind data statistical results are shown in
Table 3 and in
Figure 17.
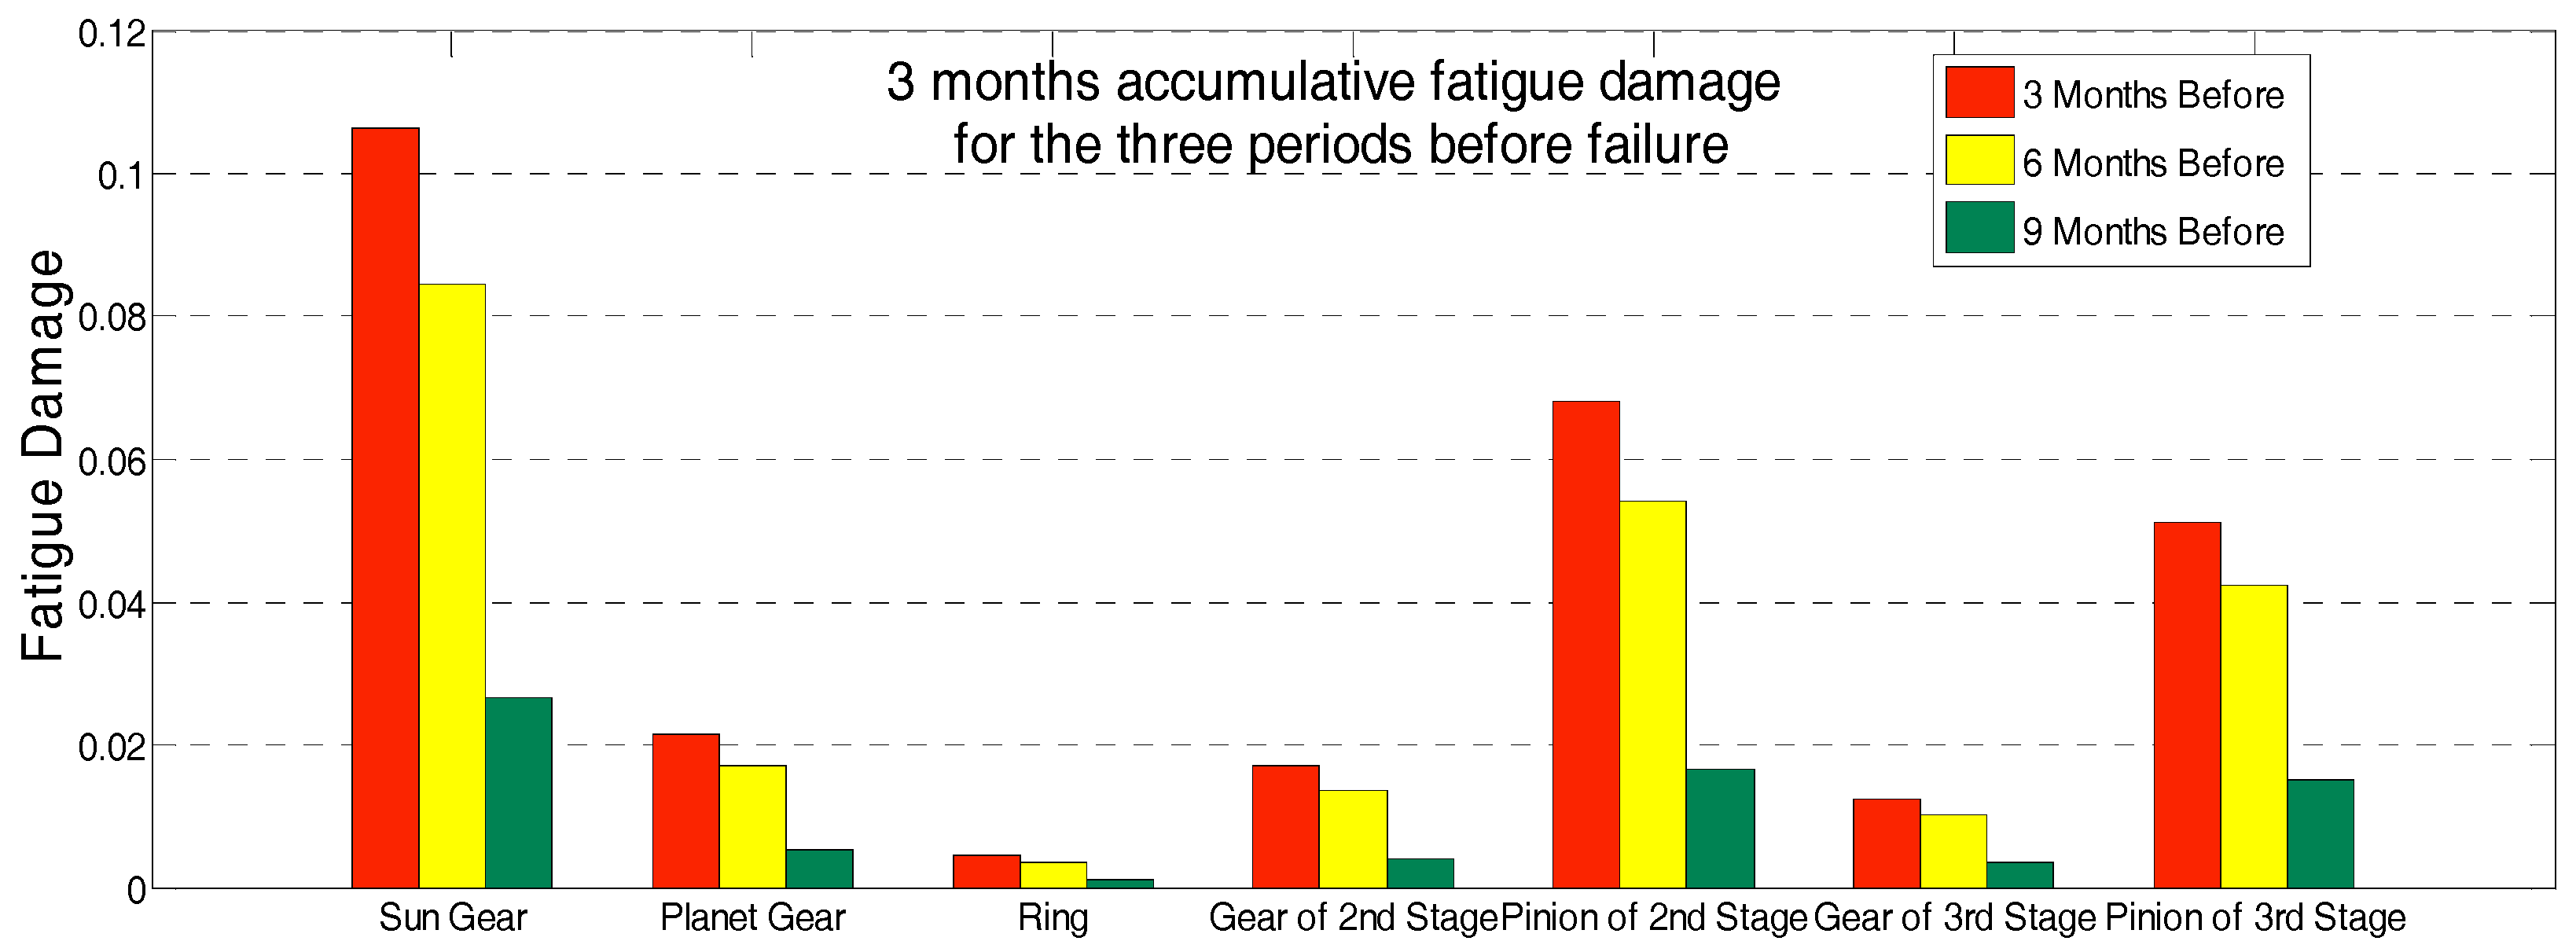
Table 3 shows the frequency of the mean wind speed exceeding 10 m/s and the turbulence intensity larger than 15% in subsequent period intervals before failure. The accumulative fatigue damage of the three section periods for different components of a gearbox are shown in
Figure 18.
Comparing the fatigue damage of different components, it shows that the sun gear damage is greater than that of the other components. For the second and third stages of the gearbox, their pinions are more vulnerable than gears. This agrees with the conclusion obtained in the short-term damage calculation. Comparing the damages accumulated for the three periods, the components’ damages in the latest three months are larger than that in the other two periods. The smallest damages are observed for the earliest three months periods (nine months before). The damage may be due to the difference of the wind speed and turbulence scale distribution as shown in
Figure 16.
High occurrence probability of high mean wind speed (≥10 m/s) is observed for the turbulence scale of 10% and 20% during the three (December 2006–March 2007) and six (September 2006–December 2006) months before period. According to the short-term damage calculation results when the mean wind speed is above 10 m/s the damage to the gearbox increases significantly. This leads to the high damage estimated for the two periods. In addition, the turbulence intensities are also increasing, which further causes serious damages to the gearbox. As observed in
Figure 18, the accumulative fatigue damage of the sun gear for the latest three months period is higher than 0.1. The total cumulative damage of nine months reached 0.2, which increases the gearbox failure probability. As the SCADA data used here is not recorded from the first date when the WT was operating, the cumulative damage value is lower than 1, but the trend shows significant damage during the six and three months before failure, which accounts for 20% of the whole service life.
7. Conclusions
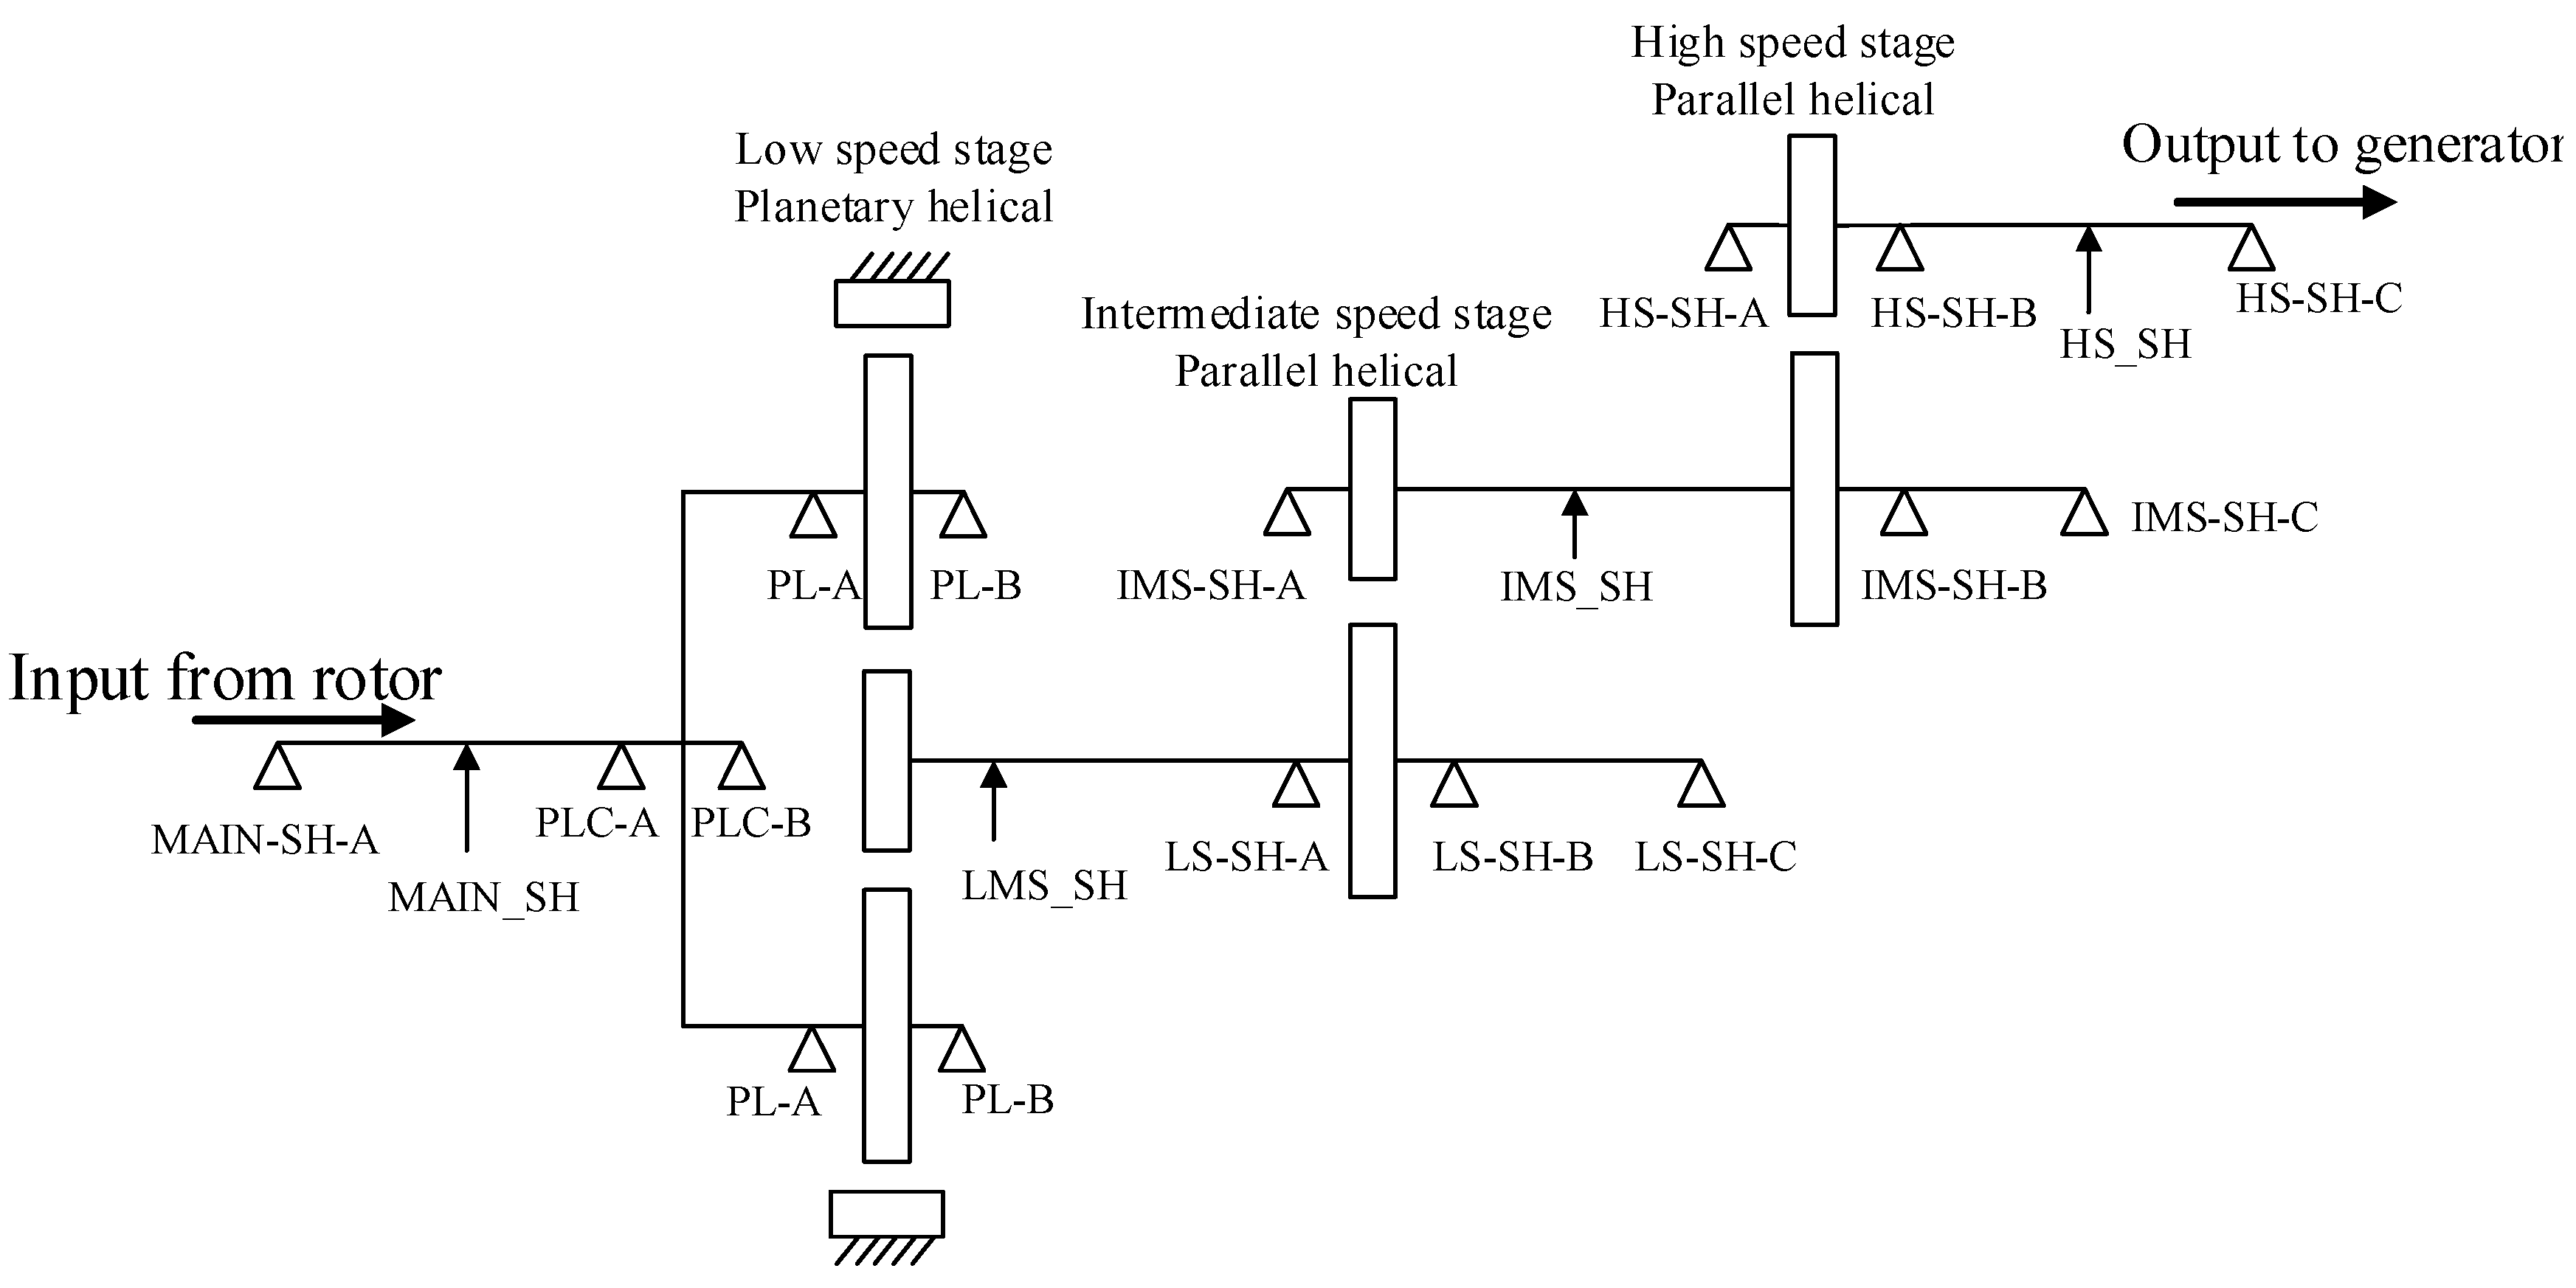
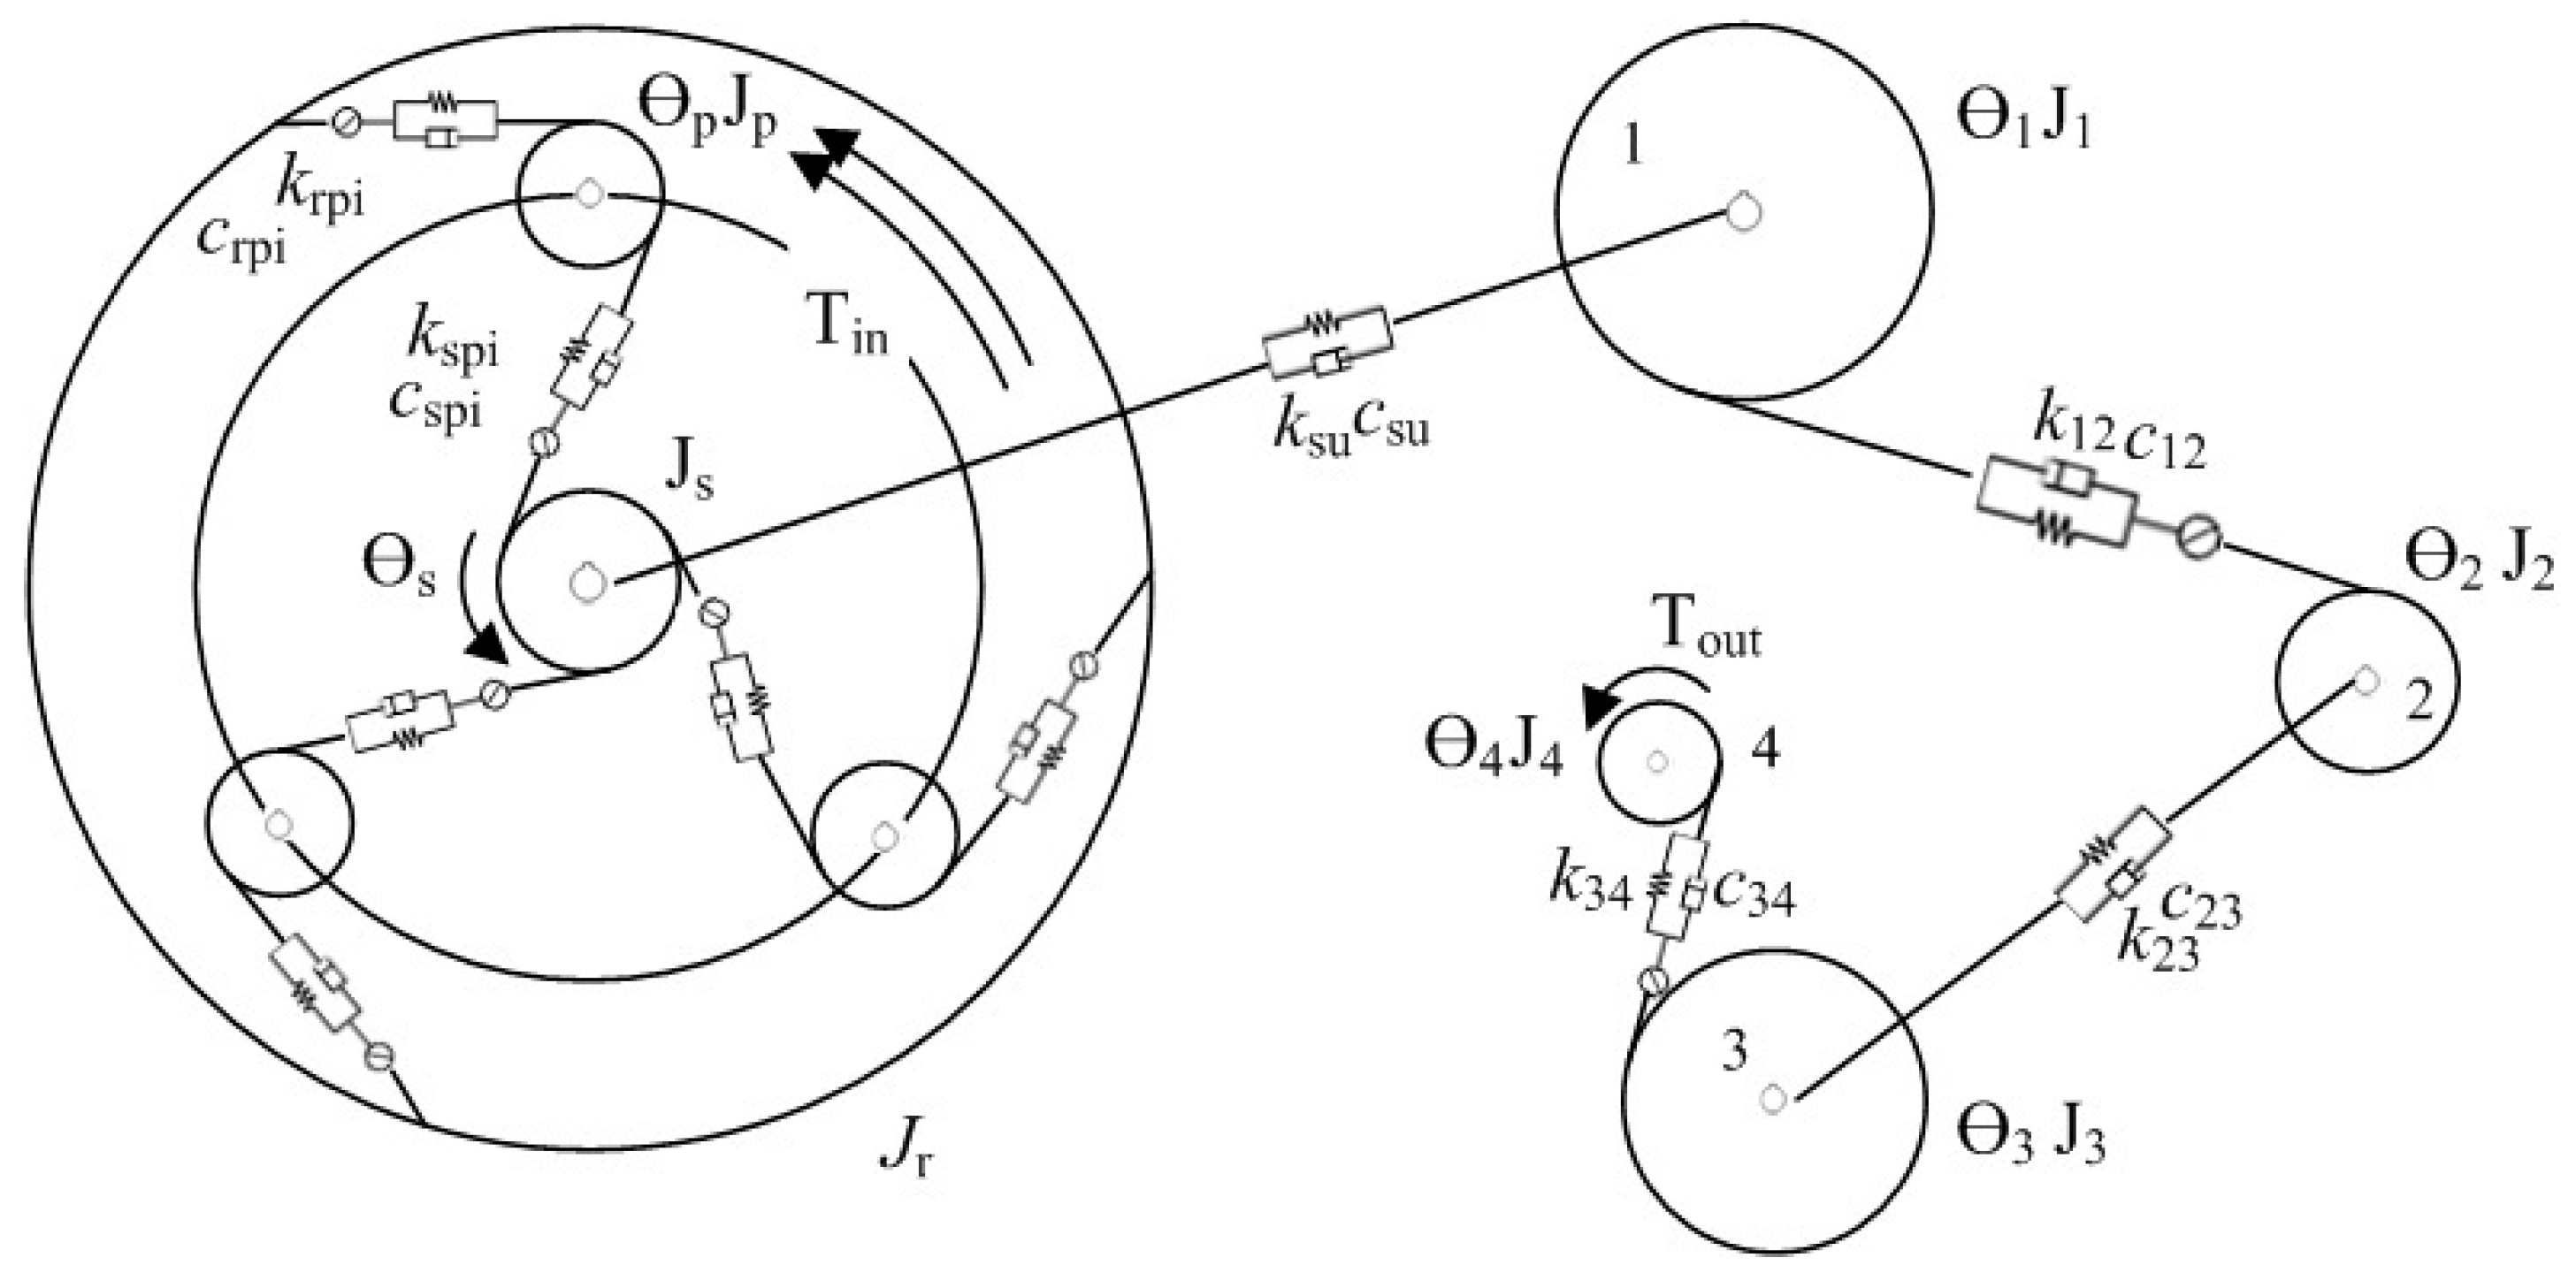
A long-term fatigue damage assessment method of WTs based on practical SCADA data is developed in this paper. Short-term fatigue damage of WT gearboxes which considers the impact of turbulence is firstly investigated. The main shaft mechanical torques under turbulent wind speeds as external excitations are obtained for gear mechanics. A three-stage gearbox multibody dynamic model which considers time-varying meshing stiffness is established to study the gears’ stress dynamics. Gear stress cycle distributions and fatigue damages are then evaluated by a rain-flow counting method and Palmgren-Miner theory. To consider the impacts of mean stress level the Goodman linear equation is used to revise the stresses S-N curve. A long-term fatigue damage quantification approach using SCADA data is finally proposed. By referring to the mean, maximum and minimum wind speeds in the SCADA data, wind turbulence intensities are calculated for each 10 min time interval. Then fatigue damage is accumulated subsequently for long-term damage quantification.
The quantification results indicate that for the current design, the most vulnerable components of WT gearbox are the sun gears. For the parallel stages, pinion damages are higher than those of gears. Special consideration to protect or avoid fatigue damage of sun gears and pinions should be carried out during the design stage. WT gearboxes show different sensitivity to different mean wind speeds. Higher damage should be expected when the WT is operating under wind conditions that being with mean wind speed above 10 m/s. Although with low data sampling rate, by assuming that wind speed distribution obey a statistical law SCADA data can be used to quantify gearbox long-term fatigue damage. The analysis result of nine months of SCADA data shows a prominent gearbox damage tendency, which can be used for WT gearbox monitoring. The approach is capable of effectively presenting the performance degradation of gearboxes’ different components due to wind speed variation. The accuracy of this method is determined by the short-term fatigue damage calculation which is affected by the variation of material/structural parameters and random external excitation situations. Further validation and increased sample cases will be helpful to improve the accuracy of this approach. In any case, the quantification approach proposed here provides a useful tool for wind farm maintenance prognosis.


