Article

A Novel Method to Directly Analyze Dissolved Acetic Acid in Transformer Oil without Extraction Using Raman Spectroscopy

1
State Key Laboratory of Power Transmission Equipment & System Security and New Technology, Chongqing University, Chongqing 400044, China
2
Chengdu Power Supply Company of State Grid, Chengdu 610041, China
*
Authors to whom correspondence should be addressed.
Energies 2017, 10(7), 967; https://doi.org/10.3390/en10070967
Submission received: 12 April 2017 / Revised: 27 June 2017 / Accepted: 4 July 2017 / Published: 10 July 2017

Abstract

:
Analyzing the concentration of low molecular acids dissolved in oil is vital in the oil-paper insulation aging diagnostic procedure of power transformers. The existing methods cannot distinguish between different acid types and their strengths. In this study, an improved solution Raman detection platform is fabricated. The direct measurement of dissolved acetic acid, a kind of low molecular acids, is observed in transformer oil without extraction. The Raman shift line of oil-dissolved acetic acid at 891 cm−1 corresponding to H–C–H symmetrical swing and O–H swing modes is taken as its characteristic value. Taking Raman shift line of pure oil at 932 cm−1 as an internal standard, a linear regression curve for quantitative analysis is obtained with a slope of 0.19. The best platform parameter of accumulation number is 300, which is determined by Allan deviation analysis. The current concentration detection limit and accuracy for oil-dissolved acetic acid are obtained at about 0.68 mg/mL and 91.66%, separately. The results show that Raman spectroscopy could be a useful alternative method for evaluation insulation aging state of an operating power transformer in the future.

1. Introduction

Oil-immersed transformers are one of the most important electrical components in power systems. Their reliability is significant for the safety and stability of power grids [1]. It is well known that dissolved CO and CO2 [2,3], furans [4,5] and dielectric properties of oil [6,7] can be used for the aging evaluation of an operating transformer [8]. Under the long-term operation, mineral oil will react with dissolved oxygen to form carboxylic acids of varying molecular weight and then dissolve in transformer oil [9]. High-molecular-weight acids (more than 5 carbon atoms), typically stearic and naphtenic acid, have a lower affinity for cellulose due to the hydrophobic nature of the alkyl group CnH2n+1 [10,11], while, low-molecular-weight acids, typically formic, levulinic, and acetic acid, are more hydrophilic and 90% of which will be absorbed by the oil-immersed paper [12]. The low-molecular-weight acids have a greater influence on the degradation rate of paper by reacting chemically with cellulose (paper) and water through donating a proton (H+) [13,14]. Cellulose degradation will form more low-molecular-weight acids, which will remain absorbed in paper and accelerate the degradation of cellulose in turn [15]. Recently, it has been demonstrated that a precise analysis of the concentration of low molecular acids along with content of water in oil and in paper is of great value for assessing ageing condition and also for assessing the effect of maintenance actions [16,17].
Right now, it is impossible to monitor the acids concentration in paper of an operating transformer. Generally, the acids value in paper can be calculated out from its value in oil. The major methods of detecting the concentration of oil-dissolved acetic acid are indicator-potentiometric titration (IPT) [18] and water-soluble acid determination [19]. For the former method, pretreatment such as extraction and heating in water bath is required, which is complicated, time-consuming and subjective, while the latter method exhibits poor reproducibility because pH values are sensitive to the experimental water and the indicators. Moreover, neither do these methods distinguish between different acid types and their strengths. Lundgaard et al. proposed that there is a need to introduce a method for measuring the content of low-molecular-weight acids in service-aged oils for assessing the degradation of oil-paper insulation [20].
Raman spectroscopy can analyze the structure and property of samples by measuring Raman scattering light directly. Incident laser light with frequency of v0 will motivate the sample molecules to produce Raman Stokes scattering photons with frequency of v0+vR. Different molecule has different Raman shift, vR, which is associated to molecule’s vibration modes. Thus, according to the position and intensity of vR, qualitative and quantitative analysis of various substances can be measured simultaneously without pretreatment process [21]. The first practical application of Raman spectroscopy in the power systems, to our best knowledge, includes the work by Irawan et al. who, in 2005, achieved continuous and qualitative monitoring of SF6 and its degradations in high-voltage switchgear [22]. In 2008, Li et al. stabilized a near-confocal Raman enhanced cavity, and achieve simultaneous measurement of fault gases (H2, CO, CO2, CH4, C2H2, C2H4 and C2H6) [23,24], but pretreatment of gas extraction from transformer oil is required. In 2013 and 2015, Toshihiro et al. demonstrated that dissolved C2H2 [25] and furfural [26] in transformer oils can be directly detected using Raman spectroscopy without extraction, respectively. In 2015, surface-enhanced Raman spectroscopy was studied in our group and the detection limits of H2, CO, CO2, CH4, C2H2, C2H4 and C2H6 were improved to 1.31, 2.34, 1.48, 0.19, 0.28, 0.81 and 0.57 (μL/L), separately [27]. In 2016, Raman spectroscopy combined with methanol extraction technology was used in our group [28] to measure dissolved furfural in transformer oil and the detection limit has been improved about 144 times when comparing the value in Toshihiro’s publication [26].
Recently, Raman spectroscopy technique was introduced to analyze the concentration of oil-dissolved acetic acid in our group [16]. Acetic acid, a kind of low molecular acids, is a polyatomic and nonlinear molecule consisting of carbon, hydrogen, and oxygen atoms, which has various independent vibration modes and is with small Raman scattering cross-section area and Raman intensity. The poor detection limit and accuracy are bottleneck problems for direct analysis of oil-dissolved acetic acid using Raman spectroscopy [16]. In this contribution, advancements made on the solution Raman detection platform which improves previous detection limit is described. Then, the Raman-shifted spectral lines of acetic acid and its corresponding vibration modes are obtained through experiment and molecular structure simulation, respectively. Besides, Raman spectra of oil, acetic acid, and oil with 40 mg/mL acetic acid concentration are compared to make sure the characteristic Raman shift spectral line of oil-dissolved acetic acid. Furthermore, the platform detection parameters are optimized and explained. Then, an internal standard is also determined to reduce fluctuation of Raman signal, and a linear regression curve is obtained to achieve quantitative analysis. Last but not the least, good Raman detection limit and accuracy of oil-dissolved acetic acid concentration is ensured, respectively. Raman spectroscopy could be a useful technique for evaluation of insulation-aging state of an operating power transformer.

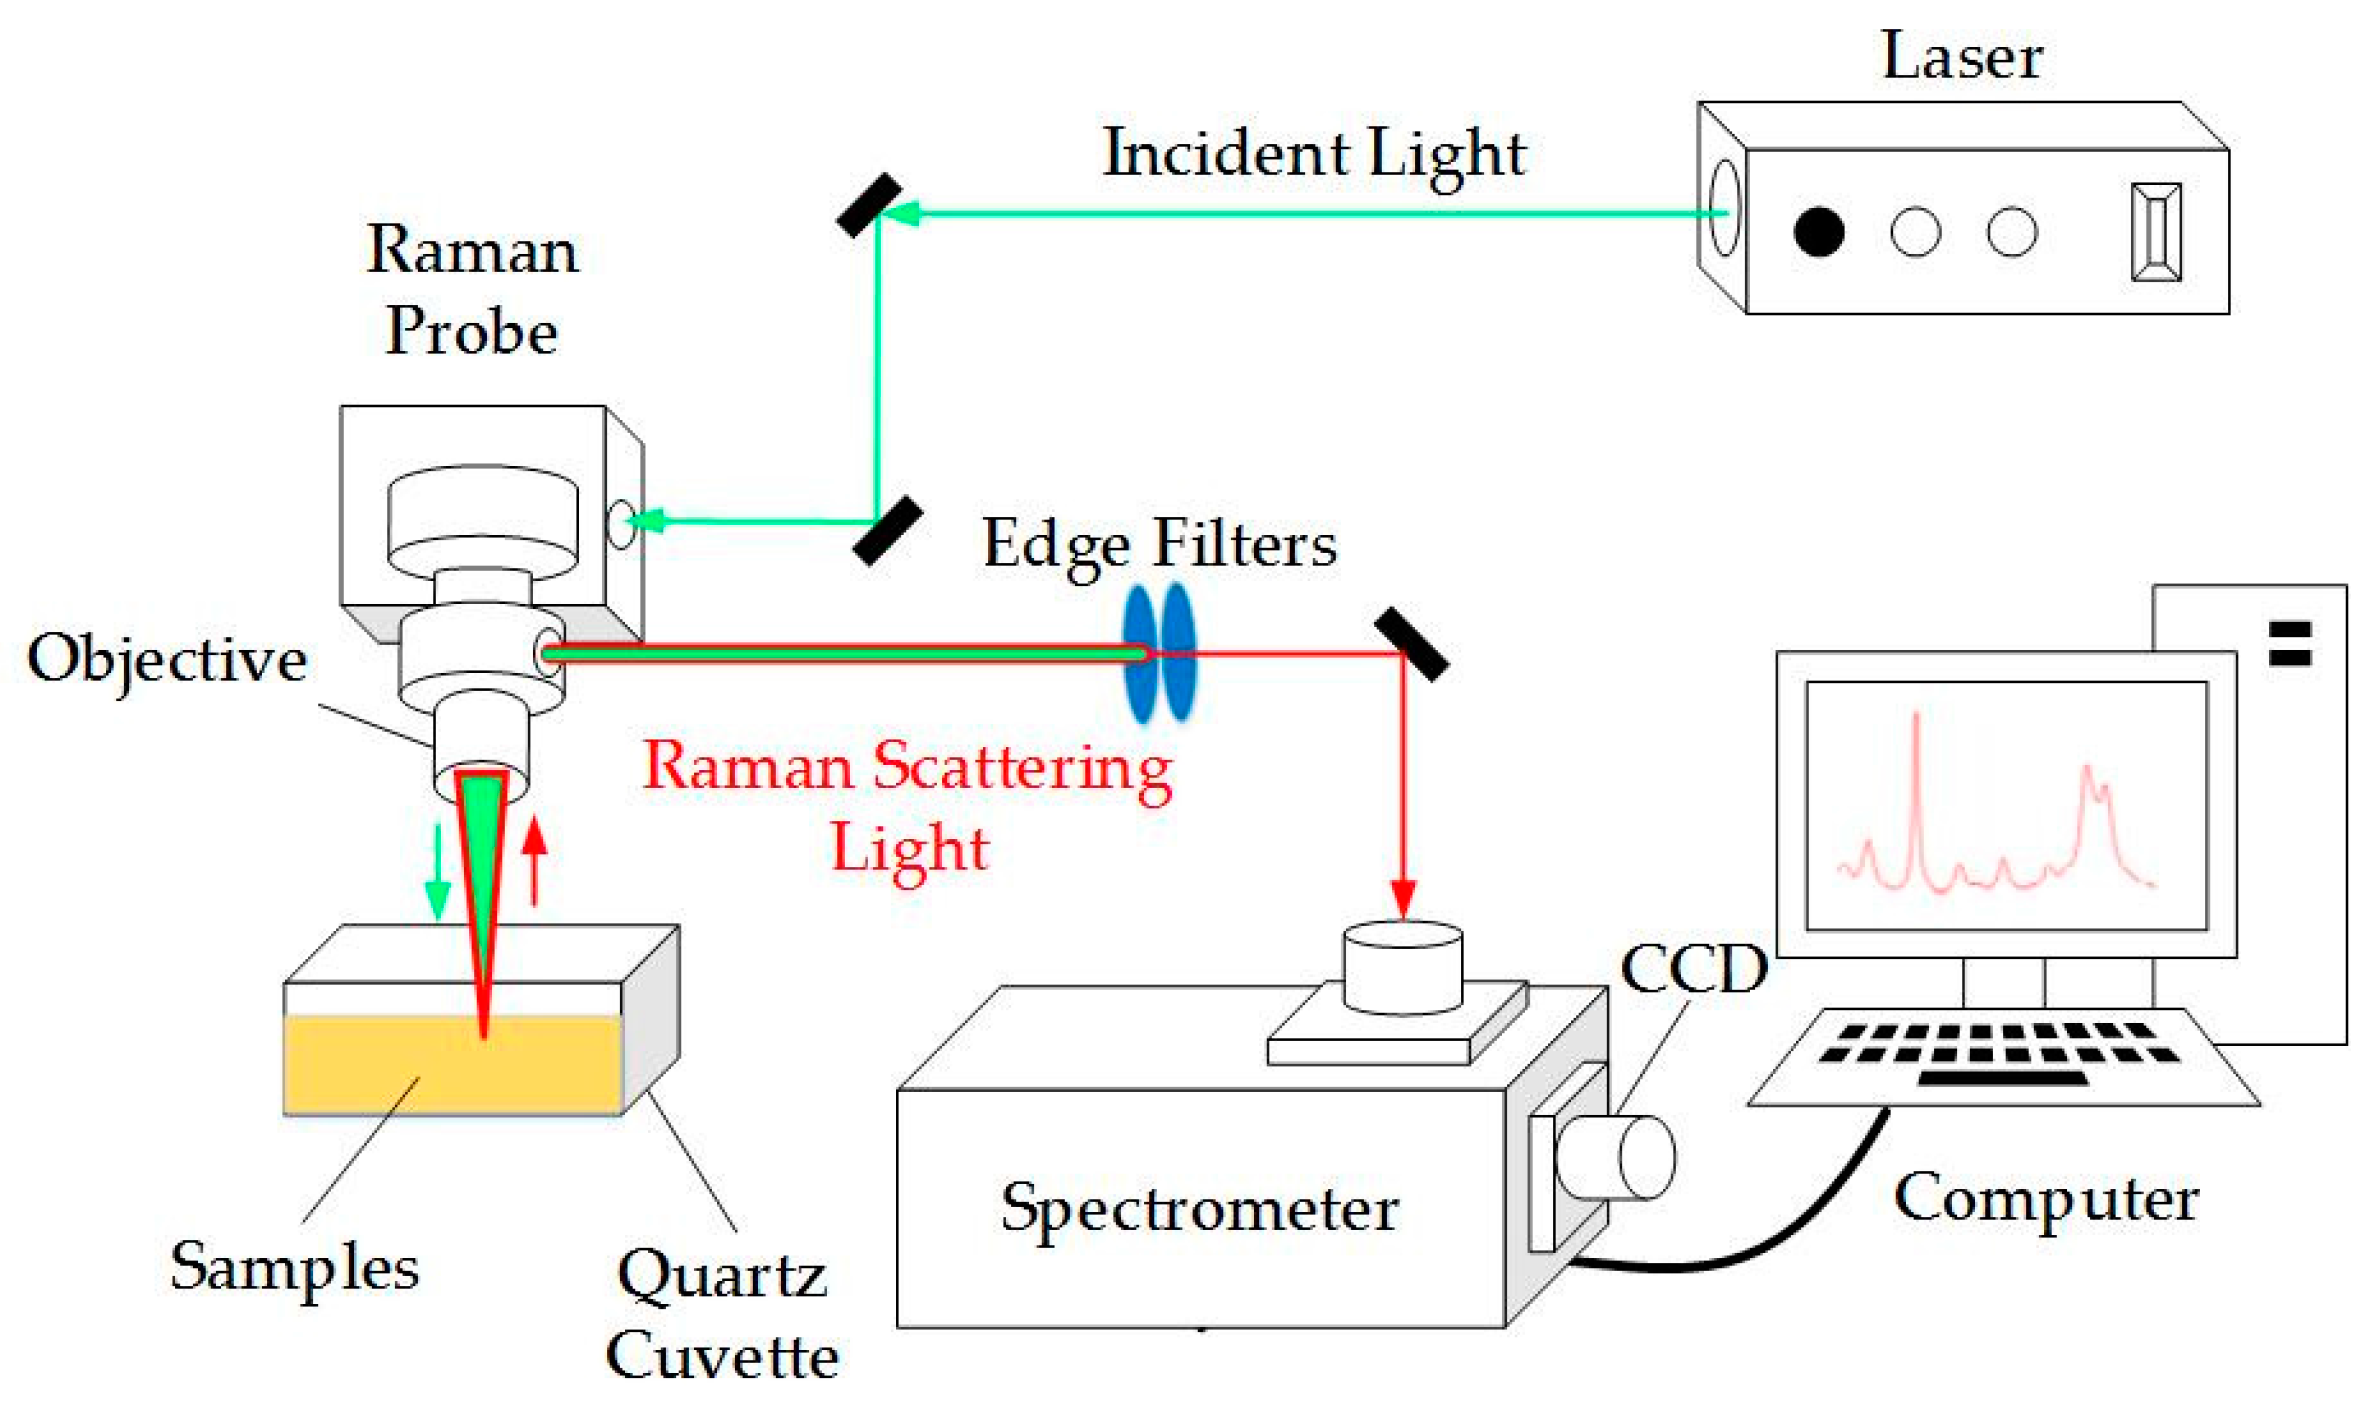
2. Experimental Setup

The experimental setup (Figure 1) fabricated on a vibration isolation table is based on our previously reported Raman spectroscopy system [16] but with modifications and improvements, in which, through a micro-objective (10×, 50× or 100×), a single-mode cw laser diode (Continuum®, DPGL-2200; wavelength of 532 nm; power of 100 mW; line width of <0.001 pm) in a temperature stabilized mount is focused on the solution samples in a cuvette to generate Raman scattering light of sample molecules (including Rayleigh scattering, Raman Stokes scattering, and Raman anti-Stokes scattering) [29].To cut down Raman scattering interference from the cuvette materials, quartz cuvette is designed and fabricated instead of previous vitric one. Then, both of the lasers and generated Raman scattering light will be collected by the focused micro-objective. However, only the Raman Stokes scattering photons can be transmitted through two added edge filters (Semrock, LP03-532RE-25; high pass, 533 nm) and focus into the slit of a spectrometer (Andor, SR-5000i-C; focal length of 500 mm; three gratings with 600, 1200 and 1800 lines per mm). A liquid nitrogen-cooled charge-coupled device (CCD, Andor, iDus-416; lowest cooling temperature of −95 °C; readout noise of <5 electrons per pixel) with a response range of 0–5000 cm−1 and 2000 × 256 pixels connected to the spectrometer is used to measure the intensity of Raman Stokes scattering light. The output of the CCD is digitized, processed (cosmic rays elimination, baseline correction and smoothing, etc.), and displayed by a personal computer.

3. Analysis of Dissolved Acetic Acid in Transformer Oil

3.1. Sample Preparation

The transformer oil used in this experiment is a mixture of paraffinic (60.0%), naphthenic (10–40%), and aromatic (5–15%) oils from Chuanrun Lubricant Company. New oil is degassed and dried before experiment to avoid its initial state differences effect. The acetic acid (99.5%, analytical reagent) used in this work is purchased from Aladdin, China.
Acetic acid (2 g) is added to a 250 mL volumetric flask at room temperature. A small amount of transformer oil of 50 mL is used to dissolve the acetic acid. After shaking up for about 10 min, 40 mg/mL acetic acid solution dissolved in transformer oil is prepared. And the prepared solution is immediately sealed in a reagent bottle to avoid the potential mass loss caused by evaporation.

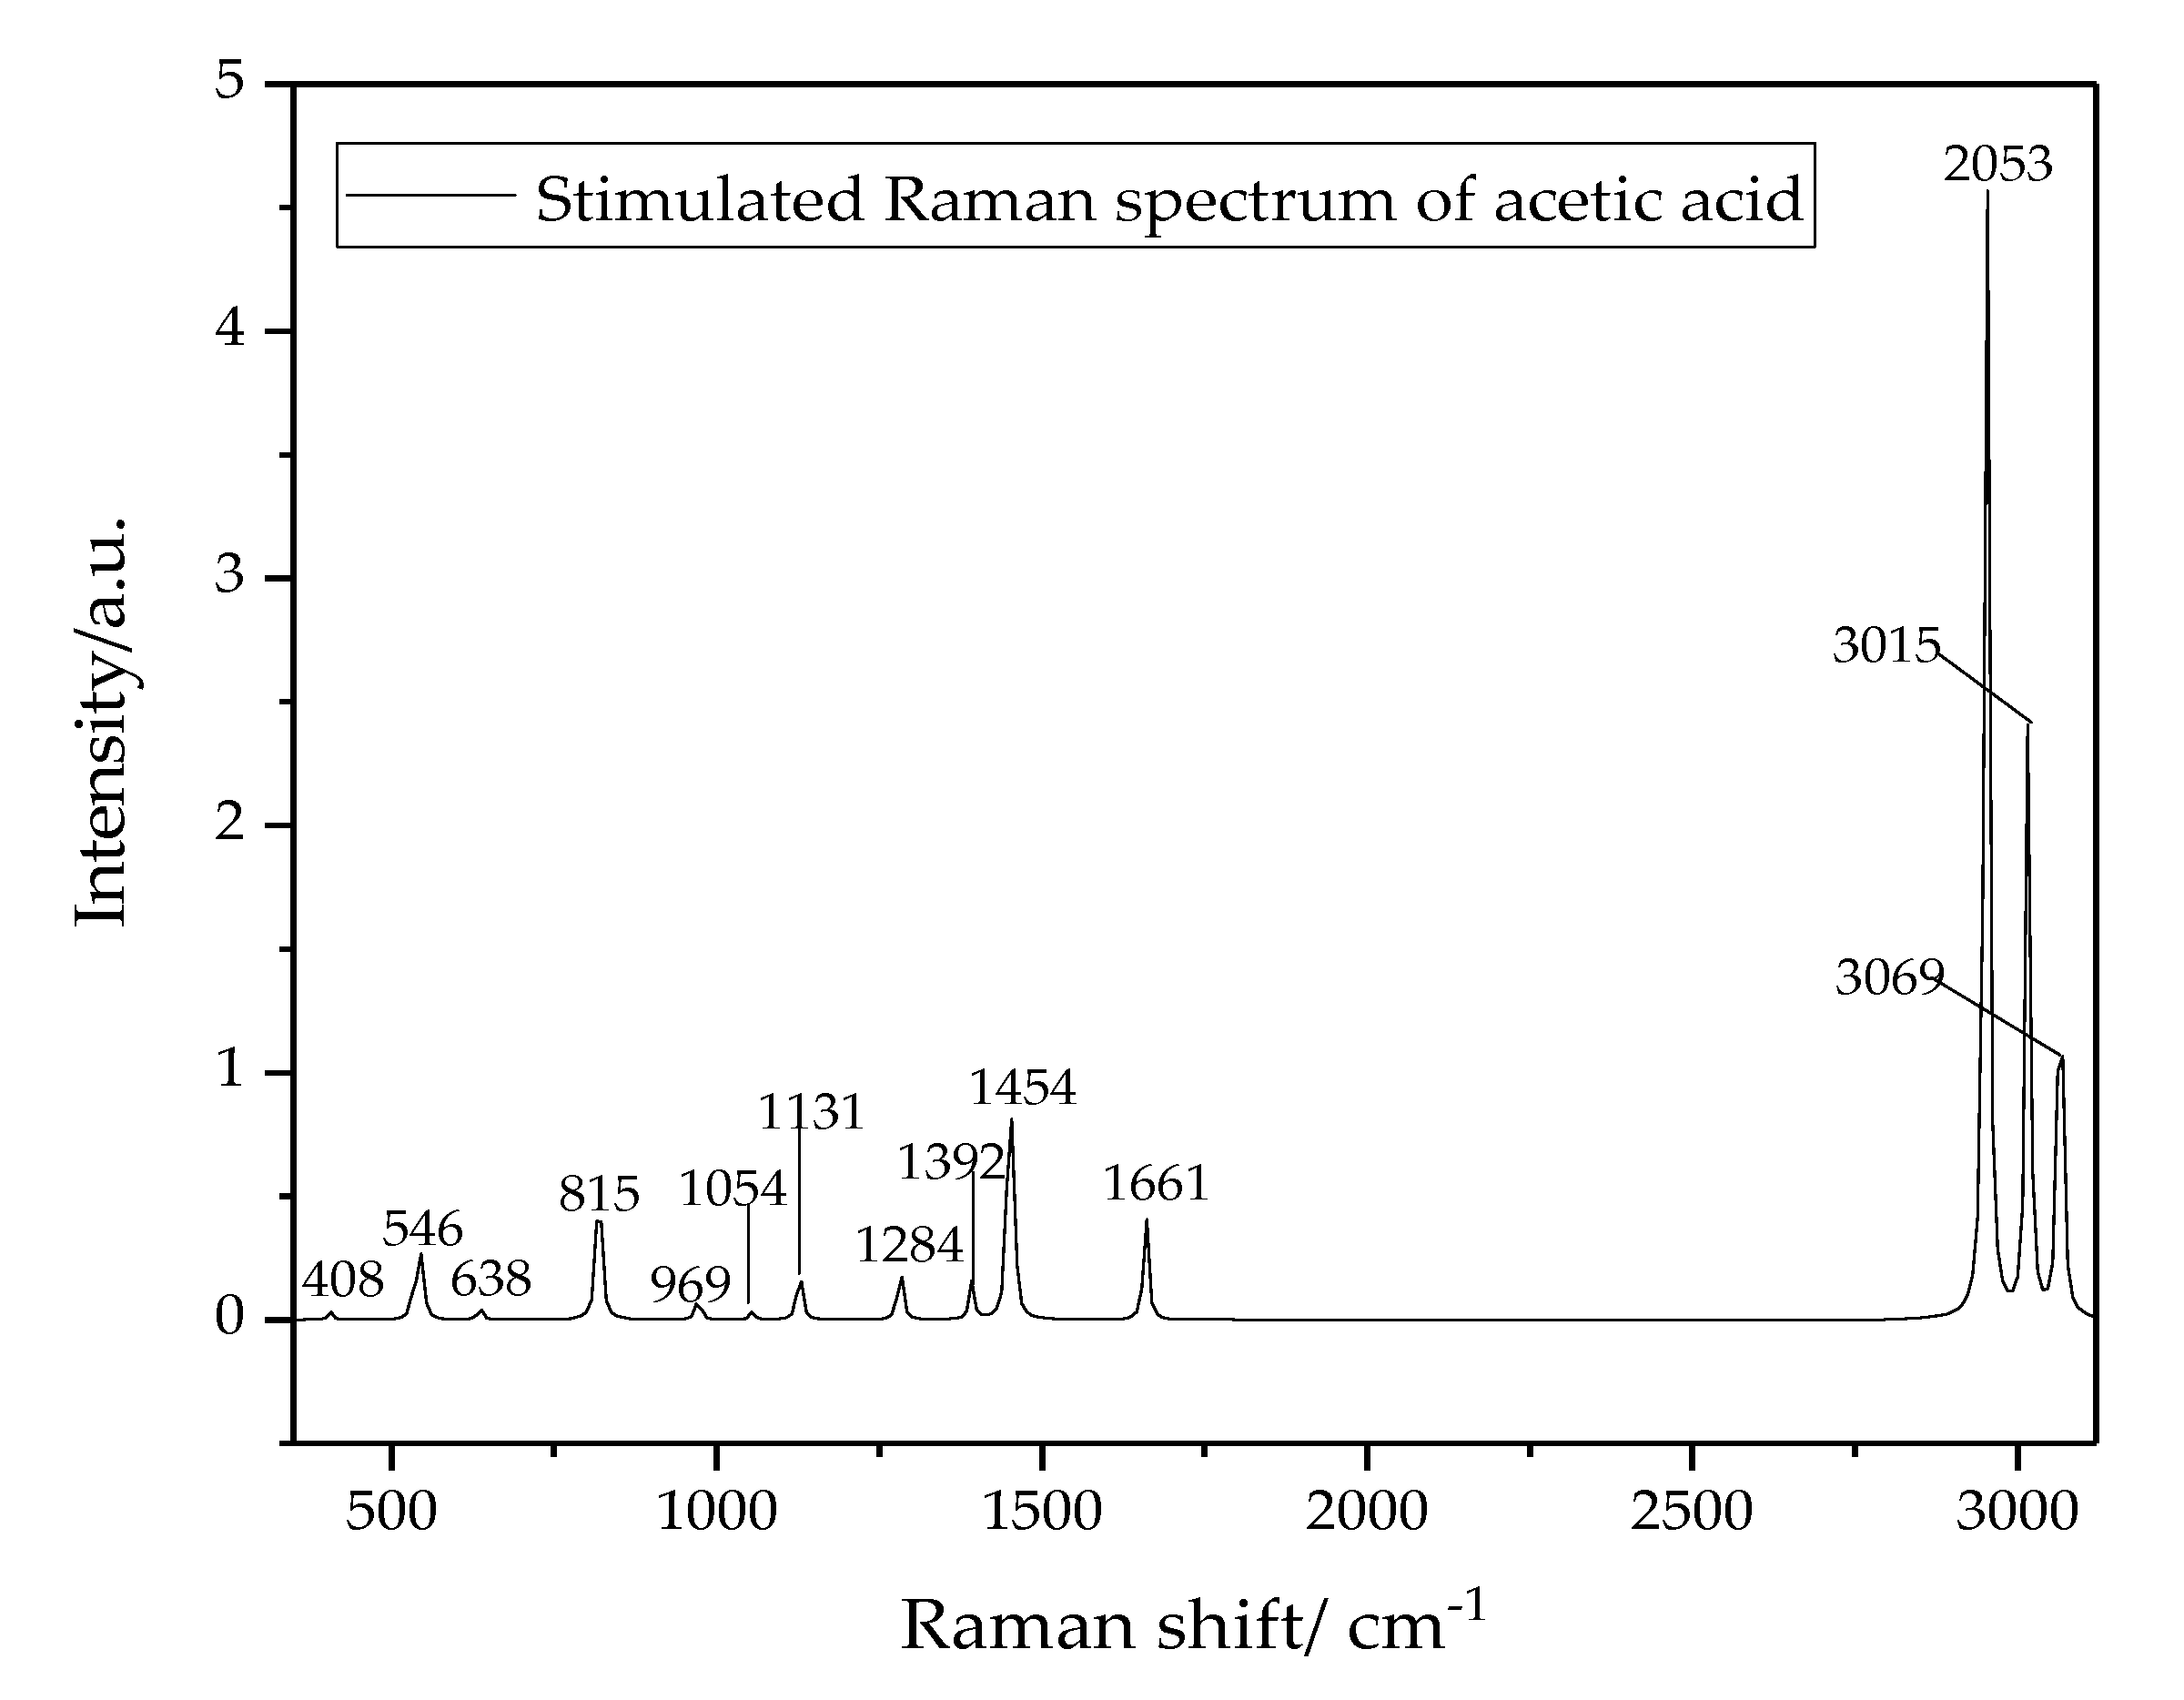
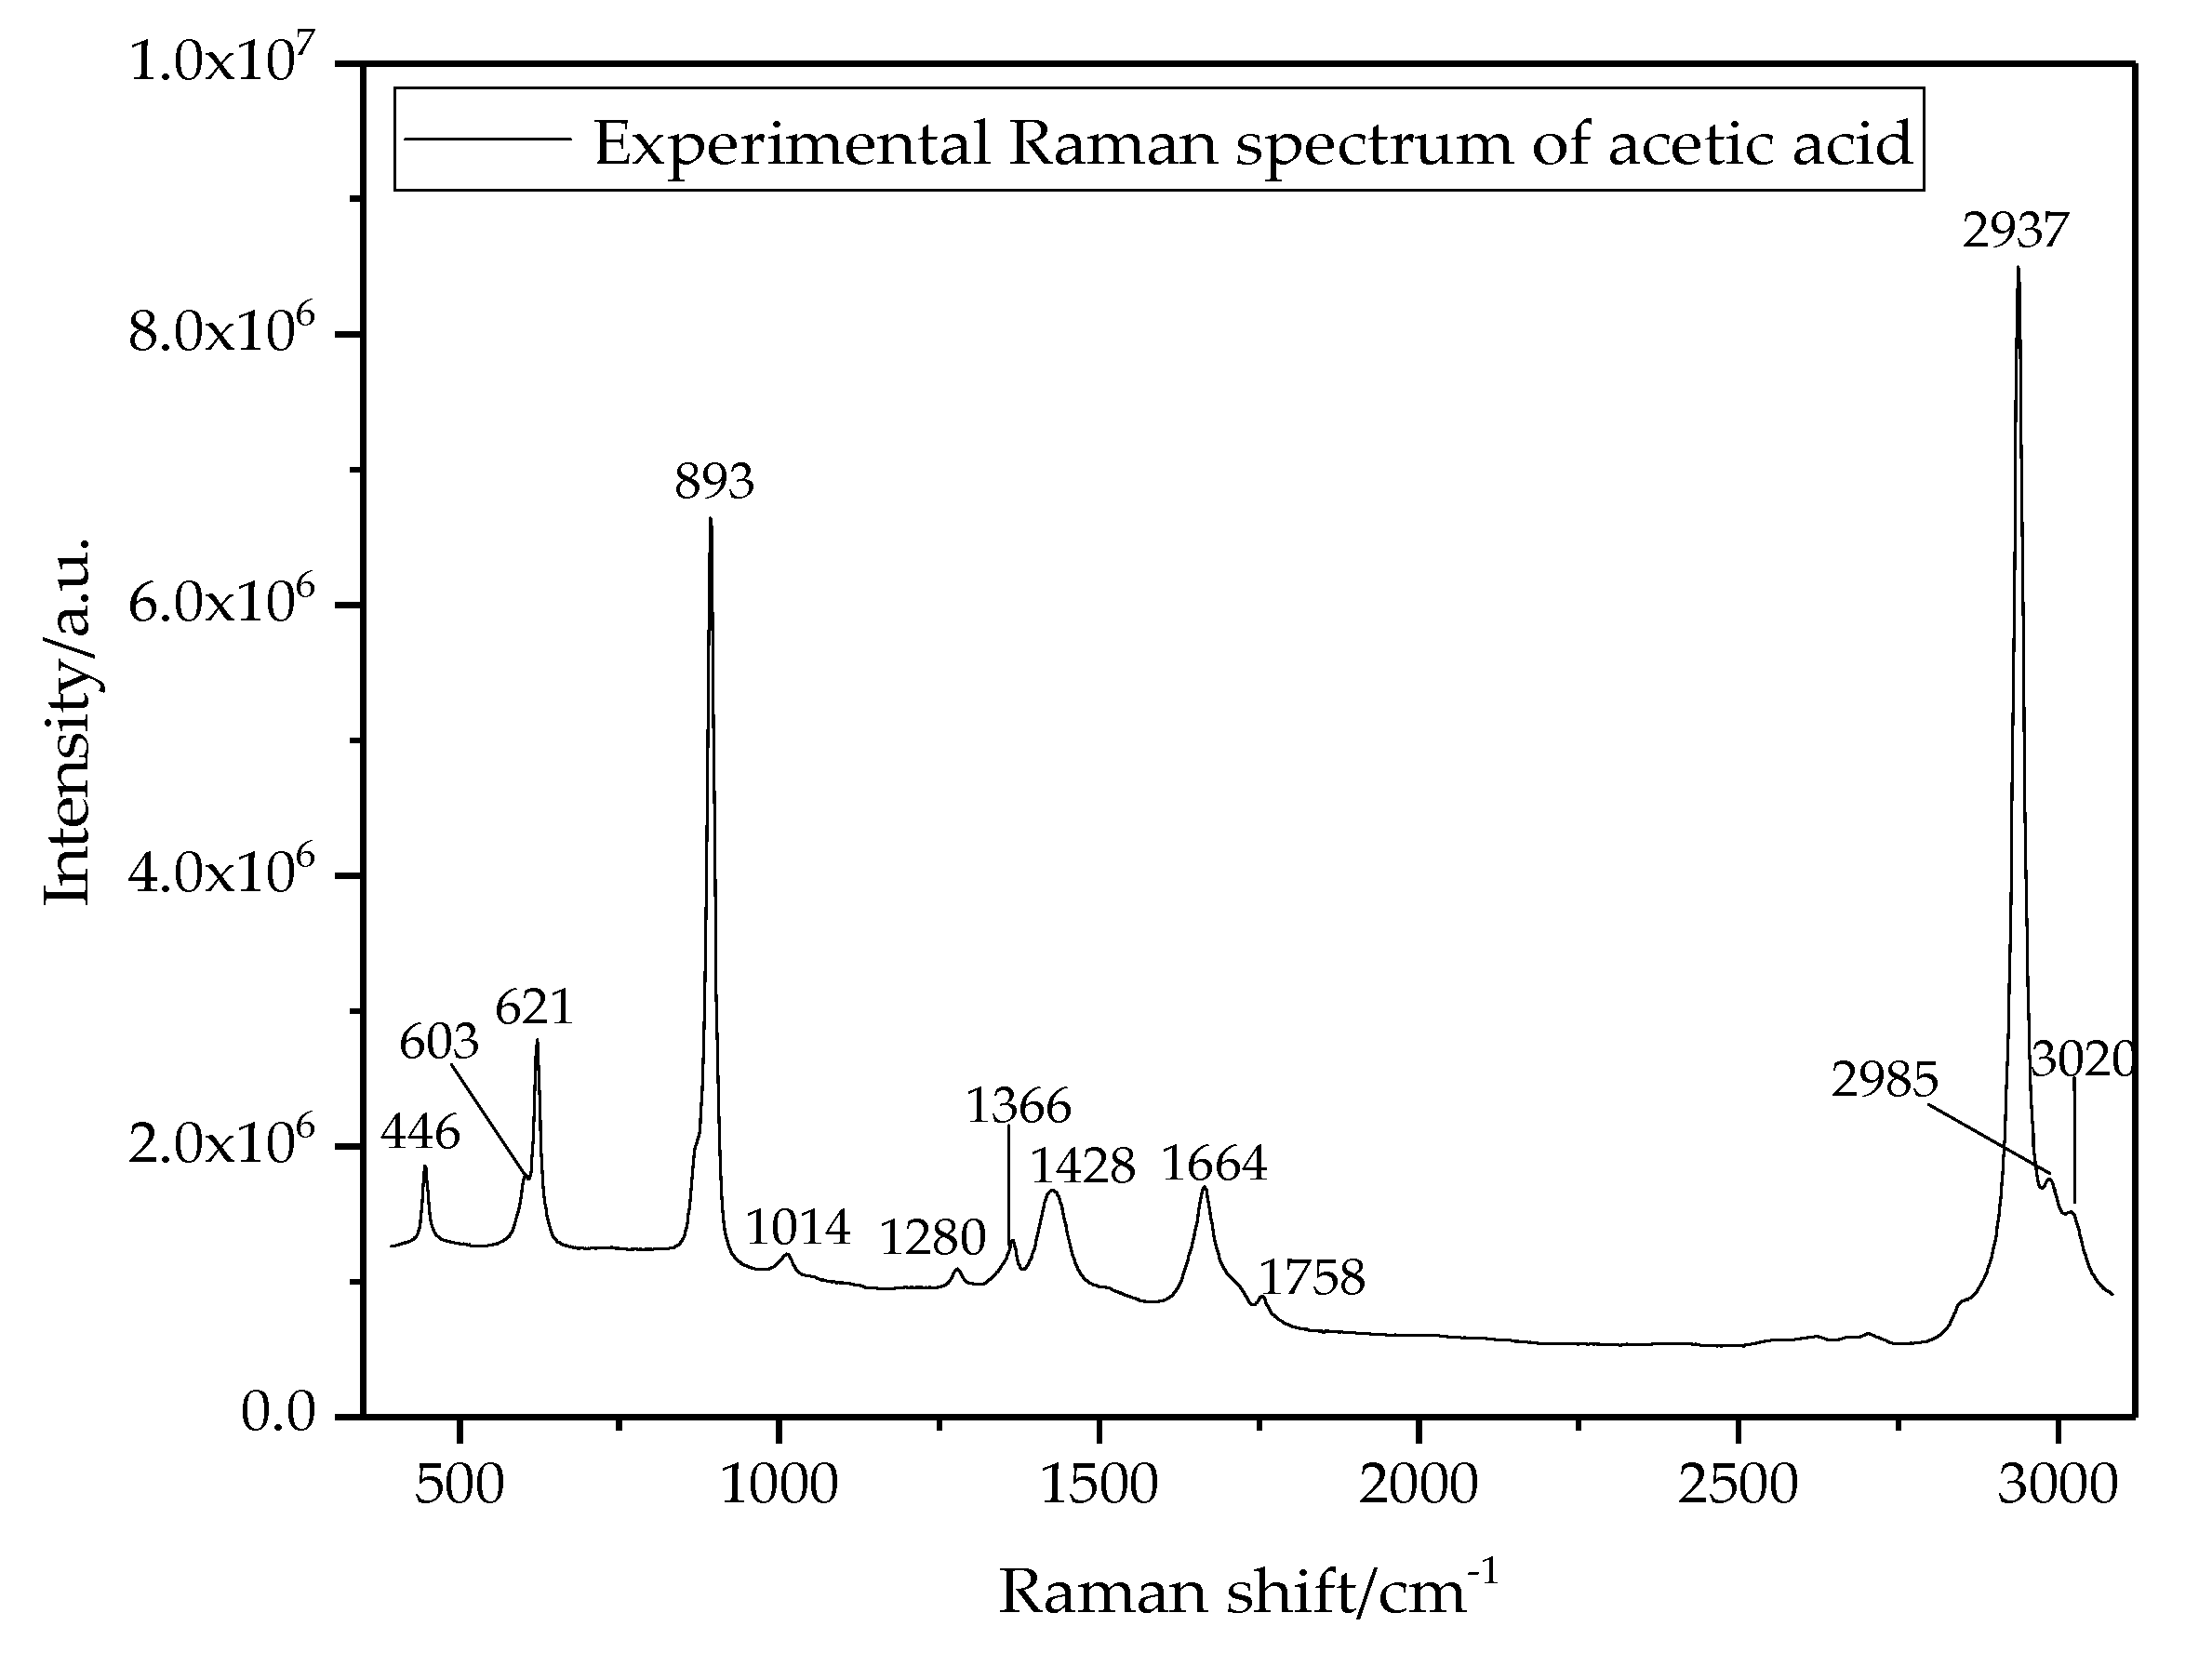
3.2. Raman Shift Spectral Lines of Acetic Acid

With a needle, a drop of pure acetic acid (1 mL) is obtained, placed into the quartz cuvette and the Raman spectral results can be seen in Figure 2. In this, more than ten Raman shift spectral lines of acetic acid are observed and the line at 2937 cm−1 shows a greatest intensity (Table 1, column 3). Besides this, the structural model of acetic acid molecule is constructed using B3LYP function and basis set 6–31G+ of Gaussian 09W software. After optimizing molecular structure parameters (i.e., bond length and bond angle) at the lowest total energy, the stimulated Raman spectrum of acetic acid is obtained as shown in Figure 3 and the Raman shift spectral lines are collected in column 2 of Table 1. Through the stimulation process, the vibration modes corresponding to each Raman shift spectral line are identified. The CH3 stretching vibration of acetic acid results in producing Raman scattering line at 2937 cm−1. The scattering line at 546, 1054, 1131 cm−1 is too weak to be measured, which causes the experimental numbers of Raman shift spectral lines to be less than the stimulated value. Moreover, harmonic approximate phenomenon also results in the difference between experimental and stimulated results [30]. However, neither of these two phenomena affects the analysis of oil-dissolved acetic acid directly, because only one Raman shift spectral line is enough to achieve qualitative and quantitative analysis, which will be elaborated in the next section.

3.3. Characteristic Raman Shift Spectral Line of Oil-Dissolved Acetic Acid

Pure transformer oil, pure acetic acid, and 40 mg/mL acetic acid solution dissolved in transformer oil with volume of 1 mL are measured and the results are shown in Figure 4a–c, respectively. Comparing these three figures, some points have been concluded as follows:
(1)
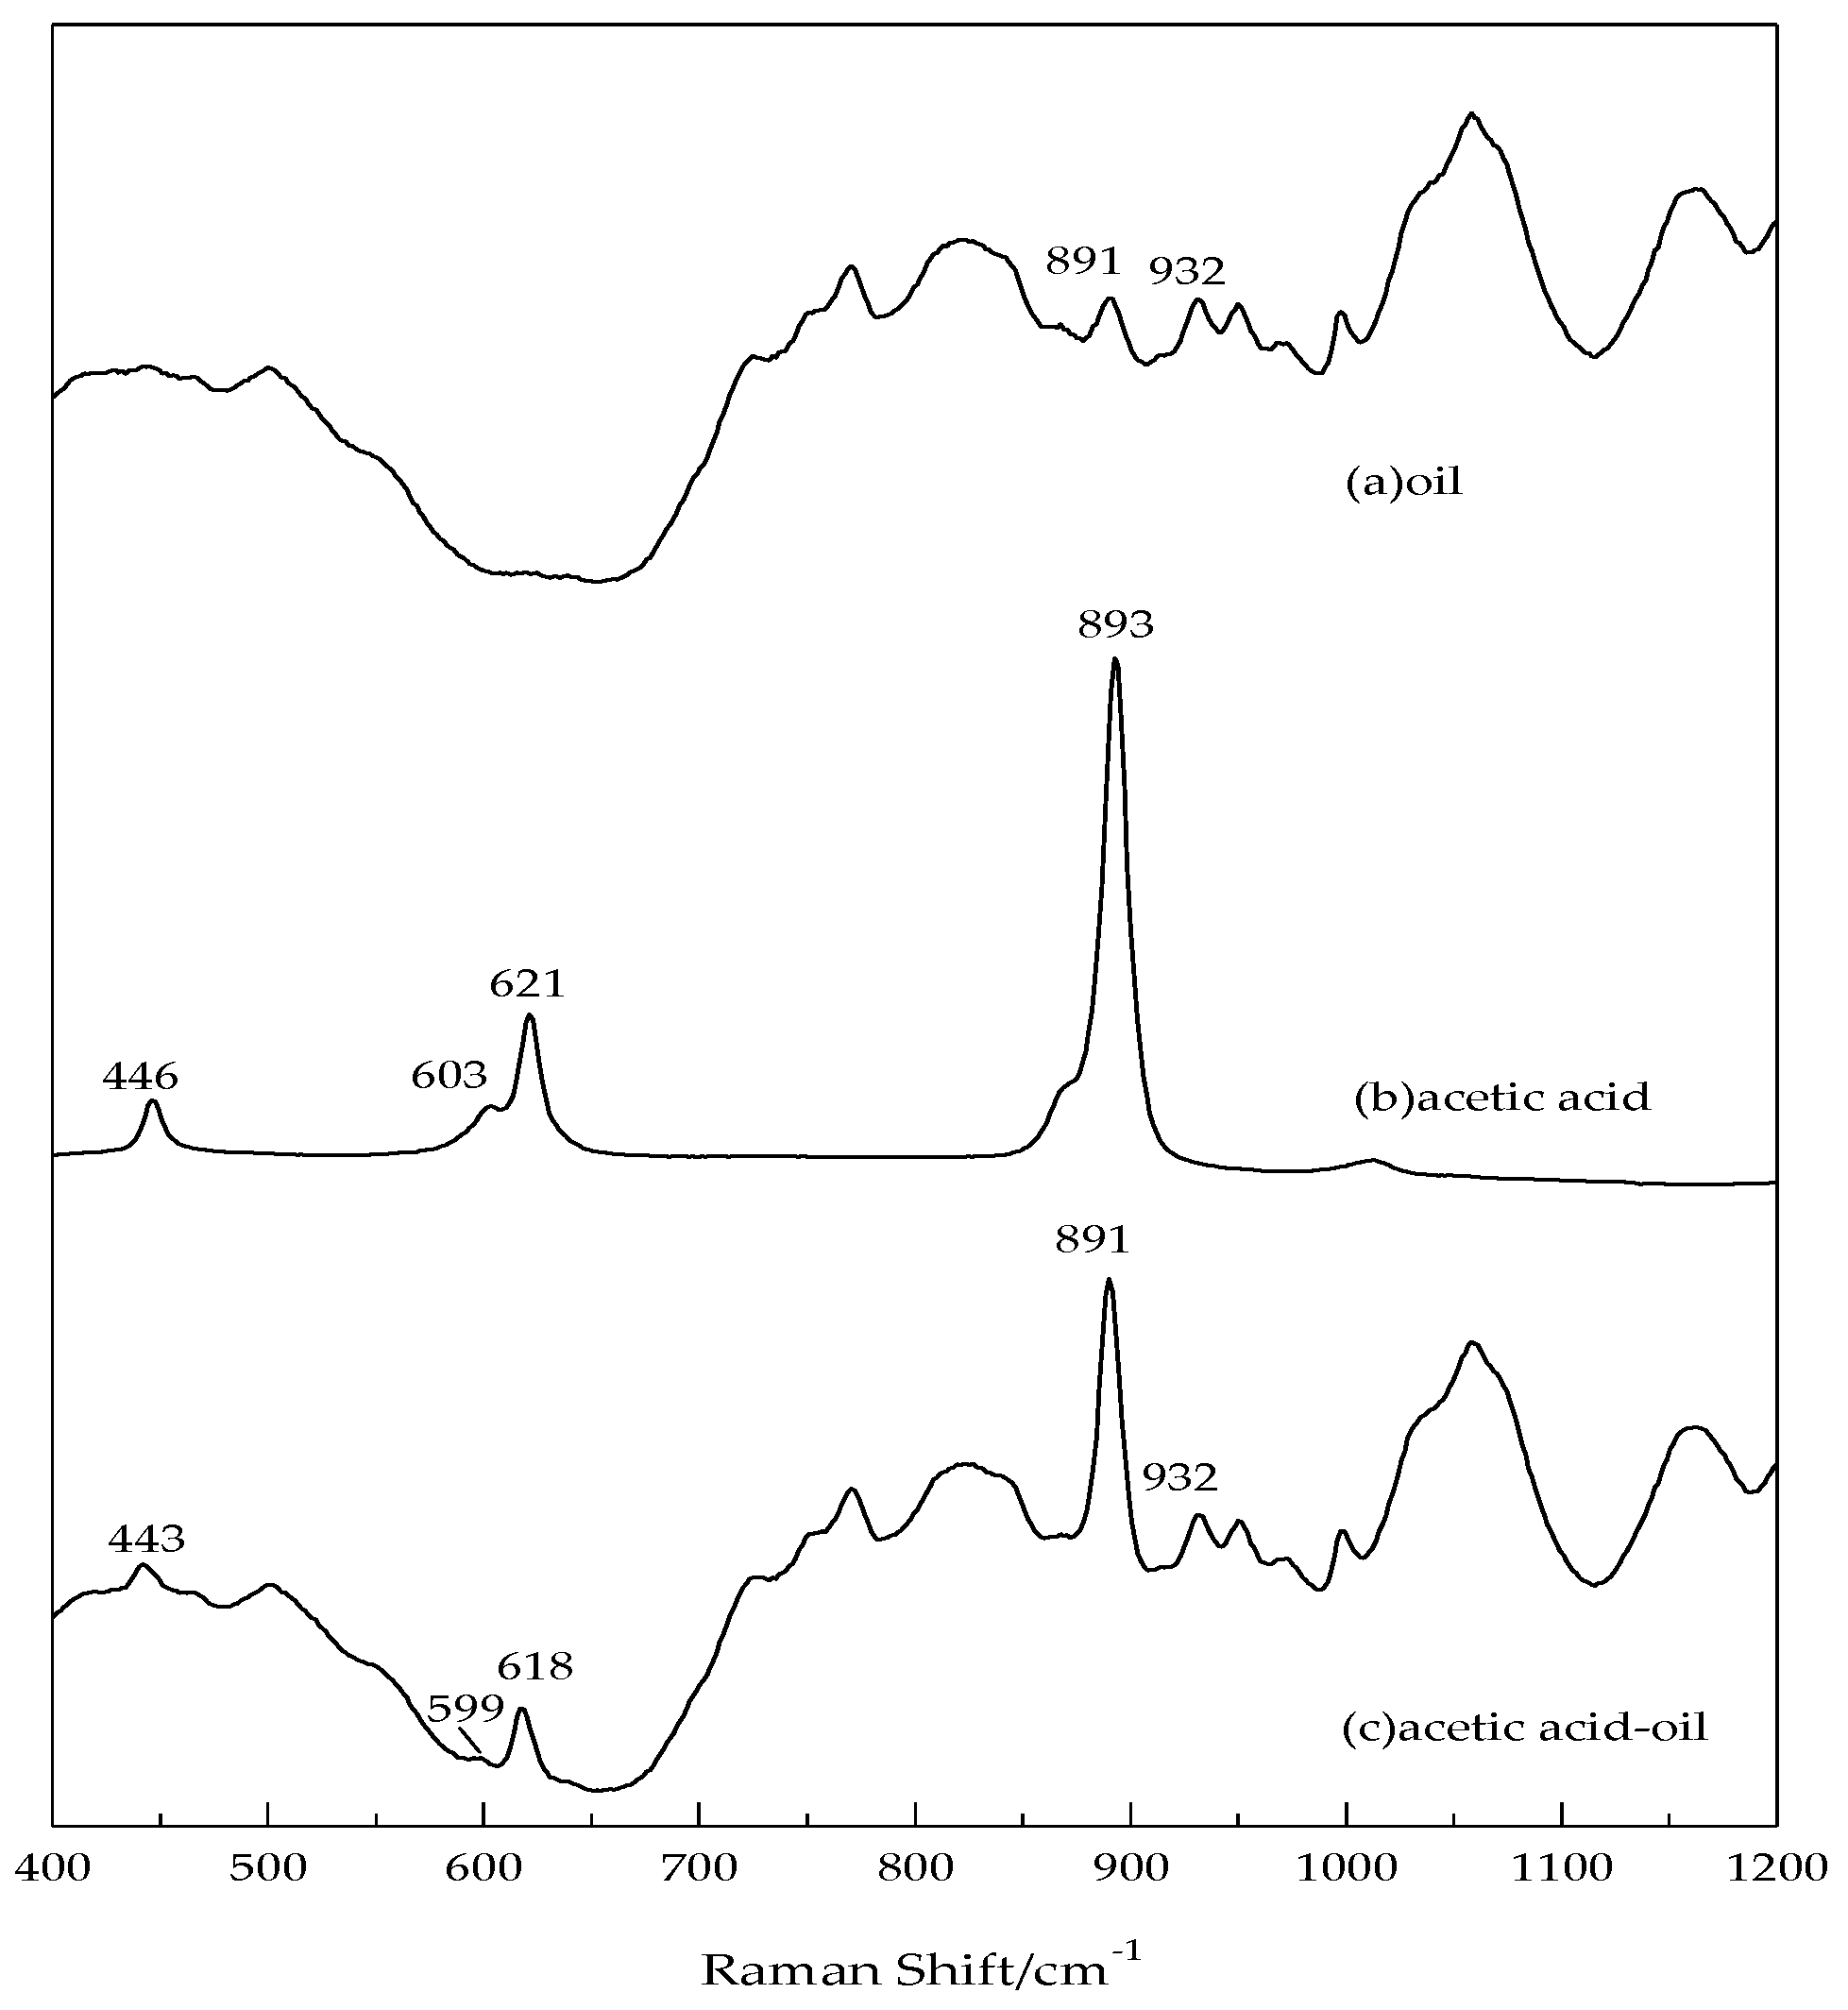
The Raman lines of pure oil have strong interference and will cover many Raman lines of acetic acid. Only in a range between 400 cm−1 and 1200 cm−1, the pure oil has no Raman lines or with low intense lines, which has little effect on the measurement of oil-dissolved acetic acid. Therefore, this range is identified as the detection interval.
(2)
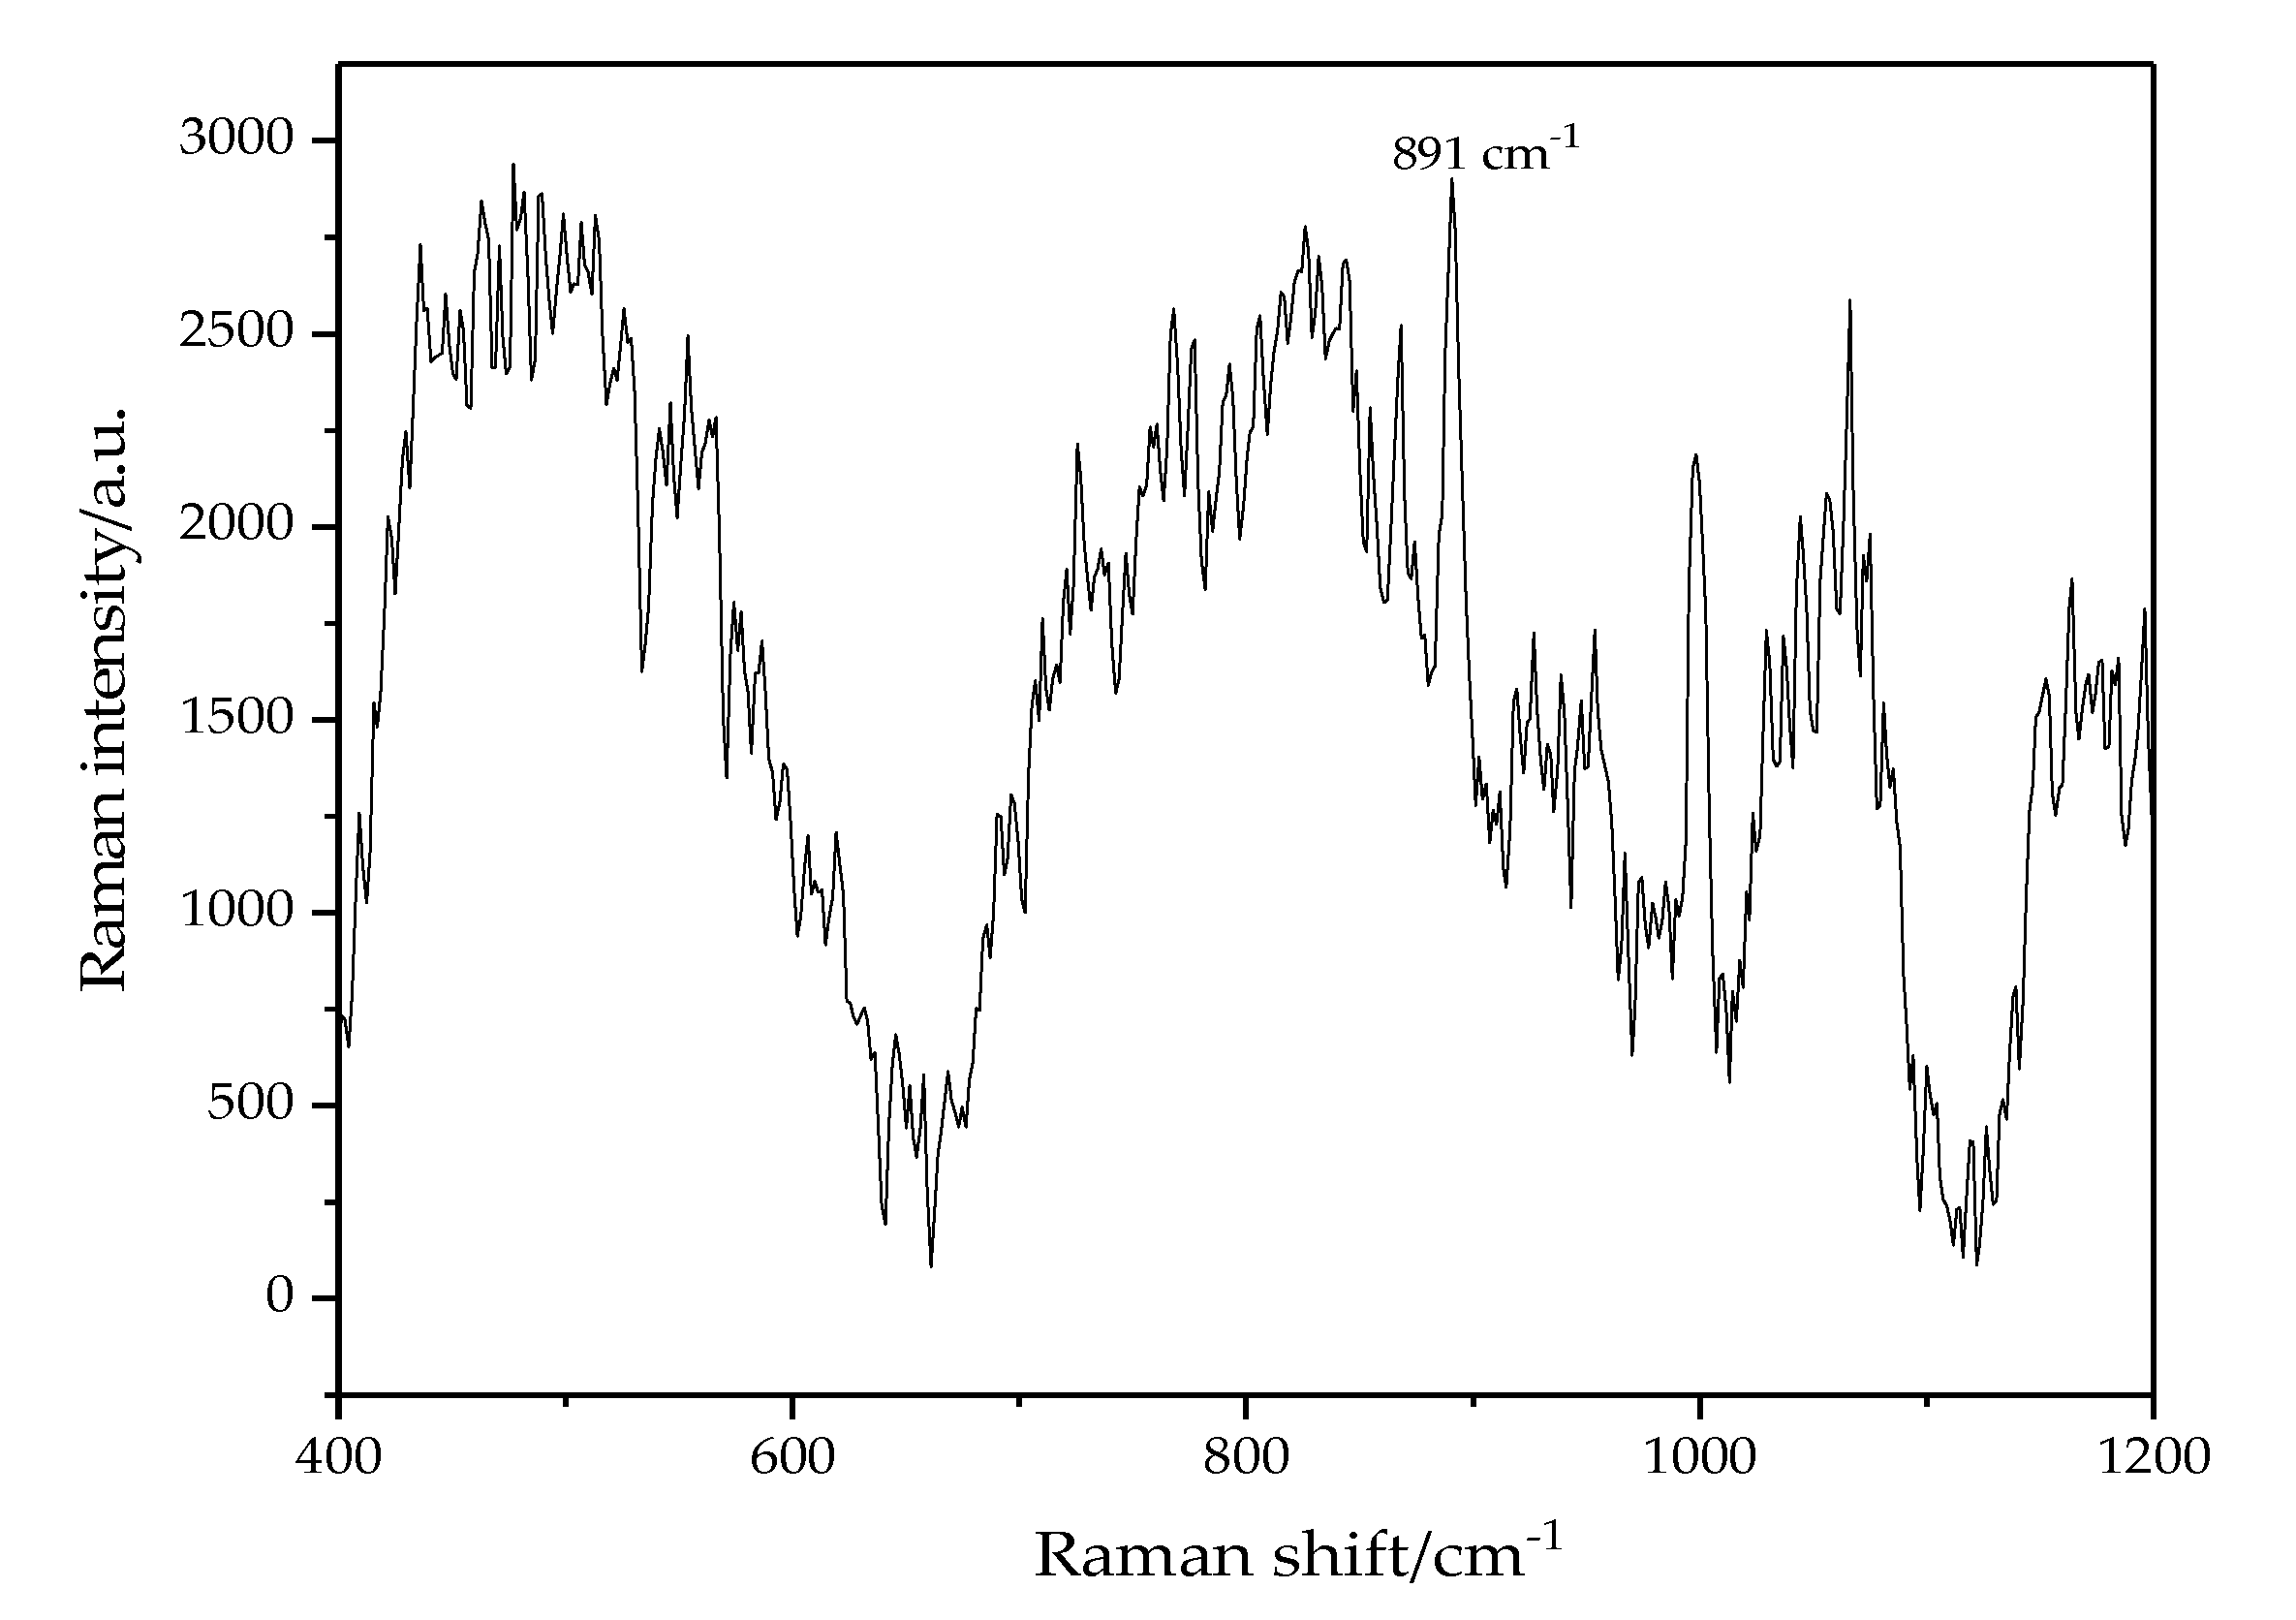
In this detection interval, obvious Raman shift lines of oil-dissolved acetic acid are at 443 cm−1, 599 cm−1, 618 cm−1 and 891 cm−1, which correspond to lines of pure acetic acid at 446 cm−1, 603 cm−1, 621 cm−1, 893 cm−1. The difference of 2~4 cm−1 is called blue-shift, mainly attributing to influence of transformer oil on Raman vibration mode of acetic acid.
(3)
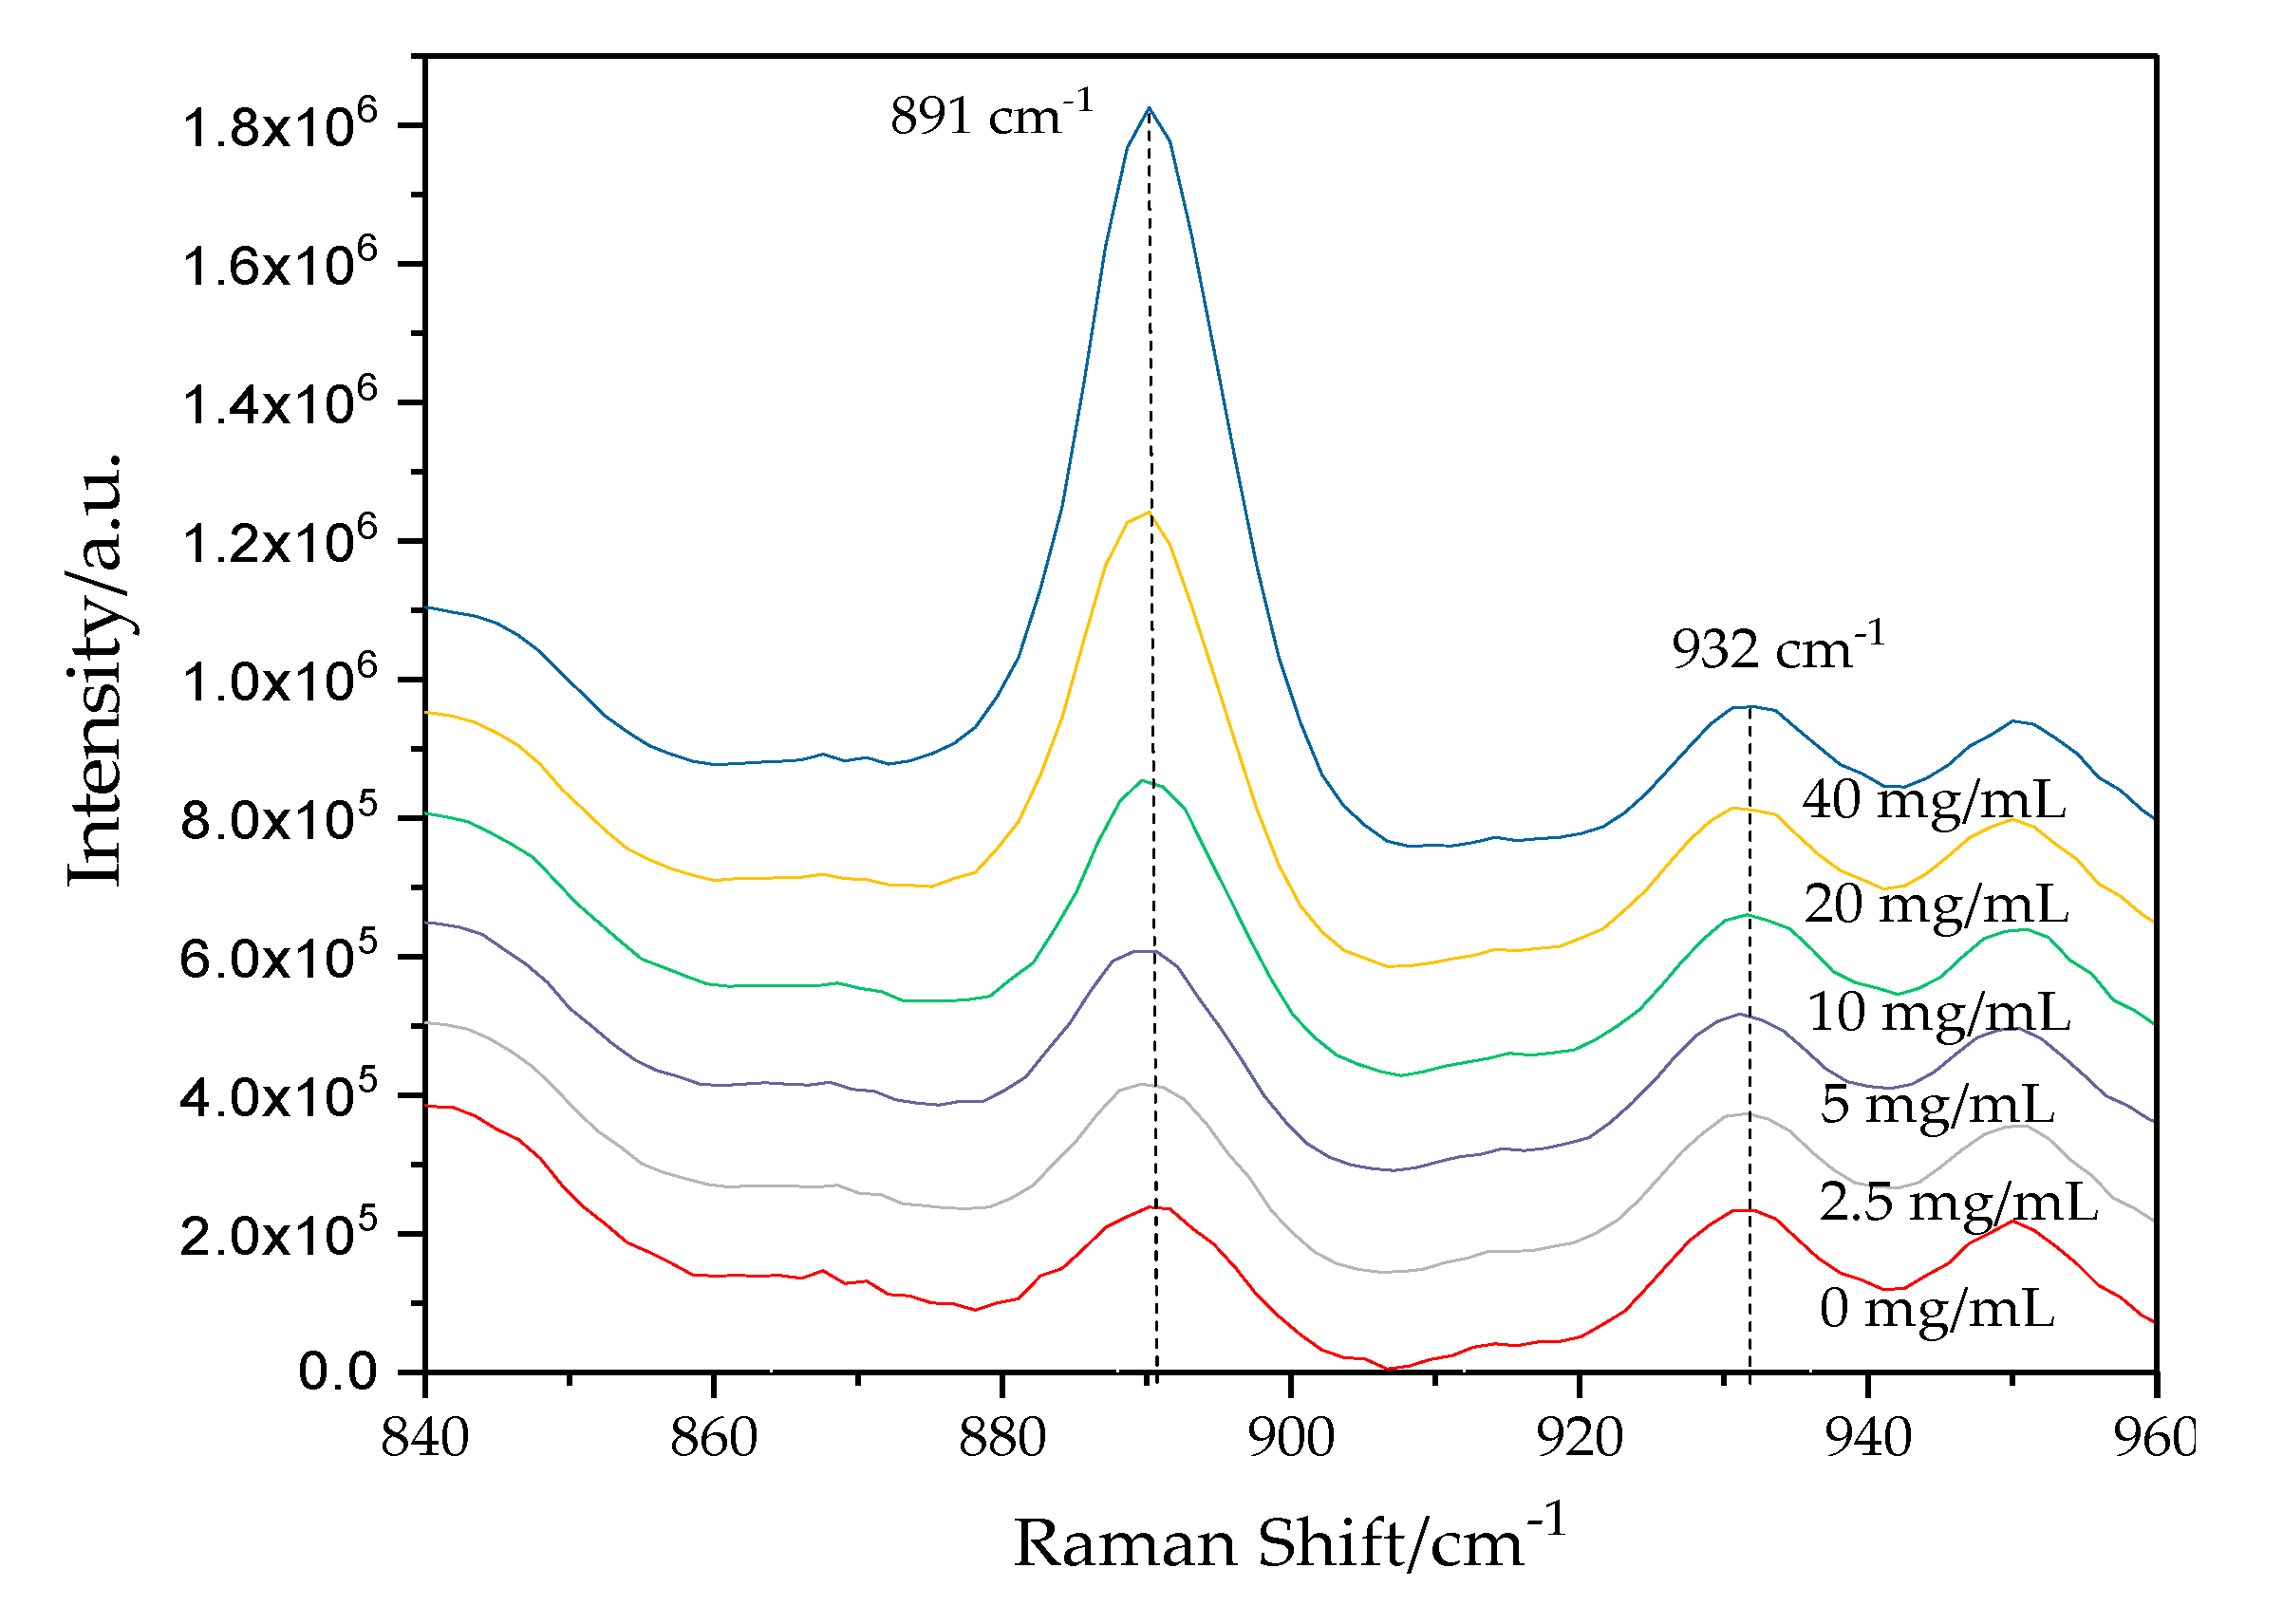
The most intense Raman shift line of acetic acid solution is 891 cm−1, corresponding to H–C–H symmetrical swing and O–H swing modes. Since the concentration of pure oil is constant, its effect on intensity of Raman line at 891 cm−1 and 932 cm−1 can be also regarded as a constant value. The low interference of oil on oil-dissolved acetic acid detection at 891 cm−1 can be eliminated when cutting down the constant value of Raman intensity of pure oil. In this experiment, for better detection limit of acetic acid, 891 cm−1 is taken as the characteristic Raman shift spectral line of oil-dissolved acetic acid and used for its qualitative and quantitative analysis. Besides, the Raman line of pure oil at 932 cm−1 is taken as an internal standard for improved detection accuracy.

3.4. Platform Parameters Optimization

To get higher signal intensity (detection limit) and better spectral resolution (detection accuracy), the platform detection parameters (laser power, grating, slit width, exposure time and accumulation number) are optimized.

3.4.1. Laser Power and Grating

The Raman scattering intensity of sample species j, R I j , is linearly associated with signal losses, k, differential scattering cross section, σ j Ω , collection efficiency, d Ω , laser intensity, I 0 , optical interaction length between laser light and samples, l, and concentration of sample species j, C j , which can be written as [31]:
R I j = k Ω σ j Ω d Ω I 0 l C j
where Ω corresponds to collection geometry of Raman scattering. So, in this system, the laser power is set at its maximum value of 100 mW. The 50× micro-objective and grating with 600 lines per mm is selected to achieve best collection efficiency and spectral resolution, respectively.

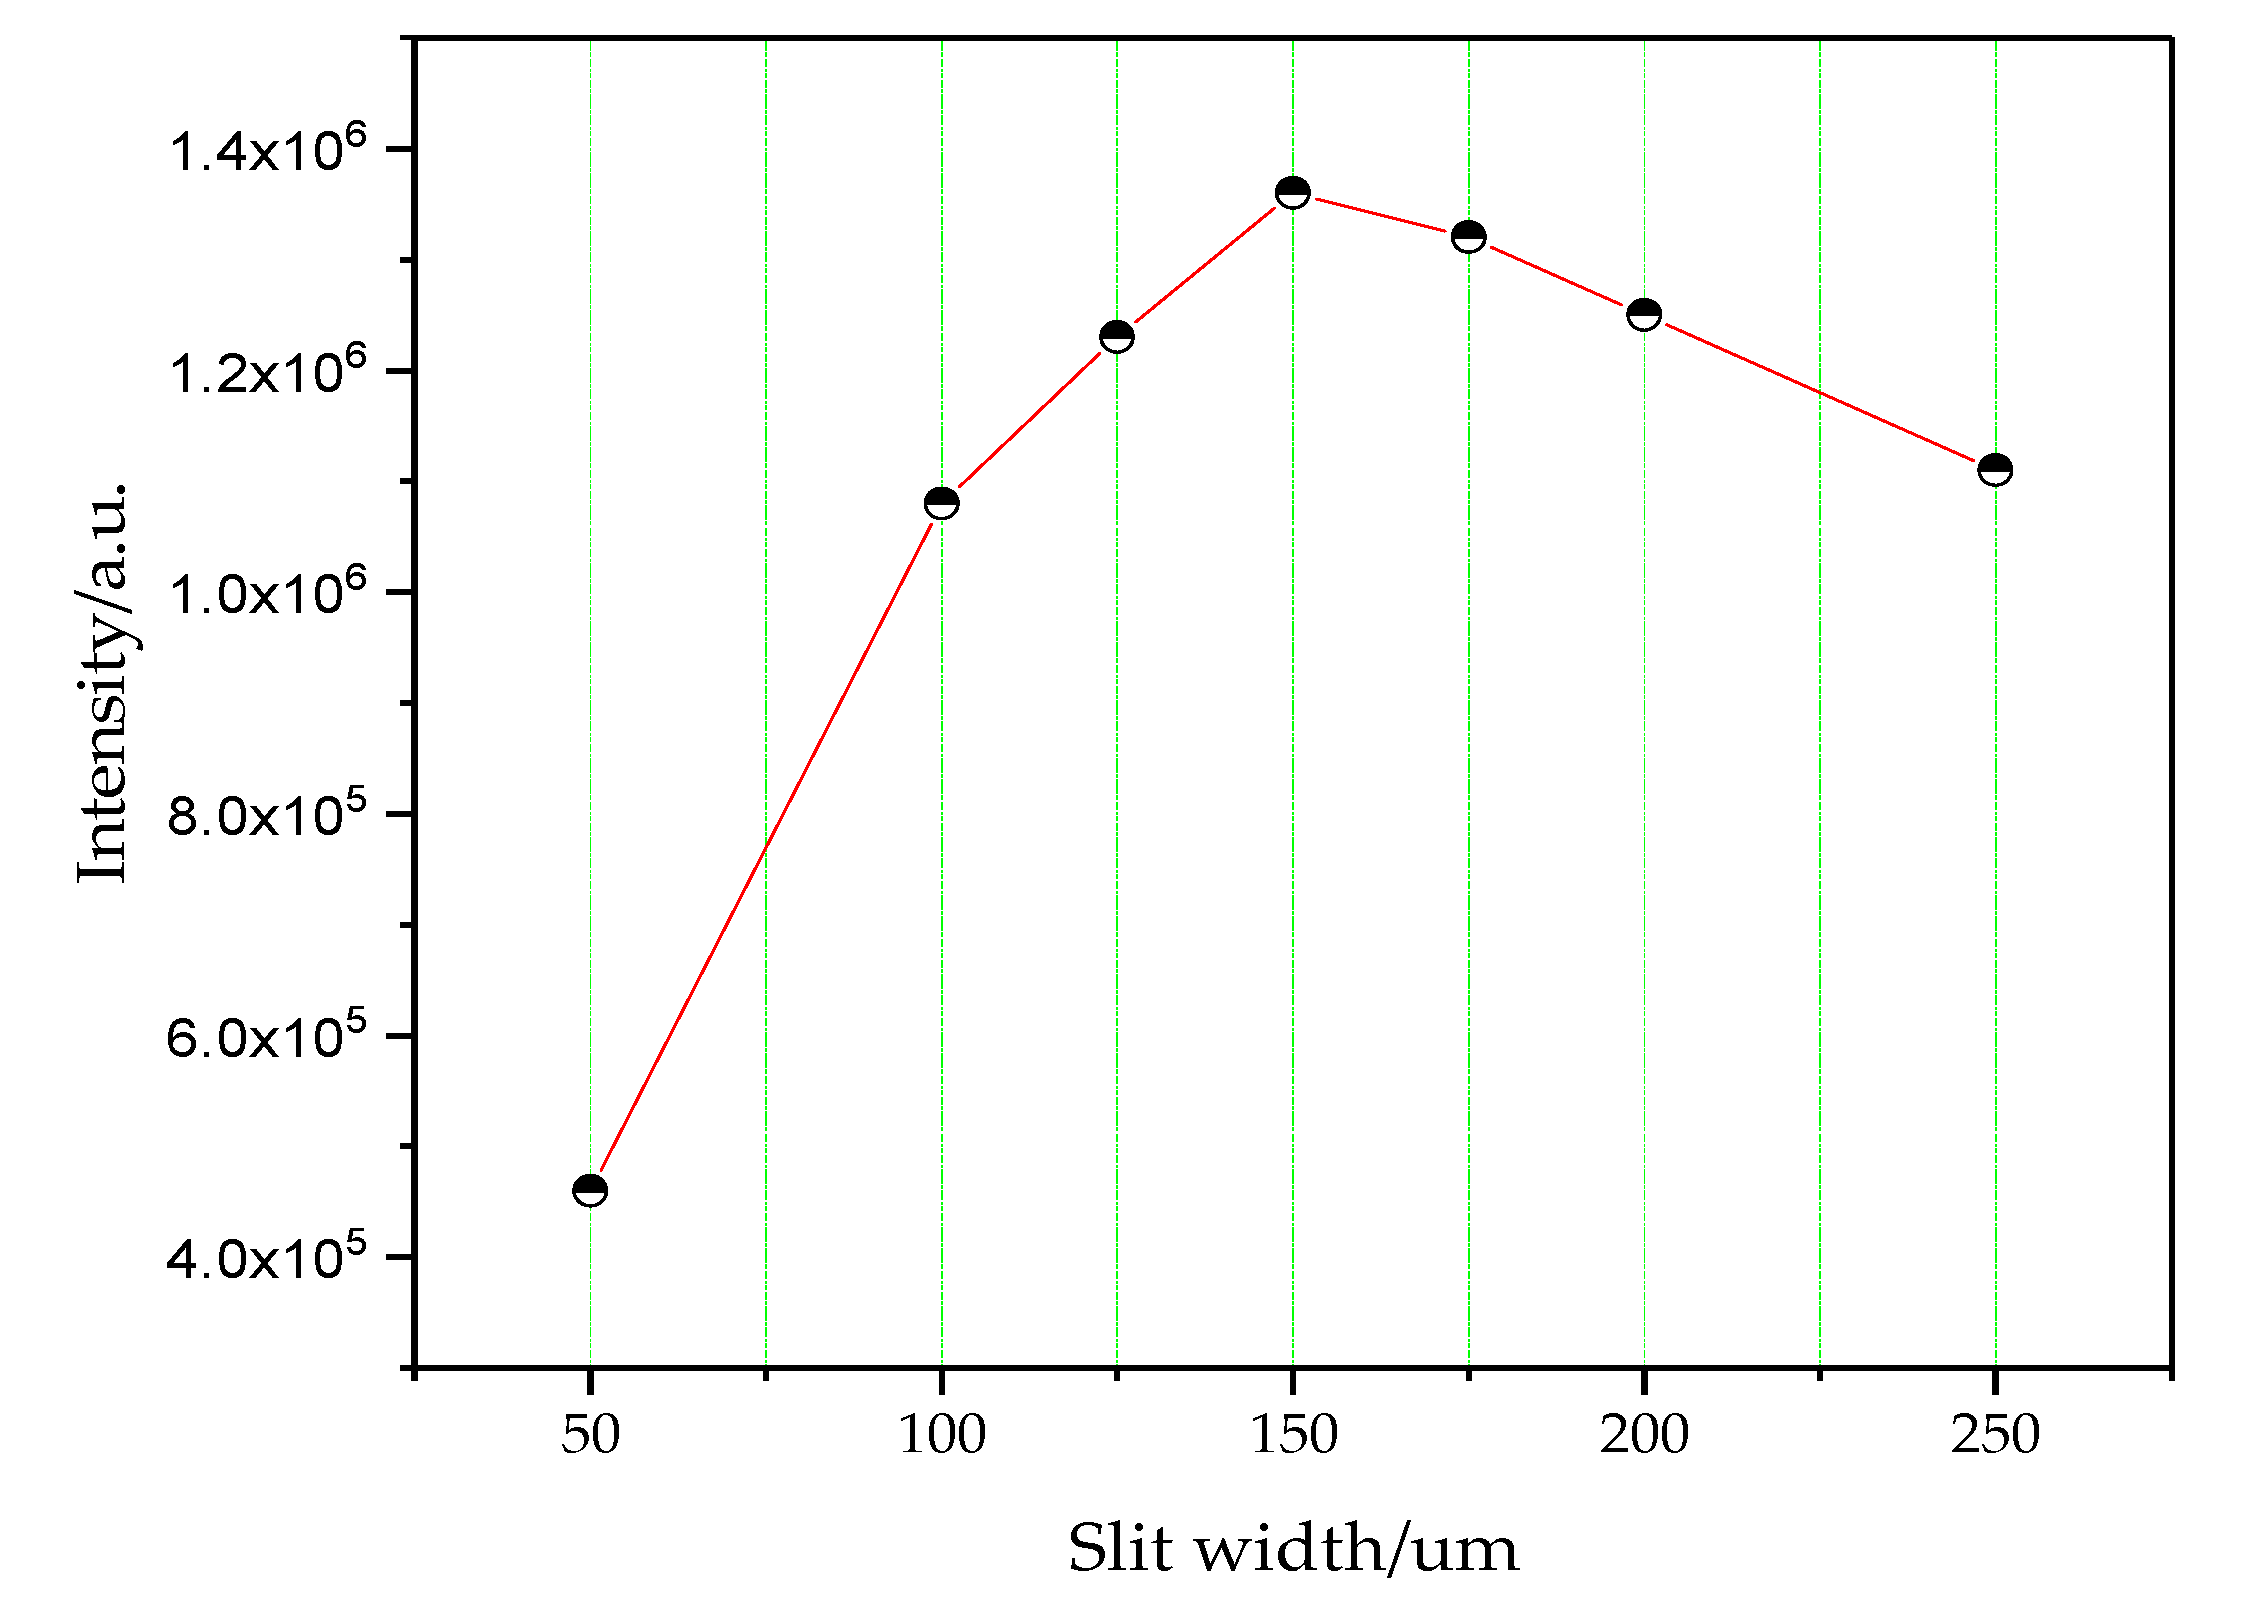
3.4.2. Selection of Slit Width

The slit width of different values with 50, 100, 125, 150, 175, 200 and 250 μm are used for detecting 40 mg/mL acetic acid-transformer oil solution, repetitively. As can be shown in Figure 5, the Raman intensity at 891 cm−1 demonstrates a trend of initial increase because bigger slit width allows more Raman scattering photons of acetic acid to come into CCD, then reaches a maximum value at slit width of 150 μm. After that, the Raman intensity descends because the generated Raman scattering photons of acetic acid at a certain concentration are constant, but bigger slit width will result in line width broadening effect. Thus, the optimized slit width is set at 150 μm in this experiment to guarantee high signal intensity and good resolution.

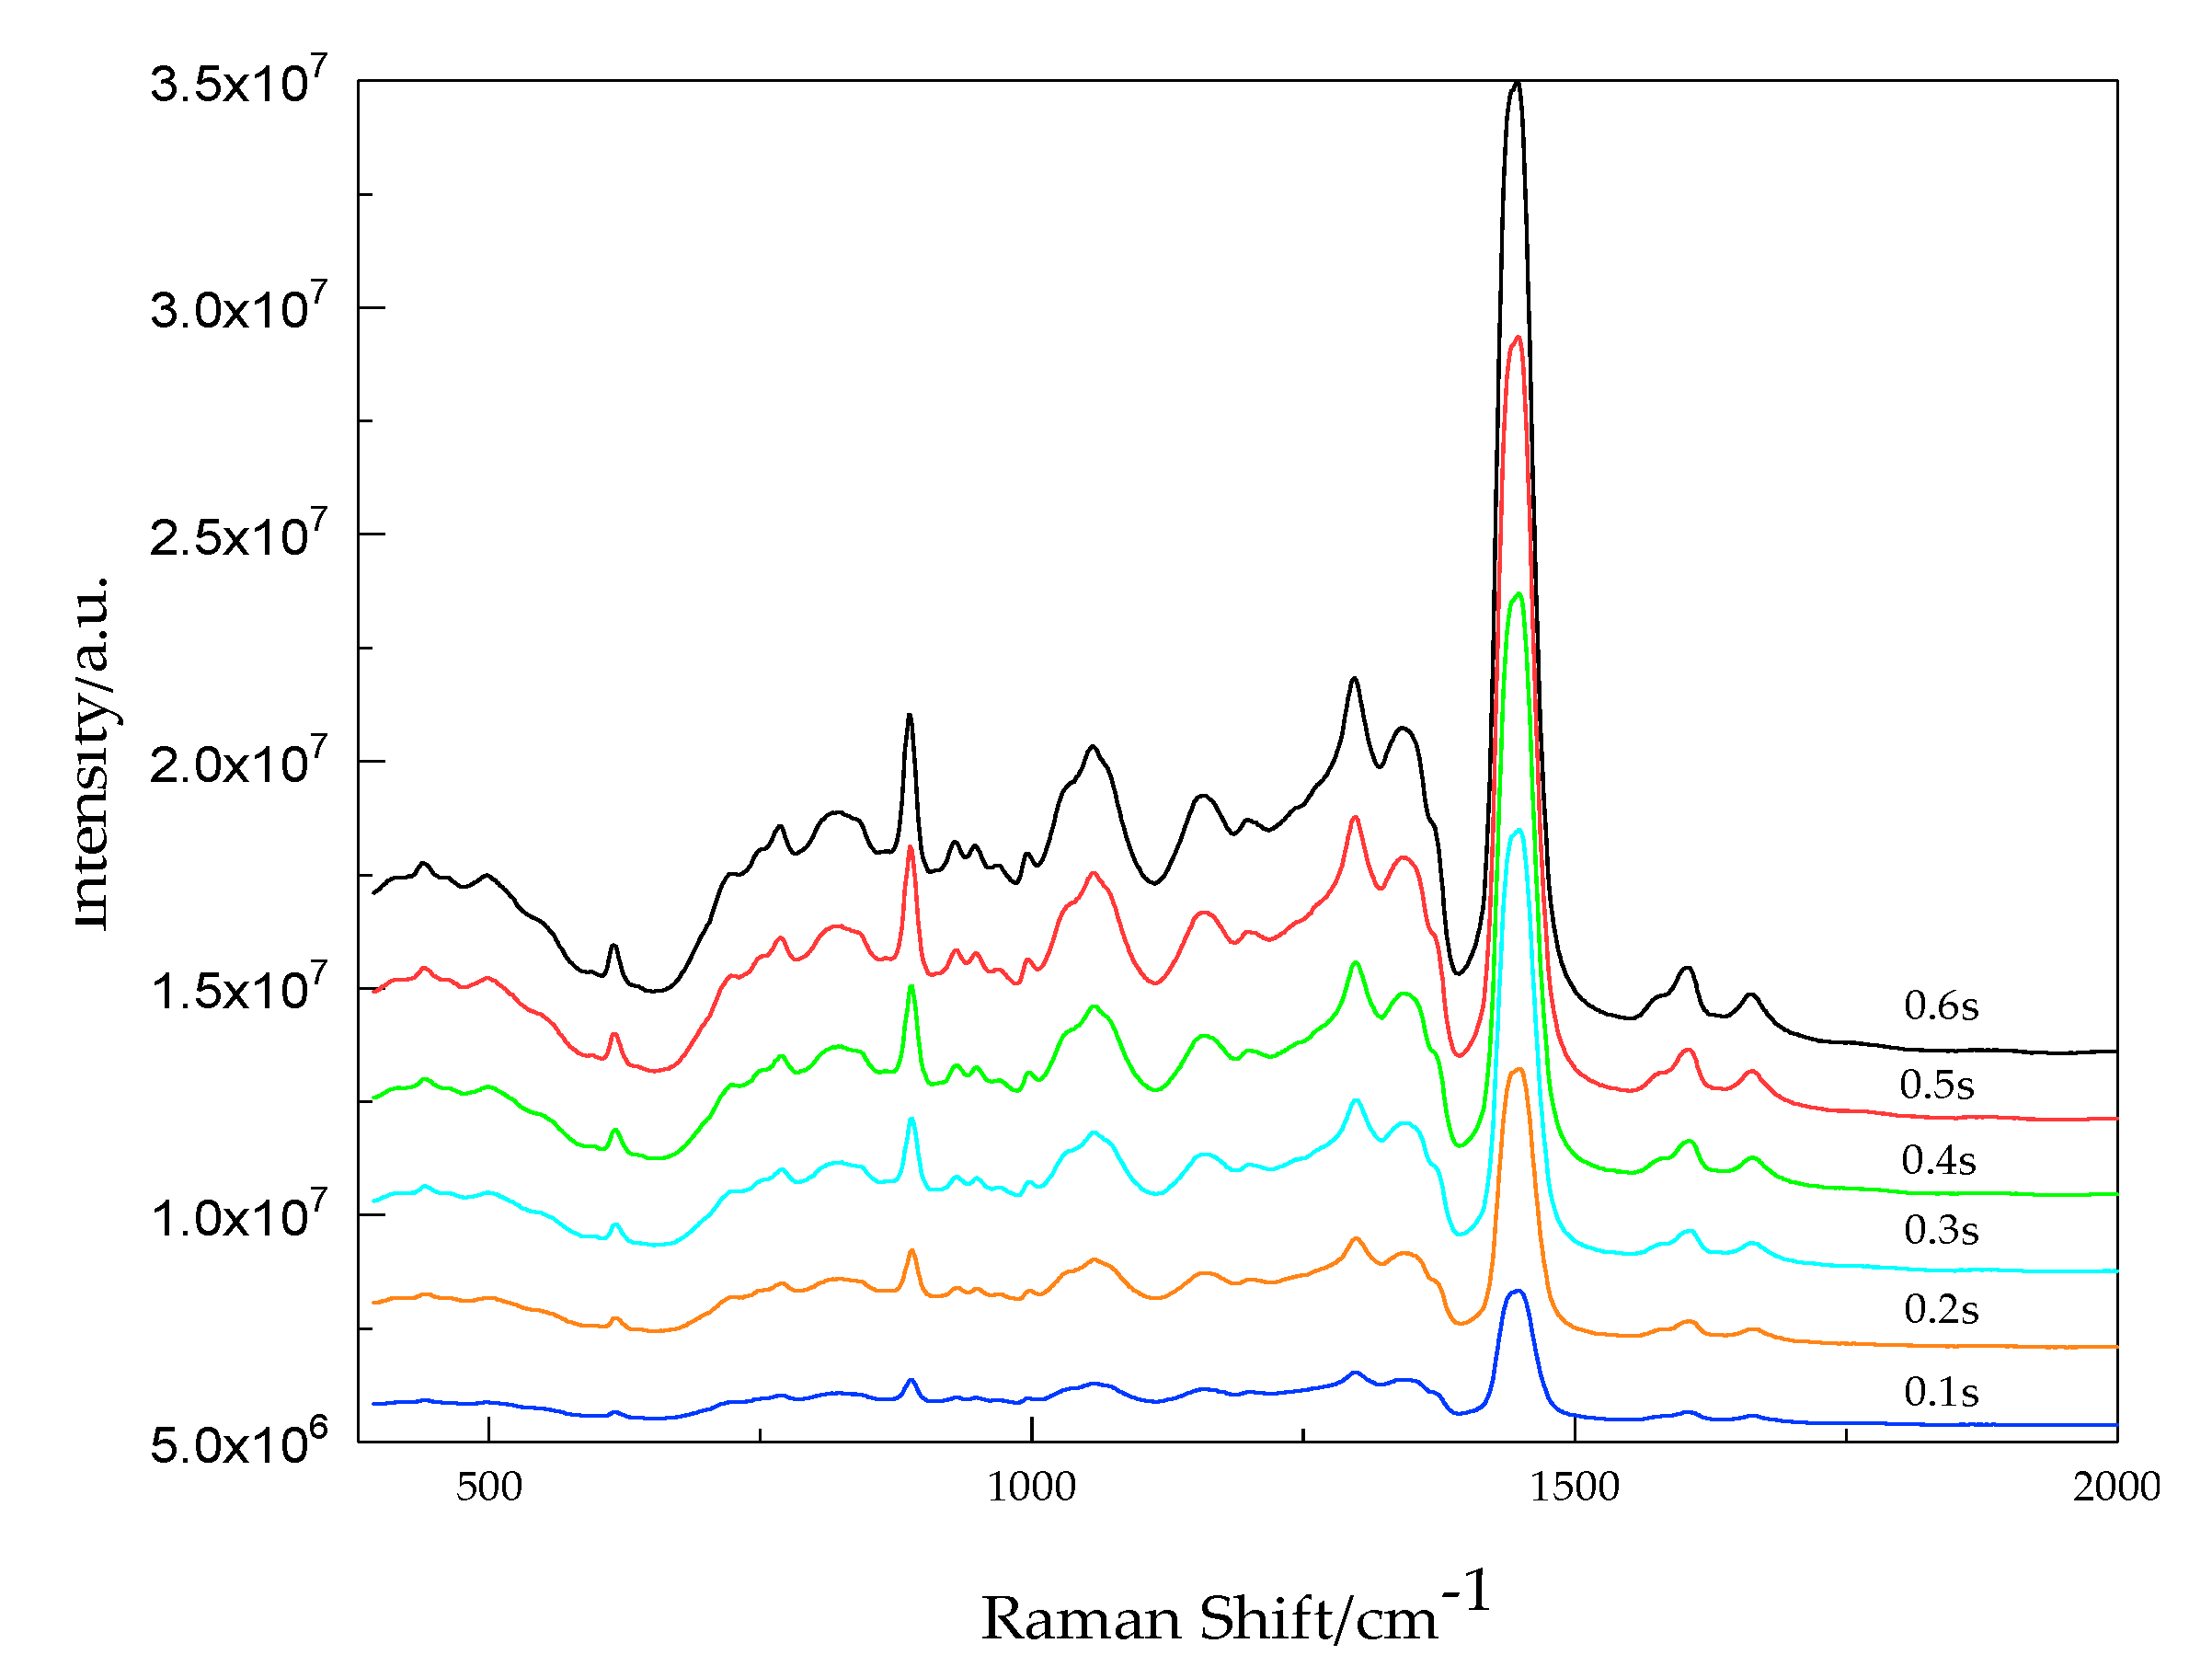
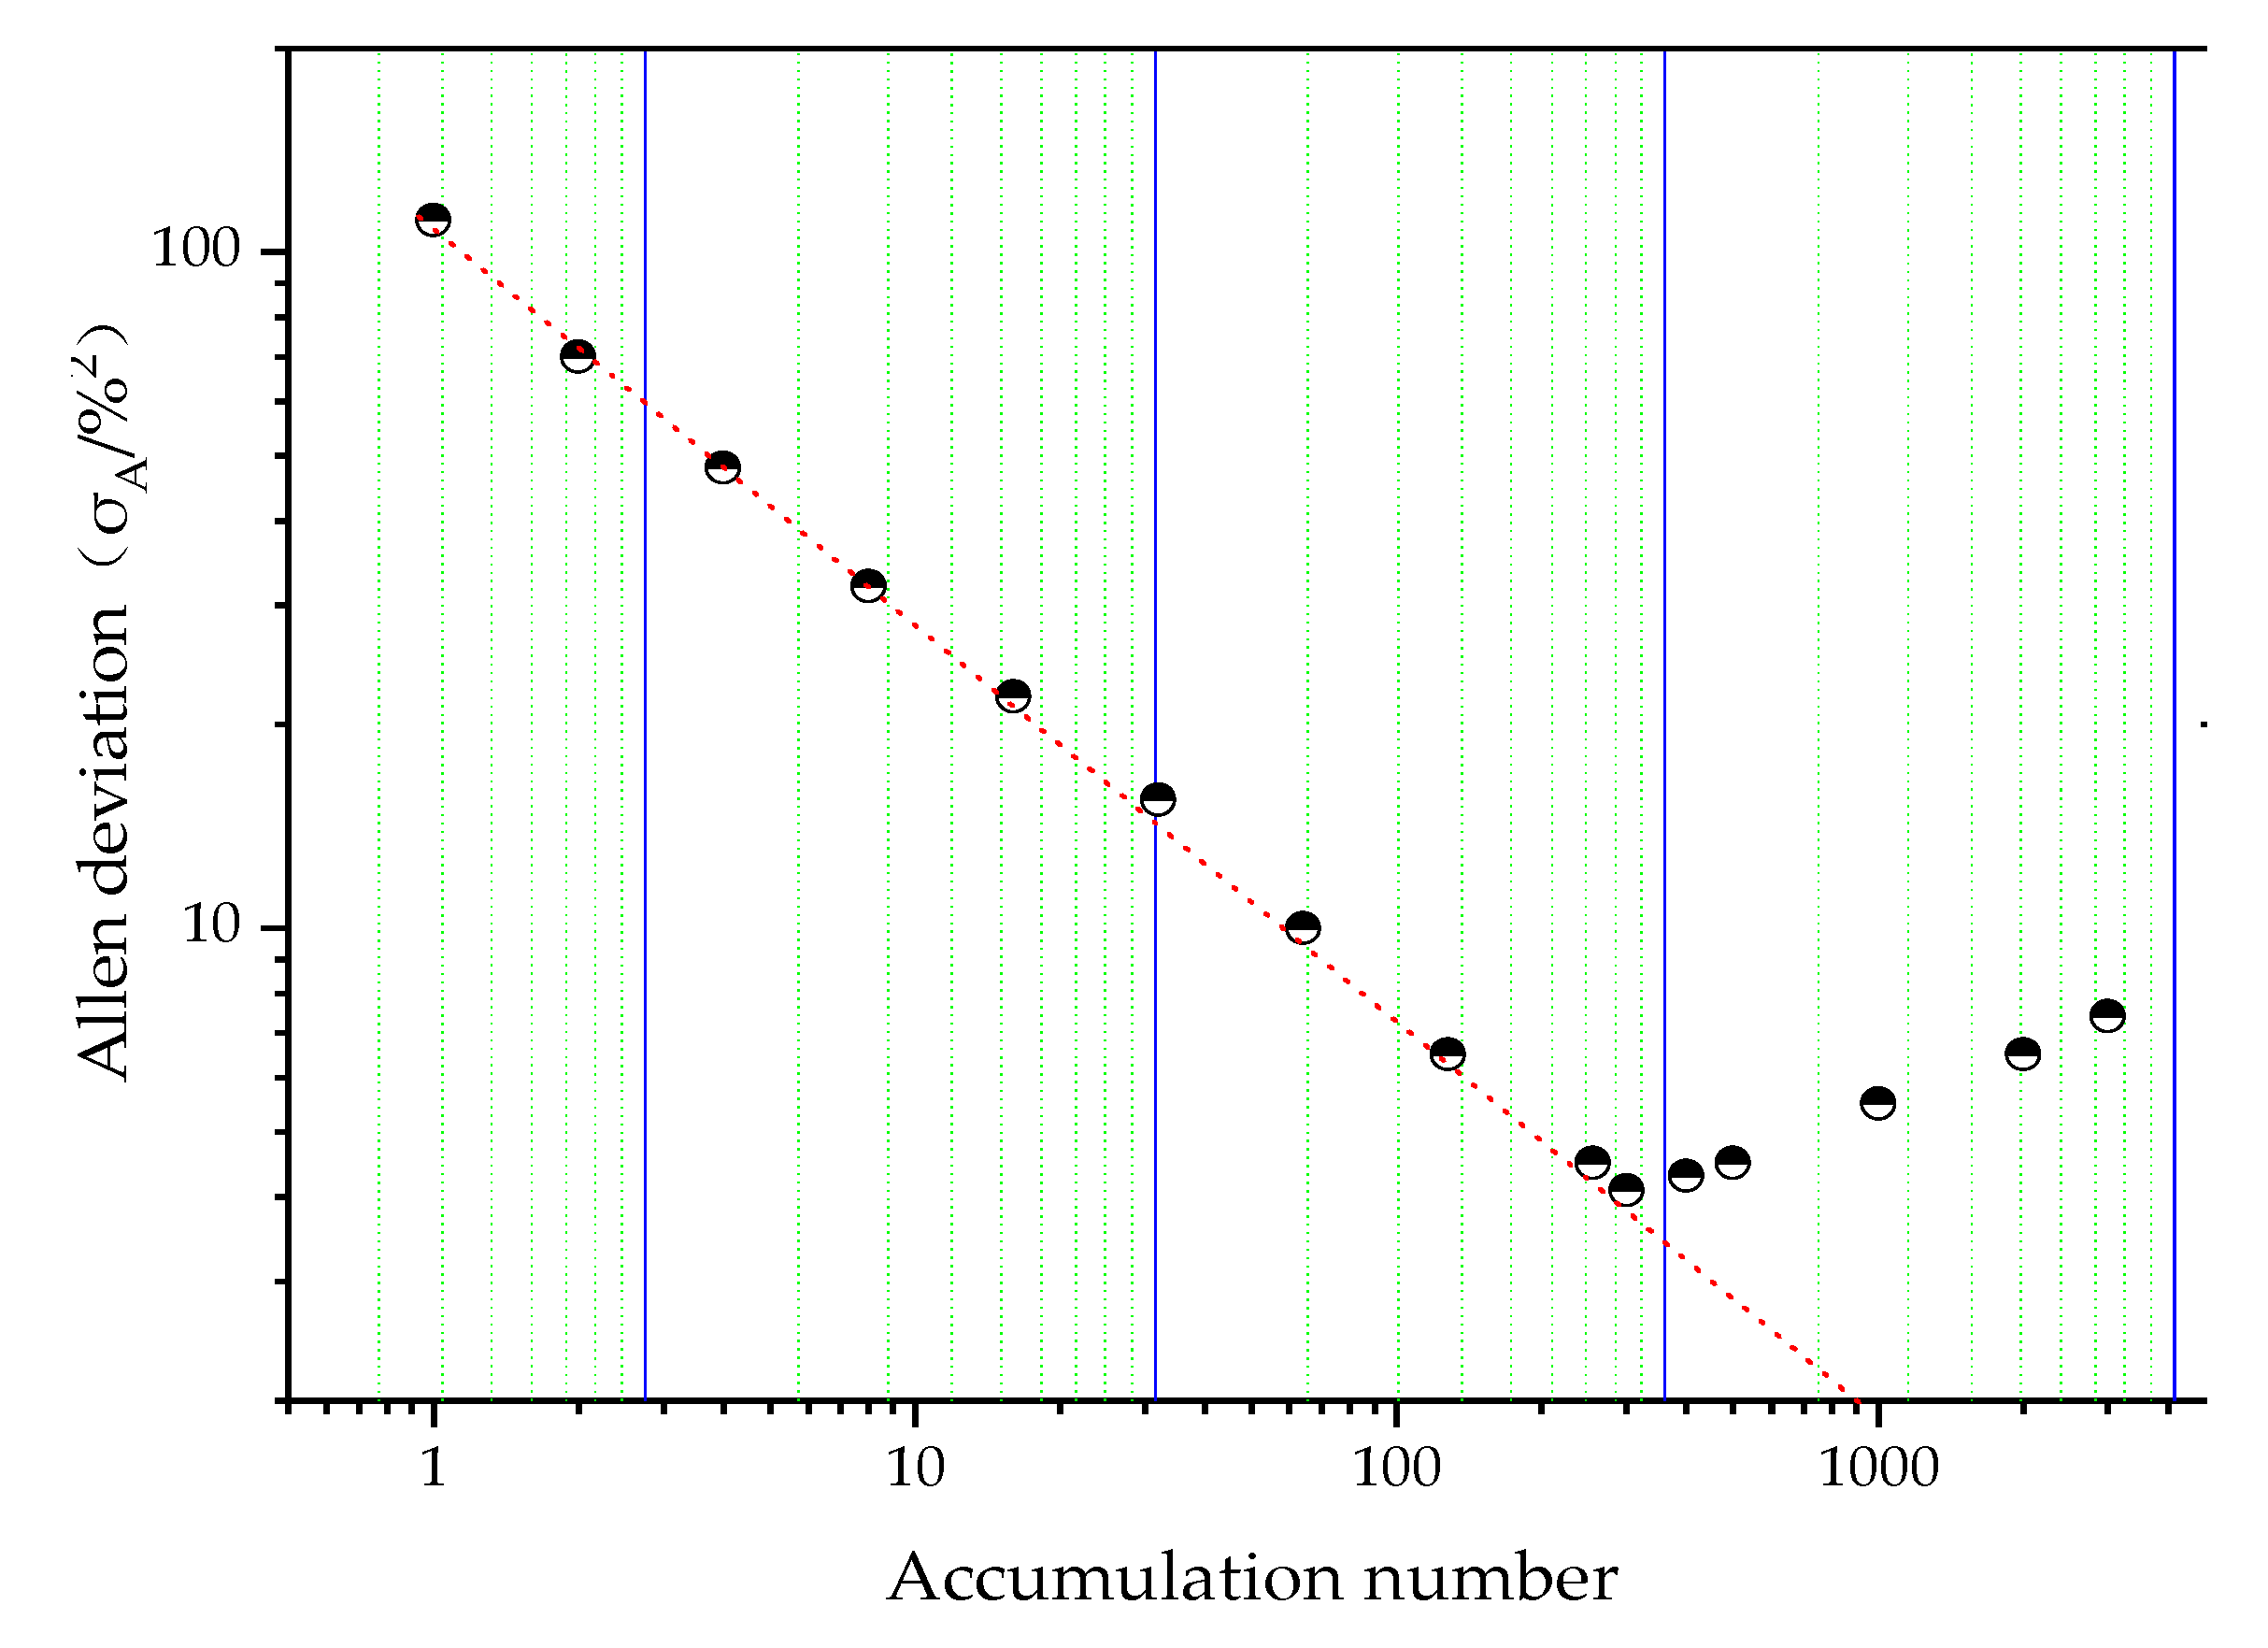
3.4.3. Selection of Exposure time and Accumulation Number

The exposure time at different values with 0.1, 0.2, 0.3, 0.4, 0.5 and 0.6 s are used for detecting 40 mg/mL acetic acid-transformer oil solution again. Figure 6 shows the Raman peak intensity at 891 cm−1 increases along with longer exposure time, which can be explained by additive effects of Raman scattering photons on CCD. As limit of CCD saturation, the maximum value of exposure time is set as 0.6 s in this experiment. Accumulation of Raman signal through analysis software is another way to take use of the additive effect, which can break through the limit of saturation. Ideally, Raman signal or signal-to-noise ratio (SNR) is linearly associated with accumulation number. However, this linear relation only exists for a short time because of drift phenomenon from hardware system. The best accumulation number is determined as 300, according to Allan deviation analysis [32], as shown in Figure 7.

4. Results

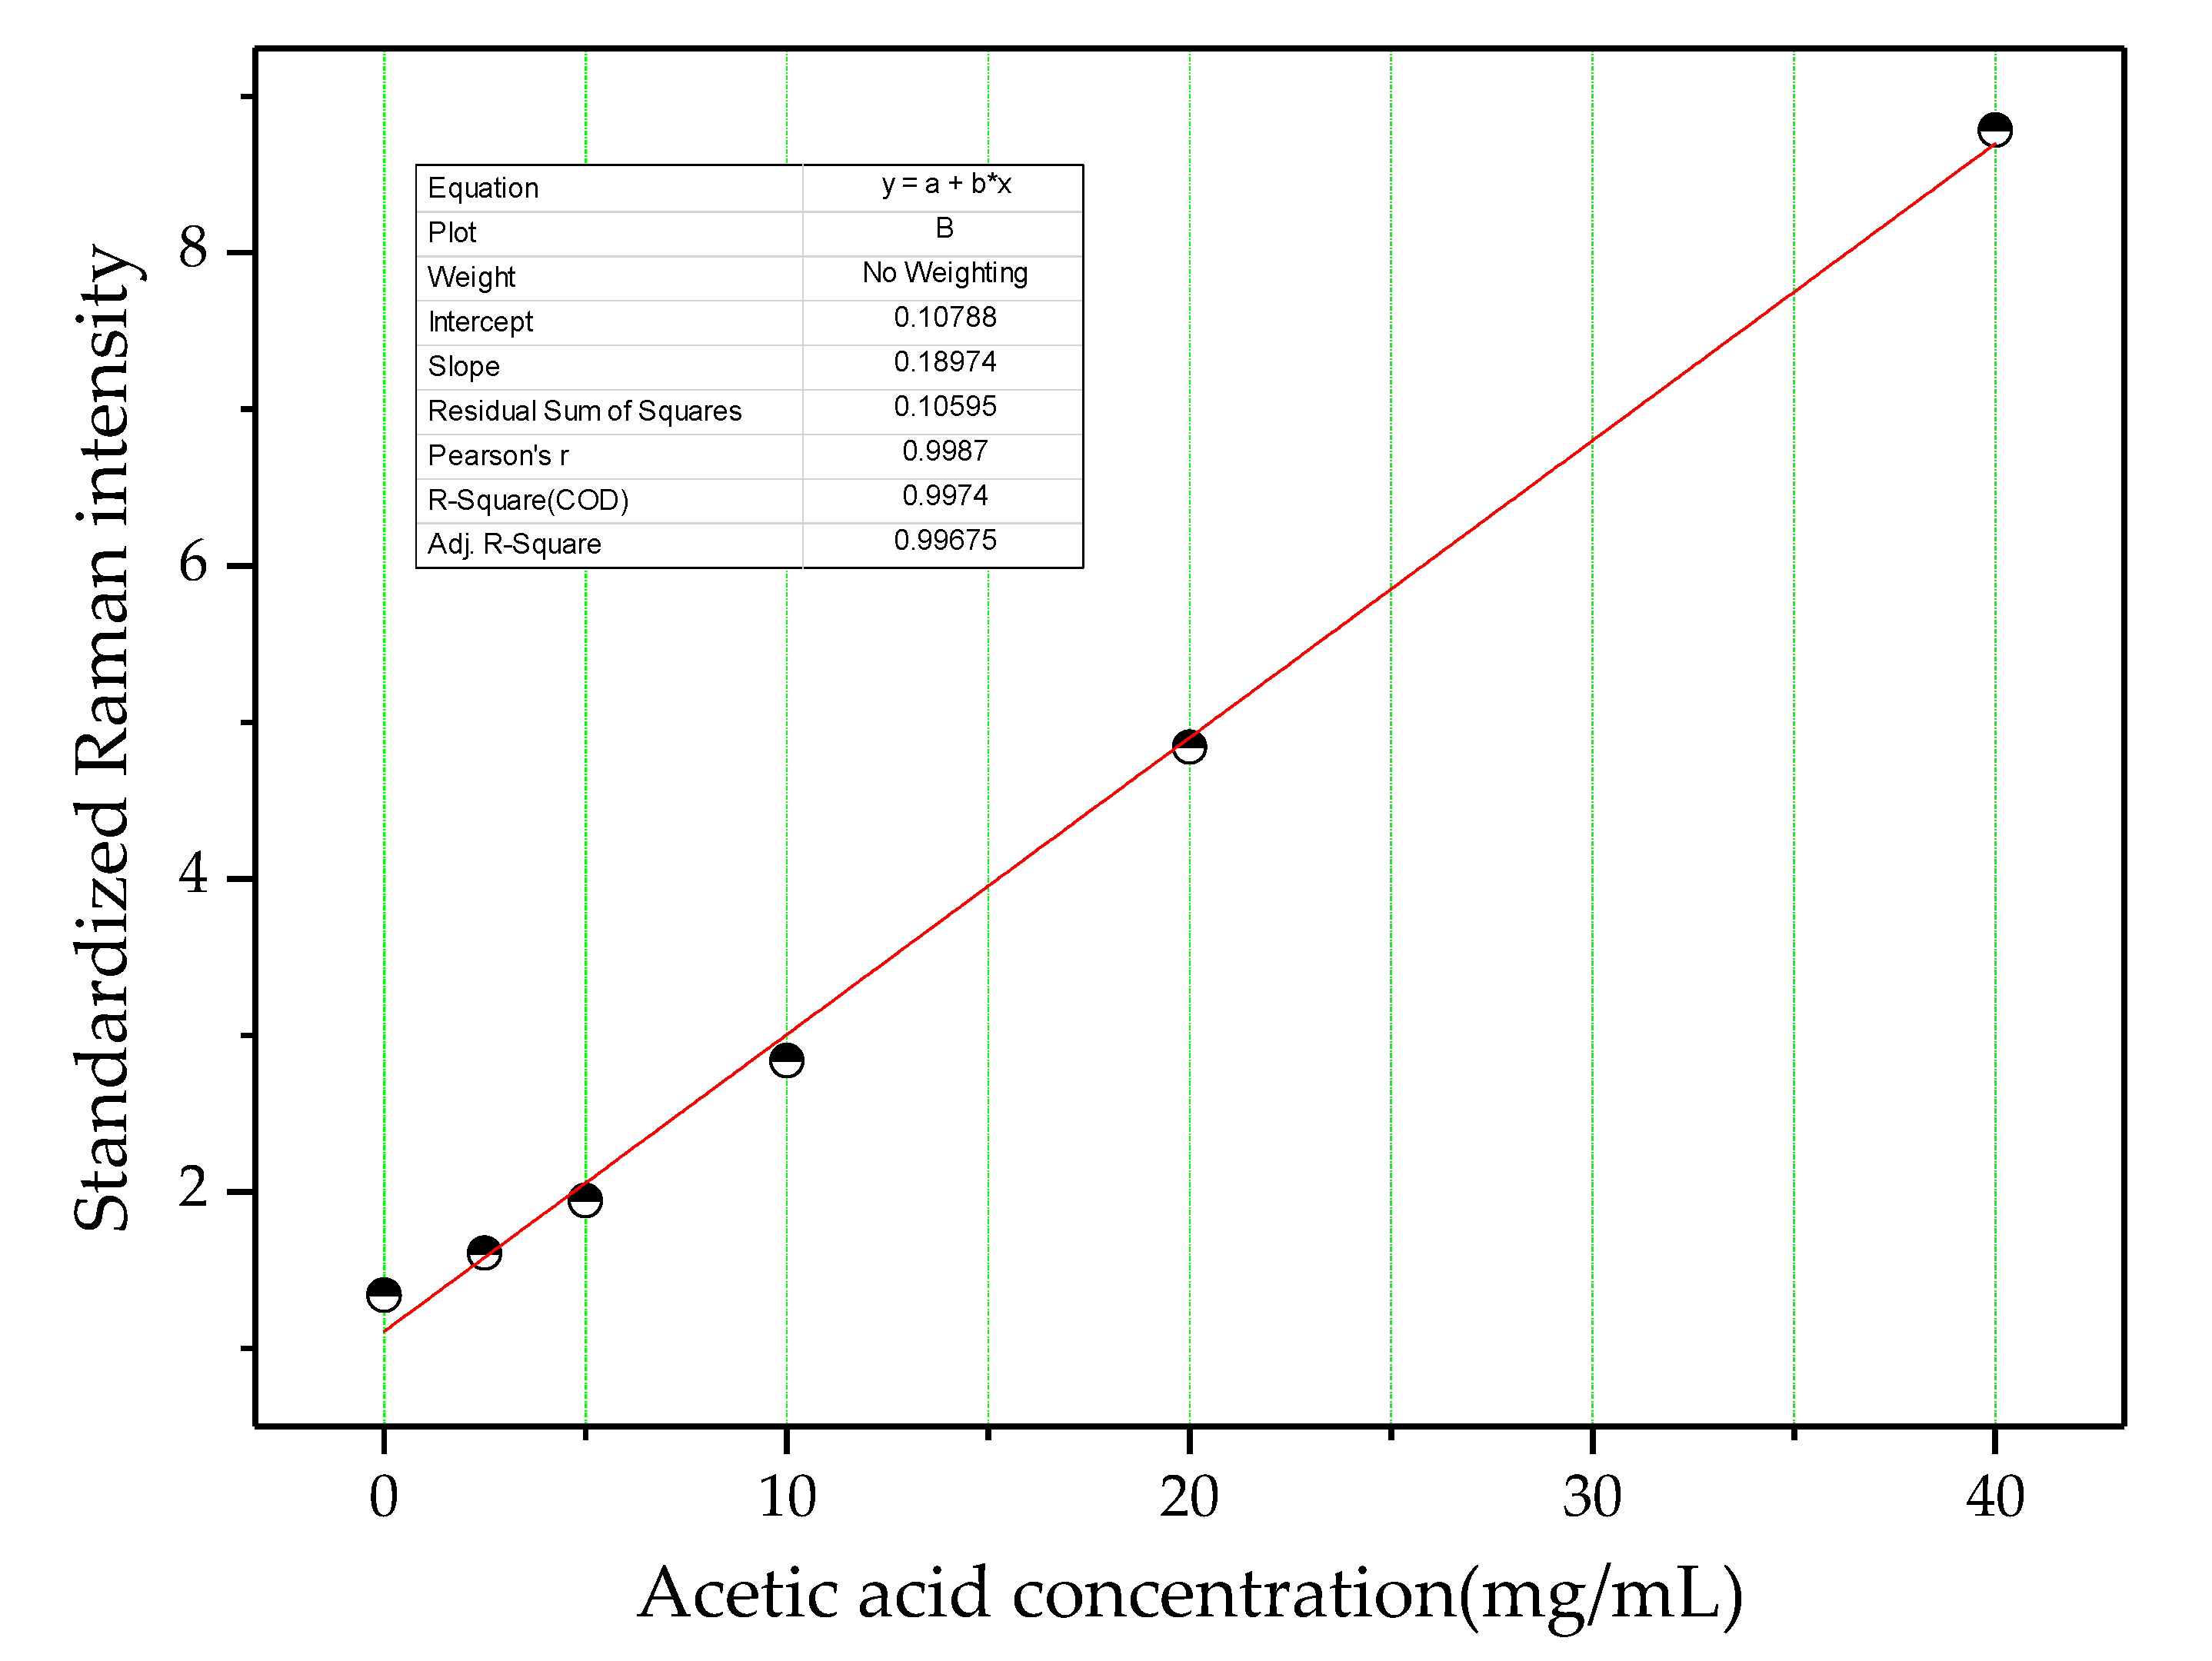
4.1. Quantitative Analysis

The five parameters of k, σ j Ω , d Ω , I 0 , l in Equation (1) have no relationship with the concentration of sample species j, C j . Thus, Equation (1) can be simplified as:
R I j = F j C j
where Fj is defined as the Raman quantification factor of sample species j.
As can be shown in Equation (2), Raman intensity is proportional to the sample concentration. So, the quantitative analysis based on Raman spectroscopy can be achieved by building a linear regression curve between Raman intensity and its corresponding known concentrations. However, the reproducibility of measured Raman spectrum is degraded due to the drift of the optical path, the variation of the excitation laser intensity and solvent noise. These changes will result in fluctuation of absolute Raman intensity and a quantitative error. To eliminate these interferences, internal standard (ratio) method is used for quantitative analysis [33]. It is effective because the internal standard is always at a constant value, and the internal standard and the samples are tested under the same experimental conditions [34]. In this study, Raman shift line of pure oil at 932 cm−1 is taken as an internal standard. So, the Raman intensity of acetic acid characteristic shift line at 891 cm−1 can be standardized by:
R I ( 891 c m 1 ) s = R I 891 c m 1 R I 932 c m 1 + C
where the influence of the pure oil line at 891 cm−1 on the Raman intensity of acetic acid can be introduced into the constant, C.
To prepare a series of oil-dissolved acetic acid samples at different concentrations, 40 mg/mL acetic acid–oil solution is diluted with pure oil at the volume proportion of 1:1 time by time. These acetic acid samples are measured using IPT and the concentrations are about 2.5, 5, 10, 20 and 40 mg/mL values, respectively. Then, the prepared acetic acid solution samples are measured using the Raman detection platform with optimizing parameters (laser power of 100 mW, 50× micro-objective, grating with 600 lines per mm, slit width of 150 μm, exposure time of 0.6 s, accumulation number of 300). An obtained Raman spectrum of a sample tends to have some irrelevant information, such as cosmic radiation, fluorescence, baseline drift and thermal stability noise of CCD. Therefore, data pre-treatment should be performed to eliminate such influence for quantitative analysis. Automatic baseline correction is first conducted to subtract baseline and fluorescence. Savitsky–Golay smoothing is used to perform denoising and removing cosmic radiation with polynomial degree of 4 and size value of 9. Figure 8 shows Raman spectra of oil-dissolved acetic acid samples at different concentrations, in which Raman intensity of acetic acid at ~891 cm−1 increases clearly along with the increase of its concentrations.
A least squares model of acetic acid concentration in transformer oil is used to conduct unary linear regression analysis between the standardized Raman intensity at 891 cm−1 and its concentration. As shown in Figure 9, an evident linear relationship exists with a slope of 0.19, which can be expressed as:
y = 0.19 x + 0.11
where the goodness-of-fit (R2) is 0.9974. Besides, the standardized Raman intensity of pure oil at 891 cm−1 is included in the intercept value of 0.11. Therefore, using this linear regression equation, acetic acid concentration can be determined by measuring its standardized Raman intensity.

4.2. Detection Limit

As can be calculated from Figure 8, the standardized Raman intensity value at 891 cm−1 of 2.5 mg/mL acetic acid is 0.27 regarding that the standardized value of 0 mg/mL and 2.5 mg/L oil-dissolved acetic acid sample at 891 cm−1 is 1.33 and 1.60, respectively. So, the detection limit of oil-dissolved acetic acid can be estimated to be 3 σ ~0.68 mg/mL [25,26], where σ is the ratio between standard deviation of the Raman spectrum from acetic acid free oil sample (between 858 and 878 cm−1 range) and internal standard Raman intensity at ~932 cm−1. If higher detection limit or sensitivity is required, it may be achieved by selective surface enhanced Raman scattering (SERS) [35].

4.3. Analysis of Oil-Dissolved Acetic Acid from an Operating Transformer

In addition, the developed Raman platform is used to analyze seven oil samples taken from different operating transformers at substations of Sigongli, Dazhulin, Yuping, Laisu, Nanchuan, Longjing and Youting in the Chongqing Electric Power Company, State Grid of China. The main characteristics including model, operation time and fault or not of these power transformers can be seen in columns 1 to 4 of Table 2. Acetic acid concentrations of oil samples are calculated according to Equation (2) and are shown in column 5 of Table 2 after averaging over five measurements. Among them, acetic acid concentration from Youting is too small to be accurately determined. Figure 10 shows the Raman spectrum of transformer oil sample from Longjing. Besides, acetic acid concentration in transformer oil samples are also measured using IPT as a basis and results are shown in column 6 of Table 2. The Raman detection accuracy for oil-dissolved acetic acid from an operating transformer is obtained at about 91.66% after comparing the detection errors (column 7 of Table 2) of these two methods. In addition to this, the obtained concentration of oil-dissolved acetic acid from operating transformers using Raman spectroscopy can be used to amend the linear regression Equation (2) and improve Raman detection accuracy further.

5. Discussion

In this paper, good Raman detection limit and accuracy of oil-dissolved acetic acid concentration is obtained. However, there is still a long way to achieve accurate evaluation insulation aging state of an operating power transformer using Raman spectroscopy for the following reasons: (1) Simultaneous detection of low-molecular-weight acids concentration, include acetic acid, formic and levulinic is unaccomplished; (2) In this study, Raman spectroscopy system is fabricated on a vibration isolation table and only used to analyze oil samples in the Laboratory. At disturbance environment of strong vibration, intense electromagnetic field, and so on, whether the system is suitable for in situ analysis of oil-dissolved acids in an operating transformer or not is unclear. (3) In international electrotechnical commission (IEC) standard, the concentration of low-molecular-weight acids is not currently used to diagnose aging state of paper insulation, because the correlation between acids concentration and aging rate has not been fully determined [14]. These unsolved questions or problems above should and will be focused on in our further work.

6. Conclusions

Raman spectroscopy is a potential analytical technique for dissolved substances in transformer oil. In this study, improvements made on our previously introduced solution Raman detection platform is reported for getting higher detection limit, including using a quartz cuvette and two edge filters. The Raman shift spectral lines of acetic acid and its corresponding vibration modes are obtained through simulation and experiment. The optimizing parameters are determined as laser power of 100 mW, 50× micro-objective, grating with 600 lines per mm, slit width of 150 μm, exposure time of 0.6 s and accumulation number of 300, respectively. Raman shift spectral line of oil-dissolved acetic acid at 891 cm−1 corresponding to H–C–H symmetrical swing and O–H swing modes is taken as its characteristic value and Raman shift line of pure oil at 932 cm−1 is taken as the internal standard for quantitative analysis. A linear regression curve for quantitative analysis is obtained with a slope of 0.19. The current concentration detection limit and accuracy for oil-dissolved acetic acid are determined as about 0.68 mg/mL and 91.66%, separately. Compared to the traditional acetic acid measurement methods, Raman spectroscopy is a more convenient and time-saving way, which is especially important for the quick acetic acid assessment in oil and may be useful for condition assessment of operating transformer.

Acknowledgments

This work is supported by the National Natural Science Foundation of China (61605020), Chongqing Research Program of Basic Research and Frontier Technology (cstc2016jcyjA0427), China Postdoctoral Science Foundation (2016M600722, 2017T100675), Special funding of Chongqing Postdoctoral research project (Xm2016023), the Fundamental Research Funds for the Central Universities (106112016CDJCR151224).

Author Contributions

The research presented in this paper is a collaborative effort among all authors. Fu Wan, Lingling Du and Weigen Chen conceived, performed the experiments, discussed the results and wrote the paper; Pinyi Wang, Jianxin Wang and Haiyang Shi performed the experiments and discussed the results.

Conflicts of Interest

The authors declare no conflict of interest.

References

  1. Conseil International des Grands Réseaux Électriques (CIGRE). Aging of Cellulose in Mineral-Oil Insulated Transformers; Task Force D1.01.10; CIGRE: Paris, France, 2007. [Google Scholar]
  2. International Electrotechnical Commission (IEC). Guide to the Interpretation of Dissolved and Free Gases Analysis; IEC: Geneva, Switzerland, 2007. [Google Scholar]
  3. Wan, F.; Chen, W.G. Using a Sensitive Optical System to Analyze Gases Dissolved in Samples Extracted from Transformer Oil. IEEE Electr. Insul. Mag. 2014, 30, 15–22. [Google Scholar] [CrossRef]
  4. Emsley, A.M.; Xiao, X.; Heywood, R.J.; Ali, M. Degradation of cellulosic insulation in power transformers. Part 2: Formation of furan products in insulating oil. IEE Proc. Sci. Meas. Technol. 2000, 147, 110–114. [Google Scholar] [CrossRef]
  5. Okabe, S.; Ueta, G.; Tsuboi, T. Investigation of Aging Degradation Status of Insulating Elements in Oil-immersed Transformer and its Diagnostic Method Based on Field Measurement Data. IEEE Trans. Dielectr. Electr. Insul. 2013, 20, 346–355. [Google Scholar] [CrossRef]
  6. Ekonomou, L.; Skafidas, P.D.; Oikonomou, D.S. Transformer oil’s service life identification using neural networks. In Proceedings of the 8th WSEAS International Conference on Electric Power Systems, High Voltages, Electric Machines (POWER’ 08), Venice, Italy, 21–23 November 2008; pp. 222–226. [Google Scholar]
  7. Dervos, C.T.; Vassiliou, P.; Skafidas, P.; Paraskevas, C. Service life estimation of transformer oil. In Proceedings of the International Conference on Protection and Restoration of the Environment VI, Skiathos, Greece, 1–5 July 2002; pp. 1239–1246. [Google Scholar]
  8. N’cho, J.S.; Fofana, I.; Hadjadj, Y.; Beroual, A. Review of physicochemical based diagnostic techniques for assessing insulation condition in aged transformers. Energies 2016, 9, 367. [Google Scholar] [CrossRef]
  9. Lipshteǐn, R.A.; Shakhnovich, M.I. Transformer Oil, 2nd ed.; Israel Program for Scientific Translations (IPST): Jerusalem, Israel, 1970. [Google Scholar]
  10. Hill, G.C.; Holman, J.S. Chemistry in Context, 5th ed.; Nelson: Walton-on Thames, UK, 2000. [Google Scholar]
  11. Lundgaard, L.E.; Hansen, W.; Linhjell, D. Aging of oil-impregnated paper in power transformers. IEEE Trans. Power Syst. Deliv. 2004, 19, 230–238. [Google Scholar] [CrossRef]
  12. Mander, L.; Liu, H.W. Comprehensive Natural Products II: Chemistry and Biology; Elsevier Science: Amsterdam, The Netherlands, 2010. [Google Scholar]
  13. Ingebrigtsen, S.; Dahlund, M.; Hansen, W.; Linhjell, D.; Lundgaard, L.E. Solubility of carboxylic acids in paper (Kraft)-oil insulation systems. In Proceedings of the 2004 Annual Report Conference on Electrical Insulation and Dielectric Phenomena, Boulder, CO, USA, 20–20 October 2004; pp. 253–257. [Google Scholar]
  14. Lelekakis, N.; Wijaya, J.; Martin, D. The effect of acid accumulation in power-transformer oil on the aging rate of paper insulation. IEEE Electr. Insul. Mag. 2014, 30, 19–26. [Google Scholar] [CrossRef]
  15. Liao, R.J.; Sang, F.M.; Liu, G.; Yang, L.J. Study on neutral acid and water dissolved in oil for different types of oil-paper insulation compositions of transformers in accelerated ageing tests. Proc. CSEE 2010, 30, 125–131. [Google Scholar]
  16. Du, L.L.; Chen, W.G.; Gu, Z.L. Analysis of acetic acid dissolved in transformer oil based on laser Raman spectroscopy. In Proceedings of the 2016 IEEE International Conference on High Voltage Engineering and Application (ICHVE), Chengdu, China, 19–22 September 2016; pp. 1–4. [Google Scholar]
  17. Lundgaard, L.E.; Hansen, W.; Ingebrigtsen, S. Ageing of mineral oil impregnated cellulose by acid catalysis. IEEE Trans. Dielectr. Electr. Insul. 2008, 15, 540–546. [Google Scholar] [CrossRef]
  18. International Electrotechnical Commission (IEC). Insulating Liquids-Determination of Acidity; IEC: Geneva, Switzerland, 2014. [Google Scholar]
  19. Tur’yan, Y.I.; Strochkova, E.; Berezin, O.Y.; Kuselman, I.; Shenhar, A. pH-metric determination of acid numbers in petroleum oils without titration. Talanta 2000, 47, 53–58. [Google Scholar] [CrossRef]
  20. Lundgaard, L.E.; Hansen, W.; Ingebrigtsen, S.; Linhjell, D.; Dahlund, M. Aging of Kraft paper by acid catalyzed hydrolysis. In Proceedings of the IEEE International Conference on Dielectric Liquids, Coimbra, Portugal, 26 June–1 July 2005; pp. 381–384. [Google Scholar]
  21. Kiefer, J. Recent advances in the characterization of gaseous and liquid fuels by vibrational spectroscopy. Energies 2015, 8, 3165–3197. [Google Scholar] [CrossRef]
  22. Irawan, R.; Scelsi, G.; Woolsey, G. Continuous monitoring of SF6 degradation in high voltage switchgear using Raman scattering. IEEE Trans. Dielectr. Electr. Insul. 2005, 12, 815–820. [Google Scholar] [CrossRef]
  23. Li, X.Y.; Xia, Y.X.; Zhan, L.; Huang, J.M. Near-confocal cavity-enhanced Raman spectroscopy for multitrace-gas detection. Opt. Lett. 2008, 33, 2143–2145. [Google Scholar] [CrossRef] [PubMed]
  24. Li, X.Y.; Xia, Y.X.; Zhan, L.; Leng, J.H. A Raman system for gas-species analysis in power transformer. Appl. Phys. B 2008, 93, 665–669. [Google Scholar] [CrossRef]
  25. Somekawa, T.; Kasaoka, M.; Kawachi, F.; Nagano, Y.; Fujita, M.; Izawa, Y. Analysis of dissolved C2H2 in transformer oils using laser Raman spectroscopy. Opt. Lett. 2013, 38, 1086–1088. [Google Scholar] [CrossRef] [PubMed]
  26. Somekawa, T.; Fujita, M.; Izawa, Y.; Kasaoka, M.; Nagano, Y. Furfural analysis in transformer oils using laser Raman spectroscopy. IEEE Trans. Dielectr. Electr. Insul. 2015, 22, 229–231. [Google Scholar] [CrossRef]
  27. Wan, F.; Chen, W.G.; Gu, Z.L.; Zou, J.Z. The research for Raman analysis of dissolved gases in transformer oil and optimization of quantitative detection. Trans. China Electr. Soc. 2016, 31, 236–243. [Google Scholar]
  28. Chen, W.G.; Gu, Z.L.; Zou, J.Z. Analysis of furfural dissolved in transformer oil based on confocal laser Raman spectroscopy. IEEE Trans. Dielectr. Electr. Insul. 2016, 23, 915–921. [Google Scholar] [CrossRef]
  29. Atkins, P. Physical Chemistry; Oxford University Press: Oxford, UK, 2006. [Google Scholar]
  30. Dirschmid, H.; Fischer, F.D. Generalized Gaussian error functions and their applications. Acta Mech. 2015, 226, 2887–2897. [Google Scholar] [CrossRef]
  31. Kiefer, J.; Seeger, T.; Steuer, S.; Schorsch, S.; Leipertz, A. Design and characterization of a Raman-scattering-based sensor system for temporally resolved gas analysis and its application in a gas turbine power plant. Meas. Sci. Technol. 2008, 19, 085408. [Google Scholar] [CrossRef]
  32. El-Sheimy, N.; Hou, H.; Niu, X. Analysis and modeling of inertial sensors using Allan variance. IEEE Trans. Instrum. Meas. 2008, 57, 140–149. [Google Scholar] [CrossRef]
  33. Wopenka, B.; Pasteris, J.D. Raman intensities of geochemically relevant gas mixtures for a laser Raman microprobe. Anal. Chem. 1987, 59, 2165–2170. [Google Scholar] [CrossRef]
  34. Li, D.; Zhu, H.; Chang, Z. Quantitative method study on the pertechnetate in aqueous solution by Raman spectroscopy. Anal. Methods 2016, 8, 246–258. [Google Scholar]
  35. Li, J.F.; Huang, Y.F.; Ding, Y.; Yang, Z.L.; Li, S.B.; Zhou, X.S.; Fan, F.R.; Zhang, W.; Zhou, Z.Y.; Wu, D.Y.; et al. Shell-isolated nanoparticle-enhanced Raman spectroscopy. Nature 2010, 464, 392–395. [Google Scholar] [CrossRef] [PubMed]
Figure 1. Schematic diagram of oil-dissolved solution detection platform basing on Raman spectroscopy.
Energies 10 00967 g001
Figure 2. Experimental Raman spectrum of pure acetic acid.
Energies 10 00967 g002
Figure 3. Stimulated Raman spectrum of acetic acid.
Energies 10 00967 g003
Figure 4. Raman spectra of oil (a), acetic acid (b), and oil with 40 mg/mL acetic acid concentration (c).
Energies 10 00967 g004
Figure 5. Raman intensity of 891 cm−1 at different slit width.
Energies 10 00967 g005
Figure 6. Raman spectra of 40 mg/mL acetic acid-transformer oil at different exposure time.
Energies 10 00967 g006
Figure 7. The log–log plot for Allan deviation of Raman intensity of 891 cm−1 versus accumulation number.
Energies 10 00967 g007
Figure 8. Raman spectra of oil-dissolved acetic acid samples at different concentrations.
Energies 10 00967 g008
Figure 9. Linear relationship between standardized Raman intensity and acetic acid concentrations.
Energies 10 00967 g009
Figure 10. Raman spectrum of transformer oil from an operating transformer of Longjing of the Chongqing Electric Power Company, State Grid of China.
Energies 10 00967 g010
Table 1. Raman shift spectral lines of acetic acid.
No.Stimulated Value (cm−1)Pure Acetic Acid (cm−1)Oil-Dissolved Acetic Acid (cm−1)Vibration Modes
1408446443H–C–H symmetrical swing and O–H swing
2546--O–H swing and C=O swing
3638603/621599/618O=C–O bending and C–C stretching
4815893891H–C–H symmetrical swing and O–H swing
59691014932O–C–C asymmetric stretching and H–C–H symmetrical swing
61054--C–H asymmetric swing
71131--O–H swing and C–H swing
8128412801289O–H swing and C–C swing
9139213661375H–C–H bending
10145414281422H–C–H asymmetric swing
1116611664/17581654/1741C=O stretching vibration
12295329372935CH3 stretching vibration
13301529852990C–H asymmetric stretching
14306930203031H–C–H asymmetric stretching
Table 2. Dissolved acetic acid detected by Raman spectroscopy and indicator-potentiometric titration (IPT).
Main Characteristics of Power Transformers from Which the Oil Samples Are Obtained Raman Spectroscopy (mg/mL)IPT (mg/mL)Detection Error (%)
SubstationModelOperation TimeFault or Not
SigongliSFSZ-240000/22020 October 2004N18.2620.119.20
DazhulinSSZ11-180000/22027 July 2007N11.1510.0411.06
YupingSFSZ9-120000/22030 June 2008N4.315.0214.15
LaisuSFPSZ10-M-120000/2205 January 2009N9.7310.285.35
NanchuanSFPSZ10-180000/22010 May 2011N3.223.436.12
LongjingSFPSZ10-180000/2202 April 2014N1.241.194.20
YoutingODFS-250000/50015 April 2015N<0.680.15/

