1. Introduction
Grid-connected power converters have been acting as an important interface between the renewables and the electrical grids. The conventional control of grid-connected power converters has been well validated in many applications and shows its effectiveness [
1,
2,
3,
4]. Along with the expansion of the renewable power generation plants, their impact on the power system has caused increasing attention [
5,
6]. The different performance of the converters compared to the traditional synchronous generators should be taken into account.
The conventional grid-connected power converters differ from synchronous generators mainly in the lack of the electromechanical characteristics. Consequently, the statics and dynamics of the renewable power generation units are both different compared with the synchronous generators. Even if the statics can be changed by equipping the droop control and energy reserve, there are still some disadvantages of the converter-interfaced generation plants.
The phase-locked loop (PLL) is a grid voltage estimator used by conventional power converters to obtain the voltage phase angle to determine the amount of current to be injected either in-phase or in-quadrature to regulate the active and reactive powers delivered to the grid, respectively. Therefore, the dynamics of these conventional converters are characterized by the PLL, whose performance will degrade under weak or islanded grid conditions [
7,
8]. As a PLL is not designed to emulate any inertial response in the presence of frequency deviations, the total inertia in the grid decreases as the integration of renewable generation plants grows. However, the updated grid codes have included “synthetic inertia” in the grid connection requirements [
9].
The emulation of synchronous generators and the implementation of its mechanical and electrical characteristics on grid-connected converters have been intensively studied in recent years. The implementation of mechanical characteristics, especially rotor inertia emulation, has been investigated in many studies to contribute with synthetic inertia to the power system [
10,
11,
12]. Besides, the emulation of electrical characteristics, commonly known as virtual impedance, is also largely developed for objectives such as the load sharing of paralleled converters [
13,
14], harmonics compensation [
15,
16] and impedance shaping in cascaded converters [
17]. Nevertheless, the performance of the synchronous generation emulation control under grid faults, especially under asymmetrical faults, still needs further study.
Grid-connected power converters can face voltage sags caused by different types of grid faults. According to grid code requirements, grid-connected power converters should be capable of getting through grid fault scenarios to let generation units remain connected under such adverse conditions, and further provide ancillary services to support the grid voltage and frequency.
Three-phase balanced faults are usually considered for stating the low-voltage ride-through (LVRT) requirements in most of the grid codes; however, asymmetrical faults are the most common faults in electrical grids [
18,
19]. Due to an asymmetrical grid fault, the voltages at the point of common coupling (PCC) will sag and become unbalanced, and may cause the trip of the power converters and the loads connected to the PCC. Sophisticated ride-through abilities for power converters can be enabled to prevent tripping of renewable generation units under fault conditions [
20,
21], the lack of contribution of negative-sequence current during asymmetrical faults motivates further improvement in the control design [
22].
Many previous works have proposed techniques to deal with the grid synchronization of power converters during asymmetrical grid faults. Smith et al. [
23] has presented different variations of synchronous reference frame PLL for grid synchronization, which are able to decompose the positive and negative components of grid voltage, even under unbalanced conditions. Alternative methods such as [
24] using a Kalman filter have also been presented for the power converters to be synchronized to the grid under both balanced and unbalanced voltage sags. As is known, unbalanced voltages contain both positive-sequence component and negative-sequence component. In order to compensate the negative-sequence component of the PCC voltages, the current injected by the power converter should also contain a negative-sequence component, as well as the positive-sequence one. Therefore, the injection of negative-sequence current by a generation unit should be also considered as an objective, in addition to grid synchronization.
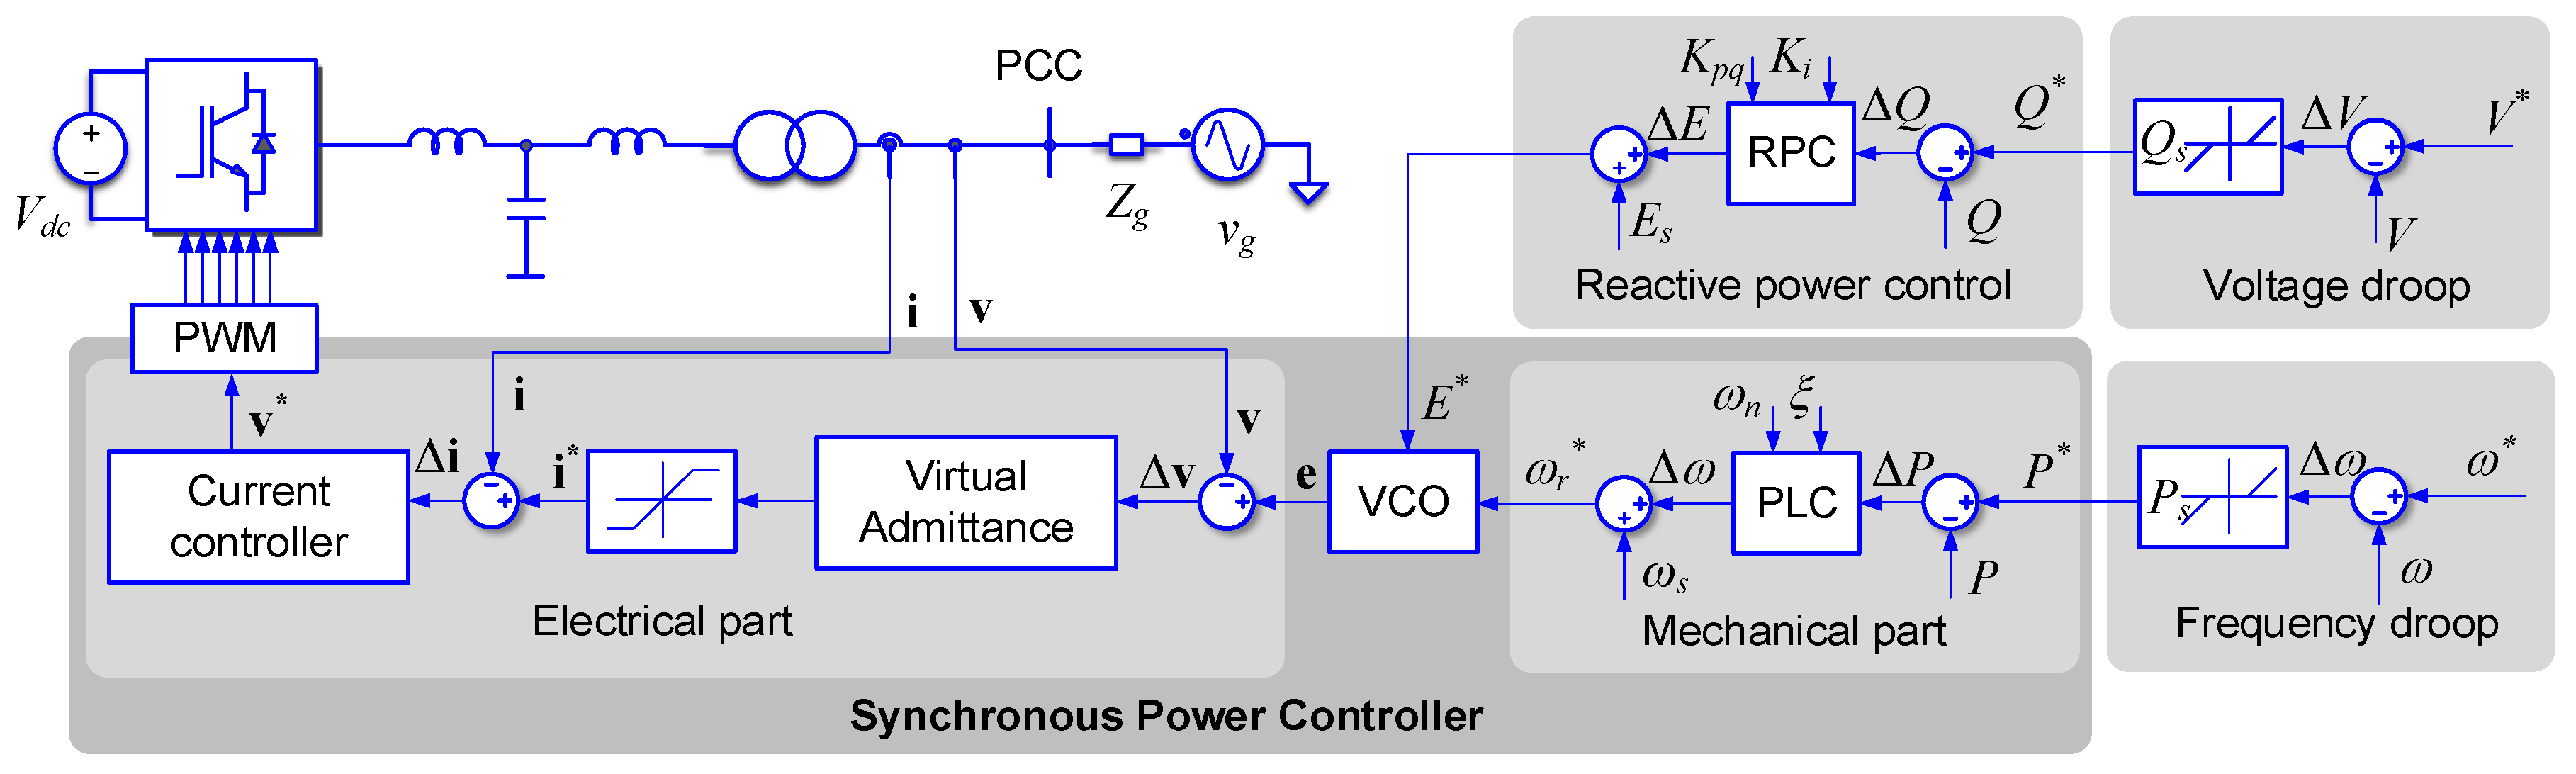
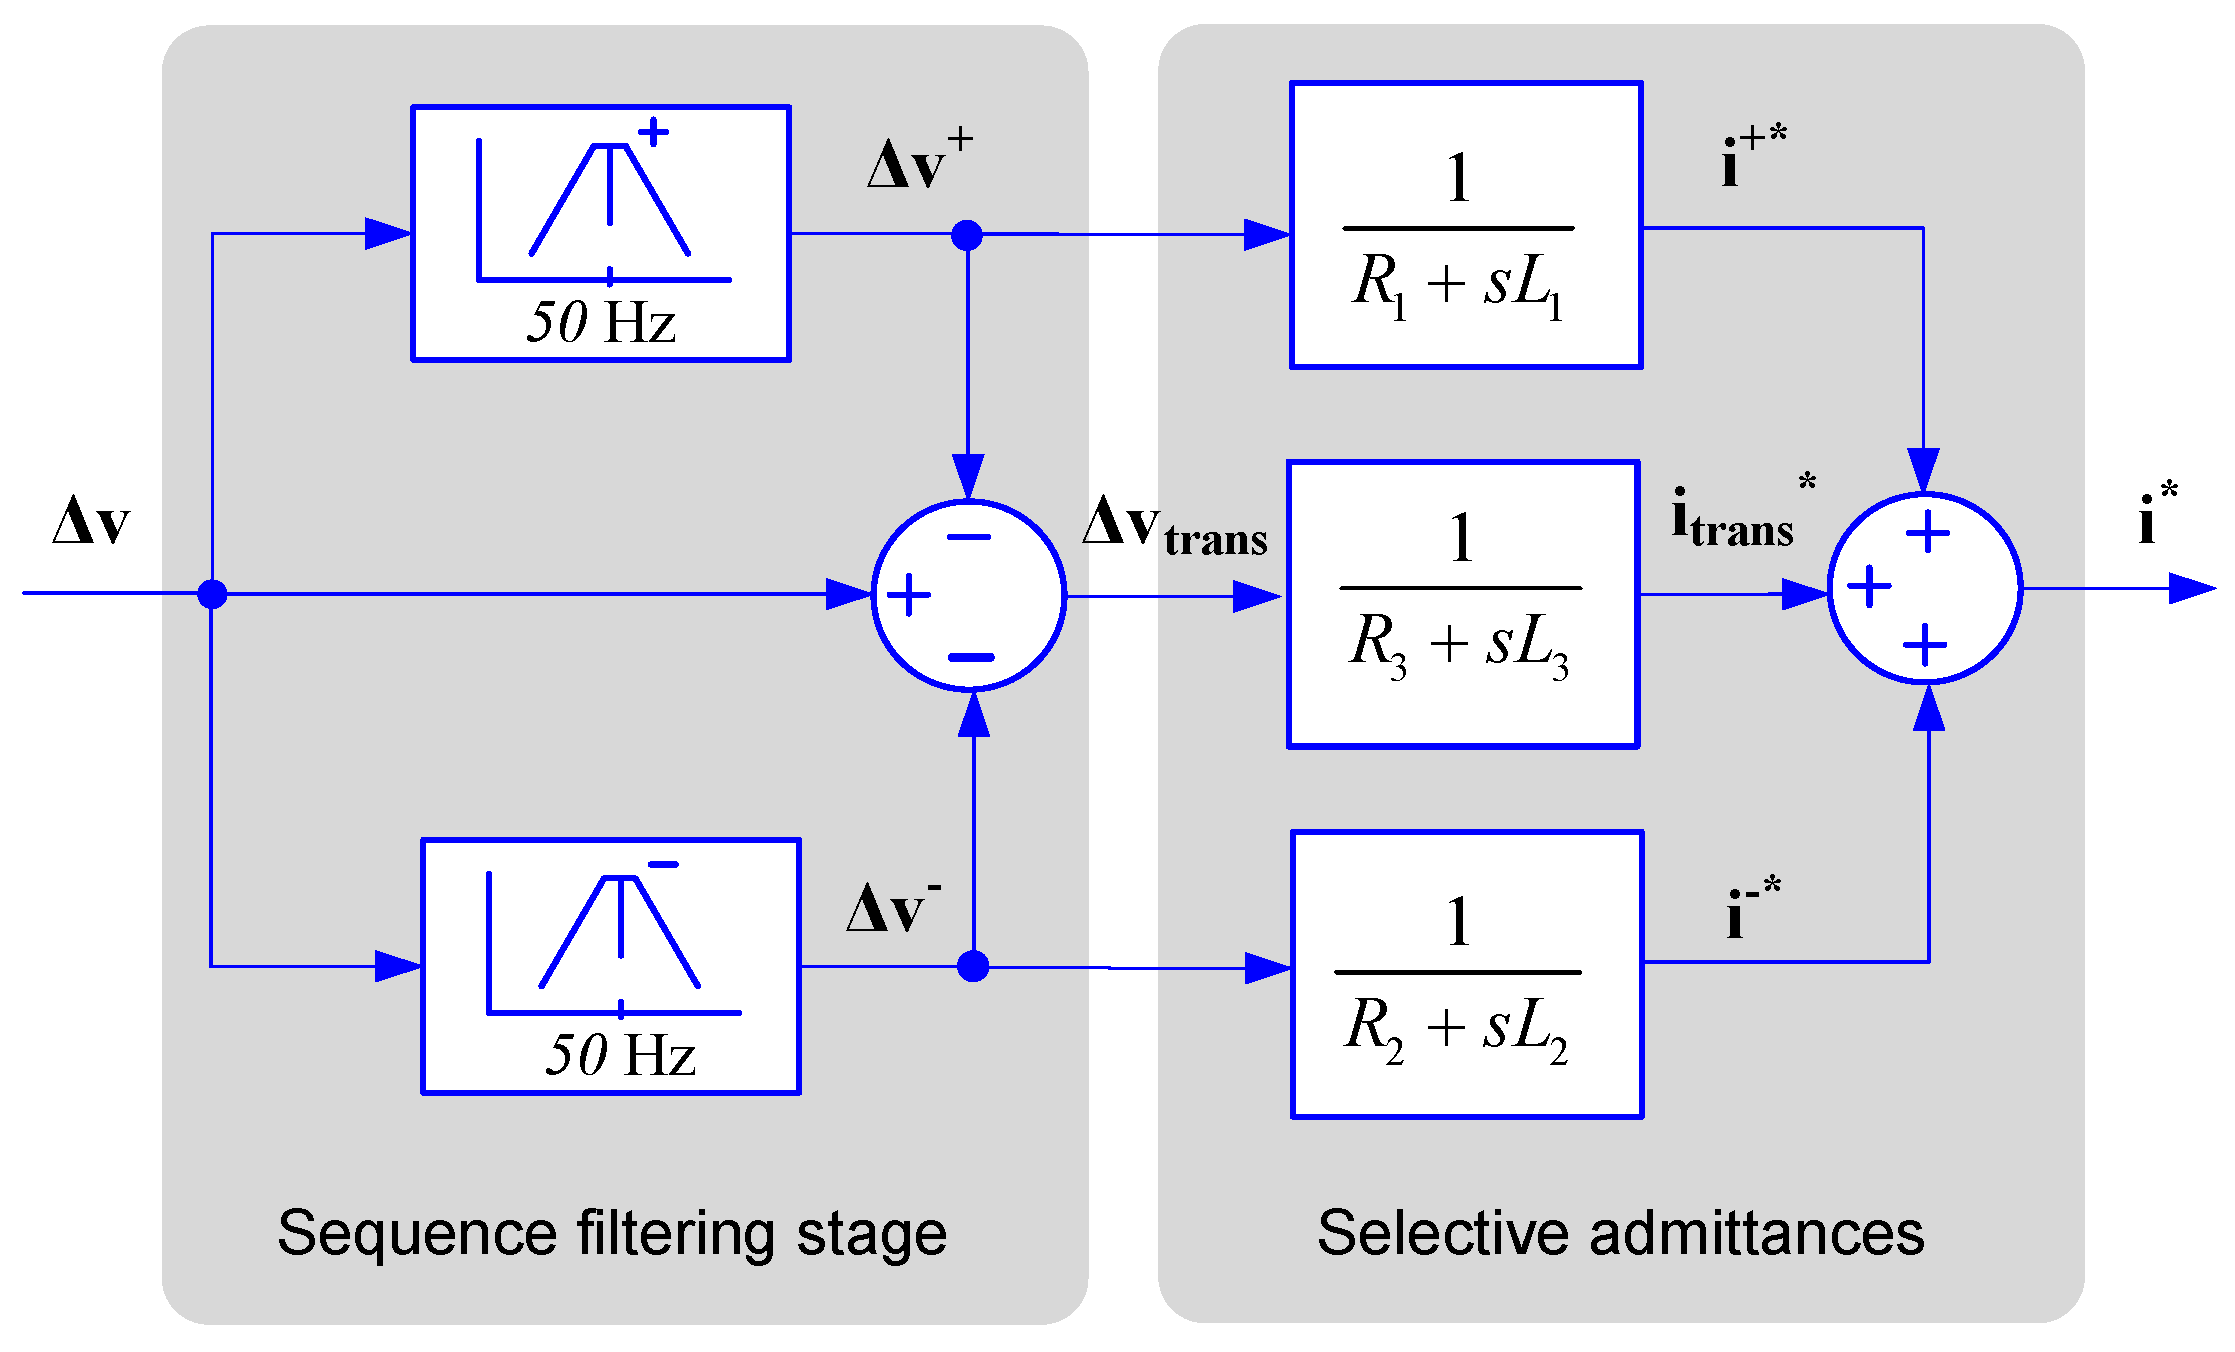
This paper develops a virtual admittance control structure, which is a part of the synchronous power controller (SPC) for grid-connected power converters. The SPC is an established solution for controlling grid-connected power converters and equipping them with emulated and improved synchronous machine characteristics. In the proposed virtual admittance block, except for the emulation of the stator output impedance of the synchronous generators, extra function of injecting negative-sequence current under asymmetrical grid faults is also added. Simulation and experimental results based on two parallel connected 100 kW grid-connected power converters are presented in this paper to demonstrate the effectiveness of the proposed control strategy in realizing negative-sequence current injection, as well as the basic function of the virtual admittance.
Unlike previous works that emphasize the grid synchronization of power converters under unbalanced grid voltages, this work implements a different control framework, the SPC, for grid-connected power converters to contribute emulated and improved synchronous generator characteristics to the grid. Furthermore, it is also shown that its capability of injecting negative-sequence reactive current during asymmetrical grid fault using a specially designed tri-path virtual admittance block.
The rest of the paper is organized as follows. The general control framework of the SPC with the proposed virtual admittance control structure are elaborated in
Section 2.
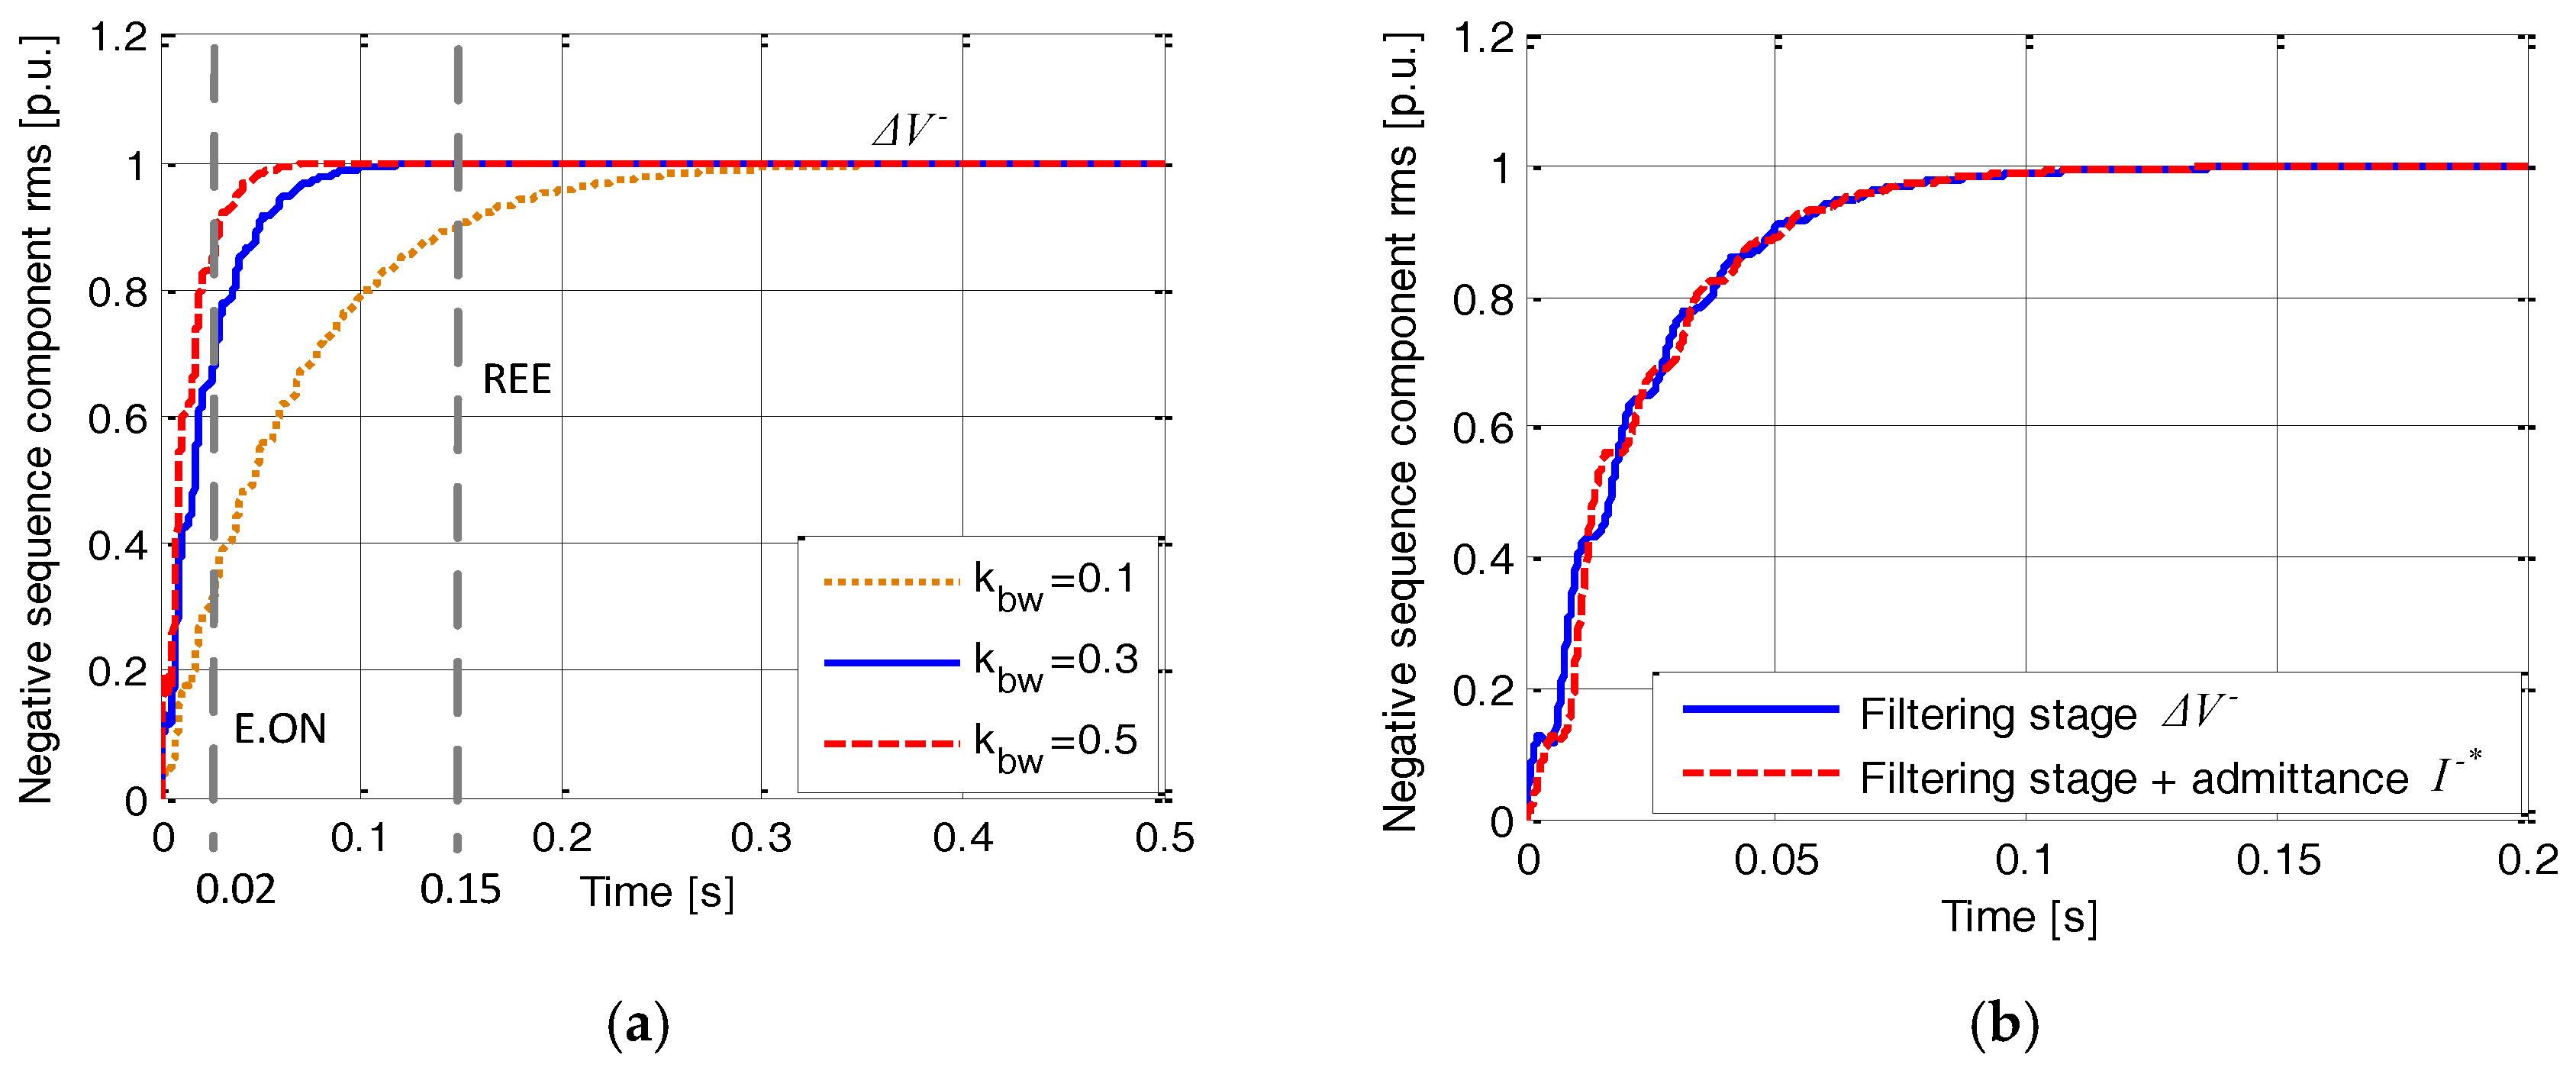
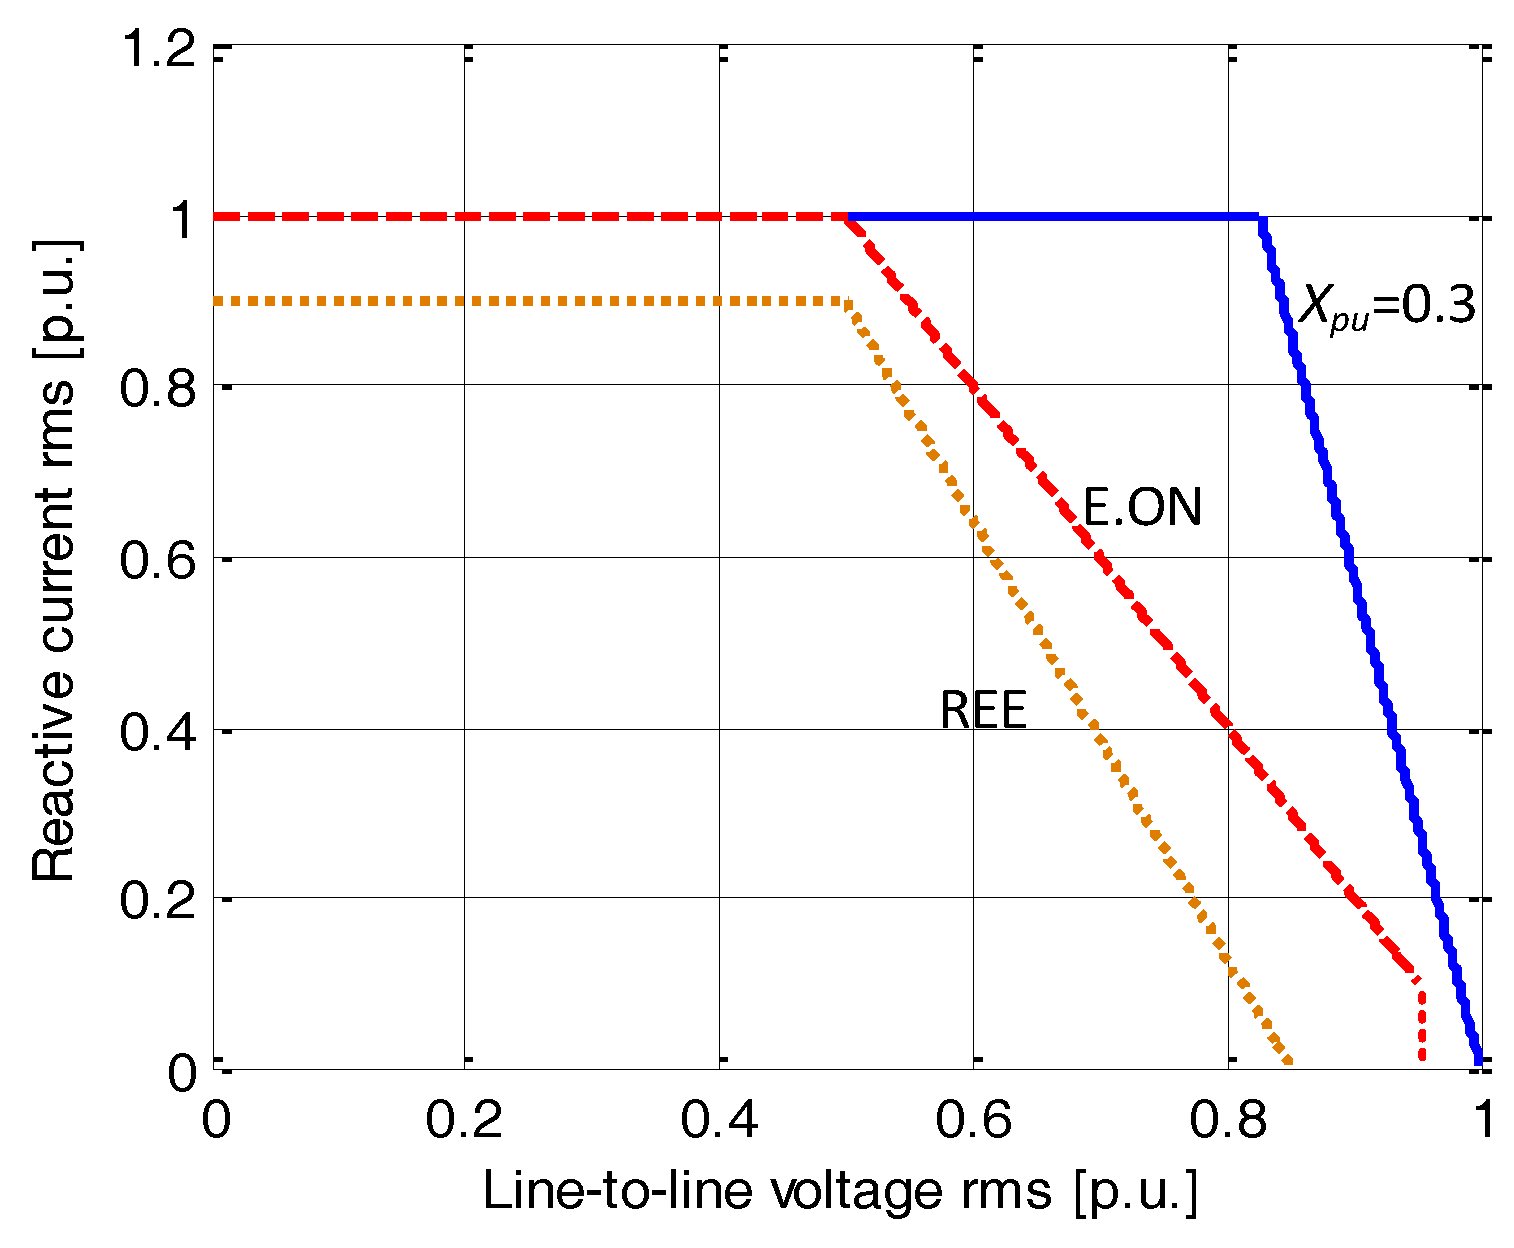
Section 3 shows the detailed design of the virtual admittance block considering the E.ON and Red Electrica de Espana (REE) grid codes. The simulation results under asymmetrical faults are shown in
Section 4. The experimental results under the same fault condition are shown in
Section 5.
3. Simulation Results
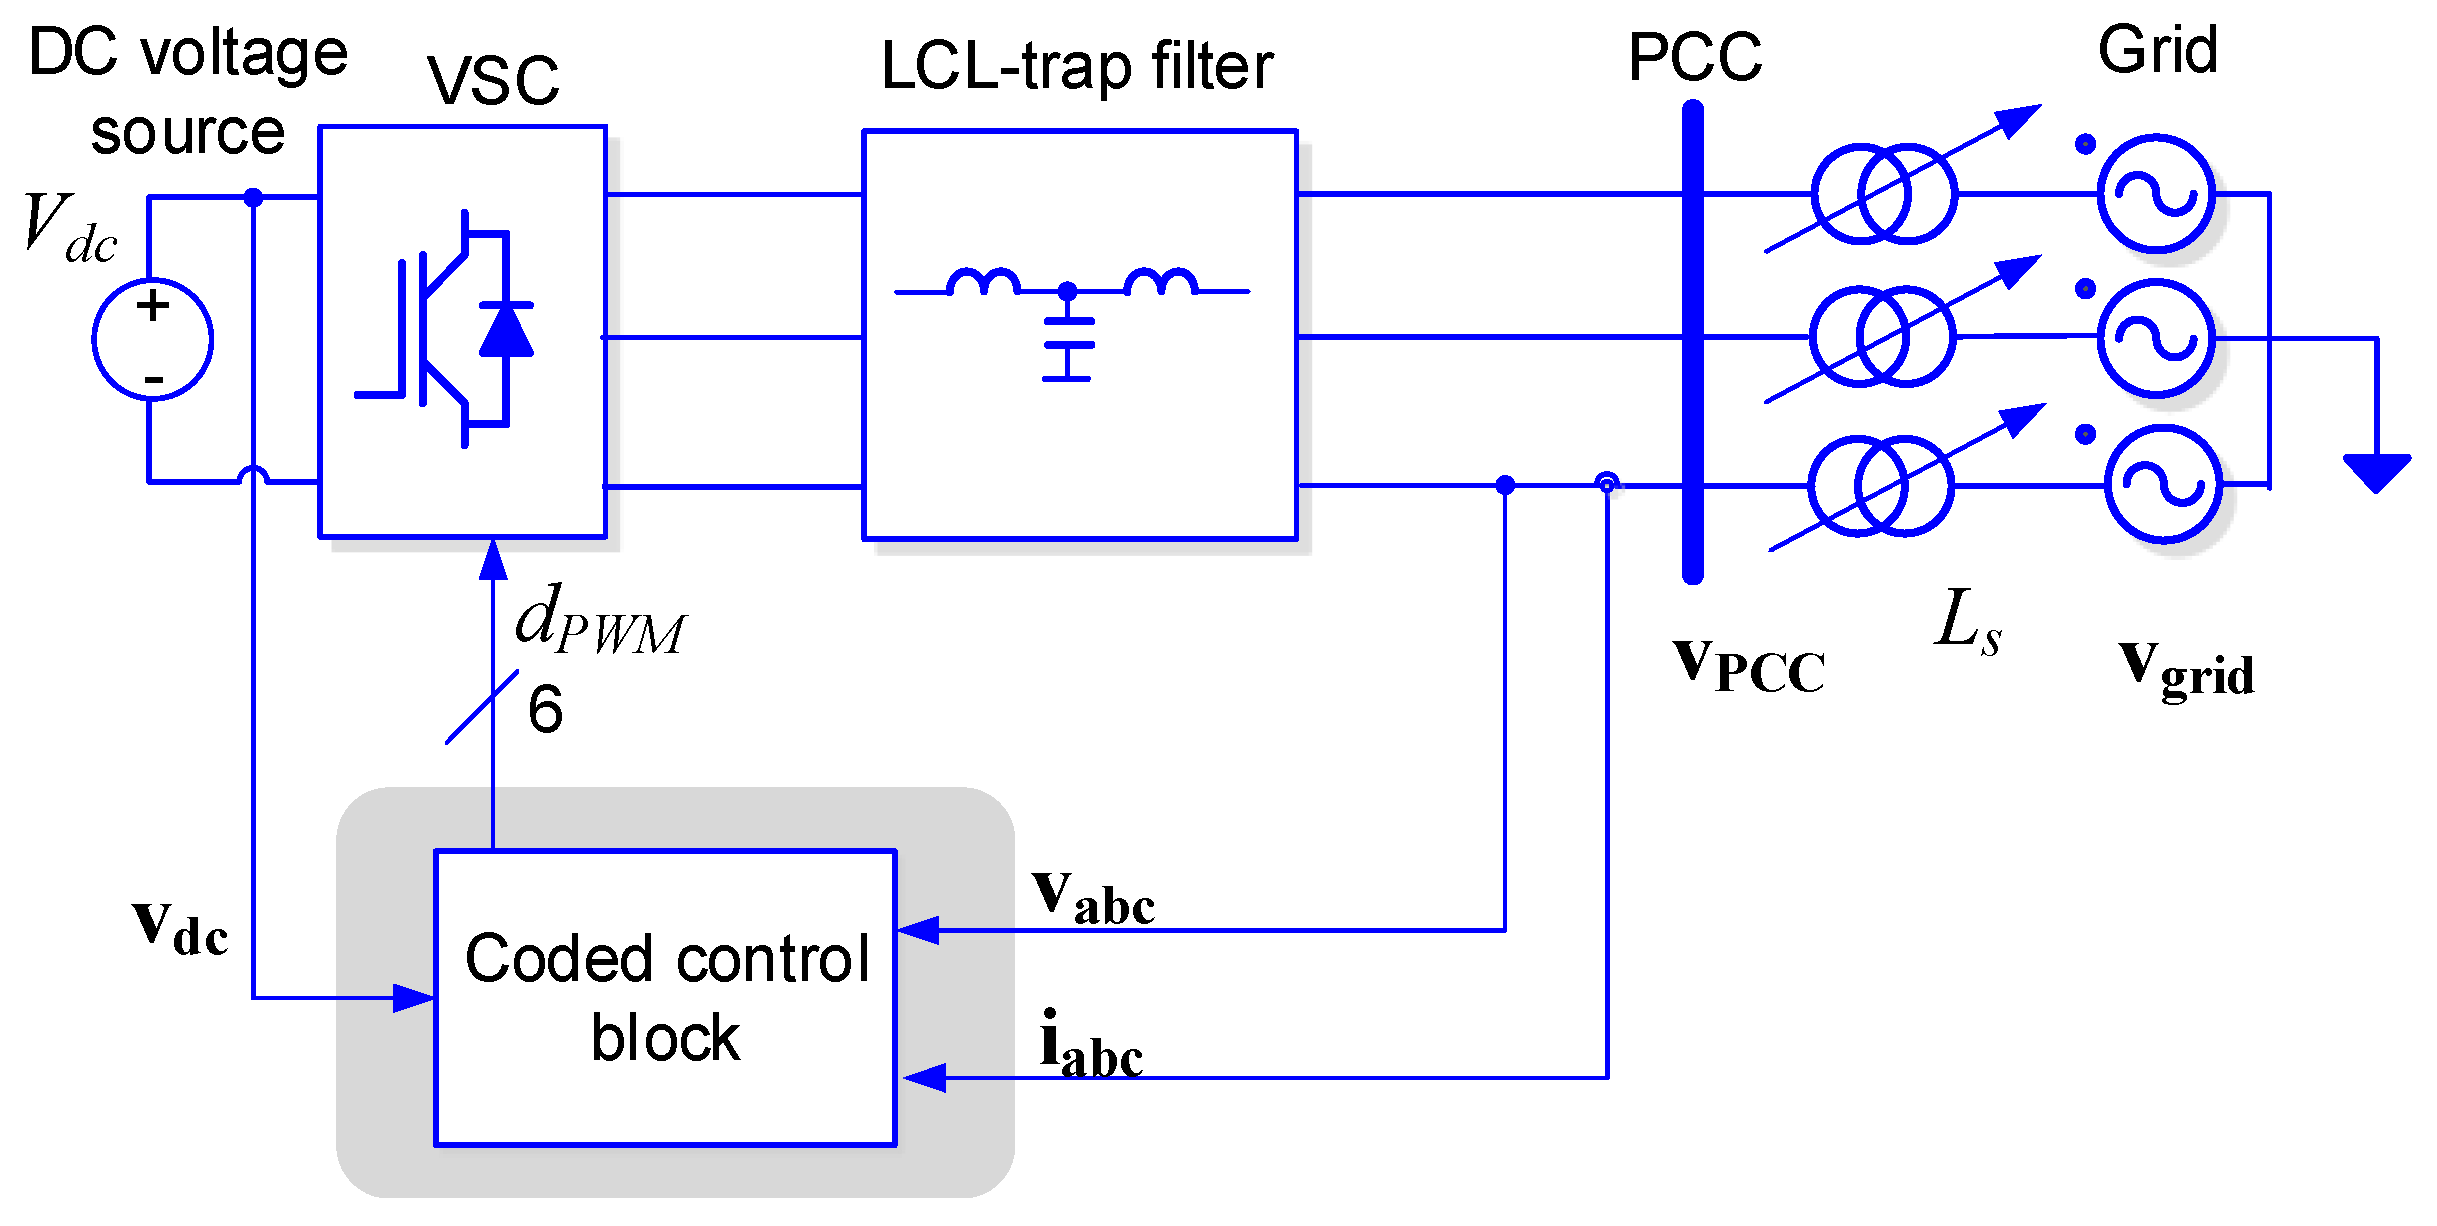
Simulation tests based on a digital implementation of the proposed controller are presented firstly in this section. A 100 kW two-level three-phase converter connected to a 400 V/50 Hz grid through a grid link filter is modeled for simulation, as shown in
Figure 5. The key parameters for the test setup and controller are listed in
Table 1.
The event considered in this simulation test is a 0.43 p.u. of voltage sag in one of the phases of the ac source, and it lasts for 200 ms. According to the aforementioned grid codes, the power converter should remain connected to the grid under such unbalanced voltage drop and the voltage support should be also triggered.
A generalized expression for the current reference generated by the virtual admittance block can be written as:
where
L and
R are the unified inductance and resistance that can be calculated based on the specified
Xpu and
Rpu.
To set different values for each sequence admittance in the virtual admittance block, the unified value of resistance and inductance can be modified by different coefficients, as shown in Equation (27). In this way, the admittance value for each branch can be simply defined by specifying value for the coefficients
Apos,
Aneg and
Atrans. Therefore, the inductance and resistance in each branch have the values shown in
Table 2.
Once Xpu and Rpu are set to meet requirements in reactive current injection during the faults, Apos can be set to 1 by convenience.
In the experiments, two different sets of values for the virtual admittances are specified. In the first case, the value for Aneg was set to 10, which is a significantly greater value than the ones for Apos and Atrans (which were both set to 1 by convenience), to clearly boost the negative-sequence current injection in the case of unbalanced faults. In contrast, the value for Aneg was set to 0.1 in a second case to limit the injection of negative-sequence current injection during unbalanced faults. These very different values for Aneg, namely 10 and 0.1, were chosen in this study case to clearly evidence the effect of the negative-sequence admittance value during unbalanced faults However, in real applications, Aneg should be determined according to the TSO requirements on the ratio between V− and I−.
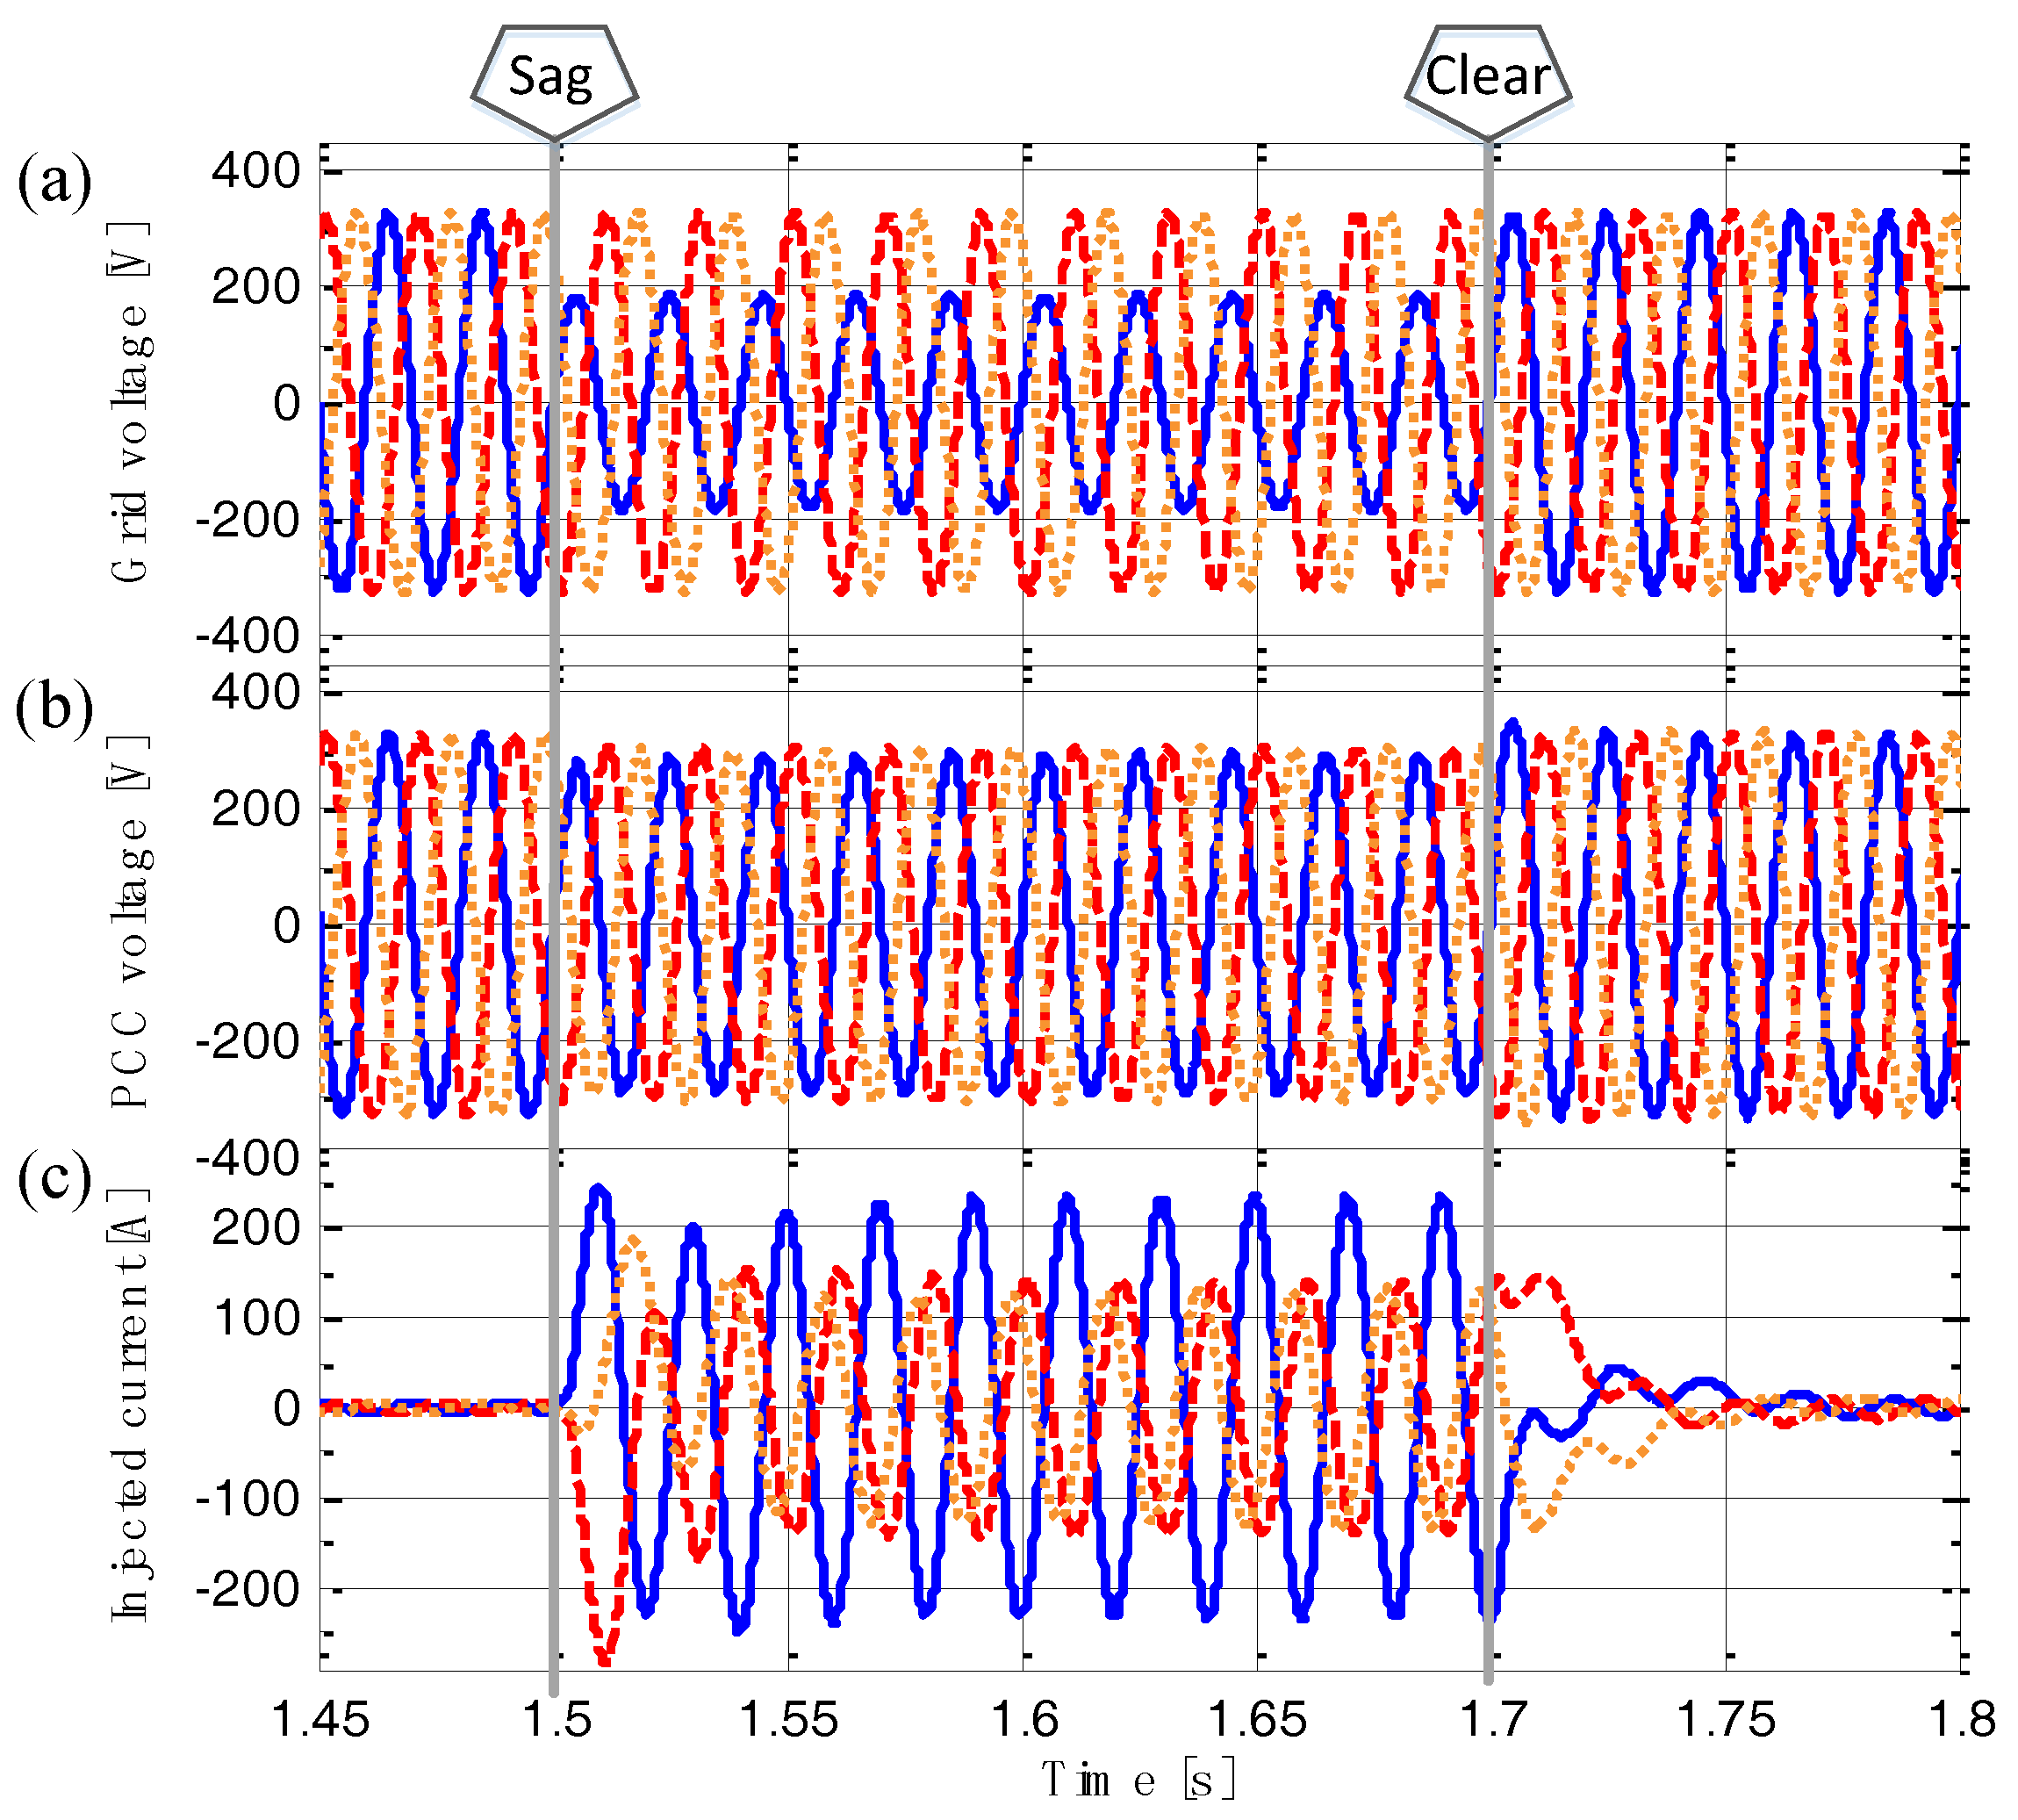
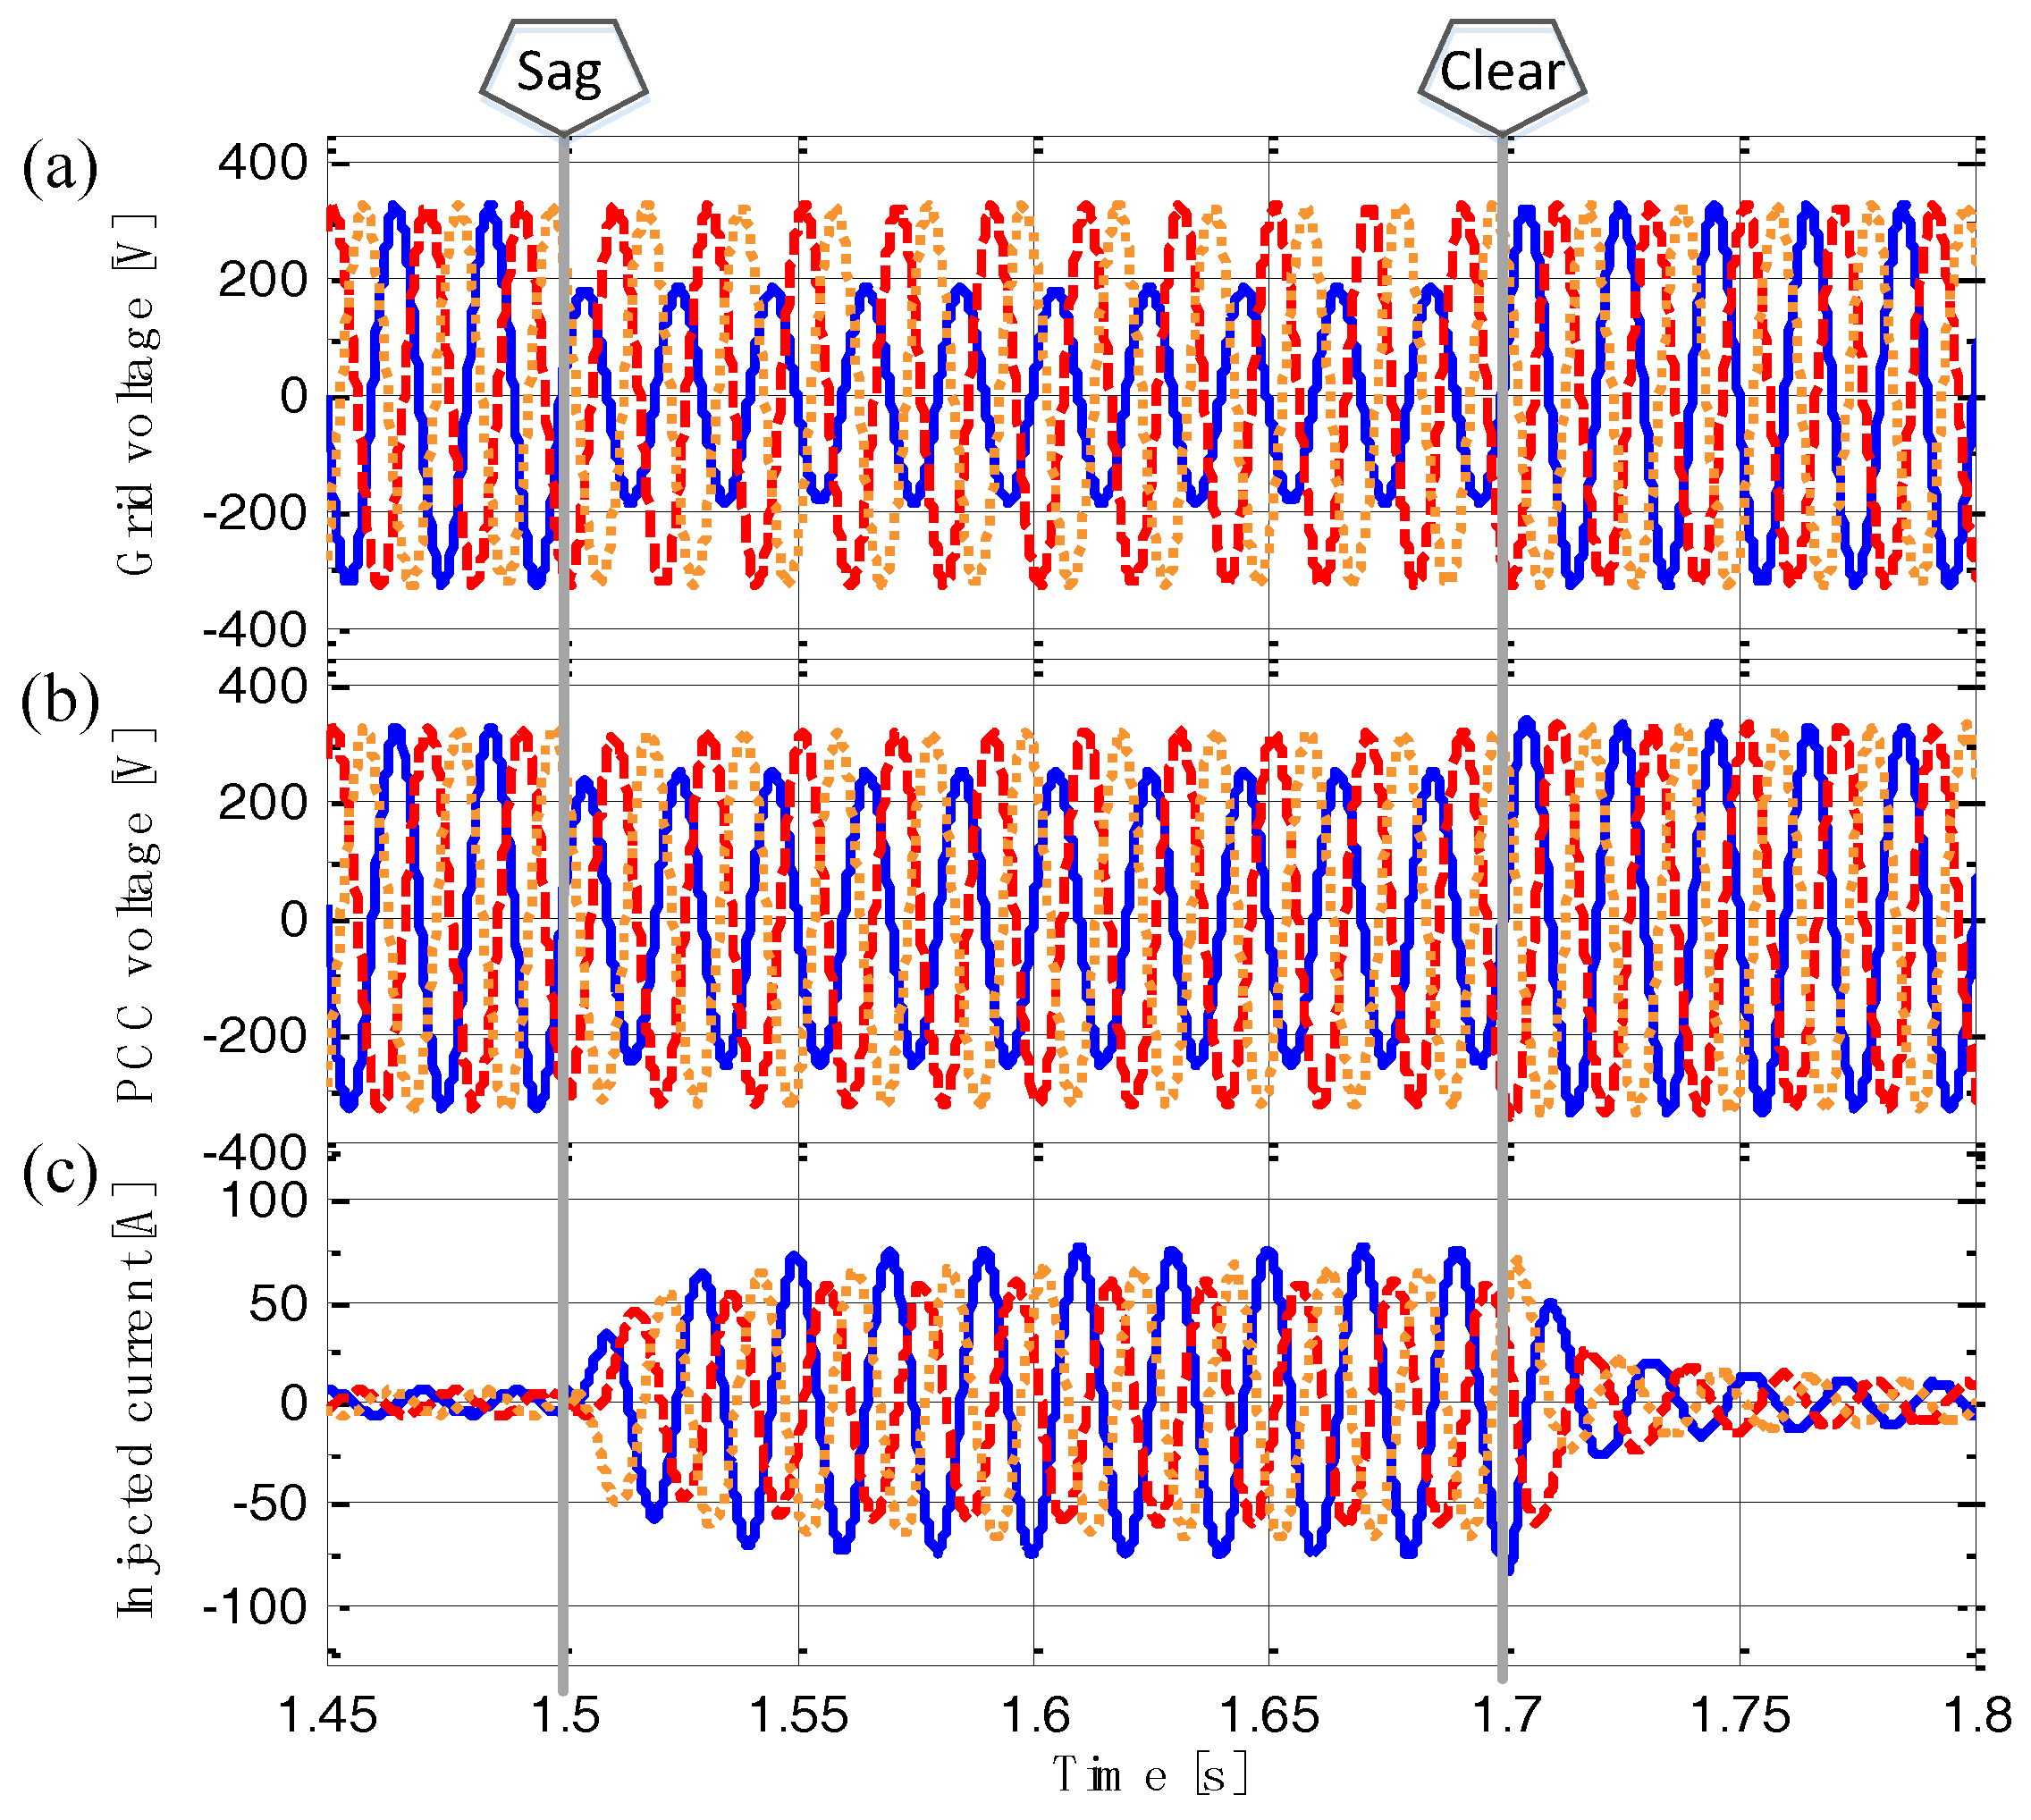
Working with the first set of values, i.e. with
Aneg = 10
Apos, it can be clearly appreciated in
Figure 6 how the power converter provides a significant support to recover the voltage at the PCC,
, regarding both magnitude and symmetry recovery. By using such a large value for the negative-sequence admittance, the unbalanced voltage at the PCC is almost compensated as
Figure 6b shows, compared to the grid voltage
, as
Figure 6a shows. The highly unbalanced current injected to the grid, shown in
Figure 6c, denotes its large negative-sequence component.
Considering the second set of values, a small value for the negative-sequence admittance is used,
Aneg = 0.1
Apos, hence the converter injects a very limited amount of negative-sequence current during the unbalanced fault, which is denoted by the relatively balanced current waveforms shown in
Figure 7c. As a result, the PCC voltage unbalance is almost not compensated during the unbalanced grid fault as
Figure 7b shows. Setting a low value for
Aneg can be needed in practice considering current limitations of the power converter. Hence, small size power converters will be mainly responsible for positive-sequence current injection.
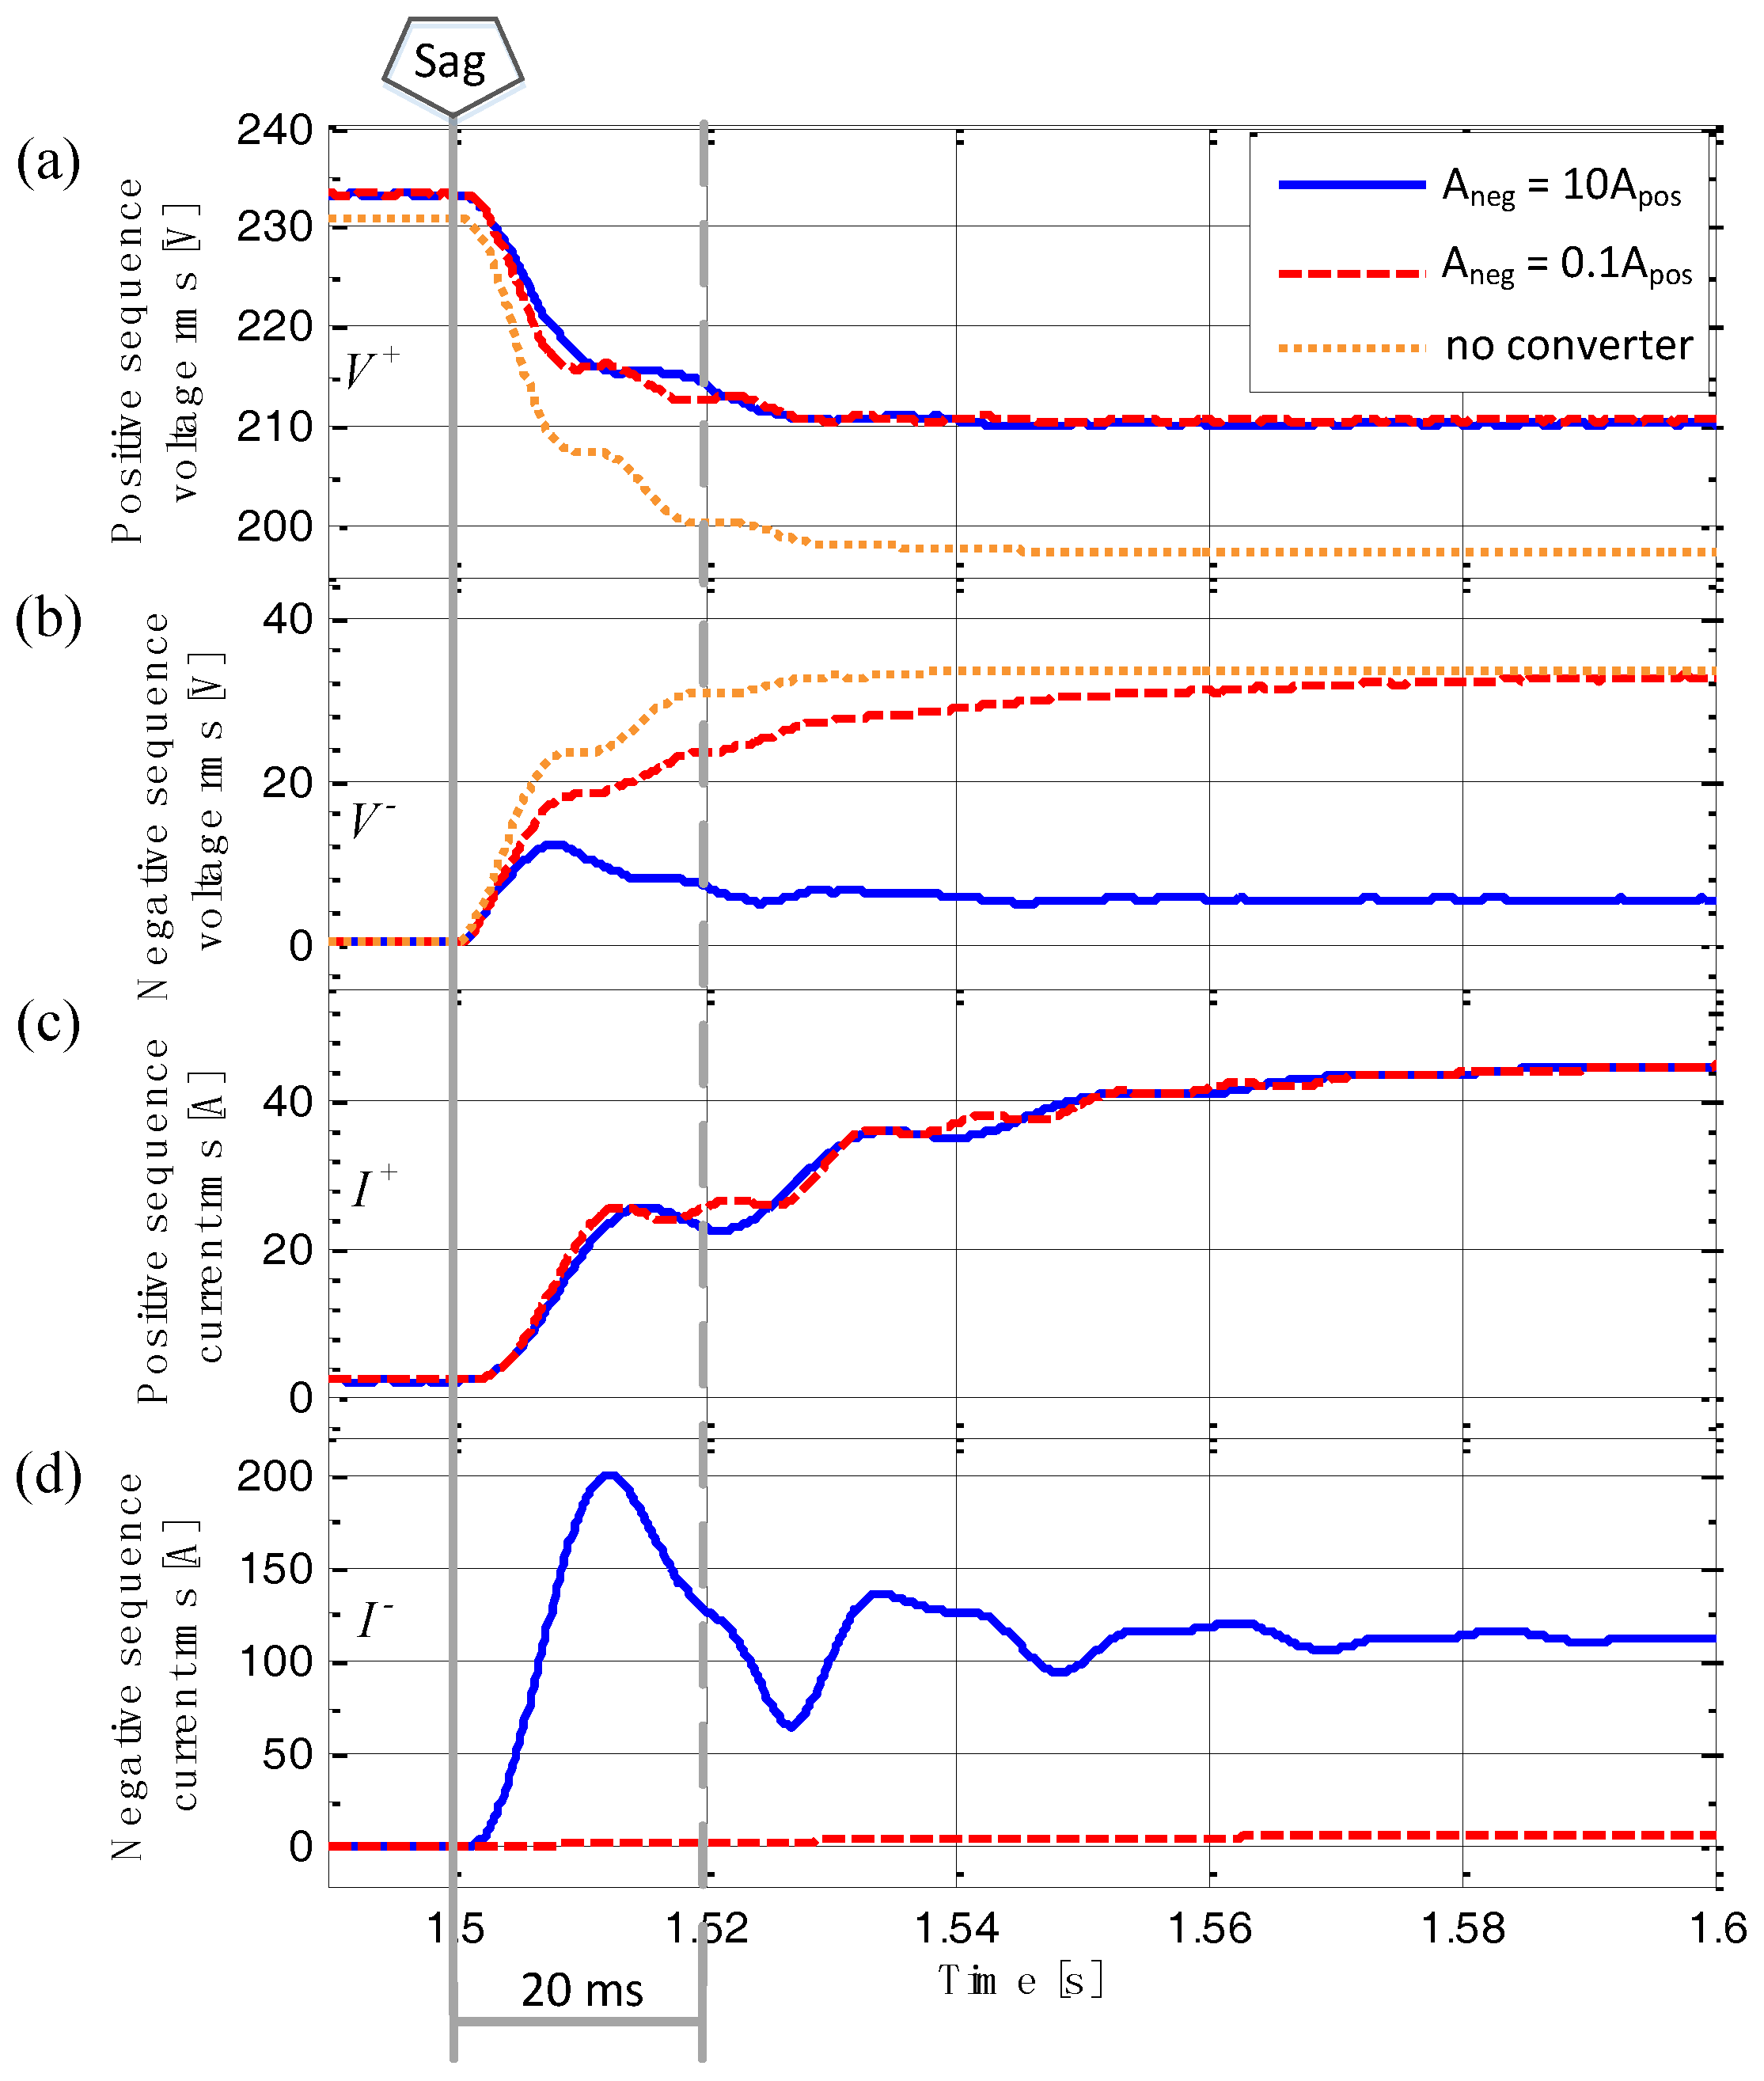
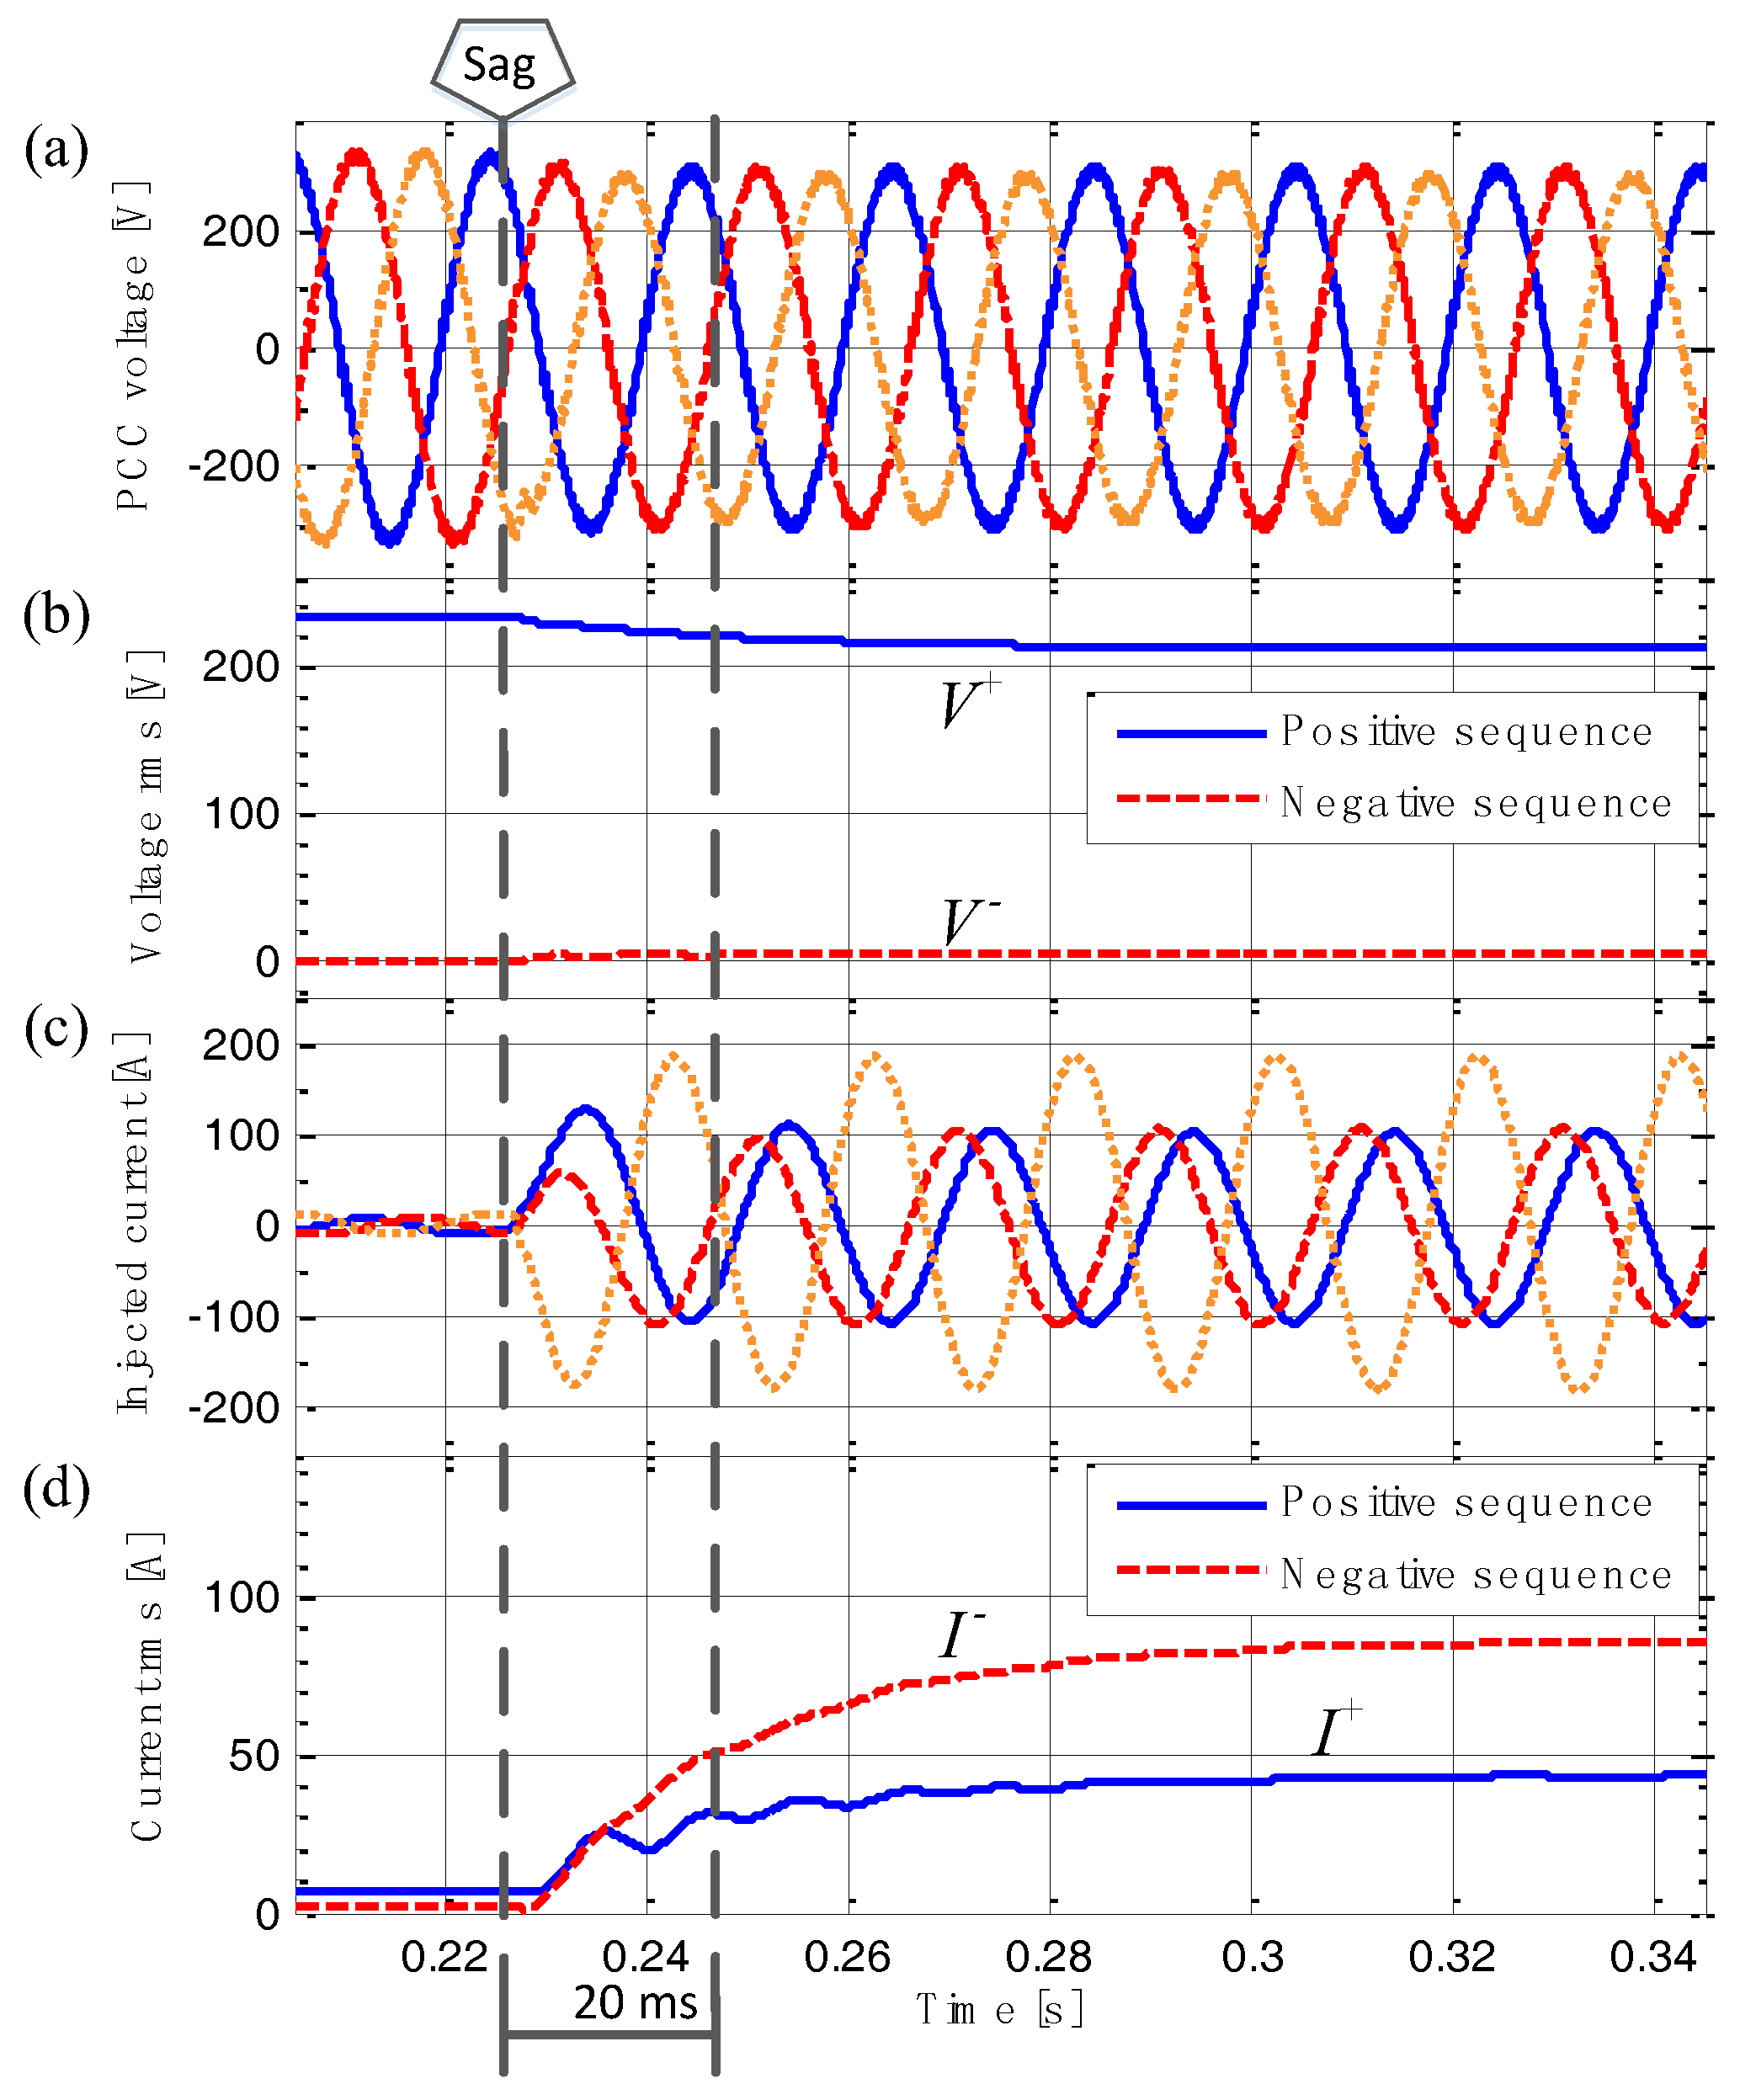
The rms value for the positive- and negative-sequence components of the voltage at the PCC and the injected current, calculated by
and
, are shown in
Figure 8.
Figure 8a shows that the positive-sequence voltage is properly supported by the SPC-based power converter with virtual admittance. The drop of the positive-sequence voltage component at the PCC is 8.5% when the power converter is activated, in comparison with 14.1% when the power converter is blocked.
Figure 8b demonstrates a significant compensation of the unbalanced effect. When
Aneg = 10, the per-unit rms voltage of the negative-sequence at the PCC during the fault is only 2.35%, a value much smaller than 14.6%, which is the per-unit rms voltage of the negative-sequence component of the voltage at the main grid.
Figure 8d shows that the rms value of the negative-sequence current injected during the unbalanced fault can be simply adjusted by changing the values for the negative-sequence admittance, i.e.,
Aneg.
Figure 8 also shows that the reaction of the converter in presence of the unbalanced fault is less than 20 ms and gets settled within 100 ms, which meets the grid codes requirements.
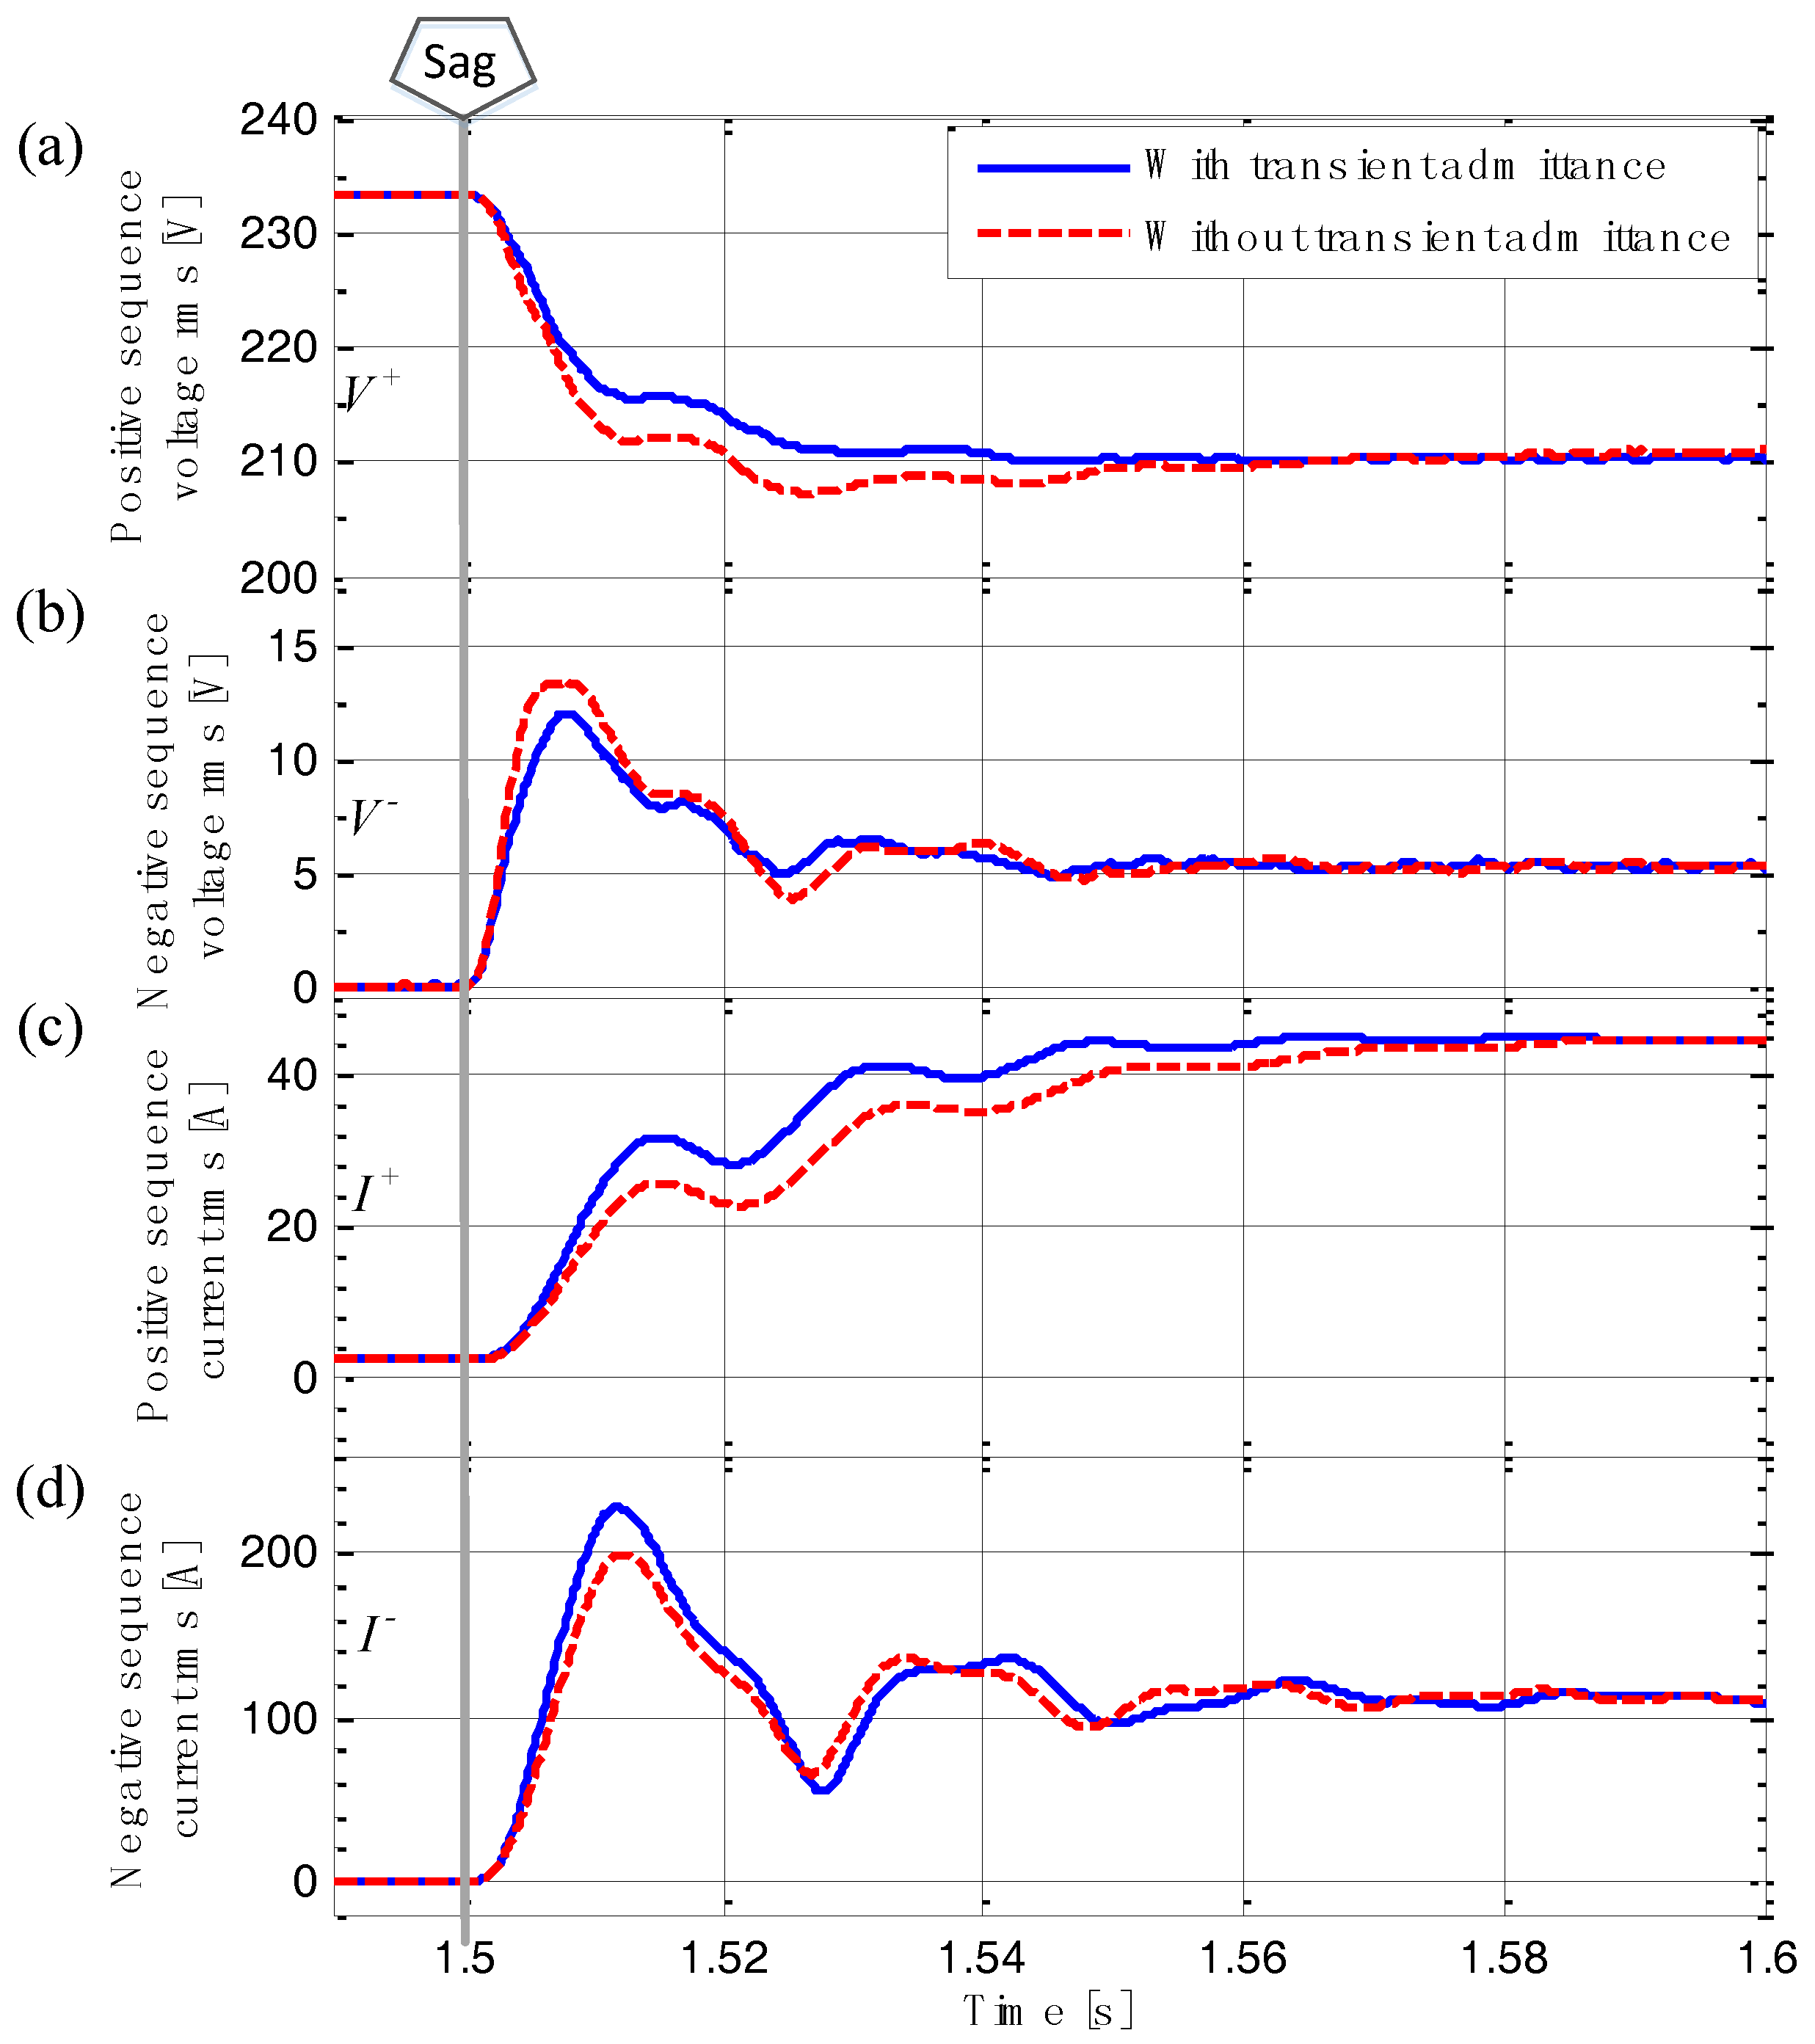
Figure 9 shows the effect of the transient admittance branch in the proposed virtual admittance block.
Atrans is set to 0 and 1 in two different study cases, while
Apos is set to 1 and
Aneg is set to 10 in both cases. As seen in
Figure 9, the transient admittance contributes to a faster response when the unbalanced fault takes place. The injected current responds faster when the transient admittance is enabled, and both positive- and negative-sequence components of the PCC voltage present a smoother change than in the case of disabling the transient impedance. The coherence of the steady-state profiles in each scope of
Figure 9 shows that the static performance is not affected by the transient admittance.
4. Experimental Results
As a first test scenario, a 10 kW grid-connected power converter is used to check whether the SPC controlled power converter can start-up and injects the power correctly with good dynamics.
The converter is programmed to have small virtual admittances in all the three branches of the virtual admittance block initially, being Apos = Aneg = Atrans = 0.01, in order to minimize the transient at the instant of grid connection. Then, the virtual admittance parameters gradually increase to 1 after the switching is enabled. Then, the active and reactive power references jump from 0 to 10 kW and 2.5 kVar afterwards.
Figure 10 shows the current waveforms during the whole process. It is seen that no transient of current is found at the instant when the converter’s switching is enabled, and no oscillations of current are found during the admittance parameters changing and the active power step-up.
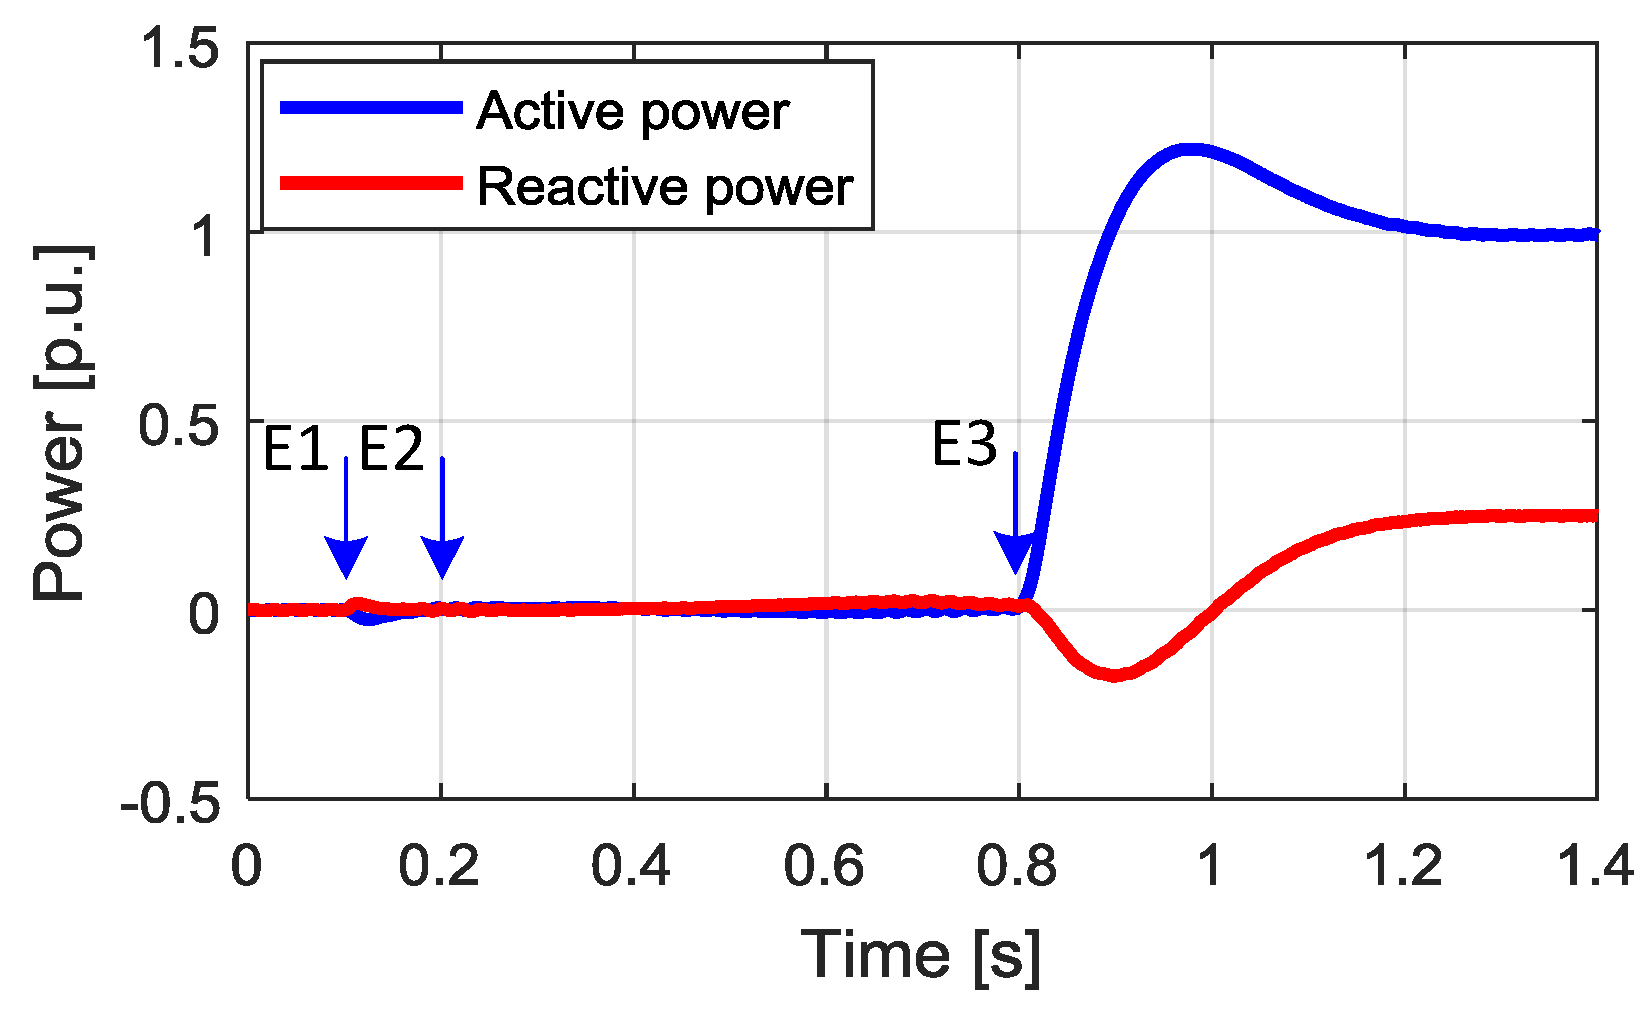
Figure 11 shows the active and reactive power injected by the power converter during the whole process. At
t = 0.1 s, the power converter’s switching is enabled (E1). At
t = 0.2 s, the admittance parameters start increasing from the value 0.01, and reach the value 1 at
t = 0.7 s. At
t = 0.8 s, the active and reactive power references jump from 0 to 10 kW and 2.5 kVar. It is observed how the power injected by the converter is correctly controlled free from oscillations or significant deviations during the whole process.
The above experimental results have demonstrated the correct implementation of the overall SPC control scheme. Then, the following tests are oriented to show the performance of the proposed virtual admittance block under asymmetrical grid fault.
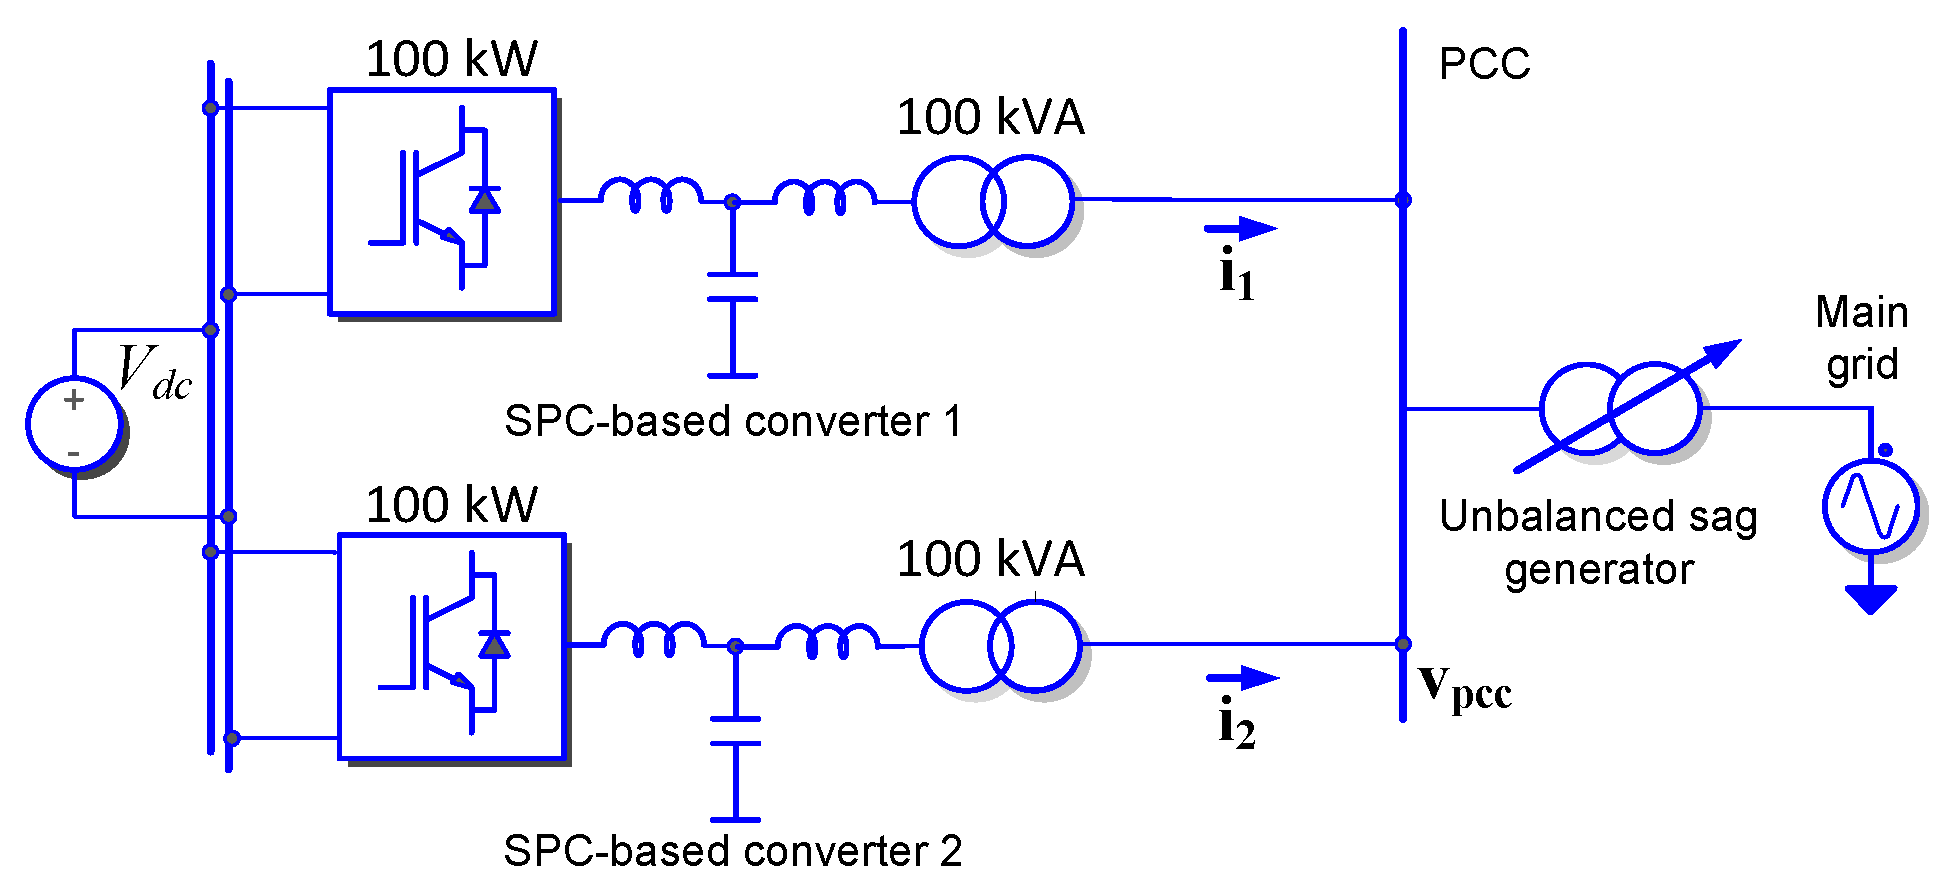
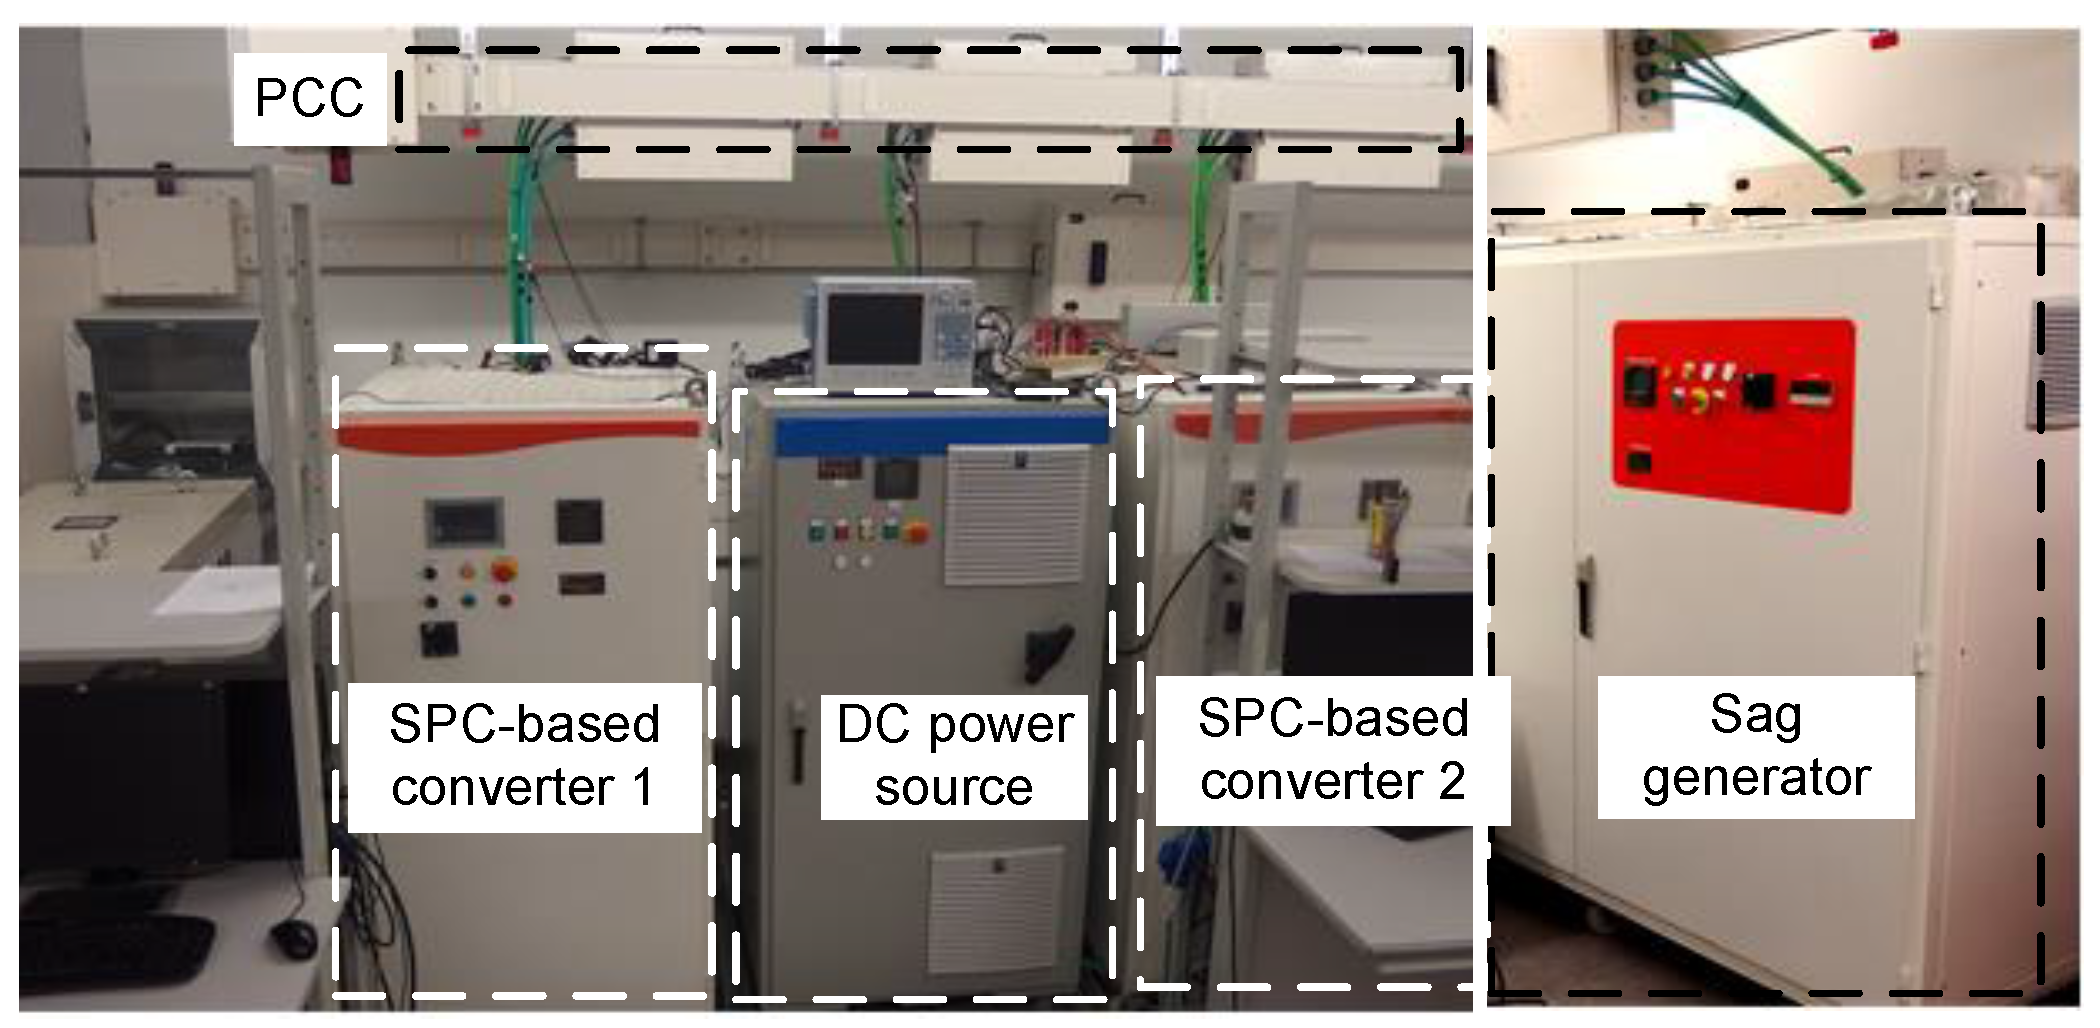
Figure 12 shows the experimental setup for asymmetrical grid fault tests, where two 100 kW two-level three-phase power converters with the same specifications are connected in parallel and to the utility grid through a sag generator. The setup is pictured in
Figure 13. A dc power source supplies both converters. The parameters for the SPC-based power converters are the same as the ones used in simulation, shown in
Table 1. The event considered in the experiments is the same with the simulation tests, namely, a voltage sag of 0.43 p.u. in one of the phases of the ac grid.
In a first experiment, only one of the two converters is connected, and
Apos,
Aneg, and
Atrans are set to 1, 10 and 1, respectively. The voltage and current waveforms at the PCC during normal working and under fault conditions are shown in
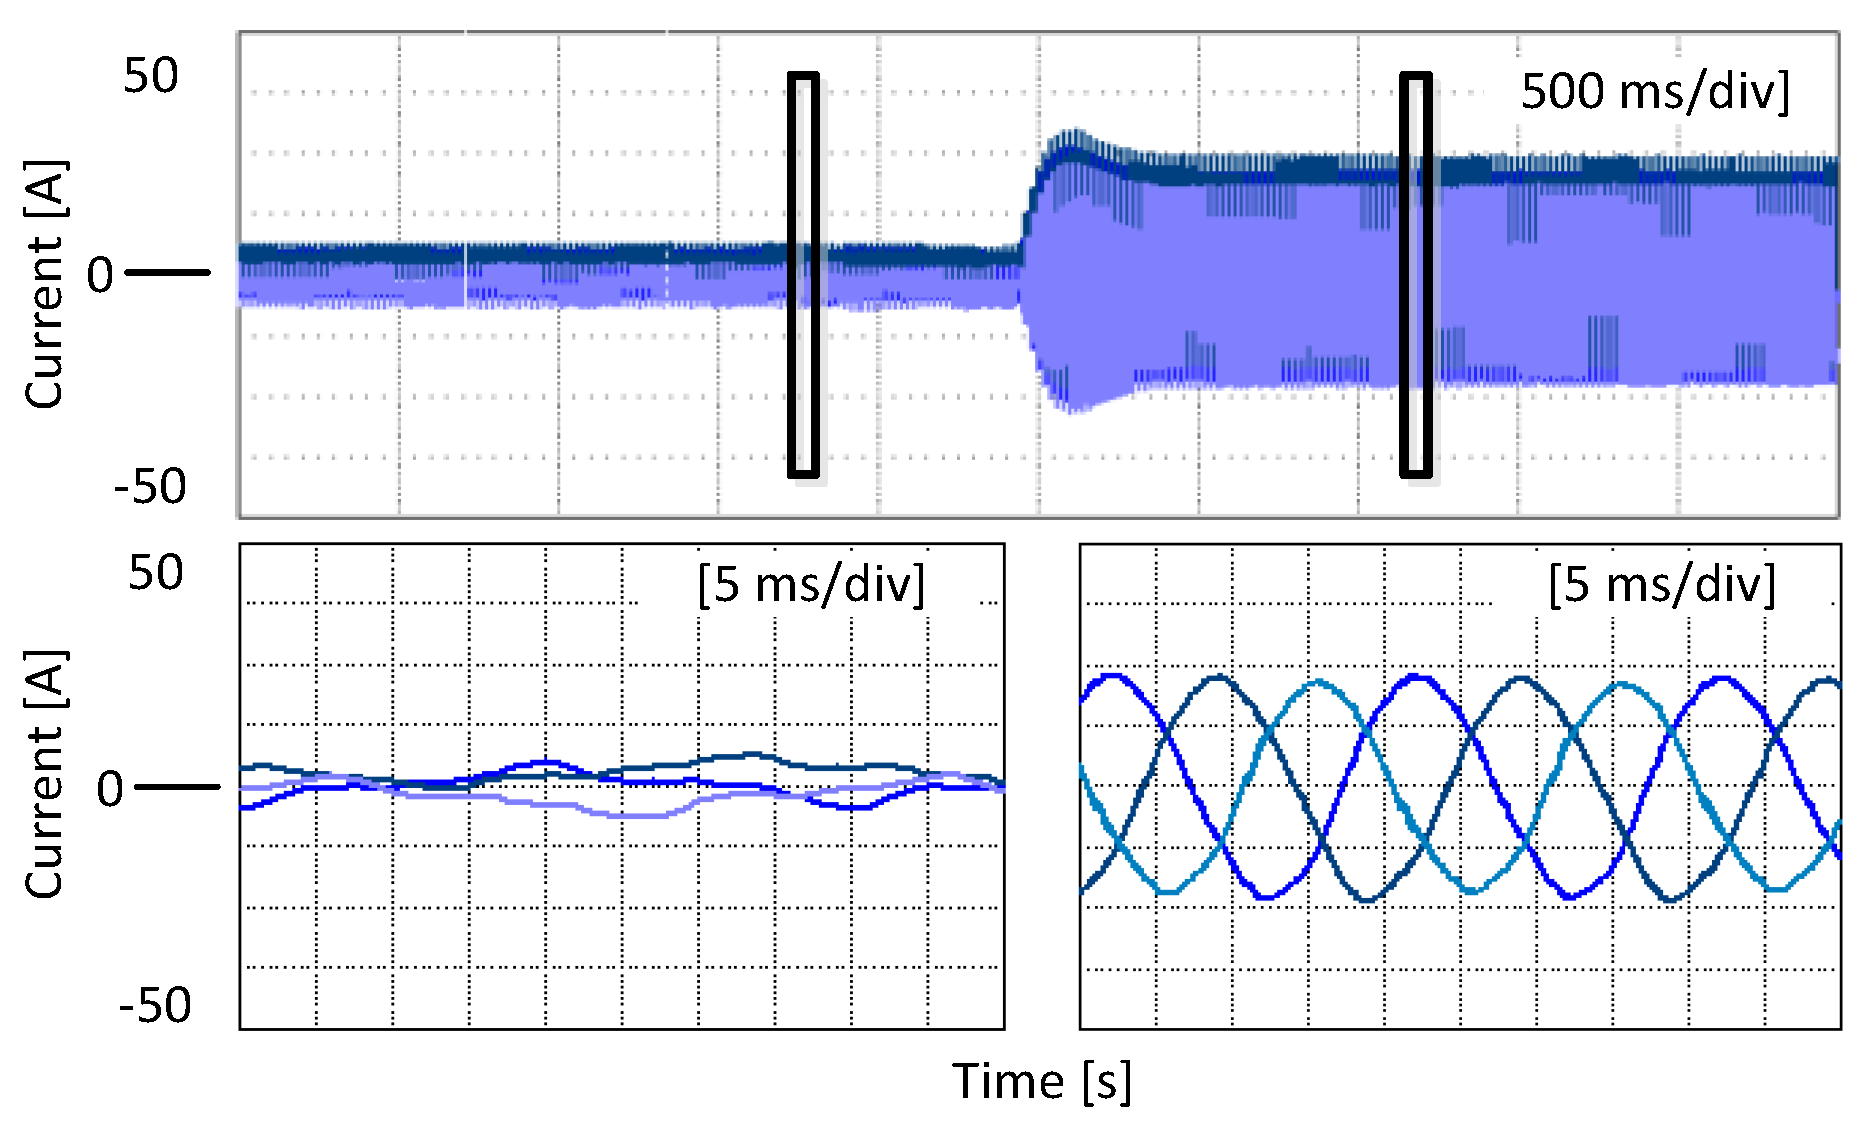
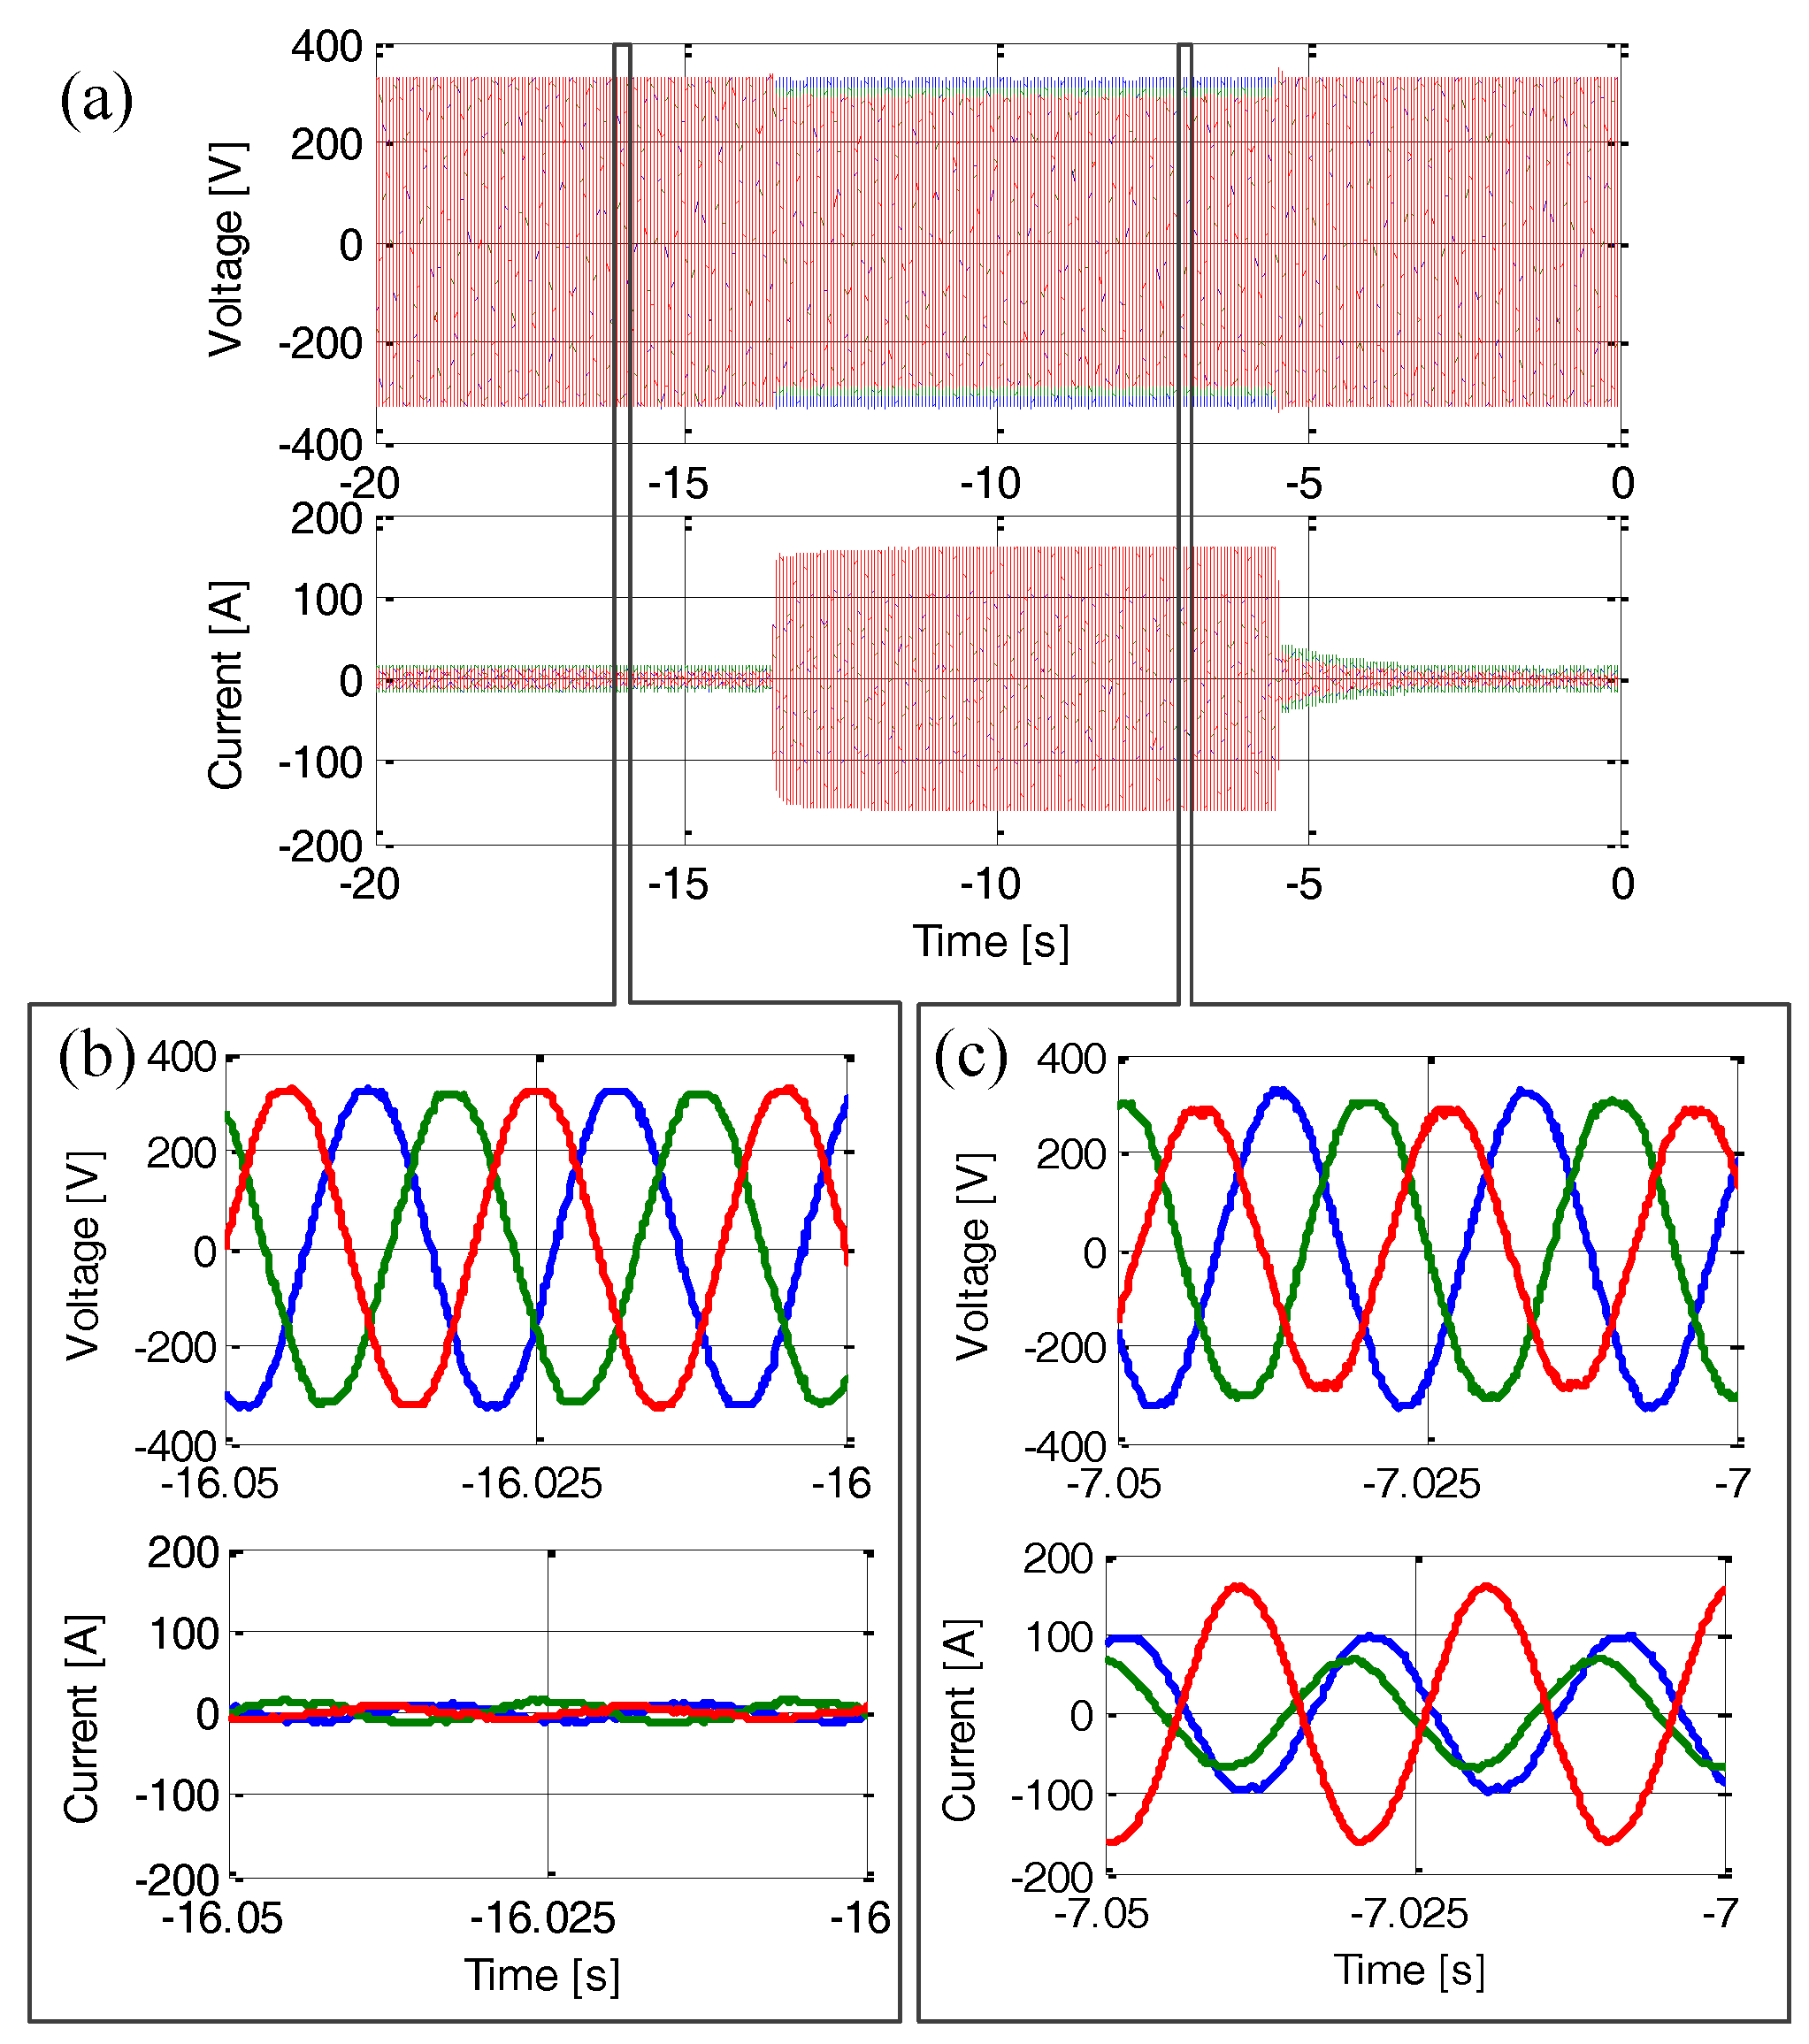
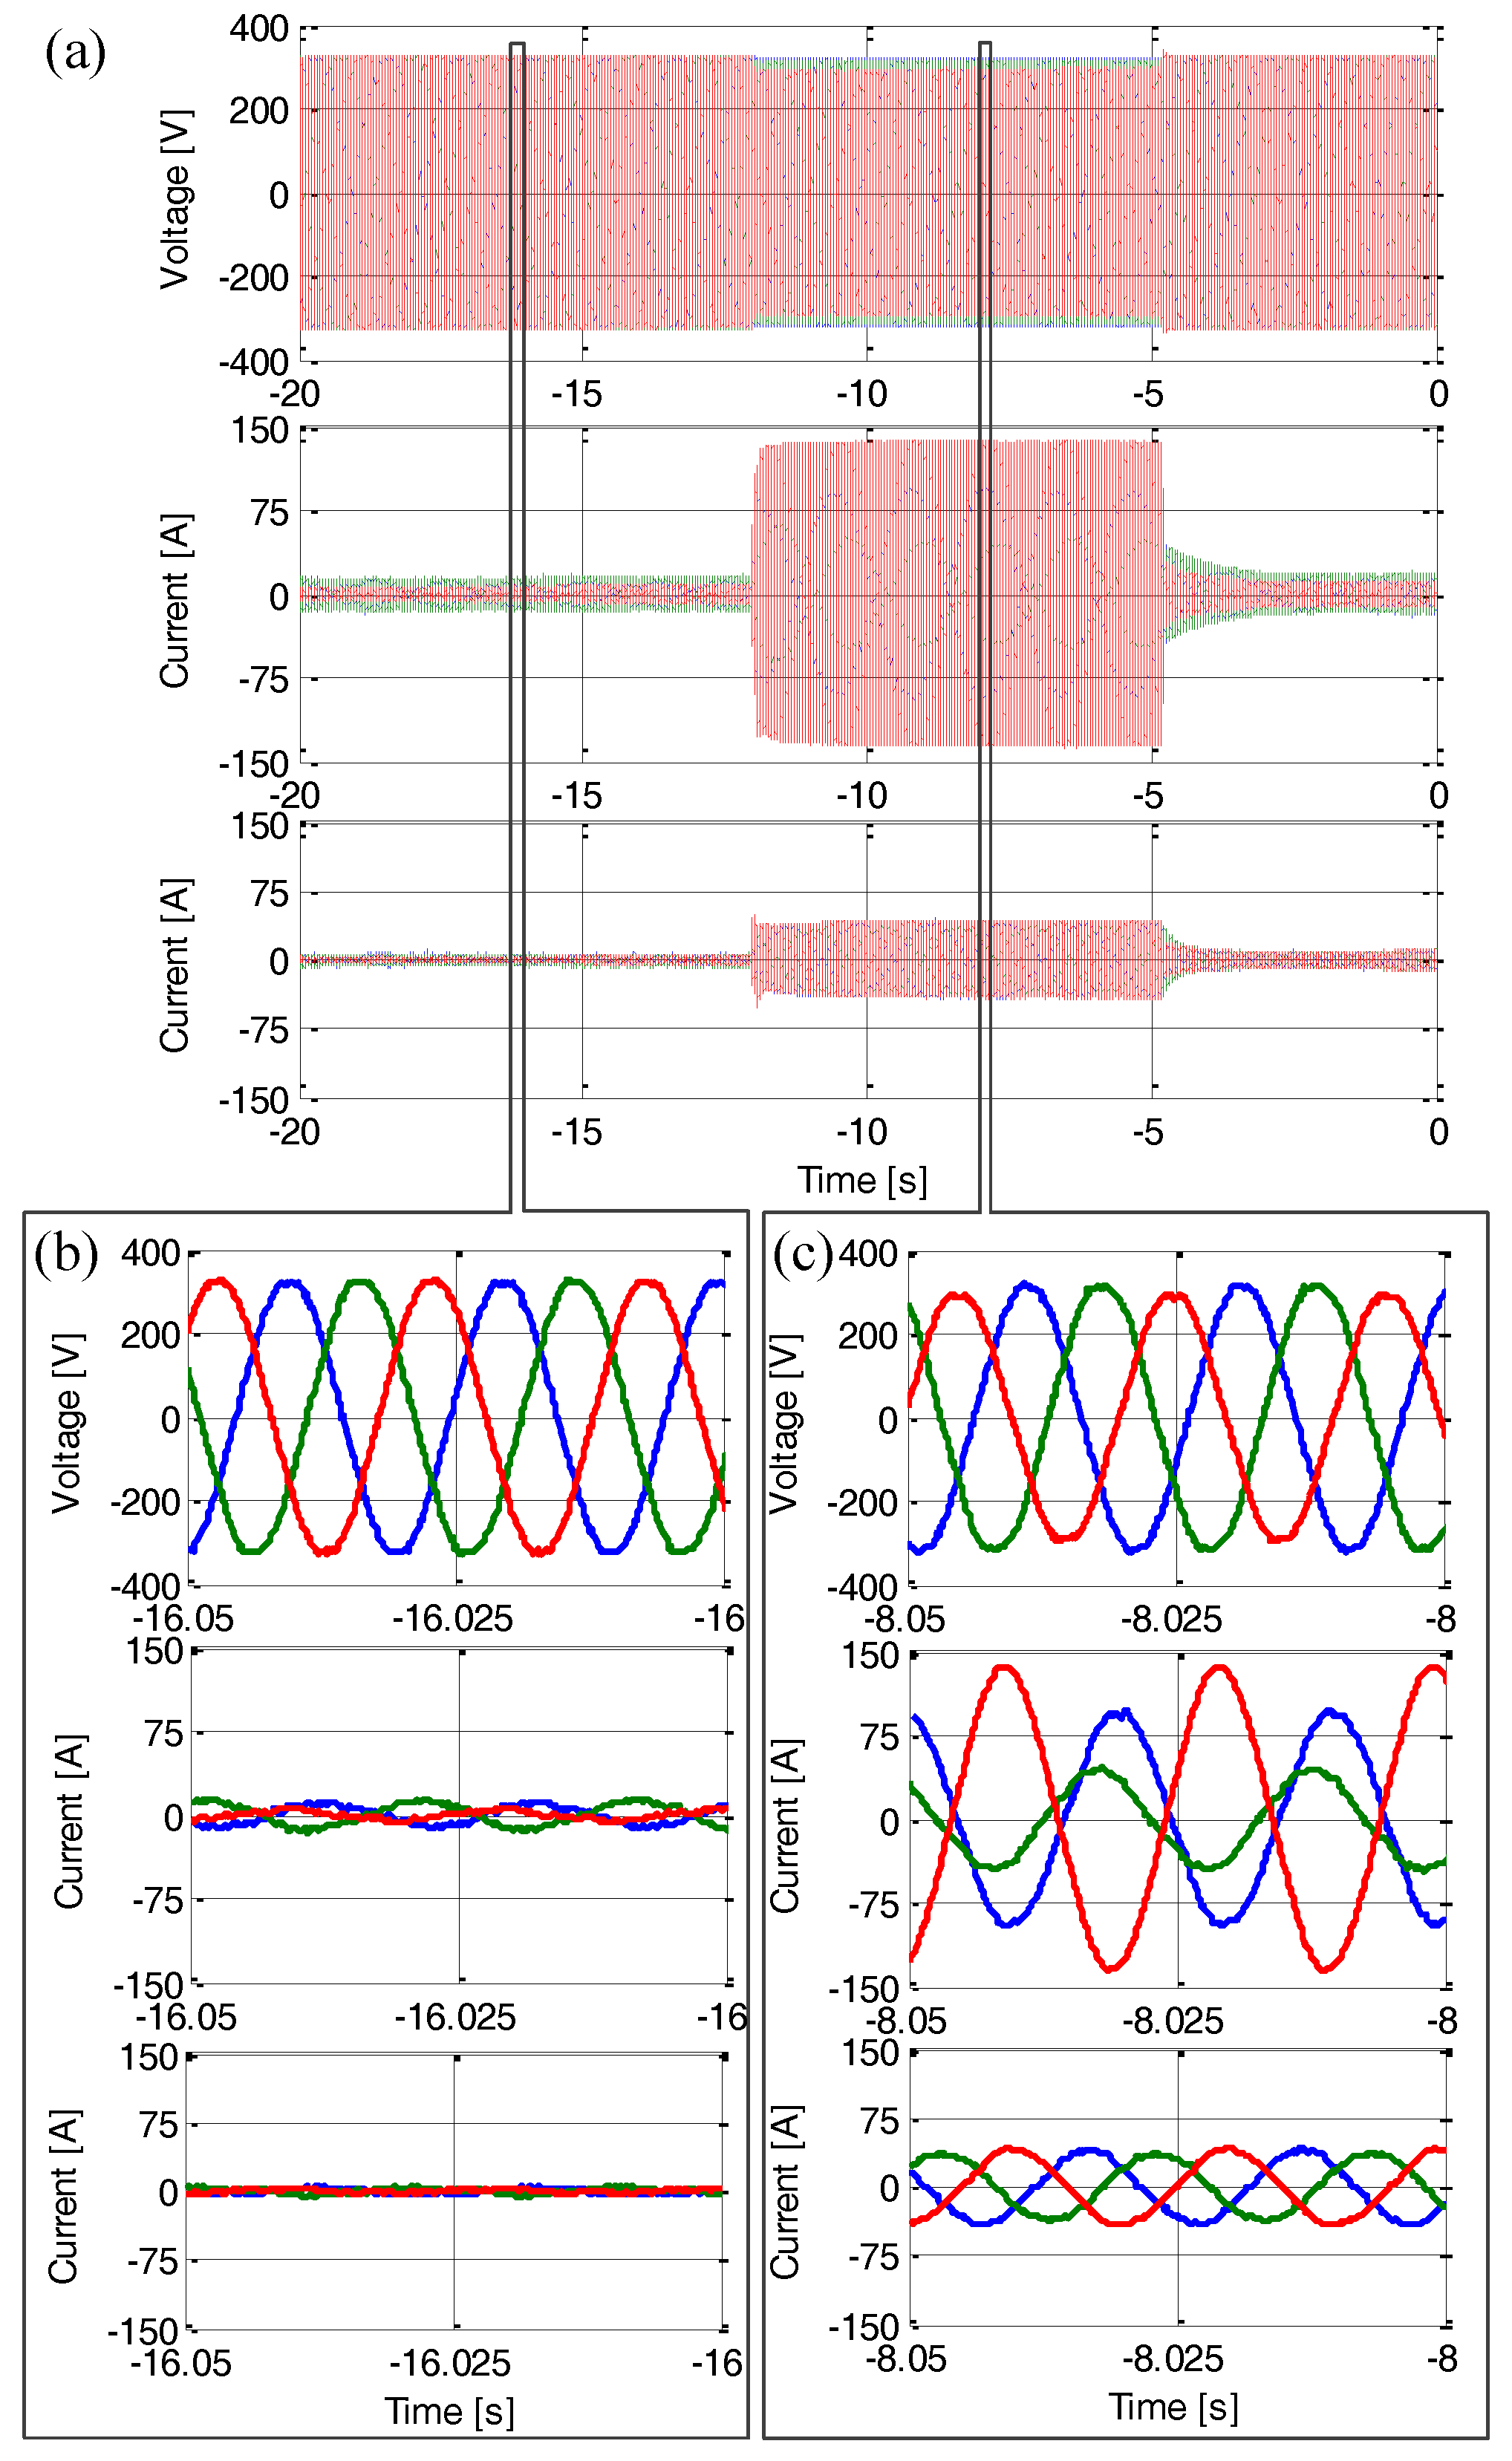
Figure 14. In this experimental test, the voltage sag is started and ended manually, which lasts for 8 s.
Figure 14a shows the envelope of the PCC voltage and converter injected current before, during and after the fault. A zoom-in of the pre-fault voltage and current waveforms are shown in
Figure 14b, while the zoom-in voltage and current waveforms during the fault are shown in
Figure 14c. These plots evidence how the PCC voltage is well supported during the unbalanced fault. There are only minor visible differences in the voltage waveforms magnitude before and during the fault. Therefore, it is demonstrated how the injected negative-sequence current results in relatively balanced voltage waveforms at the PCC.
The recorded data from the oscilloscope are plotted in
Figure 15 to check the power converter dynamics and a quantitative evaluation of the injected positive- and negative-sequence currents. The positive- and negative-sequence components of the PCC voltage are also calculated.
From the profiles of the rms current of the positive- and negative-sequence components, as
Figure 15d shows, the fast reaction of the power converter to support the unbalanced grid voltage can be appreciated. The positive- and negative-sequence current raised to 68% and 62% of the steady-state value, respectively, just 20 ms after of the fault start.
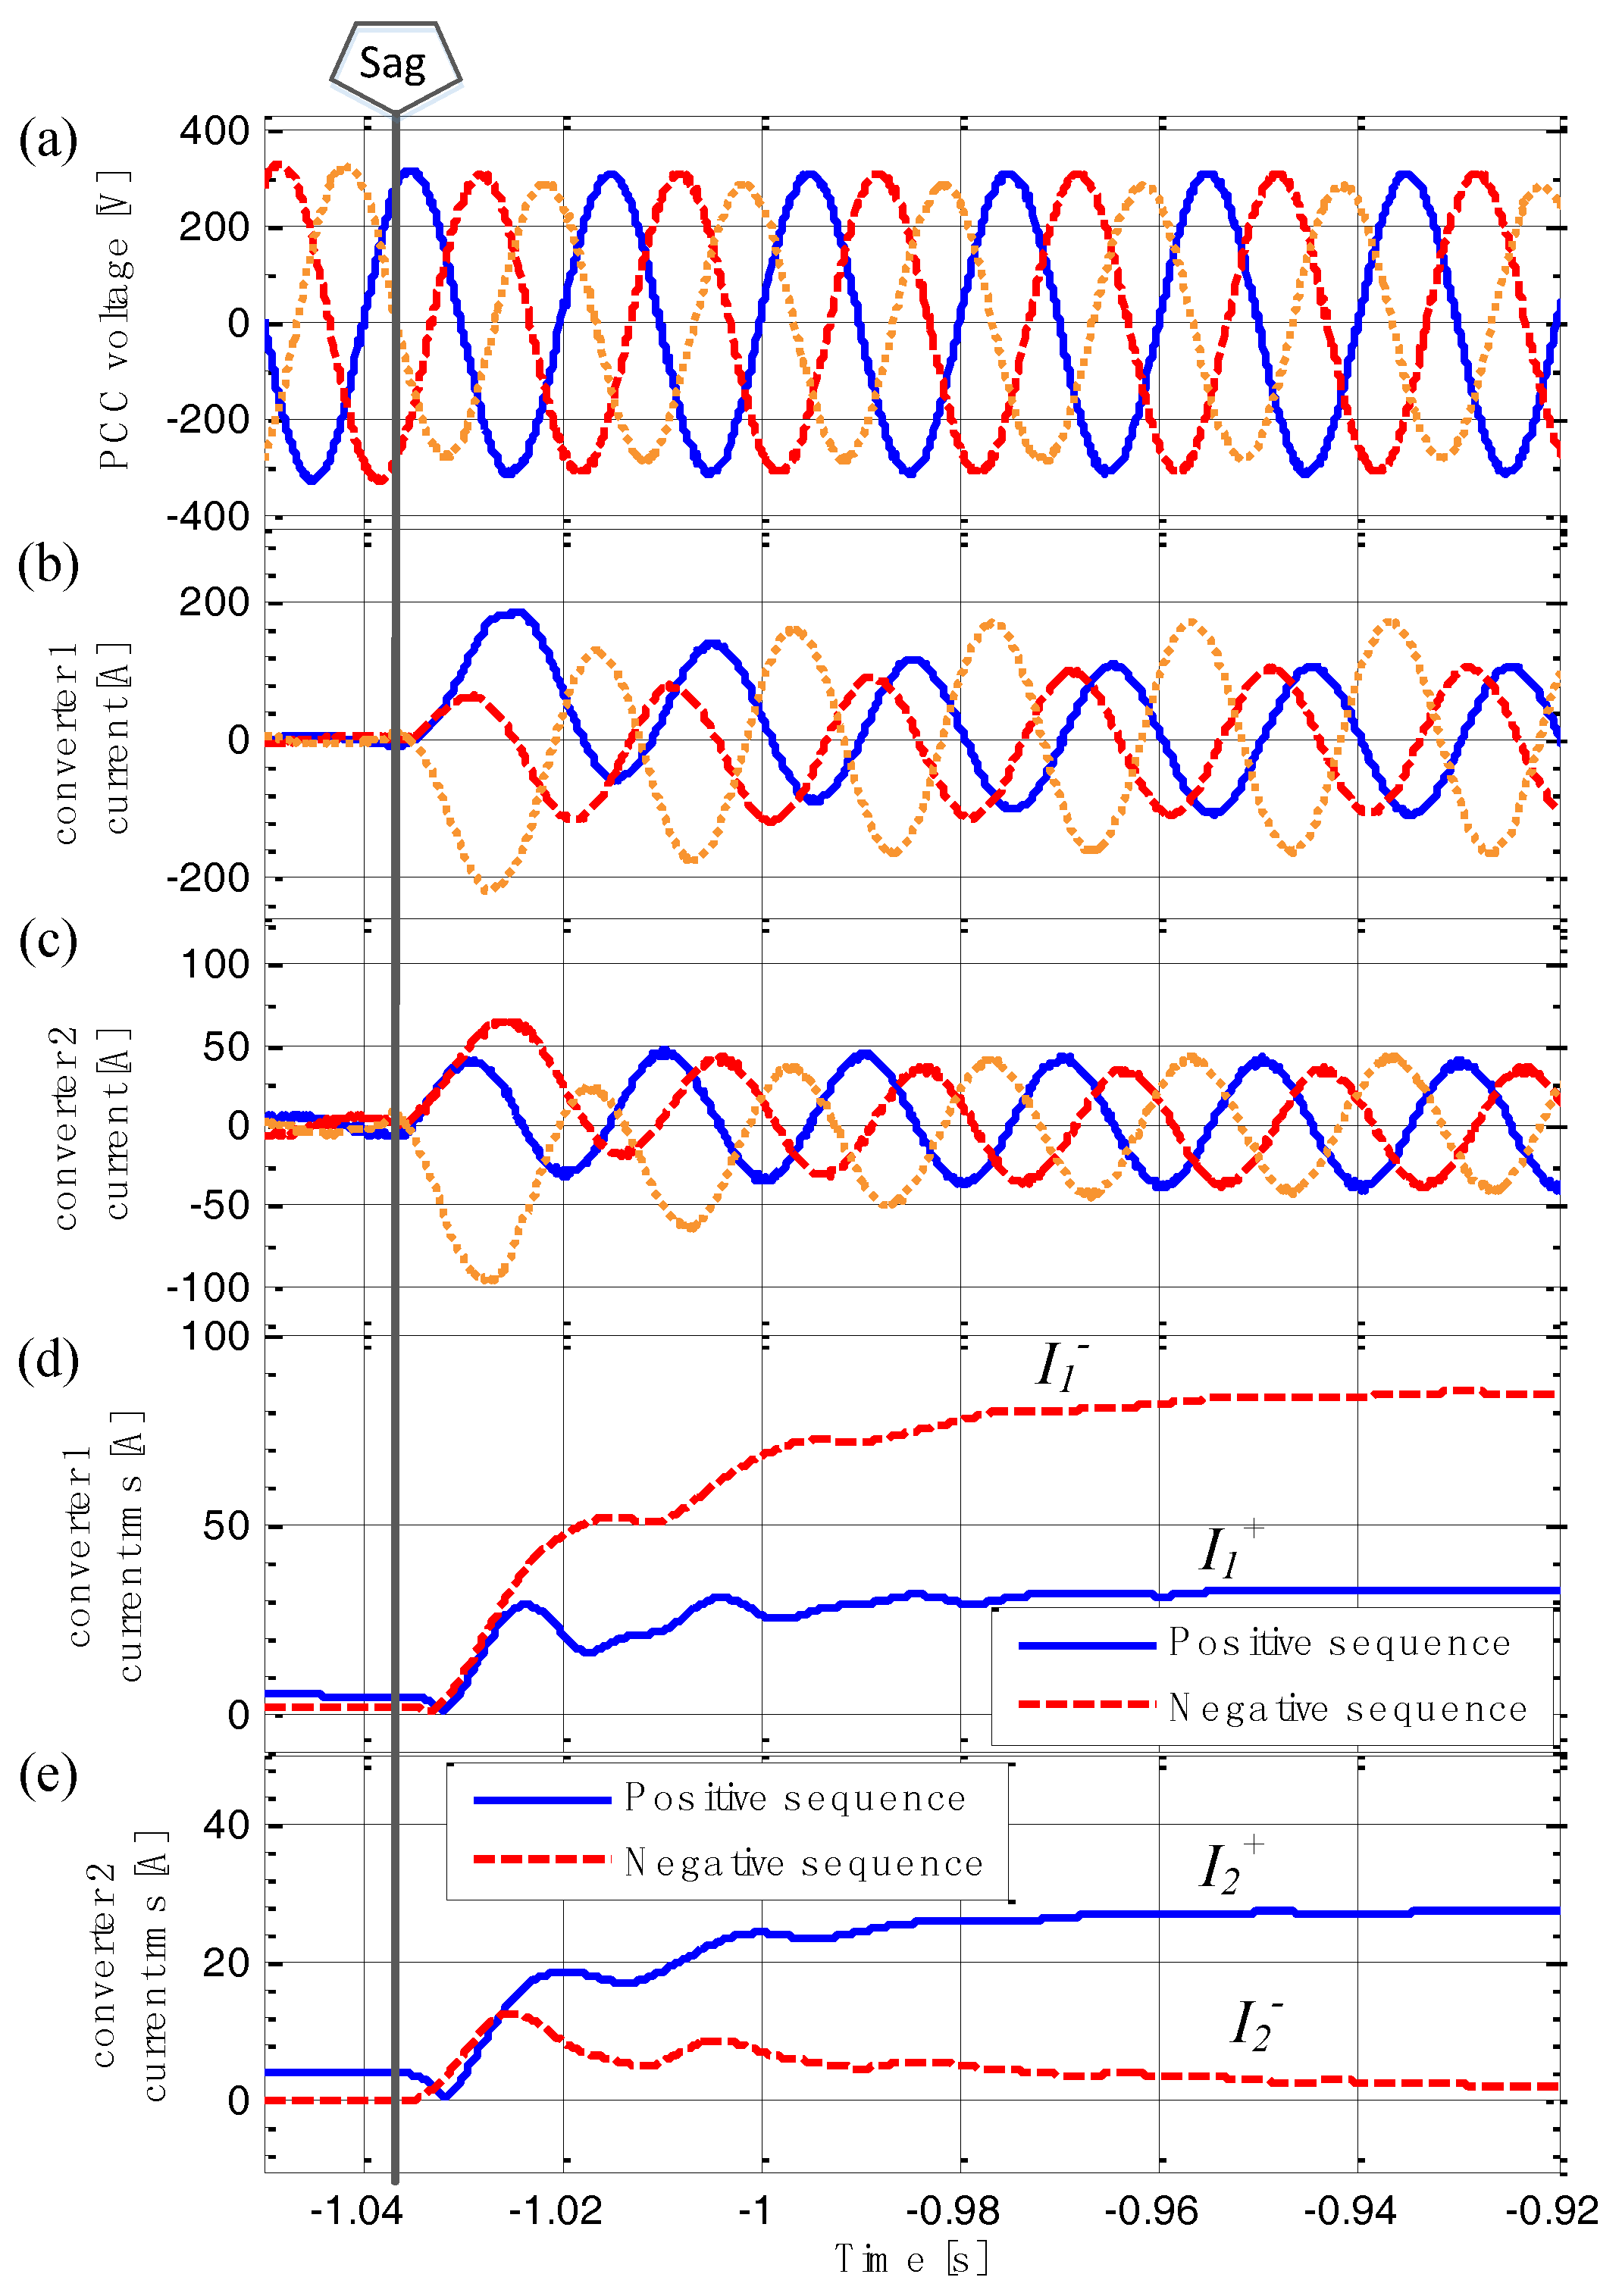
In a second experimental test, both converters are connected to the grid in order to test current sharing performance in front of common disturbances. The positive- and transient-admittance values were set the same for both converters, while different values for Aneg were set for the two power converters, i.e., Aneg = 10 Apos, and Aneg = 0.1 Apos, respectively.
Figure 16 shows the difference in the current injection of the two power converters when different values for
Aneg are set in both converters. For converter 1, with
Aneg = 10, the injected current during the fault has unbalanced waveforms as
Figure 16c shows, since it contains a large amount of negative-sequence component. For converter 2, with
Aneg = 0.1, the injected current during the fault is relatively balanced, due to the small rate of negative-sequence current injection. Thanks to the combined support provided by both converters, the voltage at the PCC does not experience a significant change in magnitude during the grid fault, which can be seen by comparing
Figure 16b,c.
Figure 17 compares the rms value of the current injected by both converters. Since both of them have the same value for
Apos, the rms value of the positive-sequence current component is at the same level in both converters. However, the negative-sequence rms current profiles for both converters exhibit a clear difference in magnitude. It practically demonstrates that negative-sequence current sharing among paralleled converter can be easily adjusted by just setting proper values for
Aneg in each of them.
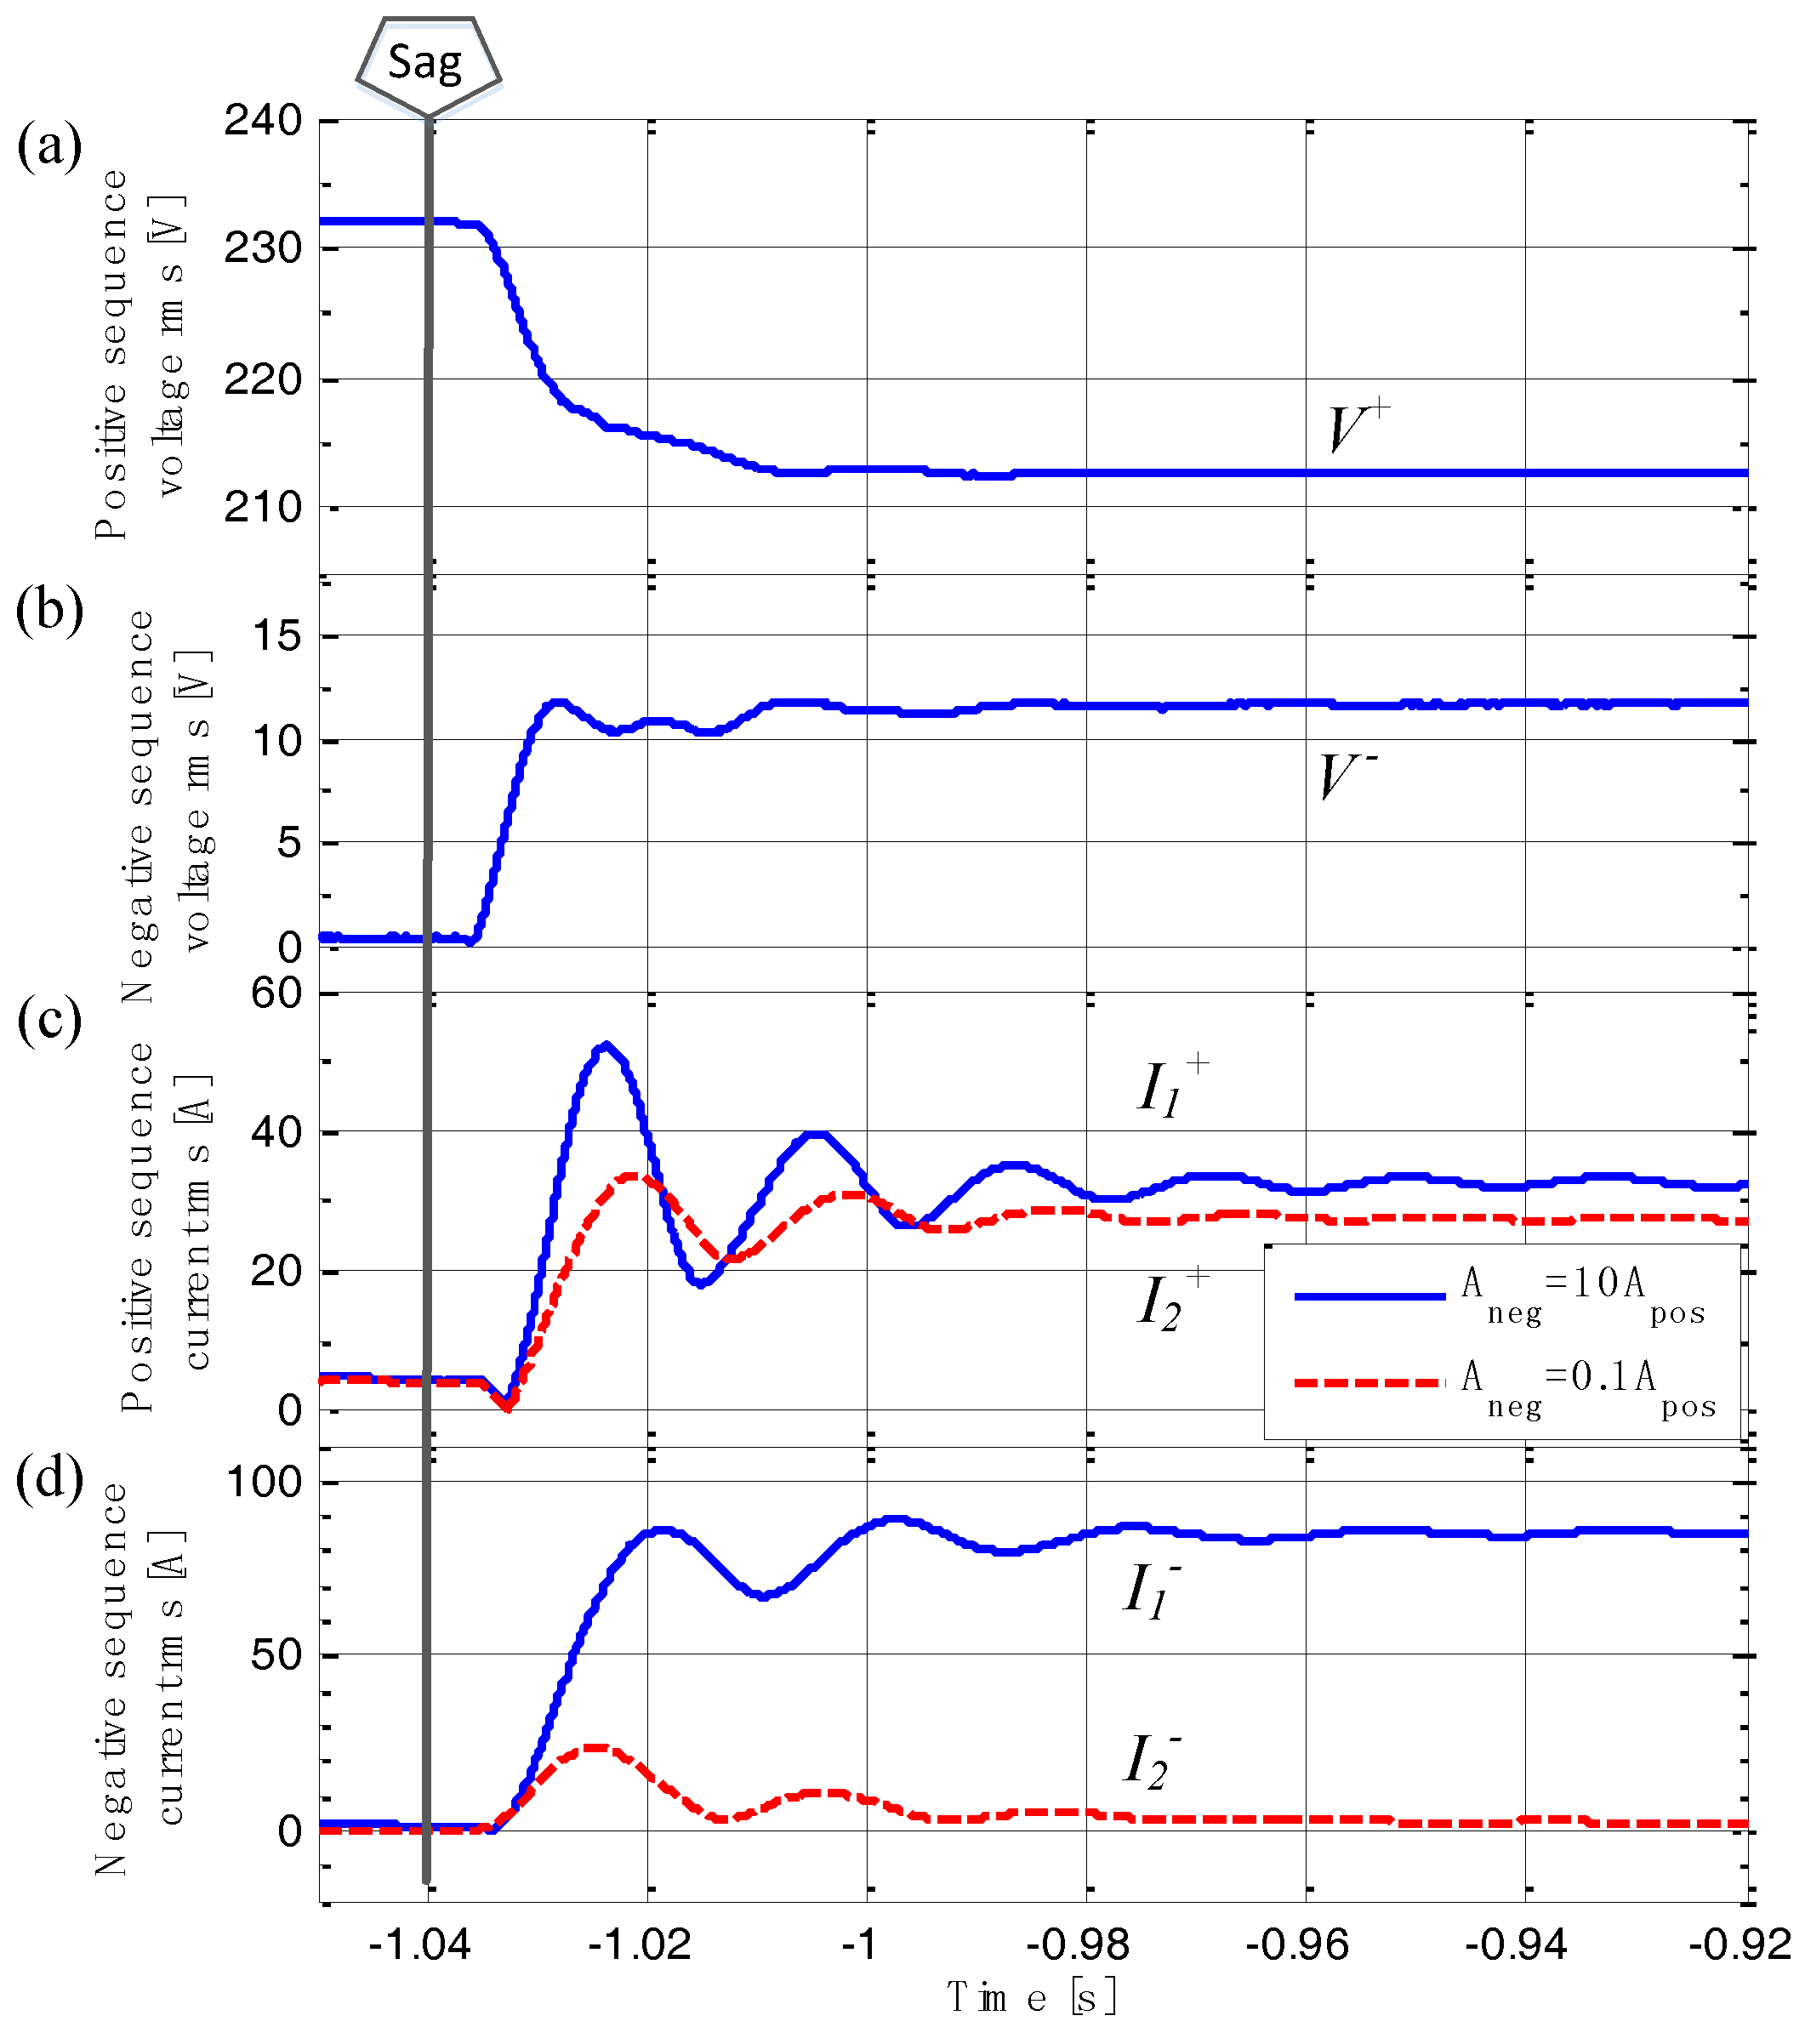
Figure 18 shows the rms profile of the positive- and negative-sequence components of the voltage at the PCC and the currents injected by two power converters with different negative-sequence virtual admittances. The positive-sequence voltage drop at the PCC, as
Figure 18a shows, is equal to 8.3% of its rated value, which is much smaller than the positive-sequence grid voltage drop, which is equal to 13.8%. Since the two converters have the same value for
Apos, the steady-state value of
I1+ and
I2+ are close each other as
Figure 18c shows. However, converter 1 injects much more amount of negative-sequence current than converter 2 as
Figure 18d shows, due to the high value set for
Aneg in the former. The negative-sequence voltage component at the PCC increases by 5.2% during the fault. It is worth noting that even though the negative-sequence voltage component at the PCC, as
Figure 18b shows, is 5.2%, which is smaller than the one in grid voltage (14.6%) during the unbalanced fault, it is greater than the one in the former experiment, when converter 2 was not connected (1.9%). Therefore, the relative influence of converter 1 on the PCC voltage is reduced due to the participation of converter 2.
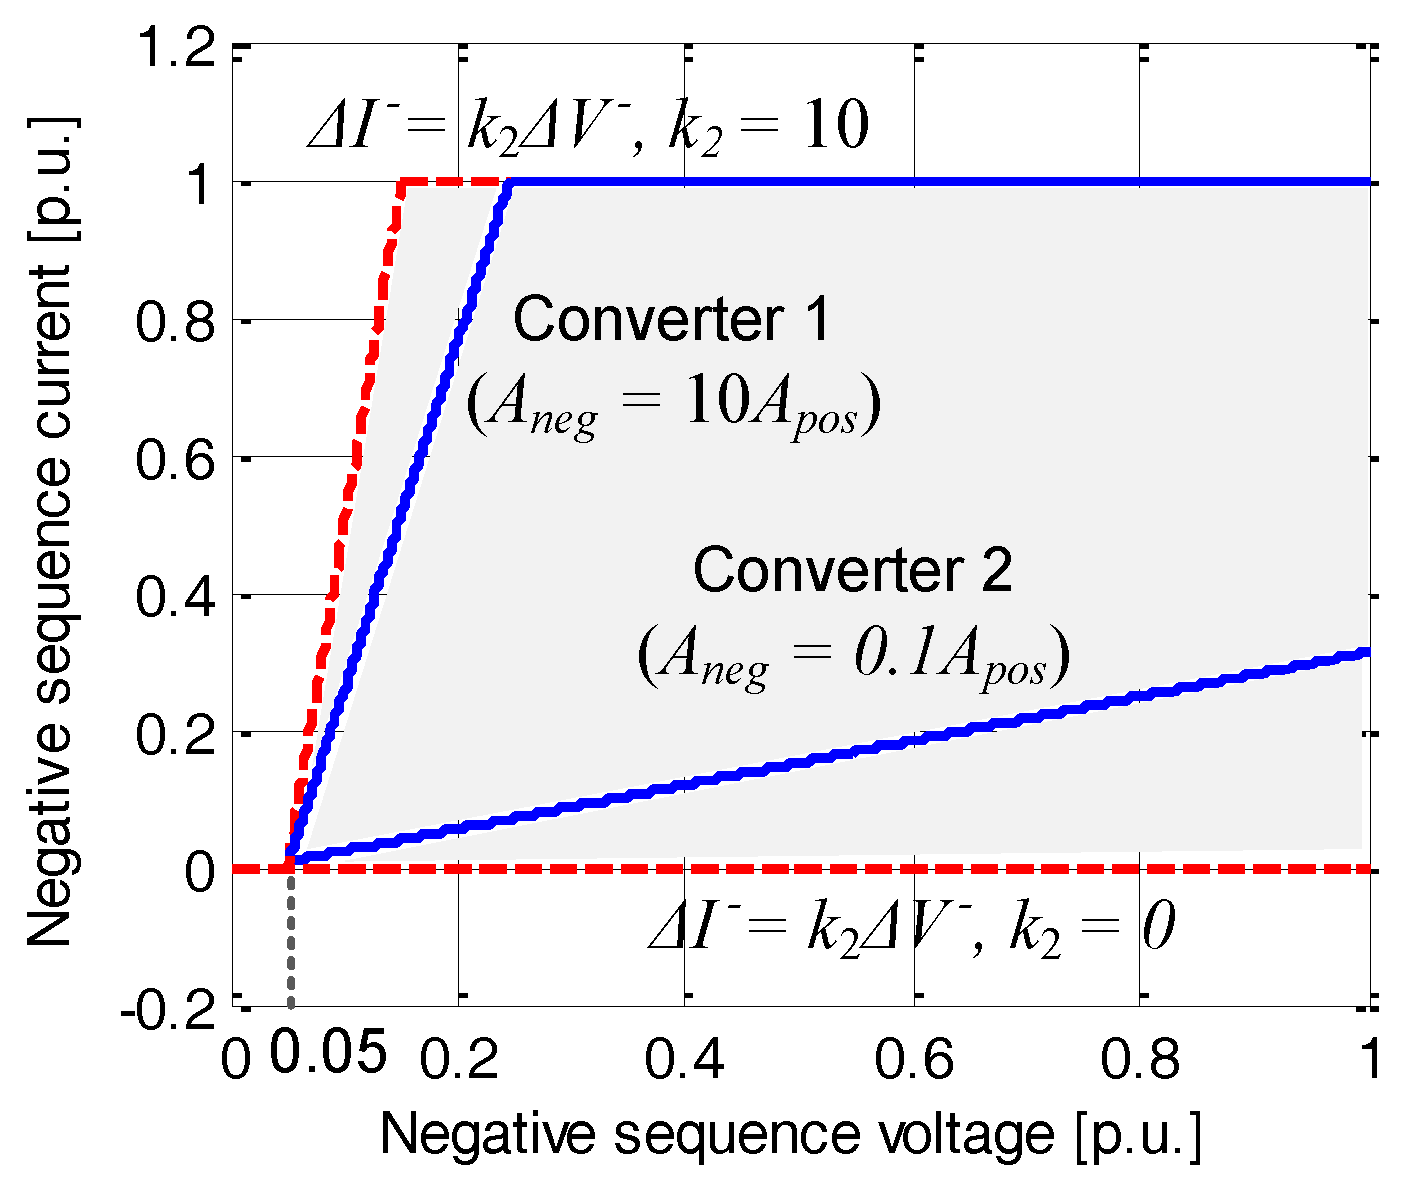
Based on the steady-state rms value for the positive- and negative-sequence voltage and current components, the actual gain of the negative-sequence current injection (Δ
I−/Δ
V−) obtained from experimental results can be calculated. The actual gains for the two converters are visualized in
Figure 19 and compared with requirements in the Verband der Elektrotechnik (VDE) grid codes (considering a 5% dead-band for each one). As can be observed in
Figure 19, the characteristics of the two converters are within the range of the grid codes requirements (the shadow area).


