Article

Experimental Investigation on Propagation Characteristics of PD Radiated UHF Signal in Actual 252 kV GIS

1
State Grid Hebei Electric Power Research Institute, Shijiazhuang 050021, China
2
State Key Laboratory of Electrical Insulation and Power Equipment, School of Electrical Engineering, Xi’an Jiaotong University, Xi’an 710049, China
*
Authors to whom correspondence should be addressed.
Energies 2017, 10(7), 942; https://doi.org/10.3390/en10070942
Submission received: 17 June 2017 / Revised: 17 June 2017 / Accepted: 4 July 2017 / Published: 7 July 2017

Abstract

:
For partial discharge (PD) diagnostics in gas insulated switchgears (GISs) based on the ultra-high-frequency (UHF) method, it is essential to study the attenuation characteristics of UHF signals so as to improve the application of the UHF technique. Currently, the performance of UHF has not been adequately considered in most experimental research, while the constructive conclusions about the installation and position of UHF sensors are relatively rare. In this research, by using a previously-designed broadband sensor, the output signal is detected and analyzed experimentally in a 252 kV GIS with L-shaped structure and disconnecting switch. Since the relative position of the sensor and the defect is usually fixed by prior research, three circumferential angle positions of the defect in cross section are performed. The results are studied by time, statistics and frequency analyses. This identifies that the discontinuity conductor of DS will lead to a rise of both the peak to peak value (Vpp) and the transmission rate of the UHF signal. Then, the frequency analysis indicates that the reason for the distinction of signal amplitude and transmission rate is that the mode components of the PD signal are distinctively affected by the special structure of GIS. Finally, the optimal circumferential angle position of the UHF Sensor is given based on the comparison of transmission rates.

1. Introduction

Gas insulated switchgear (GIS) has been increasingly used in electric power transmission networks since the 1960s for its high reliability and compactness. A survey by CIGRE pointed out that insulation failure is a major fault type in high-voltage (HV) equipment. In particular, the detection technology for partial discharge is the most important. The Ultra-High-Frequency (UHF) method, which detects the electromagnetic (EM) wave radiated by a partial discharge (PD), is used for PD diagnostics, and has obtained wide application thanks to its high sensitivity and immunity to disturbance [1,2,3,4,5].
The structure of GIS is similar to the coaxial waveguide, which makes the EM wave spread far away. However, GIS has some special structures and reflection elements, such as isolators, disconnecting conductors, and other electrical equipment which causes changes in the transmission medium and has a great impact on the propagation and attenuation of the EM signal. Furthermore, using the UHF technique in PD detection can be influenced by the position of the sensor, which will in turn affect the PD diagnosis. Therefore, it is necessary to investigate the propagation characteristics of UHF signals in various kinds of GIS structure [6,7,8,9,10] so as to study the propagation process of UHF signal and obtain optimal performance of the sensor. A considerable amount of research into the propagation characteristics of UHF signal has also been made from the viewpoint of EM wave modes [11,12,13,14,15]. Additionally, substantial research regarding the real-time monitoring of PD has also been conducted [16,17,18]. Because the features and position of the discharge signal are difficult to predict or reproduce, lots of simulation research has been carried out. Dyadic Green’s functions [19,20] have been proposed to simulate the PD signal propagation process in GIS at the beginning. Subsequently, the Finite Difference Time Domain (FDTD) method has been proven to be useful in studying the propagation characteristics of EM waves [21,22,23], as well as in the design of UHF sensors [24]. The authors have also investigated PD detection techniques for GIS based on UHF methods, especially for the design of UHF sensors [25,26] and propagation characteristics of PD-induced EM waves by using the FDTD method [27,28,29].
In order to understand the propagation process of EM waves deeply, and to develop the utilization of UHF methods, it is essential to clarify the attenuation characteristics and propagation processes of EM waves. Currently, most research, especially experimental work, has not considered the performance of UHF sensors adequately [30,31,32]. Since all PD analyses, such as location and charge quantity estimation, stem from the output signal of the sensor, and UHF signals range from 300 MHz to 3 GHz, a PD sensor with an ultra-wideband feature is definitely required [33,34]. Moreover, the circumferential angles between the UHF sensor and PD source in GIS, which has a great effect on PD detection, are actually random and has not been investigated sufficiently. Constructive conclusions regarding the installation and positioning of UHF sensors are relatively rare. Furthermore, the previous studies are not completely suitable for equipment with the corresponding voltage level in China. Therefore, more experimental research still needs to be performed. In their preceding papers, the authors have designed a planar equiangular spiral antenna (PESA) for internal UHF sensors, and have also examined the propagation of EM signals in different cases by using the Finite Difference Time Domain (FDTD) method. These were the first steps in a series of studies directed towards the above objective. Adopting the aforementioned PESA in the experimental study, this research aims to clarify the attenuation and propagation characteristics of UHF signals in a 252 kV GIS with an L-shaped structure (LS) and disconnecting switch (DS) tank, while the influence of circumferential angle positioning of UHF sensors in the GIS is also discussed. The output signal of the sensor is individually recorded under two applied voltage levels when the DS is closed and open. The time waveform, statistical feature and frequency spectrum of the results are investigated in detail. Finally, the transmission rates of the UHF signal in each case are compared in order to investigate the effect of sensor position, which provides a reference for actual utilization of UHF sensors and better application of UHF techniques in PD detection.

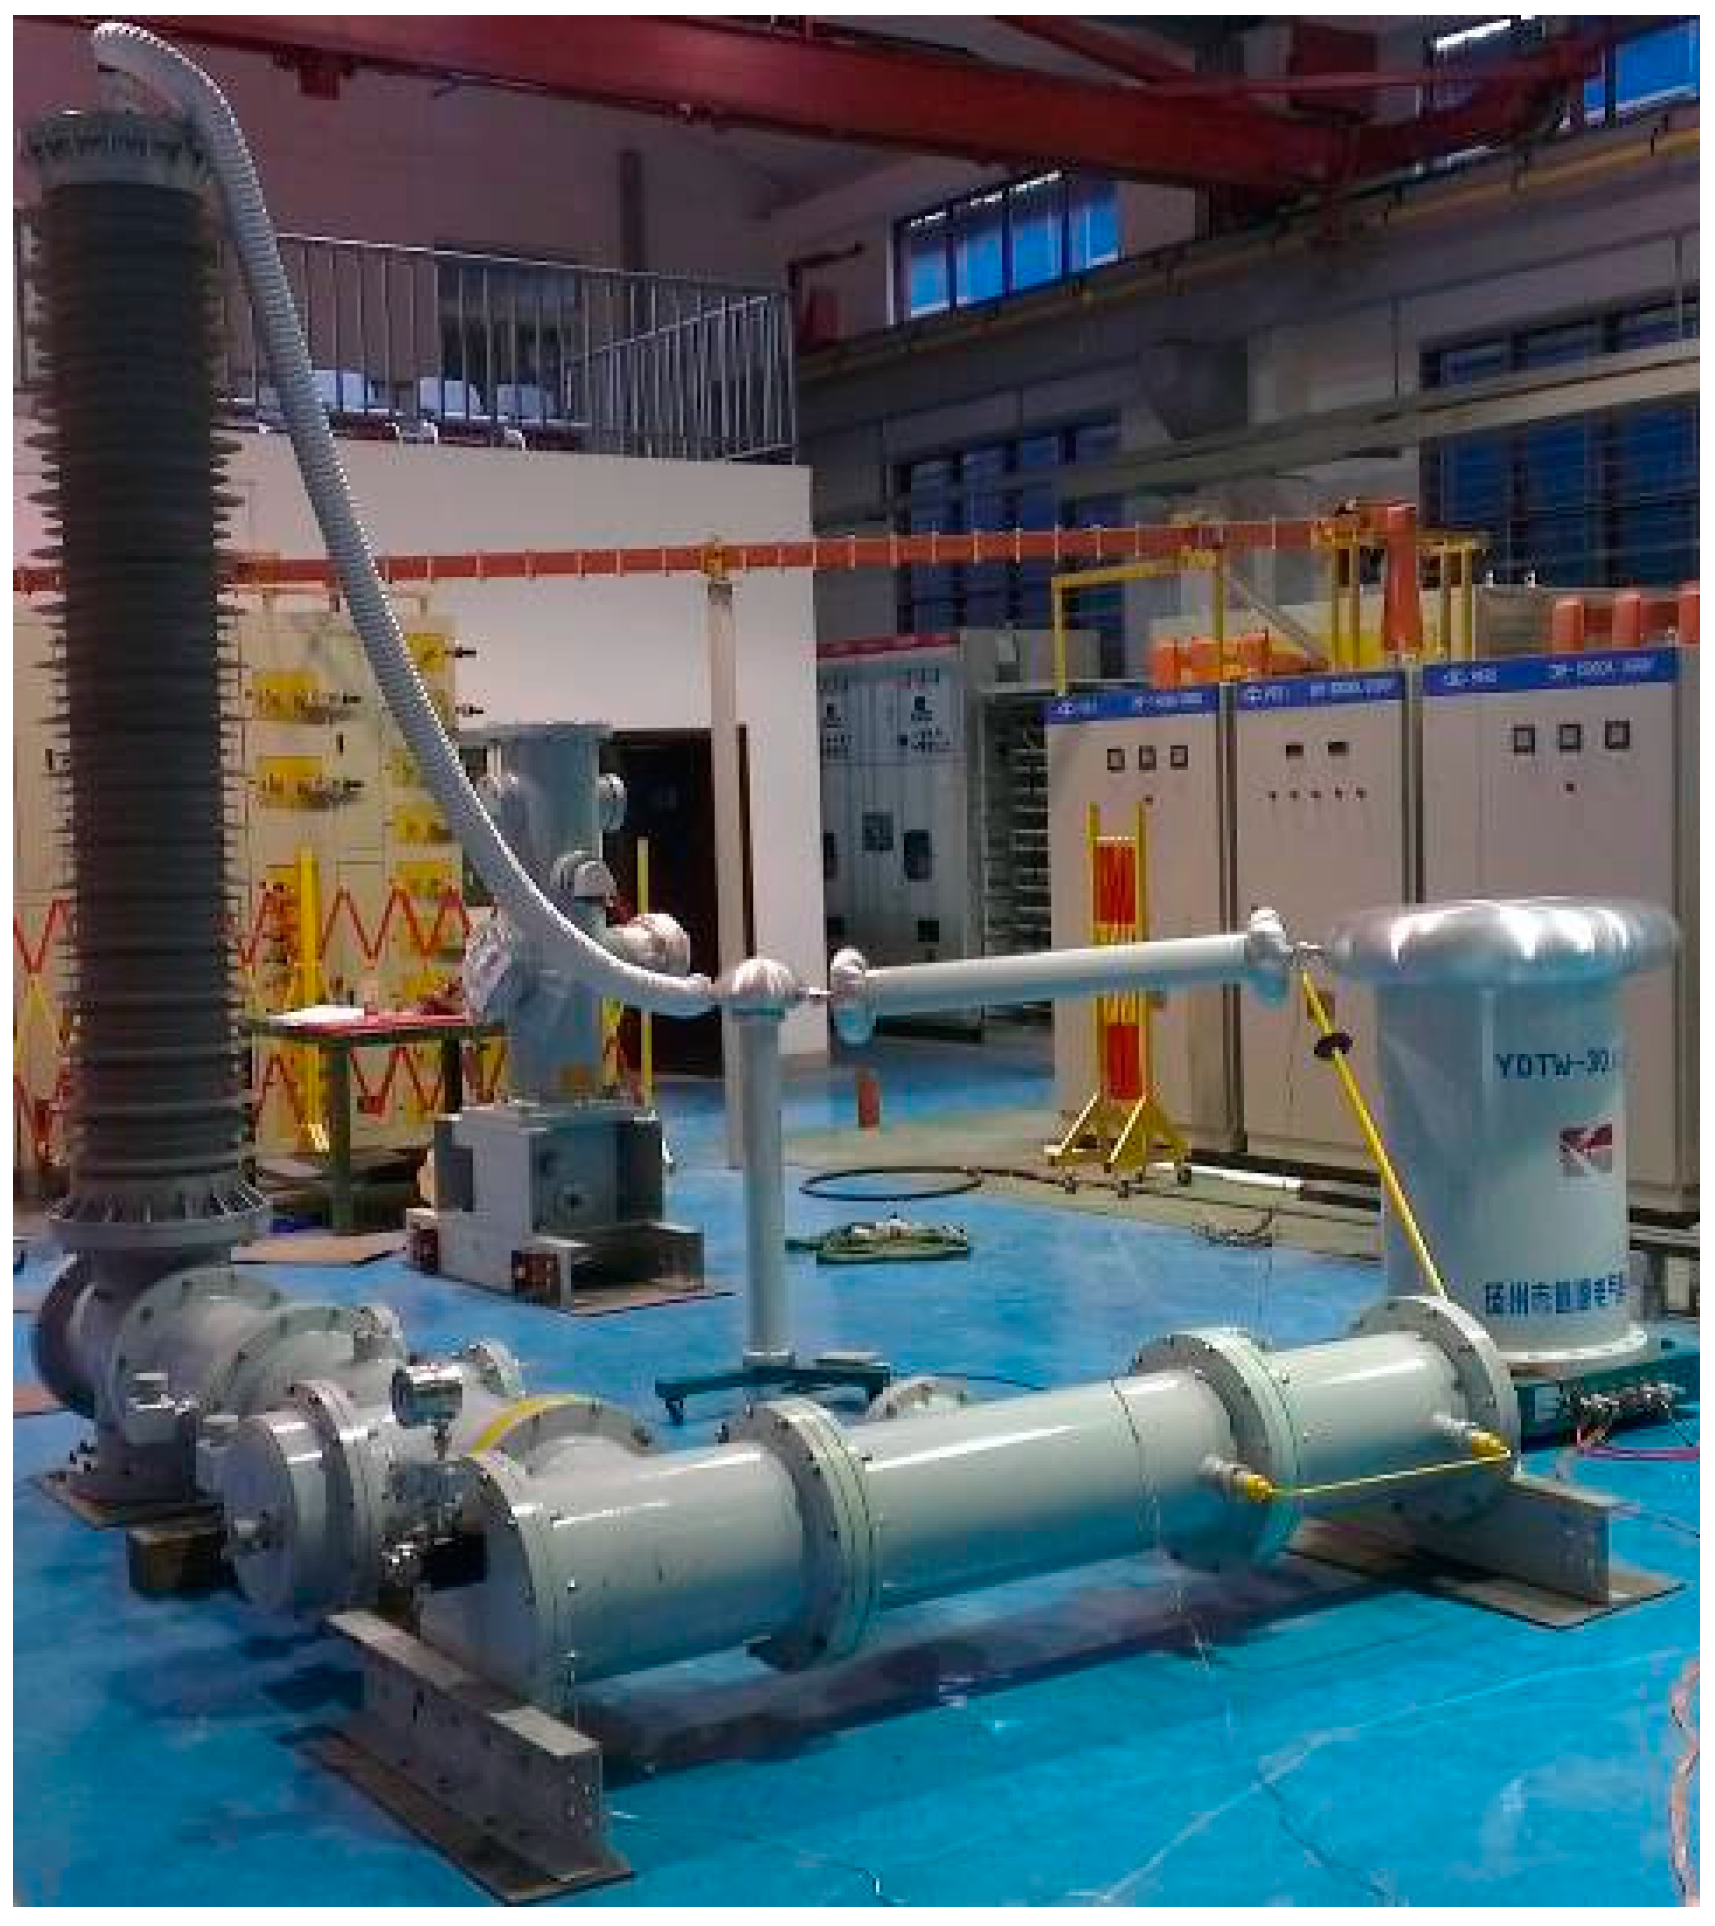
2. Experimental Platform and Setup

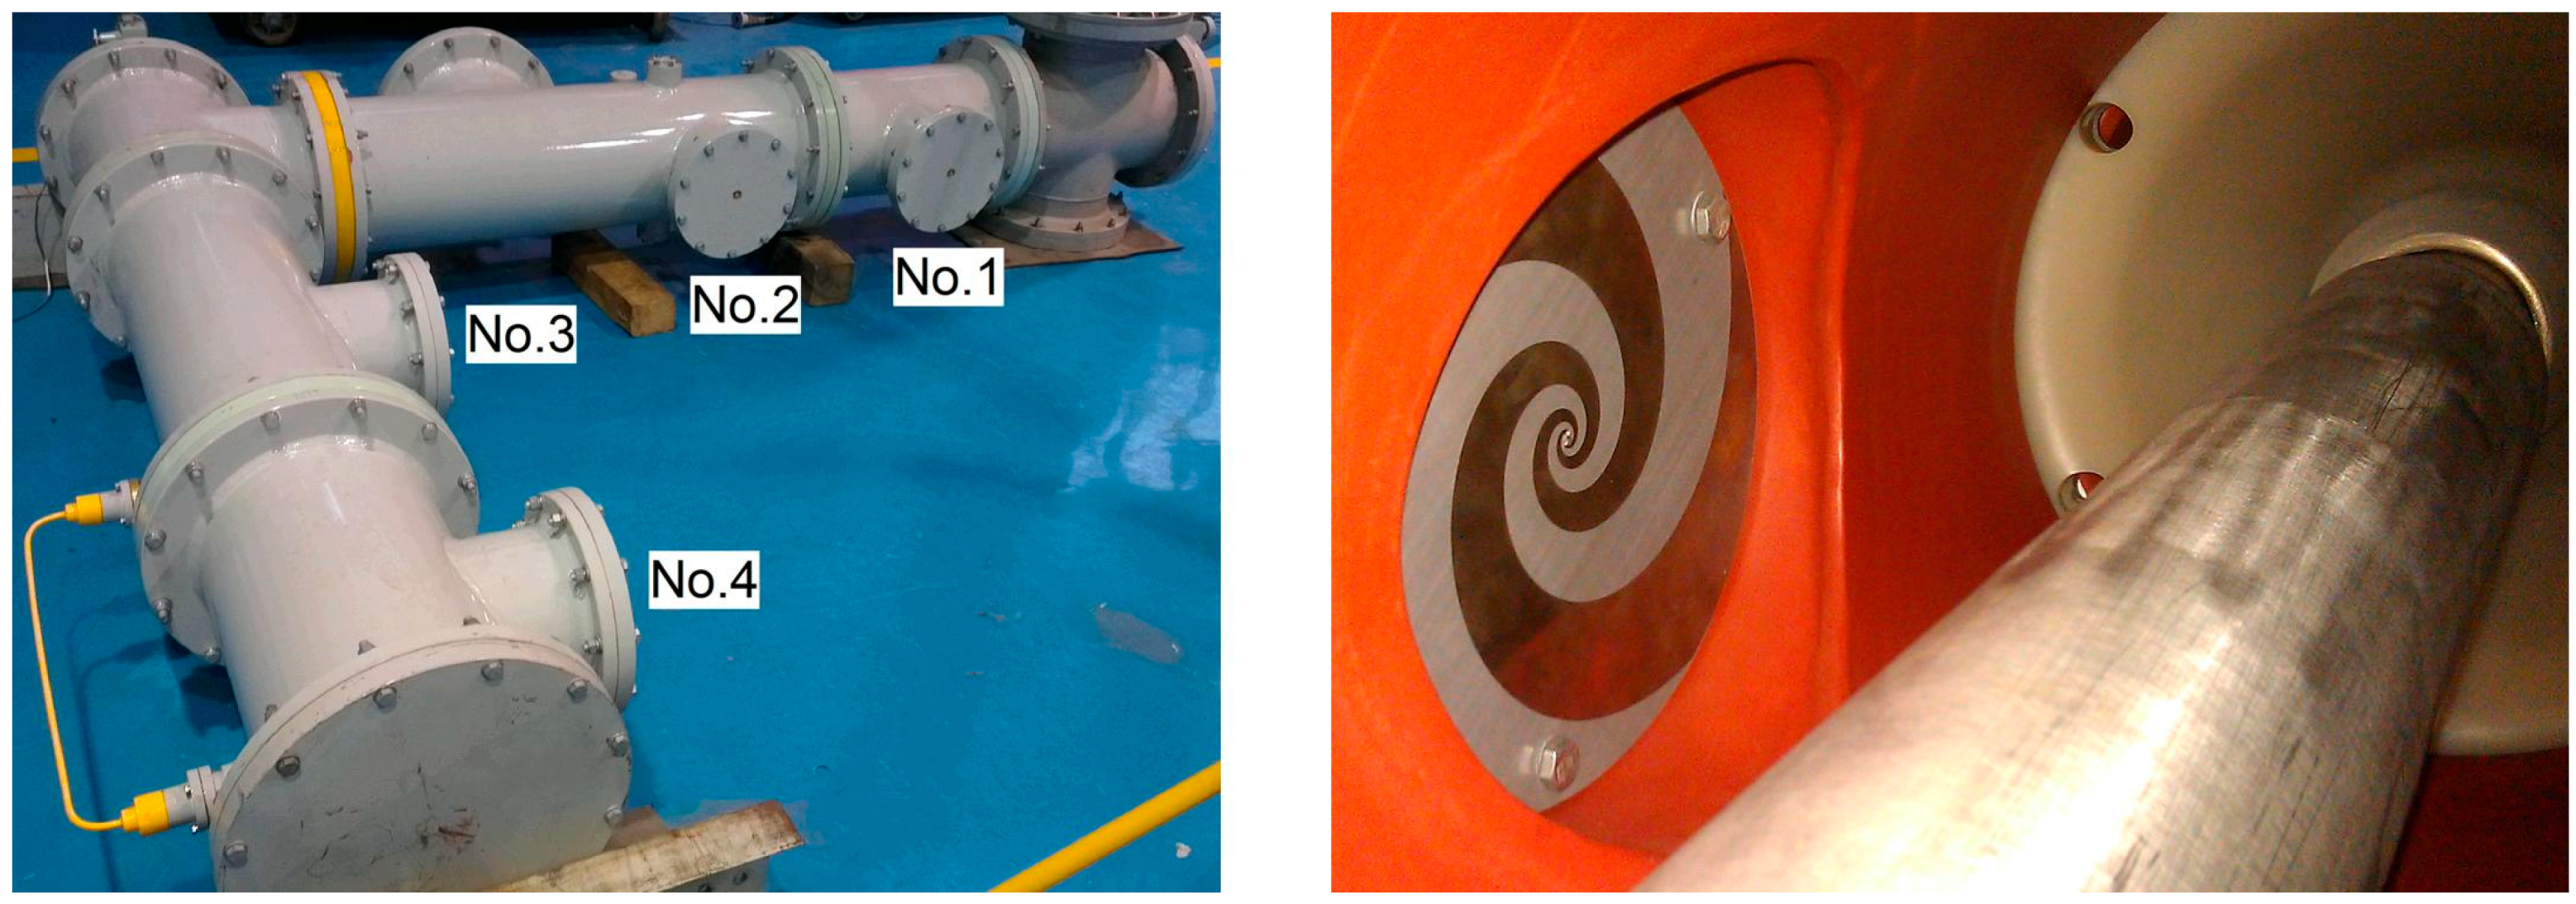
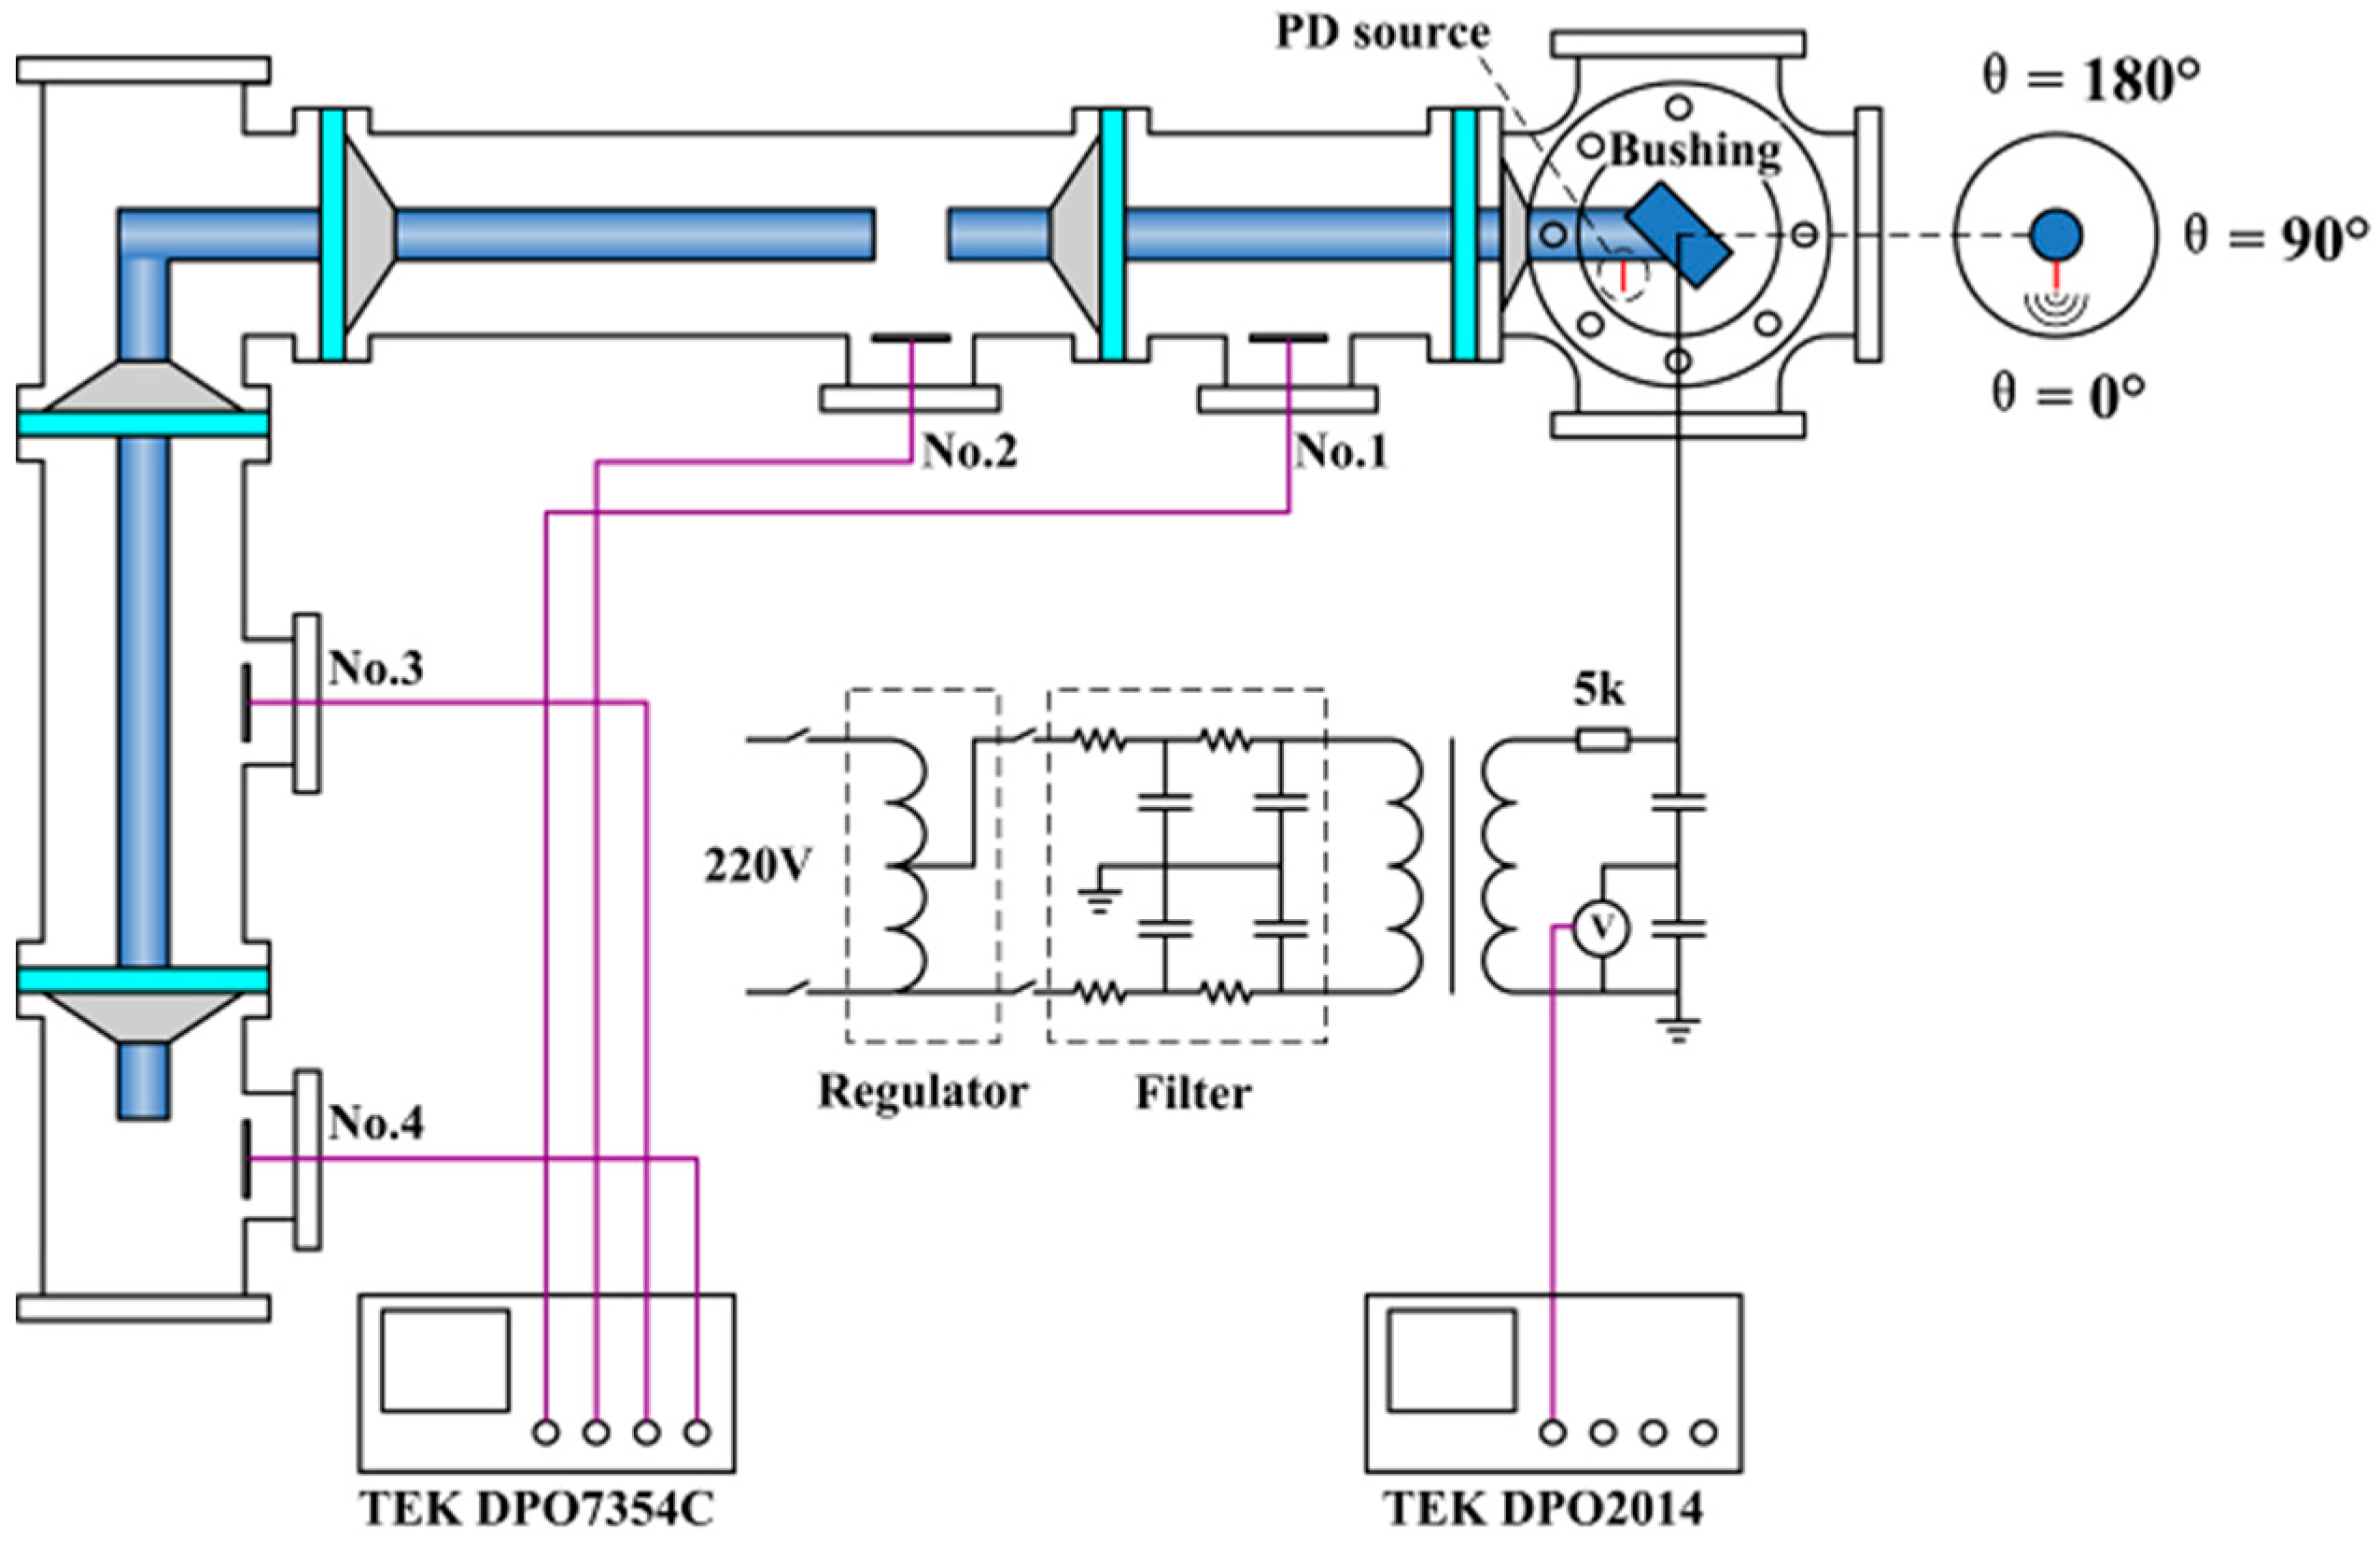
2.1. Experimental Platform

The experimental GIS tank is set according to a 252 kV GIS, as in Figure 1, which includes an insulating bushing, an L-shaped structure (LS), one disconnecting switch (DS) tank with a visible break gap and 5 disc spacers. The insulation defect is arranged in the four-way tank under the bushing in order to investigate the propagation of the PD-radiated UHF signal in the GIS tank. The power frequency voltage source generated by a non-PD testing transformer YDTW-30/150 (capacity: 30 kVA, maximum voltage: 150 kV) with a protection resistor and capacitive voltage divider is connected to the upper terminal of the bushing by an aluminum foil tube with copper wire inside.

2.2. Signal Sampling
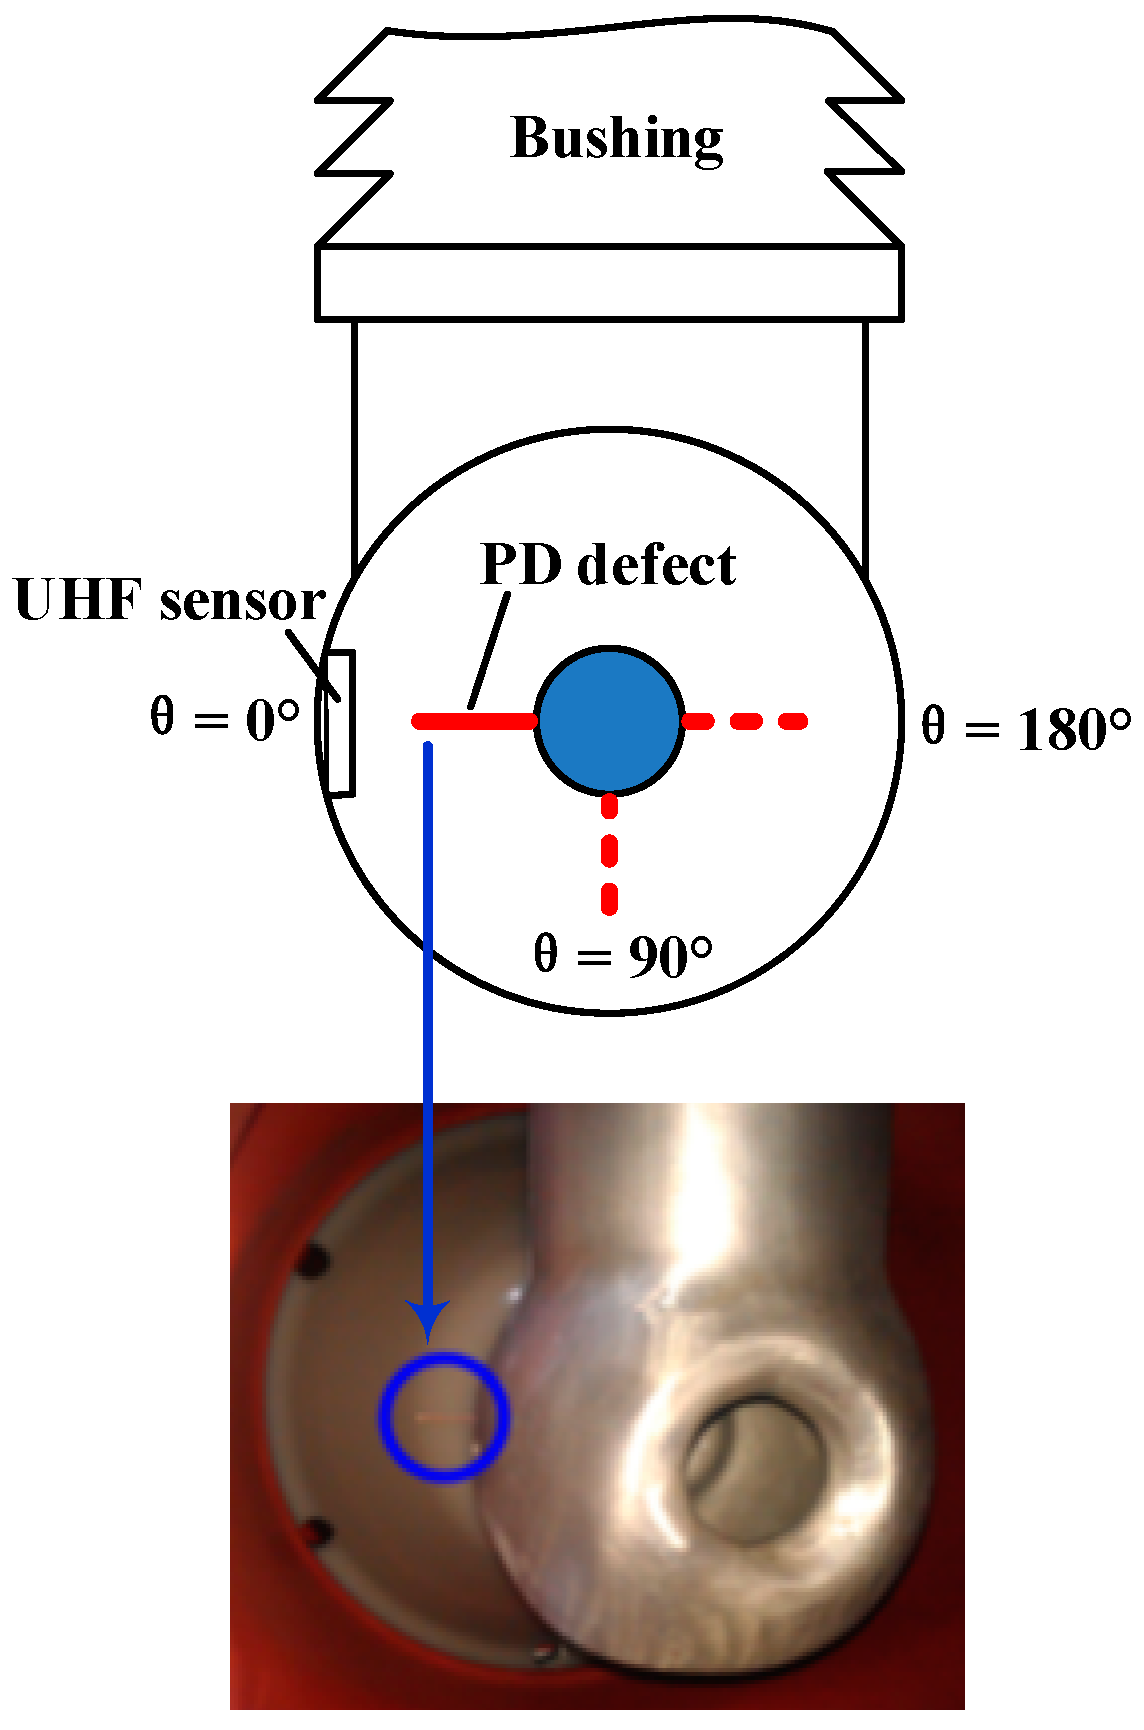
Four previously designed planar equiangular spiral antennas (PESA) [25] are placed on the inner side of the GIS tank as internal UHF sensors, which are labeled from No.1 to No.4, respectively, in Figure 2. Through a BNC seal connector on the cover and a double-shielded coaxial cable, the received UHF signal is recorded by the 4-channel digital oscilloscope (DPO7354C, 3.5 GHz, 40 GS/s, Tektronix, Beaverton, OR, USA). The applied voltage is also obtained from the capacitive voltage divider and observed by another digital oscilloscope (DPO2014, 100 MHz, 1 GS/s, Tektronix, Beaverton, OR, USA). Figure 3 illustrates the experimental setup.
For facilitating the differentiation, the part of L-shaped tank where the defect and the first two sensors are located refers to the anterior branch (AB), and the part containing the No.3 and No.4 sensors refers to L-shaped branch (LB).

2.3. PD Defect

In the tank connected to the bushing in Figure 4, a protrusion defect imitated by a piece of copper wire is placed on the central conductor. By changing the circumferential position of the defect as shown by the dotted line, the angle θ between the sensor and the defect in the cross section is 0°, 90°, and 180° respectively, and the received signals from each of the sensors are recorded each time.

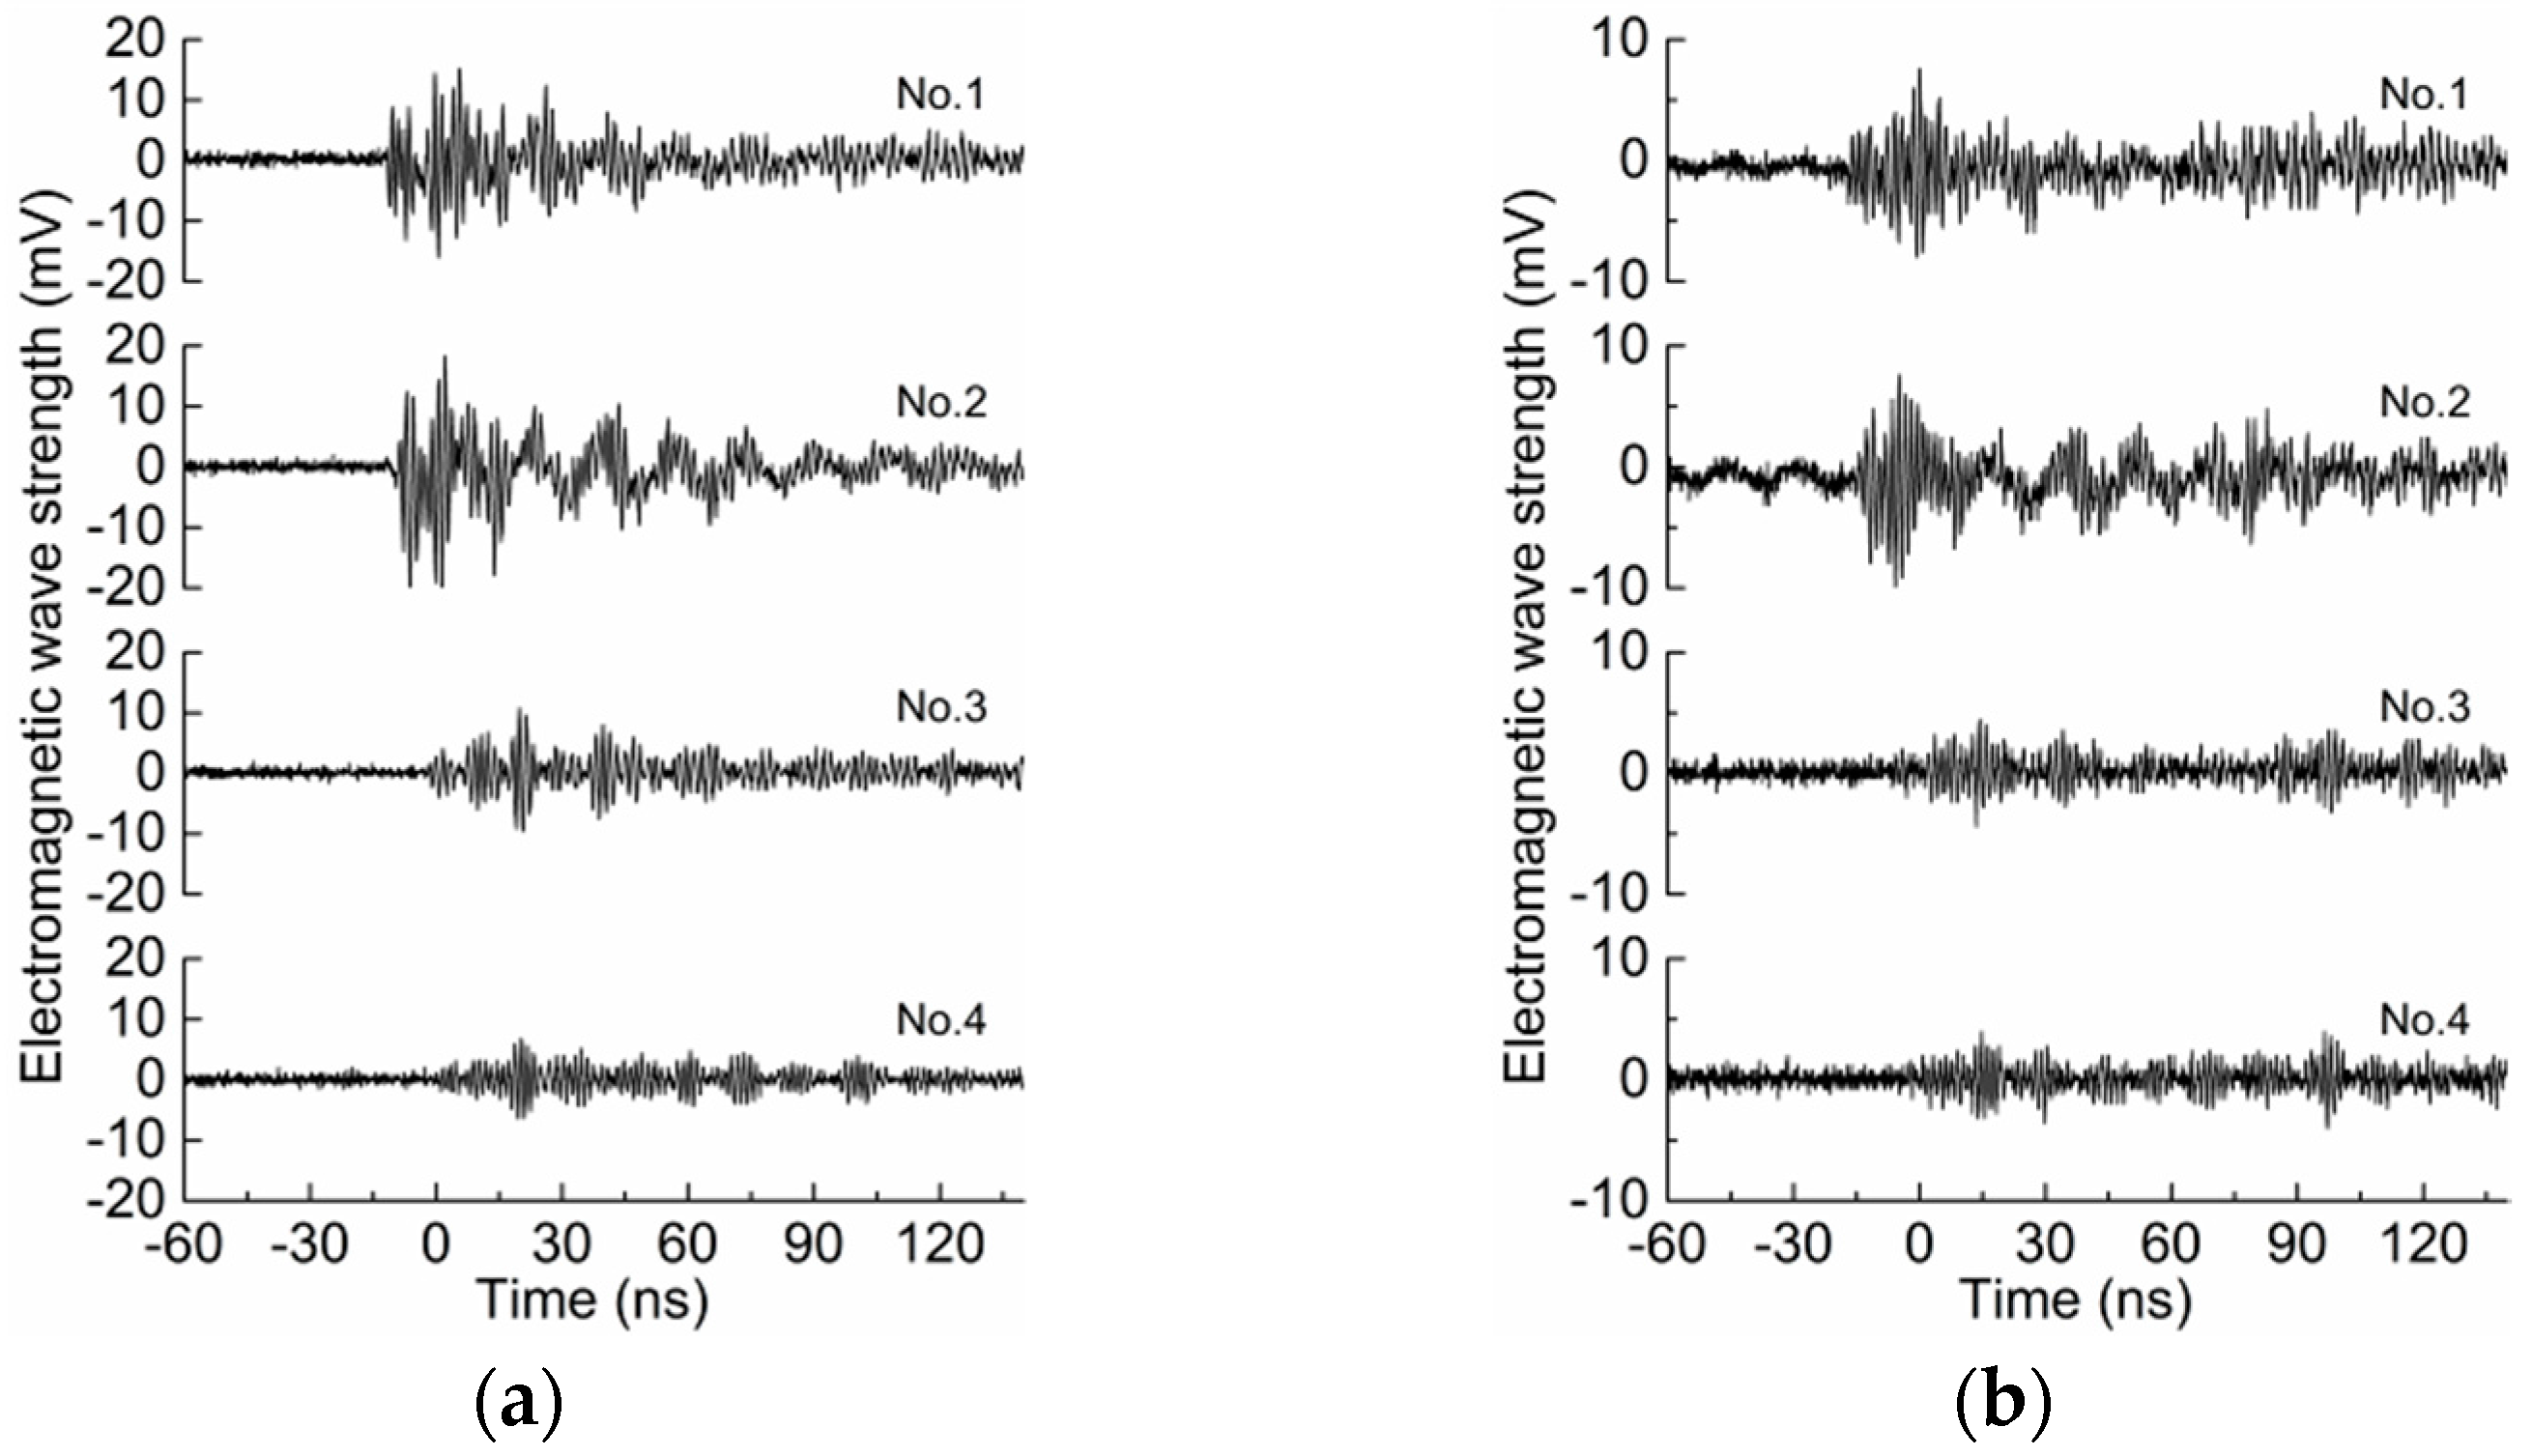
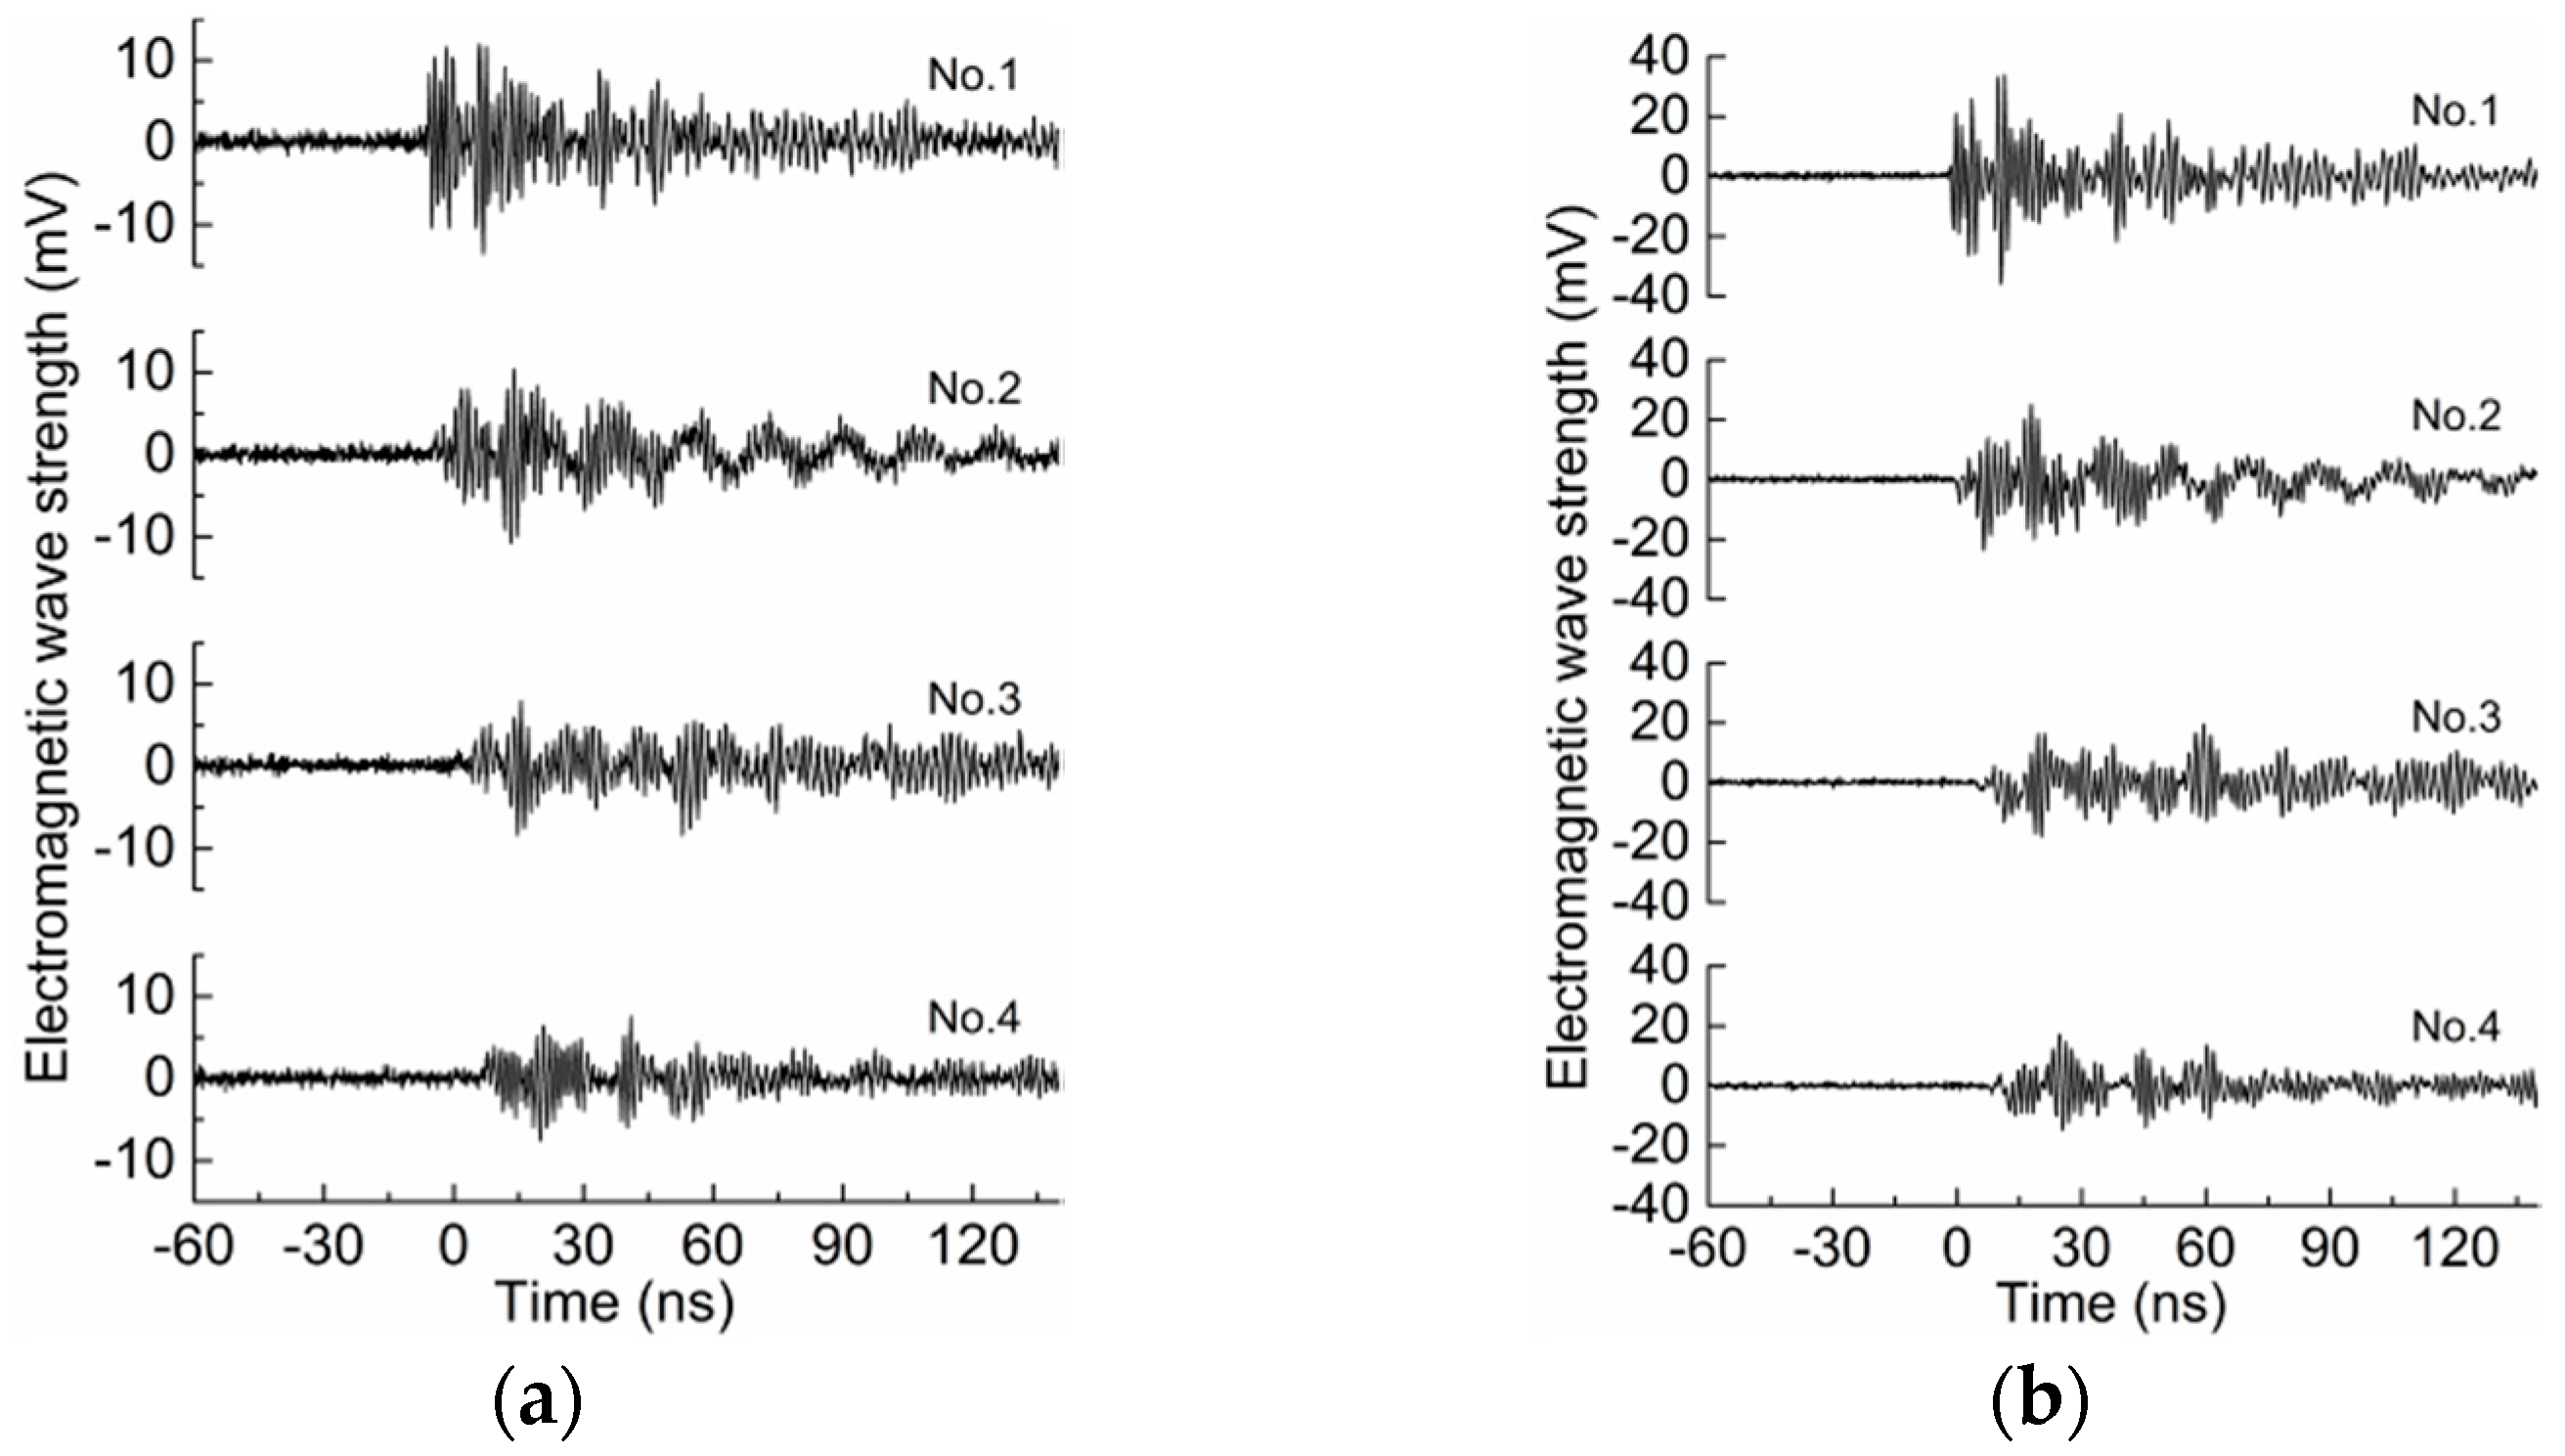
3. Experimental Results of the Defect at θ = 0°

When the DS is closed or open, the result is separately saved under two applied voltage levels in the test. When the DS is closed and the voltage is set as 6.5 kV and 9.6 kV, the time domain results of the four sensors are as shown in Figure 5. Firstly, it can be seen that the signal arrival time for the four sensors differs clearly. That is, the UHF signal arrives at the position of each sensor, from No.1 to No.4, based on the respective sensor’s distance from the PD source. Comparing the signals in LB with those in SB, there are obvious distinctions between signal characteristics. As a result of passing LS, the signal amplitudes of sensors No.3 and No.4 are reduced substantially, and the front rising edges of the signal become unclear compared with those of the sensors No.1 and No.2. On the other hand, the experimental result also reveals that the UHF sensor can receive PD-radiated signals effectively and reflect the signal feature accurately for practical PD detection. The sensor works properly in the GIS, and could be applied in on-line monitoring of PD in GISs in the future.
Then, by opening the DS and applying the same two voltages as before, the signal in the time domain is as shown in Figure 6. Similar to the above, the start time of the four sensors’ signals is consecutively delayed, and the amplitude is significantly reduced after passing the LS. However, there is no apparent difference compared with Figure 5. Next, further analysis is conducted from the perspective of the statistical features and frequency spectrum of the signal.

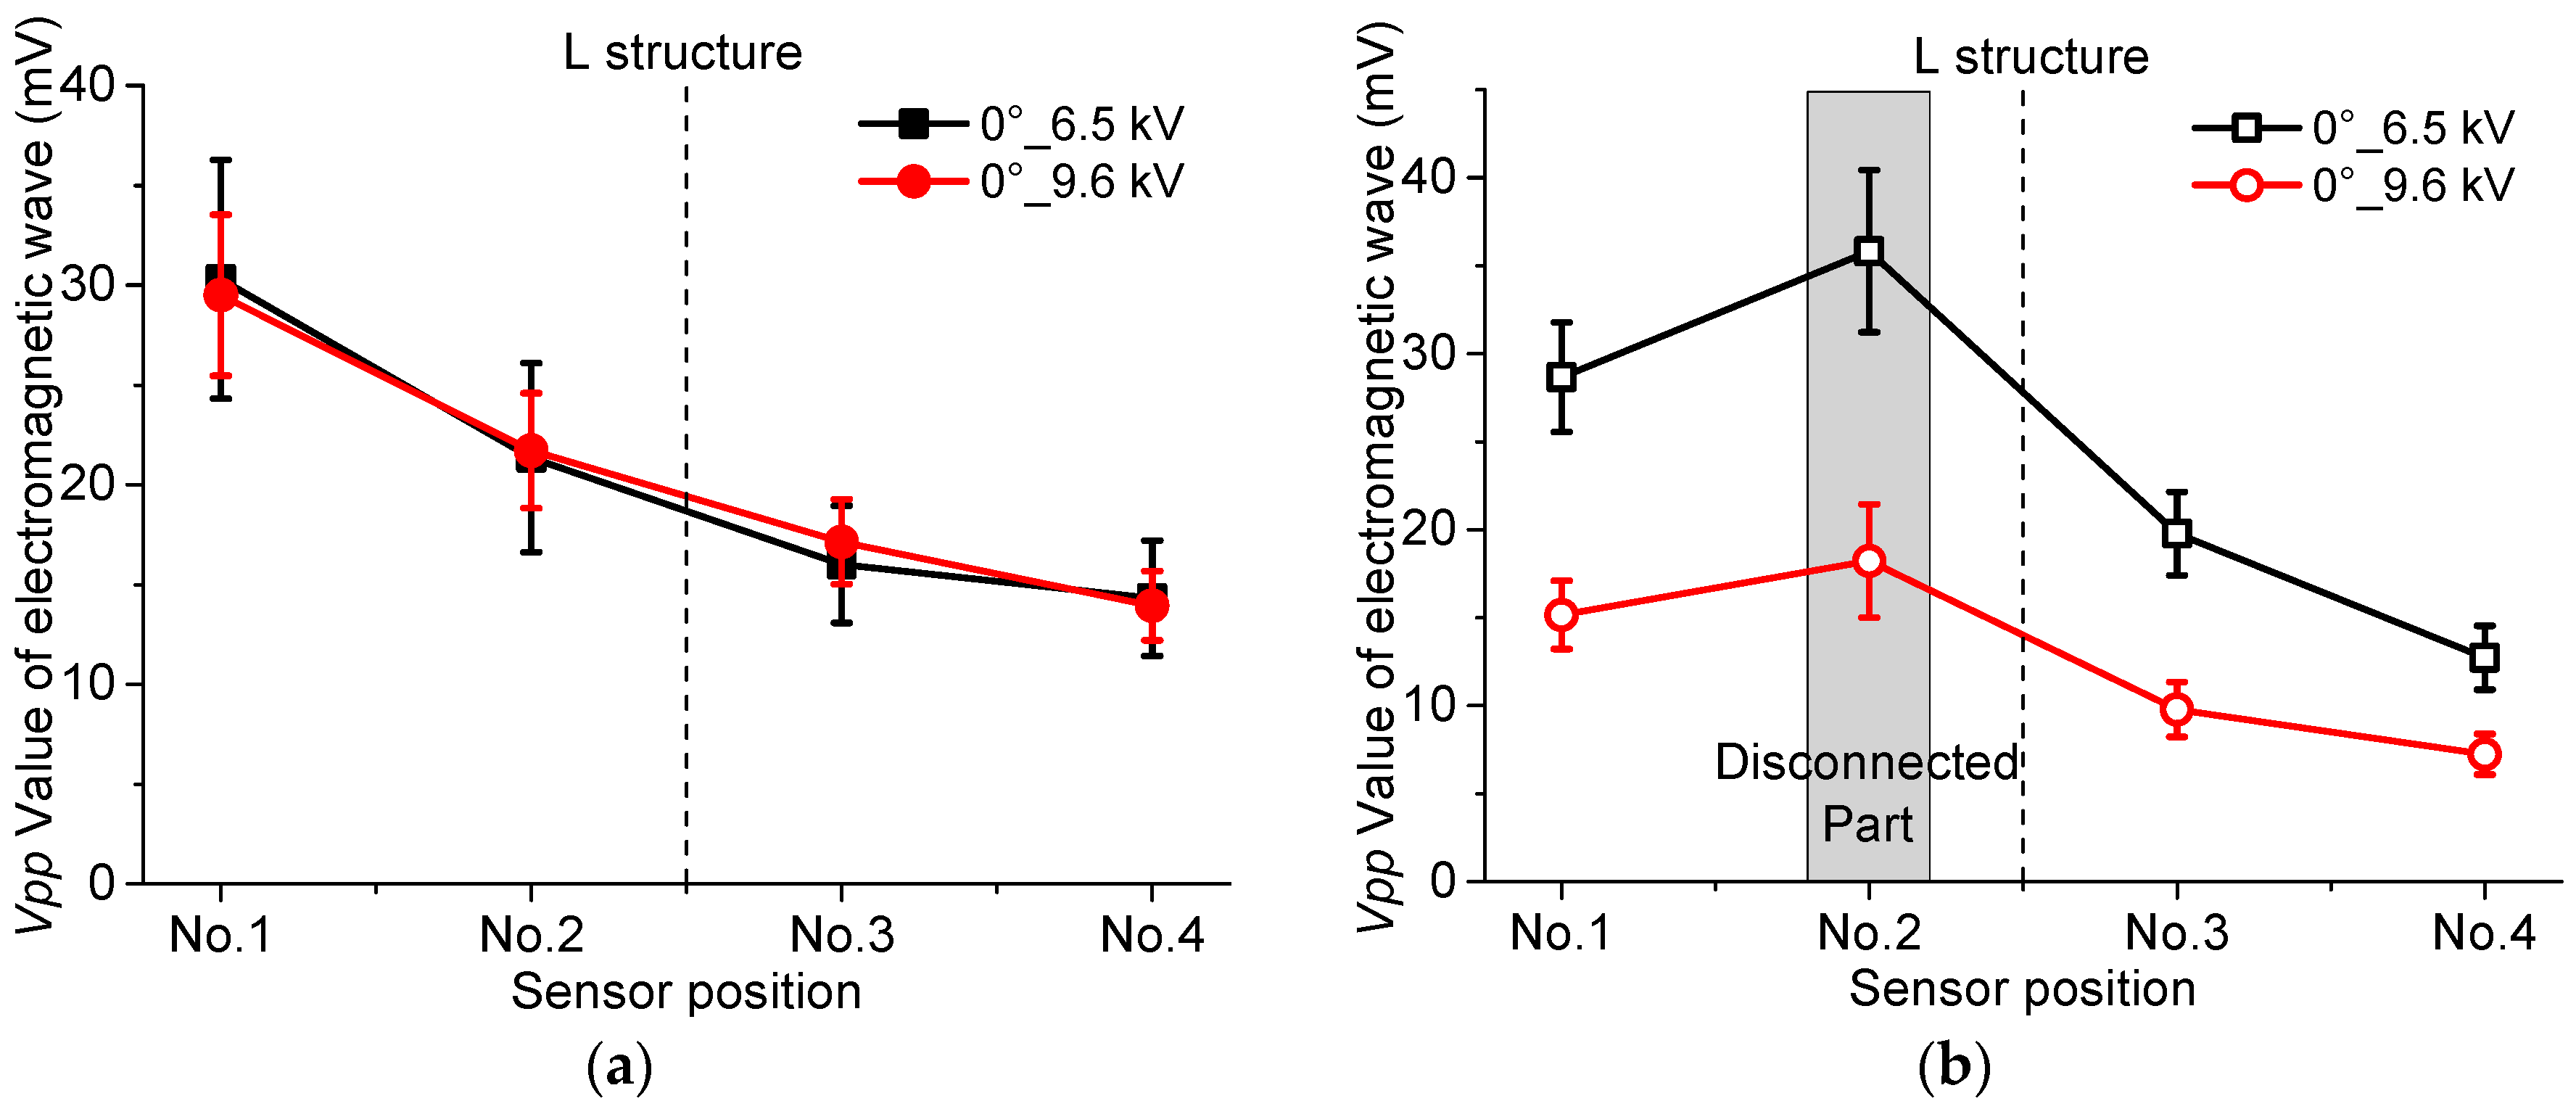
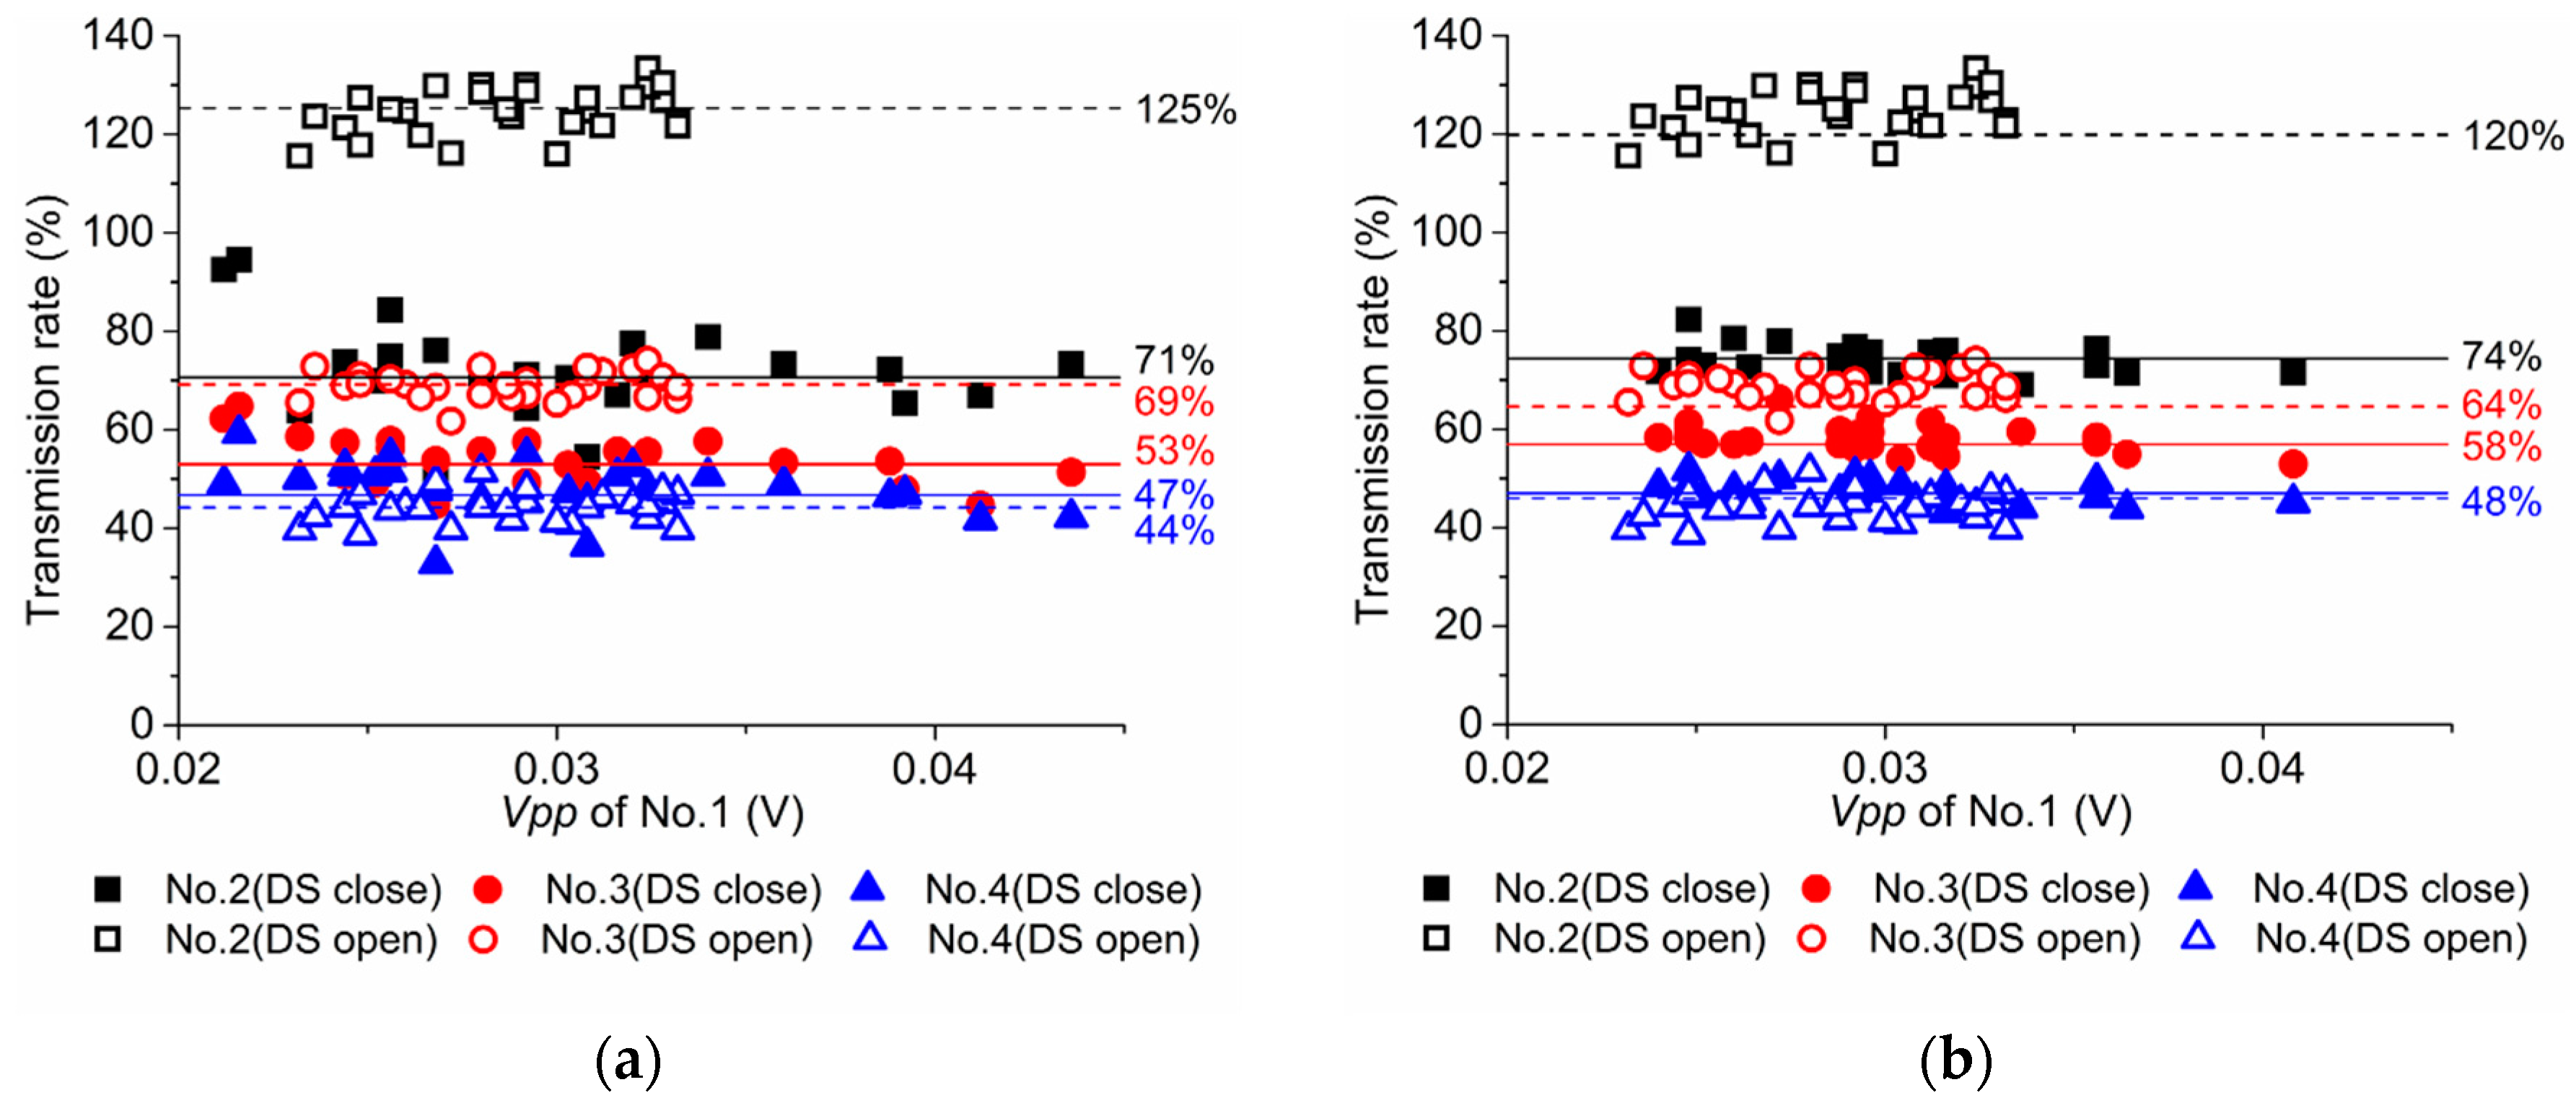
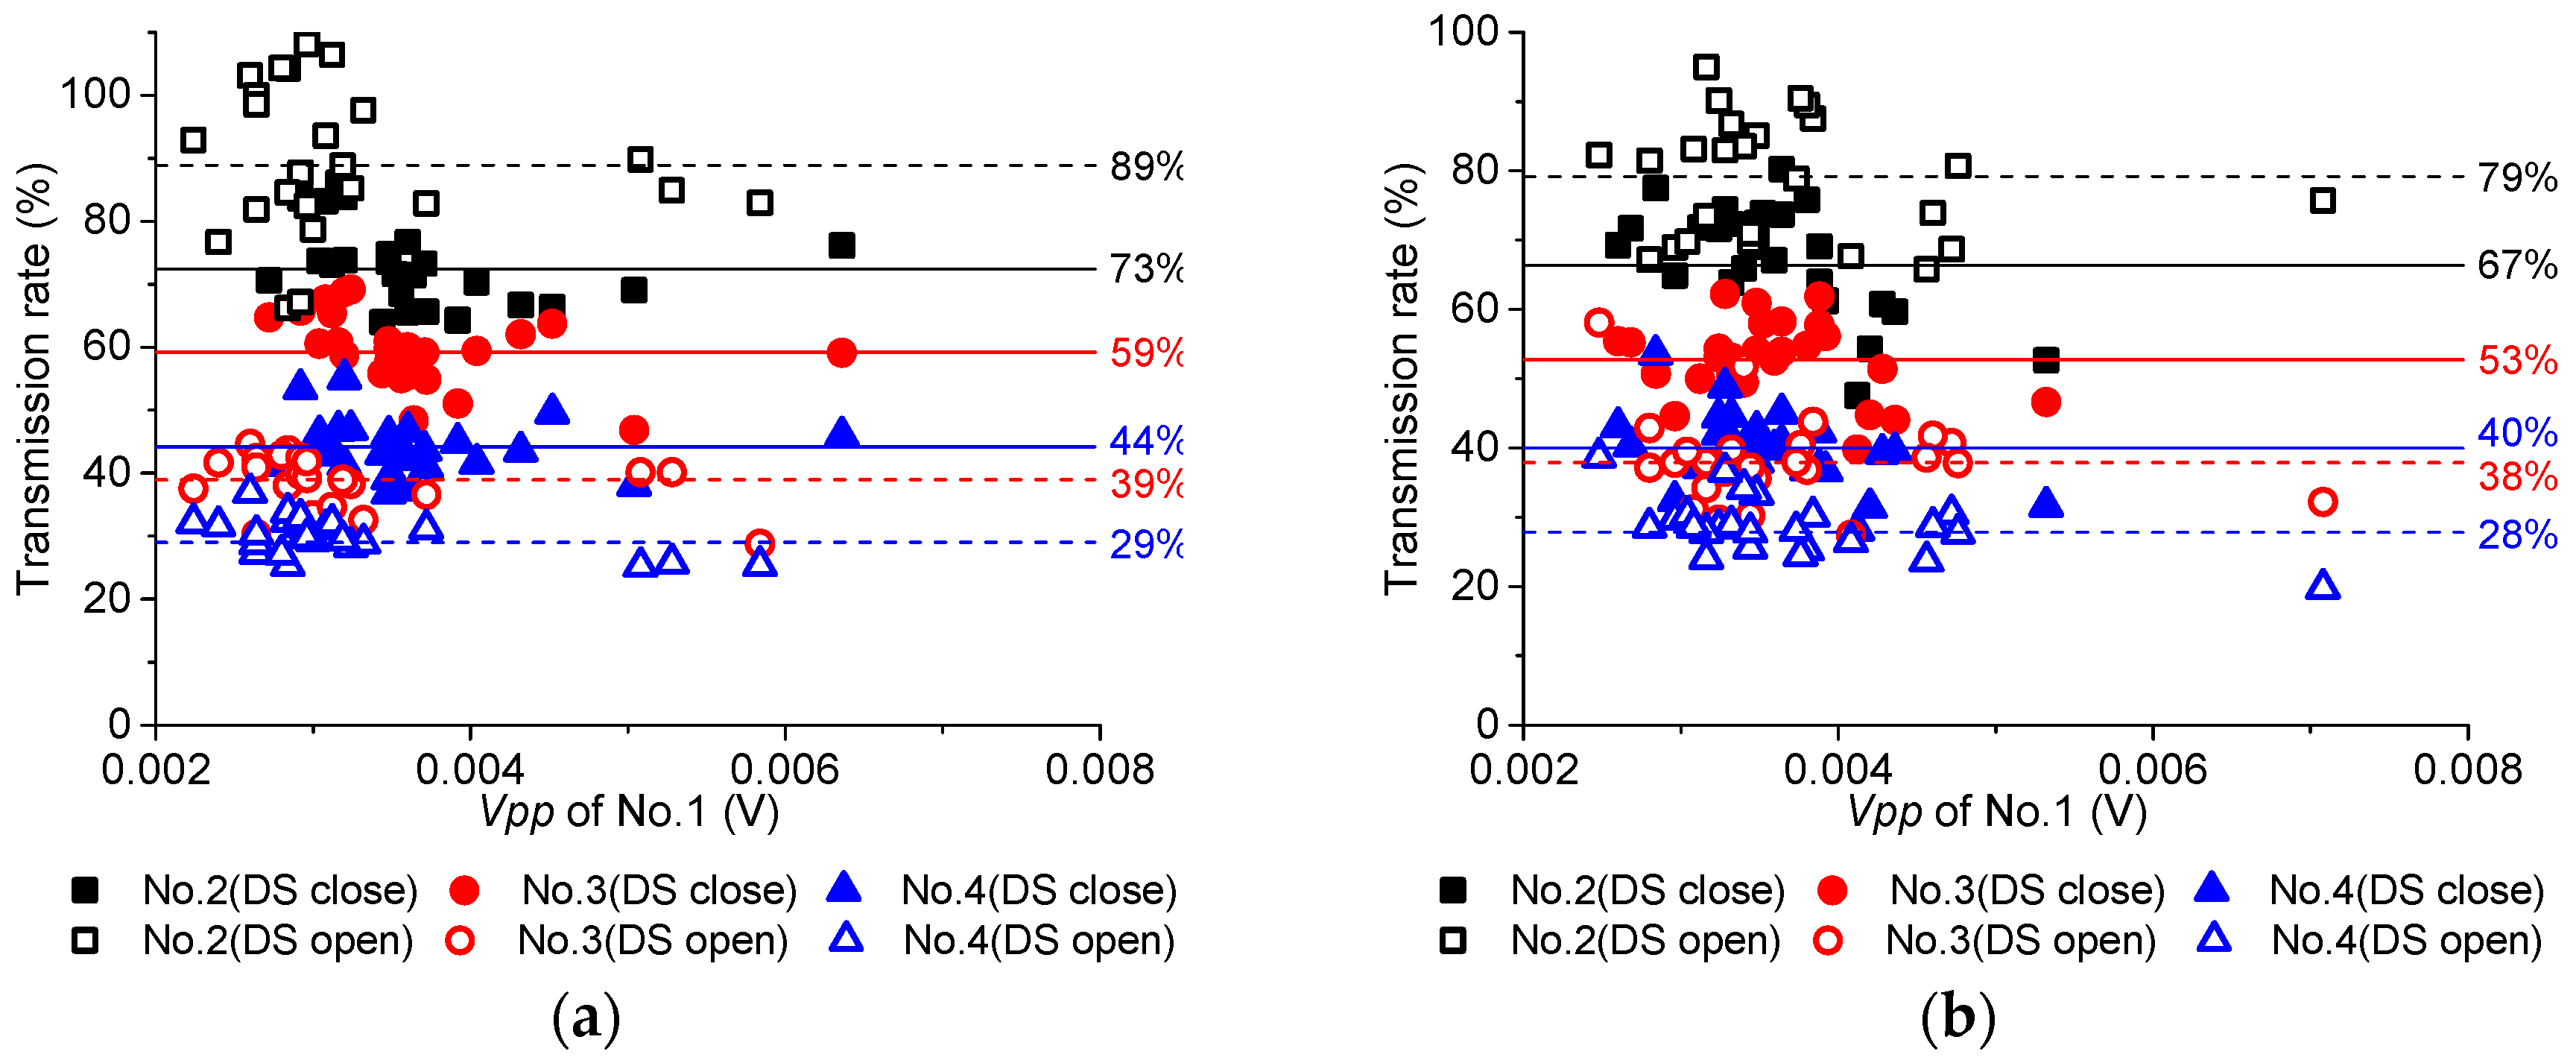
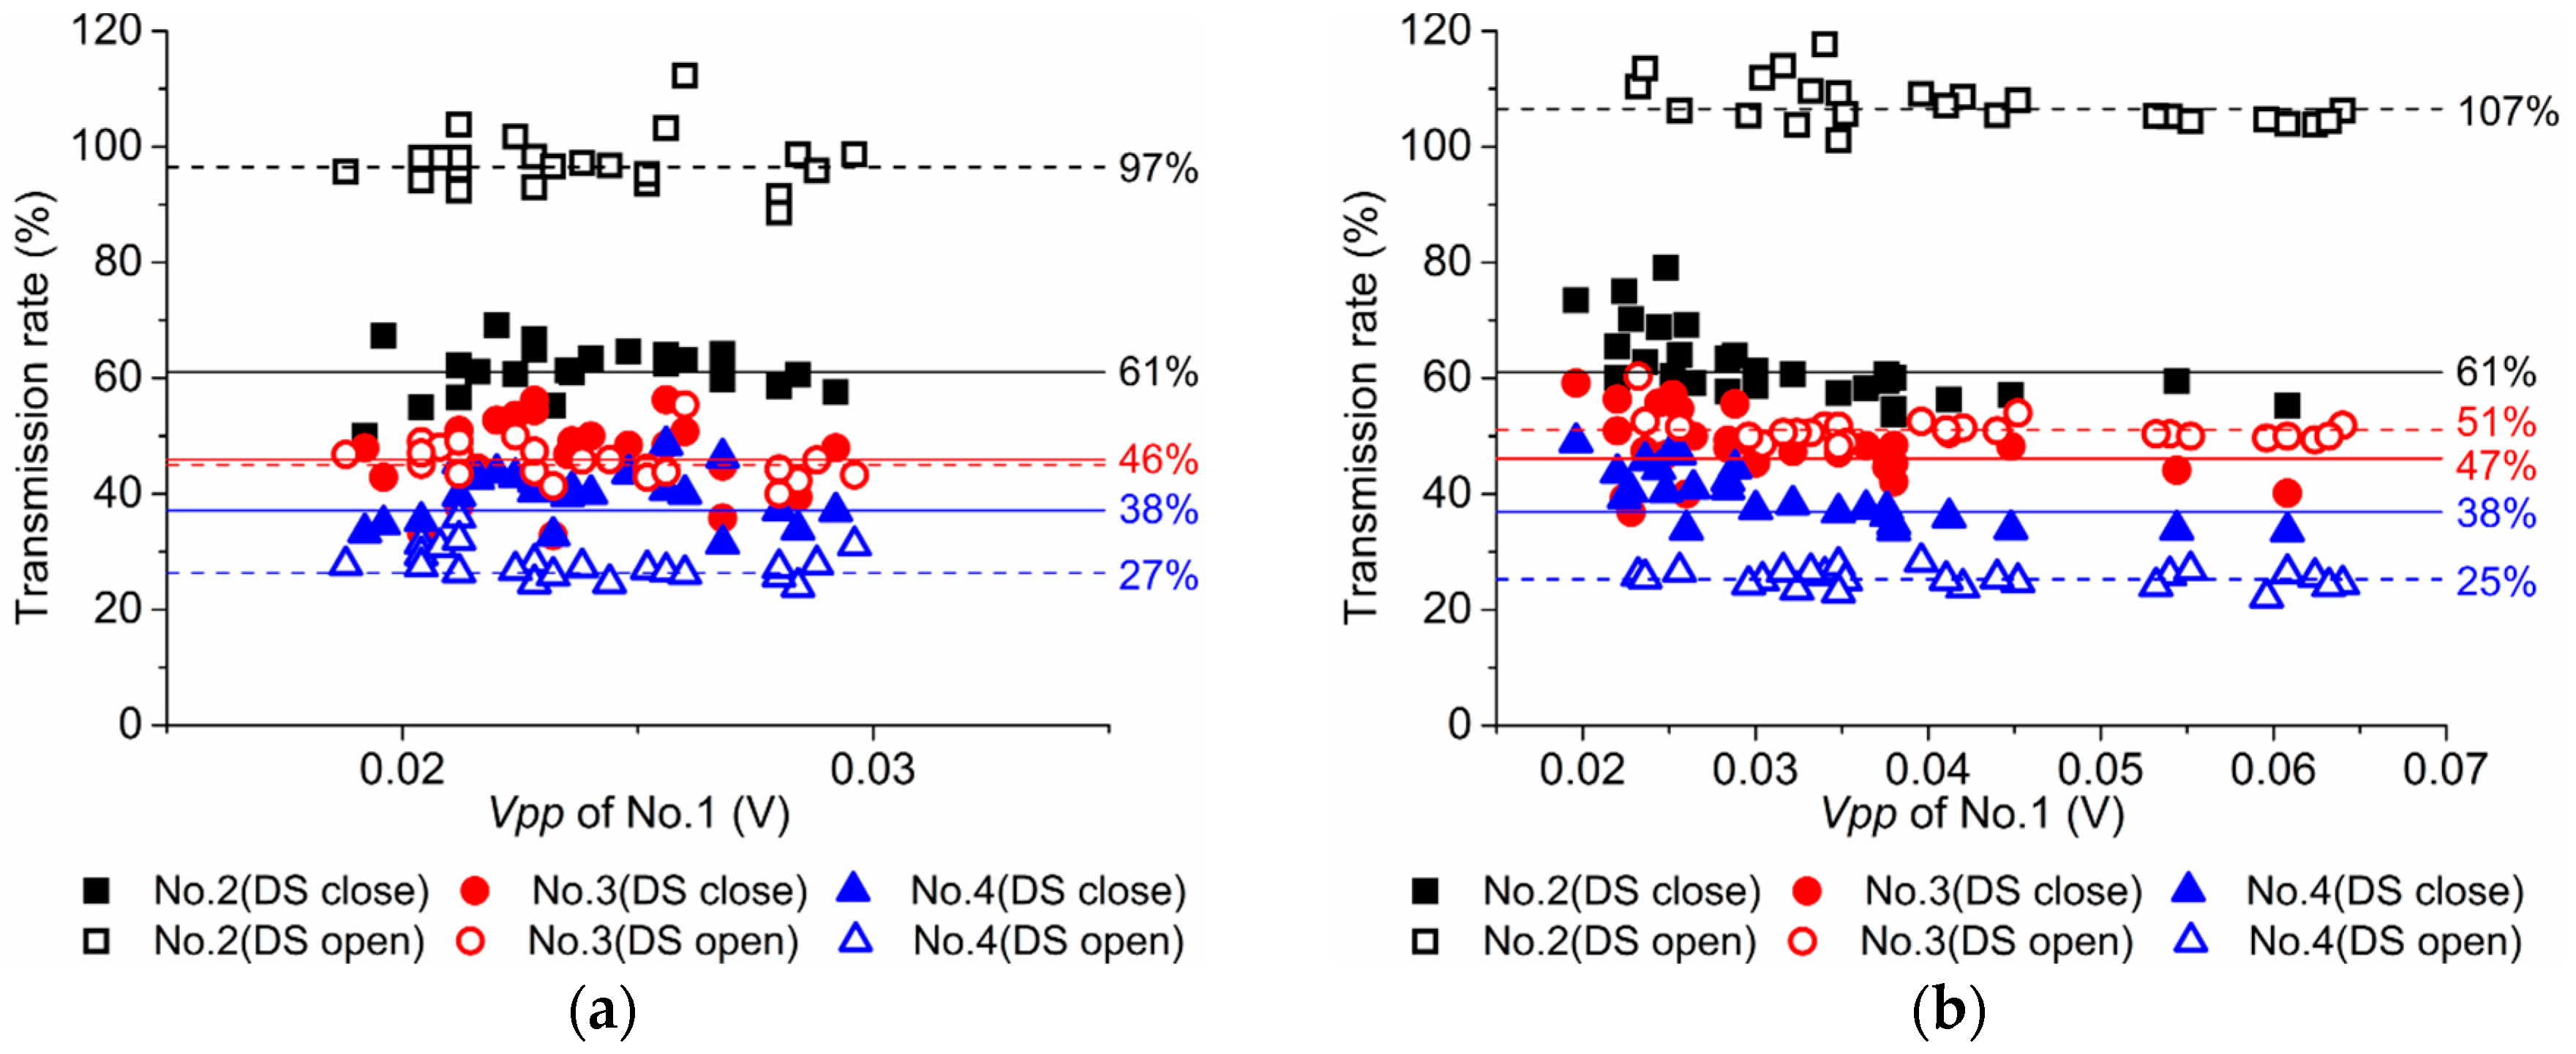
3.1. Statistical Analysis

In each case, 30 consecutive measurements were performed, and the results saved for analysis of the statistical features and rules of the signals. Figure 7 shows the peak to peak value (Vpp) attenuation characteristics from the 30 results of signals under two kinds of applied voltage. When the DS is closed, as in Figure 7a, the Vpp continues to decline and the measured deviation decreases with the increase of the distance from the PD source. This is because of the dispersion occurring in different modes of the EM wave as the propagation distance increases. And the reflection effect of LS to the signal is another reason. The two attenuation curves are relatively smooth, without any mutation between sensor No.2 and No.3, which demonstrates that LS has no evident influence on the overall attenuation trend of Vpp. Additionally, the two curves nearly overlap with each other, which means that the discharge intensity under the two kinds of voltage does not differ much.
When the DS is open, as in Figure 7b, the attenuation of Vpp was found to be greatly distinct from that when the DS is closed. At the position of sensor No.2, which contains a gap of DS, the attenuation curve shows a peak instead of a monotonic decrease. Furthermore, the measured deviation is the largest here, while those in the other three positions still maintain a decreasing order. Since the tank structure at the gap changes from a coaxial waveguide to a circular waveguide, it is more accessible for high-order mode that above TE11 (transverse electric mode 11) to pass the tank with DS. However, because of the discontinuity of wave impedance, the low-frequency transverse electromagnetic (TEM) modes are hard to access DS. Reference [10] states that the transmission rate of low-frequency components remains at around 20%. The peak at sensor No.2 is generated from the superimposition of the traveling wave, the TEM mode reflected by the gap and the reflected high-order mode by LS, which also makes this the largest measured deviation.
The transmission rate, which refers to the Vpp ratio of signals received by the last three sensors to that of sensor No.1, was statistically analyzed. Basically, the transmission rates were higher when the DS was open, as shown in Figure 8a,b. The difference between the two states of DS was the largest at No.2, at about 50%, while it was smaller for No.3, at approximately 11%. There was little difference for No.4. This indicates that LS and the discontinuity of conductor near the PD source have great impact over the transmission rate of PD signal. However, in positions that relatively distant from the special structures next to the PD source, their influence is obliterated by the signal attenuation and distortion, and becomes not so obvious.
Figure 8 also shows that, in the closed state of Figure 8a, there is a great dispersion between the 30 measurement results which are more centralized as a result of the discontinuous conductor when DS is open as in Figure 8b. In addition, the average transmission rates when the DS was open, as shown in Figure 8a, approach those shown in Figure 8b. It infers that, although there is a great distinction between the two curves in Figure 7b, the signal attenuation rule is not affected by the voltage, which provides certain instruction for the application of propagation characteristics.
This shows that the LS and the gap of the HV conductor have a great impact on the transmission rate of the PD signal. Therefore, the simpler the structure is between the UHF sensor and the PD defect, the higher the transmission rate will be. In the actual diagnosis, choosing a simplified GIS structure to detect PD can truly help demonstrate the discharge characteristics of the defect and evaluate the discharge severity better.

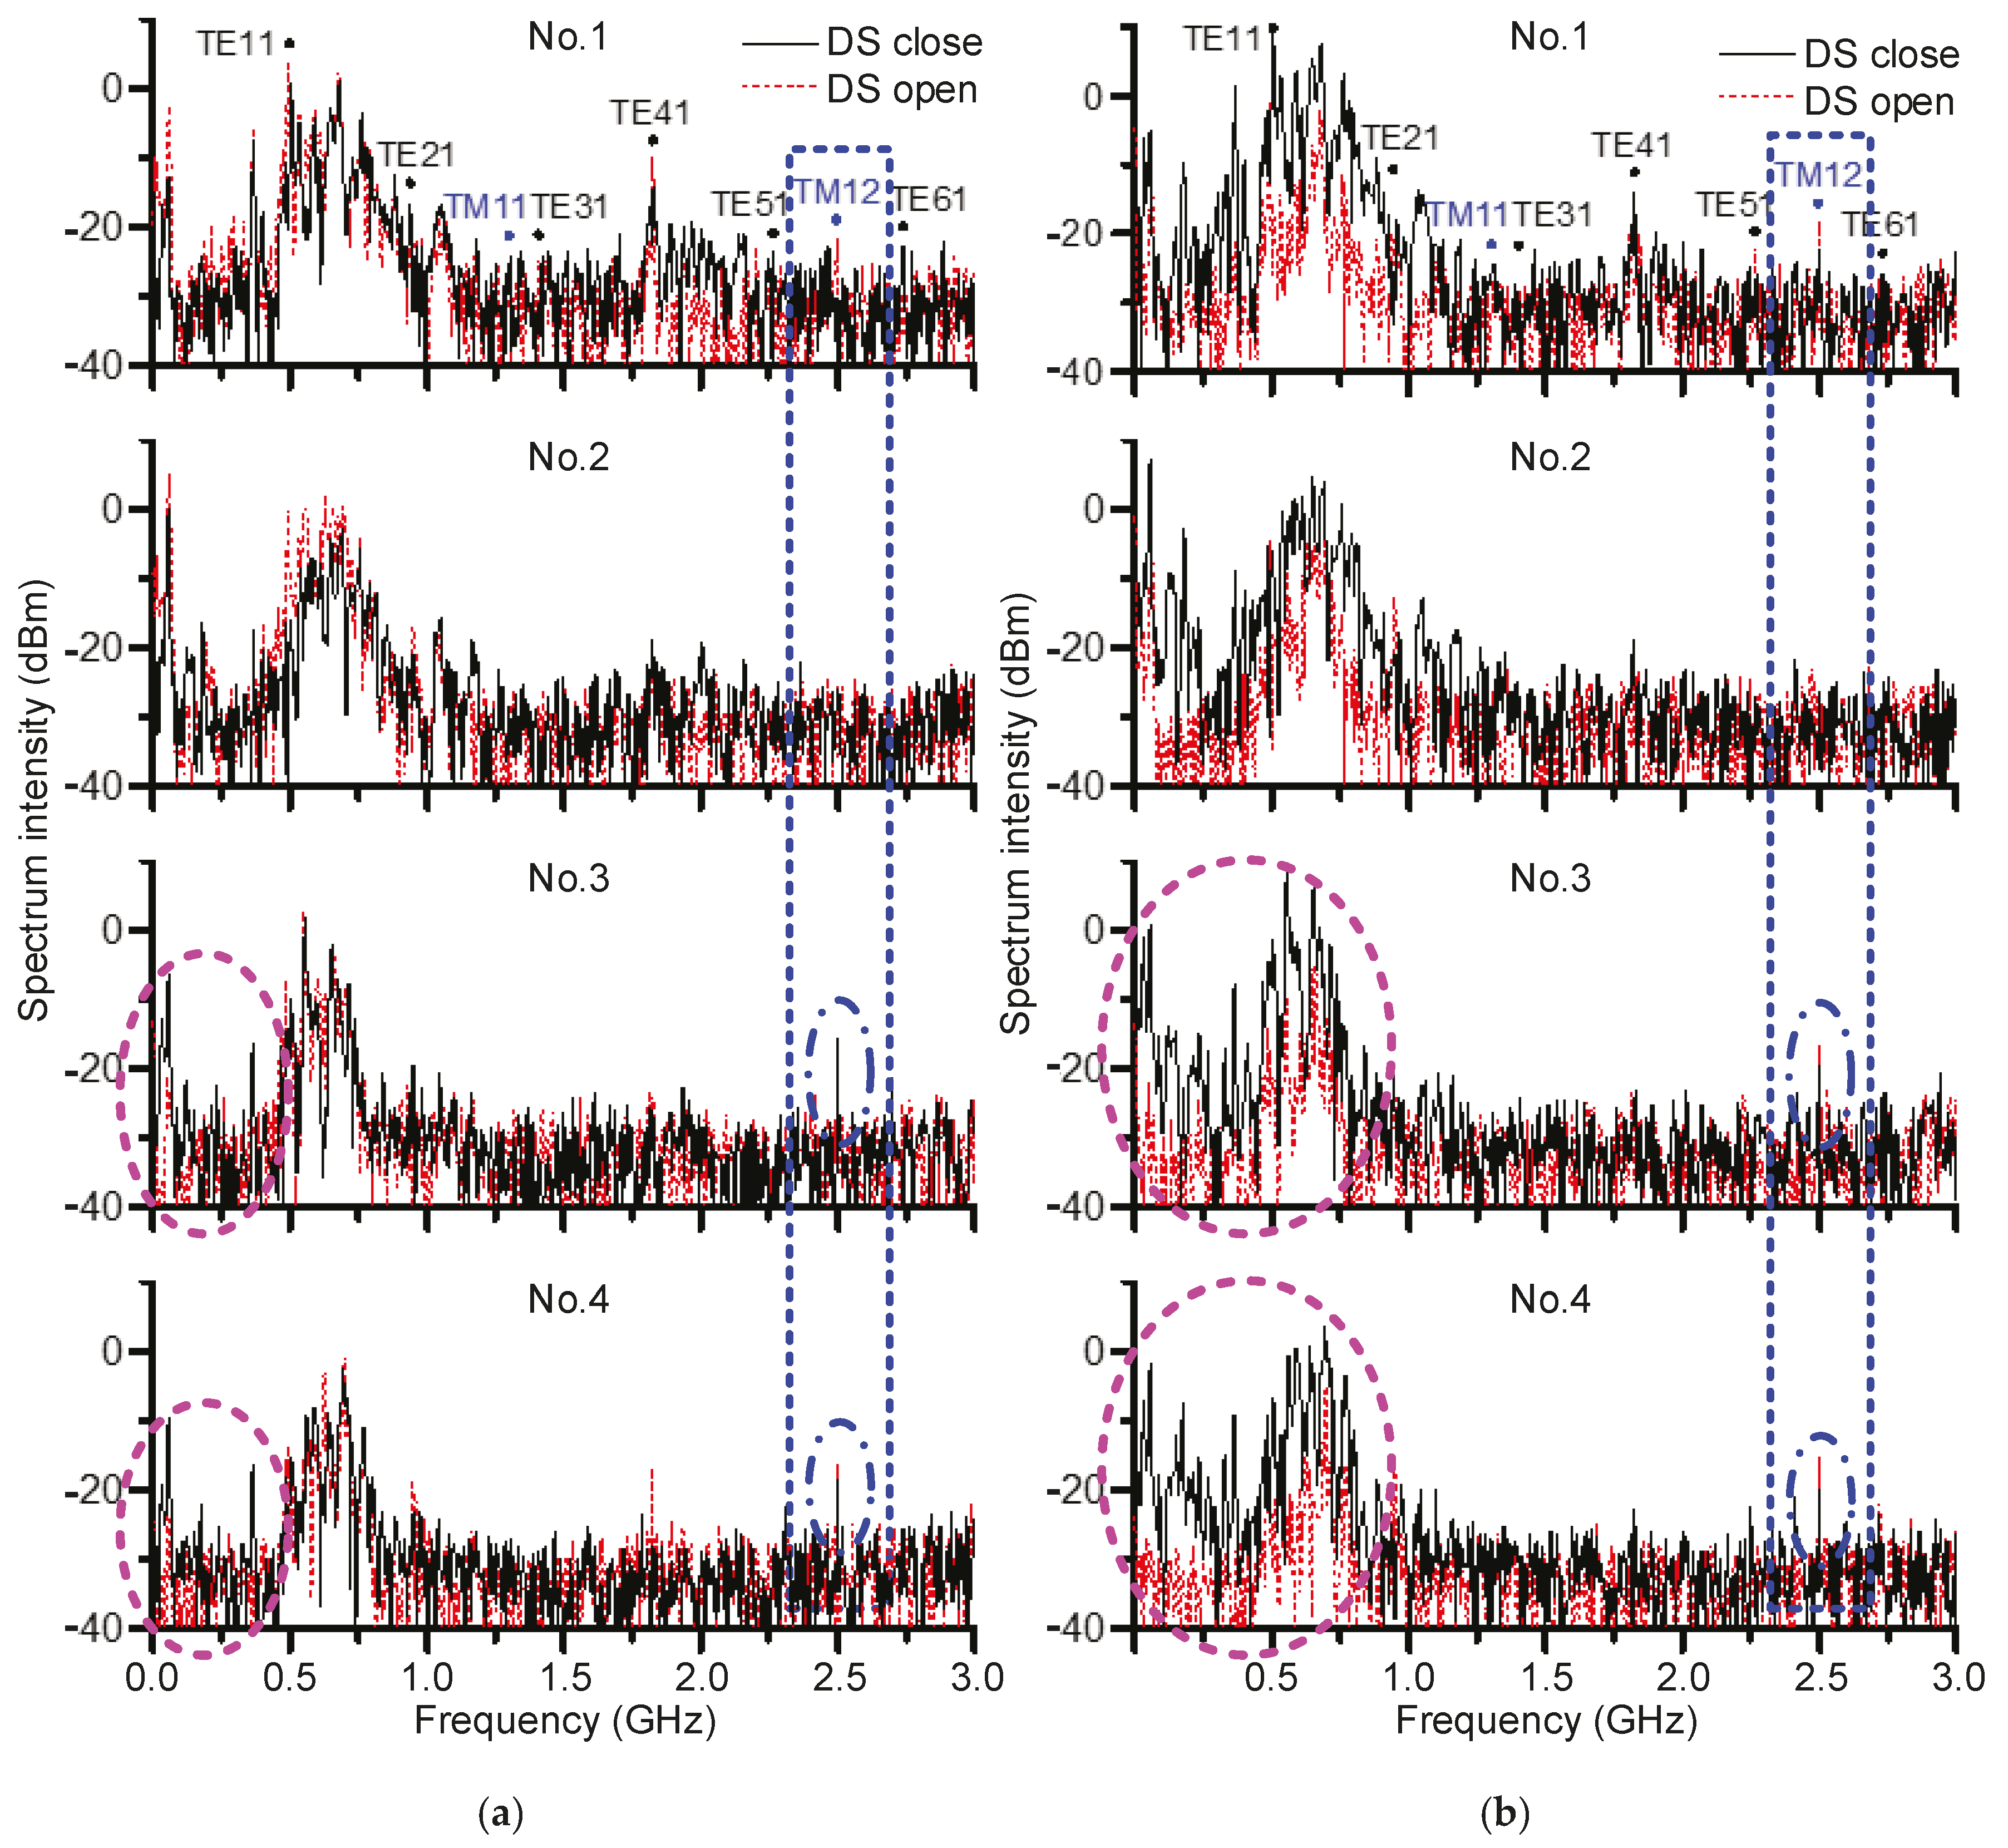
3.2. Frequency Domain Analysis

For the purpose of analyzing the propagation of different EM wave modes, the time domain signals were transformed into the frequency domain using FFT. The cutoff frequencies (CF) of some TE and TM modes were calculated according to the size of the GIS tank [12,13,14], as shown in Table 1. Next, the range below 1 GHz was designated as the low frequency band, while that between 1 GHz and 2 GHz was designated the middle frequency band, with the high frequency band being ranges above 2 GHz.
The signal frequency spectrums of each sensor when the DS was closed and open were plotted together, as Figure 9 shows. It can be seen that the signals of each sensor were all dominated by TE11, and mainly concentrated in the low frequency band and the middle frequency band around TE41. The signals also contained a certain low frequency component below 0.4 GHz. Particularly, the signals in SB were mainly in the range of 0.4–1.2 GHz. While in LB, the component around 1 GHz was obviously attenuated, with the signal frequency range becoming as narrow as 0.4–0.75 GHz. It is shown that the higher frequency part had a large attenuation after passing LS, which was consistent with previous conclusions.
The spectrums differed little between the two states of DS, as shown in Figure 9a, but certain distinctions appeared after passing LS. As for the two spectral curves in No.1 and No.2, the amplitudes were similar to each other in each frequency band. But in No.3 and No.4, after passing LS, the curve with the open DS had decreased in the low frequency band below 0.25 GHz due to the lack of TEM modes [10,35]. Hence, it separated from the curve with closed DS to some extent, which proves that the discontinuous HV conductor has a filtering effect on the low frequency component. Comparing the spectrums of the four sensors successively, it was found that the amplitudes of most modes had decreased betweenNo.1 and No.2, especially for TE11 and TE21 of the curve with the closed DS. In No.3 and No.4, most modes had further decreased. Notably, however, TM12 began to progressively increase, instead, which verifies the conclusion that LS has a positive impact on TM mode [28]. Simultaneously, the amplitude of TM12 is larger with the open DS, because of the influence of the gap.
In Figure 9b, the separation in the low frequency band becomes more prominent. The two curves start to separate clearly below 0.7 GHz from No.2. Additionally, the low frequency spectrum when the DS is open is greatly reduced after passing LS. Observing the changing process from No.1 to No.4, it was found that most of the modes, like TE11 and TE21, decreased gradually. The enhancement of TM12 in LB was still significant, which is identical to the result above.

4. The Optimal Circumferential Angle Position of UHF Sensor

4.1. Experimental Results of the Defect at θ = 90°

In this case, the defect was moved to the position θ = 90°, as shown in Figure 4. At this time, the distance from the tip of the protrusion to the tank wall was larger than that when θ = 0°, because of the mental cover below. The time domain waveforms were similar to before, which is not shown here.
The transmission rate of UHF signals at θ = 90° is displayed in Figure 10. The transmission rate has the greatest difference for different states of DS, which was about 18% for No.3, while those for No.2 and No.4 were about 14%. Compared to Figure 8, the effect of the gap in No.2 has been weakened. The transmission rate is lower than that for θ = 0°.

4.2. Experimental Results of the Defect at θ = 180°

The defect was moved to the position of θ = 180°, which is directly opposite to θ = 0°, as shown in Figure 4. The similar waveforms in the time domain are omitted here, too.
The transmission rates of UHF signals at θ = 180°are displayed in Figure 11. The largest difference of the transmission rates in different states of the DS takes place once more in No.2, at about 41%, while that in No.4 is about 12%, and there is basically no difference in No.3. Moreover, the transmission rate was higher than that at θ = 90°, but still generally lower than that at θ = 0°.

4.3. Discussion of UHF Sensor’s Position

Based on the above results, different relative positions of the sensor and the defect do have obvious influences on the received signal. The transmission rate of each UHF sensor at θ = 90° and θ = 180° are both lower than that for the corresponding sensor at θ = 0°. In other words, the transmitting attenuation of the UHF signal is at a minimum when the PD defect and UHF sensor take a circumferential angle of 0°. Thus, this position is regarded as the optimal circumferential angle position for UHF sensors to detect PD in GIS.

5. Conclusions

The UHF signal’s attenuation in an actual 252 kV GIS with hybrid structure was experimentally investigated in this research. Through the analysis of time, statistical and frequency characteristics of the results, the effect of the DS and LS on the signal’s propagation was revealed, helping to improve the understanding of the propagation mechanism. The conclusions are summarized as follows.
  • The UHF sensor, which works properly with the available installation in GIS, can effectively receive PD-radiated signal and accurately reflect its features in practical PD detection. This could be applied in on-line monitoring of PD in GIS in the future.
  • Generally, the special structures in GIS, such as LS, have an attenuating effect on UHF signals, and will make is more difficult to identify the start of the rising edge of the waveform. However, the discontinuity conductor of the DS leads to a peak of the Vpp attenuation curve, while the signal transmission rate is also enhanced. In the actual diagnosis, choosing the simplified GIS structure to detect PD can help to accurately demonstrate the discharge characteristics of the defect and evaluate the severity better.
  • The frequency domain analysis demonstrates that it is the variation of mode components in the PD signal affected by special structure of GIS that lead to the distinctions in amplitude and transmission rates. For instance, the prevention of the TEM mode by the discontinuity conductor, the enhancement of the TM mode and the decrease in TE mode by LS.
  • The relative position of the sensor and the defect will influence the received signal, especially for the transmission rate. When the circumferential angle between the sensor and defect is 0°, the transmission rate of the UHF signal is found to be at maximum. Thus, this position is considered to be the optimal circumferential angle position of UHF Sensor to detect PD in GIS.
Future work is planned, in which we will perform more experiments for other kinds of defect; the different propagation and attenuation characteristics of different defects are also expected to be analyzed.

Acknowledgments

This work was supported by the National High Technology Research and Development Program (“863” Program) of China (No. 2011AA05A121), the National Natural Science Foundation of China (No. 51521065) and Program for New Century Excellent Talents in University. The authors also gratefully appreciate the support from Dr. Tianhui Li’s wife, Ms. Dan Wang, for her guidance in the English language and style.

Author Contributions

Tianhui Li, Mingzhe Rong and Xiaohua Wang designed the planar equiangular spiral antenna and conceived the experiments; Tianhui Li and Jin Pan performed the experiments; Jin Pan contributed the experiment environment; Tianhui Li analyzed the data and wrote the paper.

Conflicts of Interest

The authors declare no conflict of interest.

References

  1. Okabe, S.; Ueta, G.; Hama, H.; Ito, T.; Hikita, M.; Okubo, H. New Aspects of UHF PD Diagnostics on Gas-insulated Systems. IEEE Trans. Dielectr. Electr. Insul. 2014, 21, 2245–2258. [Google Scholar] [CrossRef]
  2. Dai, D.D.; Wang, X.P.; Long, J.C.; Tian, M.; Zhu, G.W.; Zhang, J.M. Feature extraction of GIS partial discharge signal based on S-transform and singular value decomposition. IET Sci. Meas. Technol. 2017, 11, 186–193. [Google Scholar] [CrossRef]
  3. Feger, R.; Feser, K.; Knapp, M. The Application of Ultra-High-Frequency Partial Discharge Measurements to Gas-Insulated Substations. IEEE Trans. Power Deliv. 1998, 13, 777–782. [Google Scholar]
  4. Jiang, T.Y.; Li, J.; Zheng, Y.B.; Sun, C.X. Improved Bagging Algorithm for Pattern Recognition in UHF Signals of Partial Discharges. Energies 2011, 4, 1087–1101. [Google Scholar] [CrossRef]
  5. Tang, J.; Zhou, J.B.; Zhang, X.X.; Liu, F. A Transformer Partial Discharge Measurement System Based on Fluorescent Fiber. Energies 2012, 5, 1490–1502. [Google Scholar] [CrossRef]
  6. Hikita, M. Recent Technology Development on Partial Discharge Measurements in Diagnosis for GIS, Transformers, Cables and Inverter-fed Motors. In Proceedings of the 14th Asian Conference on Electrical Discharge, Bandung, Indonesia, 23–25 November 2008; pp. 1–8. [Google Scholar]
  7. Hikita, M.; Otsuka, S.; Teshima, T.; Okabe, S. Examination of Electromagnetic Mode Propagation Characteristics in Straight and L-Section GIS Model Using FD-TD Analysis. IEEE Trans. Dielectr. Electr. Insul. 2007, 14, 1477–1483. [Google Scholar] [CrossRef]
  8. Hikita, M.; Otsuka, S.; Okabe, S.; Ueta, G.; Hoshino, T.; Maruyama, S. Propagation Properties of PD-induced Electromagnetic Wave in GIS Model Tank with T Branch Structure. IEEE Trans. Dielectr. Electr. Insul. 2011, 18, 256–263. [Google Scholar] [CrossRef]
  9. Nishigouchi, K.; Kozako, M.; Hikita, M.; Hoshino, T.; Maruyama, S.; Nakajima, T. Waveform Estimation of Particle Discharge Currents in Straight 154 kV GIS Using Electromagnetic Wave Propagation Simulation. IEEE Trans. Dielectr. Electr. Insul. 2013, 20, 2239–2245. [Google Scholar] [CrossRef]
  10. Hikita, M.; Otsuka, S.; Okabe, S.; Wada, J.; Hoshino, T.; Maruyama, S. Influence of Disconnecting Part on Propagation Properties of PD-induced Electromagnetic Wave in Model GIS. IEEE Trans. Dielectr. Electr. Insul. 2010, 17, 1731–1737. [Google Scholar] [CrossRef]
  11. Yoshimura, M.; Muto, H.; Nishida, C.; Kamei, M. Propagation Properties of Electromagnetic Wave through T-branch in GIS. IEEE Trans. Dielectr. Electr. Insul. 2007, 14, 328–333. [Google Scholar] [CrossRef]
  12. Okabe, S.; Kaneko, S.; Yoshimura, M.; Muto, H.; Nishida, C. Partial Discharge Diagnosis Method Using Electromagnetic Wave Mode Transformation in Gas Insulated Switchgear. IEEE Trans. Dielectr. Electr. Insul. 2007, 14, 702–709. [Google Scholar] [CrossRef]
  13. Kaneko, S.; Okabe, S.; Yoshimura, M.; Muto, H.; Nishida, C.; Kamei, M. Partial Discharge Diagnosis Method Using Electromagnetic Wave Mode Transformation in Actual GIS Structure. IEEE Trans. Dielectr. Electr. Insul. 2008, 15, 1329–1339. [Google Scholar] [CrossRef]
  14. Okabe, S.; Kaneko, S. Electromagnetic Wave Propagation in a Coaxial Pipe GIS Model. IEEE Trans. Dielectr. Electr. Insul. 2007, 14, 1161–1169. [Google Scholar] [CrossRef]
  15. Kaneko, S.; Okabe, S.; Muto, H.; Yoshimura, M.; Nishida, C.; Kamei, M. Electromagnetic wave radiated from an insulating spacer in gas insulated switchgear with partial discharge detection. IEEE Trans. Dielectr. Electr. Insul. 2009, 16, 60–68. [Google Scholar] [CrossRef]
  16. Hoshino, T.; Nojima, K.; Hanai, M. Real-time PD identification in diagnosis of GIS using symmetric and asymmetric UHF sensors. IEEE Trans. Power Del. 2004, 19, 1072–1077. [Google Scholar] [CrossRef]
  17. Hoshino, T.; Maruyama, S.; Nojima, K.; Hanai, M. A unique sensitivity verification combined with real-time PD identification method. IEEE Trans. Power Del. 2005, 20, 1890–1896. [Google Scholar] [CrossRef]
  18. Hoshino, T.; Maruyama, S.; Sakakibara, T. Simulation of Propagating Electromagnetic Wave Due to Partial Discharge in GIS Using FDTD. IEEE Trans. Power Deliv. 2009, 24, 153–159. [Google Scholar] [CrossRef]
  19. Judd, M.D.; Farish, O.; Hampton, B.F. The Excitation of UHF Signals by Partial Discharges in GIS. IEEE Trans. Dielectr. Electr. Insul. 1996, 3, 213–228. [Google Scholar] [CrossRef]
  20. Judd, M.D.; Hampton, B.F.; Farish, O. Modeling partial discharge excitation of UHF signals in waveguide structures using Green's functions. IEEE Proc. Sci. Meas. Technol. 1996, 143, 63–70. [Google Scholar] [CrossRef]
  21. Judd, M.D. Using finite difference time domain techniques to model electrical discharge phenomena. In Proceedings of the Annual Report Conference on Electrical Insulation Dielectric Phenomena, Victoria, BC, Canada, 15–18 October 2000; Volume 2, pp. 518–521. [Google Scholar]
  22. Judd, M.D.; Farish, O. FDTD simulation of UHF signals in GIS. In Proceedings of the 10th International Symposium on High Voltage Engineering, Montreal, QC, Canada, 25–29 August 1997; Volume 6. [Google Scholar]
  23. Reid, A.J.; Judd, M.D. High Bandwidth Measurement of Partial Discharge Pulses in SF6. In Proceedings of the 14th International Symposium on High Voltage Engineering, Beijing, China, 25–29 August 2005; Volume 1, pp. 25–29. [Google Scholar]
  24. Reid, A.J.; Stewart, M.; Judd, M.D. FDTD Modeling of UHF Partial Discharge Sensor Response. In Proceedings of the International Conference on Sustainable Power Generation and Supply, Nanjing, China, 6–7 April 2009; Volume 14, pp. 2294–2297. [Google Scholar]
  25. Li, T.H.; Rong, M.Z.; Zheng, C.; Wang, X.H. Development simulation and experiment study on UHF Partial Discharge Sensor in GIS. IEEE Trans. Dielectr. Electr. Insul. 2012, 19, 1421–1430. [Google Scholar] [CrossRef]
  26. Li, T.H.; Rong, M.Z.; Wang, X.H. Experimental Investigation on UHF Partial Discharge Sensor in GIS. In Proceedings of the 2015 3rd International Conference on Electric Power Equipment-Switching Technology (ICEPE-ST), ICEPE, Busan, Korea, 25–28 October 2015; pp. 46–49. [Google Scholar]
  27. Li, T.H.; Wang, X.H.; Zheng, C.; Liu, D.X.; Rong, M.Z. Investigation on the Placement Effect of UHF Sensor and Propagation Characteristics of PD-induced Electromagnetic Wave in GIS Based on FDTD Method. IEEE Trans. Dielectr. Electr. Insul. 2014, 21, 1015–1025. [Google Scholar] [CrossRef]
  28. Wang, X.H.; Li, T.H.; Ding, D.; Rong, M.Z. The Influence of L-shaped Structure on Partial Discharge Radiated Electromagnetic Wave Propagation in GIS. IEEE Trans. Plasma Sci. 2014, 42, 2536–2537. [Google Scholar] [CrossRef]
  29. Rong, M.Z.; Li, T.H.; Wang, X.H.; Liu, D.X.; Zhang, A.X. Investigation on Propagation Characteristics of PD-induced Electromagnetic Wave in T-Shaped GIS Based on FDTD Method. IEICE Trans. Electron. 2014, E97-C, 880–887. [Google Scholar] [CrossRef]
  30. Pearson, J.S.; Hampton, B.F.; Sellers, A.G. A continuous UHF monitor for gas-insulated substation. IEEE Trans. Electr. Insul. 1991, 26, 469–478. [Google Scholar] [CrossRef]
  31. Meijer, S.; Smit, J.J. UHF Defect Evaluation in Gas Insulated Equipment. IEEE Trans. Dielectr. Electr. Insul. 2005, 12, 285–296. [Google Scholar] [CrossRef]
  32. Hikita, M.; Otsuka, S.; Wada, J.; Okabe, S.; Hoshino, T.; Maruyama, S. Study of partial discharge radiated electromagnetic wave propagation characteristics in an actual 154 kV model GIS. IEEE Trans. Dielectr. Electr. Insul. 2012, 19, 8–17. [Google Scholar] [CrossRef]
  33. Chen, X.X.; Qian, Y.; Sheng, G.H.; Jiang, X.C. A Time-domain Characterization Method for UHF Partial Discharge Sensors. IEEE Trans. Dielectr. Electr. Insul. 2017, 24, 110–119. [Google Scholar] [CrossRef]
  34. Wang, X.H.; Li, X.; Rong, M.Z.; Xie, D.L.; Ding, D.; Wang, Z.X. UHF Signal Processing and Pattern Recognition of Partial Discharge in Gas-Insulated Switchgear Using Chromatic Methodology. Sensors 2017, 17, 177. [Google Scholar] [CrossRef] [PubMed]
  35. Balanis, C.A. Advanced Engineering Electromagnetics, 2nd ed.; Wiley: Hoboken, NJ, USA, 2012. [Google Scholar]
Figure 1. Photograph of the GIS tank.
Energies 10 00942 g001
Figure 2. The placement of UHF sensor.
Energies 10 00942 g002
Figure 3. Experimental setup.
Energies 10 00942 g003
Figure 4. PD defect.
Energies 10 00942 g004
Figure 5. Time domain waveforms of UHF signals induced by protrusion defect (θ = 0°, DS closed). (a) U = 6.5 kV; (b) U = 9.6 kV.
Energies 10 00942 g005
Figure 6. Time domain waveforms of UHF signals induced by protrusion defect (θ = 0°, DS open). (a) U = 6.5 kV; (b) U = 9.6 kV.
Energies 10 00942 g006
Figure 7. The Vpp attenuation characteristics of UHF signals induced by protrusion defect (θ = 0°). (a) DS closed; (b) DS open.
Energies 10 00942 g007
Figure 8. The transmission rates of UHF signals induced by protrusion defect for DS closed and open (θ = 0°). (a) U = 6.5 kV; (b) U = 9.6 kV.
Energies 10 00942 g008
Figure 9. Comparison of EM wave spectra (θ = 0°). (a) 6.5 kV; (b) 9.6 kV.
Energies 10 00942 g009
Figure 10. The transmission rates of UHF signals at θ = 90°. (a) U = 10 kV; (b) U = 14.5 kV.
Energies 10 00942 g010
Figure 11. The transmission rates of UHF signals on θ = 180°. (a) U = 6.5 kV; (b) U = 9.6 kV.
Energies 10 00942 g011
Table 1. The cutoff frequencies of TEm1 and TM1n modes (GHz).
m123456
f c (TE)0.470.931.41.862.332.79
n12
f c (TM)1.32.61

