Article

Harmonic Distortion Minimization in Power Grids with Wind and Electric Vehicles

1
Midcontinent Independent System Operator, Eagan, MN 55122, USA
2
Department of Electrical and Computer Engineering, Michigan Technological University, Houghton, MI 49931, USA
3
Department of Electrical and Electronics Engineering, Istanbul Kemerburgaz University, Istanbul 34000, Turkey
4
Department of Electrical and Computer Engineering, University of Texas at El Paso, El Paso, TX 79901, USA
*
Author to whom correspondence should be addressed.
Energies 2017, 10(7), 932; https://doi.org/10.3390/en10070932
Submission received: 1 March 2017 / Revised: 12 May 2017 / Accepted: 25 June 2017 / Published: 5 July 2017
(This article belongs to the Special Issue Smart Microgrids: Developing the Intelligent Power Grid of Tomorrow)

Abstract

:
Power-electronic interfacing based devices such as wind generators (WGs) and electrical vehicles (EVs) cause harmonic distortions on the power grid. Higher penetration and uncoordinated operation of WGs and EVs can lead to voltage and current harmonic distortions, which may exceed IEEE limits. It is interesting to note that WGs and EVs have some common harmonic profiles. Therefore, when EVs are connected to the grid, the harmonic pollution EVs impart onto the grid can be reduced to some extent by the amount of wind power injecting into the grid and vice versa. In this context, this work studies the impact of EVs on harmonic distortions and careful utilization of wind power to minimize the distortions in distribution feeders. For this, a harmonic unbalanced distribution feeder model is developed in OpenDSS and interfaced with Genetic Algorithm (GA) based optimization algorithm in MATLAB to solve optimal harmonic power flow (OHPF) problems. The developed OHPF model is first used to study impact of EV penetration on current/voltage total harmonic distortions (THDs) in distribution grids. Next, dispatch of WGs are found at different locations on the distribution grid to demonstrate reduction in the current/voltage THDs when EVs are charging.

1. Introduction

Electric vehicles (EVs) and wind energy provide economic and environmental benefits, which demonstrate their large-scale interconnection possibilities at distribution grid level. EVs and wind power have capability to help reduce the emissions and depletion of fossil fuel. Despite the benefits, integration of EVs and wind generators (WGs) in the power network also causes adverse impacts because of the increased load from EV charging and intermittency of wind power [1,2]. The placement and number of EV loads and WGs impact the voltage profile in the distribution network. Similarly, studies have shown that uncoordinated charging of EVs leads increased peak demand, which impacts the overall reliability of the grid [3,4]. Also, the presence of EVs can cause increased power losses and power quality issues including harmonic distortions in the distribution grids.
Past studies focus on optimal planning and dispatch of WGs, optimal EV scheduling, impact of EV loads in distribution grids, and combined impact of EVs and WGs to the distribution grid operations. A Genetic Algorithm (GA) based approach is used in [5] to determine the location and size of the distributed generators (DGs) with feeder loss minimization as the objective. In [6], a multi-objective programming and decision theory based approach is used to solve voltage quality and total harmonic distortion (THD) issues with the help of DGs. Similar studies are carried out in [7,8,9], where Particle Swarm Optimization (PSO) is used for optimal siting and sizing of DGs with objectives to reduce THDs and to improve voltage profiles in the grid.
Uncoordinated charging of a large number of EVs impacts the overall residential load curve, increases power losses, causes overloading of lines, and also increases harmonics in the power grid due to non-linearity. Two EV charging schemes are considered in [10] to analyze such adverse impacts. In the uncoordinated random charging scenario, maximum node voltage deviation and poor power quality are observed. However, power losses and voltage THDs are found much less in the case of coordinated charging of EVs. In [10], it is demonstrated that when the EV penetration is low, THDs are not significant and the scenario is not concerning to the utilities. Similar conclusion is made in [11] that low EV penetration may not cause significant impact on THDs. Harmonics in EV currents cause abnormal operation including increased power losses, temperature rise, premature insulation and windings failure of transformers, etc. [12]; this can cause adverse impacts on reliability, security, and efficiency of the power grid. Previous studies carried out in [10,12,13,14] find the impact on harmonics due to the integration of EVs; however, these studies do not consider WGs in the network which has potentials to reduce THDs if operated in coordination with the EVs. In [15], EVs and WGs are considered to demonstrate their impacts on voltage THDs but without considering the possible coordinated operations of EVs and WGs to reduce THDs. Uncoordinated charging of EVs in a system with significant WGs can lead to significant harmonic distortions that may exceed IEEE prescribed limits [16].
Power-electronic interfacing based devices used in the EV chargers and WG system cause harmonic currents. The current drawn by EVs contains significant 5th , 7th , 11th , and 13th harmonic components [17,18]. The harmonic profiles of WGs show significant 2nd to 8th, 11th, and 13th harmonic currents [19]. It is interesting to note that WGs and EVs have some common harmonic profiles. Therefore, when EVs are connected to the grid, the harmonic pollution EVs impart onto the grid can be reduced to some extent by the amount of wind power injecting into the grid and vice versa. In this context, this work studies the impact of EVs on harmonic distortions and careful utilization of wind power to minimize the distortions in distribution feeders.
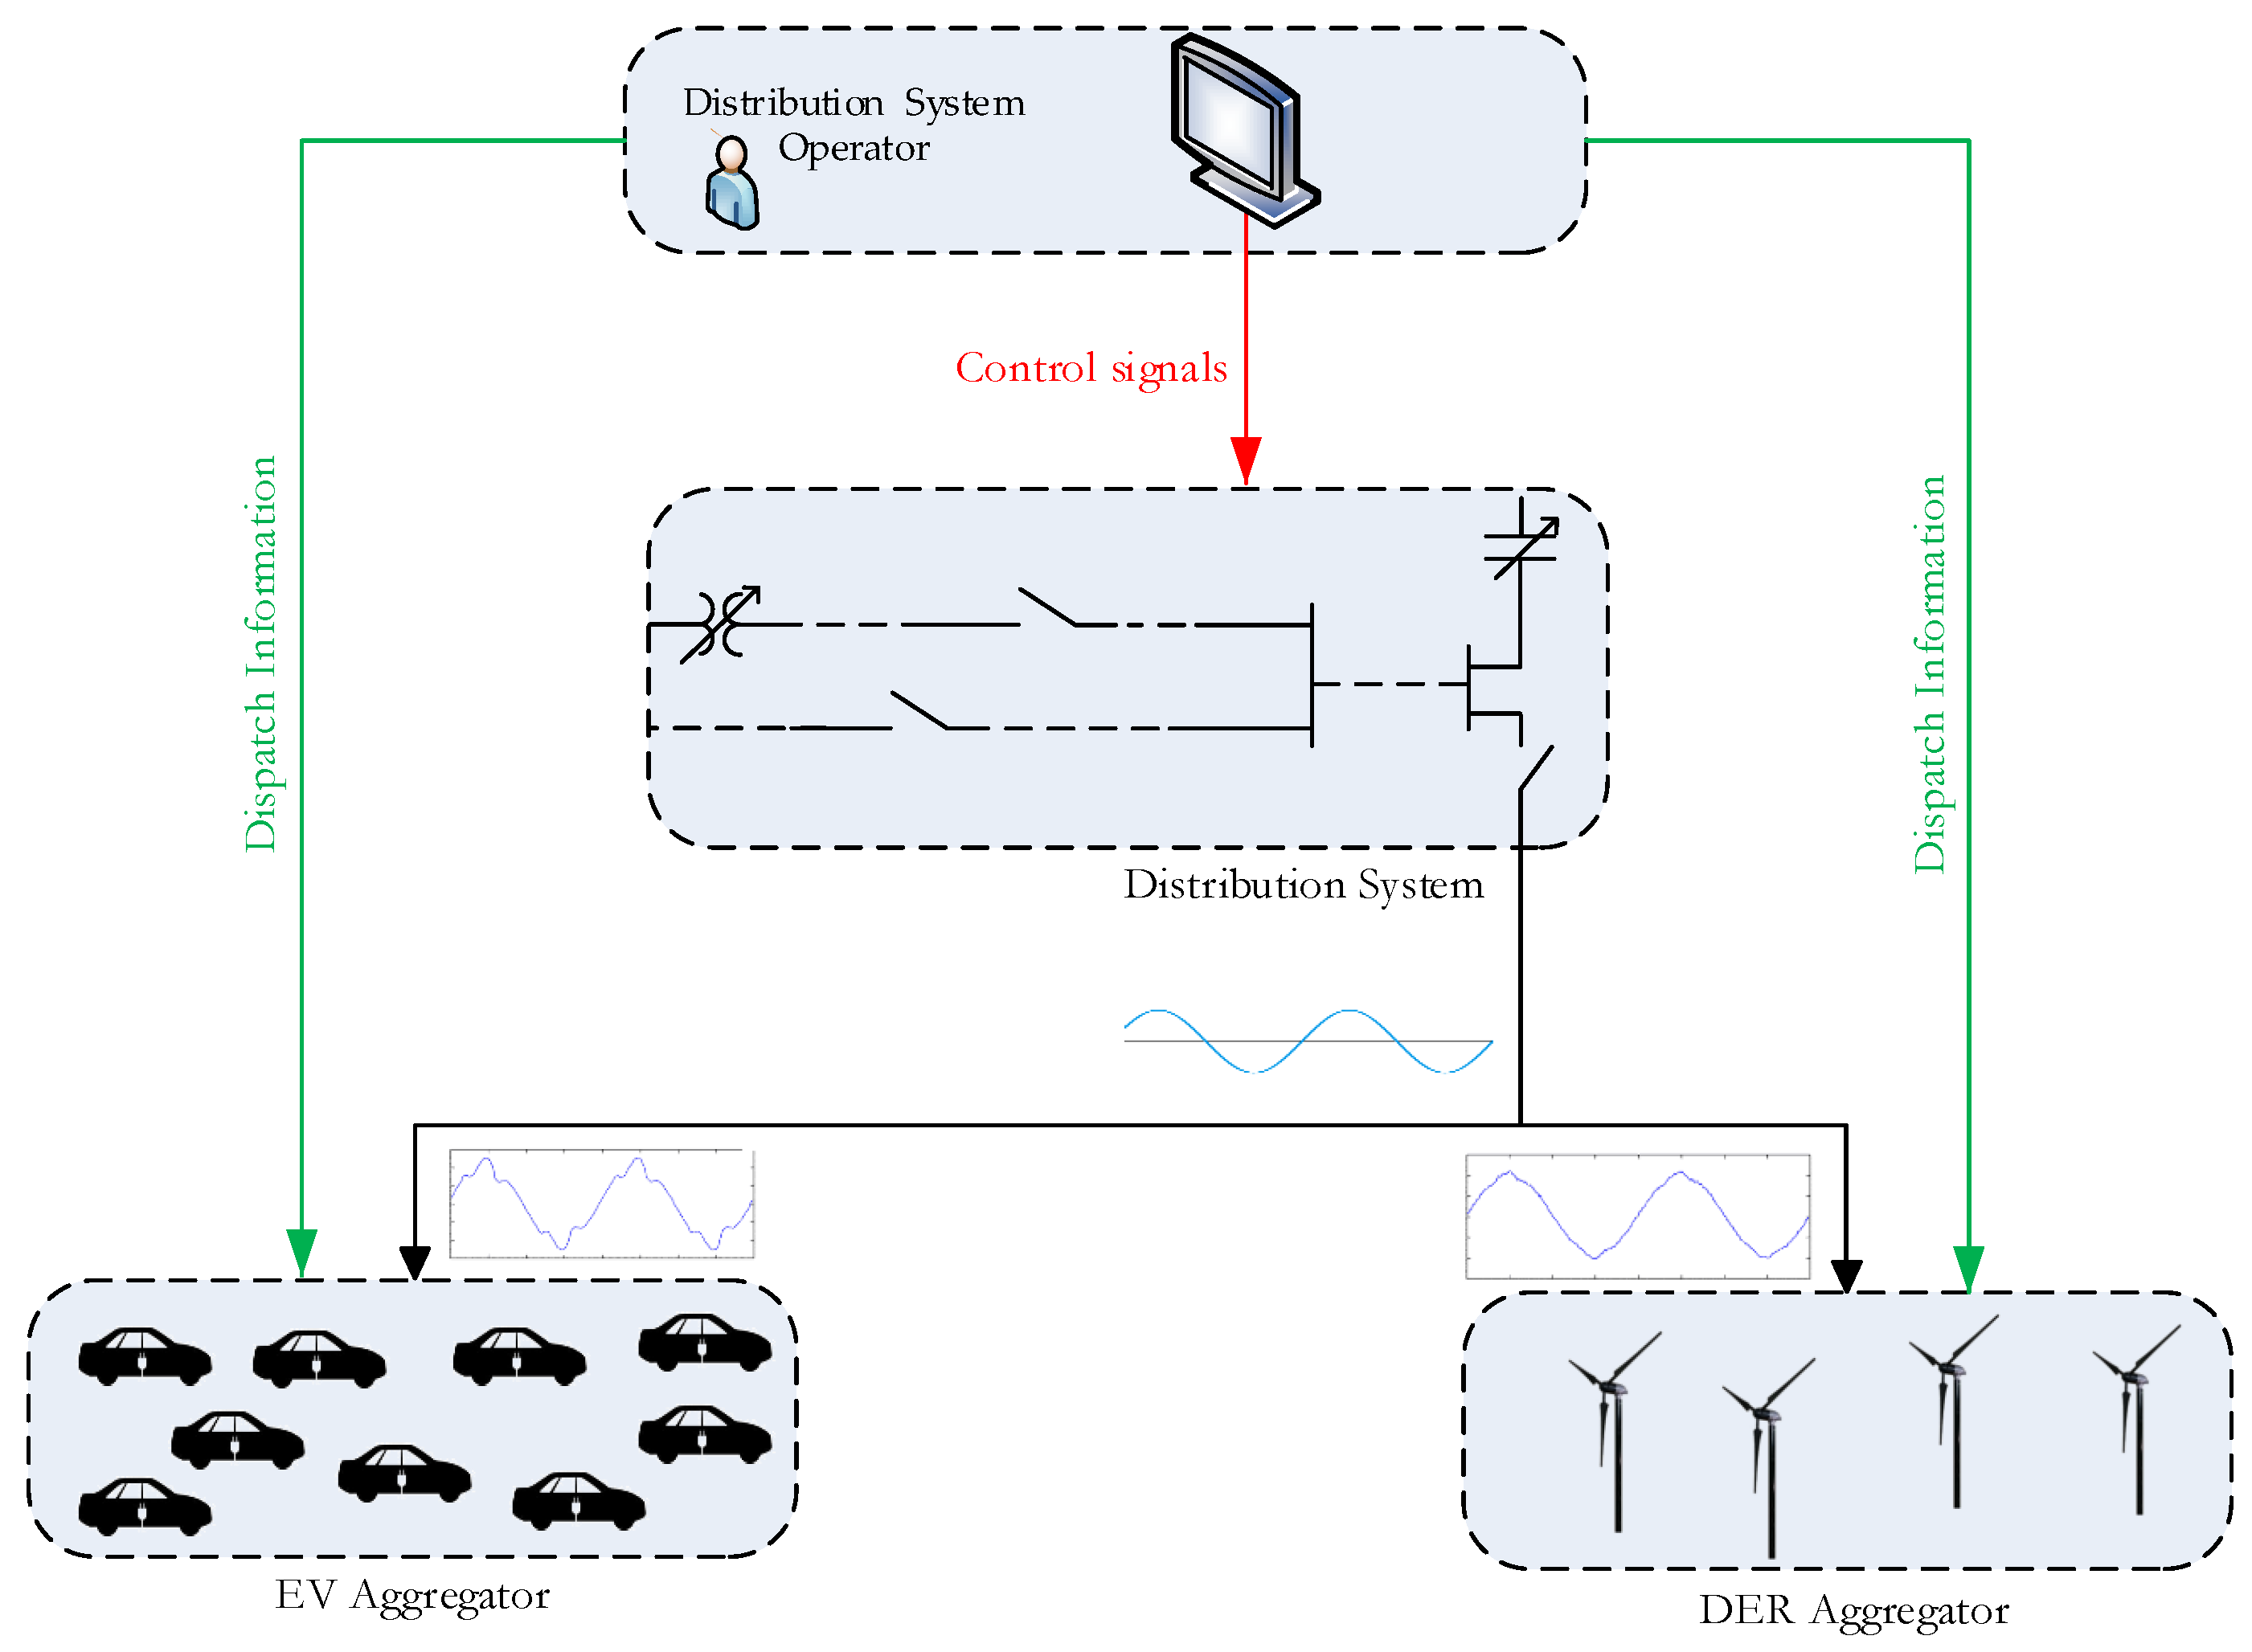
Figure 1 shows a high-level conceptual diagram that demonstrates the distorted currents withdrawn by EVs can be compensated by controlling WG output power. The distribution system operator can send dispatch signals to wind farm and EV aggregators to achieve this objective. The distribution system operator requires harmonic analysis tools and optimal harmonic power flow type models to reduce the harmonic pollution by controlling EV charging and WG output. In this context, this paper contributes on the following:
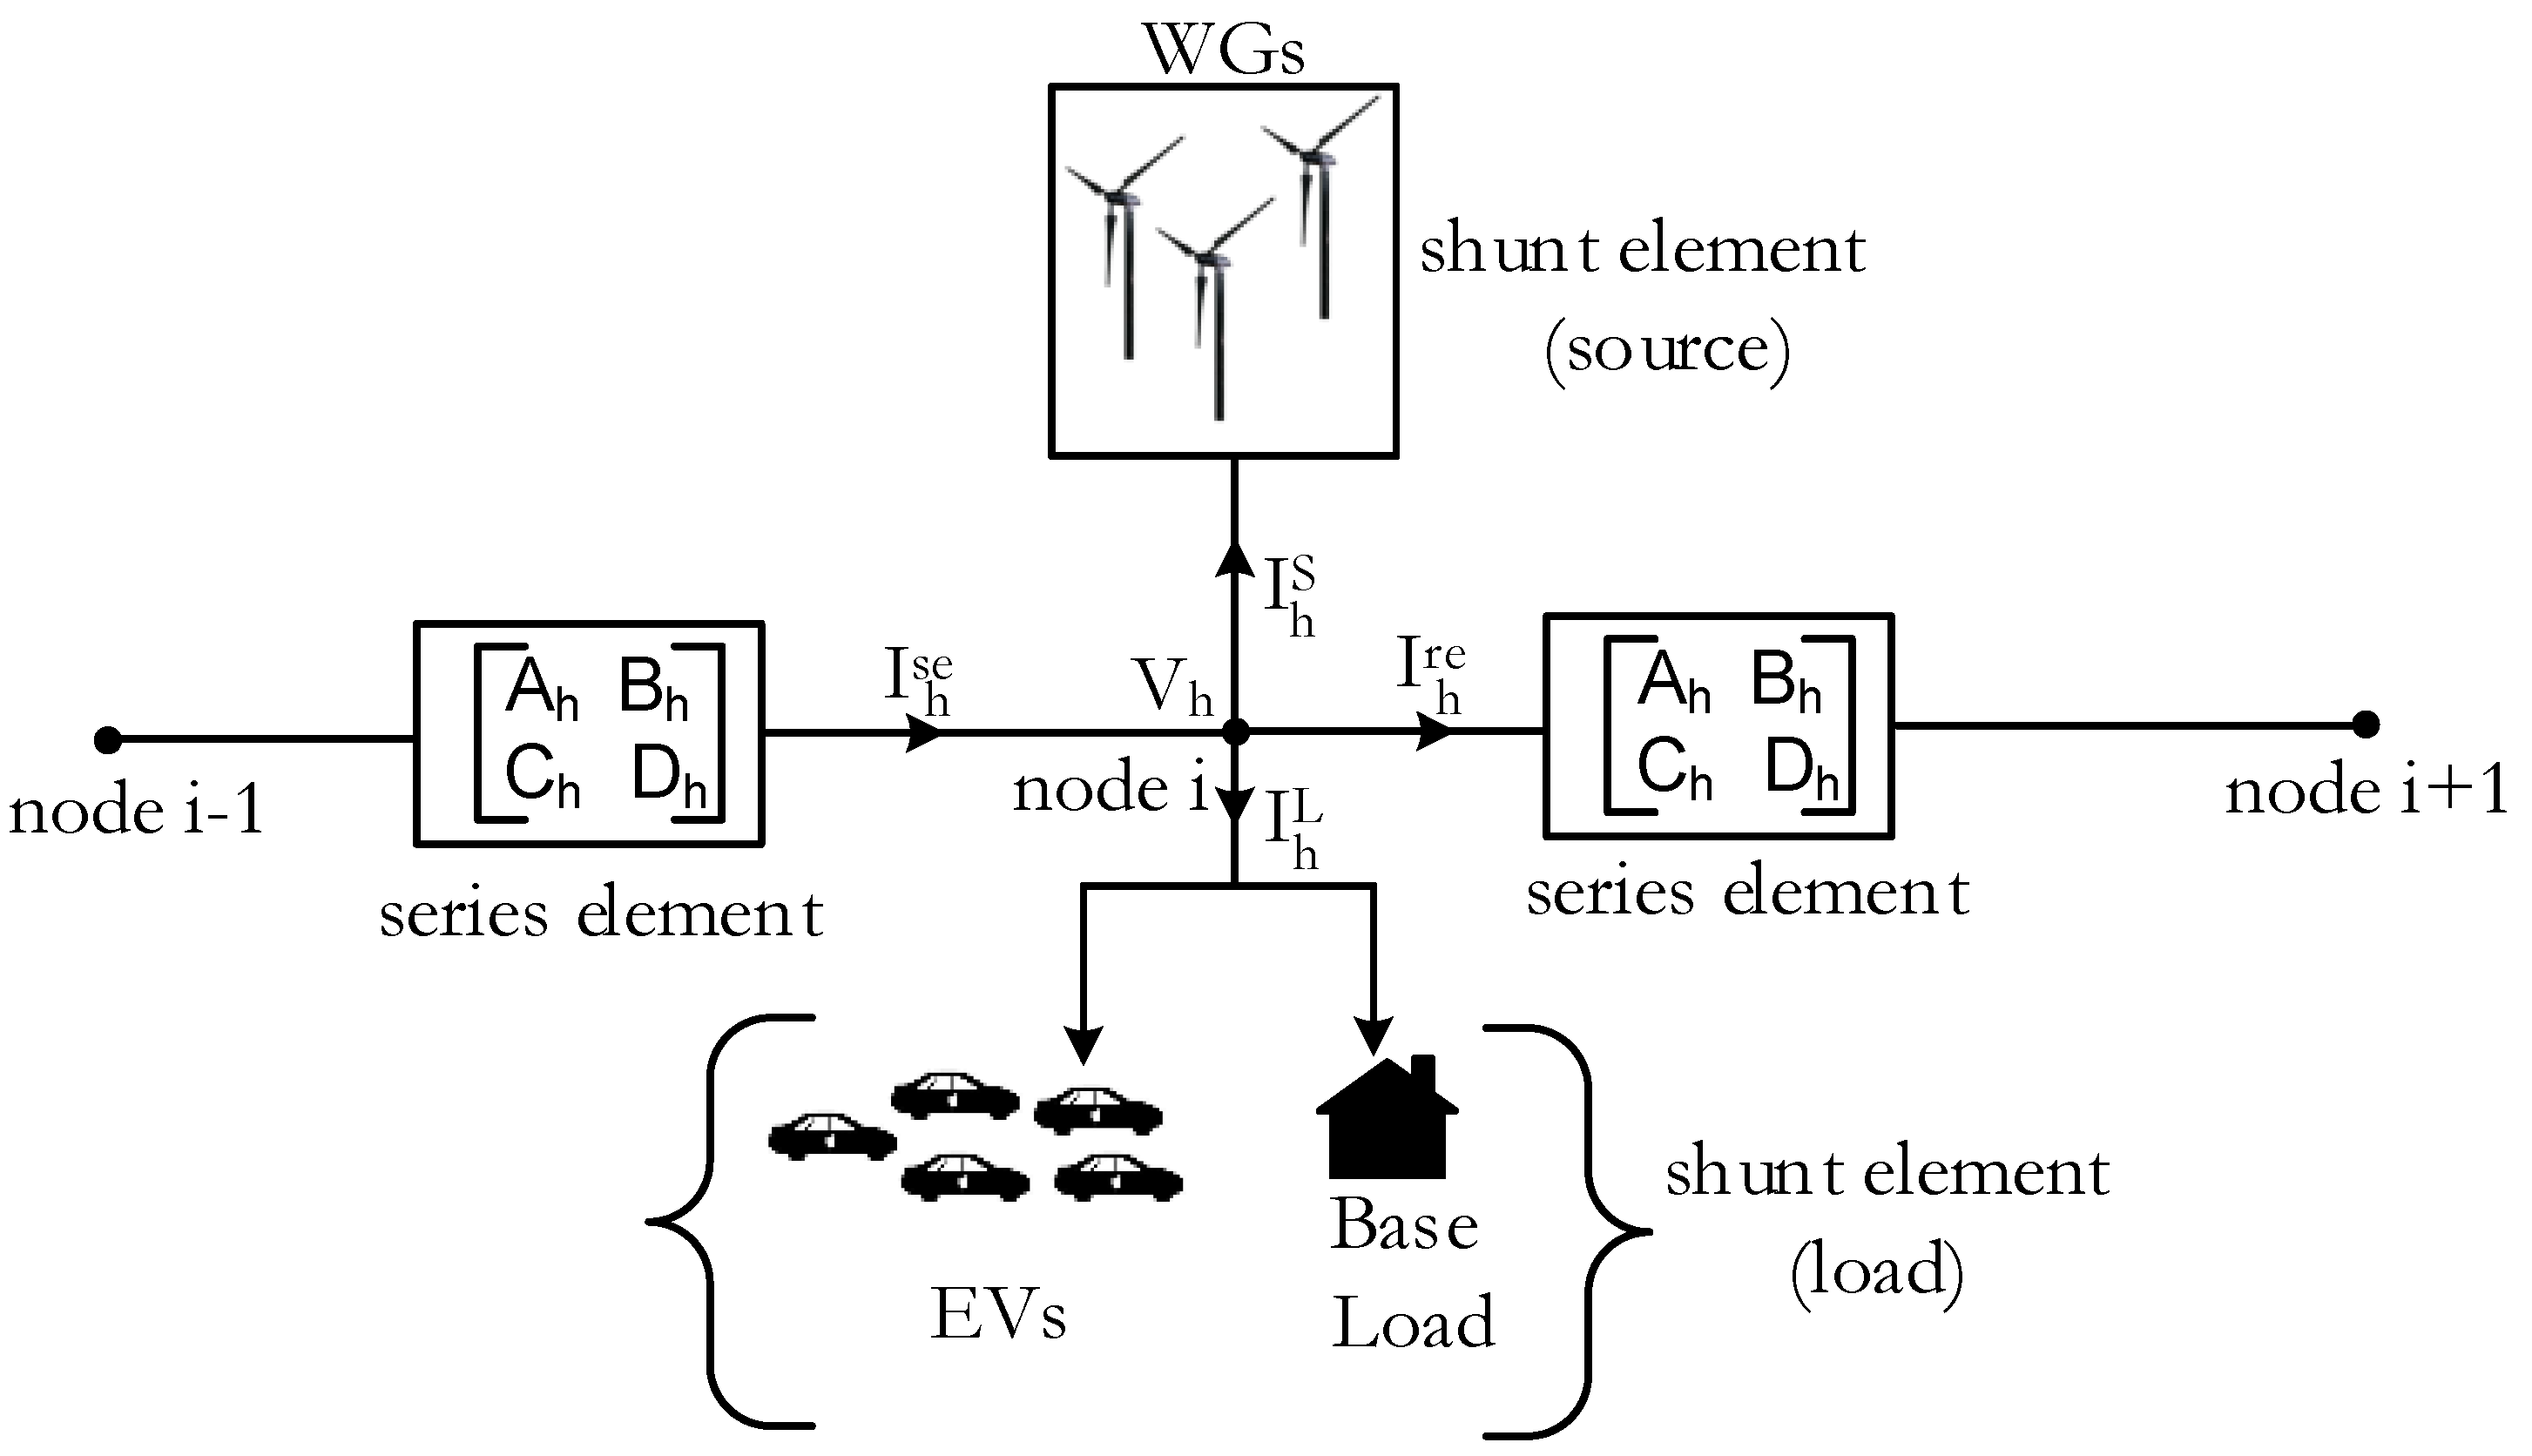
  • To develop a three-phase unbalanced distribution system model required for harmonic power flow (HPF) studies. The model is used to study the impact of EVs on voltage and current THDs in distribution system with varying degree of penetration. The same model is used to demonstrate that careful dispatch of WGs can help to reduce the harmonic distortions caused by the EVs.
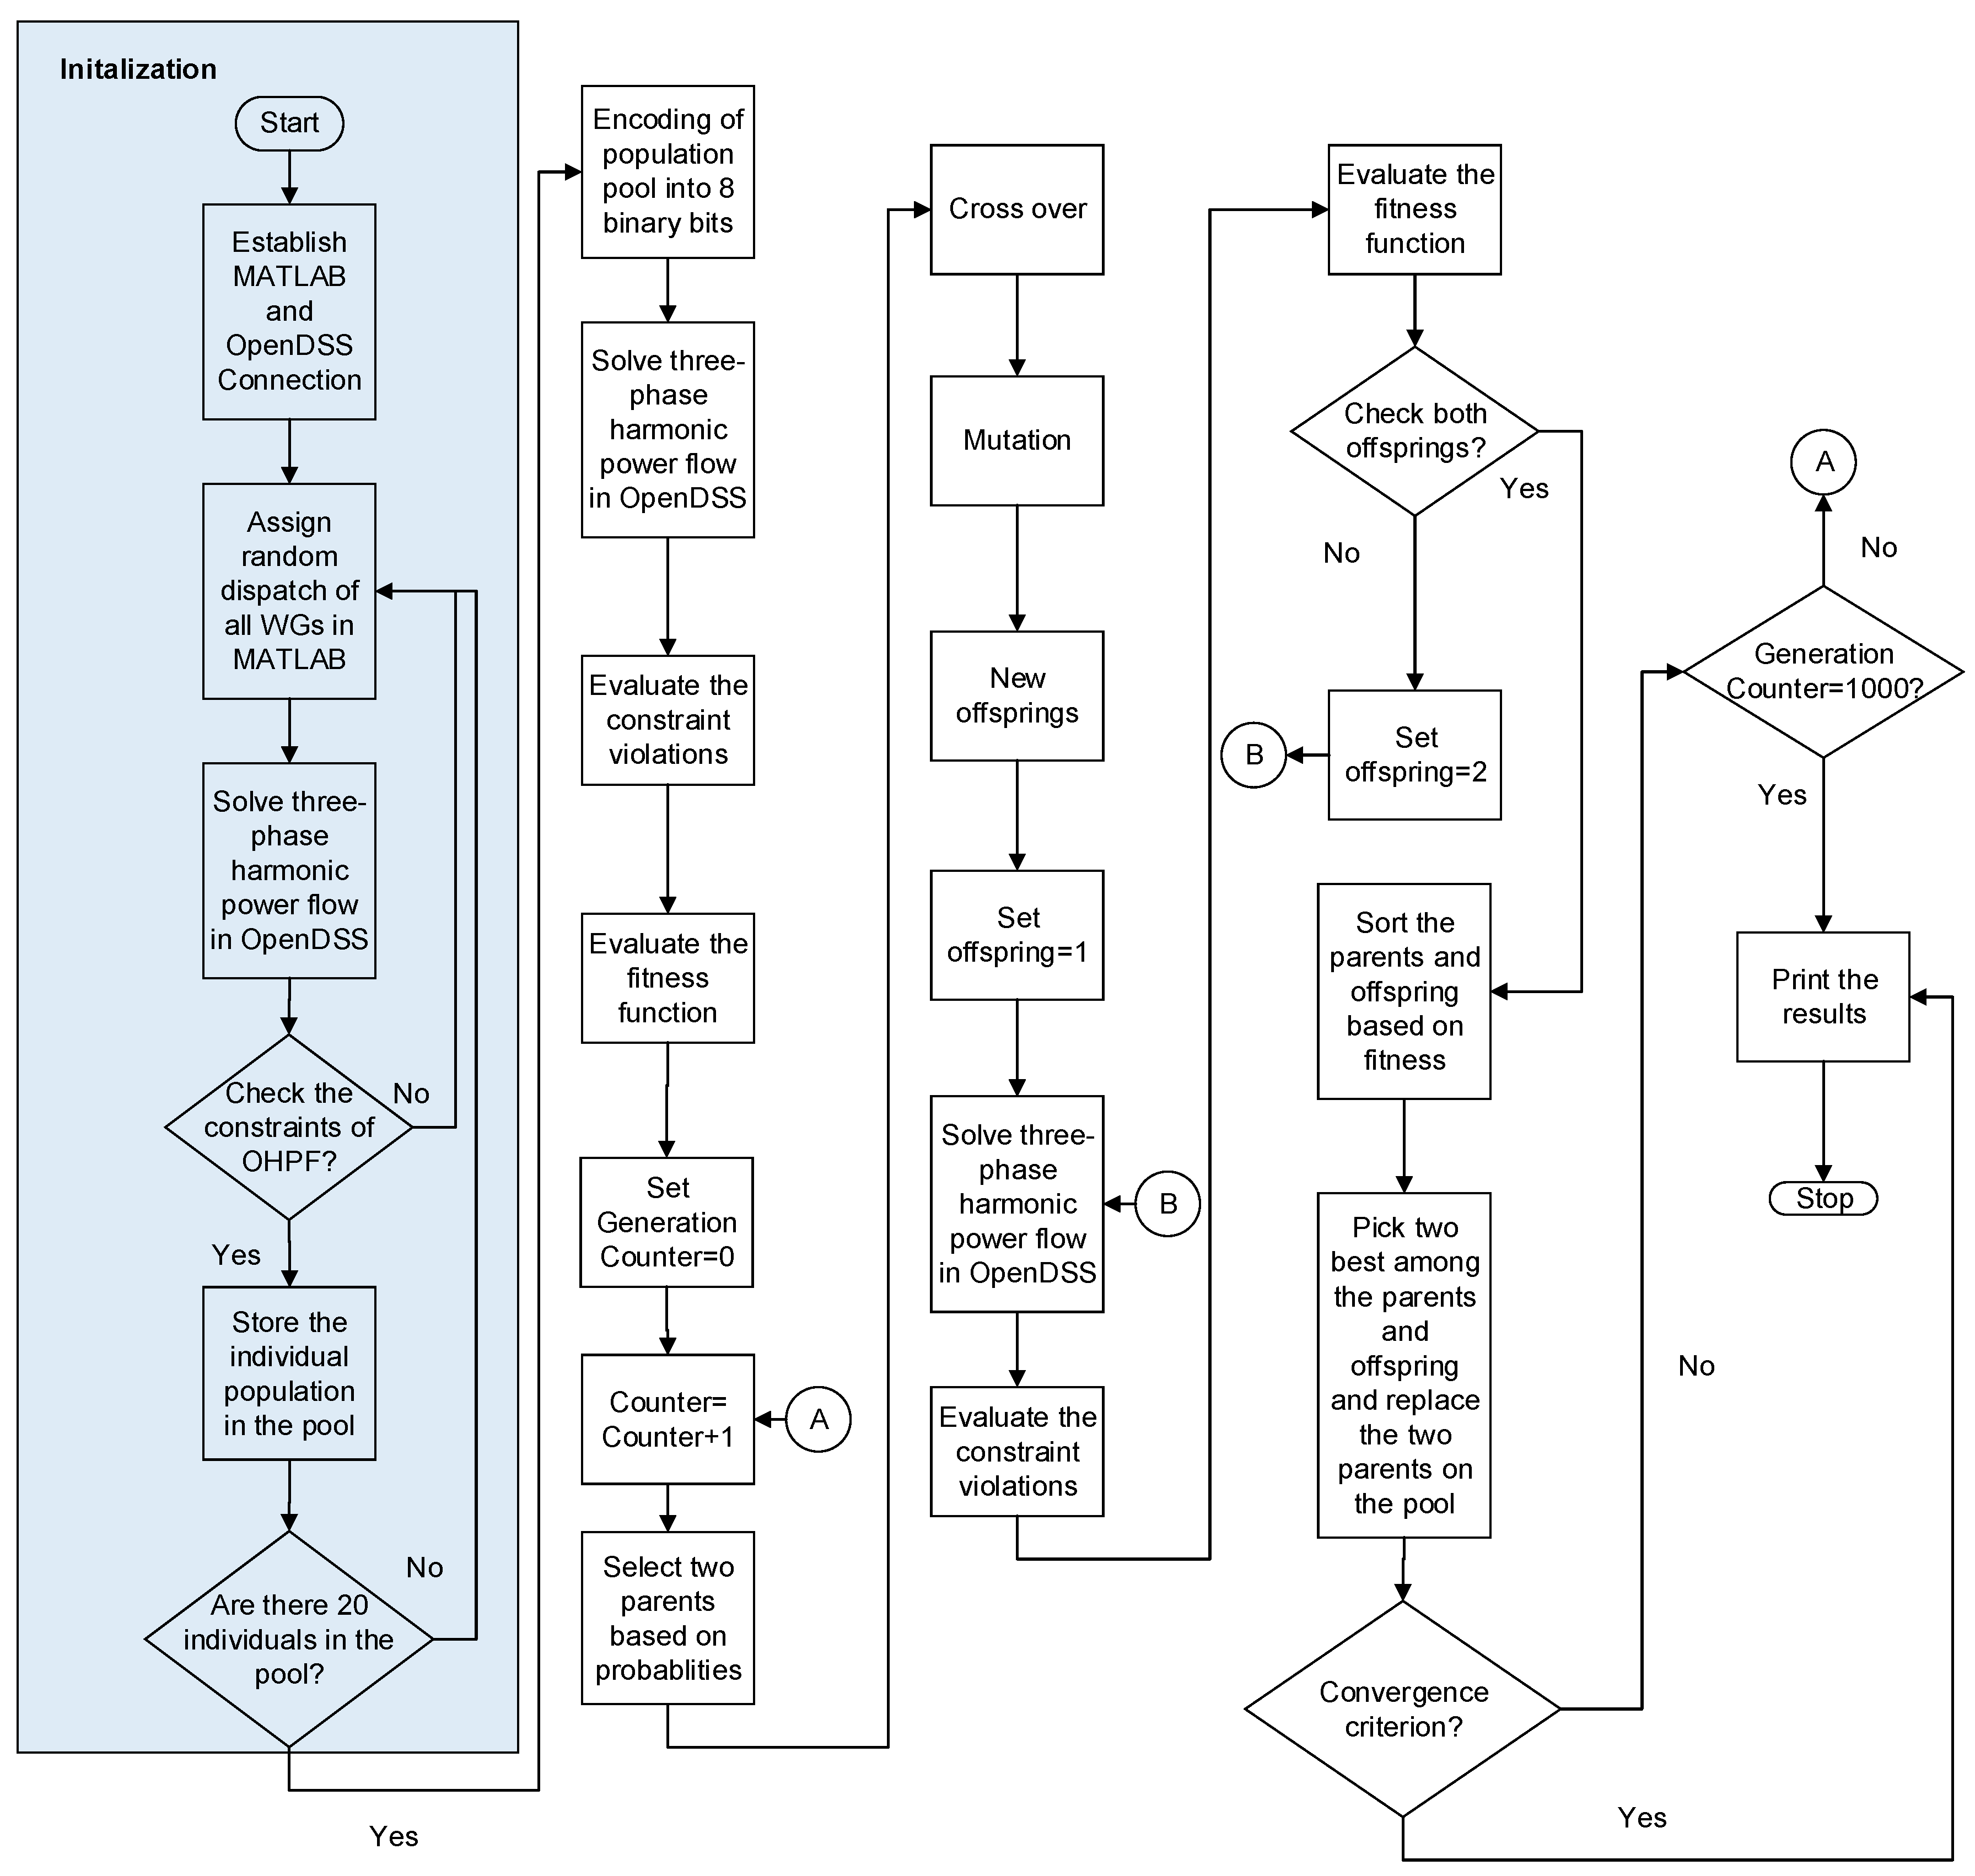
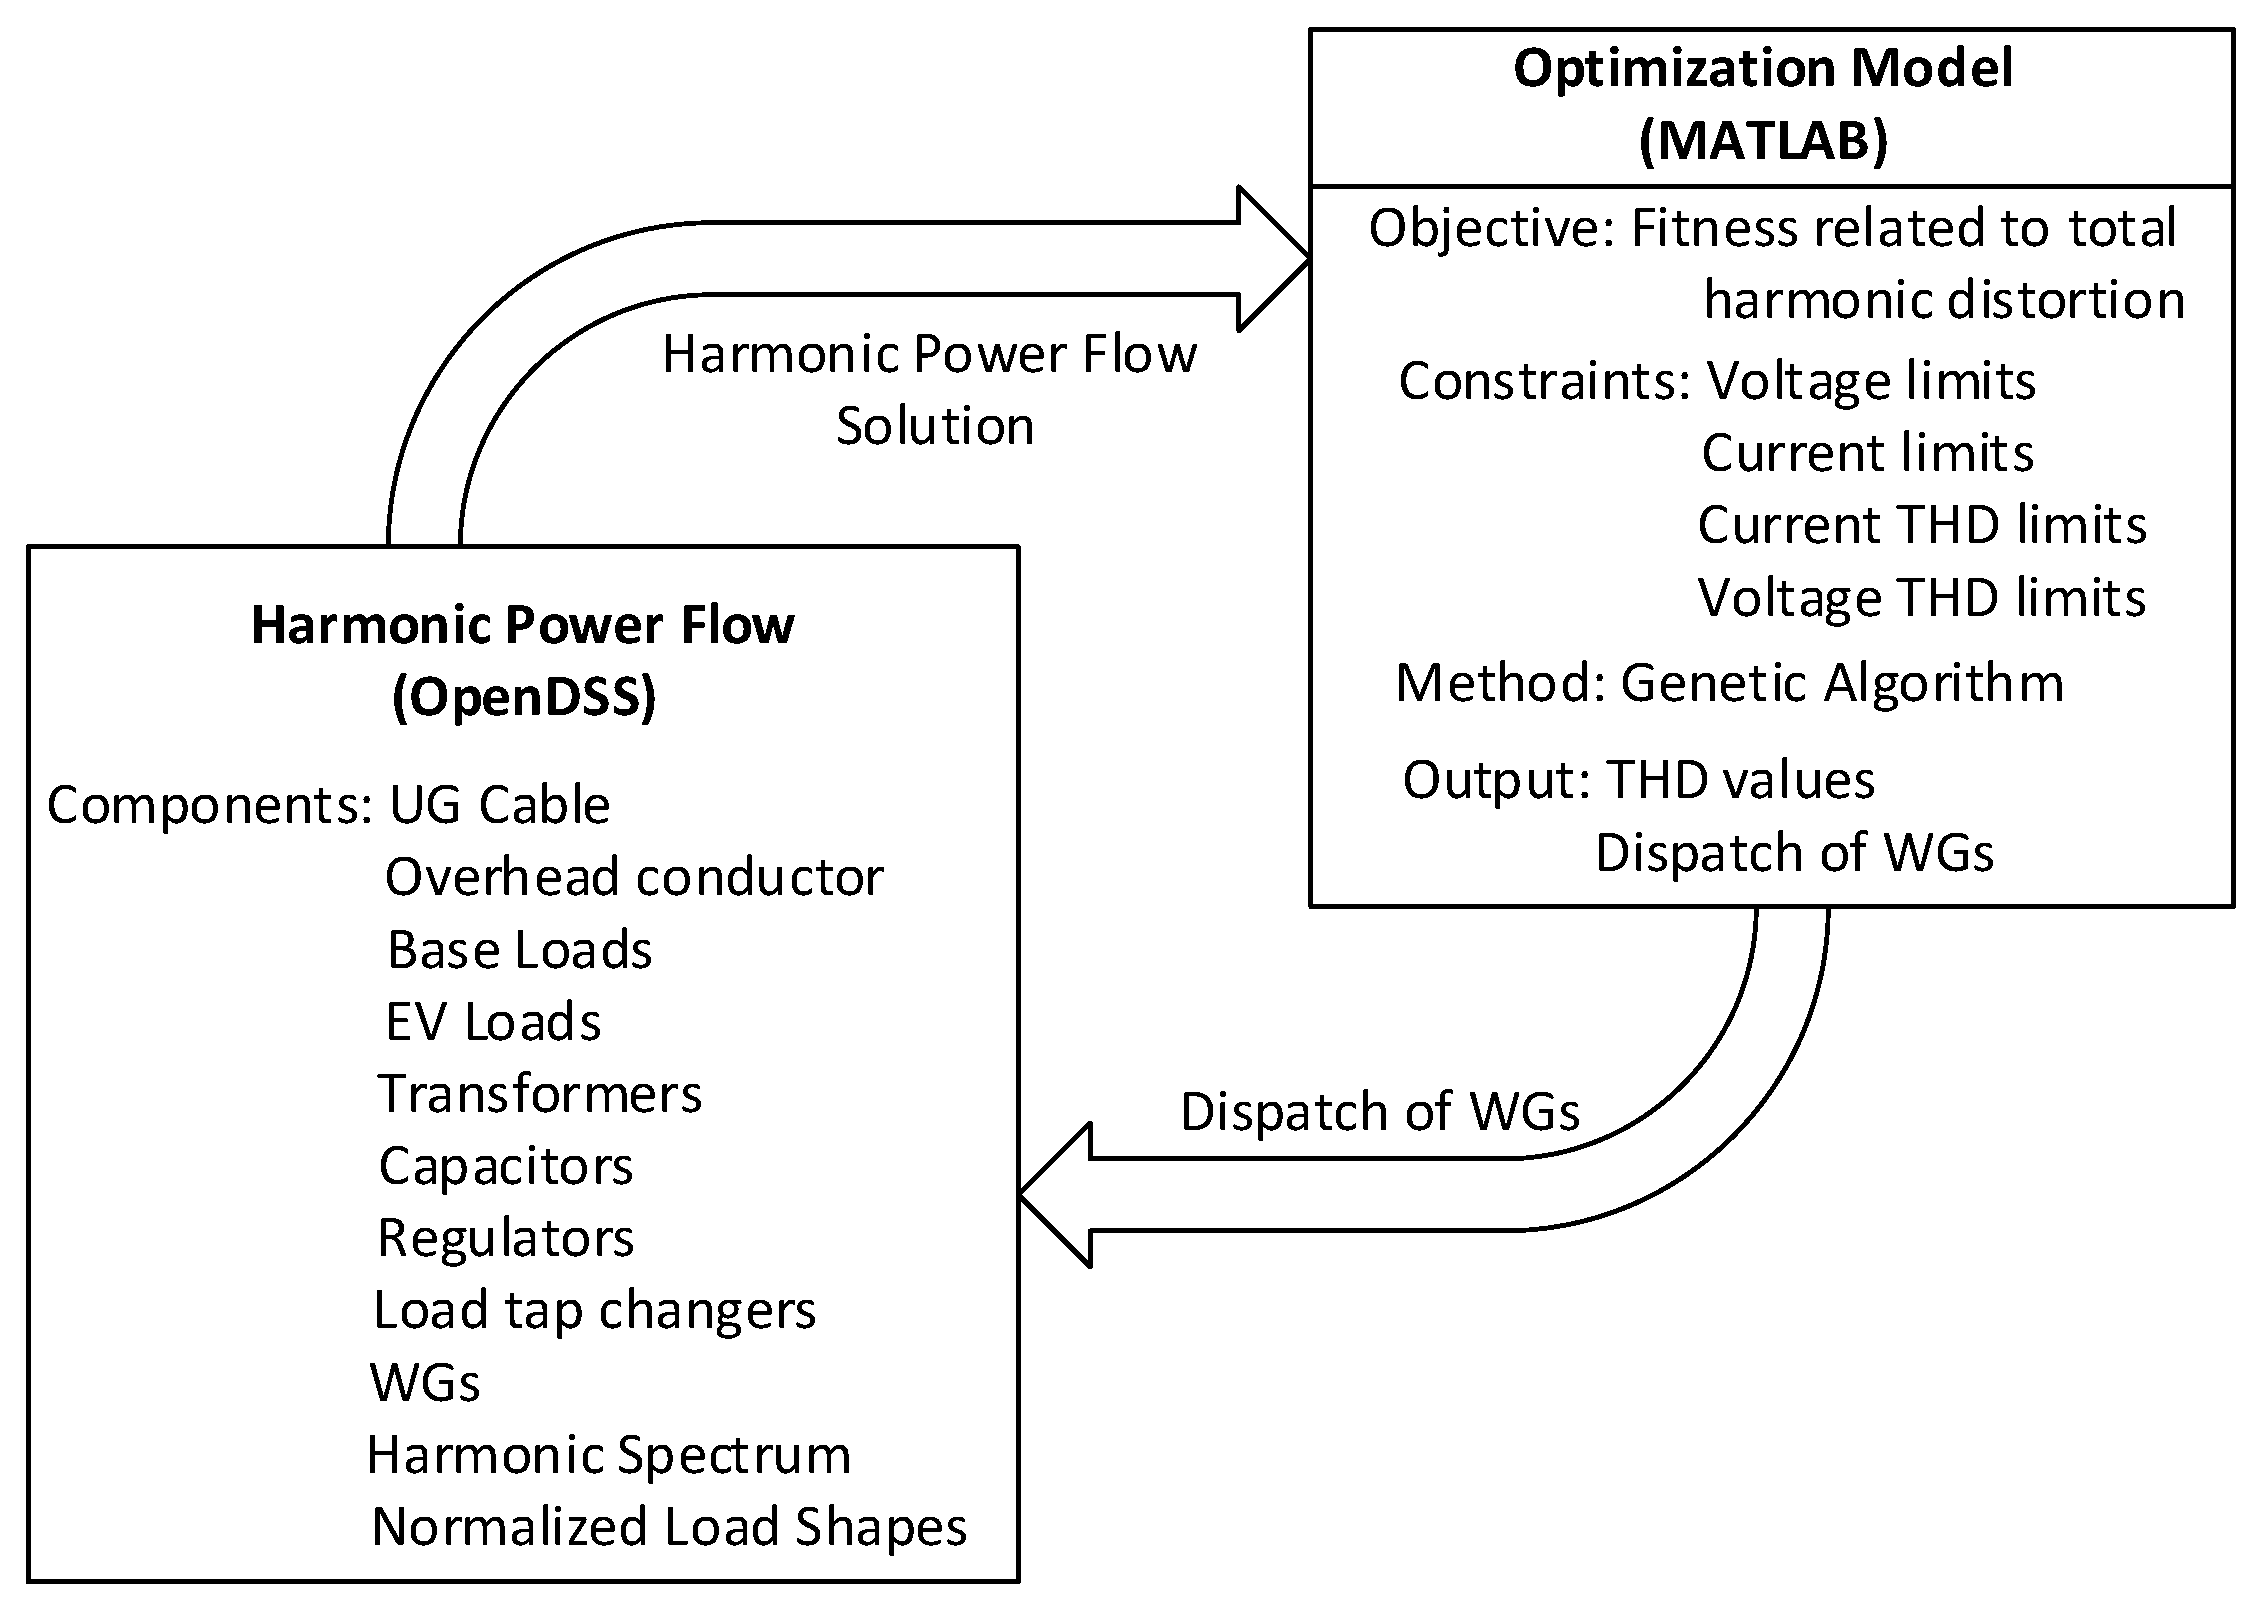
  • To develop optimal harmonic power flow (OHPF) model that utilizes previous HPF model as constraints and WGs as decision variables, and solution method based on GA. The model is then used to find optimal dispatch WGs that will reduce the voltage or current THDs in the distribution circuit with varying penetration level of the EVs.
The rest of the paper is organized as follows: Section 2 describes the HPF and and OHPF models. Section 3 presents the solution approach. Section 4 discusses impact of low and high EV penetration on IEEE 34-node distribution test feeder. The results of the OHPF is presented in the Section 5. A summary of the presented work is discussed in Section 6.

2. Modeling

The mathematical modeling of HPF and OHPF are discussed next.

2.1. Harmonic Power Flow (HPF) Model

For the harmonic power flow calculation, harmonic decoupled approach is considered as in [20,21,22]. Figure 2 shows the connection of series and shunt elements, which is the basis of building the harmonic power flow (HPF) model.
At harmonic frequencies, the system is modeled using passive elements and harmonic current sources. The impedance of the conductors, cables, and transformers are modified based on the frequencies of interest following the models explained in [23]. The following frequency dependent A , B , C , D parameter matrices derived from the line parameters are used to relate sending and receiving end voltages and currents similar to [24],
V i , p , h I s e , j , p , h = A j , p , h B j , p , h C j , p , h D j , p , h V i + 1 , p , h I r e , j , p , h j , p , h
where subscripts i, j, p, s e , r e , h represent node, branch connecting node i and i + 1 , phase, sending end, receiving end, and harmonic frequency, respectively. V and I represent three-phase complex voltages and currents, respectively.
The A , B , C , D parameter matrices of conductors, cables, transformers are not time varying except for the transformer load tap changers (LTCs). A , B , C , D matrices for the LTCs depend on the tap position, which can be written as,
A j l , p , h = 1 + Δ S t a p j l 0 0 0 1 + Δ S t a p j l 0 0 0 1 + Δ S t a p j l j l , p , h
B j l , p , h = C j l , p , h = 0 j l , p , h
D j l , p , h = A j l , p , h 1 j l , p , h
where j l j represents the LTC branches and t a p [ 16 , 16 ] represents tap position. Δ S represents per unit voltage change due to one tap position. In Equation (2), the t a p is assumed the same for all phases and is also independent of the frequency of interest.
In this study, only the constant current model is considered, i.e., harmonic loads are modeled as constant current withdrawals and harmonic sources are modeled as constant current sources. This can be represented by the following equations,
| I i l , p , h L | V i l , p , h I i l , p , h L = | I o i l , p , h L | θ i l , p , h L i l , p , h
| I i s , p , h S | V i s , p , h I i s , p , h S = | I o i s , p , h S | θ i s , p , h S i s , p , h
where i l i represents node in distribution feeder where loads are connected. Similarly, i s i represents node where sources are connected. I L and I S represent harmonic load and source current, respectively. I o L represents magnitude of harmonic load current at nominal voltage and θ L represents power factor angle of harmonic load. Similarly, I o S represents magnitude of harmonic source current at nominal voltage and θ S represents power factor angle of harmonic source.
At each node, phase, and for each harmonic frequency a current balance equation is used as following,
I s e , j , p , h = I r e , j , p , h + I i , p , h L + I i , p , h S i , p , h
where i l i represents node in distribution feeder where loads are connected. Equations (1)–(7) represent harmonic power flow model.

2.2. Optimal Harmonic Power Flow (OHPF) Model

An optimal harmonic power flow model is developed based on the HPF model. Minimization of cumulative voltage and current THDs is considered as the objective of the OHPF model. The cumulative THDs account for sum of voltage and current THDs at each node and phase of the distribution circuit, which can be expressed as,
Min i p T H D i , p V + i p T H D i , p I
where T H D V and T H D I represent voltage and current THDs, respectively. Voltage and current THDs in (8) can be computed from the nodal current and voltage information as [17],
T H D i , p V = h = 2 13 | V i , p , h | 2 1 2 | V i , p , h = 1 | i , p
T H D i , p I = h = 2 13 | I i , p , h | 2 1 2 | I i , p , h = 1 | i , p
The THD limits prescribed by the IEEE [16] can be represented as,
T H D i , p V T H D m a x V i , p
T H D i , p I T H D m a x I i , p
The OHPF model consists of the objective function given in (8), equality constraints (1)–(7), (9), (10), and inequality constraints (11) and (12). Other inequality constraints which represent nodal voltage and branch current limits are also considered in the modelling.

3. Solution Approach

The HPF model is developed in OpenDSS. A standard genetic algorithm (GA) based solution method [25] is developed in MATLAB and interfaced with the OpenDSS (see Figure 3) to solve OHPF. The GA code in MATLAB uses OpenDSS as function whenever HPF needs to be run in the OHPF model. In the MATLAB script, the inequality constraints of the OHPF are evaluated. The fitness function of the GA is comprised of the objective function in (8) and the summation of constraint violations of the OHPF model. Figure 4 provides flow chart of the solution approach. Key settings of the GA are: 8-bit representation; Population pool = 20; Max. Generations = 1000; Mutation probability = 1%; Convergence criterion 0.1 % relative change in the fitness value on two consecutive GA generations; single-point cross over after the 5th bit.

4. Impact of EV Penetration on THD

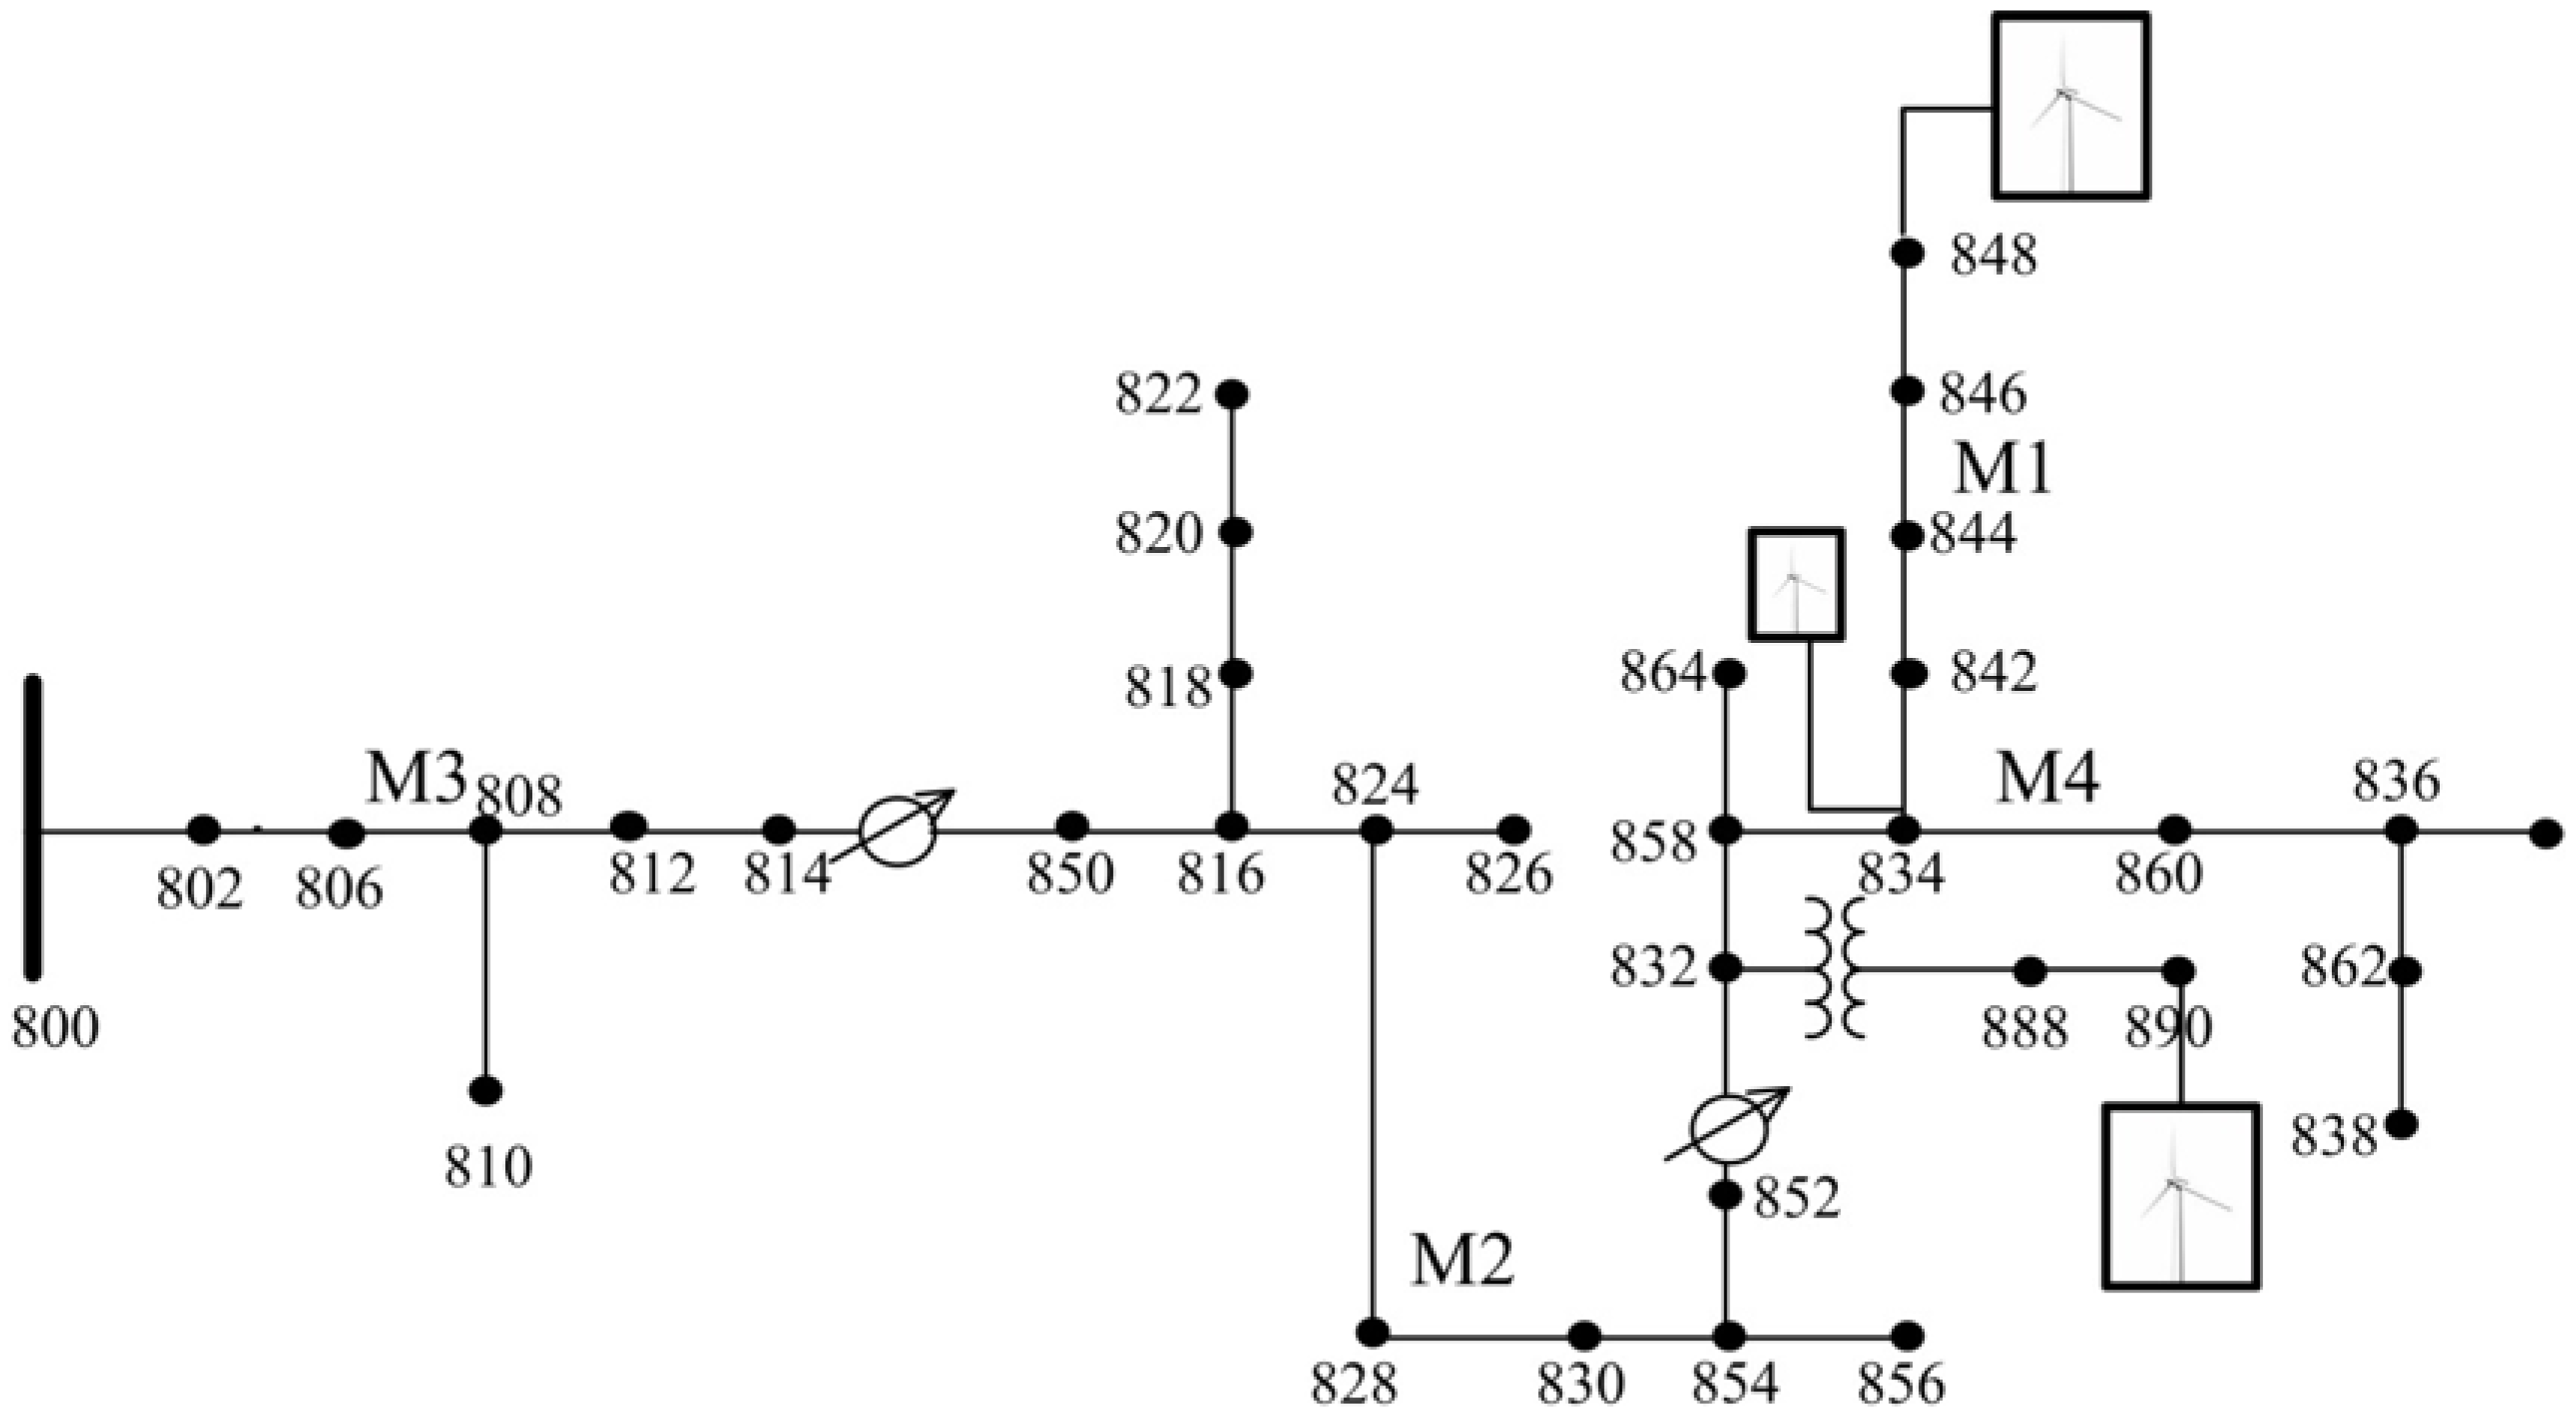
To demonstrate the impact of EV on THD, IEEE 34-node test feeder is considered. Level-2 charging infrastructure is assumed with a socket rating of 8.8 kW. The number of EVs is calculated based on the 30% residential load mix in the aggregated load profile (base load), the average residential monthly energy of 1500 kWh and average hourly electricity load of 2.0833 kW [2]. EV current harmonic profiles are obtained from [17,18] and are listed in Table 1. Wind generator current harmonic profiles are obtained from [19], which are listed in Table 2.
First, an uncoordinated EV-WG system is studied with low EV penetration, i.e., 30%. In the Case-1, only base loads and the EV loads are considered. The system loads of the IEEE 34-node test feeder are used as base load at the fundamental frequency, i.e., 60 Hz. EVs are modeled as non-linear loads with no reactive power. For the Case-2, one WG of 2 MW is added at node 848 as shown in Figure 5. For the Case-3, two more WGs of 2 MW are added at node 834 and node 890.
Table 3 lists voltage THDs obtained (for selective feeder sections) from the three case studies with low EV penetration. It can be seen that THD values are subsequently low, i.e., less than 5% and are under the limits prescribed by the IEEE [16]. This implies that the lower EV penetration does not make significant impact on the voltage THDs. On the other hand, current THD values (see Table 4) are higher in feeder sections away from the substation node. With the addition of WGs, the voltage THDs are reduced at some of the feeder nodes (e.g., THD of V a b at line 844–846). This is an interesting observation that the WGs can help reduce the harmonic distortions caused by the EV charging. Similarly, with the introduction of WGs, the current THD values are also significantly reduced in the range of 1.5–4.5%.
Three more case studies are carried out with large EV penetration, i.e., 100%. Case-4 considers no WG, while Case-5 and Case-6 include 1 and 3 WGs, respectively. For 100% EV penetration, it is expected that the EV load will inject more harmonics into the system. Therefore, the current THDs are increased as high as 50% (see Table 5), which is a clear indication that harmonics distortion gets worse with increased EV penetration. The voltage THDs are reached around 9.7% (see Table 6). With the introduction of WGs, the current THDs are reduced below 8%, while the voltage THDs are reduced below 7%.
It can be inferred from the aforementioned case studies that the inclusion of WGs certainly helps to reduce the voltage/current THD values caused by the EVs. However, the positioning and sizing of the WGs make differences in the THD profile of the system. So, it would be more acceptable if the process is more systematic to bring down the THD values. To do it in a more acceptable and systematic way, in the next Section a GA based approach is used to reduce voltage and current THD in a system with EV penetration and WGs.

5. Reduction of Voltage and Current THDs

In this section, GA-based approach is used to optimally reduce the THDs by coordinated dispatch of EVs and WGs. Case studies with two EV penetration levels are discussed (low penetration of 30%, and high penetration of 100%). WGs are assumed to be connected at all nodes in the 34-node distribution feeder.
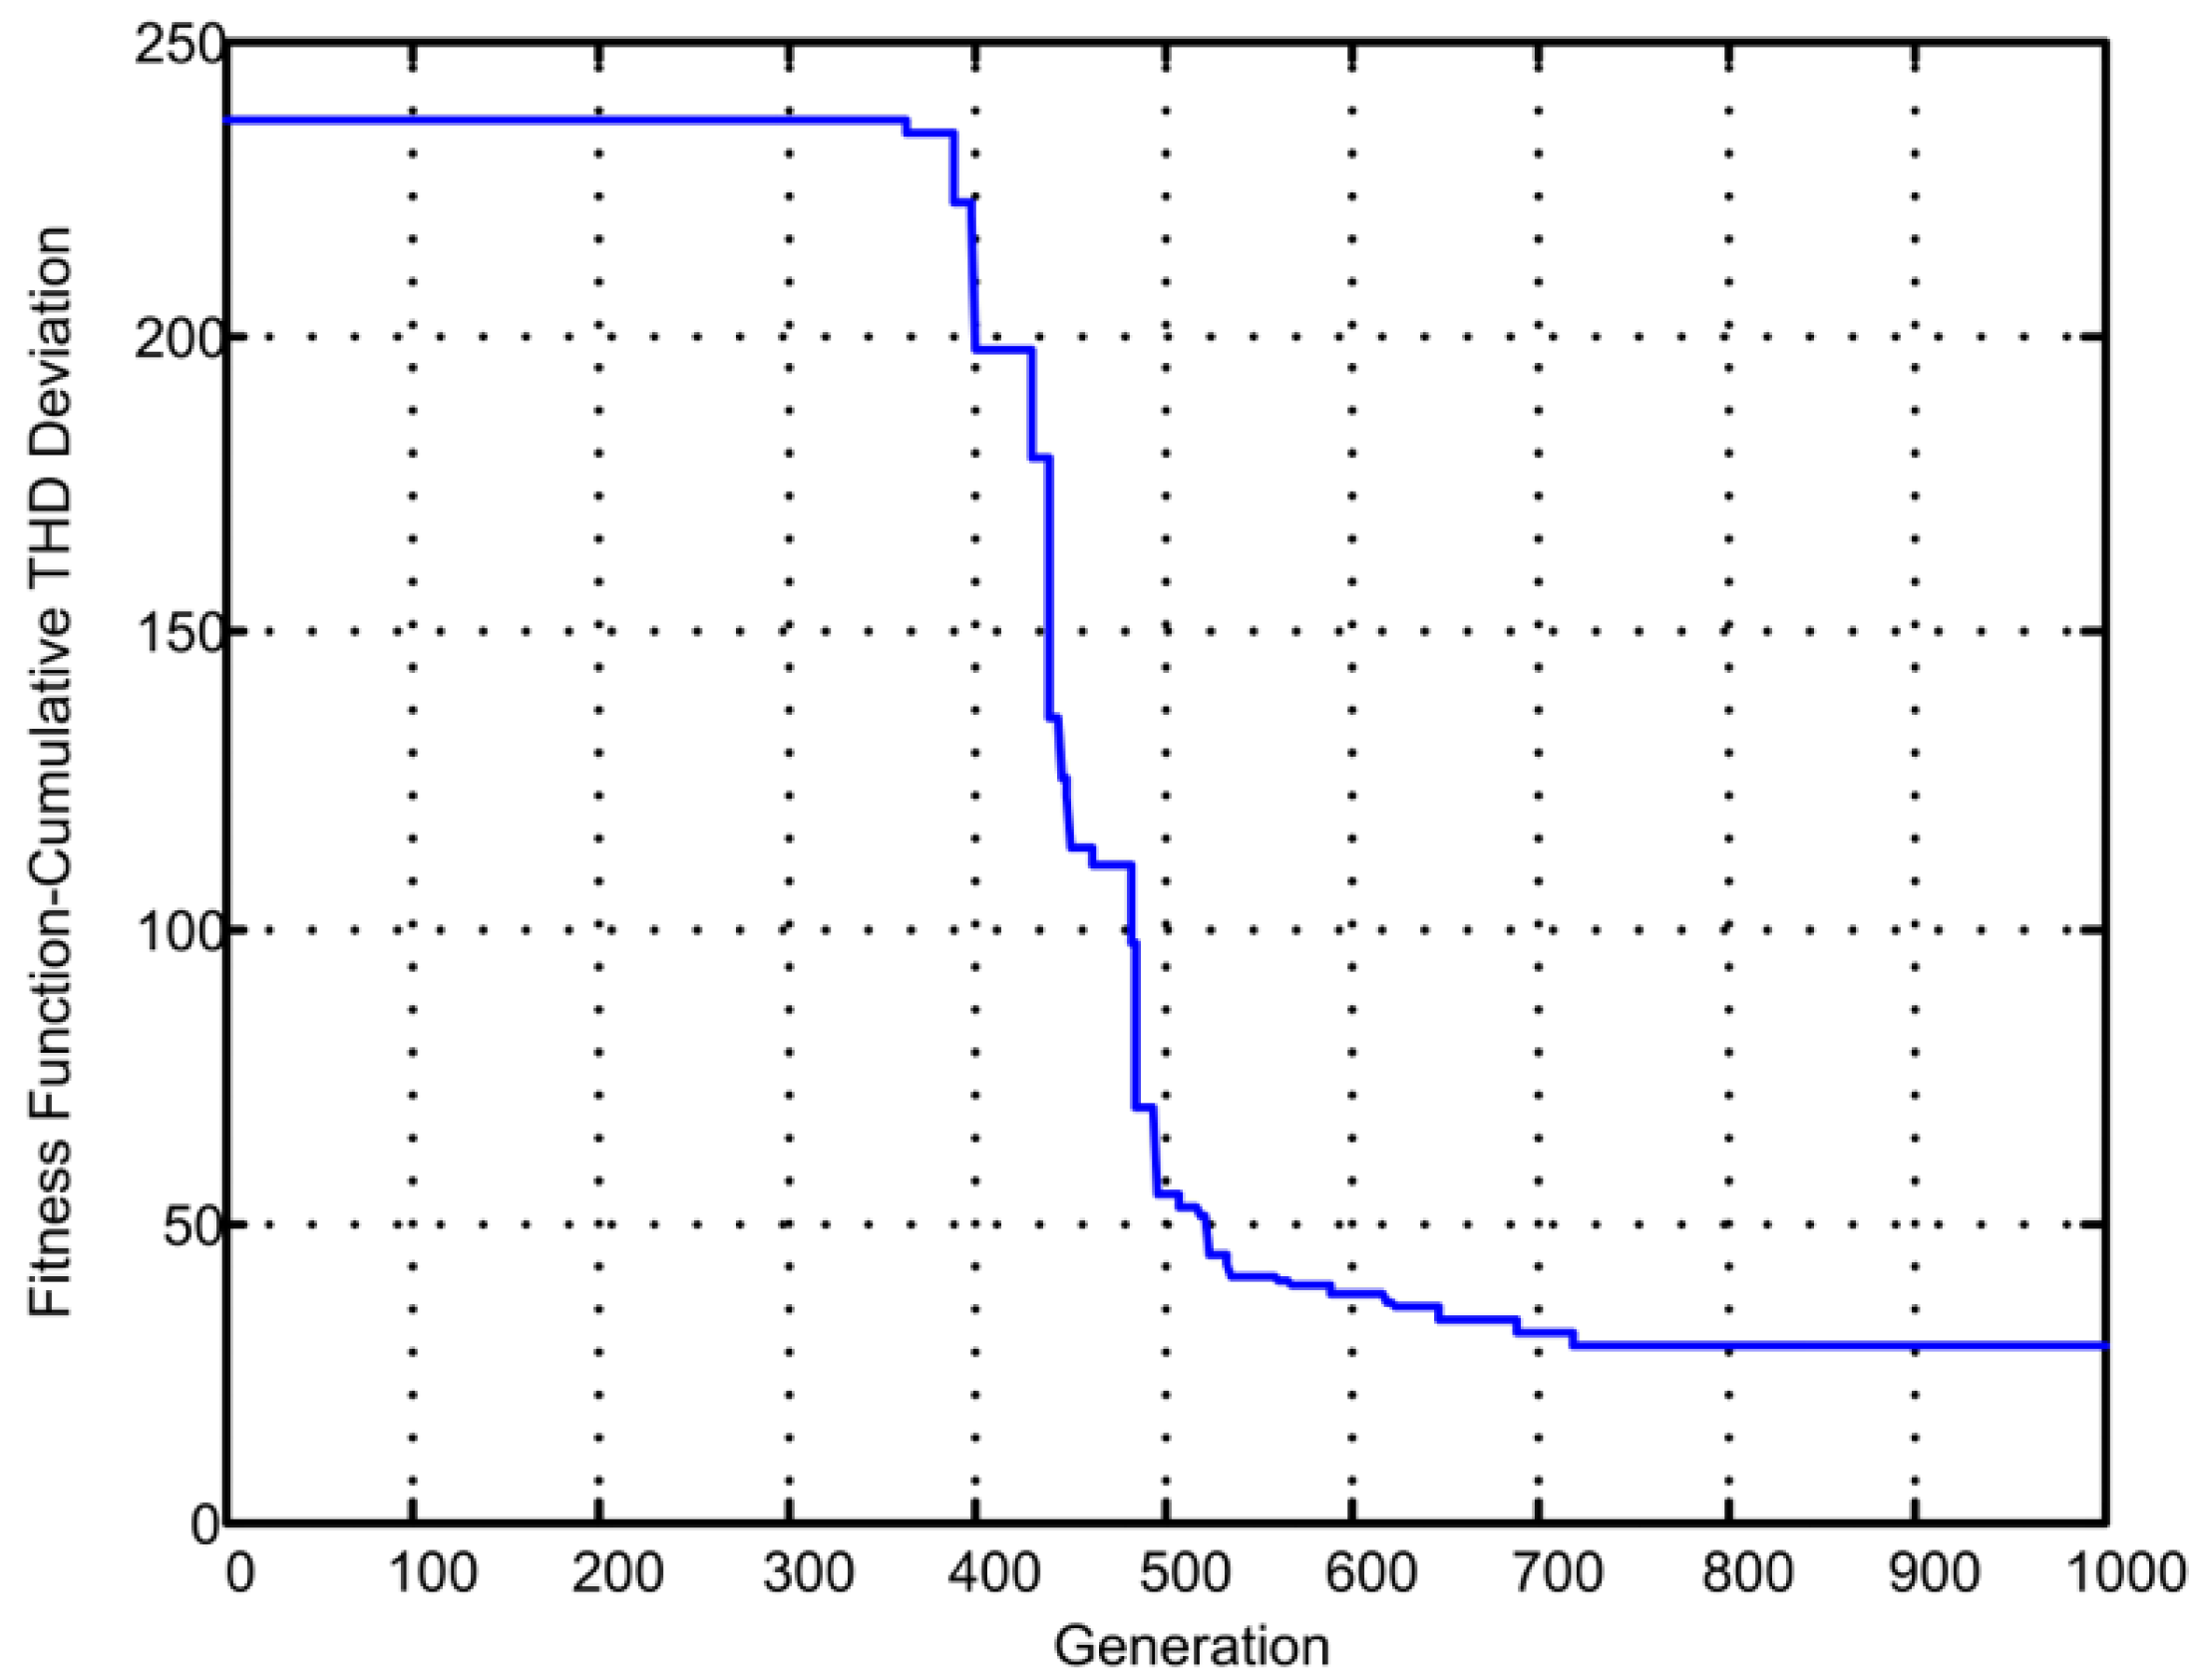
Case 7 considers 30% EV penetration and solves for optimal dispatch of WGs. The resulting voltage THDs are shown in Table 7, and the corresponding optimal dispatch of WGs are shown in Table 8. In 
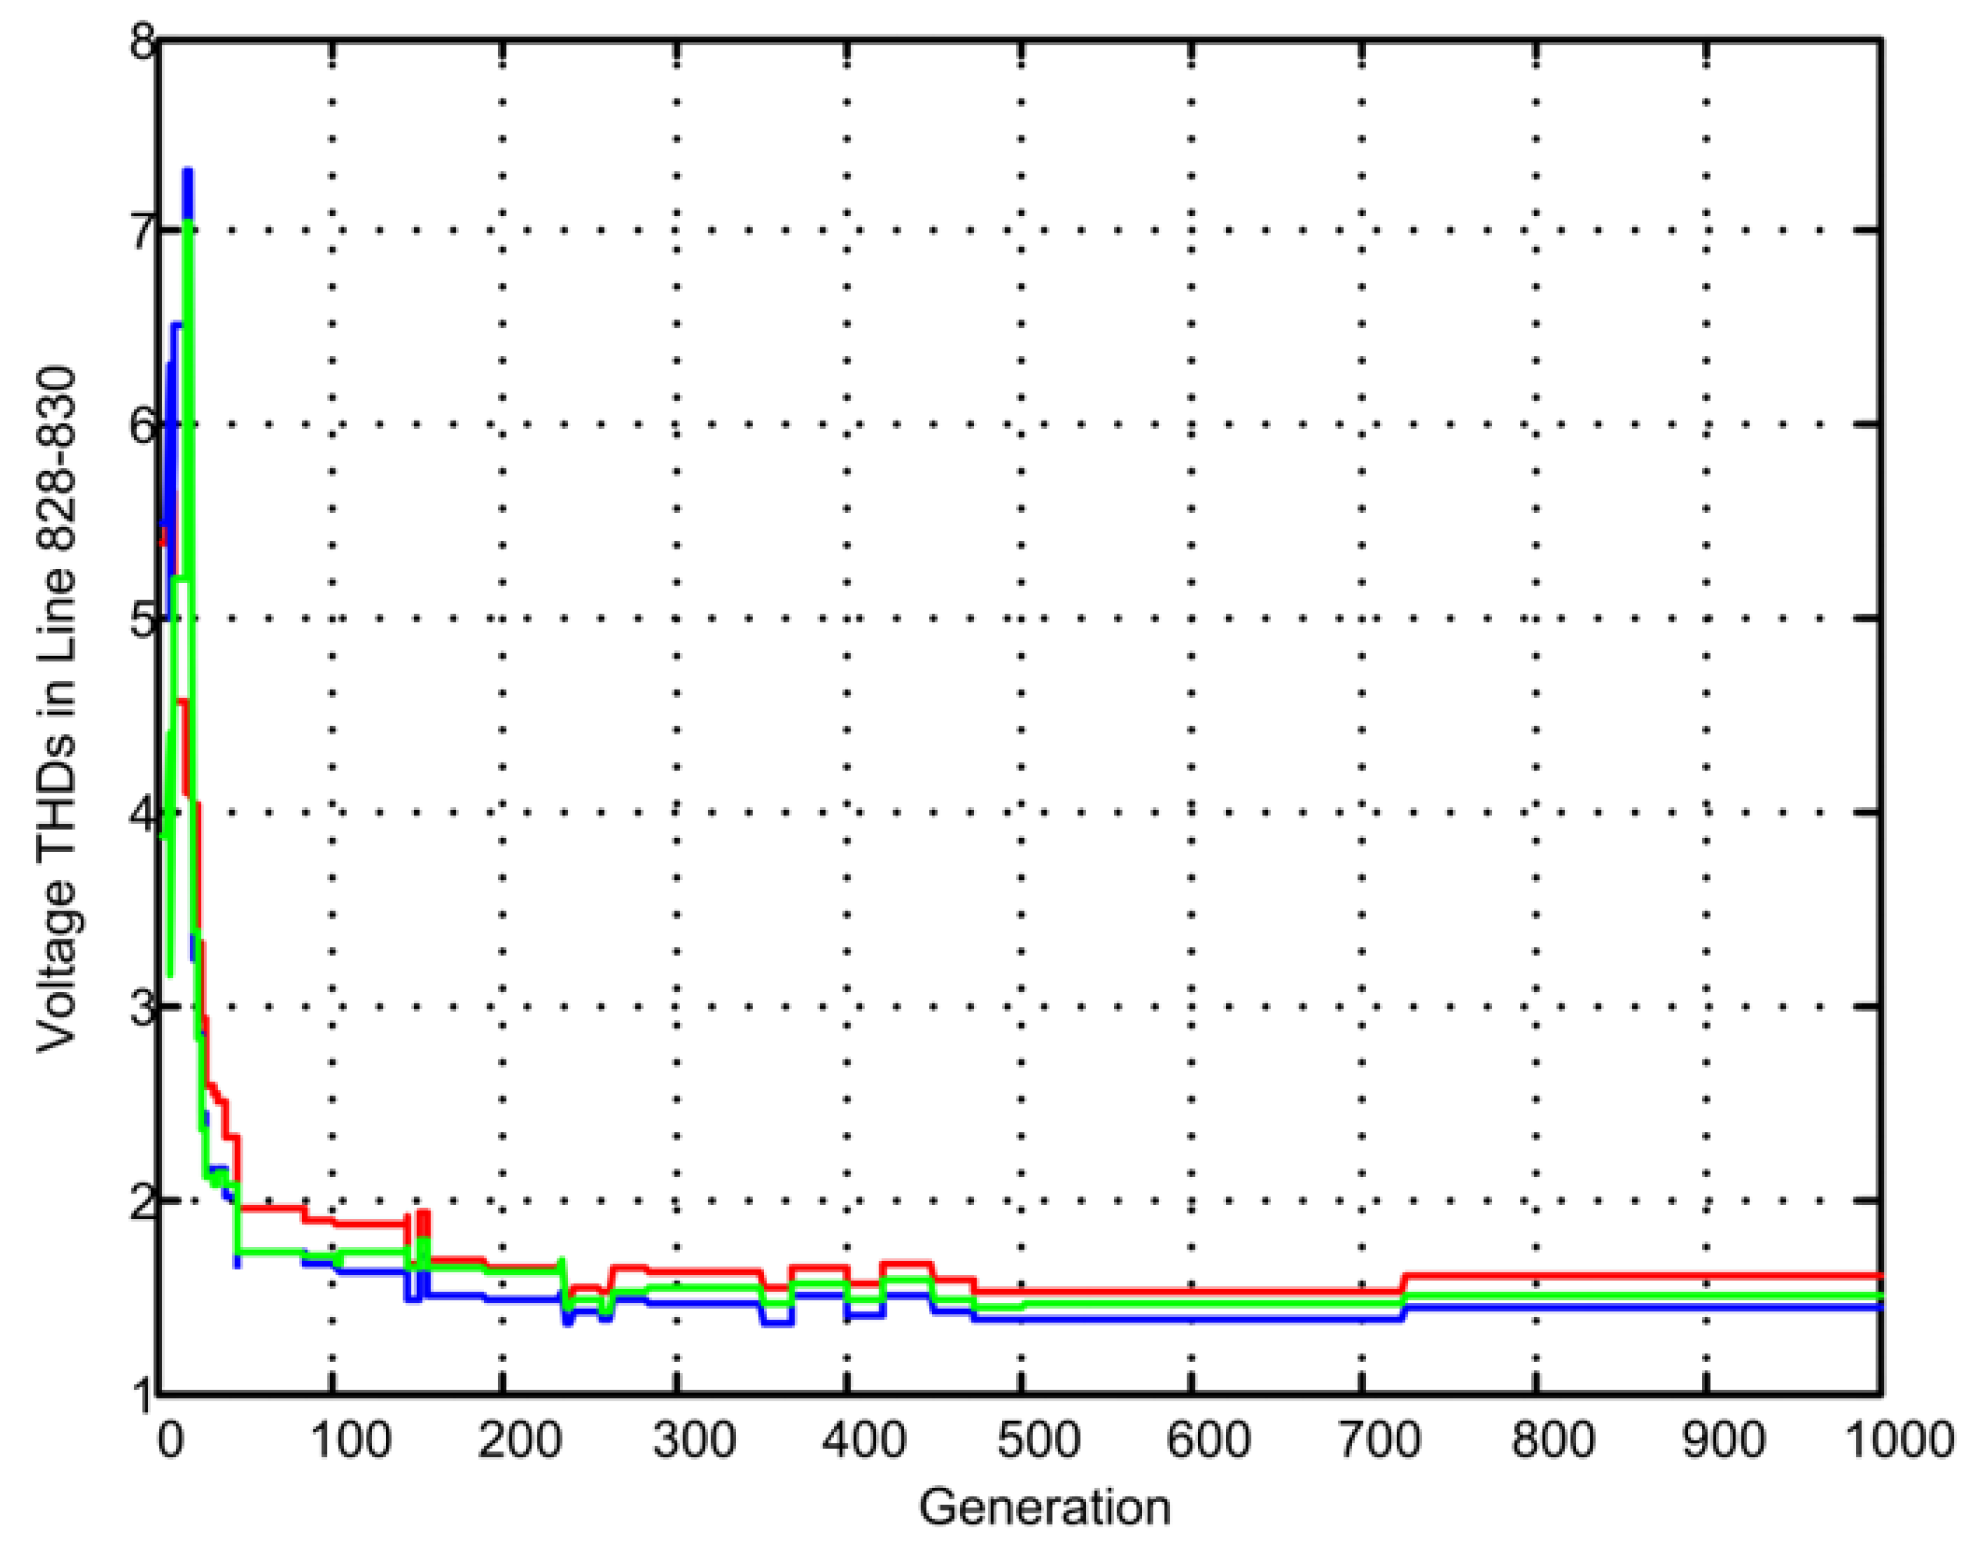
Figure 6, the characteristics of the GA fitness function over the iteration is shown. The case studies demonstrate that the coordinated optimal dispatch of EVs and WGs significantly reduces the harmonics. The voltage THDs are below 3%.
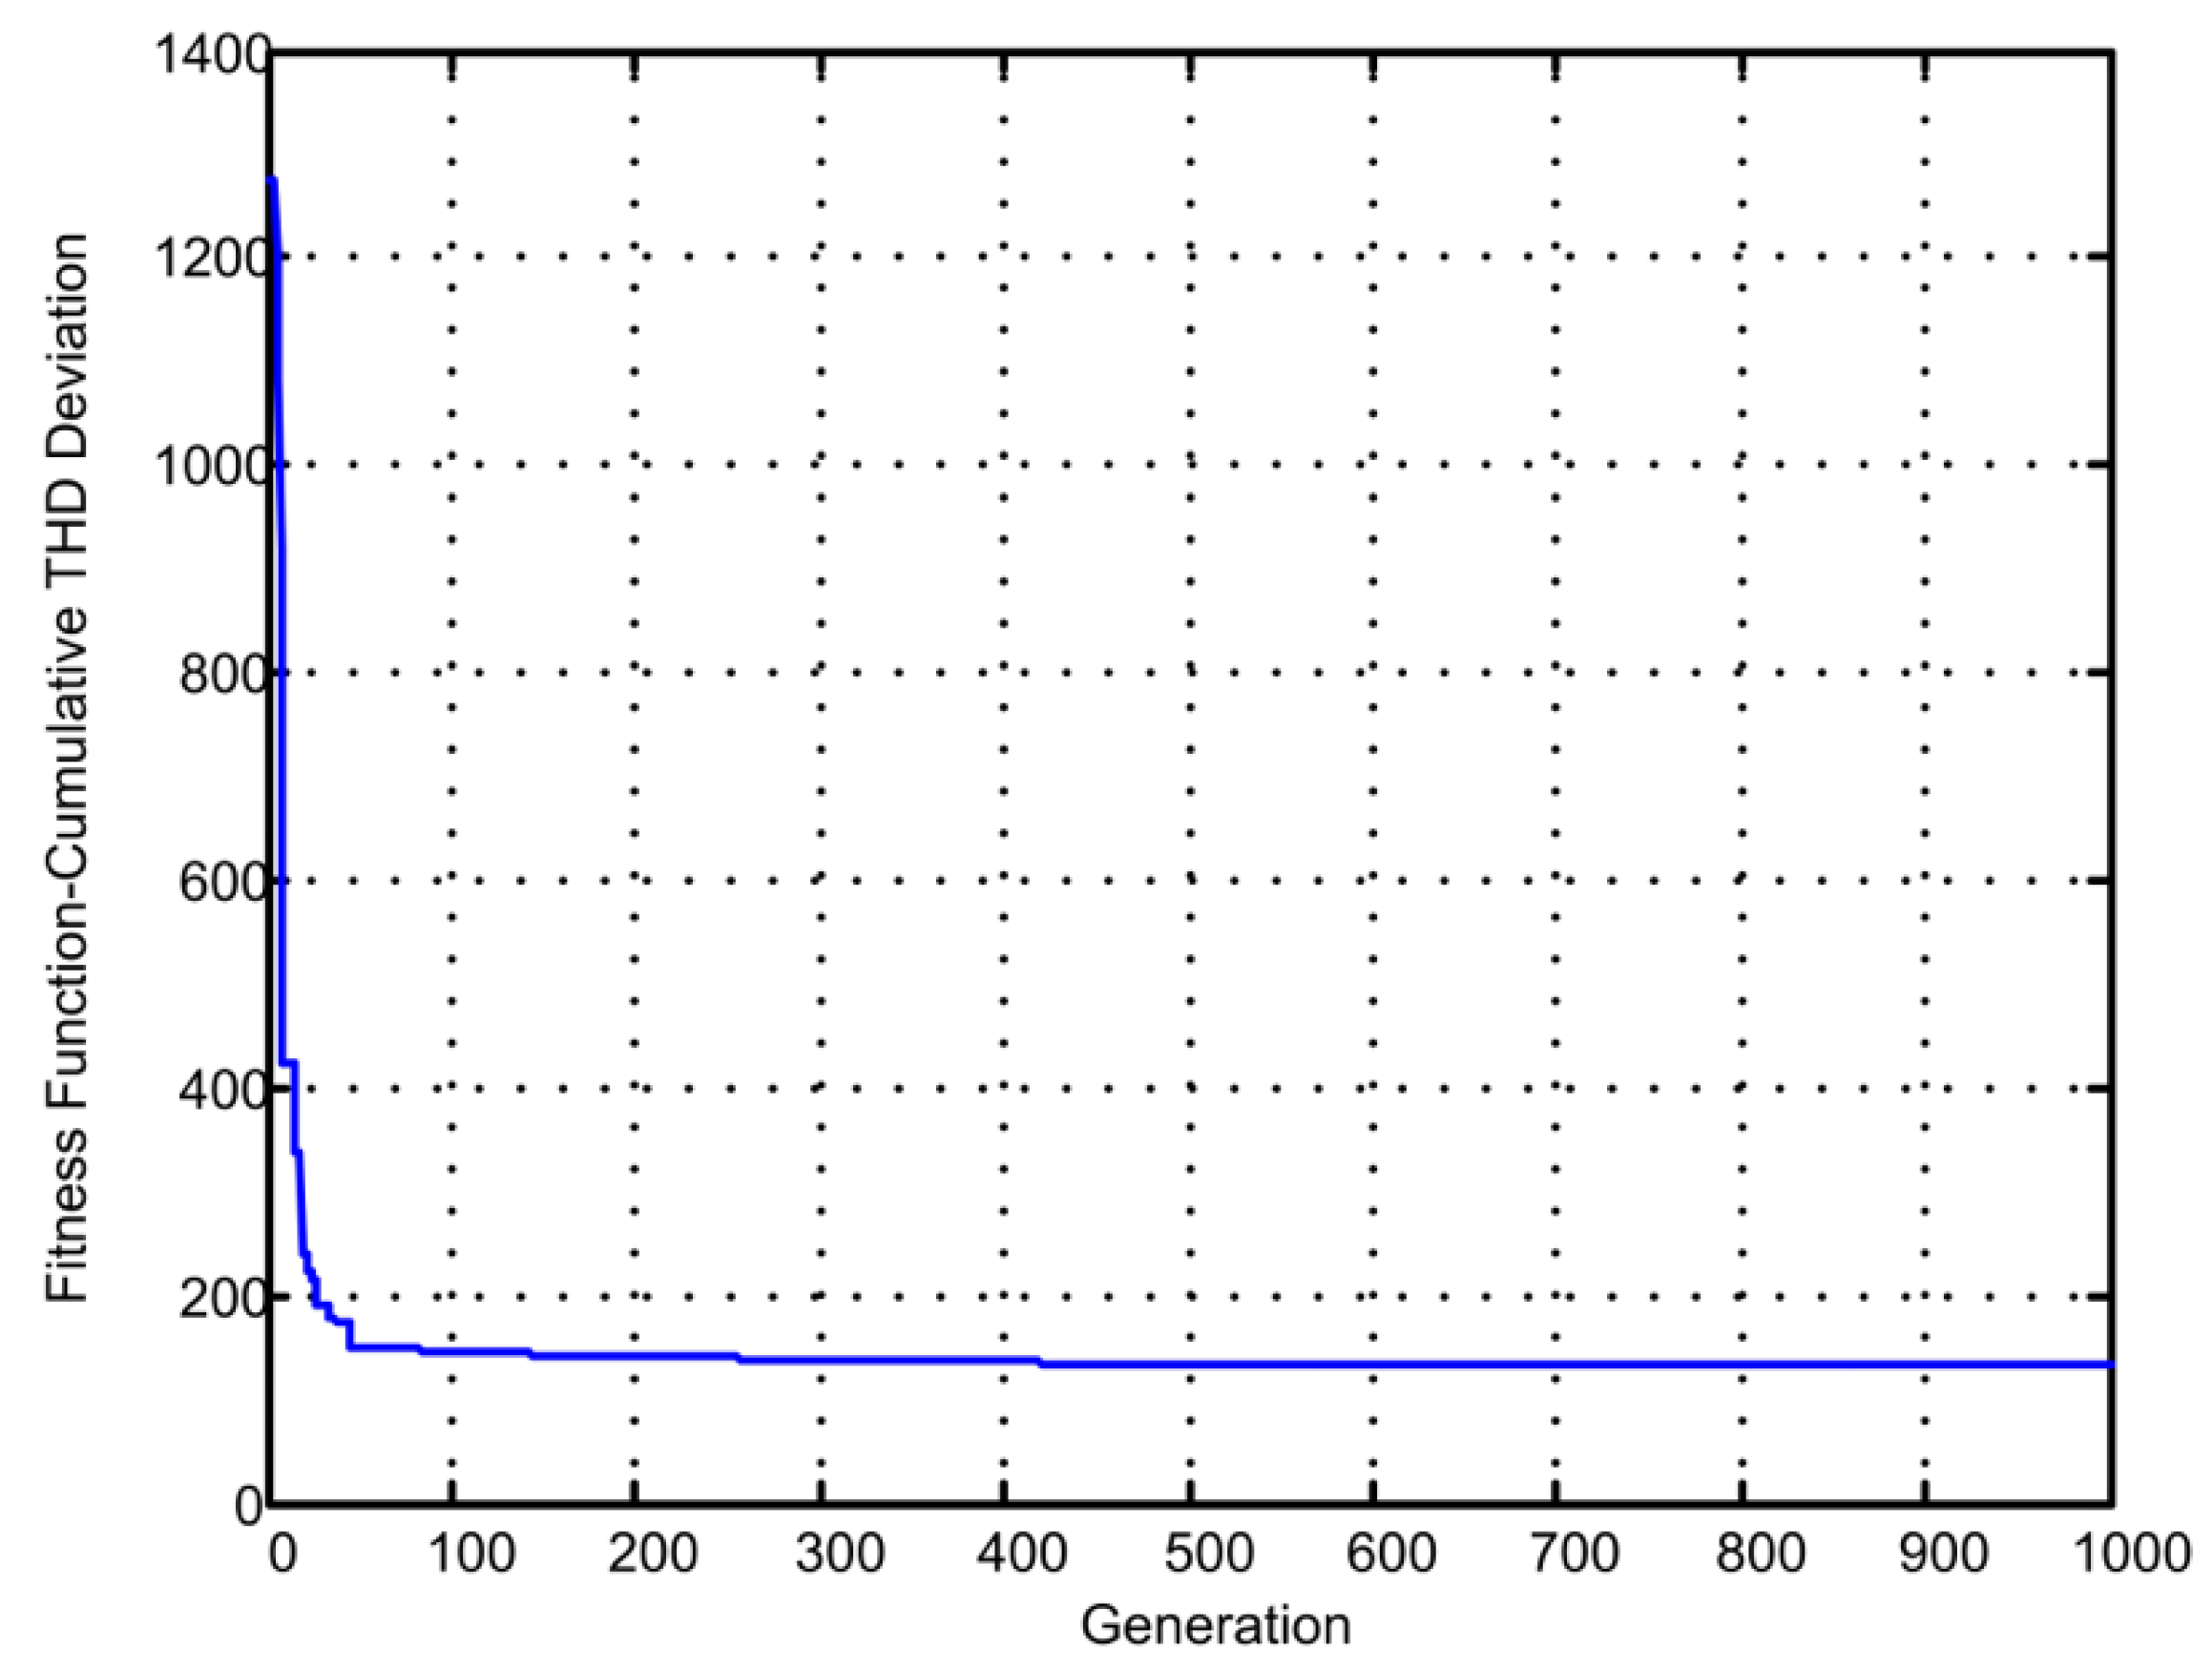
Case 8 considers 100% EV penetration and solves for optimal dispatch of WGs. The resulting voltage THDs are shown in Table 9, and the corresponding optimal dispatch of WGs are shown in Table 10. In Figure 7, the characteristics of the GA fitness function over the iteration is shown. The voltage THDs are obtained below 5%.
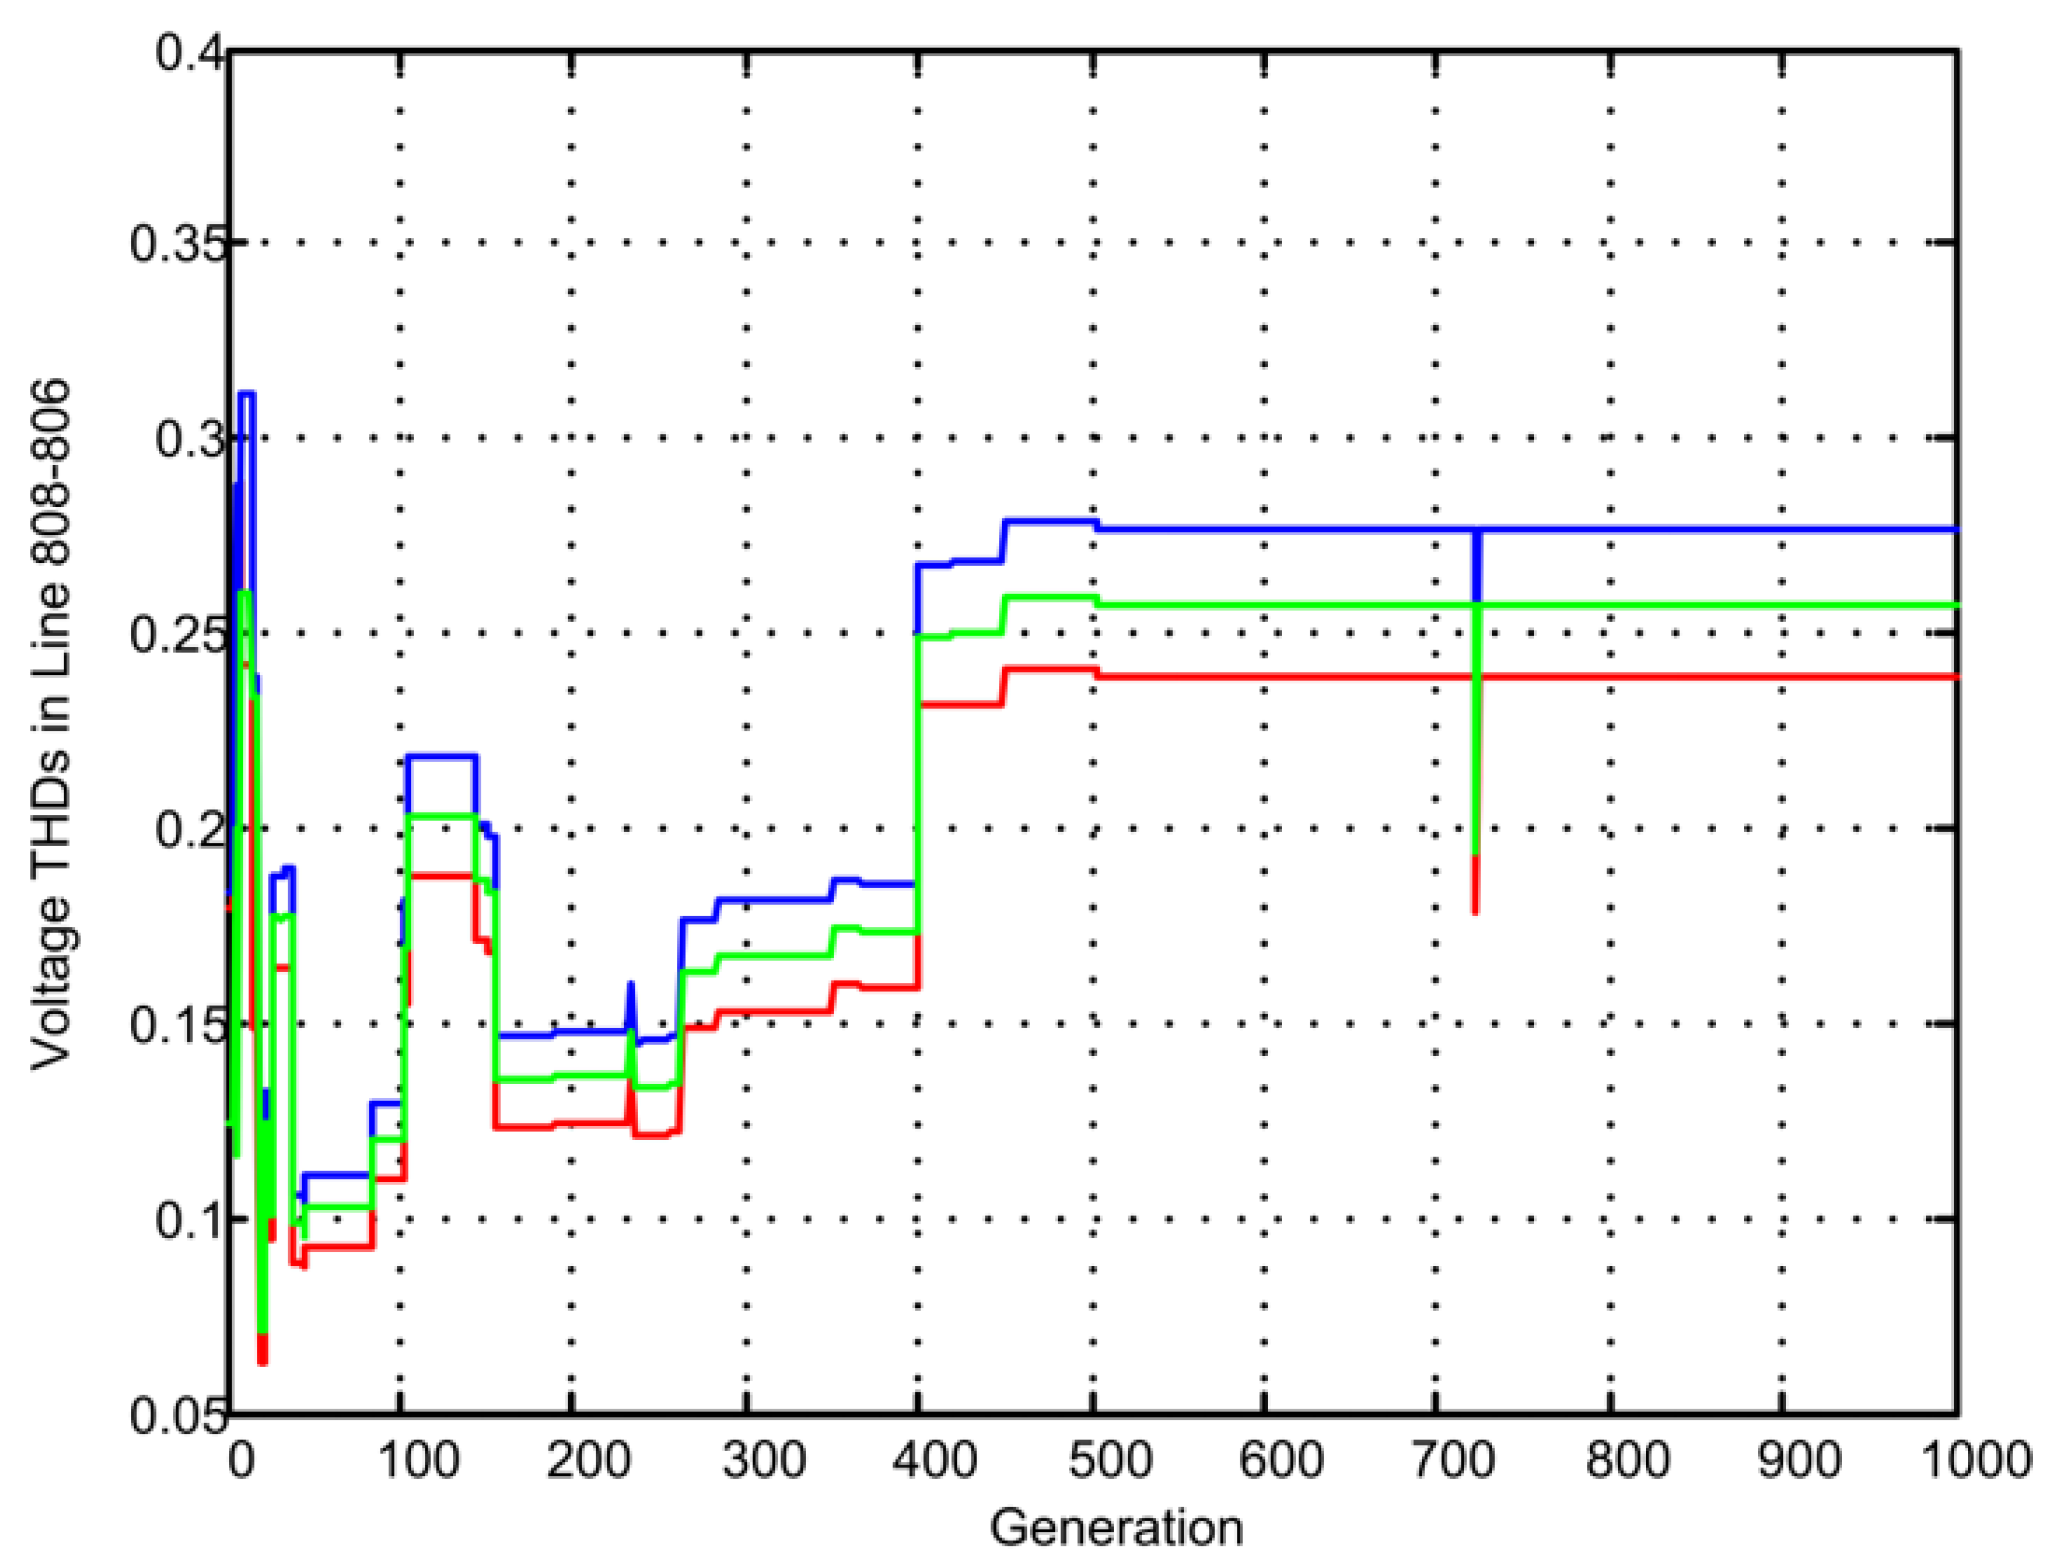
 Figure 8 and Figure 9 show the voltage THDs on two selective feeder branches. It is interesting to observe that THDs on individual feeder section could increase over the GA iterations given that the fitness function is the cumulative THDs over all the feeder sections. However; the individual THDs are well below 5%, which are the constraints included in the OHPF model.
The harmonic reduction observed in the coordinated optimal dispatch is significant as the voltage THDs reductions for high EV penetration are below 5% (compared to 10% in uncoordinated cases). Similarly, the current harmonic THDs are significantly reduced to 5% compared to 50% in uncoordinated cases. The GA algorithms took nearly one hour to run for each of the case studies in a Windows machine with 6 GB memory and 2.80 GHz processor. The optimality tolerance was set at 0.1 % ; however, the solution might have converged locally as the GA method alone does not guarantee global optimal solutions.

6. Conclusions

In this paper, a harmonic decoupled power flow model is developed to study the impact of EVs and WGs on the current and voltage THDs. Simulations carried out in the IEEE 34-node test feeder demonstrate that low EV penetration is not a concern for voltage THDs, as the THDs are below 5%, which are within the limits prescribed by the IEEE. However, low EV penetration is shown to have significant impacts on current THDs. Also, high penetration of EVs are shown to have adverse impacts on both current and voltage THDs. With the integration of WGs in the test feeder consisting of EV loads, it is demonstrated that WGs can help to reduce THDs at some nodes in the feeder, while it causes increased THDs at other nodes. This demonstrated that WGs have the capability to reduce the THDs caused by the EVs. However, the appropriate dispatch of WGs is to be determined in order to achieve the benefits of WGs to reduce THDs. Thus, this paper also presented a GA based method to find optimal dispatch of WGs in the IEEE 34-node test feeder to reduce the voltage and current THDs at each node and phase of the test feeder below the IEEE limits.

Acknowledgments

The second author would like to thank the Scientific and Technological Research Council of Turkey (TUBITAK) for its financial support under the program 2221.

Author Contributions

R. Misra contributed to the development of mathematical models. S. Paudyal contributed to the drafting of the paper, O. Ceylan contributed to develop the case studies, and P. Mandal contributed to the relevant literature search and the case studies.

Conflicts of Interest

The authors declare no conflict of interest.

References

  1. Li, C.T.; Ahn, C.; Peng, H.; Sun, J. Synergistic control of plug-in vehicle charging and wind power scheduling. IEEE Trans. Power Syst. 2013, 28, 1113–1121. [Google Scholar] [CrossRef]
  2. Saber, A.Y.; Venayagamoorthy, G.K. Plug-in Vehicles and Renewable Energy Sources for Cost and Emission Reductions. IEEE Trans. Ind. Electron. 2011, 58, 1229–1238. [Google Scholar] [CrossRef]
  3. Li, C.T.; Ahn, C.; Peng, H.; Sun, J. Integration of plug-in electric vehicle charging and wind energy scheduling on electricity grid. In Proceedings of the IEEE PES Innovative Smart Grid Technologies (ISGT), Washington, DC, USA, 16–20 January 2012; pp. 1–7. [Google Scholar]
  4. Wang, J.; Du, X.; Li, G.; Yang, G. Harmonic Analysis of the Interconnection of Wind Farm. In Proceedings of the Electronics and Signal Processing: Selected Papers from the 2011 International Conference on Electric and Electronics (EEIC 2011), Nanchang, China, 20–22 June 2011; Volume 1, pp. 1031–1038. [Google Scholar]
  5. Singh, R.K.; Goswami, S.K. Optimum Siting and Sizing of Distributed Generations in Radial and Networked Systems. Electr. Power Compon. Syst. 2009, 37, 127–145. [Google Scholar] [CrossRef]
  6. Carpinelli, G.; Celli, G.; Mocci, S.; Pilo, F.; Russo, A. Optimisation of embedded generation sizing and siting by using a double trade-off method. IEEE Proc. Gener. Transm. Distrib. 2005, 152, 503–513. [Google Scholar] [CrossRef]
  7. Amanifar, O. Optimal distributed generation placement and sizing for loss and THD reduction and voltage profile improvement in distribution systems using Particle Swarm Optimization and sensitivity analysis. In Proceedings of the 16th Electrical Power Distribution Conference, Bandar Abbas, Iran, 19–20 April 2011; pp. 1–7. [Google Scholar]
  8. Sedighi, M.; Igderi, A.; Parastar, A. Sitting and sizing of Distributed Generation in distribution network to improve of several parameters by PSO algorithm. In Proceedings of the Conference Proceedings IPEC, Singapore, 27–29 October 2010; pp. 1083–1087. [Google Scholar]
  9. Alinejad-Beromi, Y.; Sedighizadeh, M.; Sadighi, M. A particle swarm optimization for sitting and sizing of Distributed Generation in distribution network to improve voltage profile and reduce THD and losses. In Proceedings of the 43rd International Universities Power Engineering Conference, Padova, Italy, 1–4 September 2008; pp. 1–5. [Google Scholar]
  10. Deilami, S.; Masoum, A.S.; Moses, P.S.; Masoum, M.A.S. Voltage profile and THD distortion of residential network with high penetration of Plug-in Electrical Vehicles. In Proceedings of the IEEE PES Innovative Smart Grid Technologies Conference Europe (ISGT Europe), Gothenberg, Sweden, 11–13 October 2010; pp. 1–6. [Google Scholar]
  11. Jiang, C.; Torquato, R.; Salles, D.; Xu, W. Method to assess the power quality impact of plug-in electric vehicles. In Proceedings of the 16th International Conference on Harmonics and Quality of Power (ICHQP), Bucharest, Romania, 16 October 2014; pp. 177–180. [Google Scholar]
  12. Moses, P.S.; Masoum, M.A.S.; Smedley, K.M. Harmonic losses and stresses of nonlinear three-phase distribution transformers serving Plug-In Electric Vehicle charging stations. In Proceedings of the IEEE PES Innovative Smart Grid Technologies (ISGT), Anaheim, CA, USA, 17–19 January 2011; pp. 1–6. [Google Scholar]
  13. Masoum, M.A.S.; Deilami, S.; Islam, S. Mitigation of harmonics in smart grids with high penetration of plug-in electric vehicles. In Proceedings of the IEEE Power and Energy Society (PES) General Meeting, Providence, RI, USA, 25–29 July 2010; pp. 1–6. [Google Scholar]
  14. Etezadi-Amoli, M.; Choma, K.; Stefani, J. Rapid-Charge Electric-Vehicle Stations. IEEE Trans. Power Deliv. 2010, 25, 1883–1887. [Google Scholar] [CrossRef]
  15. Zhang, Z.; Chiang, H.D.; Wang, T. Harmonic analysis of power system with wind generations and plug-in electric vehicles. In Proceedings of the IEEE Electrical Power Energy Conference, Halifax, NS, Canada, 21–23 August 2013; pp. 1–6. [Google Scholar]
  16. IEEE Recommended Practice and Requirements for Harmonic Control in Electric Power Systems; IEEE Std 519-2014; IEEE: Piscataway, NJ, USA, 2014; pp. 1–29.
  17. Masoum, M.A.S.; Moses, P.S.; Deilami, S. Load management in smart grids considering harmonic distortion and transformer derating. In Proceedings of the Innovative Smart Grid Technologies (ISGT), Gaithersburg, MD, USA, 19–21 January 2010; pp. 1–7. [Google Scholar]
  18. Staats, P.T.; Grady, W.M.; Arapostathis, A.; Thallam, R.S. A statistical method for predicting the net harmonic currents generated by a concentration of electric vehicle battery chargers. IEEE Trans. Power Deliv. 1997, 12, 1258–1266. [Google Scholar] [CrossRef]
  19. Ghassemi, F.; Koo, K.L. Equivalent Network for Wind Farm Harmonic Assessments. IEEE Trans. Power Deliv. 2010, 25, 1808–1815. [Google Scholar] [CrossRef]
  20. Hong, Y.Y.; Chen, Y.T. Three-phase optimal harmonic power flow. IEE Proc. Gener. Transm. Distrib. 1996, 143, 321–328. [Google Scholar] [CrossRef]
  21. Hong, Y.Y. Optimal harmonic power flow. IEEE Trans. Power Deliv. 1997, 12, 1267–1274. [Google Scholar] [CrossRef]
  22. Ulinuha, A.; Masoum, M.A.S.; Islam, S.M. Harmonic power flow calculations for a large power system with multiple nonlinear loads using decoupled approach. In Proceedings of the Australasian Universities Power Engineering Conference, Perth, Australia, 9–12 December 2007; pp. 1–6. [Google Scholar]
  23. Bonner, A.; Grebe, T.; Gunther, E.; Hopkins, L.; Mahseredjian, J.; Miller, N.W.; Spherling, B.R. Modeling and simulation of the propagation of harmonics in electric power networks. II. Sample systems and examples. IEEE Trans. Power Deliv. 1996, 11, 466–474. [Google Scholar]
  24. Paudyal, S.; Canizares, C.A.; Bhattacharya, K. Optimal Operation of Distribution Feeders in Smart Grids. IEEE Trans. Ind. Electron. 2011, 58, 4495–4503. [Google Scholar] [CrossRef]
  25. Haupt, R.L.; Haupt, S.E. Practical Genetic Algorithms; John Wiley & Sons: New York, NY, USA, 1998. [Google Scholar]
Figure 1. Conceptual diagram depicting cancellation of harmonic from electric vehicles (EVs) by wind generators (WGs) at distribution feeder level.
Energies 10 00932 g001
Figure 2. Circuit connection showing the branch currents and nodal voltages used for modeling the harmonic power flow.
Energies 10 00932 g002
Figure 3. The developed interface between the harmonic power flow (HPF) model in OpenDSS and Optimization model in MATLAB.
Energies 10 00932 g003
Figure 4. Flowchart of the solution algorithm where a Genetic Algorithm (GA)-based optimization algorithm is built in MATLAB and a harmonic power flow model is built in OpenDSS.
Energies 10 00932 g004
Figure 5. IEEE 34-Node Test Feeder System after the addition of Three WGs.
Energies 10 00932 g005
Figure 6. Cumulative voltage THD over the GA iterations (High EV Penetration).
Energies 10 00932 g006
Figure 7. Cumulative voltage THD over the GA iterations (High EV Penetration).
Energies 10 00932 g007
Figure 8. Voltage THD over GA iteration at branch 828–830.
Energies 10 00932 g008
Figure 9. Voltage THD over GA iteration at branch 808–806.
Energies 10 00932 g009
Table 1. Line Current Harmonic Content of the EV Charger [17,18].
Harmonic OrderMagnitude (%)Angle (°)Harmonic OrderMagnitude (%)Angle (°)
1100−26119−67
525−94135−46
717−67
Table 2. Wind Generator Current Harmonic Content (in p.u. based on 100 MVA) [19].
Harmonic OrderMag. (p.u.)Harmonic OrderMag. (p.u.)Harmonic OrderMag. (p.u.)
20.00018367.33 × 10 5 137.33 × 10 5
30.00014770.00033253.67 × 10 5
40.0001183.67 × 10 5 453.67 × 10 5
50.00077110.000293470.00011
Table 3. Phase to Phase Voltage total harmonic distortions (THDs) for Low EV Penetration.
Case StudiesBranchTHD V ab ( % ) THD V bc ( % ) THD V ca ( % )
Case 1 (EV)844–8464.624.644.14
828–8302.732.772.52
808–8060.090.090.08
834–8604.584.604.11
Case 2 (EV + 1WG)844–8463.814.063.74
828–8302.602.712.53
808–8060.110.110.10
834–8603.784.033.71
Case 3 (EV + 3WGs)844–8463.994.584.13
828–8302.963.393.11
808–8060.130.140.14
834–8603.954.544.09
Table 4. Current THDs for Low EV Penetration.
Case StudiesBranchTHD I a ( % ) THD I b ( % ) THD I c ( % )
Case 1 (EV)844–84625.7524.2023.19
828–8308.047.226.16
808–8065.506.466.31
834–8606.413.436.09
Case 2 (EV + 1WG)844–8462.812.902.59
828–8303.493.813.92
808–8064.424.294.14
834–8604.413.554.37
Case 3 (EV + 3WGs)844–8462.042.051.77
828–8302.312.322.23
808–8062.142.332.35
834–8603.353.533.79
Table 5. Current THDs for High EV Penetration.
Case StudiesBranchTHD I a ( % ) THD I b ( % ) THD I c ( % )
Case 4 (EV)844–84650.2638.7037.75
828–83011.029.526.98
808–8066.677.9137.12
834–86014.897.6212.96
Case 5 (EV + 1WG)844–8464.505.034.03
828–8303.435.985.93
808–80610.919.006.46
834–86010.206.379.56
Case 6 (EV + 3WGs)844–8462.592.732.07
828–8303.873.783.72
808–8063.723.993.96
834–8607.395.887.33
Table 6. Phase to Phase Voltage THDs for High EV Penetration.
Case StudiesBranchTHD V ab ( % ) THD V bc ( % ) THD V ca ( % )
Case 4 (EV)844–8469.619.547.82
828–8305.385.574.62
808–8060.160.170.14
834–8609.549.467.76
Case 5 (EV + 1WG)844–8465.435.844.73
828–8304.194.043.53
808–8060.180.180.15
834–8605.405.804.62
Case 6 (EV + 3WGs)844–8465.916.805.84
828–8304.474.974.35
808–8060.190.200.19
834–8605.846.725.77
Table 7. THD of Phase to Phase Voltages in Low EV Penetration.
BranchTHD V ab ( % ) THD V bc ( % ) THD V ca ( % )
844–8462.392.962.92
828–8301.572.041.88
808–8060.130.150.14
834–8602.352.902.86
Table 8. Optimal WG Dispatch in Low EV Penetration.
NodeWG (kW)NodeWG (kW)NodeWG (kW)NodeWG (kW)NodeWG (kW)
1254.98490.215176.472258.8229950.98
2372.5591205.816352.9423264.7302323.5
32450.9810950.981788.2424617.55311568.6
4303.9211715.69181568.8325245.1322294.1
5519.611219.61191833.33262480.433137.25
6215.69131450.920833.33271950.9342490.2
71862.7514156.8621215.69281382.3
Table 9. THD of Phase to Phase Voltages in High EV Penetration.
BranchTHD V ab ( % ) THD V bc ( % ) THD V ca ( % )
844–8463.724.043.73
828–8301.591.431.51
808–8060.240.280.26
834–8603.663.973.68
Table 10. Optimal WG Dispatch in High EV Penetration.
NodeWG (kW)NodeWG (kW)NodeWG (kW)NodeWG (kW)NodeWG (kW)
12245.181813.73151186.27222235.29292421.5
22264.792411.7616343.14231196.08302117.6
32137.25102470.59172450.9824617.6531323.53
41892.16112460.78181931.37252215.6932990.2
52127.45122303.92191803.922619.6133254.9
6284.3113235.2920313.73272245.134196.8
71666.6141529.4121156.86281725.5

