Multi-Party Energy Management for Networks of PV-Assisted Charging Stations: A Game Theoretical Approach


Abstract
:1. Introduction
- (1)
- An hour-ahead optimization model for the operation of PVCS is proposed, considering the profit of the PVCS, the local consumption of the PV energy and the impacts on the grid. Moreover, to guarantee the service quality for EVs, a two-level feasible charging region (FCR) model is built to work as a real-time constraint for the optimization. Considering the EV charging demands and PV energy might be quite different in various scenarios, learning-based decision-making is designed to assist the optimization of the PVCS.
- (2)
- The multi-party energy management problem of the PVCS network is formulated as a non-cooperative game. The energy flow includes the buying of energy from the conventional power plants, the trading among the PVCSs, and the surplus PV energy fed back to the utility grid. The strategy of each player (PVCS) is modeled as a demand response (DR) activity to achieve their own optimization goal. The existence and uniqueness of Nash equilibrium of the game is proved, and a two-level distributed heuristic algorithm is introduced to solve the problem.
2. Basic Structure and Models
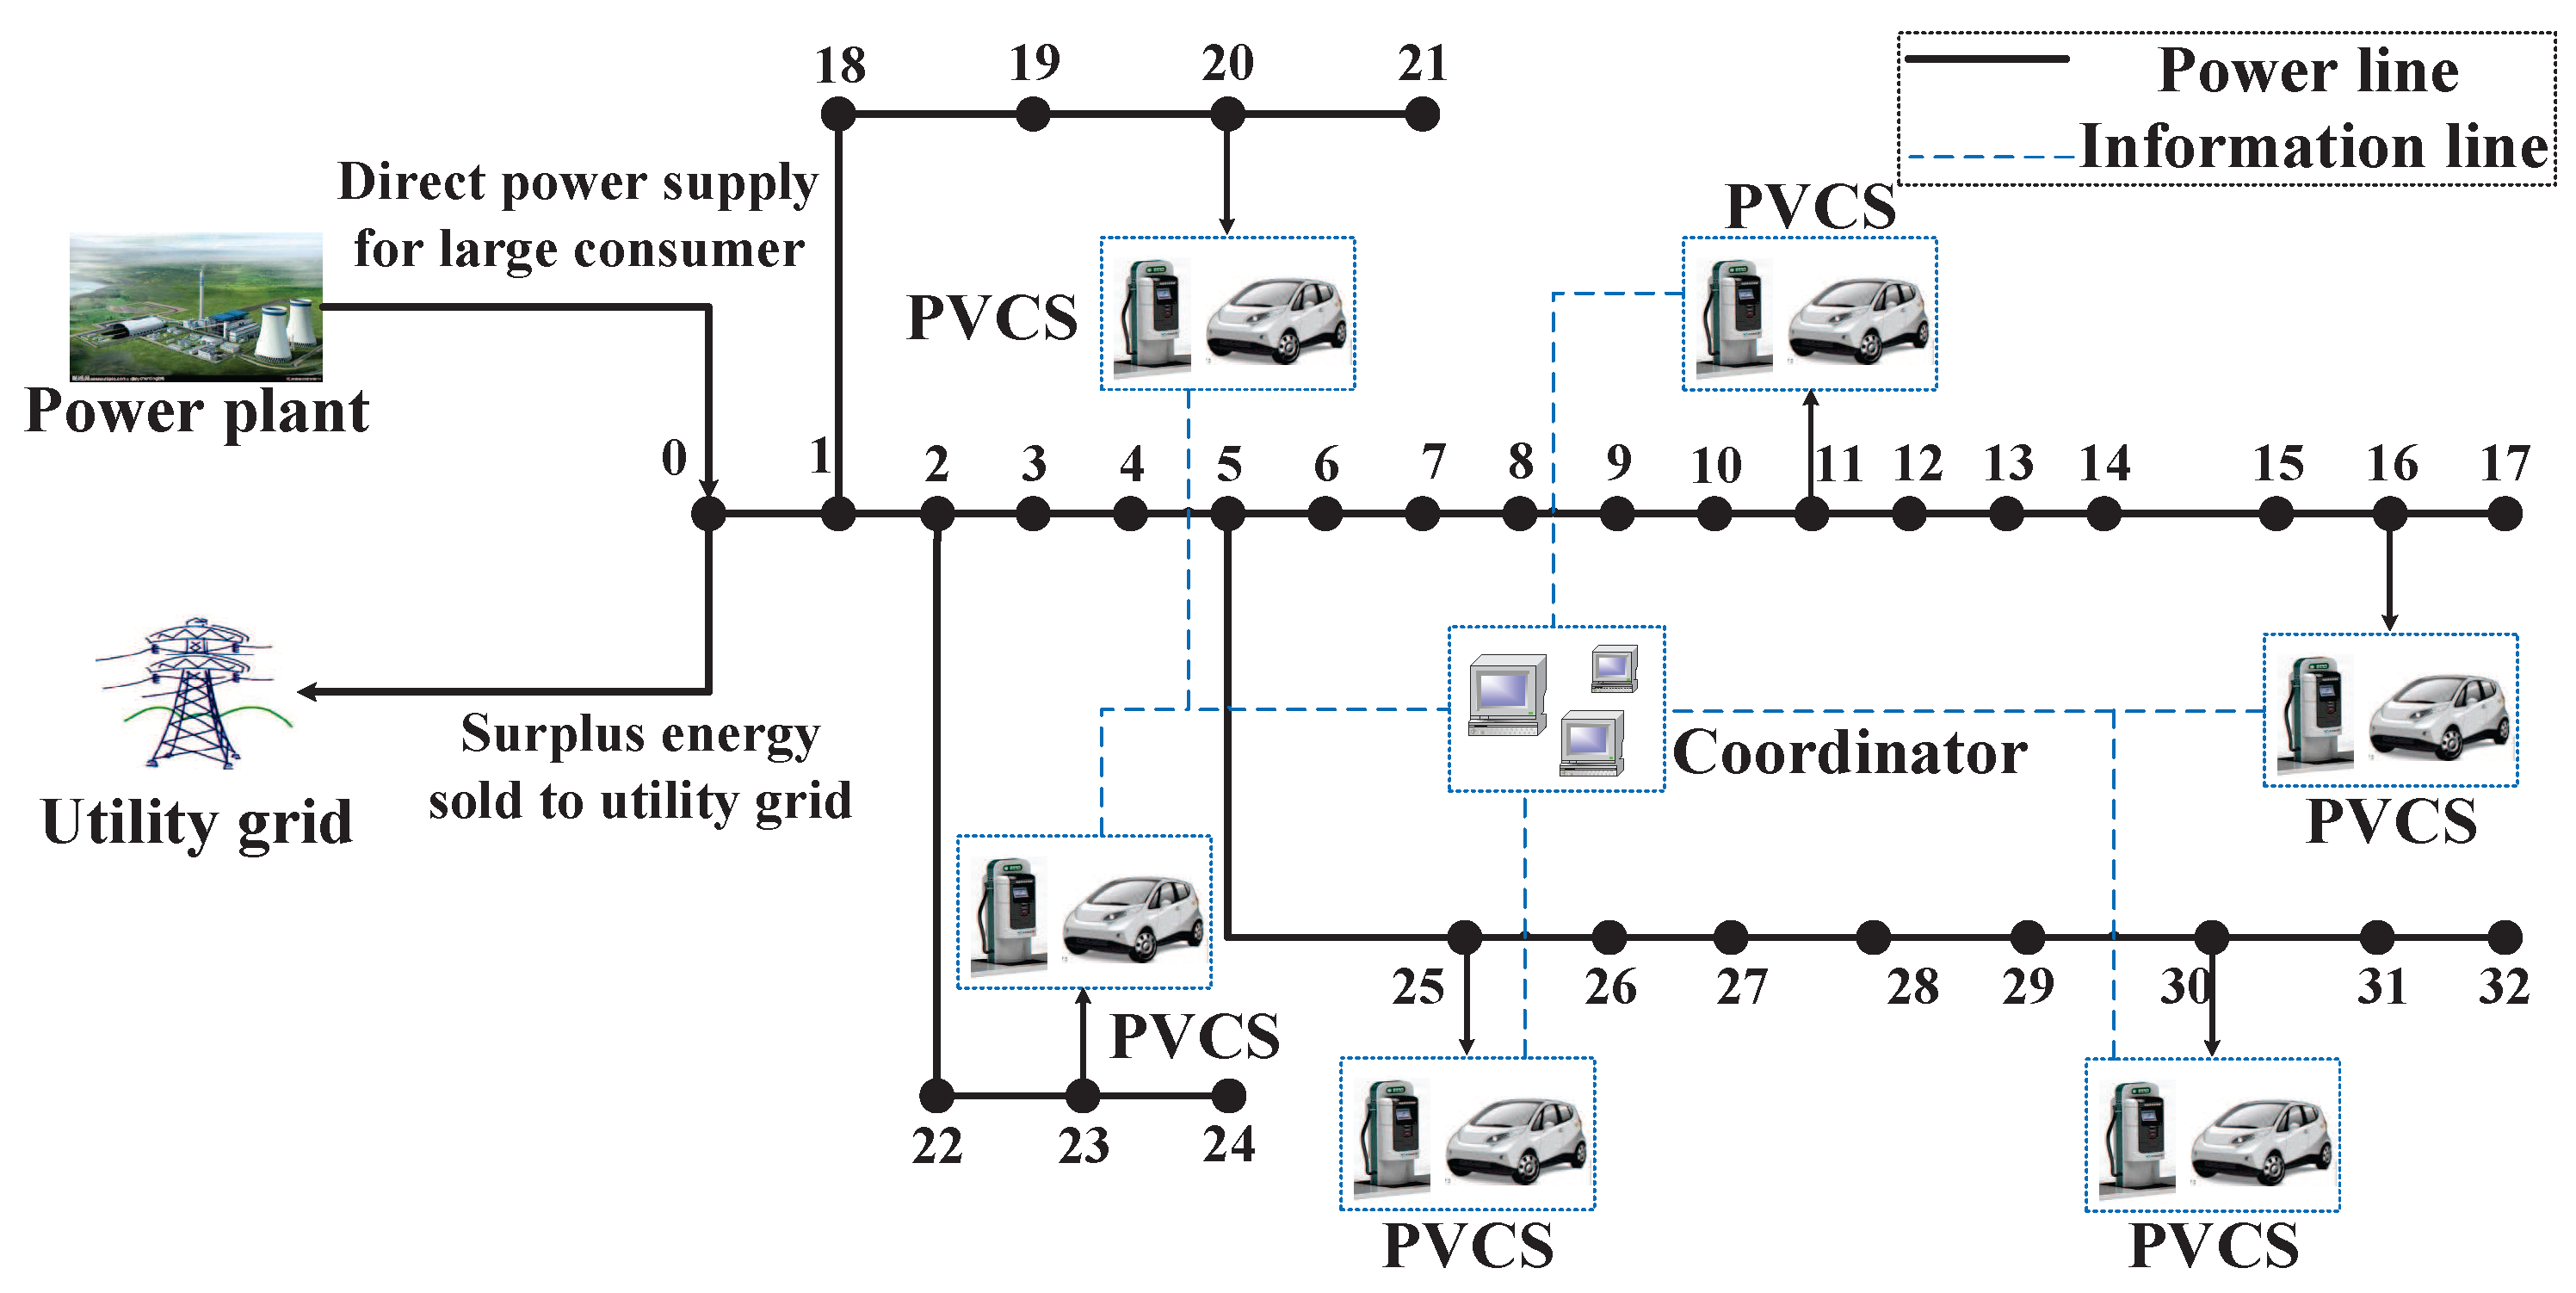
2.1. Structure of the PVCS Network
2.2. Model of EV’s Charge
2.3. Direct Power Supply for Large Consumer
3. Two-Level FCRs
3.1. FCR at the Station Level
- Type 1:
- This type of EV will leave before the end of time slot T, so they must be charged in time slot T to reach the objective before their departure time.
- Type 2:
- This type of EV will not leave before the end of time slot T, so they can be charged or not in time slot T depending on the amount of the charging load and the PV energy.
3.2. FCR at the EV Level
4. Modeling of the PVCSs Network
4.1. Load Model of the Network
4.2. Objective of the PVCS
4.3. Learning-Based Decision-Making
- (1)
- , which means the PV energy difference ratio of the two days is less than .
- (2)
- , which means the two days have the same weather type (sunny, rainy, cloudy, and foggy).
- (3)
- , which means the two days are both weekdays, weekends or festivals.
4.4. Allocation of the Charging Load
- step 1:
- For Type 1 EVs, set ; for Type 2 EVs, set .
- step 2:
- Calculate the sum of the EVs’ present charging load in each PVCS:
- step 3:
- If , increase the charging rate of all the Type 2 EVs until :
5. Distributed EM Algorithm Based on Non-Cooperative Game
5.1. Formulation of the Non-Cooperative Game
5.2. Distributed Solving Method for the Game
- step 1:
- The coordinator sends the information about the cost of buying energy ( and ) to all the PVCSs in the network;
- step 2:
- The PVCSs determine their and calculate their , then send to the coordinator;
- step 3:
- The coordinator calculates the total netload and sends the it to all the PVCSs;
- step 4:
- All the PVCSs figure out their own optimal charging load according to assuming that the charging loads of all the other PVCSs , i.e., the netload of all the other PVCSs , are not changed;
- step 5:
- Repeat step2 to step4 until .
| Algorithm 1 Two-level distributed DR algorithm |
| Initialization: 1. Set and randomly generate by: 3. Calculate initial according to (20) using . 4. Get initial using inner level. 5. Calculate initial according to (29). Iteration:loop Outer level: 1. Update using DE according to: 3. Update using inner level. 4. Update according to (29) and: Inner level: 1. Update according to: 2. Update using . |
6. Case Study
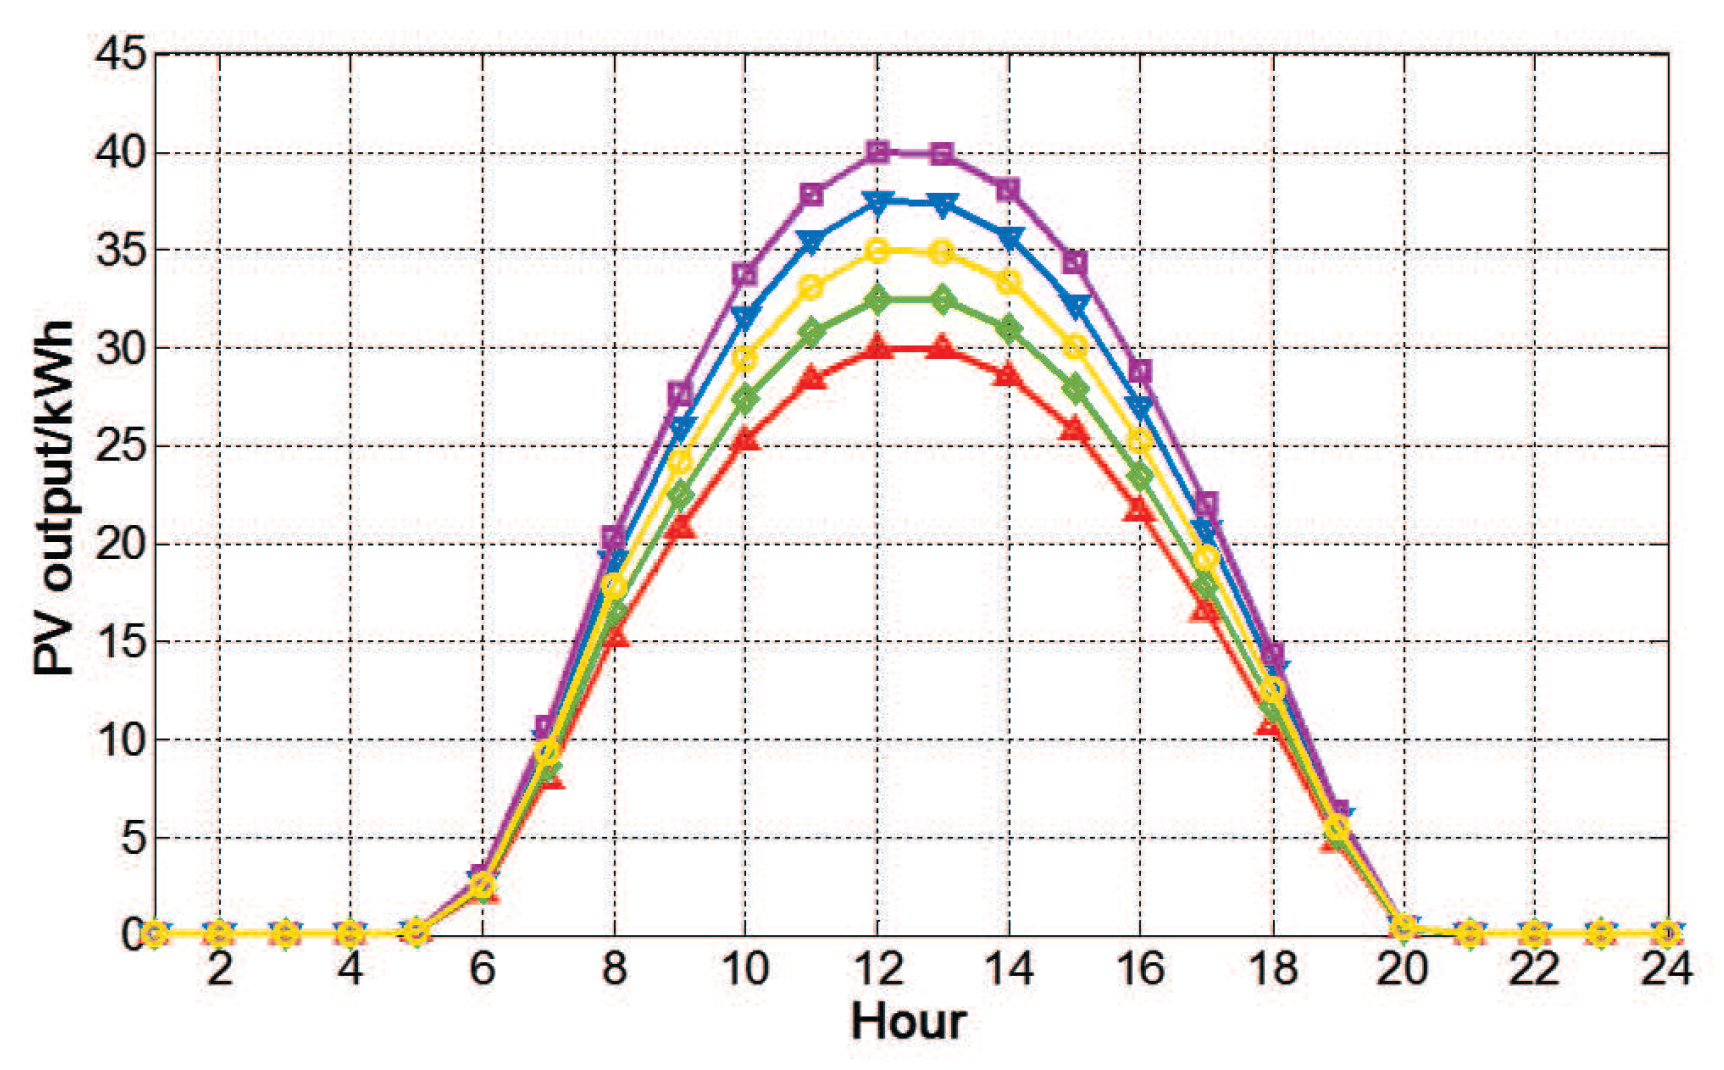
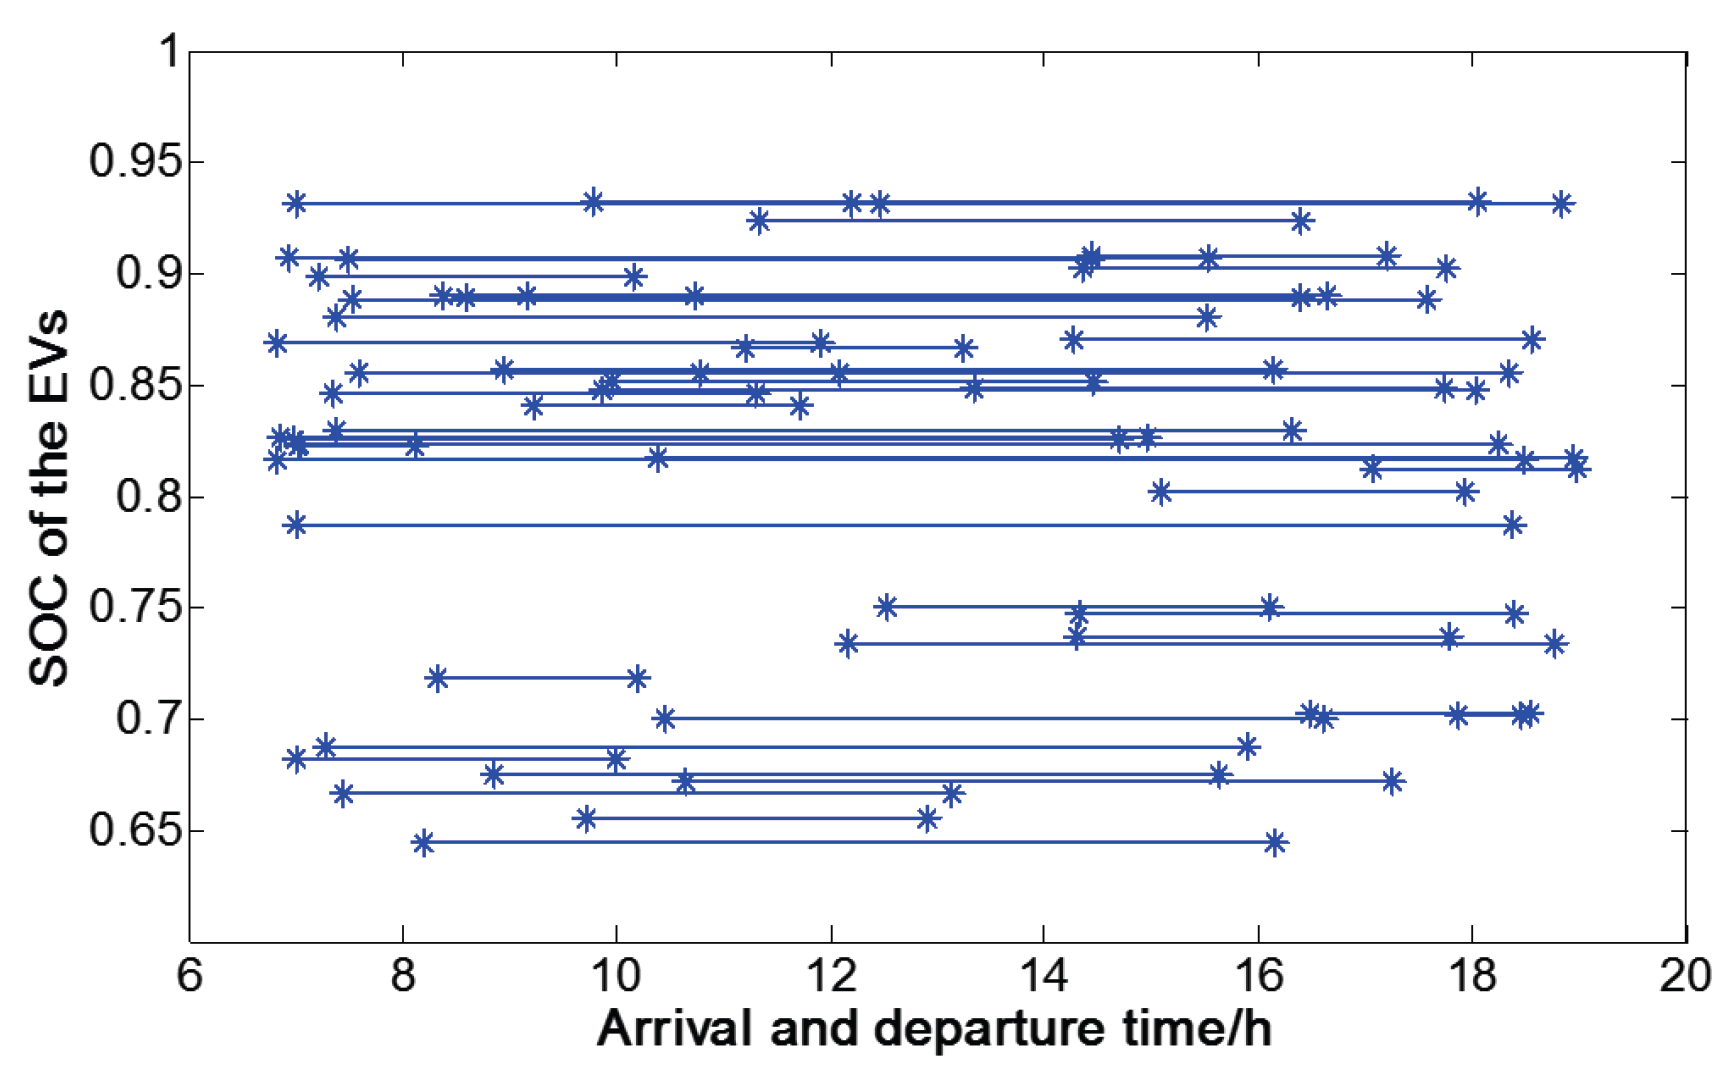
6.1. Basic Data
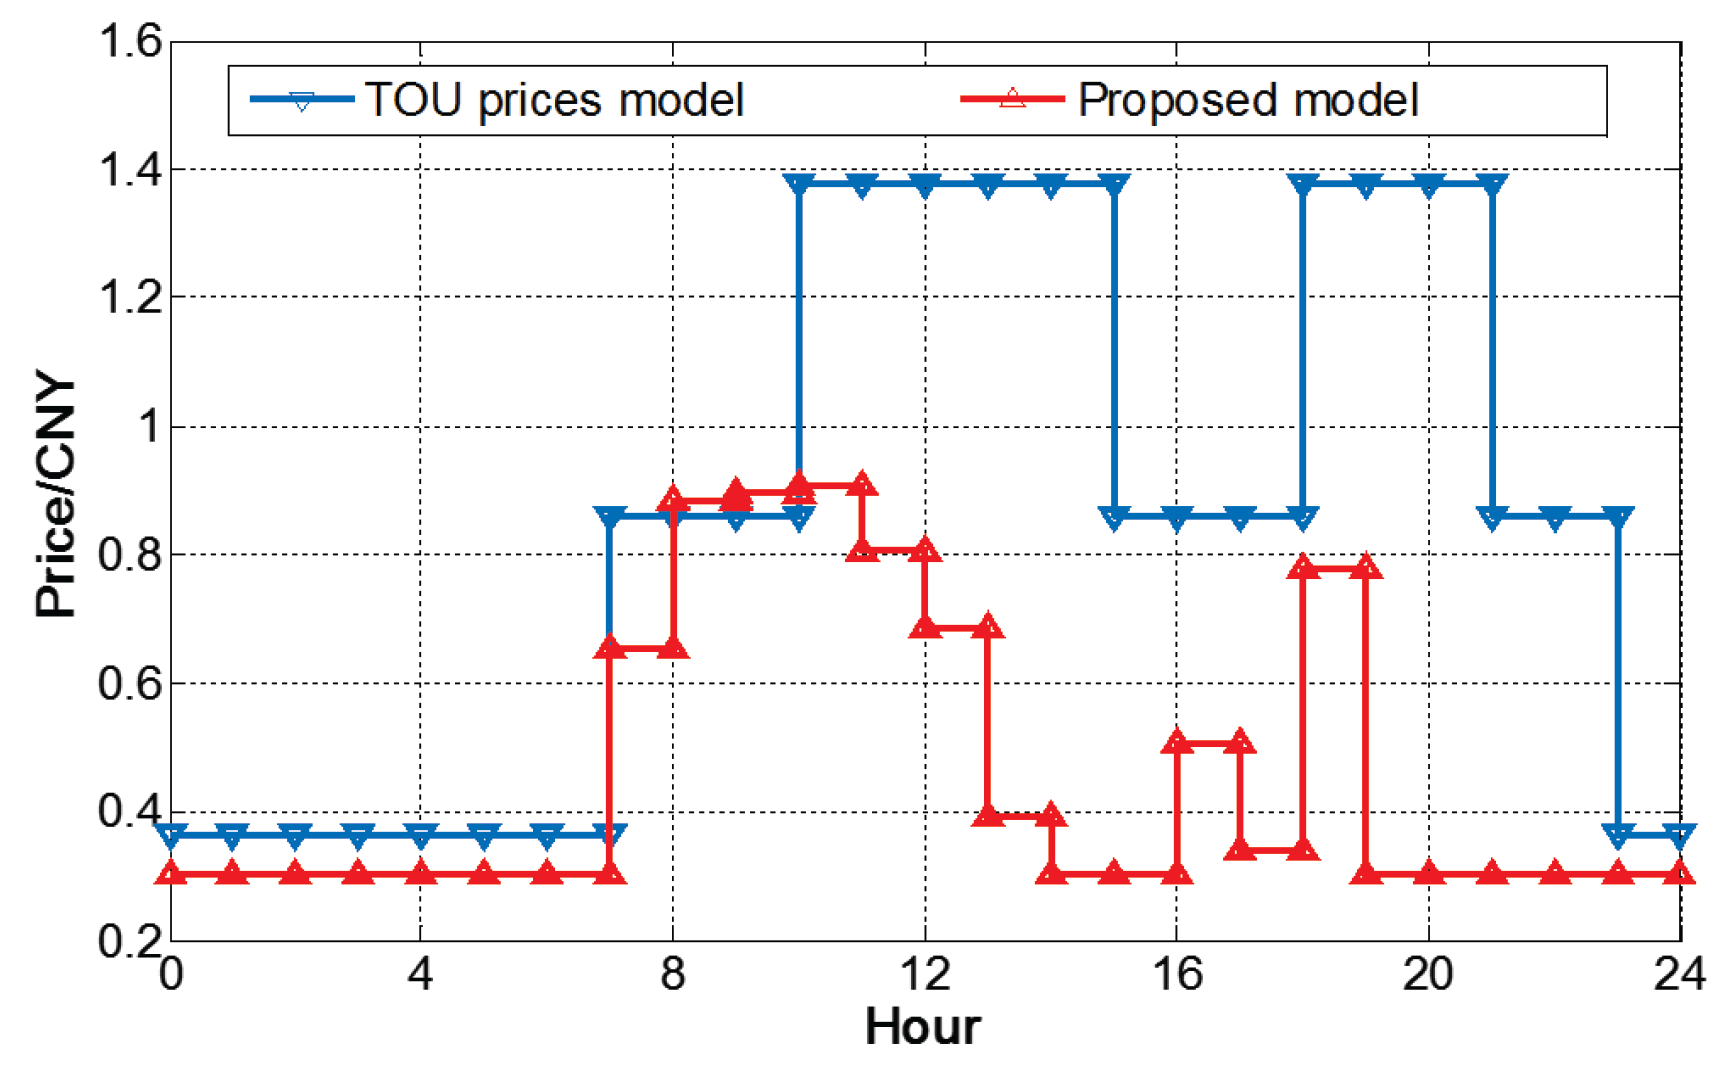
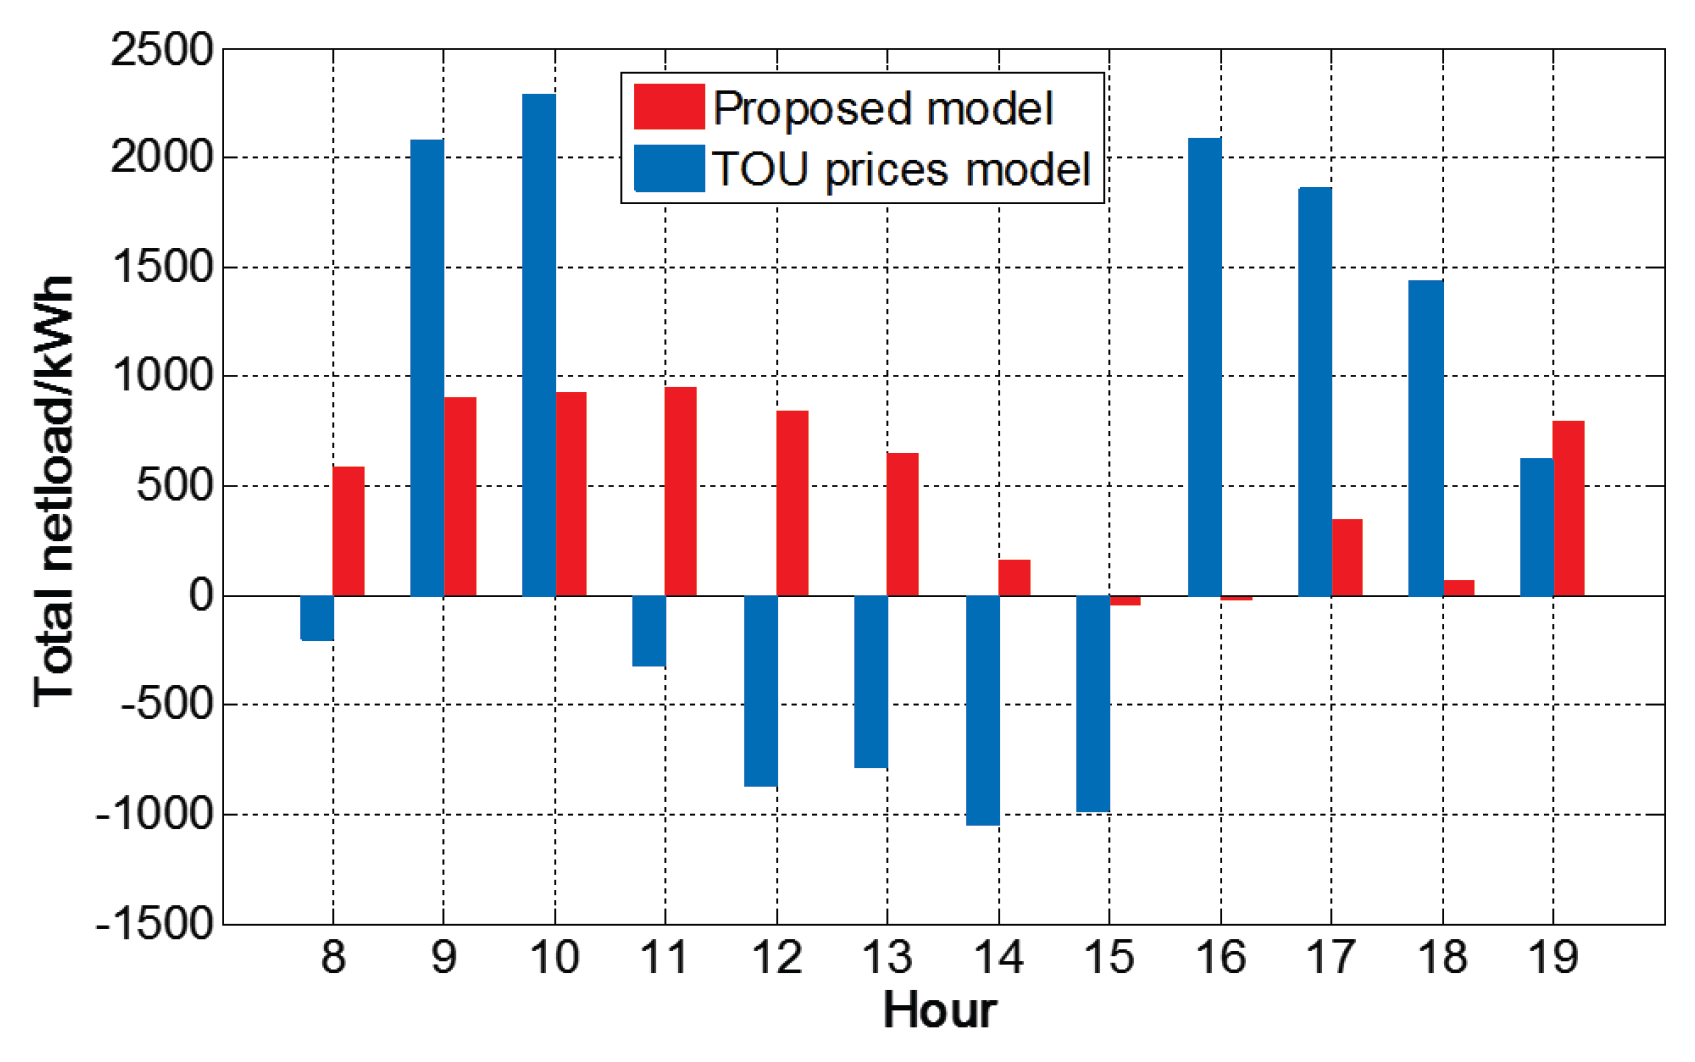
6.2. Comparisons of the Effect with the Time of Use (TOU) Prices Model
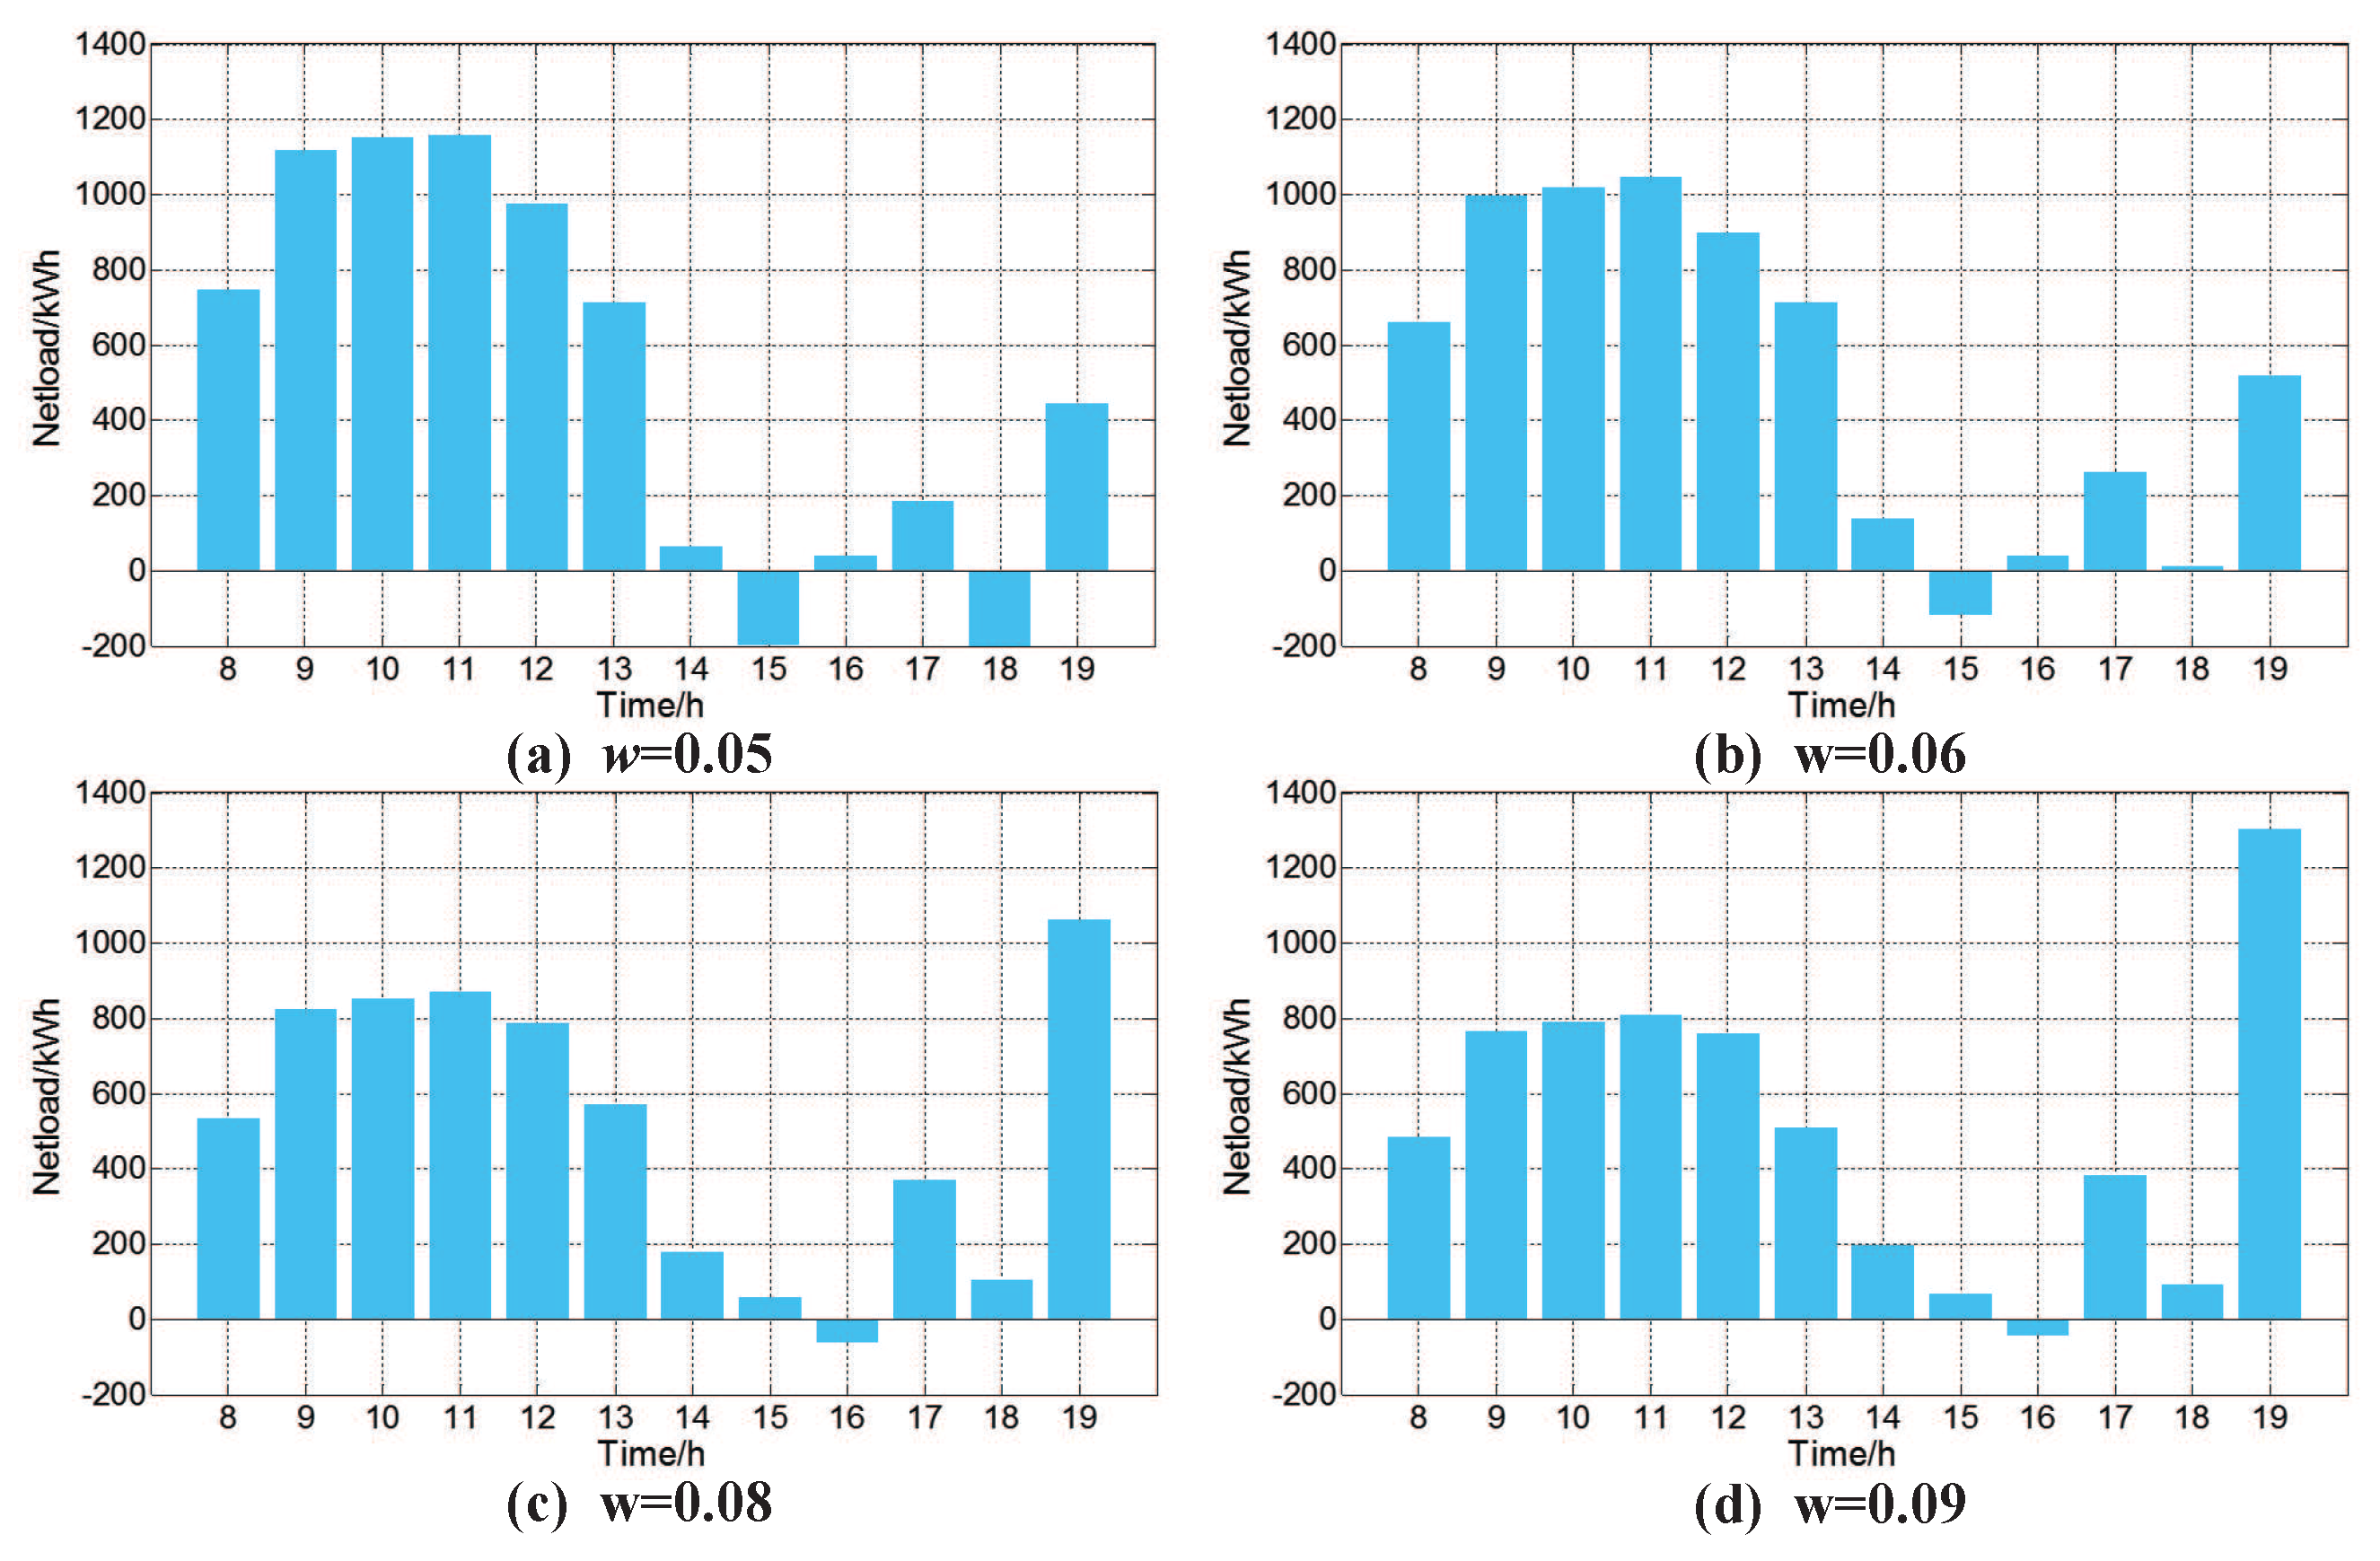
6.3. Sensitivity Analysis
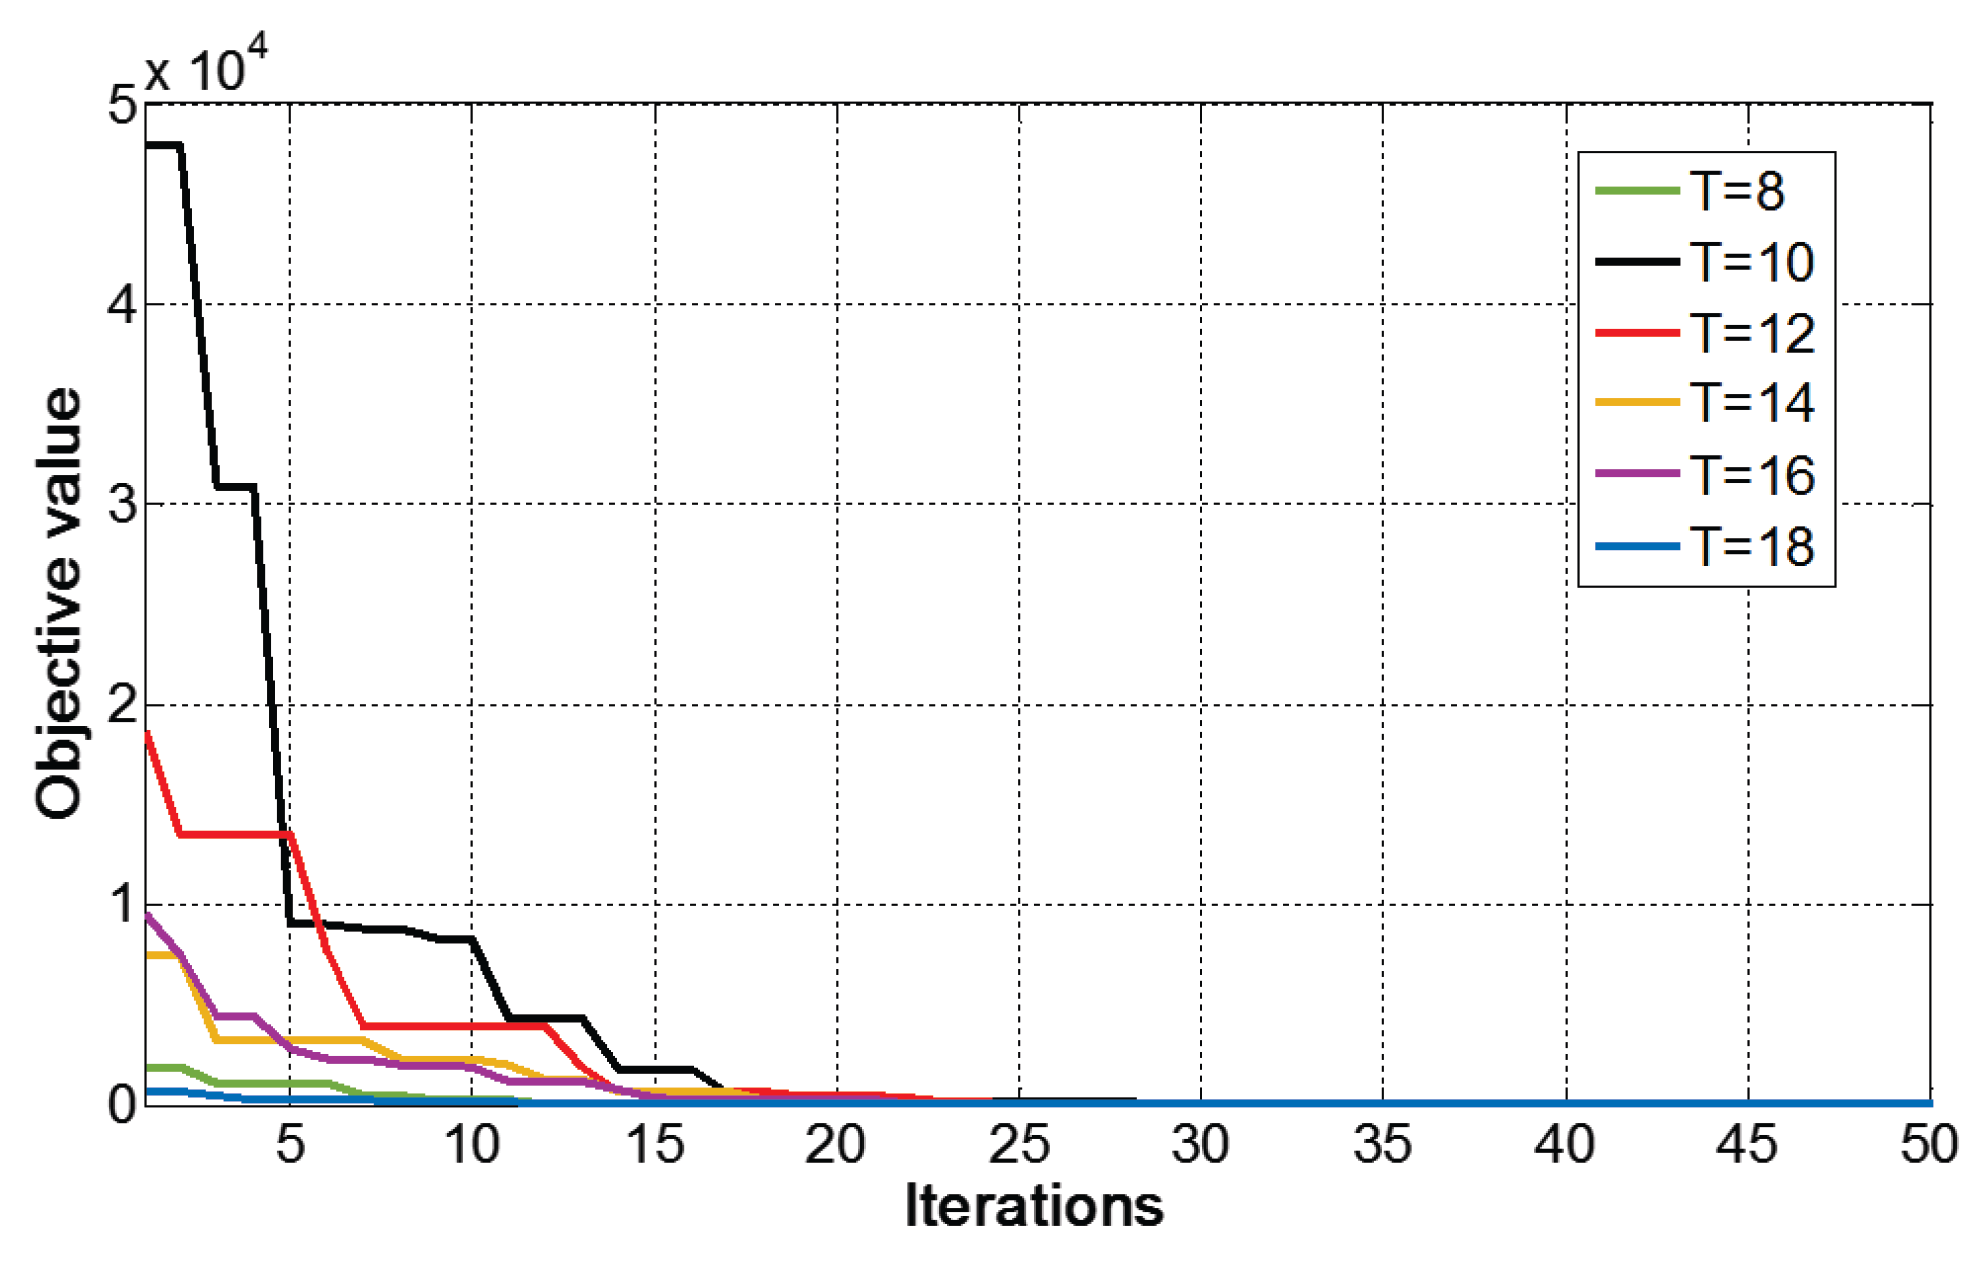
6.4. Analysis of Convergence and Practical Feasibility
7. Conclusions
Acknowledgments
Author Contributions
Conflicts of Interest
Abbreviations
| PV | Photovoltaic |
| CS | Charging station |
| PVCS | PV-assisted charging station |
| MPPT | Maximum power point tracking |
| SR | Switched reluctance |
| EV | Electric vehicle |
| PHEV | Plug-in hybrid electric vehicle |
| FCR | Feasible charging region |
| GIS | Geographical information system |
| DR | Demand response |
| LCC | Life cycle cost |
| UEMS | User energy management system |
| SOC | State of charge |
| ELMK | Extreme learning machine with Kernel |
| NHTS | National Household Travel Survey |
| TOU | Time of use |
| EM | Energy management |
| PPTCL | Percentage of PV energy in the total charging load |
Appendix A. Approximation of the Cost Model
References
- Van Roy, J.; Leemput, N.; Geth, F.; Salenbien, R. Apartment Building Electricity System Impact of Operational Electric Vehicle Charging Strategies. IEEE Trans. Sustain. Energy 2014, 5, 264–272. [Google Scholar] [CrossRef]
- Liu, N.; Chen, Z.; Liu, J.; Tang, X.; Xiao, X.; Zhang, J. Multi-objective optimization for component capacity of the photovoltaic-based battery switch stations: Towards benefits of economy and environment. Energy 2014, 64, 779–792. [Google Scholar] [CrossRef]
- Zhongfu, T.; Kangting, C.; Liwei, J.; Pingkuo, L.; Zhang, C. Issues and solutions of China’s generation resource utilization based on sustainable development. J. Mod. Power Syst. Clean Energy 2016, 4, 147–160. [Google Scholar]
- Fernandez, L.P.; San Roman, T.G.; Cossent, R.; Domingo, C.M.; Frias, P. Assessment of the impact of plug-in electric vehicles on distribution networks. IEEE Trans. Power Syst. 2011, 26, 206–213. [Google Scholar] [CrossRef]
- Reddy, K.S.; Panwar, L.K.; Kumar, R.; Panigrahi, B.K. Distributed resource scheduling in smart grid with electric vehicle deployment using fireworks algorithm. J. Mod. Power Syst. Clean Energy 2016, 4, 188–199. [Google Scholar] [CrossRef]
- Cao, Y.; Tang, S.; Li, C.; Zhang, P.; Tan, Y.; Zhang, Z.; Li, J. An optimized EV charging model considering TOU price and SOC curve. IEEE Trans. Smart Grid 2012, 3, 388–393. [Google Scholar] [CrossRef]
- Saber, A.Y.; Venayagamoorthy, G.K. Plug-in Vehicles and Renewable Energy Sources for Cost and Emission Reductions. IEEE Trans. Ind. Electron. 2011, 58, 1229–1238. [Google Scholar] [CrossRef]
- Traube, J.; Lu, F.; Maksimovic, D.; Mossoba, J. Mitigation of Solar Irradiance Intermittency in Photovoltaic Power Systems With Integrated Electric-Vehicle Charging Functionality. IEEE Trans. Power Electron. 2013, 28, 3058–3067. [Google Scholar] [CrossRef]
- Hernandez, J.; Sutil, F. Electric Vehicle Charging Stations Feeded by Renewable: PV and Train Regenerative Braking. IEEE Latin Am. Trans. 2016, 14, 3262–3269. [Google Scholar] [CrossRef]
- Liu, N.; Chen, Q.; Lu, X.; Liu, J. A Charging Strategy for PV-Based Battery Switch Stations Considering Service Availability and Self-Consumption of PV Energy. IEEE Trans. Ind. Electron. 2015, 62, 4878–4889. [Google Scholar] [CrossRef]
- Liu, N.; Zou, F.; Wang, L.; Wang, C.; Chen, Z.; Chen, Q. Online energy management of PV-assisted charging station under time-of-use pricing. Electr. Power Syst. Res. 2016, 137, 76–85. [Google Scholar] [CrossRef]
- Chen, Q.; Liu, N.; Hu, C.; Wang, L.; Zhang, J. Autonomous Energy Management Strategy for Solid-State Transformer to Integrate PV-Assisted EV Charging Station Participating in Ancillary Service. IEEE Trans. Ind. Inform. 2017, 13, 258–269. [Google Scholar] [CrossRef]
- Shojaabadi, S.; Abapour, S.; Abapour, M.; Nahavandi, A. Optimal planning of plug-in hybrid electric vehicle charging station in distribution network considering demand response programs and uncertainties. IET Gener. Transm. Distrib. 2016, 10, 3330–3340. [Google Scholar] [CrossRef]
- Sheppard, C.J.; Harris, A.; Gopal, A.R. Cost-effective siting of electric vehicle charging infrastructure with agent-based modeling. IEEE Trans. Transp. Electr. 2016, 2, 174–189. [Google Scholar] [CrossRef]
- Yao, W.; Zhao, J.; Wen, F.; Dong, Z.; Xue, Y.; Xu, Y.; Meng, K. A multi-objective collaborative planning strategy for integrated power distribution and electric vehicle charging systems. IEEE Trans. Power Syst. 2014, 29, 1811–1821. [Google Scholar] [CrossRef]
- Hu, Y.; Cao, W.; Wu, J.; Ji, B. Thermography-Based Virtual MPPT Scheme for Improving PV Energy Efficiency Under Partial Shading Conditions. IEEE Trans. Power Electron. 2014, 29, 5667–5672. [Google Scholar] [CrossRef]
- Hu, Y.; Zhang, J.; Cao, W.; Wu, J.; Tian, G.Y.; Finney, S.J.; Kirtley, J.L. Online Two-Section PV Array Fault Diagnosis With Optimized Voltage Sensor Locations. IEEE Trans. Ind. Electron. 2015, 62, 7237–7246. [Google Scholar] [CrossRef]
- Hu, Y.; Song, X.; Cao, W.; Ji, B. New SR Drive With Integrated Charging Capacity for Plug-In Hybrid Electric Vehicles (PHEVs). IEEE Trans. Ind. Electron. 2014, 61, 5722–5731. [Google Scholar] [CrossRef]
- Zheng, Y.; Dong, Z.Y.; Xu, Y.; Meng, K.; Zhao, J.H.; Qiu, J. Electric Vehicle Battery Charging/Swap Stations in Distribution Systems: Comparison Study and Optimal Planning. IEEE Trans. Power Syst. 2014, 29, 221–229. [Google Scholar] [CrossRef]
- Liu, Z.; Wen, F.; Ledwich, G. Optimal Planning of Electric-Vehicle Charging Stations in Distribution Systems. IEEE Trans. Power Deliv. 2013, 28, 102–110. [Google Scholar] [CrossRef]
- Wang, G.; Xu, Z.; Wen, F.; Wong, K.P. Traffic-Constrained Multiobjective Planning of Electric-Vehicle Charging Stations. IEEE Trans. Power Deliv. 2013, 28, 2363–2372. [Google Scholar] [CrossRef]
- Liu, N.; Yu, X.; Wang, C.; Wang, J. Energy Sharing Management for Microgrids With PV Prosumers: A Stackelberg Game Approach. IEEE Trans. Ind. Inform. 2017, 13, 1088–1098. [Google Scholar] [CrossRef]
- Bayram, I.S.; Michailidis, G.; Devetsikiotis, M. Unsplittable Load Balancing in a Network of Charging Stations Under QoS Guarantees. IEEE Trans. Smart Grid 2015, 6, 1292–1302. [Google Scholar] [CrossRef]
- Malandrino, F.; Casetti, C.; Chiasserini, C.F. A Holistic View of ITS-Enhanced Charging Markets. IEEE Trans. Intell. Transp. Syst. 2015, 16, 1736–1745. [Google Scholar] [CrossRef]
- Massimo, A.; Dell’Isola, M.; Frattolillo, A.; Ficco, G. Development of a Geographical Information System (GIS) for the integration of solar energy in the energy planning of a wide area. Sustainability 2014, 6, 5730–5744. [Google Scholar] [CrossRef]
- Liu, N.; Chen, Q.; Liu, J.; Lu, X.; Li, P.; Lei, J.; Zhang, J. A Heuristic Operation Strategy for Commercial Building Microgrids Containing EVs and PV System. IEEE Trans. Ind. Electron. 2015, 62, 2560–2570. [Google Scholar] [CrossRef]
- Ma, L.; Liu, N.; Wang, L.; Zhang, J.; Lei, J.; Zeng, Z.; Wang, C.; Cheng, M. Multi-party energy management for smart building cluster with PV systems using automatic demand response. Energy Build. 2016, 121, 11–21. [Google Scholar] [CrossRef]
- Liu, N.; Yu, X.; Wang, C.; Li, C.; Ma, L.; Lei, J. An energy sharing model with price-based demand response for microgrids of peer-to-peer prosumers. IEEE Trans. Power Syst. 2017, pp. [Google Scholar] [CrossRef]
- Debreu, G. A Social Equilibrium Existence Theorem. Proc. Natl. Acad. Sci. USA 1952, 38, 886–893. [Google Scholar] [CrossRef] [PubMed]
- Arrow, K.J.; Enthoven, A.C. Quasi-concave programming. Econometrica 1961, 29, 779–800. [Google Scholar] [CrossRef]
- Liu, N.; Cheng, M. Effectiveness Evaluation for a Commercialized PV-Assisted Charging Station. Sustainability 2017, 9, 323. [Google Scholar] [CrossRef]
- Jia, L.T.S. A statistical model for charging power demand of electric vehicles. Power Syst. Technol. 2010, 4, 126–130. [Google Scholar]
- Dubey, A.; Santoso, S.; Cloud, M.P.; Waclawiak, M. Determining Time-of-Use Schedules for Electric Vehicle Loads: A Practical Perspective. IEEE Power Energy Technol. Syst. J. 2015, 2, 12–20. [Google Scholar] [CrossRef]


| ObjectiveSOC | RatedCapacity | Maximum Charge Rate | RatedVoltage | EnduranceMileage |
|---|---|---|---|---|
| 0.95 | 178 Ah | 0.5 C | 320 V | 240 km |
| Indexes | PPTCL | Average Price (CNY/kWh) | Economic Profit (CNY) | Load Rate |
|---|---|---|---|---|
| TOU model | 46.63% | 0.8761 | 59,994 | 0.1061 |
| Proposed model | 75.56% | 0.7153 | 63,798 | 0.4186 |
| Increase/decrease value | 28.93% | 0.1608 | 3804 (6.34%) | 0.3125 |
| Number of the Stations | 1 | 2 | 3 | 4 | 5 |
|---|---|---|---|---|---|
| TOU model | 844.9 | 972.5 | 1050.8 | 952.1 | 828.9 |
| Proposed model | 907.8 | 1018.6 | 1118.6 | 994.3 | 856.5 |
| Increase rate | 7.44% | 4.74% | 6.45% | 4.43% | 3.33% |
| Item | w = 0.05 | w = 0.06 | w = 0.07 | w = 0.08 | w = 0.09 |
|---|---|---|---|---|---|
| Average price (CNY) | 0.7756 | 0.7368 | 0.7153 | 0.7189 | 0.7229 |
| Total economic benefit (CNY) | 62,833 | 63,358 | 63,798 | 63,726 | 63,593 |
| Peak netload (kW) | 1148.6 | 1043.8 | 951.2 | 1061.3 | 1301.5 |
| PPTCL (%) | 73.08 | 74.24 | 75.56 | 76.68 | 77.59 |
| Load rate | 0.3357 | 0.3748 | 0.4186 | 0.3675 | 0.2985 |
© 2017 by the authors. Licensee MDPI, Basel, Switzerland. This article is an open access article distributed under the terms and conditions of the Creative Commons Attribution (CC BY) license (http://creativecommons.org/licenses/by/4.0/).
Share and Cite
Liu, N.; Cheng, M.; Ma, L. Multi-Party Energy Management for Networks of PV-Assisted Charging Stations: A Game Theoretical Approach. Energies 2017, 10, 905. https://doi.org/10.3390/en10070905
Liu N, Cheng M, Ma L. Multi-Party Energy Management for Networks of PV-Assisted Charging Stations: A Game Theoretical Approach. Energies. 2017; 10(7):905. https://doi.org/10.3390/en10070905
Chicago/Turabian StyleLiu, Nian, Minyang Cheng, and Li Ma. 2017. "Multi-Party Energy Management for Networks of PV-Assisted Charging Stations: A Game Theoretical Approach" Energies 10, no. 7: 905. https://doi.org/10.3390/en10070905
APA StyleLiu, N., Cheng, M., & Ma, L. (2017). Multi-Party Energy Management for Networks of PV-Assisted Charging Stations: A Game Theoretical Approach. Energies, 10(7), 905. https://doi.org/10.3390/en10070905