1. Introduction
By the mid-1980s, several countries around the world took the initiative of making significant changes in the energy markets, usually called liberalization, privatization and/or restructuring of the electricity supply industry. The motivations that led to these changes may differ in nature, but are basically all stimulated by the belief that the introduction of competition can bring significant benefits to the system. These benefits are visible at the level of energy prices, which have become more transparent. Improvements in productivity, improvements in better rationalization of labour and fuel costs, higher choice of generation technologies, investment risks and other measures, will lead to lower electricity costs and better services that benefit end consumers [
1].
Sioshansi and Pfaffenberger in [
2], looked at market restructuring initiatives around the world, making fruitful comparisons of what seems to be happening, and pointing to some of the key lessons that have been learned, leading to high monetary costs. As can be seen in the literature on market reform, it is often indicated that in most cases the reform leads to unplanned consequences which, according to [
2], should be treated as a subsequent “reform of reforms”. In addition, market reform in many countries has introduced new problems, risks and concerns, some of which are not fully resolved. The reform of electricity market reforms was designed to address the unforeseen and unintended consequences of the initial reform. The theoretical design of markets may have inherent flaws that only became apparent after some time or during the course of an extreme event, for example: currency devaluation, political crisis, serious droughts, among others. These events could spoil what could have been a mayor result [
3]. Often a major impediment to such cross-border initiatives is the fact that working with different countries with different laws can often be an obstacle to their implementation. One of the main market design problems is present in the Final Report of the Sector Inquiry on Capacity Mechanisms, EU report of 30/11/2016 [
4], where the problem with generation capacity compensation due to the energy only markets with cap price is discussed.
These changes in the electricity markets were one of the main European Union’s objectives. With the three legislative packages (1996, 2003, 2009), the European Union progressively opened up this sector to competition, aiming at a European internal market for electricity [
5,
6]. European directives are still being implemented by the Member States in their respective legislation. The planned integrated European market has not yet been fully achieved and the European electricity sector is still subject to continuous changes [
7]. With the European market standardized, the EU wants all states to practice very similar electricity pricing in order to eliminate inequalities and make it possible for this price to positively influence the economic development of each country. In a research paper on European energy markets, The Economist laid out three main reasons for not creating a pan-European system energy market [
8]:
Deliberate state interference motivated by a desire to support so-called national energy champions.
Lack of interest by dominant players or governments to build additional transmission lines to facilitate cross-border trade.
Weak enforcement of European directives at the country level.
According to recent data from the European Commission (EC), it was possible to circumvent these and other reasons [
4]. In 2016, very similar values of electricity prices were obtained throughout Europe. This electricity price depends on several factors, including fuel mix, cross-border interconnections, market coupling, market concentration of suppliers and weather conditions [
4]. If the price of electricity is standardized, it may mean that the factors influencing it are stable and reliable. In the case of coupling, European markets are on the right implementation path.
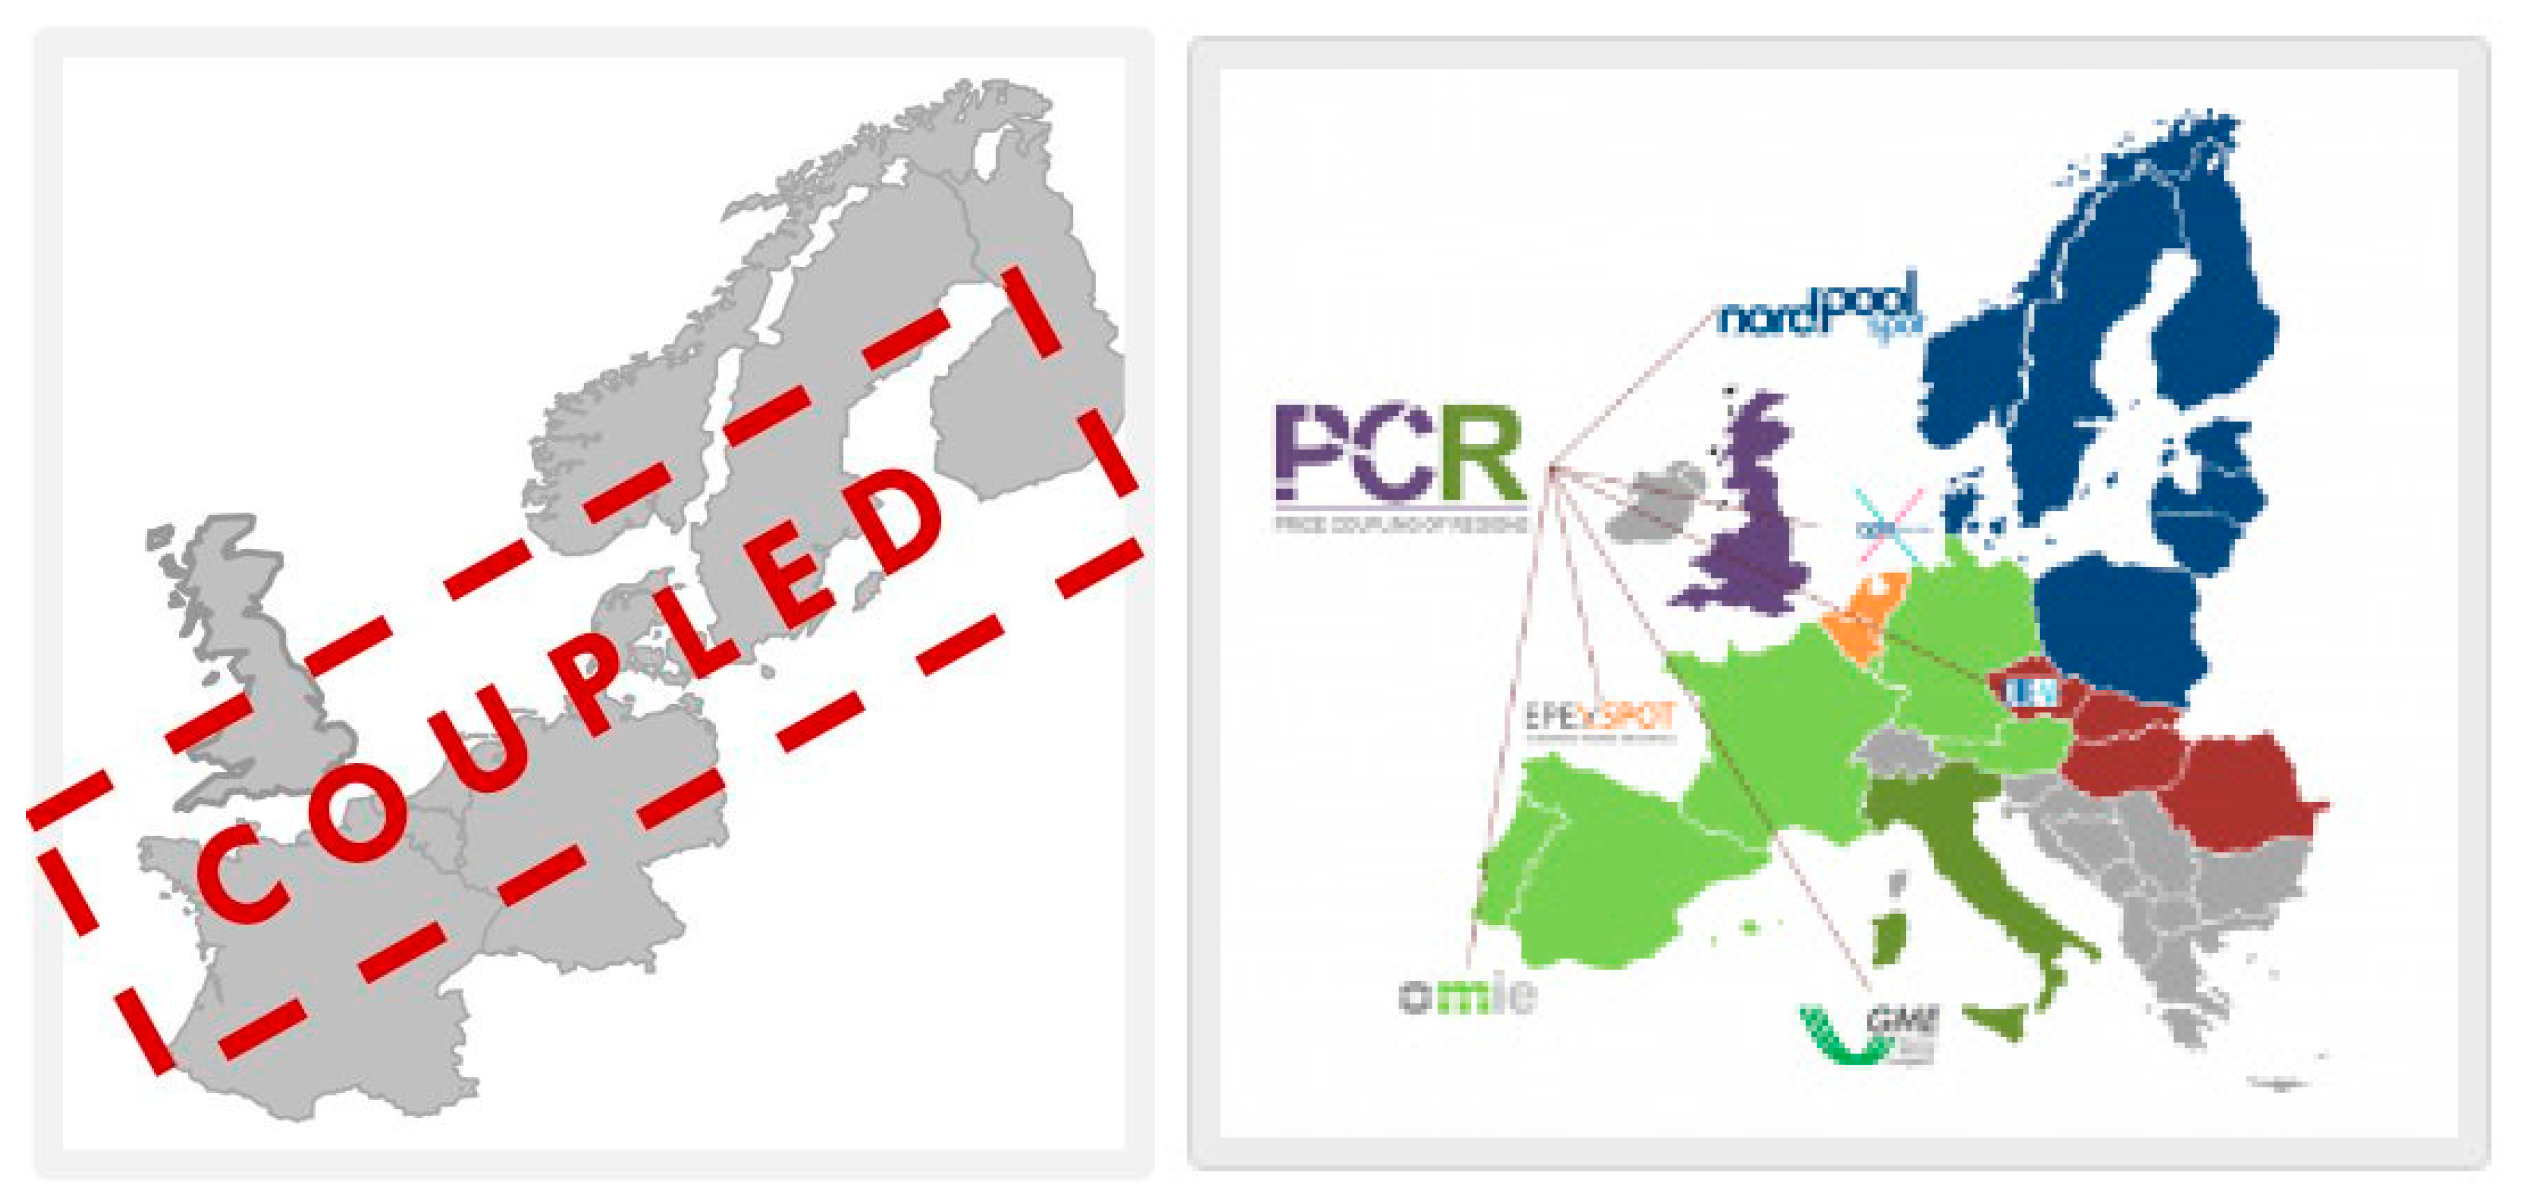
There are already some projects that have been implemented towards the creation of the single European market. The Price Coupling on 4 February 2014 provided an important step towards the creation of the integrated European market. This initiative was aimed at the countries of Northern Western Europe (NWE), being the first initiative of the Price Coupling, which was considered as a starting point for other regions to join [
9].
In
Figure 1 it is possible to observe the countries that were part of this first initiative of the PCR, and countries that incorporate PCR, and as can be seen there are many more countries in this last initiative, namely France, Belgium, Holland, Germany, United Kingdom, Denmark, Norway, Sweden and Finland. After the coupling described above, other couplings have come up, such as South-Western Europe (SWE) Coupling (France, Spain, Portugal); Italian Borders Working Table (IBWT) (Austria, France, Greece, Italy, Slovenia, and Switzerland); The Multi-Regional Coupling (MRC) (cooperation between the Power Exchanges APX, Belpex, EPEX SPOT, Nord Pool Spot and OMIE); and PCR [
12]. PCR is a more recently project currently being operated by seven Power Exchanges: EPEX SPOT, GME, Nord Pool, OMIE, OPCOM, OTE and TGE, but also open to other European Power Exchanges wishing to join. PCR has the main objective of calculating electricity prices across Europe. It also optimizes the overall welfare and increases transparency of prices and flows [
13].
Wholesale market prices and even the consumption/generation variation throughout the time is often not reflected on the energy price of small consumers, so the consumers can feel it and adapt their behavior. A relevant exception is the example of Spanish Government in April of 2014, which has implemented a new mechanism that links the retail market electricity price to the wholesale market price. This mechanism has as objective to remove the regulation of the commodity prices in electricity bills for householders in Spain [
14]. As a result, decentralized and local electricity markets are being studied as a promising solution to complement current centralized wholesale markets, through the trade of demand response and distributed generation services. In this way, the consumers can feel the needs and changes from the local electricity markets through price-based signals. Also, electricity markets feel the changes of the small players as well. Several researches have proposed on this topic, e.g., the co-simulation of the buildings and local electricity markets has been studied in [
15]. In [
16], the authors have decomposed the global optimization problem into independent local optimization problems by a price-based control method. A solution based on market control structures in a smart grid scale, known as local market is addressed in [
17]. A local market in this work can be seen as a place where individual consumers and prosumers meet to trade energy in a neighborhood environment. Advantage of local markets is not only that self-generated electricity can be consumed locally but it also strengthens local distribution networks and provides new opportunities for local industry and regional businesses. Although a significant amount of work is being done in this domain (for instance, see the projects discussed in [
18,
19,
20] the large majority of the performed studies lacks the ability of replicability and scalability while being focused on a small part of the system and inhibiting too further understand its implications as a whole. A relevant exception in the New York electricity market [
21], where a local market structure has already been implemented, and whose results are being assessed as a pioneer solution for global electricity markets.
With these evolutions and changes in electricity markets, the modus operandi of the markets has become different, more competitive, where it is more difficult for the participants to achieve significant profits when selling their product because of the increasing competition. In this way, it is essential for the professionals of this area to understand the market principles and to know how to evaluate the investments in this environment of competitive economy [
22]. Simulation tools are used to try to overcome these problems. Through these it is intended to understand how the market mechanisms work, and how the integration of new market entities can affect the market results.
Simulation based on multiagent systems is one of the areas of artificial intelligence (AI) that allows analysing dynamic and adaptive systems with complex iterations between agents/components, such as energy markets [
23]. Energy market simulators provide users with the ability to test solutions, validate and experiment with different and new alternatives for the functioning of markets. Another possibility is the simulation of the inclusion of new agents allowing to perceive how the market reacts. Several simulation tools for electricity markets have emerged, among which we highlight the following: Agent-based Modeling of Electricity Systems (AMES) [
24] Electricity Market Complex Adaptive System (EMCAS) [
25], and Multi-Agent Simulator for Competitive Electricity Markets (MASCEM) [
23]. These simulation tools are advantageous in terms of operation and market regulation, since they were built from the perspective of market operation, giving little importance to the decision support of the entities that participate in the negotiations. In other words, the decision support of electricity market negotiating players is not explored in depth, thus there is a lack of comprehensive studies from the perspective of these players, such as the work presented in this paper.
Taking into account [
26], the authors approach the issue from the point of view of negotiation entities, where they mention that decision support for electricity market negotiation players is an area with little exploration, and it should be taken into account because it is essential in the decision making of the entities in their negotiations, enabling them to adapt to changing market environments and to being able to achieve more market share advantages.
Contributing to overcoming these limitations is the main objective of this study. These limitations suggest the need for the development of tools to support the participation of stakeholders in electricity markets, so that they are able to take actions that allow them to maximize their profits. Thus, the main purpose of this work is the development of a model for portfolio optimization that allows supporting the participation in electricity markets. In specific, this paper proposes an ad-hoc heuristic for the generation of adequate initial solutions for the metaheuristic optimization of markets participation portfolio. This heuristic aims at overcoming some limitations of previous models [
27,
28,
29] regarding their execution time and variability of the achieved solutions.
Portfolio optimization is widely used in finance and economics [
30]. This problem is a resource allocation one. In the case of economic and financial resources the resources are monetary amounts, which are distributed by the different portfolios in order to get the maximum return. The application of the theory of portfolios in the area of economics and finance has had many followers over the years, however, in energy markets the application of this methodology has had little adherence. The typical portfolio optimization problem that arose in economics and finance is devoted to maximize profits while minimizing the risk associated with the actions that lead to such profit. According to [
31], where the author considers the application of the theory of portfolios to the electric energy markets, it is considered as profit the allocation of electricity in the different markets and as risk the variation of the price that it obtained in the respective market during a certain time. In this sense, the author measures the risk of the asset (electricity) by means of historical prices. In the case of this study, the risk is not considered in the optimization, and the quantity allocated in each market is allocated in order to obtain the maximum profit. Nonetheless, there are already some publications focused on the energy sector, such as: Bar-Lev and Katz [
32], who were the pioneers in this area by analysing the acquisition of fossil fuels by the American energy industry. Later, in 2006, Krey and Zweifel [
33], used the technique to determine the efficient combinations of electricity generation sources for the US and Switzerland.
This work is divided in six sections: after the overview of the problem and identification of the existing limitations provided in this introductory section,
Section 2 presents an overview on the portfolio optimization problem, focusing on previous work in the energy sector area. The proposed methodology is presented in
Section 3, including the objective function, its constraints and the heuristic created for the problem. In
Section 4 a description of the case study is made and the results of the application of the proposed methodology are presented in
Section 5. Finally,
Section 6 presents the most relevant conclusions from this work.
2. Portfolio Optimization in Electricity Markets
There are already some approaches that apply the Markowitz model in electric power markets. Most of them use AI techniques to solve the problem, because these techniques show good results in a short time when compared to exact methods [
34]. In [
35], the author presents a portfolio optimization model using a Genetic Algorithm (GA) as a technique to solve the problem. It is concluded that GA is a robust and effective method in solving the portfolio optimization problem.
A methodology for participation in electric energy markets for the following day is presented in [
36] where the resolution of portfolio optimization is done using another AI technique, Particle Swarm Optimization (PSO) [
37], Initially an exposition is made on the importance of decision support techniques in the electricity markets, followed by a brief description of the decision support system, in which the optimization of portfolios is inserted. In the presented practical example, the market player can sell his electricity in five different markets and buy in only one. The author concludes that the proposed methodology is able to provide support in the participation of energy markets, and the PSO has also proved to be efficient in solving the optimization problem.
The PSO has shown ability to achieve good results in solving a wide variety of problems, and this is no exception. Several adaptations of traditional PSO have emerged over the years, with the goal of refining and improving the process of searching for problems of different Natures. The New Particle Swarm Optimization with Local Random Search (NPSO-LRS) [
38], has been applied to the portfolio optimization problem in [
39], and has shown clear improvements when compared to the traditional PSO method.
The concepts of quantum mechanics and physics motivated a new generation of optimization methods [
40]. Inspired by PSO theories and quantum mechanics, a new approach to PSO, the Quantum PSO (QPSO), was introduced [
41]. In [
42], one can see the application of the QPSO in solving the portfolio optimization problem applied to the electricity markets participation. There are other methods based on PSO that can be highlighted, such as the Evolutionary Particle Swarm Optimization (EPSO) [
43], which consists of a hybridization of PSO with evolutionary algorithms. The PSO variant called Migration Particle Swarm Optimization (MPSO) [
44], is also an interesting solution with great potential for solving the portfolios problem.
Another very popular technique of AI already applied to the portfolio optimization of electricity market participation is Simulated Annealing (SA) [
45], which is an optimization method that imitates the annealing process used in metallurgic processes. The final properties of this substance depend strongly on the cooling schedule applied, i.e., if it cools down quickly the resulting substance will be easily broken due to an imperfect structure, if it cools down slowly the resulting structure will be well organized and strong. In [
27] the resolution capabilities of this algorithm for the portfolio optimization problem are presented. In [
46], the authors address the portfolio optimization problem from the perspective of retailers operating in liberalized electricity markets. The proposed model is based on the classic Markowitz model. The behaviour of various markets entities is simulated, and the case study includes an optimization involving the risk management.
Recognizing the ability of metaheuristic approaches to solve optimization problems, more precisely regarding the portfolio optimization of electricity market players, and analysing the obtained results, two main gaps arise: (i) metaheuristic approaches are able to achieve approximate solutions in faster execution times than exact methods, but the execution time is still highly dependent on the dimension of the problem, which causes these methods to require larger execution times for larger problems, otherwise the achieved solutions are not sufficiently approximate to the global optimum solution; (ii) the variability of the achieved solutions is often high; i.e., the standard deviation of the solutions is usually high due to the randomness in the search process.
These gaps indicate that there is a need to strengthen the current methods, making them suitable to solve the envisaged problem, regardless of the simulation scenario and its dimension. In order to overcome these limitations, this work proposes an ad-hoc heuristic based on the previous knowledge, which allows the generation of an adequate initial solution that can be used to initiate the search process of different metaheuristic methods. This heuristic makes the methods more reliable, as it decreases the variability of the solutions, while reducing the need for larger execution times during the search process.
4. Case Study
This case study considers the experimentation of seven metaheuristic optimization methods, which are applied to solving the optimization of the presented portfolio optimization formulation. The considered metaheuristics are: PSO, EPSO, QPSO, NPSO-LRS, MPSO-TVAC, GA and SA. The initial solutions for the optimization methods are calculated using the proposed initial solution heuristic. The algorithms’ performance when using the proposed heuristic and when not using it (using a random initial solution) is compared.
A realistic scenario considering five different market types has been used, taking as a basis MIBEL, the Iberian electricity market [
49]. The markets considered in this study are: the day-ahead spot market, the balancing (or intra-day) market – both of these markets are executed by means of a symmetric auction pool, where both seller and buyer player submit bids that are composed by a target price and a volume (to sell or buy); negotiations by means of bilateral contracts, and a local market, at the smart-grid (SG) level, which also is assumed to work by means of bilateral contracts, between local entities, i.e., geographically close players. Bilateral contracts can be established regarding the volume that is negotiated directly between two parties, and the price that is agreed between them. The balancing market is composed by different market sessions. When participating in the day-ahead spot market, the supported seller player can only sell. On the other hand, in all other market types it is possible to buy and sell, depending on the expected prices. Limits have also been imposed on the possible amount of negotiation in each market. In this case, it is only possible to buy up to 10 MW in each market in each period of negotiation, which makes a total of 40 MW purchased. This condition limits the search space of variables, and avoids solution that tend to infinite purchase or sale amounts in certain markets. It is possible to sell power on any market, and it can be transacted as a whole or in installments. The player, representing an aggregator of renewable generation, has 10 MW for sale. The inputs for the portfolio optimization are: the number of days and negotiation periods; the number of different markets and the associated number of negotiation sessions; the limits for purchase and sale in each session of each market; the expected negotiation price in each session of each market for each period of each day, depending on the negotiation volume; and finally, the amount of TEP to be allocated by the different markets
In the balancing market, the player can only sell or buy in each session in each period. Contrarily, in bilateral contracts and local markets both sale and purchase in the same period (by negotiating with different players) is allowed. As mentioned before, bilateral negotiation in many market operators, such as MIBEL, is free. Players are able to establish deals directly with other parties. In this way, by playing strategically, players can establish both sale and purchase agreements for the same period, with different entities, if the achieved return will be advantageous.
Real electricity market prices data of the day-ahead spot market, the intraday market, and bilateral contracts have been extracted from website of the Iberian electricity market operator MIBEL [
49]. Local SG market prices are based on the results from previous studies [
29]. All metaheuristic methods have been implemented in MatLab software (Version - R2016a, MathWorks, Natick, MA, USA), on a computer compatible with 1 processors Intel
® Xeon
® w3565 3.20GHz, with 4 Cores, 8 GB of RAM and operating system Windows 10 64bits.
5. Results
Table 1 presents the result of the application of the proposed initial solution heuristic for the considered case study. The action in each market is a variable for the problem and constitutes a solution with a certain objective function value. As was previously mentioned, seven different metaheuristics have been implemented, with two versions for each metaheuristic. In the first version, a random solution for starting search point is considered and the second version considers the search process starting with the solution of
Table 1.
The results for the first simulation period of the considered day are presented in
Table 2. These results regard the different optimization methods when using an initial random solution, and when using the initial solution generated by the proposed heuristic, presented in subchapter 3.0 (methods with the suffix -ST). When using the proposed heuristic, all algorithms initiate the searching process starting from a solution defined by the set of rules expressed by the heuristic, i.e., the solution presented in
Table 1. All the algorithms have been executed under the same conditions (same machine, same input data, etc.) in order to avoid variations due to external factors. A total of 1000 executions have been run for each simulation.
As
Table 2 shows, the use of the initial solution generated by the proposed heuristic has an impact on the objective function results. The work presented in [
34] shows the comparison between the exact resolution of the problem obtained by a Mixed Integer Linear Programming and an PSO algorithm. This study shows that the execution time for the exact resolution (984,960 (s)) is very high when compared to a metaheuristic resolution (22.97 (s)) for 24 periods of optimization.
As can be observed, the algorithms with random solution present good execution times in an acceptable number of iterations when compared to the deterministic resolution [
29]. In fact, the objective function maximum in several algorithms is very close when comparing the results of two different approaches (with and without the use of the proposed method. In
Table 2 it is not noticeable, but the values are more extensive and have more decimal places, which show that the values with the proposed heuristic are generally a little higher them random solution. This can be consulted in [
50], and in
Table 3 it is possible to observe the differences for objective function values.
As can be seen from
Table 2, the use of the proposed initial solution results in solutions that are able to achieve higher objective function results than those achieved by the several methods when using random initial solutions. The maximum achieved values with or without initial solution are rather similar in most of the algorithms; however, these values are achieved very rarely in the total of the 1000 executed runs, mostly due to the randomness of the methods.
The initial solution also originates results in a higher average than methods when not using the heuristic, as well as a lower standard deviation. Thereby, the variability of results when using the initial solution is lower. Regarding the execution time and the number of iterations required to achieve the solution, the values are generally lower when using the proposed heuristic. However, in the PSO, QPSO and NPSO-LRS algorithms the values of mean number of iterations and execution time increase when compared to the solution without the proposed heuristic because, these algorithms are most of the times converging to a local maximum, rather than the global optimum. This makes the search process stop faster, and in a smaller number of iterations, but thus leading to a much lower mean objective function mean value. With the use of the proposed heuristic, the search process is located towards the localization of the global maximum, but still a more extensive search process is required in that localization in order to reach the global best objective function value.
The box plots for all methods are presented in
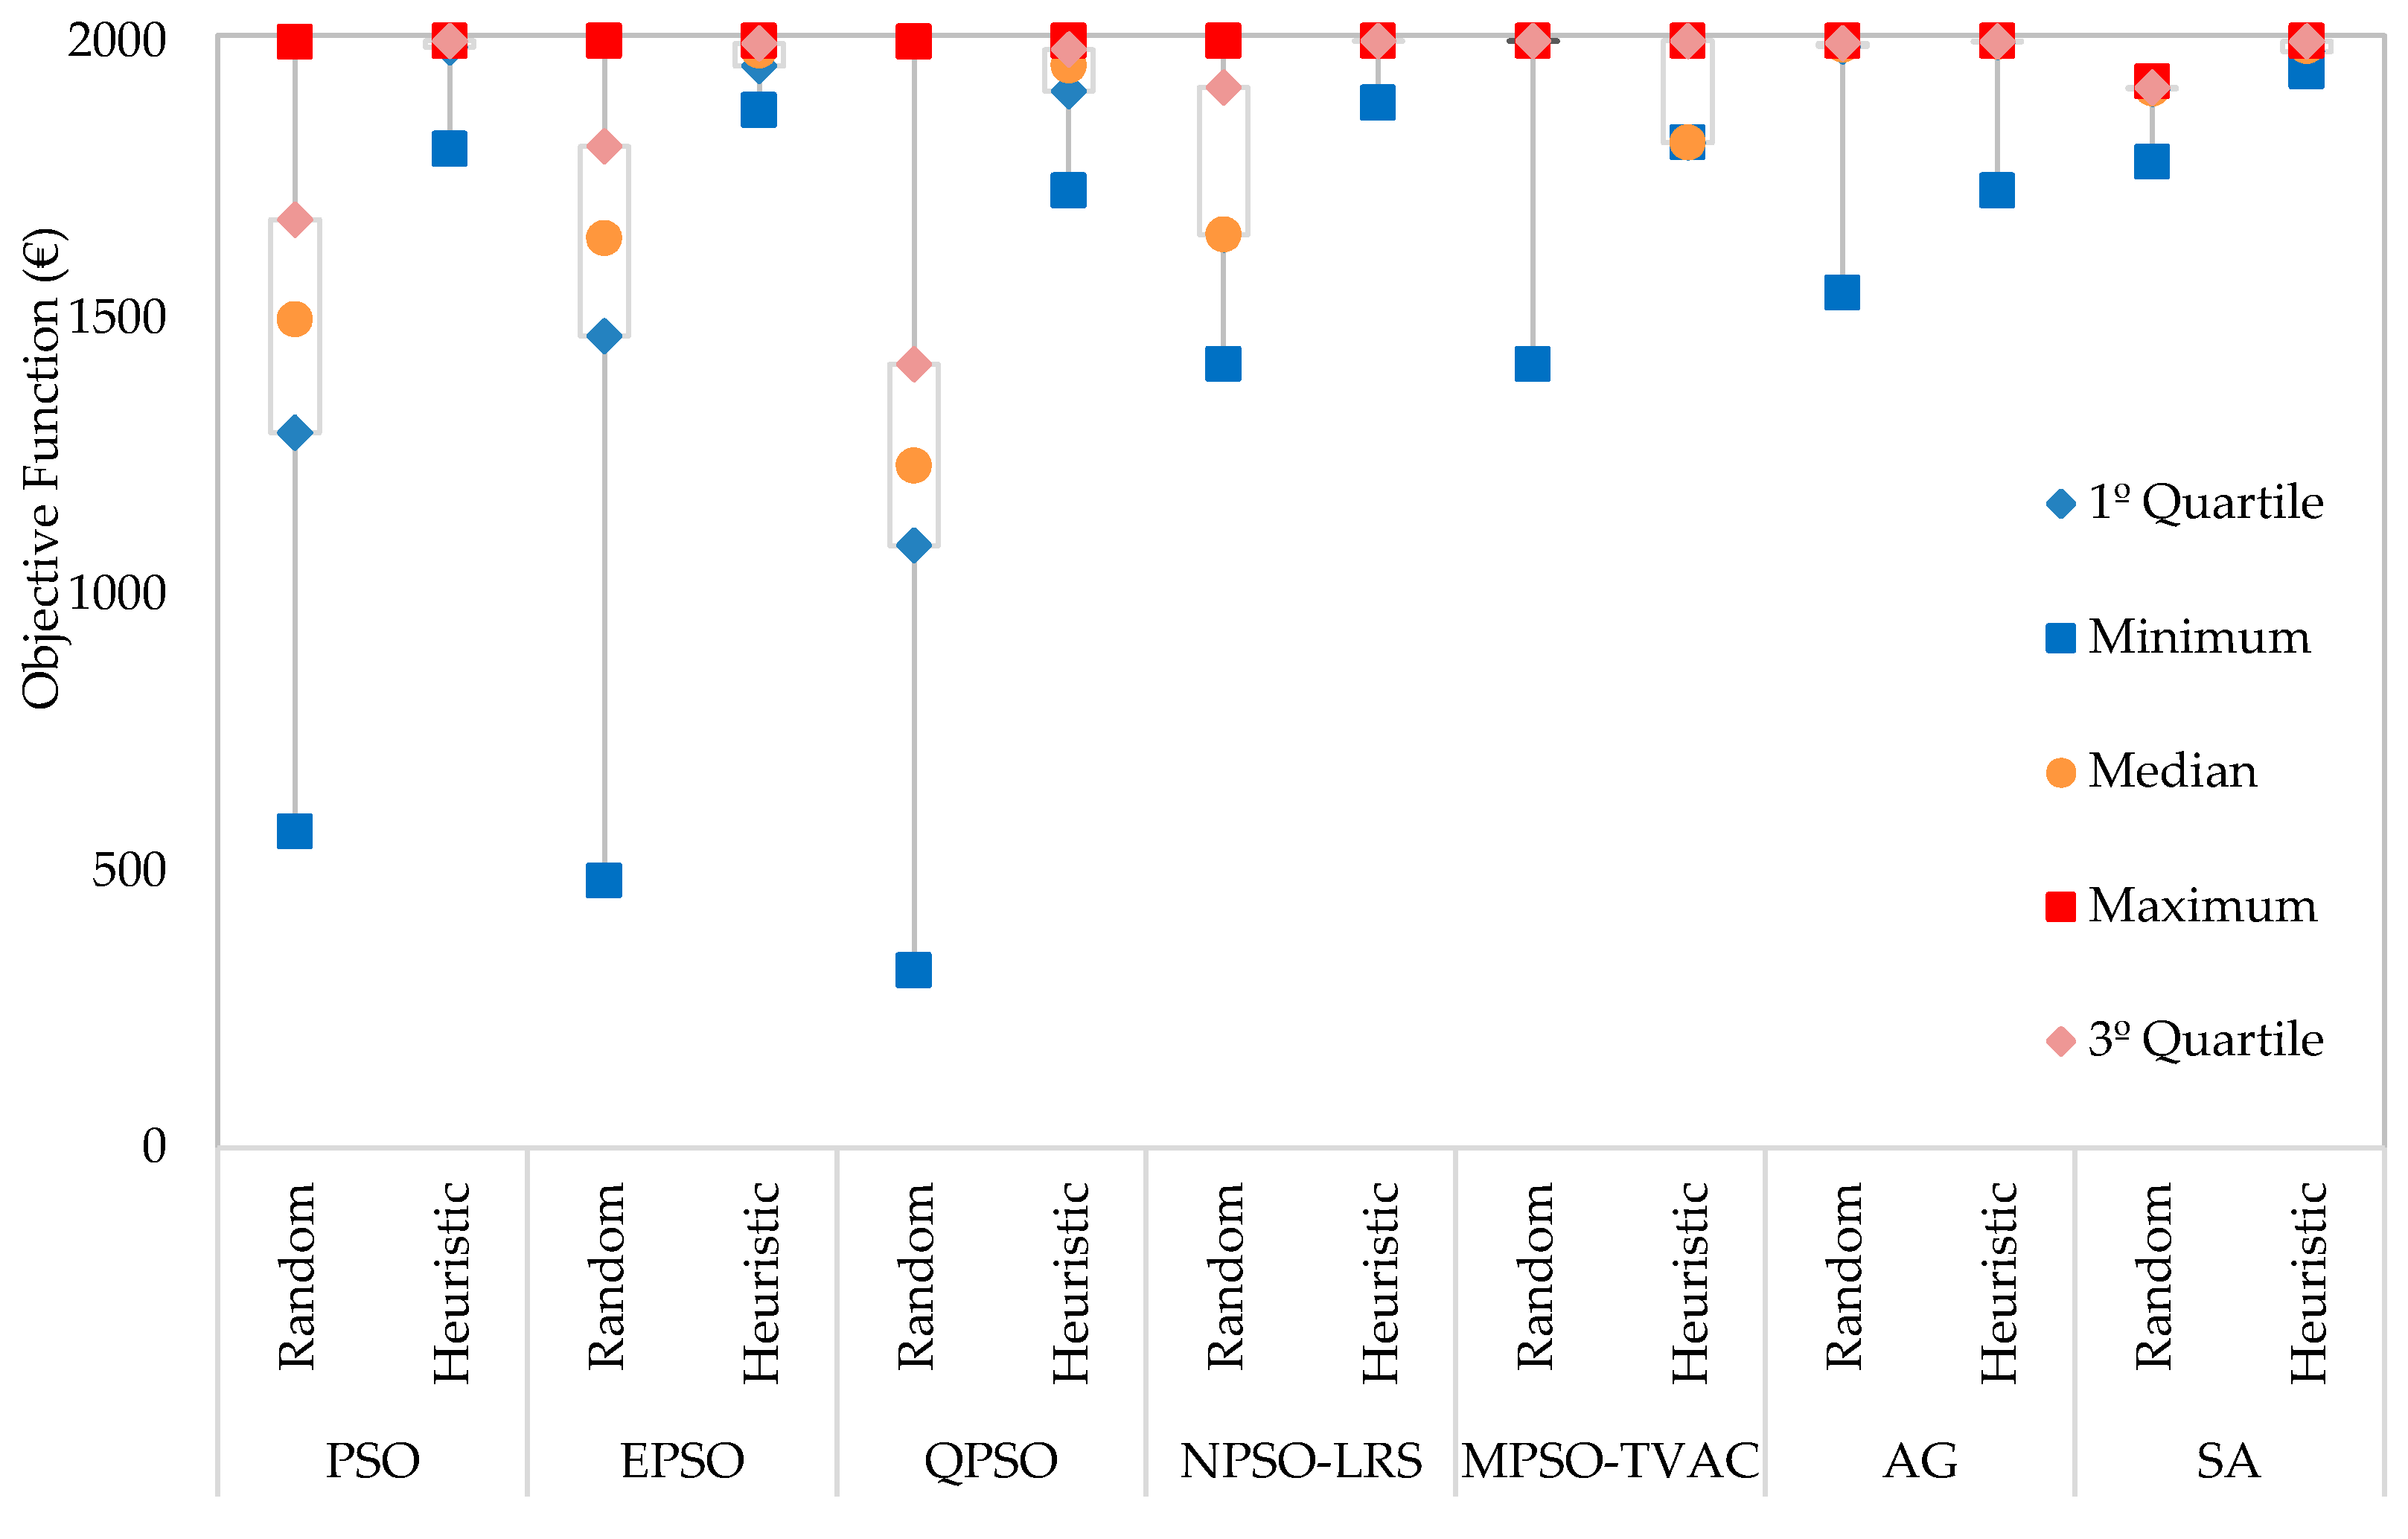
Figure 2. These plots are built based on the results of the simulations, namely the maximum and minimum, and also from the median, and from the first and third quartiles values. This representation allows assessing how the results are distributed, regarding their concentration, symmetry or identification of outliers. The box plots also enable comparing groups of results.
Figure 2 shows that the minimum achieved values are significantly different when using and when not using the proposed initial solution heuristic. QPSO is the method in which is verified the greatest improvement of the minimum value, namely from 1232.7 € to 1956 €. Also noteworthy is the value between 1st quartile and 3rd quartile, as it represents 50% of the observations; the smaller the distance between these two quartiles, the more consistent the algorithm is. The distance between these two quartiles has been decreased in all methods when using the proposed heuristic. By analysing the maximum achieved values it is visible that, although the methods using the proposed approach have achieved the best maxima, the algorithms using random initial solutions have also achieved solutions that are close to these values (at the cost of higher execution times and variability). The exception is the SA algorithm, which has been the method to reach a higher improvement.
In
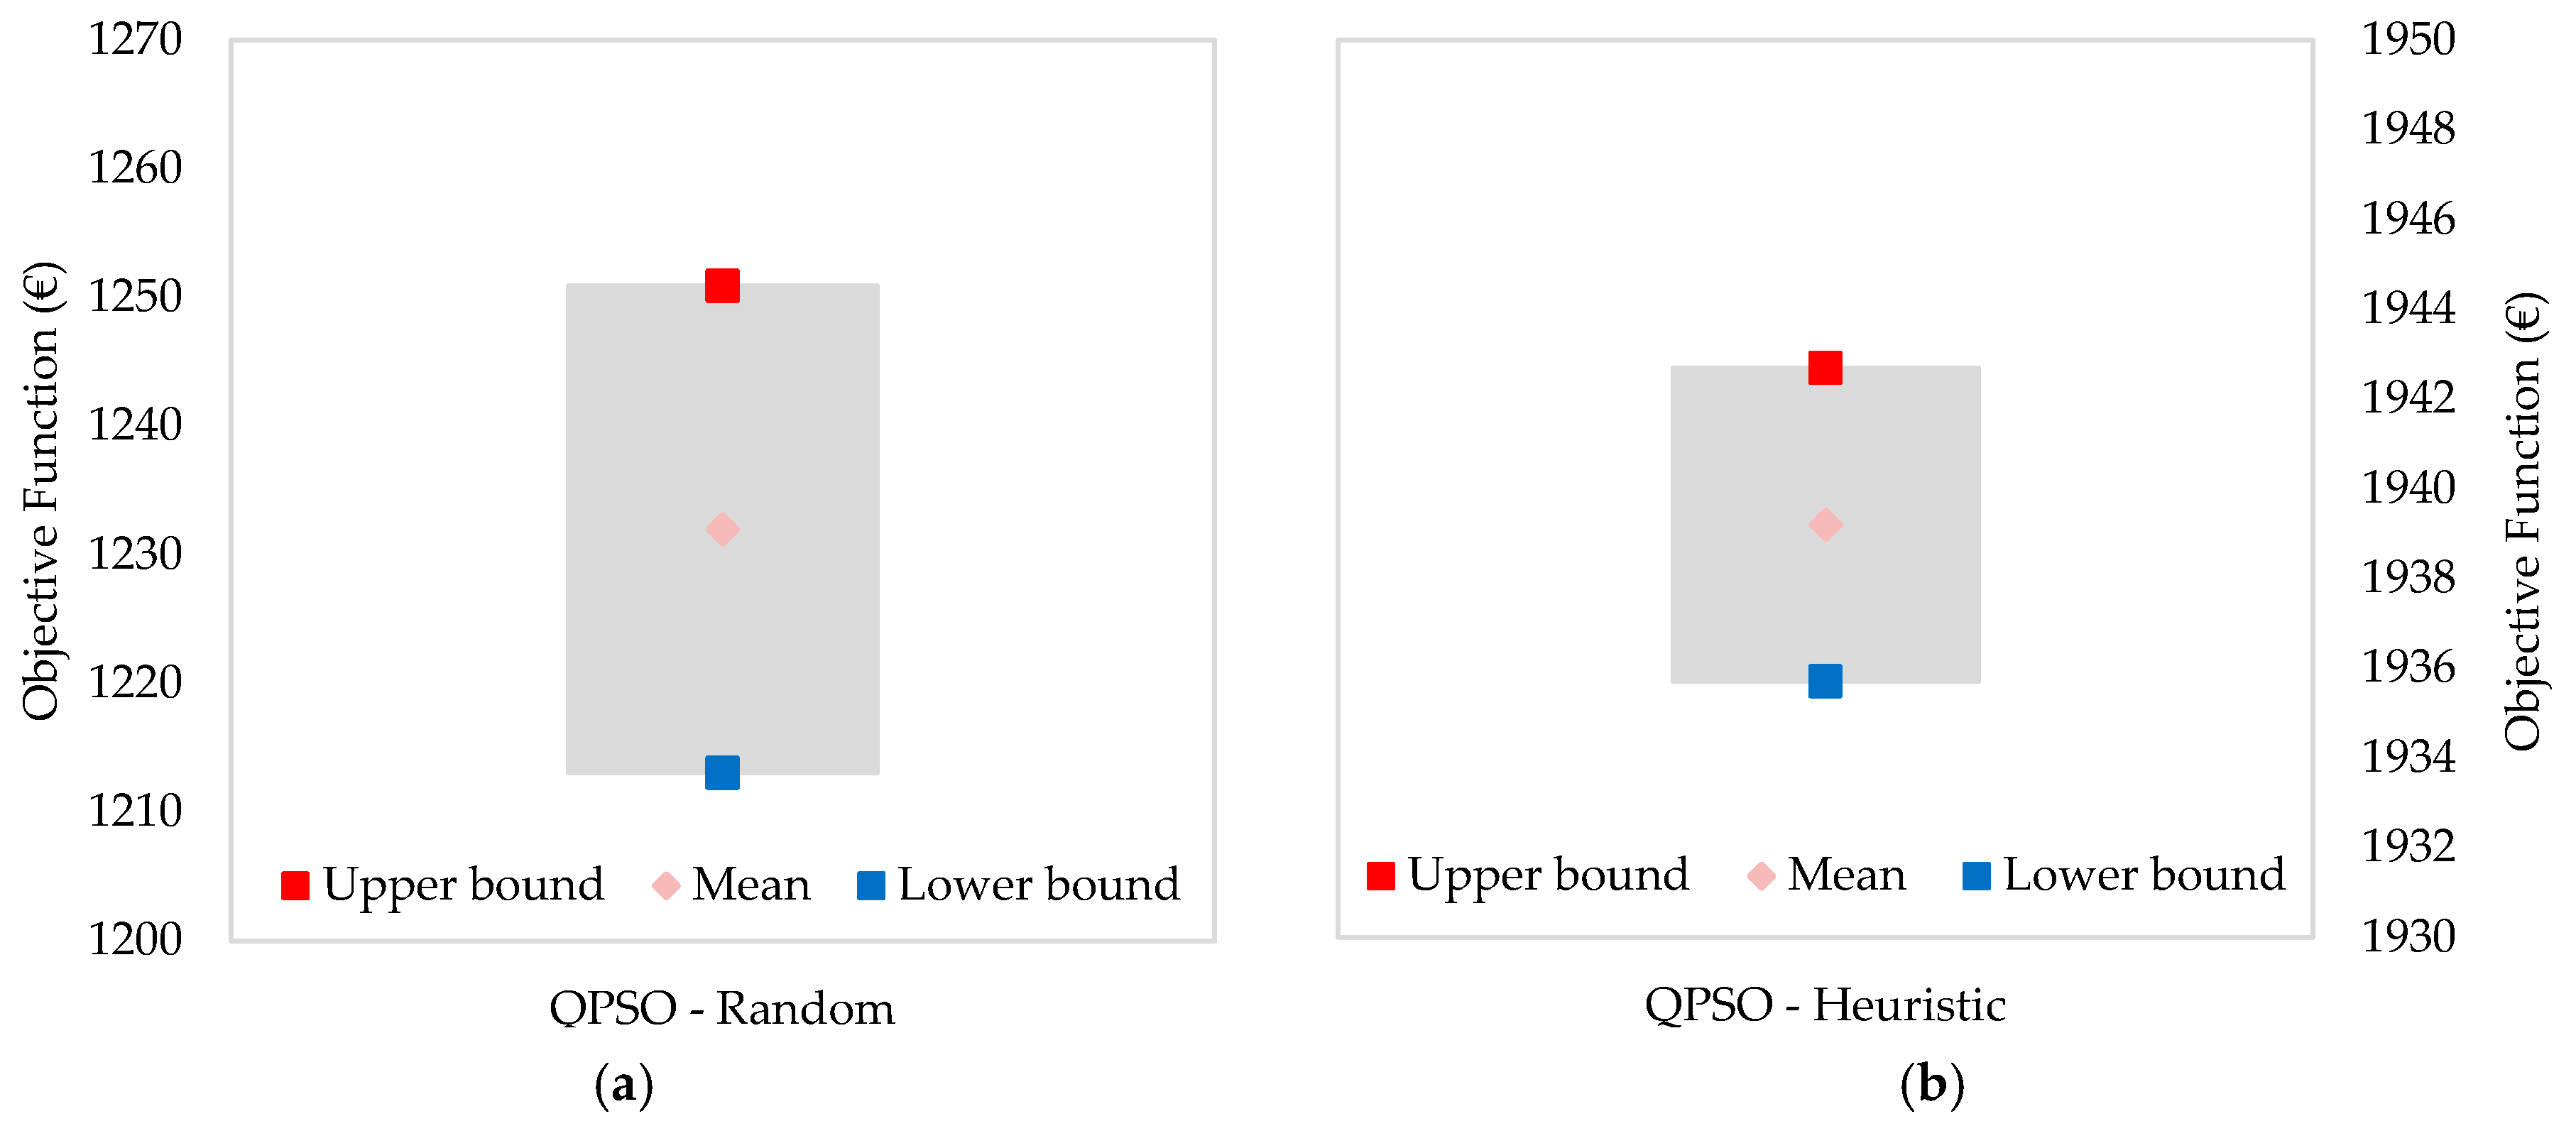
Figure 3 the confidence interval for QPSO with and without the use of the initial solution heuristic is presented. QPSO is shown because it was the method that presented the greatest improvement in terms of difference between upper and lower limits, when comparing the random initial solution and heuristic solution. The confidence interval (Equation (16)) is constructed from the observations of 1000 simulations
for each algorithm. Each set of observations has a mean (µ) and a standard deviation (
). The critical value (
) is dependent on the confidence level for the test (95%):
The 95% confidence interval for the QPSO with and without the proposed initial solution is represented in
Figure 3. With the confidence interval one can analyse how reliable the algorithm is, because in this case there are 95% chances of running this algorithm for this problem and obtaining a result between the upper and lower limits, adding or subtracting a certain error. In this case as one can see from
Figure 3b the confidence interval with the initial solution improved, as both the lower and upper limit values increased considerably (approximately 700 €).
Table 4 presents the results of upper bound, lower bound and error values for the 95% confidence intervals of all the executed simulations (1000 simulations).
From
Table 4 it is possible to see in more detail the values of the representation of
Figure 3.
Table 4 shows that there is a significant difference in most algorithms between the results when using the proposed approach and the randomly generated solution. The PSO, EPSO and QPSO are the methods that present the larger improvement with the use of the proposed method, as the upper and lower limits have risen considerably to values closer to the maximum value. As a consequence the error has decreased significantly. By analysing the 95% confidence intervals, it can be concluded that the proposed initial solution heuristic shows clear advantages over the random solution.
In
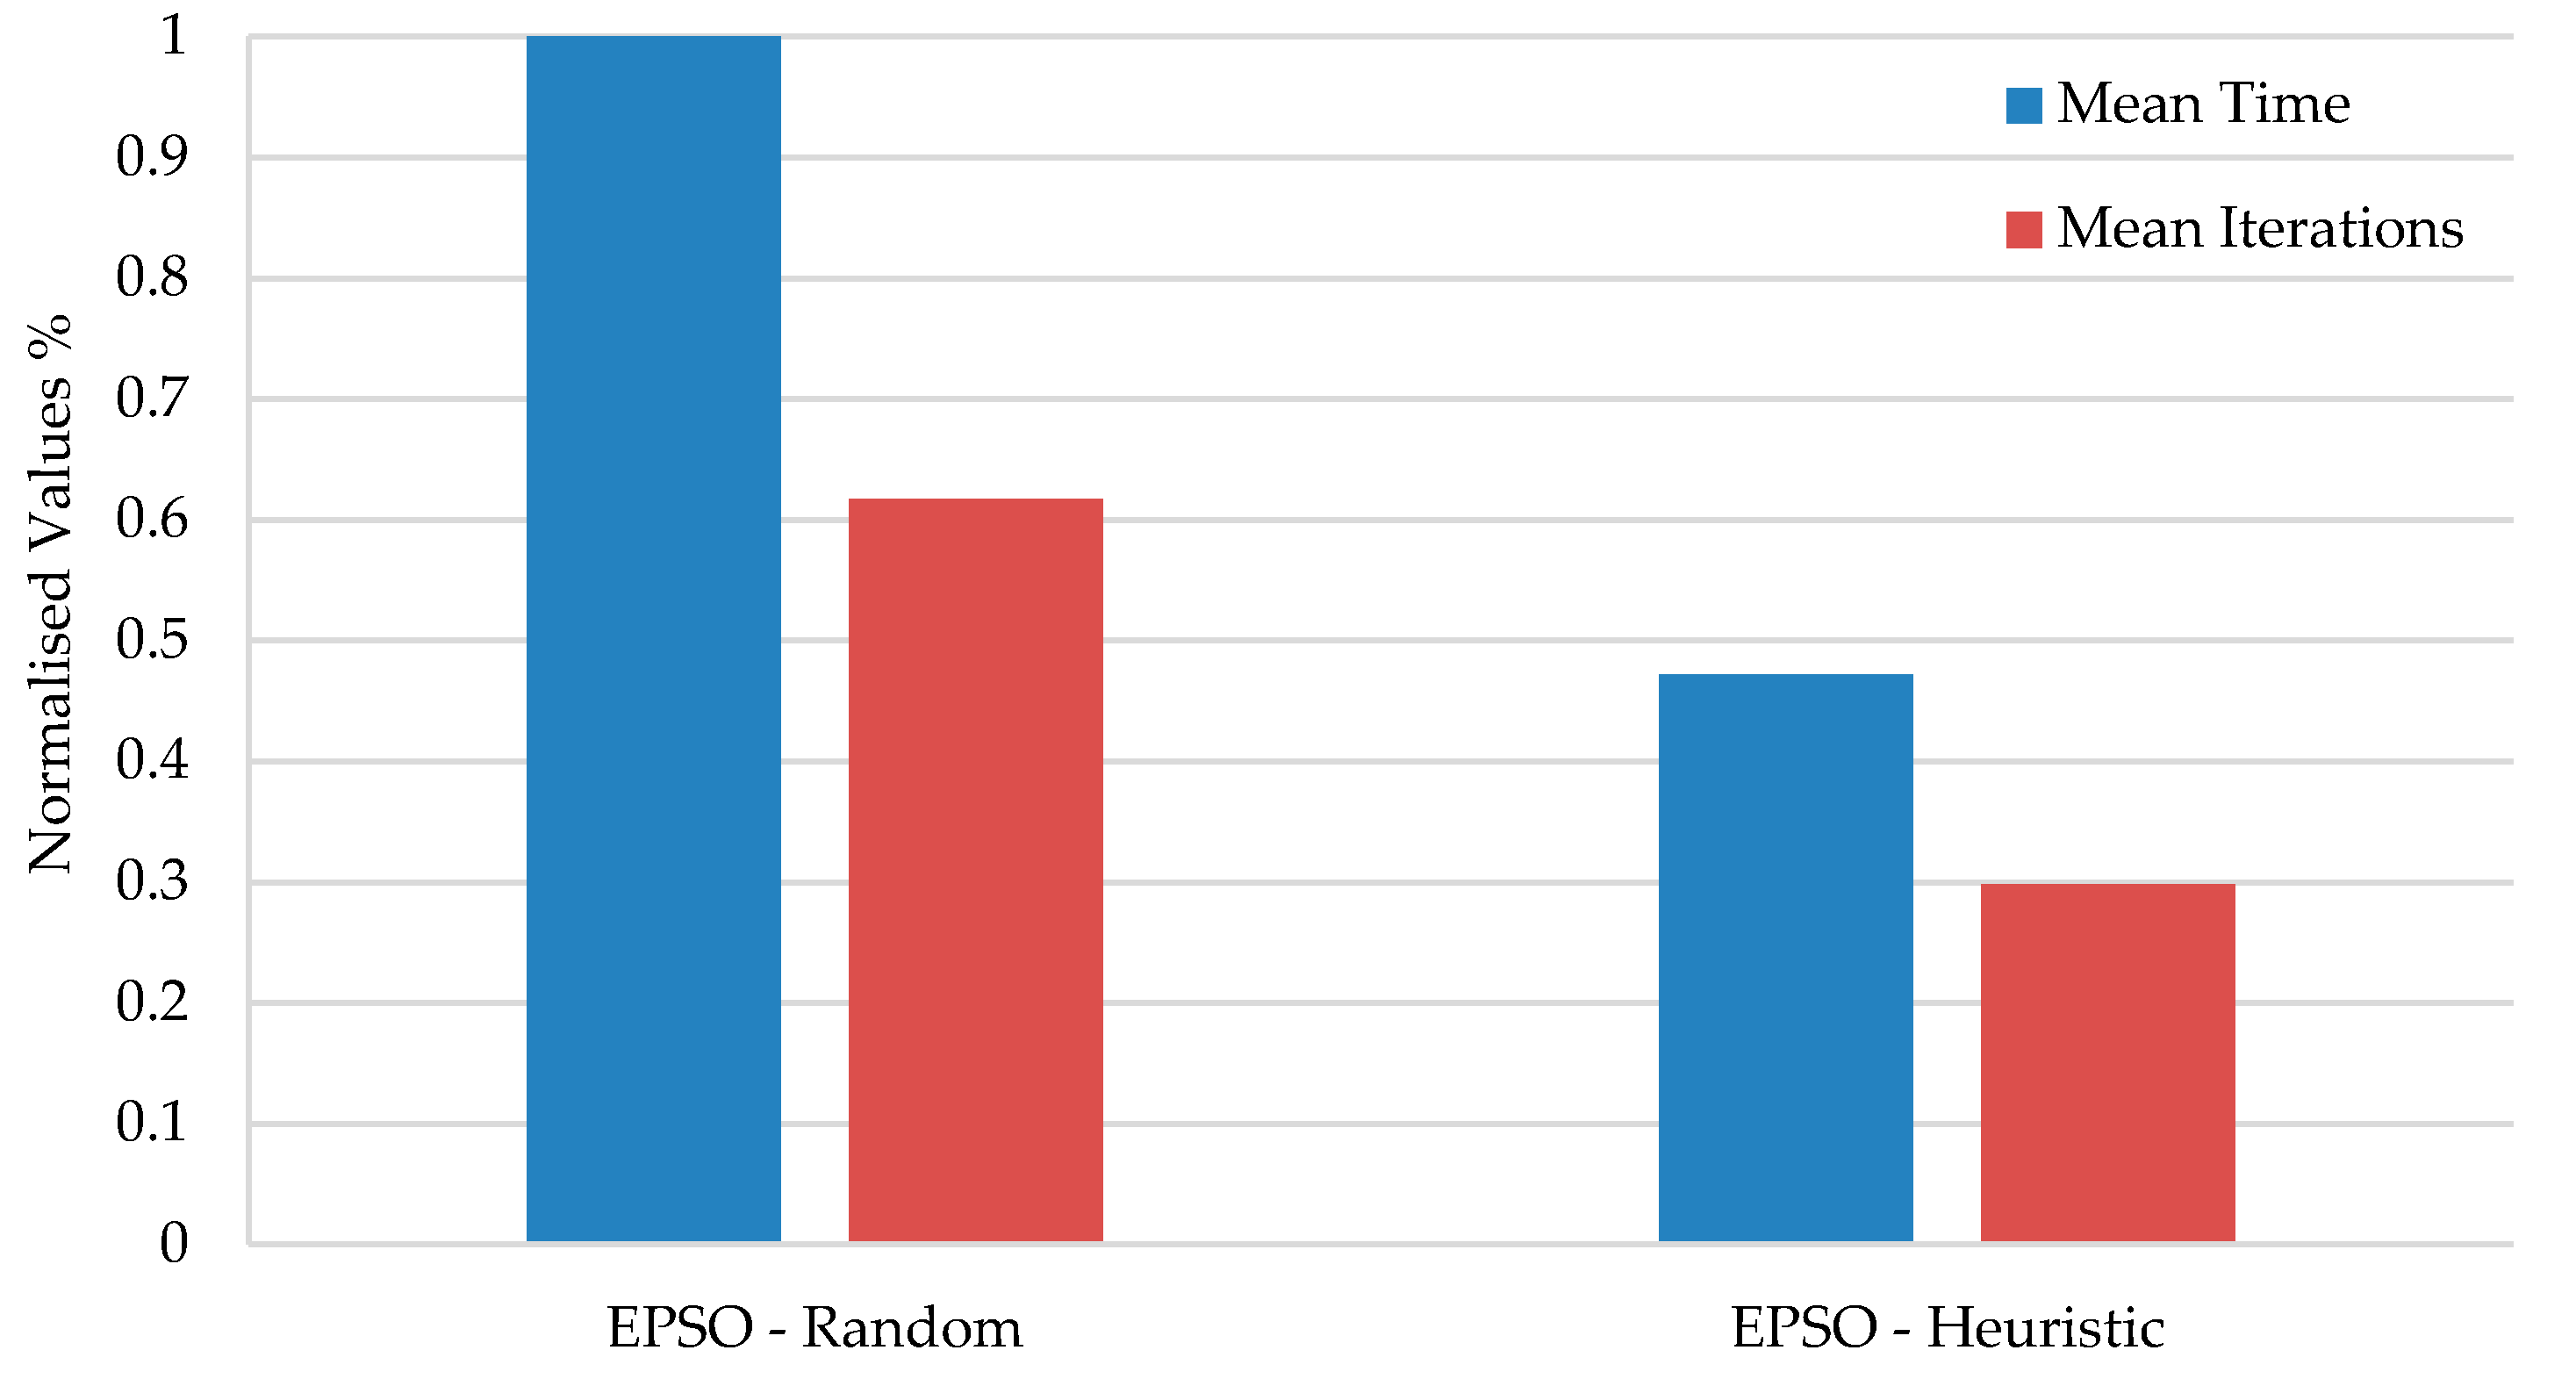
Figure 4 the average of the execution time as well as the average of iterations for the EPSO method is presented. The EPSO is chosen because it was in this algorithm that it was possible to reduce the most the number of iteration and execution time.
As can be seen from
Figure 4, the use of the proposed heuristic originates a decrease of both the number of iterations and the execution time. In the EPSO (
Figure 4), MPSO-TVAC, GA, SA this decrease is visible. This is due to the fact that, when using the proposed heuristic, the algorithm does not start the search with a random solution, which means that its search is not too extensive in terms of time and iterations.
Table 5 shows the results of T-test student for execution time and iterations number mean. The inclusion of this test aims to prove that the mean values with random solutions are higher than mean values with the proposed heuristic. In this table
Df represents the degrees of freedom,
H0 represents the possibility of the mean (execution time and number of iterations) without the proposed initial solution heuristic being smaller than the mean with the proposed methodology.
H1 represents the possibility of it being larger.
As one can see from
Table 5, the
p-value of both tests is lower than 0.05, which rejects
H0 and accepts
H1. Thus, it can be affirmed, with 95% confidence, that there was a decrease in the value of the average for execution time and number of iterations.
Figure 5 shows the variation of electricity prices with the traded amount. This representation allows explaining how the optimization model behaves.
As can be seen from
Figure 5, some markets (spot and balancing market sessions) present a unique market price for this hour, while bilateral and smart-grid markets present prices that vary with the negotiated amount. The expected result is that the optimization allocates the sales to markets and amounts where the price is higher and purchases when the price is lower.
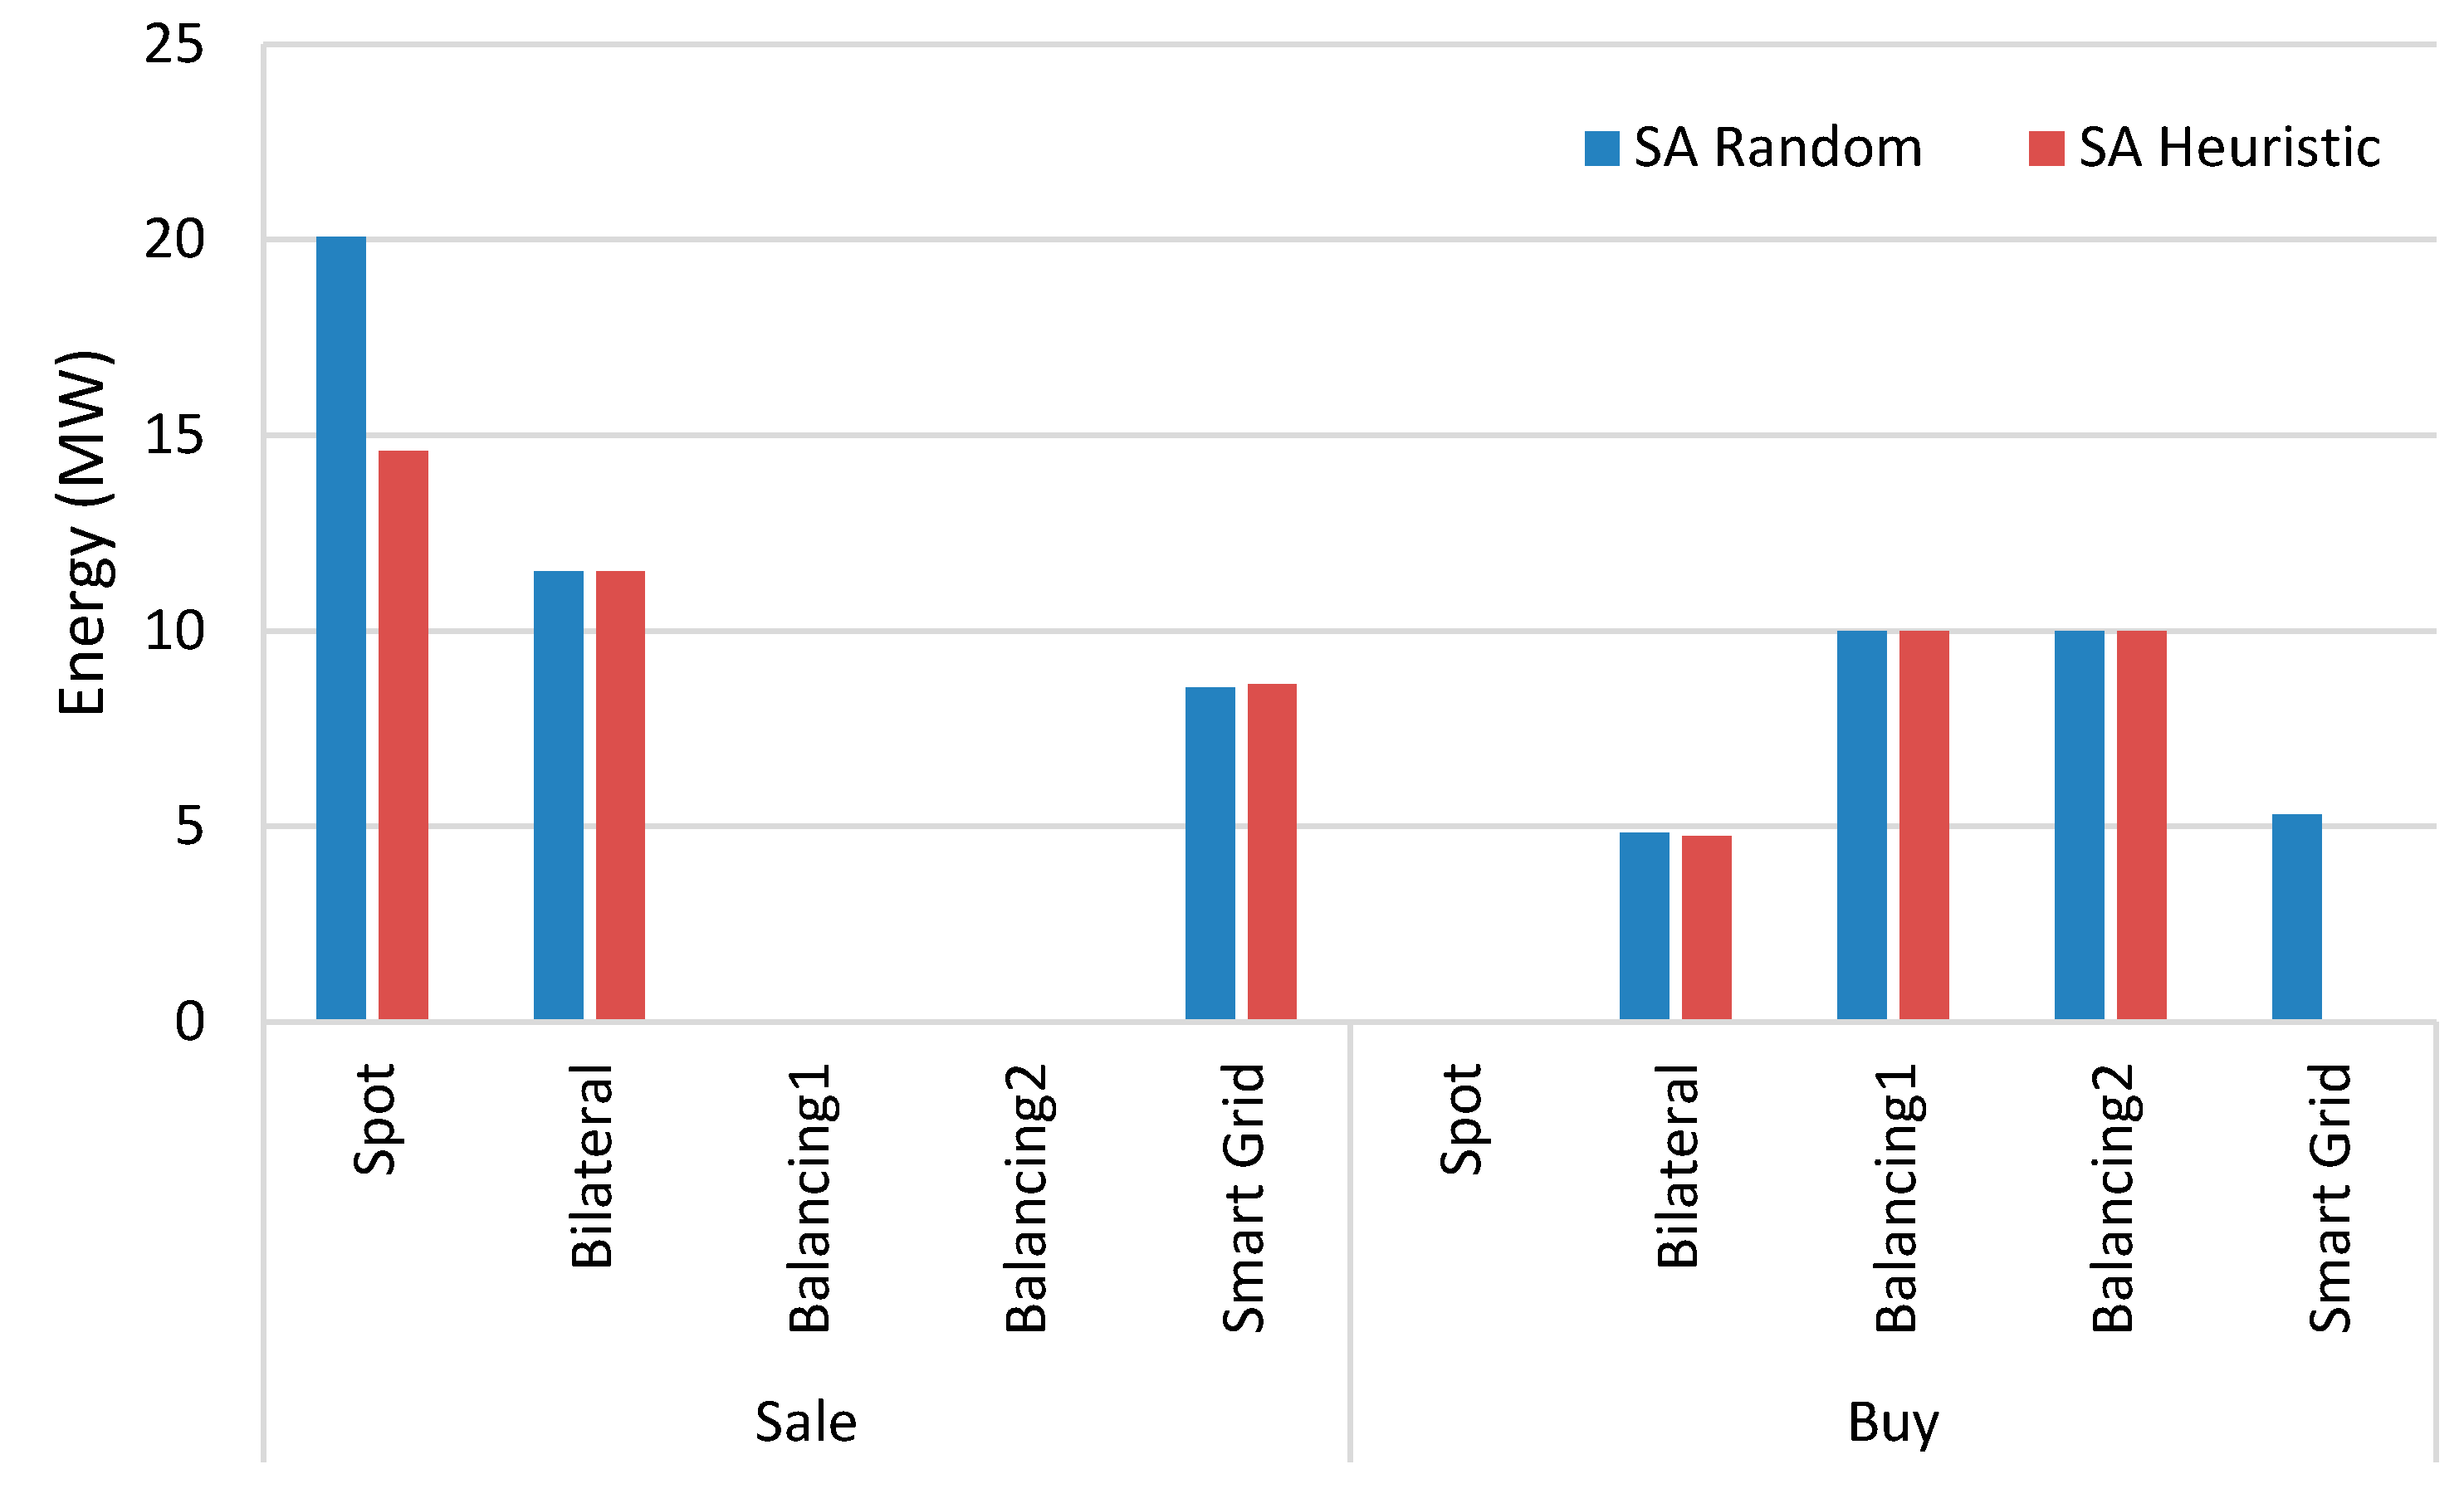
Figure 6 shows the energy purchased and sold in each market for the SA with random solution and with the proposed heuristic solution. The presented scheduling corresponds to the simulation in which both methods obtained the highest objective function solution, and as one can see, the difference is minimal.
By matching
Figure 5 and
Figure 6 it is possible to explain the functioning of the model for period 1. As expected, the model presents a solution with the purchased energy in the cheapest markets and sales in the most profitable. As the total energy that can be bought in each market is 10 MW, the maximum amount is bought in the balancing sessions (lower prices), and also a purchase of 4.7 MW in bilateral contracts, which present a low price for this amount. The sale is set to the smart grid in 8.6 MW, 13.3 MW in bilateral contracts and 13.8 MW in the spot market.
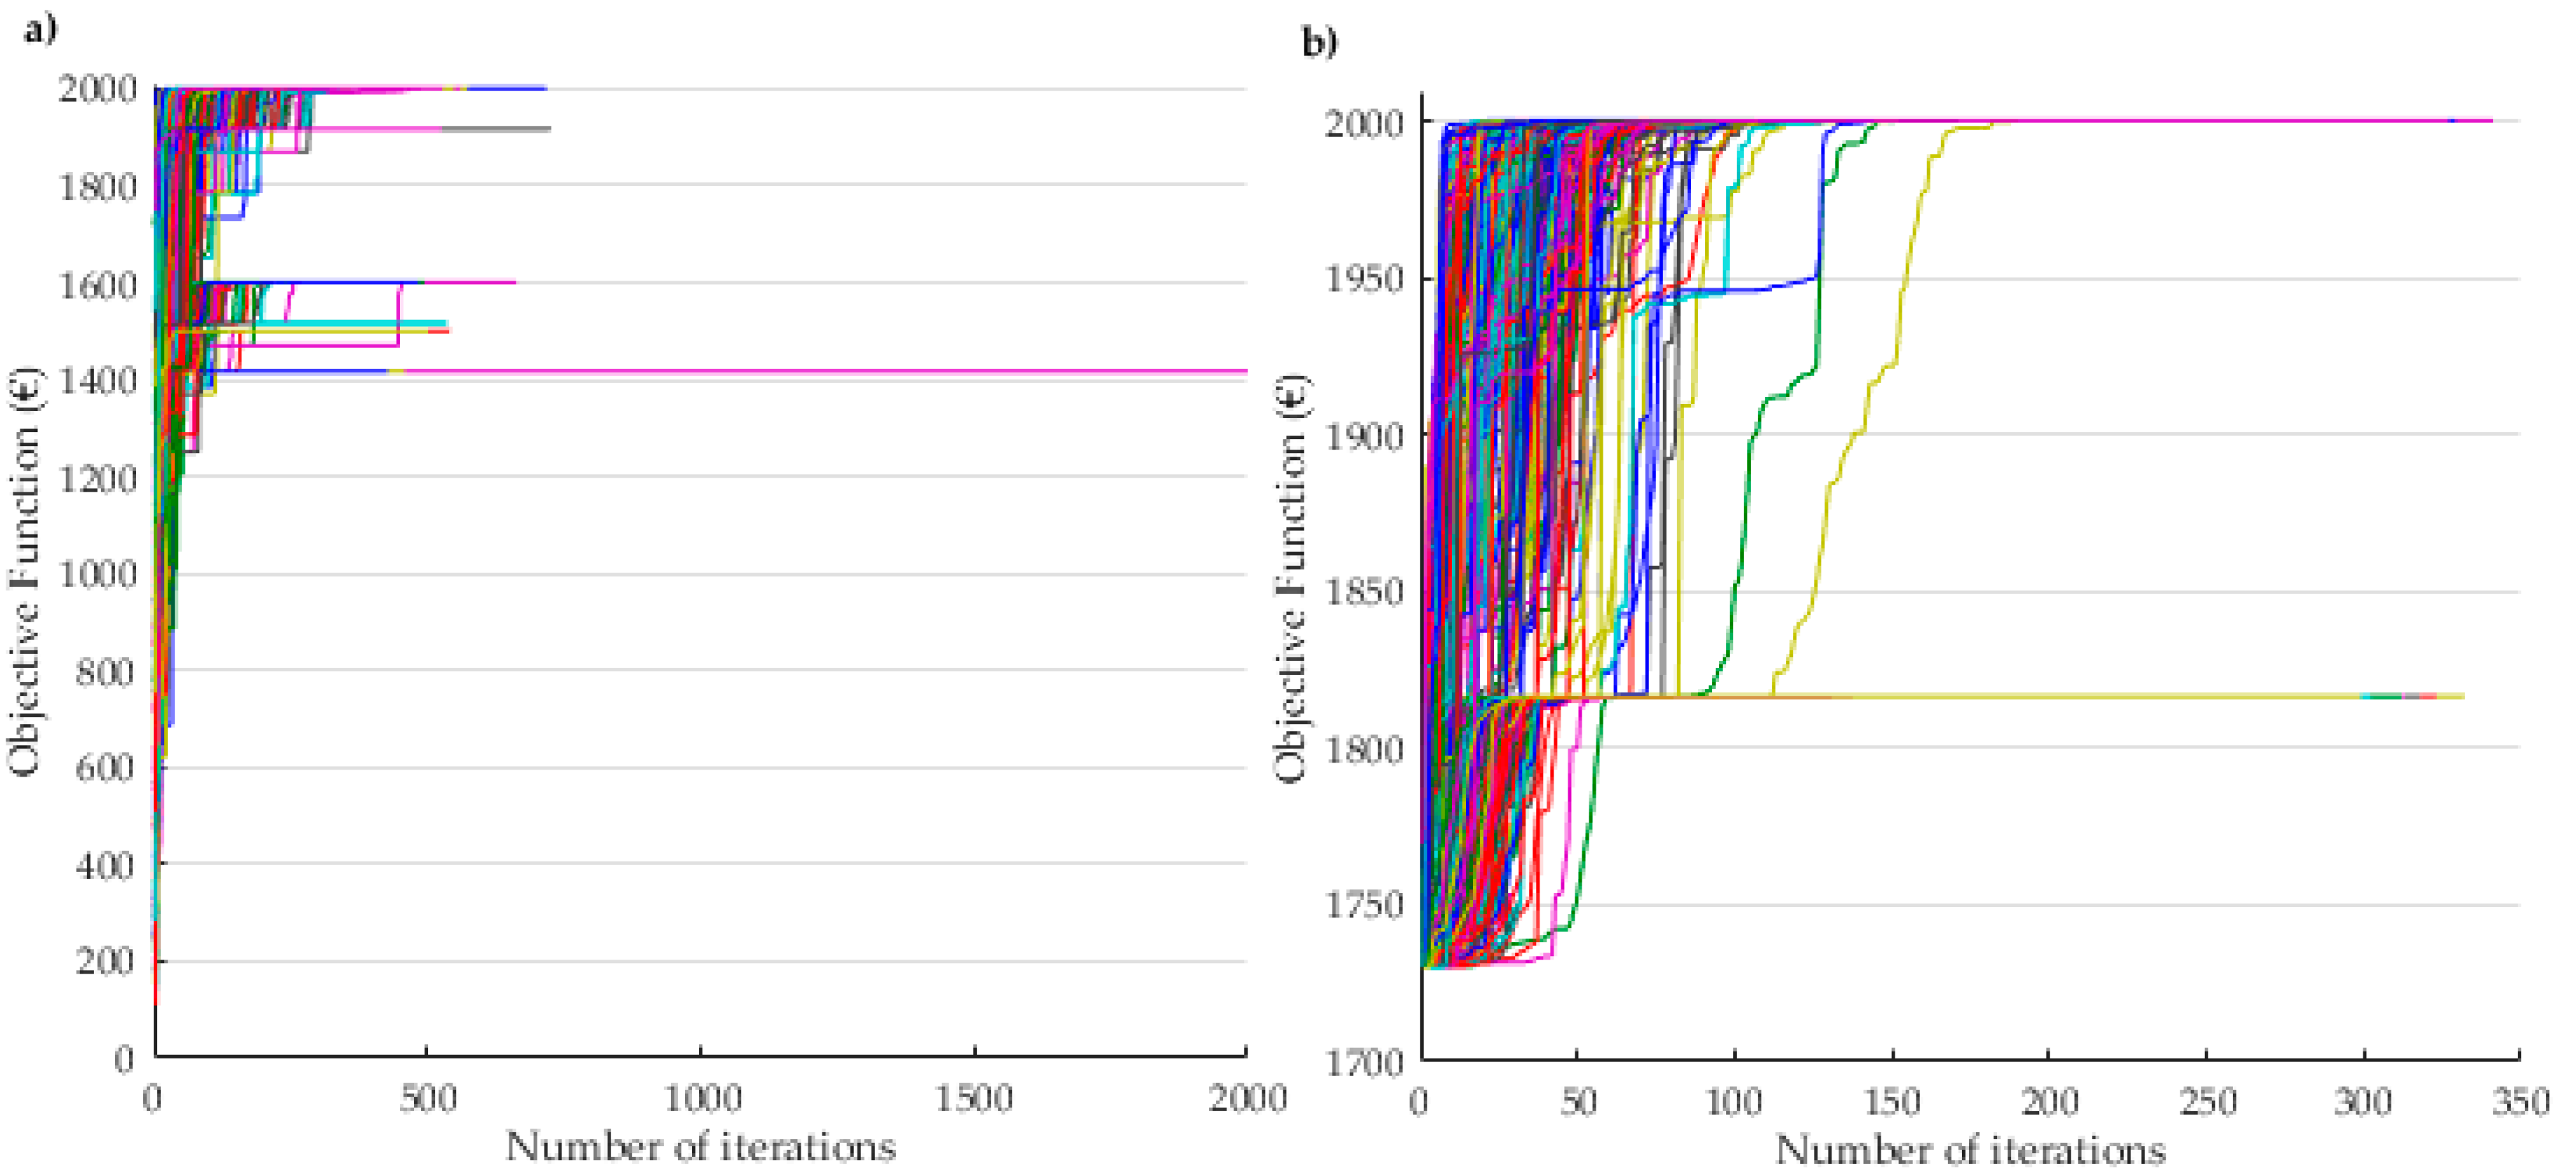
Figure 7 shows the performance of the MPSO-TVAC method when using a randomly generated solution and when using the proposed heuristic solution. This algorithm is chosen because it is the algorithm that achieved the highest maximum solution among all algorithms. It should be noted that the scales of the graph are different in
Figure 7a,b. This representation is made because it is possible to observe better the differences between performances of two resolutions. In
Figure 7 the yy scale starts at 1700 € because the minimal solution of 1000 runs in MPSO-TVAC (heuristic solutions) is 1730, and thus it is possible to see better the amplitude of the performance of the two algorithms.
As it is possible to observe, when the initial solution is provided, the algorithm converges in fewer iterations. In
Figure 7b it is visible that the algorithm starts the search with an initial solution that is provided by the proposed heuristic and that can be observed in the
Table 1, and that corresponds to an objective function value of 1730 €. It is also possible to visualize that in
Figure 7b there is a less disparity of solutions between the minimum registered value and the maximum.
6. Conclusions
The greater competitiveness and complexity brought by the electricity market restructuring forced the participants to face new challenges, which has caused an increase in the decision making difficulty, leading to the need for support from the participating entities. Existing simulation tools already represent important support for market users as they provide them with information that is taken into account in the planning of future actions. However, there is a lack of models and tools to support participants in the decision-making process regarding negotiations in the electricity markets.
This paper proposed a heuristic that allows achieving an initial solution for metaheuristic optimization algorithms to start their search process. This work is done with the objective of solving the problem of portfolio optimization of electricity market participation and thus provide a suitable solution for players’ negotiations. The achieved solution is able to be used by market players as a suggestion in support of their decisions in electricity markets negotiations.
From the presented results, one can verify that the inclusion of the proposed heuristic has clear advantages for solving the problem. By defining this starting point for the algorithms, they can obtain better optimization values. This is visible by the analysis of the STD, as methods using the proposed heuristic are able to achieve lower values, meaning that the solutions are closer to the average. The average with this modification also gets closer to the maximum value, which, together with the small STD, makes the set of solutions very strong when compared to the previous approaches.
It can also be seen, from the achieved results, that the approach that is able to achieve the best objective function results for the considered problem is the NPSO-RLS, while the faster algorithm to achieve suitable results is the standard PSO approach.
As a future work it is proposed to develop a multiobjective model that considers the risk in the calculation of the return to which each action in the market is associated. It is also proposed to improve the proposed heuristic in order to further decrease the STD and execution time, and increase the objective function results of metaheuristic methods in solving the optimization problem of electricity markets participation portfolio. Finally, the authors aim to improve the representation of the expected prices in each market in order to implicitly include the negotiation limits in each market in these prices, so that the need for defining these limit variables can be avoided.
