1. Introduction
The demand response (DR) market was introduced in the Korean electricity market in November 2014. In the past, demand management was implemented through the program by Korea Electric Power Corporation (KEPCO) in Korea. However, after the DR market was opened, a third party called “the load aggregator” was allowed to participate in the Korean electricity market. Load aggregators have recruited the resources of KEPCO’s customers who have participated in demand management. Thus, there has not been any difficulty in recruiting demand response resources (DRRs). However, due to the lack of business experiences of the load aggregators, there was not enough prior knowledge on the efficient operation and management of aggregated DRRs. The profitability of aggregators varies depending upon how the aggregators manage the DRRs because various DRRs have different characteristics.
In this study, a mean-variance portfolio method is proposed for determining the lowest-risk DRR portfolio for a given level of expected return for load aggregators. The proposed method is designed to compute the expected return and risk of a DRR portfolio by considering DRRs’ various characteristics such as the maximum curtailment capability, sustained response duration, and historical participation rate.
Markowitz’s mean-variance portfolio theory [
1] suggests how to minimize the risk of a portfolio based on the expected returns and risks of individual assets. The correlation among the expected returns of individual assets can reduce risk when assembling a portfolio of assets. This is named the portfolio effect or diversification effect. Portfolio theory was applied initially in the financial field and has subsequently been applied in the field of energy research. Bar-Lev and Katz, in early examples of applying portfolio theory to the electric power field, proposed a method to optimize the fossil fuel generation mix and determined the extent to which the electricity industry has utilized fossil fuel resources in [
2]. Awerbuch and Berger evaluated the application of portfolio theory to the development of an optimal generation mix in the European Union (EU), and illustrated the portfolio effects, i.e., diversification effects of different generating mixes in [
3]. In [
4], Jansen et al. presented the results of an application of portfolio theory to a future portfolio of electricity generating technologies in the Netherlands by 2030, and they identified that portfolio (cost) risk can be reduced significantly through diversification with a critical role for renewable generation such as wind power. In [
5], Delarue et al. applied portfolio theory to establish a multi-period power generation mix plan, and illustrated that the introduction of wind power can be motivated by a desire to lower the risk on generation cost. In [
6], Eichhorn and Römisch presented a model for finding an electricity portfolio that maximizes profits and minimizes risk when retailers procure the power they need to supply using polyhedral risk measures.
There have been various studies related to optimizing the operation of DRRs. In reference [
7], DRRs can be considered as a means to avoid the risk by the fluctuation of electricity prices and demand from the perspective of load-serving entities (LSEs). On the other hand, the proposed method in this paper attempts to determine the lowest risk DRR portfolio for a given level of expected return using mean-variance portfolio theory from the load aggregators’ perspective. In [
8], Mollahassani-pour et al. proposed a method to minimize the cost while maintaining the reliability of a system by considering the DRRs in establishing the preventive maintenance plan of the generator, assuming the DRR as the virtual power plant. In [
9], Dabbagh and Sheikh-El-Eslami proposed an offering model for a virtual power plant, which is an integration of various distributed energy resources, using a two-stage stochastic programming approach and conditional value at risk (CVR).
The market-bidding problem of a pool of price-responsive consumers for the aggregator or the retailer is studied in [
10]. The complex market bid, consisting of a series of price-energy bidding curves, consumption limits, and maximum pike-up and drop-off rates, can largely capture the price-sensitive consumption of the cluster of flexible loads. In [
11], the relation between electricity price and customer response is analyzed by applying stochastic finite impulse response (FIR) model. A bidding approach for a time-shiftable load in the day-ahead and real-time markets is proposed in [
12] to minimize energy procurement cost. The bidding strategy of plug-in electric vehicle aggregator proposed in [
13]. Bidding and clearing strategy is developed in [
14] by incorporating the internal dynamics of thermostatically controlled loads into mechanism design problem. These studies deal with the price-bid strategy of the aggregator or the retailer in various electricity market, but the return and risk faced by them is not considered.
Portfolio theory has been applied in the field of power research primarily for the optimization of the generation mix and procurement of electricity. In addition, studies on DRRs have thus far focused on effective operation of the resources. However, there has not been any research conducted to measure the profitability and risk of the resources and allocate them by applying portfolio theory.
The present work outlines an approach to assess the rate of return and the risk of DRRs and to optimize the operation of many DRRs using Markowitz portfolio theory.
Section 2 provides details of the calculation method for the expected return and risk of an individual DRR (each customer).
Section 3 details the method of grouping resources using portfolio theory.
Section 4 reports on numerical results, and
Section 5 discusses the conclusion and paths forward.
2. How to Measure Expected Returns and Risks of Individual Resources
2.1. Background
Markowitz’s portfolio theory, or mean-variance analysis, is a mathematical framework to assemble a portfolio of assets such that the risk is minimized for a given level of expected return, and the expected return and risk of an asset are defined to be the mean and variance (or standard deviation) of an asset’s rate of return, respectively. This theory was originally developed in the finance field, but if the expected return and risk of an asset can be measured in a reasonable way, it can be applied in various fields such as a generation mix and DRRs operation. In particular, because load aggregators must operate so many DRRs, it is very useful to apply portfolio theory in grouping the resources and operating them to minimize the risk or maximize the profit.
Load aggregators hold many DRRs (end use customers) that have quite different characteristics such as reduction capacity, ramp period (or response time), and sustained response period. These resources would respond differently according to their business environment, and rewards for load reduction and penalties for reduction failure are offered by the market price, so the characteristics of each resource (customer) and the market price have an effect on the revenues of load aggregators.
2.2. Market Price and Participation Rate
Since electricity market prices are used to determine both compensation for curtailment and penalties by failure to curtail, the market price is a significant factor to influence the profit of load aggregators. Market prices are determined by the principle of supply and demand in the electricity market and generally changes according to various market conditions such as loads, fuel prices, and generator maintenance schedule. Because electricity market prices are dynamic, they can be generally modeled using the geometric Brownian motion (GBM) model [
15,
16,
17]. Thus, prices in the future in this study are estimated by the following GBM model:
where
P and
represent electricity market price and a drift rate of electricity market price, respectively.
,
, and
denote volatility of electricity market price, time interval and generalized Wiener process, respectively.
and
are estimated from Korea’s electricity market price data during years 2014–2016.
Customers, i.e., individual DRRs, may fail to achieve the contracted curtailment capability allocated by an aggregator. In a case where the customer fails to curtail, the market operator imposes the penalty on the aggregator due to the curtailment failure. In the other words, the uncertainty in the behavior of customers’ response influences aggregators’ profit, and the participation rate is a critical factor in the revenue stream of load aggregators.
The behaviors relating to participation can be analyzed by using historical load curtailment data. If DRRs do not participate when curtailment is instructed, there will be a higher probability that DRRs will not participate in the very near future as well. In this study, the future participation rate is estimated using the past participation rate and GBM model. The past participation rate (
) is calculated from the data of historical load curtailment in Korea Electric Power Corporation (KEPCO) DR program as follows:
where
is the DRR requested by the load aggregator to customer
i at time
t in the past demand response event, and
is the amount of the load curtailment provided by customer
i at time
t in the past DR event.
In practice, various factors such as temperature, humidity, electricity prices and operating schedules in factories can affect customer’s electricity consumption. These factors also influence participants in demand response in a similar manner, but differently depending upon whether the participants are residential or industrial. Consumption patterns of residential participants could possibly be more weather dependent, whereas those of industrial participants could be more operating schedule dependent. However, regardless of consumer types, the primary driver to manage the consumption patterns of any electricity consumer and draw the participations in demand response is the price signal. The price signal in the market is the key factor affecting the decision-making on the demand side as to whether to participate or not. The participation in demand response is generally dependent upon the degree of the compensation and status of the price signal. For example, owners of DRRs with lower shutdown cost would participate in demand response even when electricity price is relatively low. On the other hand, owners of DRRs with higher shutdown cost would preferably participate in demand response whenever the price is relatively high enough to recover its shutdown cost. Despite the fact that there have been former studies dealing with consumers’ responses to electricity prices [
10], the participation rate is considered in this study to be a dependent variable of the electricity price and participation rate in the future is estimated through regression model as follows:
where
represents the participation rate of DRR
i at time
t.
The first-order coefficient, , and the constant term, , are estimated by linear regression model using the past participation rate ( ) and electricity price data. The electricity price at time t, i.e., , which is used in the future participation rate estimation, is based on the price data estimated by the GBM model. Because is a dynamic variable estimated using stochastic process model, is also dynamic.
2.3. Revenue and Cost of Load Reduction
2.3.1. Overview of Demand Response Market in Korea
Demand response resources have been traded in the Korean wholesale electricity market since November 2014. In the DRR market, peak curtailment DRRs (or capacity DRRs) and price responsive DRRs are traded separately. In the case of peak curtailment DRRs, Korea Power Exchange (KPX) (Independent System Operator in Korea Electricity Market) instructs a load curtailment an hour ahead, and these resources assume a role to substitute for high-cost generators. The customers participating in the load curtailment are compensated with incentives such as payments for availability and performance. The payment for availability is calculated in the same method as the capacity price of generators and the payment for performance is determined based on the resources’ actual curtailment and the highest variable generation cost at that time. In the case of price responsive DRR, the resources bid on the day-ahead electricity market and curtail the load if the demand reduction price is lower than the bid prices of generators, and are compensed with incentives based on the system marginal price (SMP).
2.3.2. Revenue from Load Curtailment
Regarding load aggregators, revenue from the load curtailment of a customer (or individual DRR) includes market payment and customer penalties. Market payment includes payment for scheduled curtailment, payment for dispatched curtailment, and payment for capability. Payment for scheduled curtailment is a reward for the amount of load curtailment assigned in a day-ahead unit commitment (UC), and is determined based on system marginal price (SMP) in the electricity market. Payment for dispatched curtailment is a reward for the amount of the load curtailment assigned in an-hour-ahead dispatch and determined based on the highest variable cost of all operating generators. Payment for capacity is a reward for the obligatory curtailment capacity. Customer penalties are payment for failing to curtail the scheduled load and are determined by a contract between a load aggregator and a customer.
2.3.3. Cost of Load Curtailment
The costs of a load aggregator for load curtailment consist of customer incentives and market penalties. Customer incentives are payments paid to a customer to participate in load curtailment and are determined by a contract between a load aggregator and a customer such as customer penalties. Market penalties are payments for failing to reduce. If a load aggregator did not carry out the load curtailment assigned in a day-ahead UC, KPX imposes penalties for scheduled curtailment on the aggregator. In addition, if a load aggregator fails to carry out the load curtailment dispatched, KPX imposes penalties for dispatched curtailment on the aggregator. Penalties for scheduled curtailment are determined based on SMP, and penalties for dispatched curtailment are determined as the cutback of the payment for capacity.
2.3.4. Rate of Return of an Aggregator by the Load Curtailment of Each Customer
A rate of return (
) that a load aggregator can obtain when a customer (individual DRR
i) of the aggregator participates in load curtailment is defined as follows:
where
is the amount of load reduction that customer
i contributes for scenario
s as follows:
is the revenue obtained in payment for the load curtailment by customer
i. It increases proportionally with increasing actual amount of load curtailment by customer
i when the customer’s actual load curtailment is less than or equal to 120% of the load reduction assigned to customer
i in the DR event. However, if the actual amount of the customer’s load curtailment is greater than 120% of the amount of load curtailment allocated by the aggregator, no further revenue resulting from receiving DR market prices is generated. The function
is defined as follows:
where
is the wholesale electricity market price for scenario
s,
is the actual load curtailment of customer
i for scenario
s, and
is the amount of load curtailment allocated to customer
i.
is the revenue obtained only when customer
i does not curtail some or all of the allocated load curtailment in the DR event. The penalty imposed on customer
i by the aggregator is the penalty price (
) multiplied by the difference between the actual and allocated amount of load curtailment on customer
i. This function is expressed as follows:
where
is price of the penalty determined by a contract between an aggregator and customer
i.
is an incentive offered as the reward for load reduction to customer
i that participates in the DR event by the aggregator. It increases proportionally with increasing actual amount of load reduction by customer
i when the customer’s actual load reduction is less than or equal to the load curtailment assigned to customer
i in the DR event. However, if the actual amount of the customer’s load reduction is greater than the customer’s load curtailment assigned by the aggregator, there is no further cost to pay for additional load reduction. The function
is defined as follows:
where
is the incentive price determined by a contract between an aggregator and customer
i.
is an expense that should be paid to the ISO by the aggregator who fails to meet the amount of curtailment allocated by the ISO (KPX) because customer
i does not reduce some or all of allocated load curtailment in the DR event. If a customer does not curtail as much as allocated by its aggregator, the deficit is covered by another customer of the aggregator and the aggregator is not charged a penalty. However, because the aggregator should pay the price to the customer covering the deficit, the cost increases. Thus,
is the price for load reduction of the customer covering the deficit, however, the unit price is equal to the price for the load curtailment of customer
i. This function is expressed as follows:
2.4. Calculation of Expected Returns and Risks
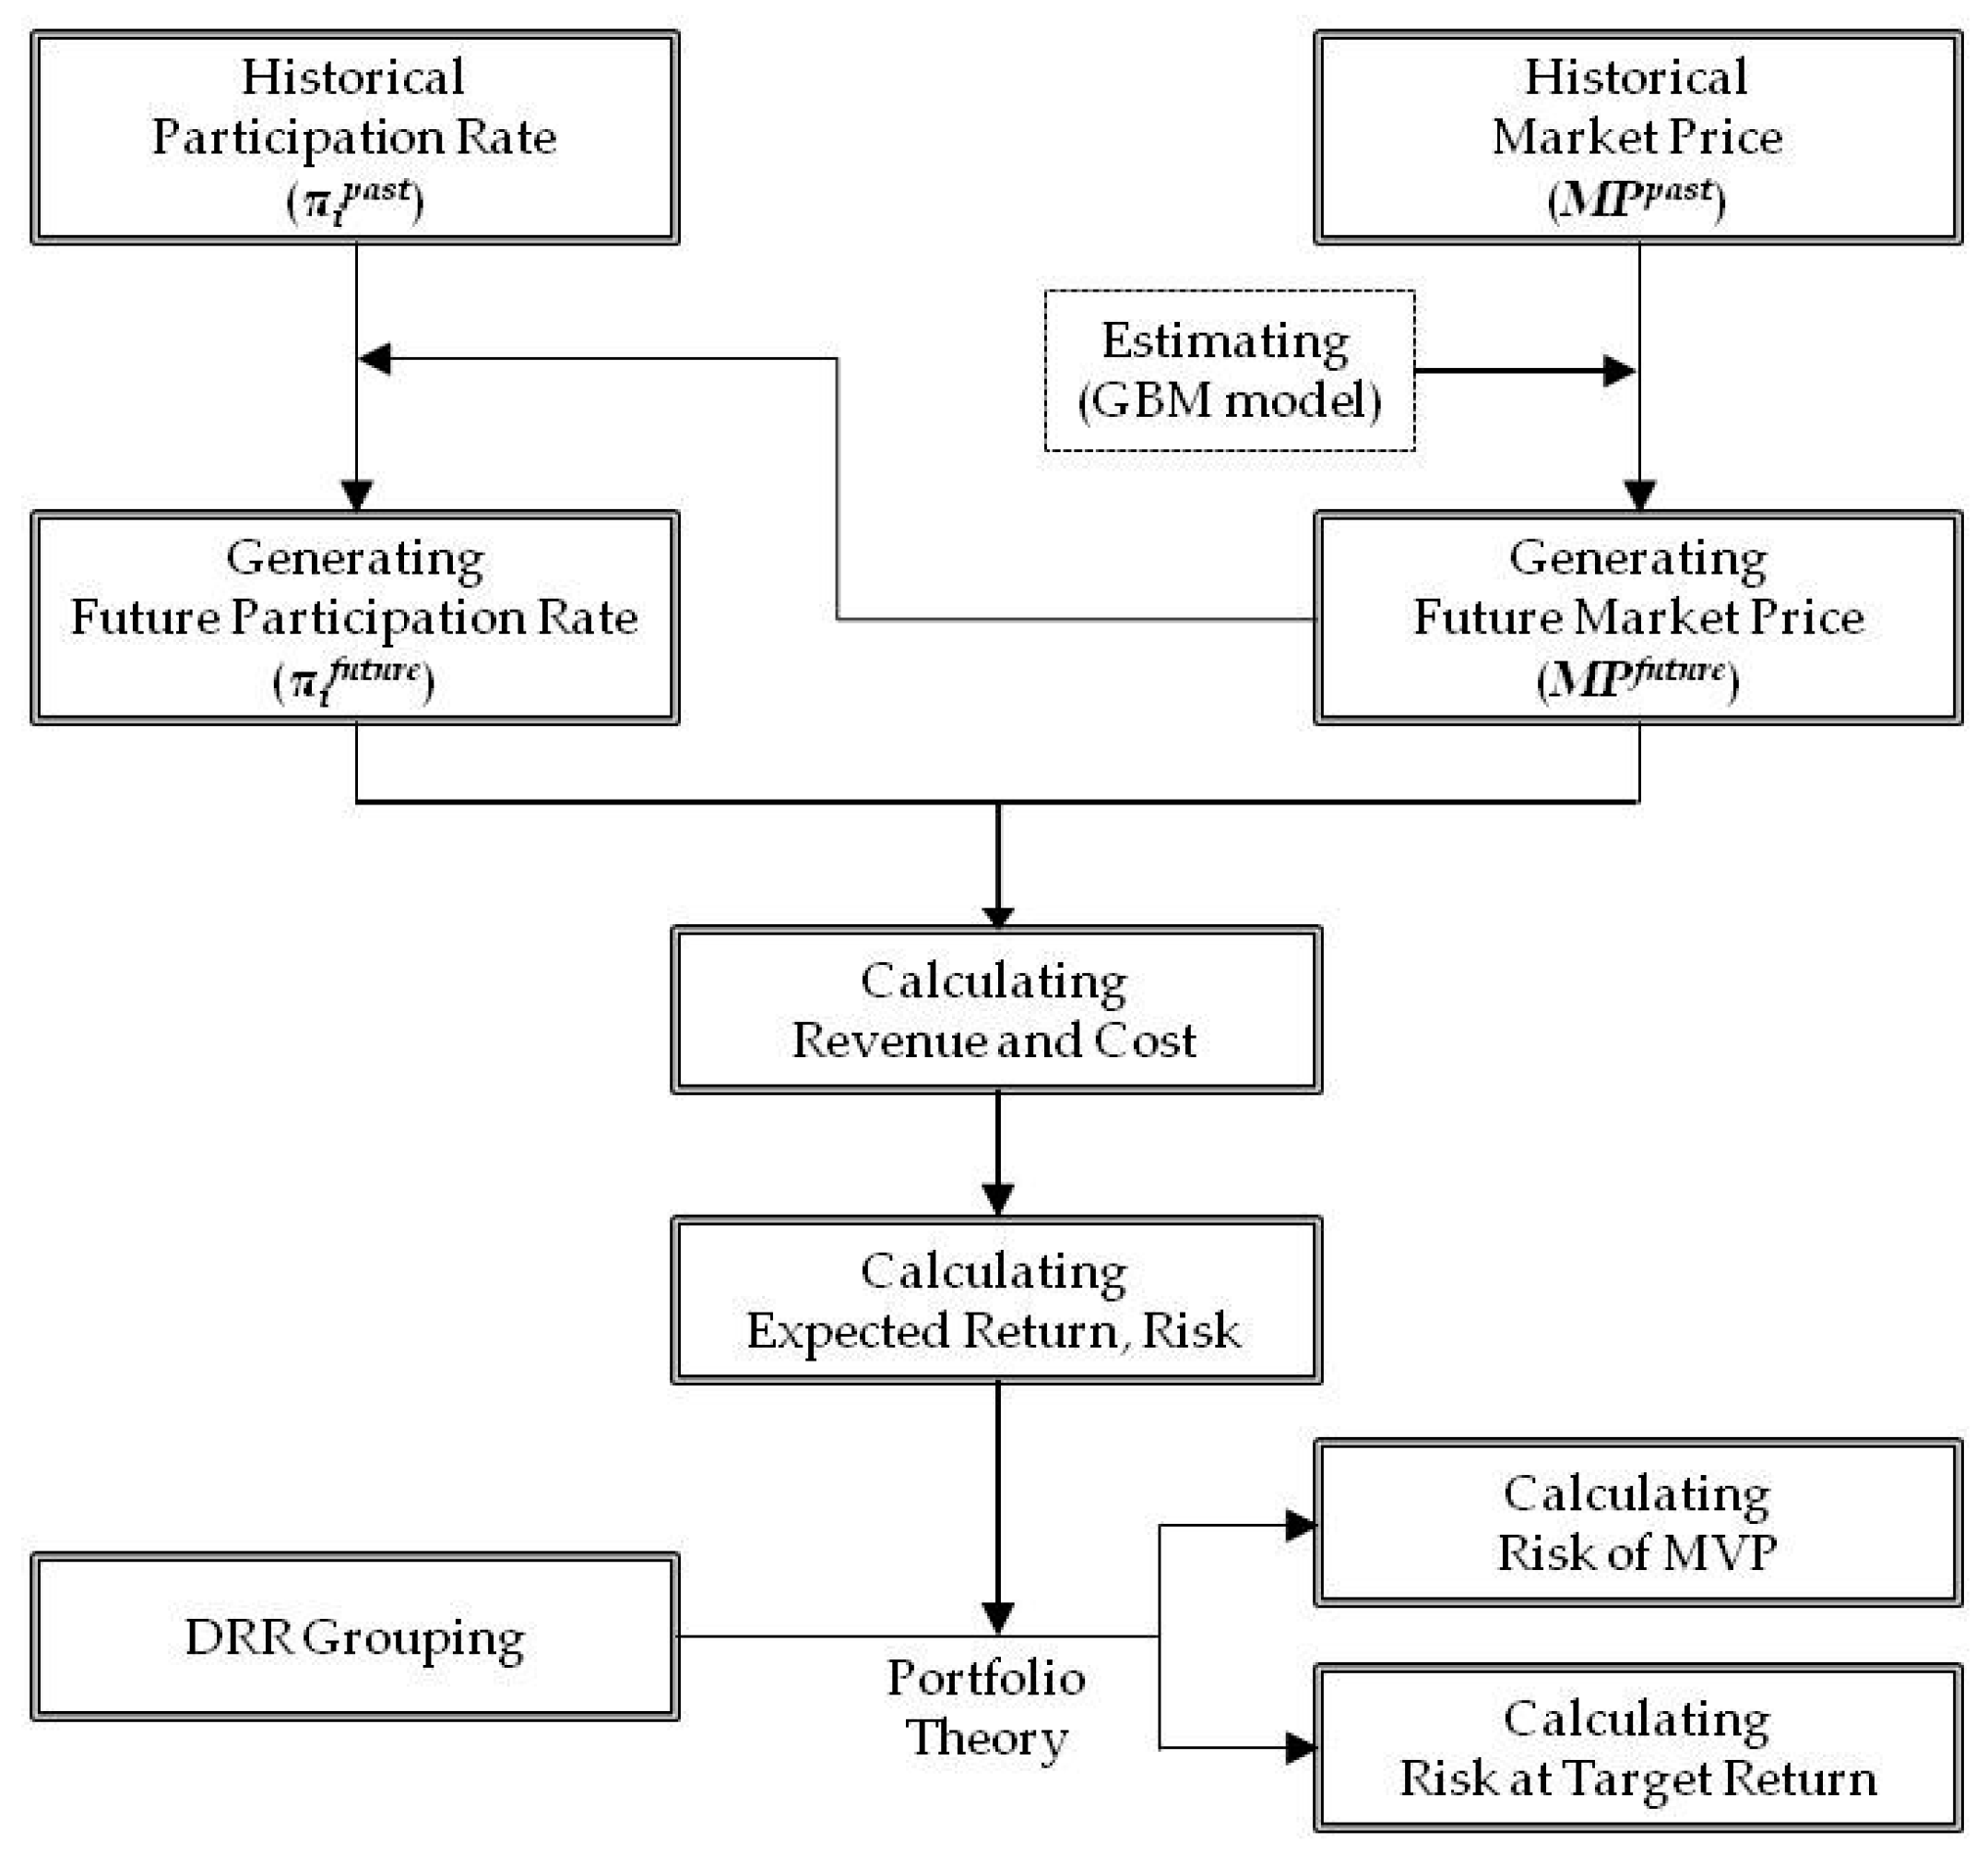
In this study, a Monte Carlo simulation-based method is used to calculate the expected return, risk, and covariance, i.e., correlation coefficient of DRRs. In this paper, the primary factors affecting the rate of returns of aggregators are assumed to be the participation rate and wholesale electricity market price. Therefore, future price and participation rate need to be estimated in order to calculate the rate of return for an individual DRR. The stochastic model described in
Section 2.2 is applied to estimate the future price and participation rate. The amount of curtailment from DRR, revenue, cost, and rate of return are computed using the estimated future prices and participation rates. The mean, i.e., expected return and the variance, i.e., risk of a portfolio are computed by Monte Carlo simulations
3. Resource Allocation Method Using Portfolio Theory
In this section, a new method is proposed for optimally grouping DRRs, the load curtailment of all customers contracting with a load aggregator to reduce their loads, using the expected return and risk of the individual DRR by applying portfolio theory.
3.1. Resource Grouping Scenario
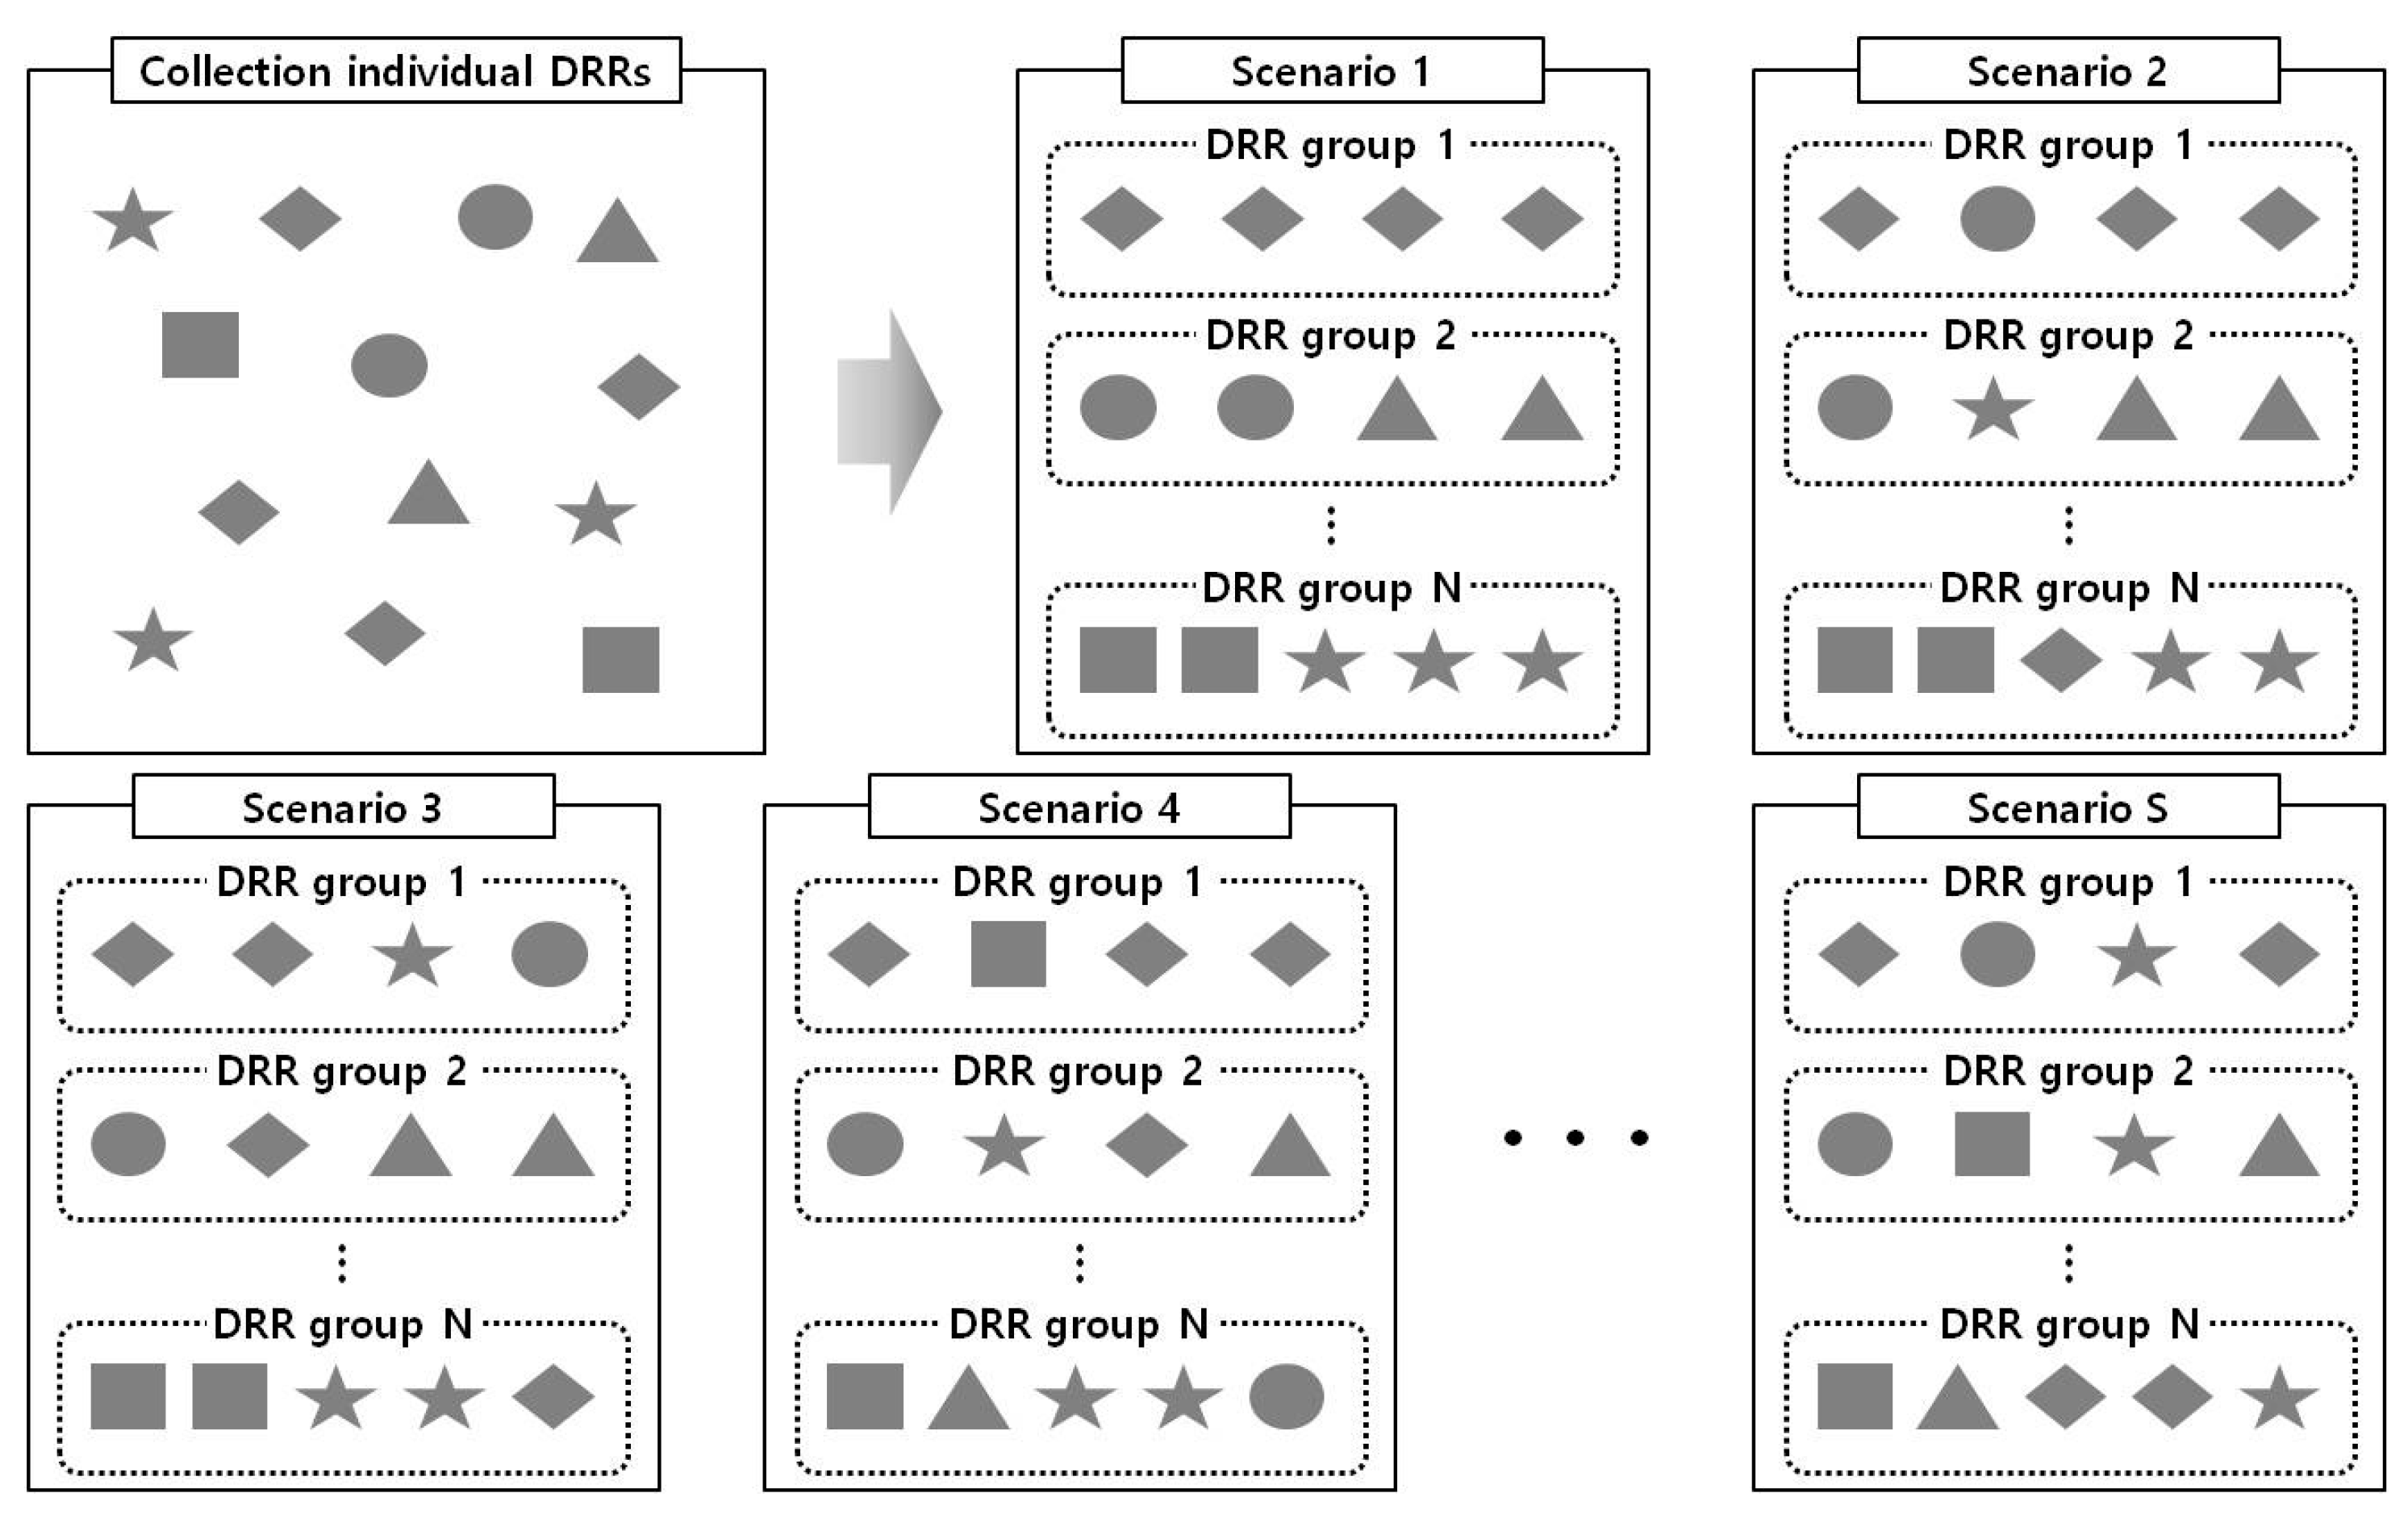
ere are many ways by which a load aggregator divides its customers (individual resources) into DRR groups. For example, dividing 10 individual resources into two DRR groups results in a number of 1024 (=
), and with increasing number of individual resources and DRR groups, the number of possible divisions increases very quickly. However, not all cases are considered because there are some constraints related to formulating DRRs. In the Korean DR market, one DRR group shall be composed of 10 or more individual DRRs, and the maximum reduction capacity of one DRR group shall be 10–500 MW. Therefore, in this study, the cases that satisfy these constraints are considered and defined a dividing case as a “scenario”.
Figure 1 roughly shows how an aggregator can divide all its individual DRRs into some (N) DRR groups.
Each individual resource has its own load characteristics. Some resources have a high load factor, some have a low load factor, and the shape of the load duration curve (LDC) varies from resource to resource. One DRR group can minimize the risk from the aggregator’s point of view by complementing them if resources with different load characteristics are evenly included. Therefore, the DRR group is constructed by reflecting the load characteristics of the individual resources.
A DRR group is simply a collection of DRRs aggregated by a load aggregator. The load aggregator can operate multiple DRR groups. A scenario is one of all possible DRR combinations by combining different DRRs to form a DRR group. A portfolio is constructed by taking a weighted combination of DRRs with different composition ratios, i.e., weights of DRRs on their curtailment capabilities in a DRR group. Therefore, it is possible to create various types of portfolios by taking different composition ratios of DRRs in the same DRR group.
3.2. Minimum Variance Portfolio Selection of Optimal Grouping Scenario
There are several DRR groups in a scenario and, for each group, we can construct many portfolios with individual DRRs included in each DR resource. Then the expected return and risk of the portfolios are calculated. The expected return and risk of a portfolio are defined as follows:
where
is a share of individual DRR
i in the portfolio,
is an expected return of individual DRR
i,
is a variance of an individual DRR’s return, and
is a covariance between the rate of returns of individual DRRs
i and
j.
Once the expected return and risk of portfolios are calculated, the minimum variance portfolio (MVP) for each DRR group can be determined. The MVP is the portfolio whose risk (variance or standard deviation) is the least among all portfolios that can be created with individual DRRs included in a DRR group. A “group risk” (
) can be defined to be the risk of the MVP and define a “scenario risk” (
), as the mean of all group risks of that scenario. The final objective is to determine the optimal scenario, which has the lowest scenario risk, and which is the best way to group individual DRRs. Combining the above steps, the following optimization problem can be formulated as follows:
where
is a binary variable indicating whether individual DRR
j is included in DRR group
i (i.e., if included, 1; otherwise, 0).
is the minimum number of individual DRRs to be included in one DRR group,
is the maximum amount of load curtailment capacity for individual DRR
j, and
are the minimum and maximum amounts of total load capacity (MW), respectively, that one DRR group should reduce in a DR event.
is the maximum curtailment duration of individual DRR
j, and
and
are the minimum and maximum amounts of total energy (MWh), respectively, that one DRR group should curtail in a DR event.
3.3. Target Return and Risk
MVP has the advantage of minimizing risk, but it has the weakness that the expected return is also lowered. For this reason, aggregators are inevitably interested in how to construct a resource that can achieve a reasonable expected return. This can be overcome by slightly modifying the method presented above. By adding the target expected rate of return and the target risk as constraints while keeping the objective function that minimizes the risk, it is possible to achieve two goals: securing the appropriate rate of return and minimizing the risk. The following constraint expression is added:


