
Multidisciplinary Energy Assessment of Tertiary Buildings: Automated Geomatic Inspection, Building Information Modeling Reconstruction and Building Performance Simulation

Abstract

1. Introduction
2. Background on BIM and BPS Tools
3. European Regulatory Framework on Energy Efficiency of Buildings
4. Case Study
5. Methodology
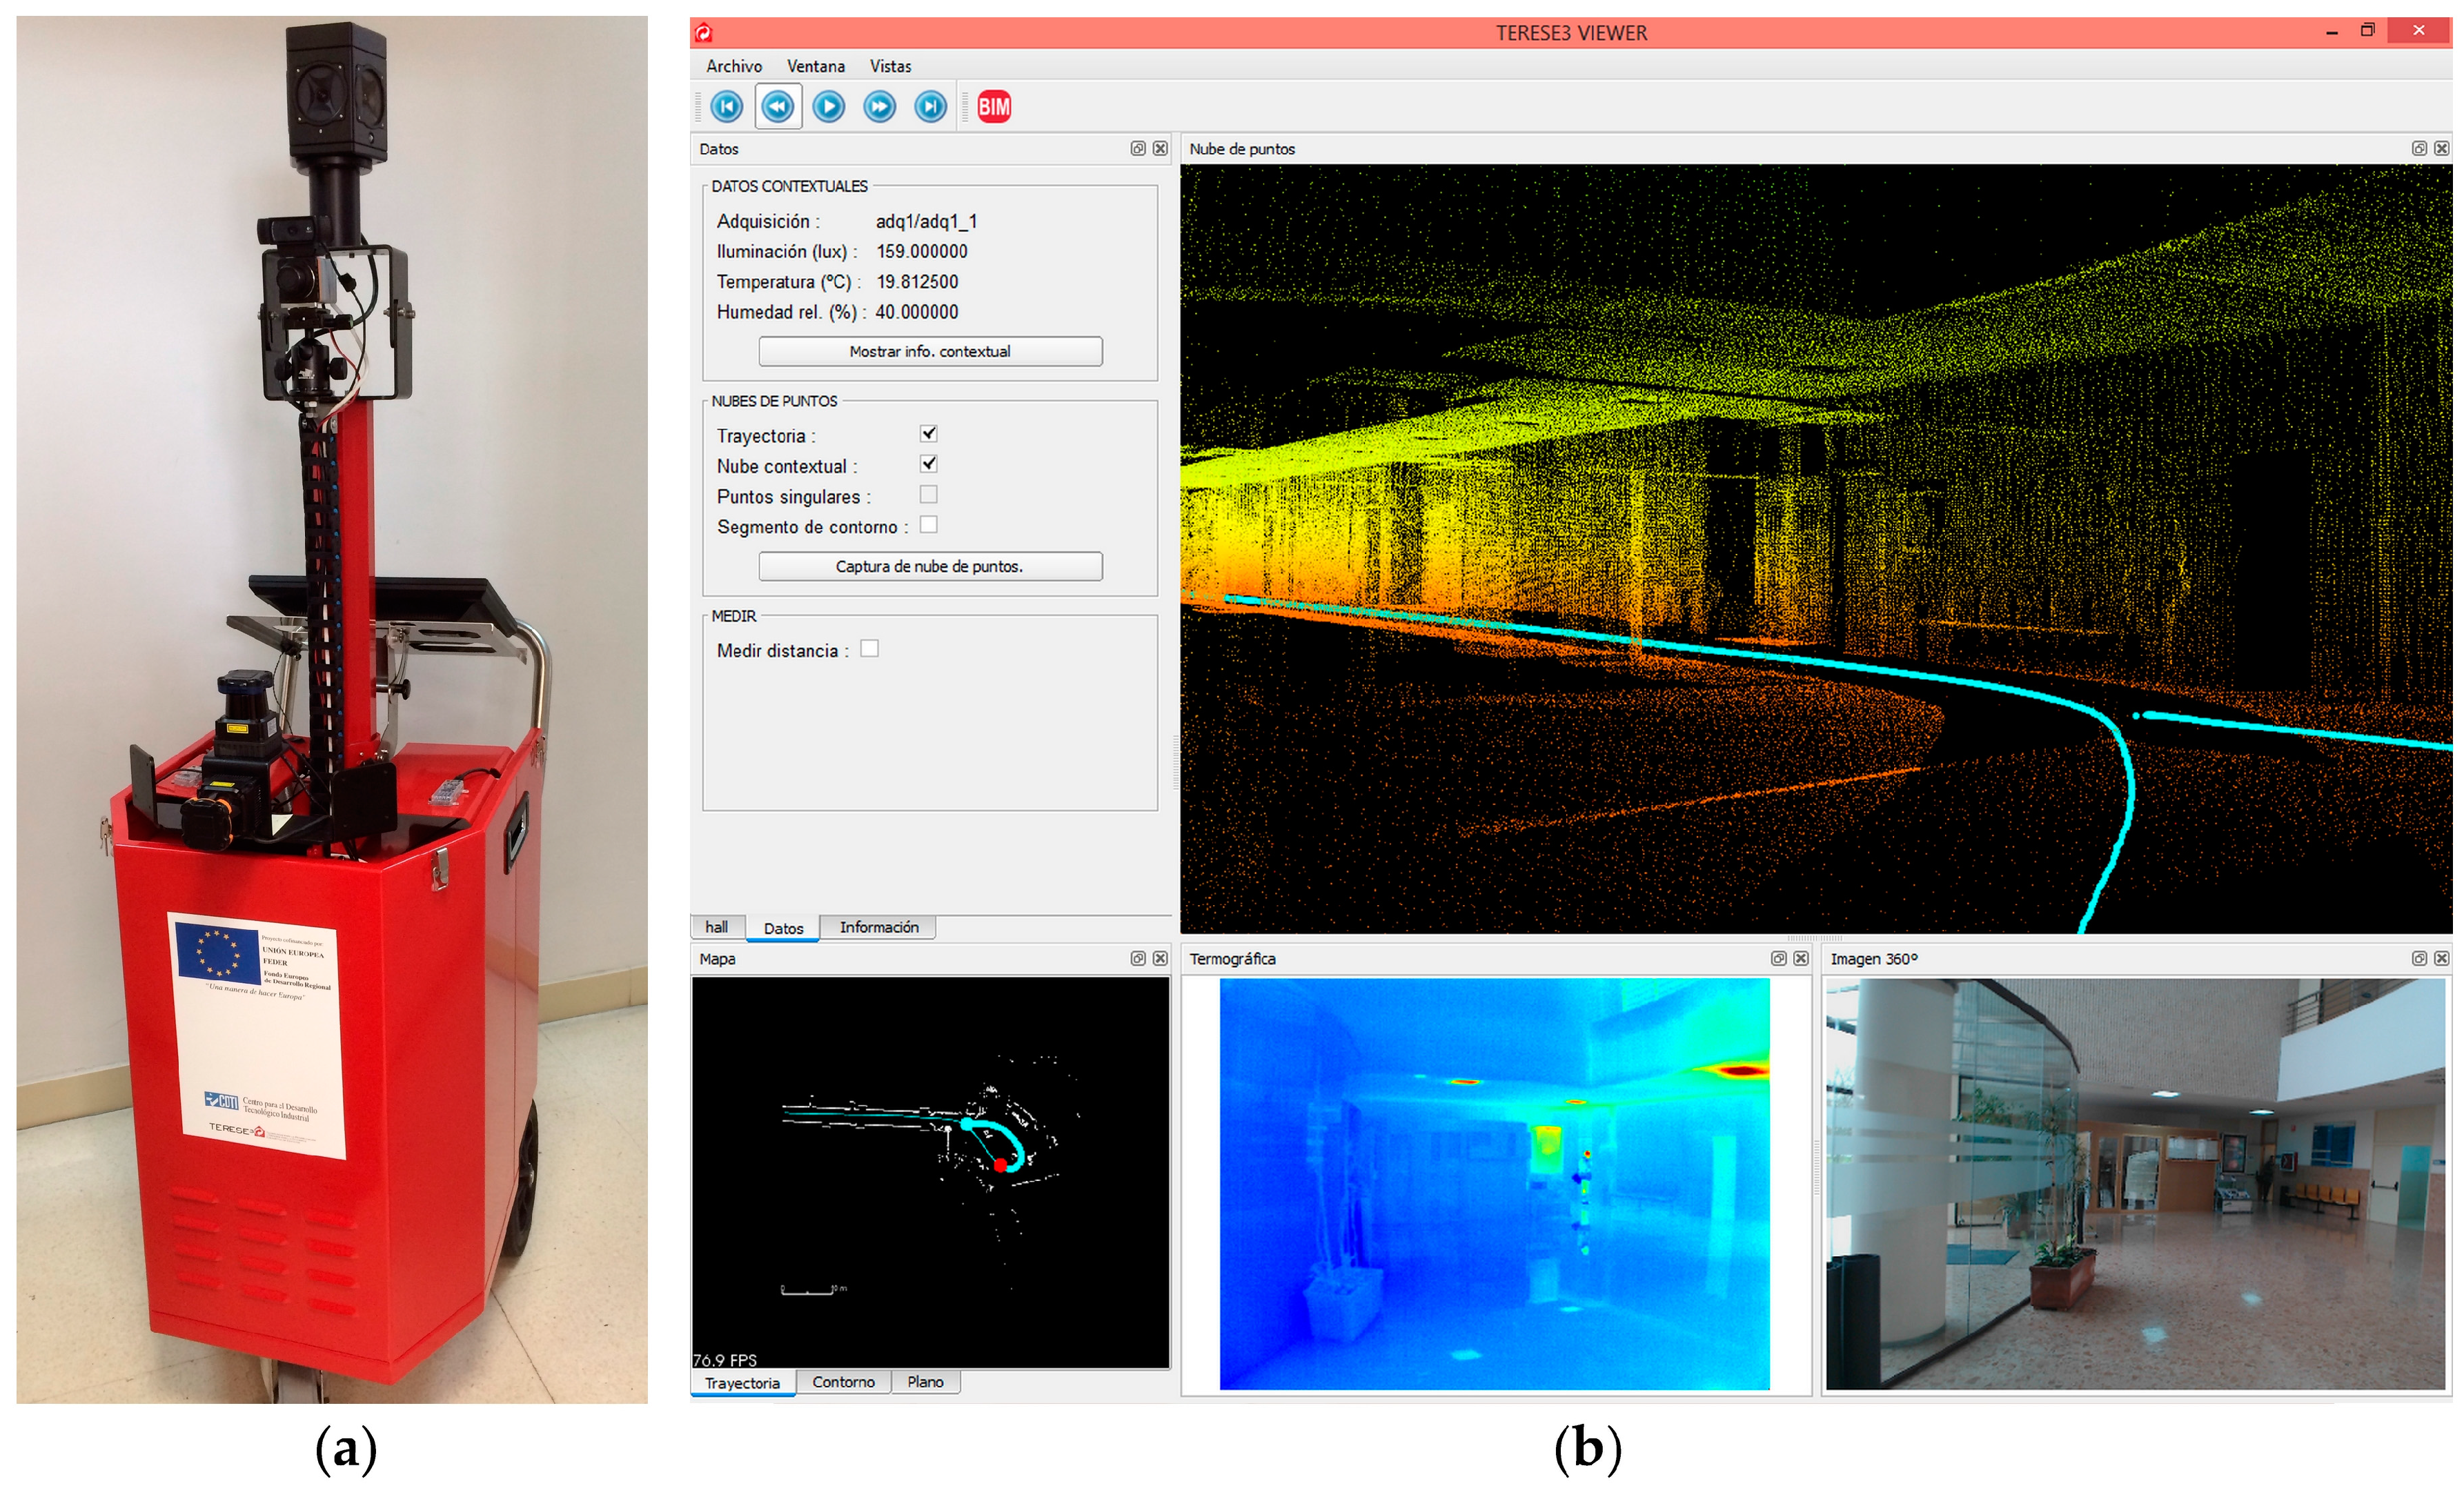
5.1. Data Collection
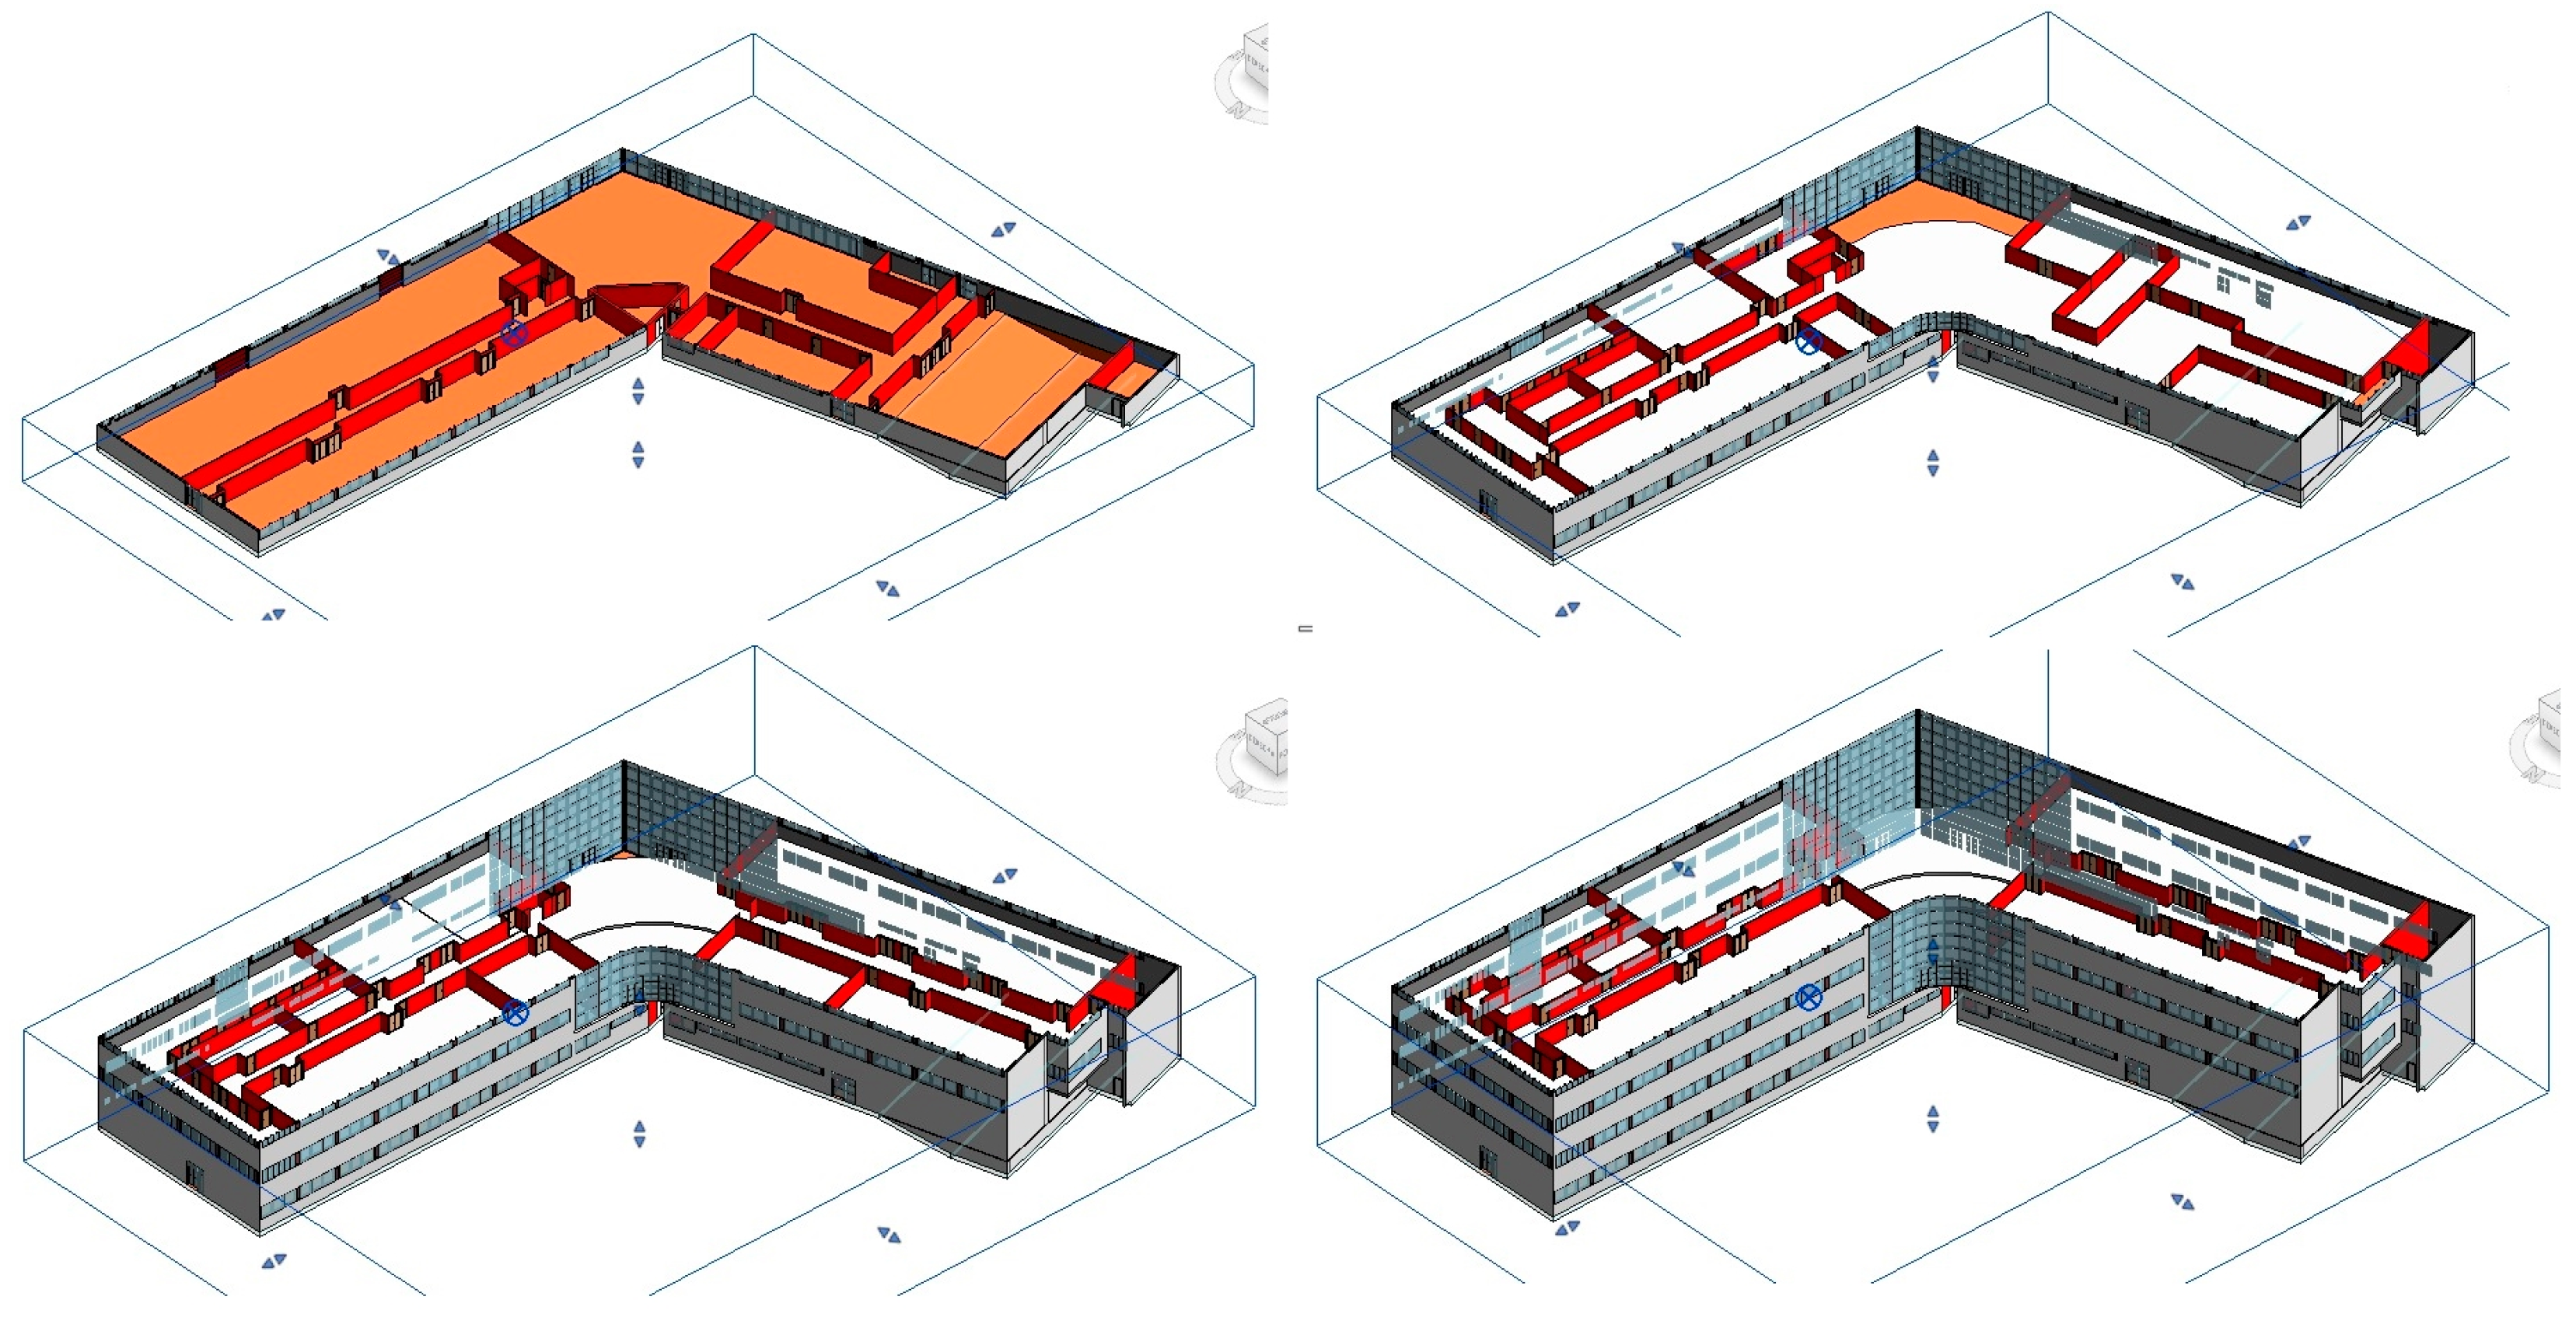
5.2. Development of the Building Information Model
5.3. Energy Assessment in Official Software CE3X
5.4. Energy Assessment in Design Builder BPS
- A great amount of openings disappeared after importing the *gbxml model. In order to achieve a complete, smooth import of the model it was necessary to slightly increase the separation between the openings.
- Partitions were not properly exported, either. It was necessary to redefine them. Particular roof elements—a skylight and the central part of the roof—had to be reconstructed, too.
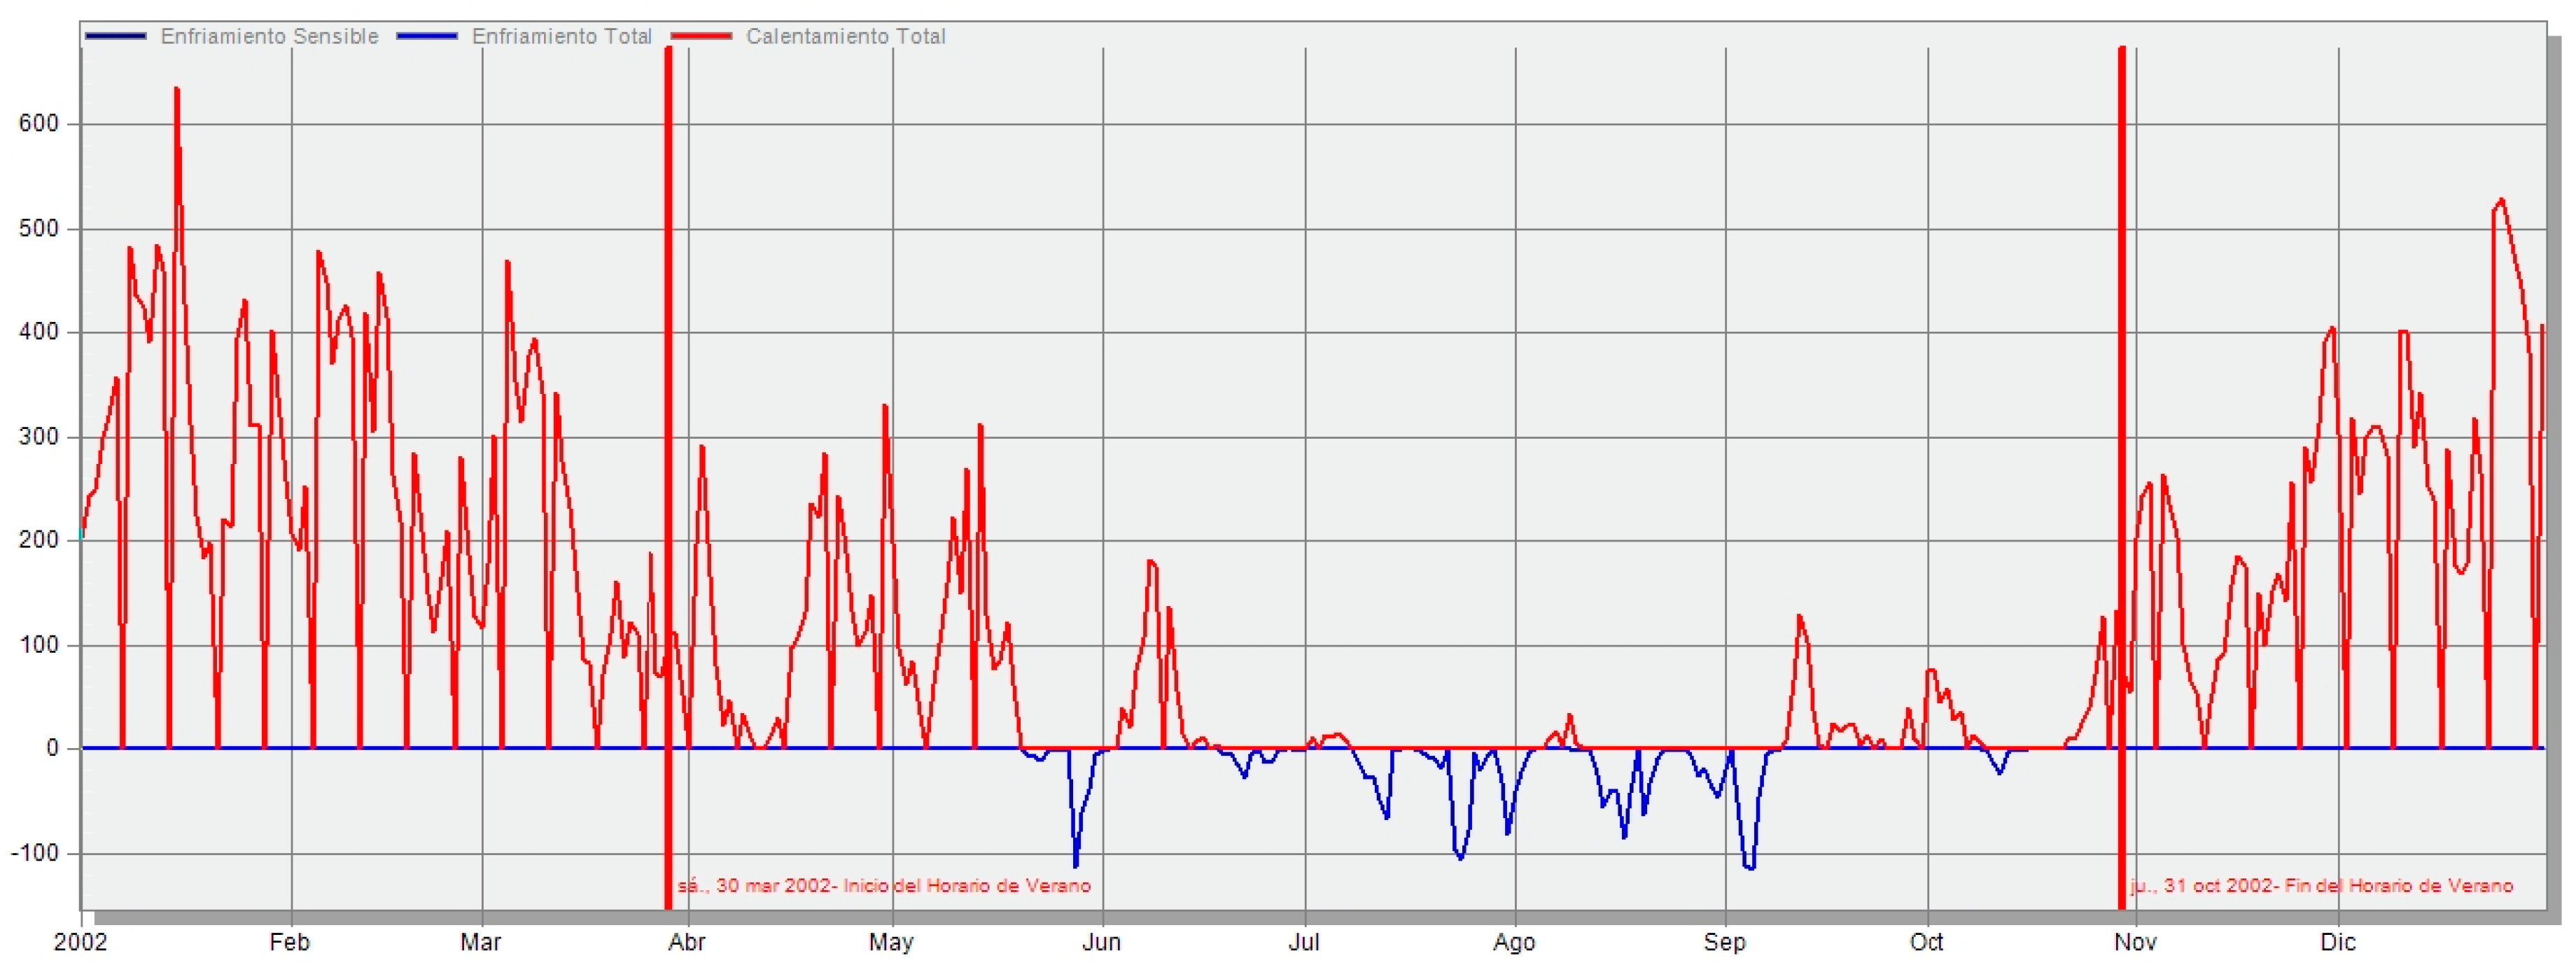
6. Discussion of Results
7. Conclusions
Acknowledgments
Author Contributions
Conflicts of Interest
References
- D’Agostino, D.; Zangheri, P.; Castellazzi, L. Towards nearly zero energy buildings in Europe: A focus on retrofit in non-residential buildings. Energies 2017, 10. [Google Scholar] [CrossRef]
- Terés-Zubiaga, J.; Campos-Celador, A.; González-Pino, I.; Escudero-Revilla, C. Energy and economic assessment of the envelope retrofitting in residential buildings in Northern Spain. Energy Build. 2015, 86, 194–202. [Google Scholar] [CrossRef]
- Aïssani, A.; Chateauneuf, A.; Fontaine, J.-P.; Audebert, P. Cost model for optimum thicknesses of insulated walls considering indirect impacts and uncertainties. Energy Build. 2014, 84, 21–32. [Google Scholar] [CrossRef]
- Builidngs Performance Institute Europe (BPIE). Europe’s Buildings under the Microscope. A Country-by-Country Review of the Energy Performance of Buildings; BPIE: Brussels, Belgium, 2011; Available online: http://bpie.eu/wp-content/uploads/2015/10/HR_EU_B_under_microscope_study.pdf (accessed on 27 February 2017).
- United Nations. Reports–Addendum Part Two: Action Taken by the Conference of the Parties. Proceedings of the Confertence of the Parties on Its Twenty-First Session, Paris, France, 30 November–13 December 2015; Available online: http://unfccc.int/resource/docs/2015/cop21/eng/10a02.pdf (accessed on 27 February 2017).
- Meijer, F.; Visscher, H. Upgrading energy efficient housing and creating jobs: It works both ways. Open House Int. 2014, 39, 34–40. [Google Scholar]
- Volk, R.; Stengel, J.; Schultmann, F. Building Information Modeling (BIM) for existing buildings—Literature review and future needs. Autom. Constr. 2014, 38, 109–127. [Google Scholar] [CrossRef]
- Ryan, E.M.; Sanquist, T.F. Validation of building energy modeling tools under idealized and realistic conditions. Energy Build. 2012, 47, 375–382. [Google Scholar] [CrossRef]
- Stadel, A.; Eboli, J.; Ryberg, A.; Mitchell, J.; Spatari, S. Intelligent sustainable design: Integration of carbon accounting and Building Information Modeling. J. Prof. Issues Eng. Educ. Pract. 2011, 137, 51–54. [Google Scholar] [CrossRef]
- Wang, S.; Yan, C.; Xiao, F. Quantitative energy performance assessment methods for existing buildings. Energy Build. 2012, 55, 873–888. [Google Scholar] [CrossRef]
- Fumo, N. A review on the basics of building energy estimation. Renew. Sustain. Energy Rev. 2014, 31, 53–60. [Google Scholar] [CrossRef]
- Darko, A.; Chan, A.P.C. Critical analysis of green building research trend in construction journals. Habitat Int. 2016, 57, 53–63. [Google Scholar] [CrossRef]
- Cambeiro, F.P. Application of newer design and manufacturing techniques in construction for residential architecture: From centimeter to millimeter. Ph.D. Thesis, University of Vigo, Pontevedra, Spain, 2013. Available online: http://hdl.handle.net/11093/230 (accessed on 28 February 2017). (In Spanish).
- Wong, K.; Fan, Q. Building information modelling (BIM) for sustainable building design. Facilities 2013, 31, 138–157. [Google Scholar] [CrossRef]
- Ghassemi, R.; Becerik-Gerber, B. Transitioning to Integrated Project Delivery: Potential barriers and lessons learned. Lean Constr. J. 2011, 32–52. [Google Scholar]
- Khaddaj, M.; Srour, I. Using BIM to retrofit existing buildings. Procedia Eng. 2016, 145, 1526–1533. [Google Scholar] [CrossRef]
- Huber, D.; Akinci, B.; Oliver, A.A.; Anil, E.; Okorn, B.E.; Xiong, X. Methods for automatically modeling and representing as-built building information models. In Proceedings of the NSF CMMI Research Innovation Conference, Atlanta, GA, USA, 4–7 January 2011. [Google Scholar]
- El-Omari, S.; Moselhi, O. Integrating 3D laser scanning and photogrammetry for progress measurement of construction work. Autom. Constr. 2008, 18, 1–9. [Google Scholar] [CrossRef]
- Brenner, C. Building reconstruction from images and laser scanning. Int. J. Appl. Earth Obs. Geoinf. 2005, 6, 187–198. [Google Scholar] [CrossRef]
- Wang, J.; Li, S.; Wang, X.; Mao, C.; Guo, J. The application of BIM-enabled facility management system in complex building. Int. J. 3-D Inf. Model. 2013, 2, 16–33. [Google Scholar] [CrossRef]
- Zlot, R.; Bosse, M.; Greenop, K.; Jarzab, Z.; Juckes, E.; Roberts, J. Efficiently capturing large, complex cultural heritage sites with a handheld mobile 3D laser mapping system. J. Cult. Herit. 2014, 15, 670–678. [Google Scholar] [CrossRef]
- Vosselman, G. Design of an indoor mapping system using three 2D laser scanners and 6 DOF SLAM. ISPRS Ann. Photogramm. Remote Sens. Spatial Inf. Sci. 2014, II-3, 173–179. [Google Scholar] [CrossRef]
- Borrmann, D.; Nüchter, A.; Dakulović, M.; Maurović, I.; Petrović, I.; Osmanković, D.; Velagić, J. A mobile robot based system for fully automated thermal 3D mapping. Adv. Eng. Inform. 2014, 28, 425–440. [Google Scholar] [CrossRef]
- Fox, M.; Coley, D.; Goodhew, S.; Wilde, P. Thermography methodologies for detecting energy related building defects. Renew. Sustain. Energy Rev. 2014, 40, 296–310. [Google Scholar] [CrossRef]
- Picco, M.; Marengo, M. On the impact of simplifications on building energy simulation for early stage building design. J. Eng. Archit. 2015, 3, 66–78. [Google Scholar] [CrossRef]
- Markiewicz, P. Modern analysis and simulation tools and skills for the evaluation and design of urban projects. In Proceedings of the International Conference Virtual City and Territory—11th Congress Virtual City and Territory, Krakow, Poland, 6–8 July 2016; Centre of Land Policy and Valuations (CPSV): Barcelona, Spain, 2016; pp. 1028–1039. [Google Scholar]
- Holness, G.V.R. BIM gaining momentum. ASHRAE J. 2008, 50, 28–40. [Google Scholar]
- The Construction Industry Institute. Available online: https://www.construction-institute.org (accessed on 2 March 2017).
- Yang, Z.; Becerik-Gerber, B. Coupling occupancy information with HVAC energy simulation: A systematic review of simulation programs. In Proceedings of the 2014 Winter Simulation Conference, Savannah, GA, USA, 7–10 December 2014; pp. 3212–3223. [Google Scholar]
- Zeng, R.; Chini, A.; Srinivasan, R.S.; Jiang, P. Energy efficiency of smart windows made of photonic crystal. Int. J. Constr. Manag. 2017, 17, 100–112. [Google Scholar] [CrossRef]
- Atam, E. Current software barriers to advanced model-based control design for energy-efficient buildings. Renew. Sustain. Energy Rev. 2017, 73, 1031–1040. [Google Scholar] [CrossRef]
- García-Alvarado, R.; González, A.; Bustamante, W.; Bobadilla, A.; Muñoz, C. Características relevantes de la simulación energética de viviendas unifamiliares. Inf. Constr. 2014, 66. (In Spanish) [Google Scholar] [CrossRef]
- Wang, X.; Kendrick, C.; Ogden, R.; Walliman, N.; Baiche, B. A case study on energy consumption and overheating for a UK industrial building with rooflights. Appl. Energy 2013, 104, 337–344. [Google Scholar] [CrossRef]
- Sacht, H.M.; Bragança, L.; Almeida, M.G. Facades modules for eco-efficient refurbishment of buildings: An overview. In Proceedings of the Conference Portugal SB10: Sustainable Building Affordable to All, Vilamoura, Portugal, 17–19 March 2010; Universidade do Minho: Braga, Portugal, 2010; pp. 423–432. [Google Scholar]
- Crawley, D.B.; Hand, J.W.; Kummert, M.; Griffith, B.T. Contrasting the Capabilities of Building Energy Simulation Software Tools. 2005. Available online: https://pure.strath.ac.uk/portal/files/253952/strathprints006555.pdf (accessed on 16 March 2017).
- Sousa, J. Energy simulation software for buildings: Review and comparison. In Proceedings of the International Workshop on Information Technology for Energy Applications (IT4ENERGY 2012), Lisbon, Portugal, 6–7 September 2012; Available online: http://ceur-ws.org/Vol-923/paper08.pdf (accessed on 2 February 2017).
- Crawley, D.B.; Lawrie, L.K.; Winkelmann, F.C.; Buhl, W.F.; Huang, Y.J.; Pedersen, C.O.; Strand, R.K.; Liesen, R.J.; Fisher, D.E.; Witte, M.J.; et al. EnergyPlus: Creating a new-generation building energy simulation program. Energy Build. 2001, 33, 319–331. [Google Scholar] [CrossRef]
- Prada-Hernández, A.V.; Rojas-Quintero, J.S.; Vallejo-Borda, J.A.; Ponz-Tienda, J.L. Interoperability of building energy modeling (BEM) with building information modeling (BIM). In Proceedings of the SIBRAGEC ELAGEC 2015, São Carlos, Brasil, 7–9 October 2015; pp. 519–526. [Google Scholar]
- Jalaei, F.; Jrade, A. Integrating BIM with green building certification system, energy analysis and cost estimating tools to conceptually design sustainable buildings. In Proceedings of the Construction Research Congress 2014, Atlanta, GA, USA, 19–21 May 2014; pp. 140–149. [Google Scholar]
- Choi, J.; Shin, J.; Kim, M.; Kim, I. Development of openBIM-based energy analysis software to improve the interoperability of energy performance assessment. Autom. Constr. 2016, 72, 52–64. [Google Scholar] [CrossRef]
- Gourlis, G.; Kovacic, I. A study on building performance analysis for energy retrofit of existing industrial facilities. Appl. Energy 2016, 184, 1389–1399. [Google Scholar] [CrossRef]
- Ilter, D.; Ergen, E. BIM for building refurbishment and maintenance: Current status and research directions. Struct. Surv. 2015, 33, 228–256. [Google Scholar] [CrossRef]
- International Organization for Standardization (ISO). ISO 16739—Industry Foundation Classes (IFC) for Data Sharing in the Construction and Facility Management Industries 2013; ISO: Geneva, Switzerland, 2013. [Google Scholar]
- Gourlis, G.; Kovacic, I. Building Information Modelling for analysis of energy efficient industrial buildings—A case study. Renew. Sustain. Energy Rev. 2017, 68, 953–963. [Google Scholar] [CrossRef]
- Jeong, W.; Son, J. An algorithm to translate building topology in building information modeling into object-oriented physical modeling-based building energy modeling. Energies 2016, 9. [Google Scholar] [CrossRef]
- Chalmers, P. Climate Change: Implications for Buildings. Key Findings from the Intergovernmental Panel on Climate Change (IPCC) 5th Assessment Report; Buildings Performance Institute Europe (BPIE): Brussels, Belgium, 2014; Available online: https://www.bmz.de/en/publications/topics/climate/Buildings_Briefing_Web_EN_Pages.pdf (accessed on 1 March 2017).
- Spyridaki, N.A.; Ioannou, A.; Flamos, A.; Oikonomou, V. An ex-post assessment of the regulation on the energy performance of buildings in Greece and the Netherlands—A cross-country comparison. Energy Effic. 2016, 9, 261–279. [Google Scholar] [CrossRef]
- European Commission and Parliament. Directive 2010/31/EU of the European Parliament and of the Council of 19 May 2010 on the Energy Performance of Buildings (EPBD Recast); Eurpean Union: Luxembourg, 2010; Available online: http://eur-lex.europa.eu/legal-content/EN/TXT/PDF/?uri=CELEX:32010L0031&from=ES (accessed on 22 February 2017).
- Patiño-Cambeiro, F.; Armesto, J.; Patiño-Barbeito, F.; Bastos, G. Perspectives on near ZEB renovation projects for residential buildings: The Spanish case. Energies 2016, 9. [Google Scholar] [CrossRef]
- Burford, N.; Jones, R.; Reynolds, S.; Rodley, D. Macro micro studio: A prototype energy autonomous laboratory. Sustainability 2016, 8. [Google Scholar] [CrossRef]
- European Parliament and Council. Commission Delegated Regulation 244/2012 of 16 January 2012 Supplementing Directive 2010/31/EU of the European Parliament and of the Council on the Energy Performance of Buildings by Establishing a Comparative Methodology Framework for Calculating Cost-Optimal Levels of Minimum Energy Performance Requirements for Buildings and Building Elements. European Union: Luxembourg, 2012; Available online: http://eur-lex.europa.eu/legal-content/EN/TXT/PDF/?uri=CELEX:32012R0244&from=en (accessed on 26 February 2017).
- European Parliament and Council. Directive 2012/27/EU of The European Parliament and of the Council of 25 October 2012 on Energy Efficiency, Amending Directives 2009/125/EC and 2010/30/EU and Repealing Directives 2004/8/EC and 2006/32/EC; European Union: Luxembourg, 2012; Available online: http://eur-lex.europa.eu/legal-content/EN/TXT/PDF/?uri=CELEX:32012L0027&from=ES (accessed on 21 February 2017).
- Ministry of the Presidency of Spain. Royal Decree 235/2013 on the basic procedure for energy performance certification in buildings. Boletín Oficial del Estado 2013, 89, 1–14. (In Spanish) [Google Scholar]
- Ministry of Public Works of Spain. Basic Document HE of the Spanish Technical Building Code (CTE-DB-HE). Available online: https://www.codigotecnico.org/images/stories/pdf/ahorroEnergia/DccHE.pdf (accessed on 6 March 2017). (In Spanish).
- Ministry of the Presidency of Spain. Royal Decree 1027/2007—Spanish Regulation on Thermal Systems in Buildings (RITE). Boletín Oficial del Estado 2007, 207, 35931–35984. (In Spanish) [Google Scholar]
- Ministry of Industry, Energy and Tourism of Spain. Royal Decree 56/2016, which transposes the Directive 2012/27/UE on energy efficiency, as regards energy audits, accreditation of service suppliers and energy auditors, and the promotion of efficiency in the supply of energy. Boletín Oficial del Estado 2016, 38, 11655–11681. (In Spanish) [Google Scholar]
- Ministry of Industry, Energy and Tourism of Spain. Certification of Energy Efficiency: Registration of Authorized Documents. Available online: http://www.minetad.gob.es/energia/desarrollo/EficienciaEnergetica/CertificacionEnergetica/DocumentosReconocidos/Paginas/documentosreconocidos.aspx (accessed on 9 March 2017). (In Spanish).
- ECOEFYS. Energy Efficiency Certification Software CE3X for Existing Buildings. Available online: http://www.ecoefys.com/programa-ce3x-de-certificacion-energetica-edificios-existentes (accessed on 13 February 2016). (In Spanish).
- Institute for Energy Diversification and Savings (IDAE). IDAE Guide: Technical Background Manual on Energy Efficiency Certification for Existing Buildings CE3X; IDAE: Madrid, Spain, 2012; Available online: http://www.minetad.gob.es/energia/desarrollo/EficienciaEnergetica/CertificacionEnergetica/DocumentosReconocidos/Documents/Manual_fundamentos_tecnicos_CE3X_05.pdf (accessed on 15 March 2017). (In Spanish)
- Builidngs Performance Institute Europe (BPIE). Energy Performance Certificates across the EU; BPIE: Brussels, Belgium, 2014; Available online: http://bpie.eu/wp-content/uploads/2015/10/Energy-Performance-Certificates-EPC-across-the-EU.-A-mapping-of-national-approaches-2014.pdf (accessed on 3 May 2017).
- European Parliament and Council. Directive 2014/24/EU of 26 February 2014 on Public Procurement and Directive Repealing 2004/18/EC; European Union: Luxembourg, 2014; Available online: http://eur-lex.europa.eu/legal-content/EN/TXT/PDF/?uri=CELEX:32014L0024&from=ES (accessed on 23 February 2017).
- Liz, J.T. BIM, el Futuro de las Infraestructuras. Available online: http://www.esbim.es/wp-content/uploads/2016/06/esBIM-Jorge-Torrico-Comision-esBIM-futuro-infraestructuras.pdf (accessed on 8 March 2017). (In Spanish).
- Presidency of the Government of Spain. Royal Decree 2429/1979—Basic Building Regulation NBE-CT-79, on thermal requirements for buildings. Boletín Oficial del Estado 1979, 253, 24524–24550. (In Spanish) [Google Scholar]
- Armesto, J.; Sánchez-Villanueva, C.; Patiño-Cambeiro, F.; Patiño-Barbeito, F. Indoor multi-sensor acquisition system for projects on energy renovation of buildings. Sensors 2016, 16. [Google Scholar] [CrossRef] [PubMed]
- The Qt Company. Available online: https://www.qt.io (accessed on 4 May 2017).
- Abanda, F.H.; Vidalakis, C.; Oti, A.H.; Tah, J.H.M. A critical analysis of Building Information Modelling systems used in construction projects. Adv. Eng. Softw. 2015, 90, 183–201. [Google Scholar] [CrossRef]
- Instituto Eduardo Torroja de Ciencias de la Construcción; CEPCO; AICIA. Catálogo de Elementos Constructivos del CTE; CSIC: Madrid, Spain, 2010; Available online: http://www.anape.es/pdf/Catalogo%20de%20Elementos%20Constructivos%20CAT-EC-v06.3_marzo_10.pdf (accessed on 16 February 2017). (In Spanish)
- Ministry of Industry, Energy and Tourism of Spain. RITE: Authorized documents. Available online: http://www.minetad.gob.es/energia/desarrollo/EficienciaEnergetica/RITE/Reconocidos/Paginas/IndexDocumentosReconocidos.aspx (accessed on 1 March 2017). (In Spanish).
- Association for Research and Industrial Cooperation of Andalusia (AICIA). Classification of the Energy Performance. Existing Buildings; Ministry of Public Works of Spain: Madrid, Spain, 2011; (In Spanish).
- Aurea Consulting. Infiltrations in Accordance with CTE. Available online: https://ecoeficiente.es/infiltracioneshe (accessed on 7 March 2017). (In Spanish).


| Energy Systems | Power | Efficiency |
|---|---|---|
| Two diesel oil boilers | 2 × 291 kW | Seasonal efficiency 85% |
| Fan-coils | 5.2 kW | Estimated efficiency 92% |
| Electric heater for DHW | 10 kW | Seasonal efficiency 90% |
| Indoor lighting | 103.8 kW | Mean efficiency 55% |
| IMIS (m) | FARO (m) | ε (m) | εr (%) | |
|---|---|---|---|---|
| Corridor length | 31.577 | 31.527 | 0.050 | 0.16% |
| Corridor height | 3.009 | 3.000 | 0.009 | 0.30% |
| Corridor width | 3.022 | 3.018 | 0.004 | 0.13% |
| Hall length | 12.651 | 12.628 | 0.023 | 0.18% |
| Small corridor length | 14.492 | 14.427 | 0.065 | 0.45% |
| Room length | 14.232 | 14.120 | 0.112 | 0.79% |
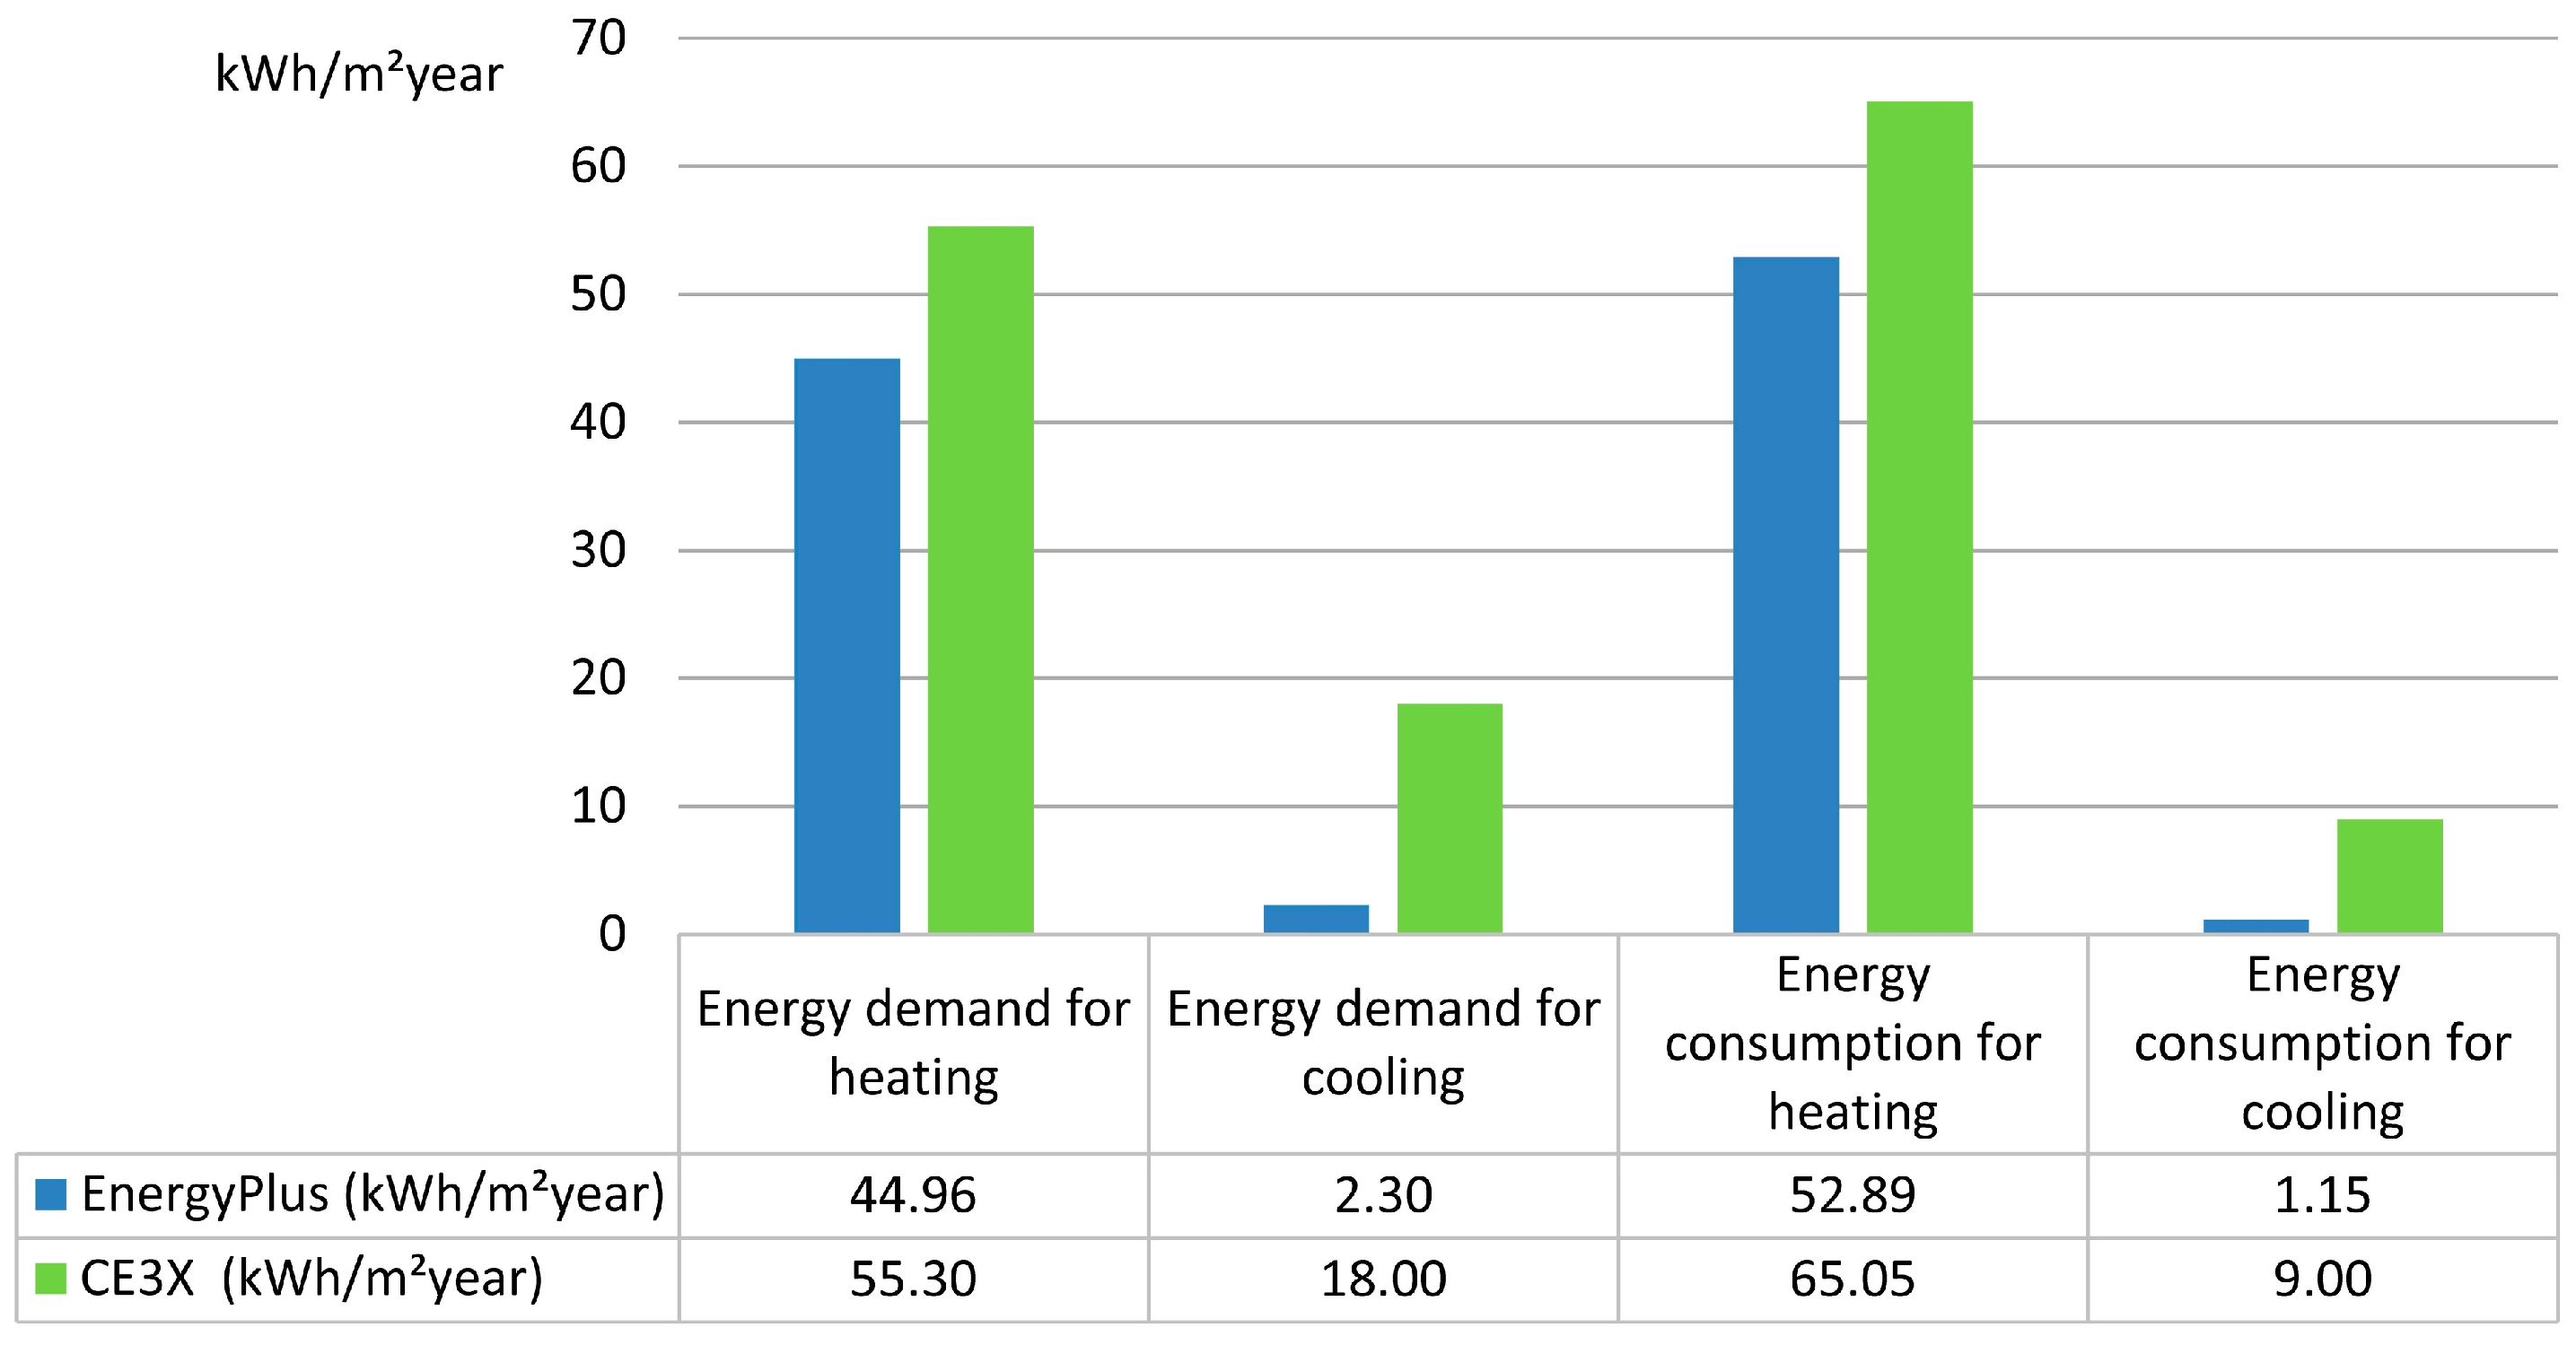
| Energy System | CE3X | Design Builder | Deviation of CE3X (%) | |
|---|---|---|---|---|
| Energy demand (kWh/m2/year) | Heating | 55.30—F | 44.96—E | 23.0 |
| Cooling | 18.00—C | 2.30—A | 682.6 | |
| DHW | 0.40 | 0.44 | −9.1 | |
| Final energy consumption (kWh/m2/year) | Heating | 65.05 | 52.89 | 23.0 |
| Cooling | 9.00 | 1.15 | 682.6 | |
| DHW | 0.45 | 0.49 | −8.1 | |
| Illumination | 43.32 | 43.32 | 0 | |
| Primary energy consumption (kWh/m2/year) | Heating | 76.74 | 62.51 | 22.8 |
| Cooling | 21.31 | 2.72 | 683.4 | |
| DHW | 1.07 | 1.18 | −9.3 | |
| Illumination | 102.60 | 102.60 | 0 | |
| CO2 emissions (kg CO2/m2/year) | Heating | 20.24 | 16.45 | 23.2 |
| Cooling | 2.97 | 0.38 | 681.6 | |
| DHW | 0.15 | 0.16 | −6.2 | |
| Illumination | 14.34 | 14.34 | 0 | |
| Auxiliary equipment | 1.10 | 0.90 | 22.2 | |
| Total CO2 emissions | 38.80—D | 32.23—C | 20.3 |
| Working Days | |
|---|---|
| Time slot (24 h) | 7–14, 17–20 |
| Cooling set point temperature (°C) | 25 |
| Heating set point temperature (°C) | 20 |
| Sensible heat due to users (W/m2) | 2.00 |
| Latent heat due to users (W/m2) | 1.26 |
| Illumination (%) | 100 |
| Equipment (W/m2) | 1.50 |
| Ventilation (%) | 100 |
© 2017 by the authors. Licensee MDPI, Basel, Switzerland. This article is an open access article distributed under the terms and conditions of the Creative Commons Attribution (CC BY) license (http://creativecommons.org/licenses/by/4.0/).
Share and Cite
Patiño-Cambeiro, F.; Bastos, G.; Armesto, J.; Patiño-Barbeito, F. Multidisciplinary Energy Assessment of Tertiary Buildings: Automated Geomatic Inspection, Building Information Modeling Reconstruction and Building Performance Simulation. Energies 2017, 10, 1032. https://doi.org/10.3390/en10071032
Patiño-Cambeiro F, Bastos G, Armesto J, Patiño-Barbeito F. Multidisciplinary Energy Assessment of Tertiary Buildings: Automated Geomatic Inspection, Building Information Modeling Reconstruction and Building Performance Simulation. Energies. 2017; 10(7):1032. https://doi.org/10.3390/en10071032
Chicago/Turabian StylePatiño-Cambeiro, Faustino, Guillermo Bastos, Julia Armesto, and Faustino Patiño-Barbeito. 2017. "Multidisciplinary Energy Assessment of Tertiary Buildings: Automated Geomatic Inspection, Building Information Modeling Reconstruction and Building Performance Simulation" Energies 10, no. 7: 1032. https://doi.org/10.3390/en10071032
APA StylePatiño-Cambeiro, F., Bastos, G., Armesto, J., & Patiño-Barbeito, F. (2017). Multidisciplinary Energy Assessment of Tertiary Buildings: Automated Geomatic Inspection, Building Information Modeling Reconstruction and Building Performance Simulation. Energies, 10(7), 1032. https://doi.org/10.3390/en10071032