Article

Flexibility-Based Evaluation of Variable Generation Acceptability in Korean Power System

Department of Energy System Engineering, Chung-Ang University, 84 Heukseok-ro, Dongjak-gu, Seoul 06974, Korea
*
Author to whom correspondence should be addressed.
Energies 2017, 10(6), 825; https://doi.org/10.3390/en10060825
Submission received: 28 March 2017 / Revised: 6 June 2017 / Accepted: 15 June 2017 / Published: 18 June 2017
(This article belongs to the Special Issue Sustainable Energy Technologies)

Abstract

:
This study proposes an evaluation method for variable generation (VG) acceptability with an adequate level of power system flexibility. In this method, a risk index referred to as the ramping capability shortage expectation (RSE) is used to quantify flexibility. The RSE value of the current power system is selected as the adequate level of flexibility (i.e., RSE criterion). VG acceptability is represented by the VG penetration level for the RSE criterion. The proposed evaluation method was applied to the generation expansion plan in Korea for 2029 in order to examine the validity of the existing plan for VG penetration. Sensitivity analysis was also performed to analyze the effects of changes in system uncertainty on VG acceptability. The results show that the planned VG penetration level for 2029 can improve by approximately 12% while securing flexibility.

1. Introduction

For the next few decades, the national renewable energy plan of Korea has been outlined in the second basic energy plan (every five years), fourth new and renewable energy basic plan (every five years), and seventh basic plan for long-term electricity supply and demand [1,2,3]. These plans indicate that integrating renewable energy is essential to improve energy security and cope with the post-2020 climate change regime. The expansion of photovoltaic (PV) and wind power systems is considered as a core strategy to implement these plans. Their installed capacity is expected to account for approximately 75% of total installed capacity in 2029 [3]. The annual average growth of PV and wind power systems between 2017 and 2029 will be 1012 MW and 528 MW, respectively; these figures correspond to the largest and second largest increase in renewable energy resources.
To cope with the challenges of supplying sustainable energy, renewable energy implementation plans in Korea emphasize variable generation (VG) through PV and wind power systems, although other renewable resources will be included. In the process of introducing VG into the power grid, many studies have demonstrated the lack of flexibility in the operation and planning of the system because unexpected variations in VG would lead to a power mismatch [4,5,6,7,8]. Flexibility is generally defined as the ability to respond to changes in net load (i.e., load minus VG). Power systems may not support flexibility because of uncertainties such as failure of power plants (FOPP) and load forecast errors [8]. Increasing VG has made it harder to secure flexibility because of increased system uncertainty. Accordingly, the flexibility issue has recently surfaced in the operation and planning of power systems.
The flexibility issue is not limited to Korea. Most system operators and planners have encountered this problem and have made efforts to secure flexibility [9,10]. Hence, the conventional generator has received attention because it can provide ramping capability, which can be considered as the most effective means to respond to variations in net load [11]. The greater the ramping capability of the power system, the larger the grid acceptability for VG. However, as mentioned previously, system uncertainty is an inevitable problem. Therefore, controlling the available ramping capability is of vital importance to integrate more VG output, while maintaining flexibility.
Studies have been conducted to assess VG acceptability based on power system flexibility, which can be categorized as deterministic and probabilistic approaches [12,13,14,15]. Ramping capability was considered in the former approach, but related uncertainties in the system were neglected. The load shedding experience of the Electric Reliability Council of Texas (Austin, TX, USA) is a prime example of the necessity of reflecting system uncertainty [16], which was determined in [14,15]. The grid-acceptable wind power capacity was calculated using the unit commitment (UC) and economic dispatch model [14]. A chronological method was used to generate the scenario. However, the FOPP was neglected, which influences reliability. The wind curtailment ratio was also used as a risk criterion. However, wind curtailment risk is not as serious as load curtailment risk, whose effects on reliability are more severe. In [15], the wind power acceptability in China was computed. Various risks were considered through a systematic approach, particularly transmission and storage capacity risks, but FOPP was also neglected.
This study proposes a flexibility-based evaluation method for VG acceptability. In this method, major system uncertainties, such as FOPP and VG forecast error, are considered in the flexibility calculation. Flexibility is quantified using a risk index referred to as the ramping capability shortage expectation (RSE), which represents the possibility of a ramping capability shortage due to major system uncertainties in a particular period [8]. The RSE is used as a criterion in the evaluation of VG acceptability. Korea’s VG penetration plan for 2029 does not provide a reasonable basis for the required flexibility [3]. Thus, we examine the validity of the existing plan for VG penetration and evaluate VG acceptability with an adequate level of flexibility using the proposed evaluation method. Moreover, sensitivity analysis is performed to analyze the effects of system uncertainties on flexibility.
The rest of this paper is organized as follows. Section 2 explains the flexibility index RSE, which is used as a criterion to evaluate the VG acceptability. In Section 3, the evaluation method for VG acceptability is described. In Section 4, VG acceptability for the generation expansion plan in Korea is evaluated. Sensitivity analysis is performed to confirm the effects of changes in uncertainty parameters on VG acceptability. The conclusions and future prospects are discussed in Section 5.

2. Flexibility Index: Ramping Capability Shortage Expectation

When considering power balance, the concept of flexibility can be incorporated in power system reliability, which addresses the risks faced by power systems. The risk considered is simply a power mismatch due to system uncertainties, such as FOPP and net load forecast error (NLFE), which are sources of risk. In other words, a causal relationship exists between risk and system uncertainty. Increasing the VG of PV and wind power systems can increase risk. Studies conducted to evaluate risk have failed to demonstrate this causal relationship [17,18,19]. The RSE index in our study was proposed to overcome this limitation and explicitly evaluate power system flexibility [8].

2.1. RSE Definition

The ramping capability of a generator is defined as the ability to change its output during a specific period. The system ramping capability (SRC) can be computed by adding the ramping capabilities of every generator as follows:
S R C t = i I A i , t Δ t O i , t Δ t min ( P m a x , i P i , t Δ t , r r i Δ t )
In the SRC, the uncertainty of the generator is taken into account using availability Ai,t−Δt, which is calculated using the Markov chain-based capacity state model [8]. This value varies with time Oi,t−Δt and indicates whether generator i is online at time t − Δt. If the generator is online, the value is one; otherwise, it is zero. Pmax,i and Pi,t−Δt are the maximum output and scheduled output of generator i, respectively. rri is the ramp rate of generator i. Δt is the minimum time interval considered in the ramping capability calculation. The SRC should then be compared with the RC requirement (RCR) in the net load side, which is given as follows:
R C R t = N L F E t + F N L t i I A i , t Δ t O i , t Δ t P i , t Δ t
where NLFEt and FNLt are the net load forecast error and forecast net load at time t, respectively. Ai,t−Δt is included in this equation, indicating that RCRt is affected by FOPP. If the loading generator unexpectedly fails, additional ramping capability is required, which is reasonable.
If RCRt is not covered by SRCt, then the power is mismatched. This situation can be called a ramping capability shortage if load shedding is required. Therefore, the risk index RSE is defined as the sum of the probabilities, wherein the RCR will not be satisfied by the SRC for the entire period, and is given as follows:
R S E = t R S P t = t e E t Δ t P r o b ( e ) [ c C t Δ t P r o b c [ R C R t > S R C t ] ]
such that:
R S E = t e E t Δ t P r o b ( e ) [ c C t Δ t P r o b c [ F N L t + N L F E t > i I A i , t Δ t O i , t Δ t { P i , t Δ t + min ( P m a x , i P i , t Δ t , r r i Δ t ) } ] ]
where Ci,t−Δt and Ei,t−Δt are the possible uncertainty scenarios set for the FOPP and NLFE at time t − Δt, respectively. The RSE has the following characteristics: (1) only the up-RC shortage risk (related to increasing net load) is considered so that more critical problems can be incorporated in terms of reliability; and (2) the calculation of the RSE is applied to the worst case of all possible FOPP scenarios. The second characteristic intends to reduce the computational burden in generating scenarios. For more details, refer to [8].

2.2. Comparison of RSE with Reliability Indices

The RSE-based flexibility evaluation is different from conventional evaluations based on reliability indices, such as loss of load probability and loss of load expectation [20,21]. First, the reliability indices-based evaluation is combined with the solution process of the stochastic UC problem. The indices are included in the objective function of the problem; thus, an independent evaluation is impossible. However, calculation of the RSE is independent from the solution process of the UC problem. Second, in the reliability indices-based evaluation, generating uncertainty scenarios such as FOPP and NLFE, as well as establishing simulation procedures are time-consuming. It is impossible to consider all the possible scenarios for system uncertainty. In most related studies, reduction techniques were used to generate uncertainty scenarios. However, scenarios for system severity were not generated. System severity is defined as the extent to which the system is in danger of losing the power balance. Severity should be considered in the flexibility study because the nature of the risks observed in flexibility and reliability studies are the same. The RSE can take into account severity by selecting the worst case for the FOPP scenario, thereby reducing the computational burden that occurs as the size of the system increases.

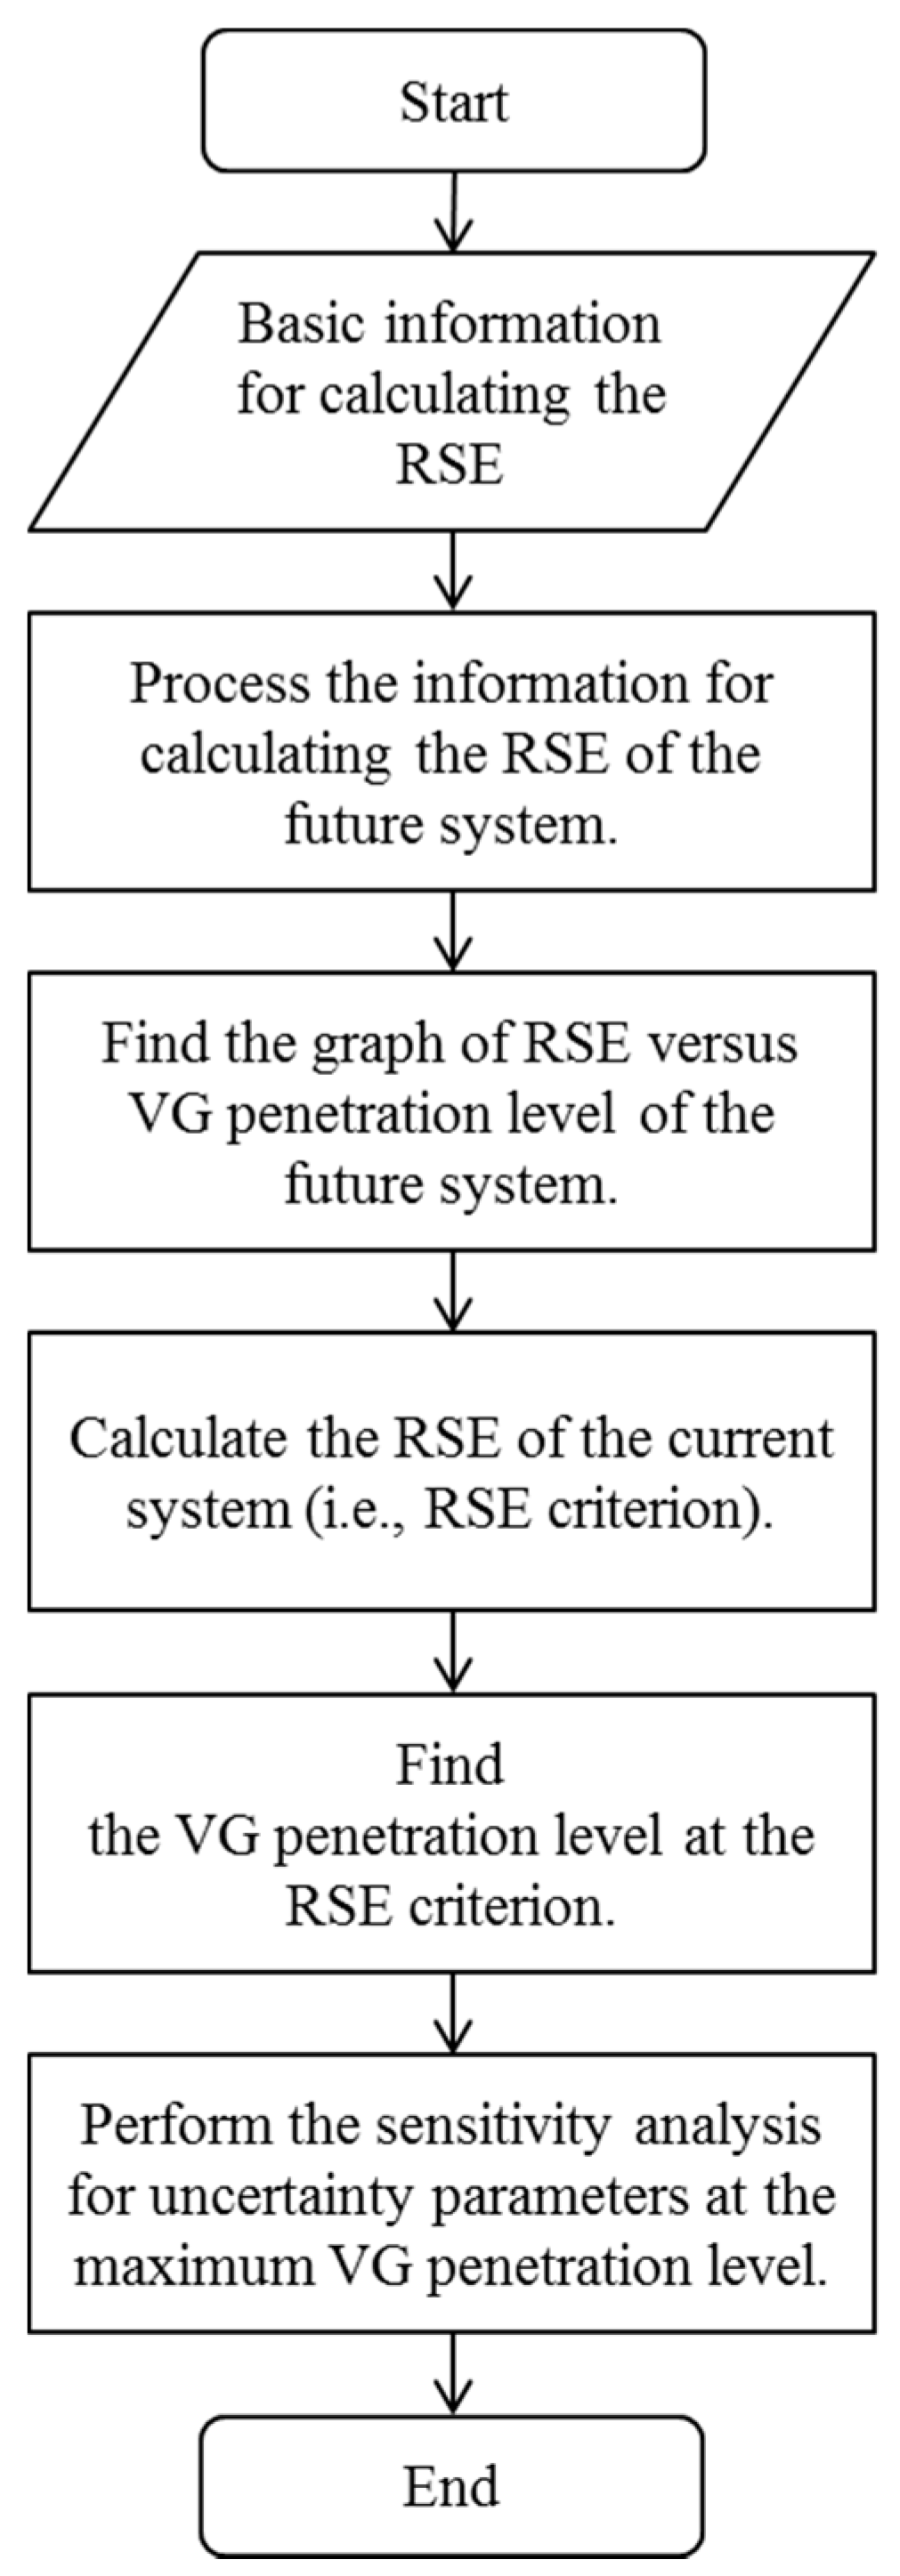
3. Evaluation Procedure of the Variable Generation Acceptability
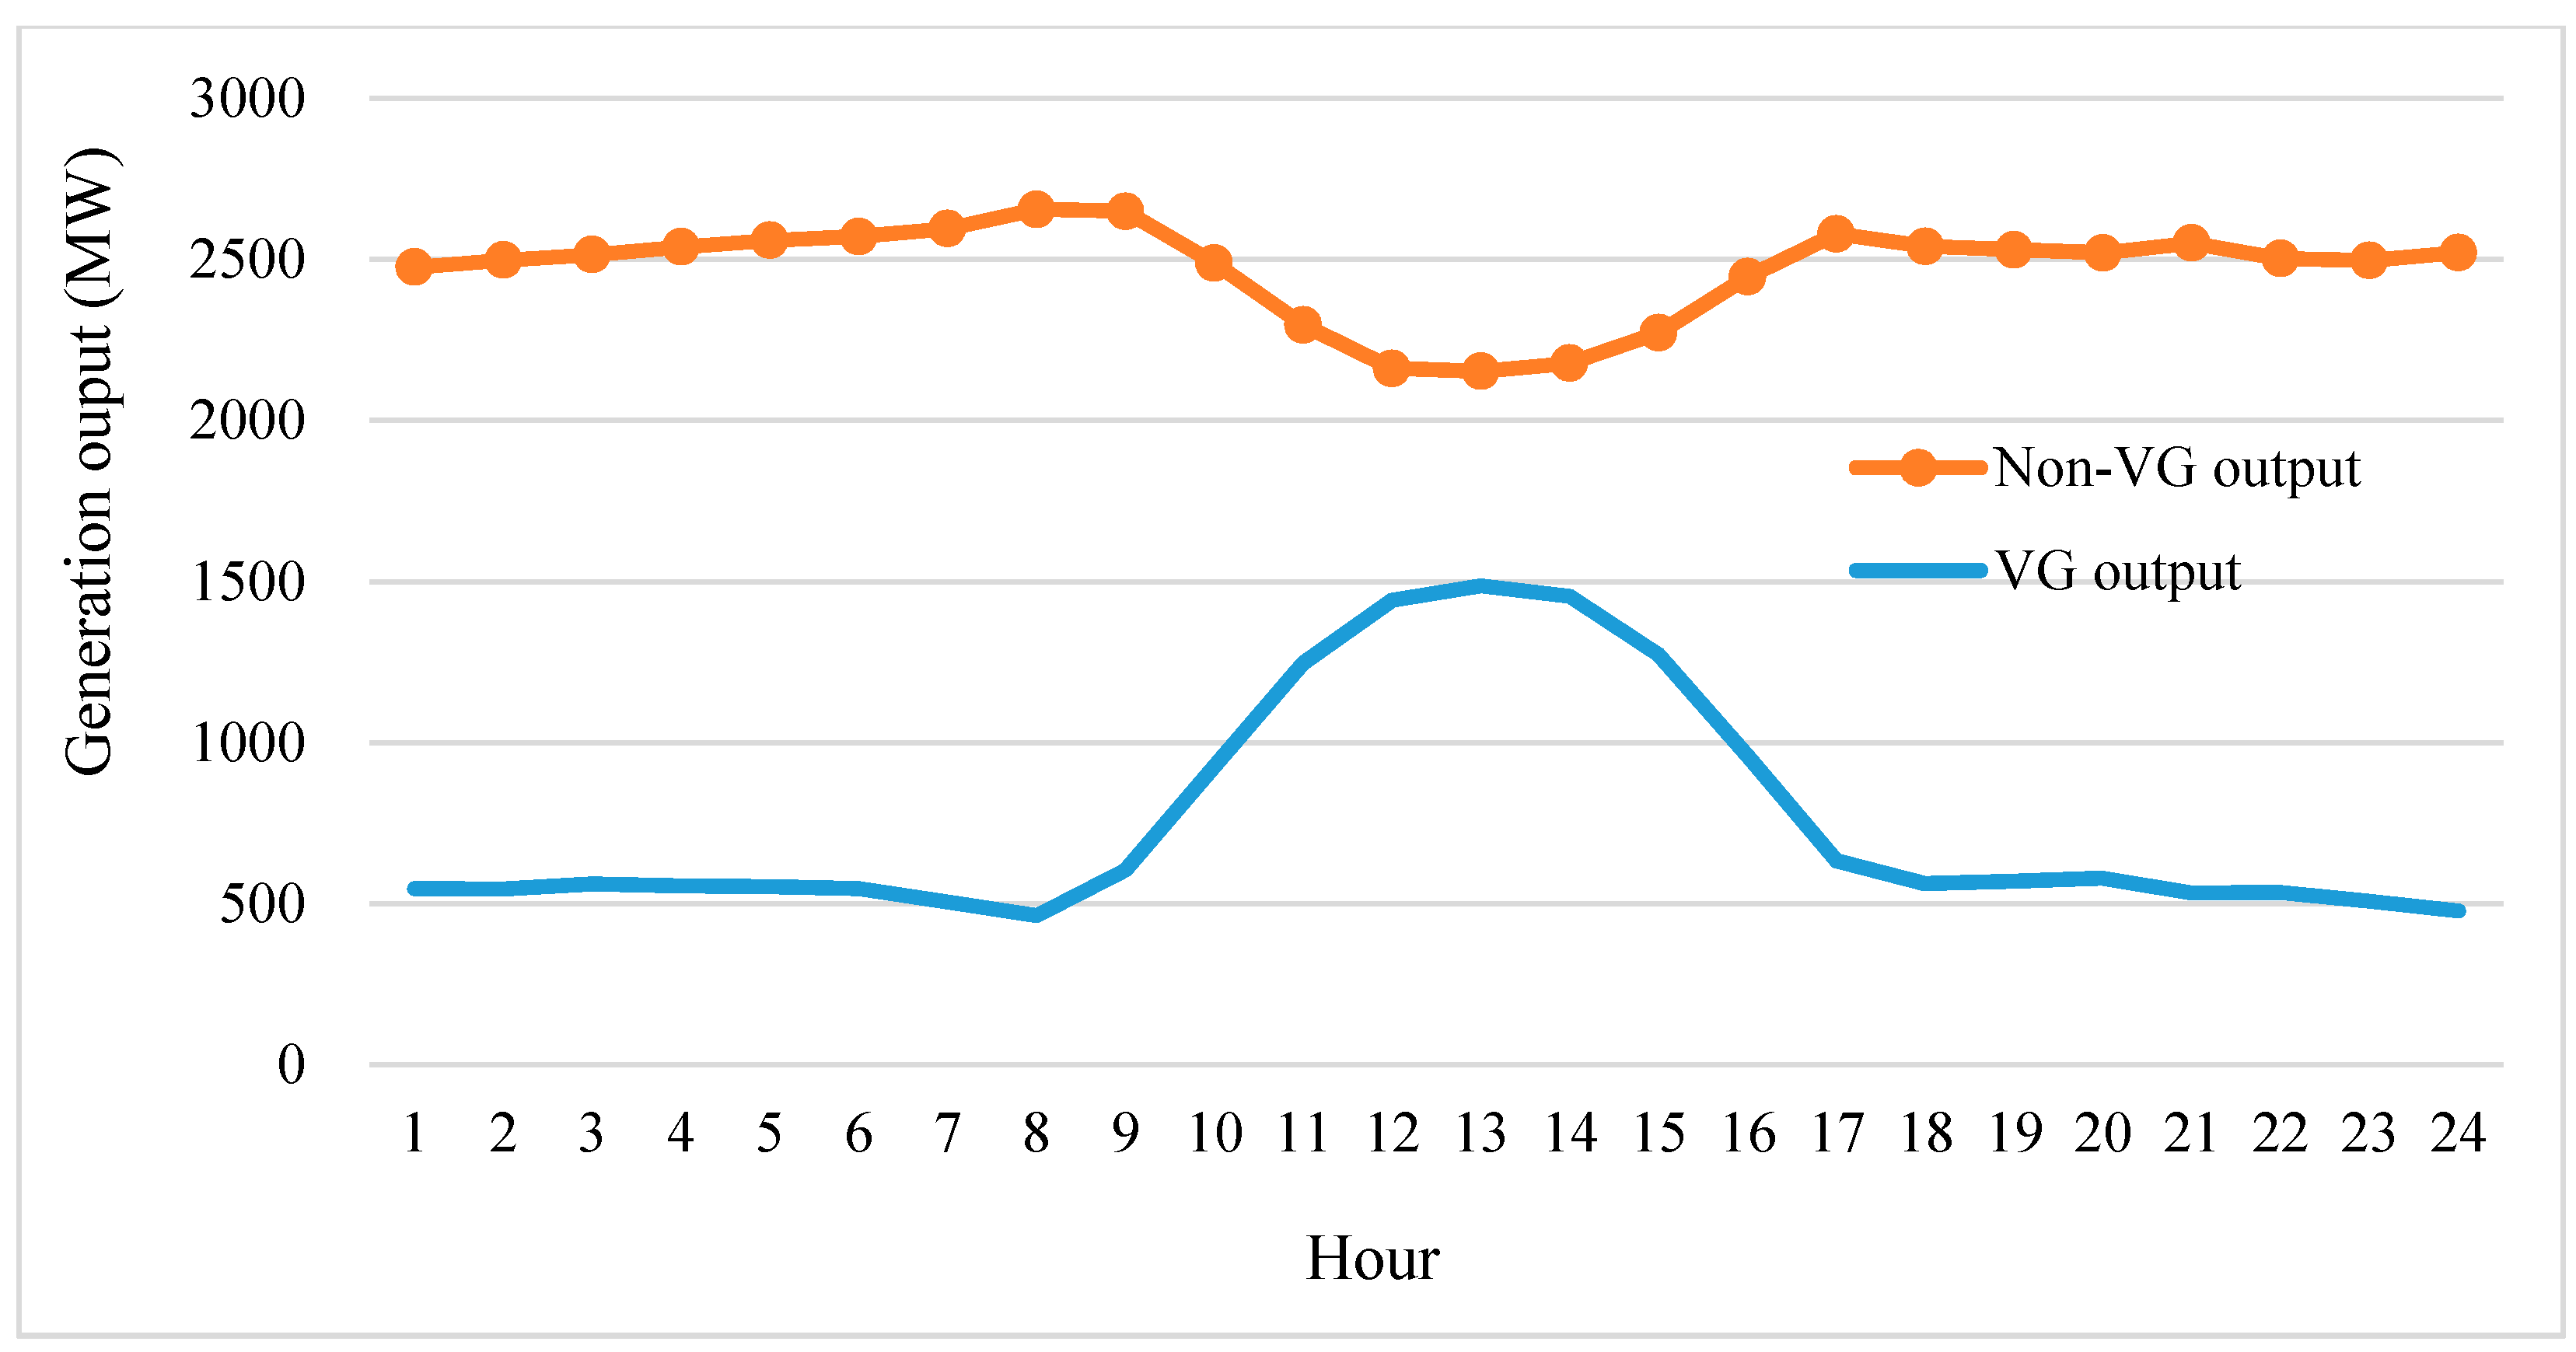
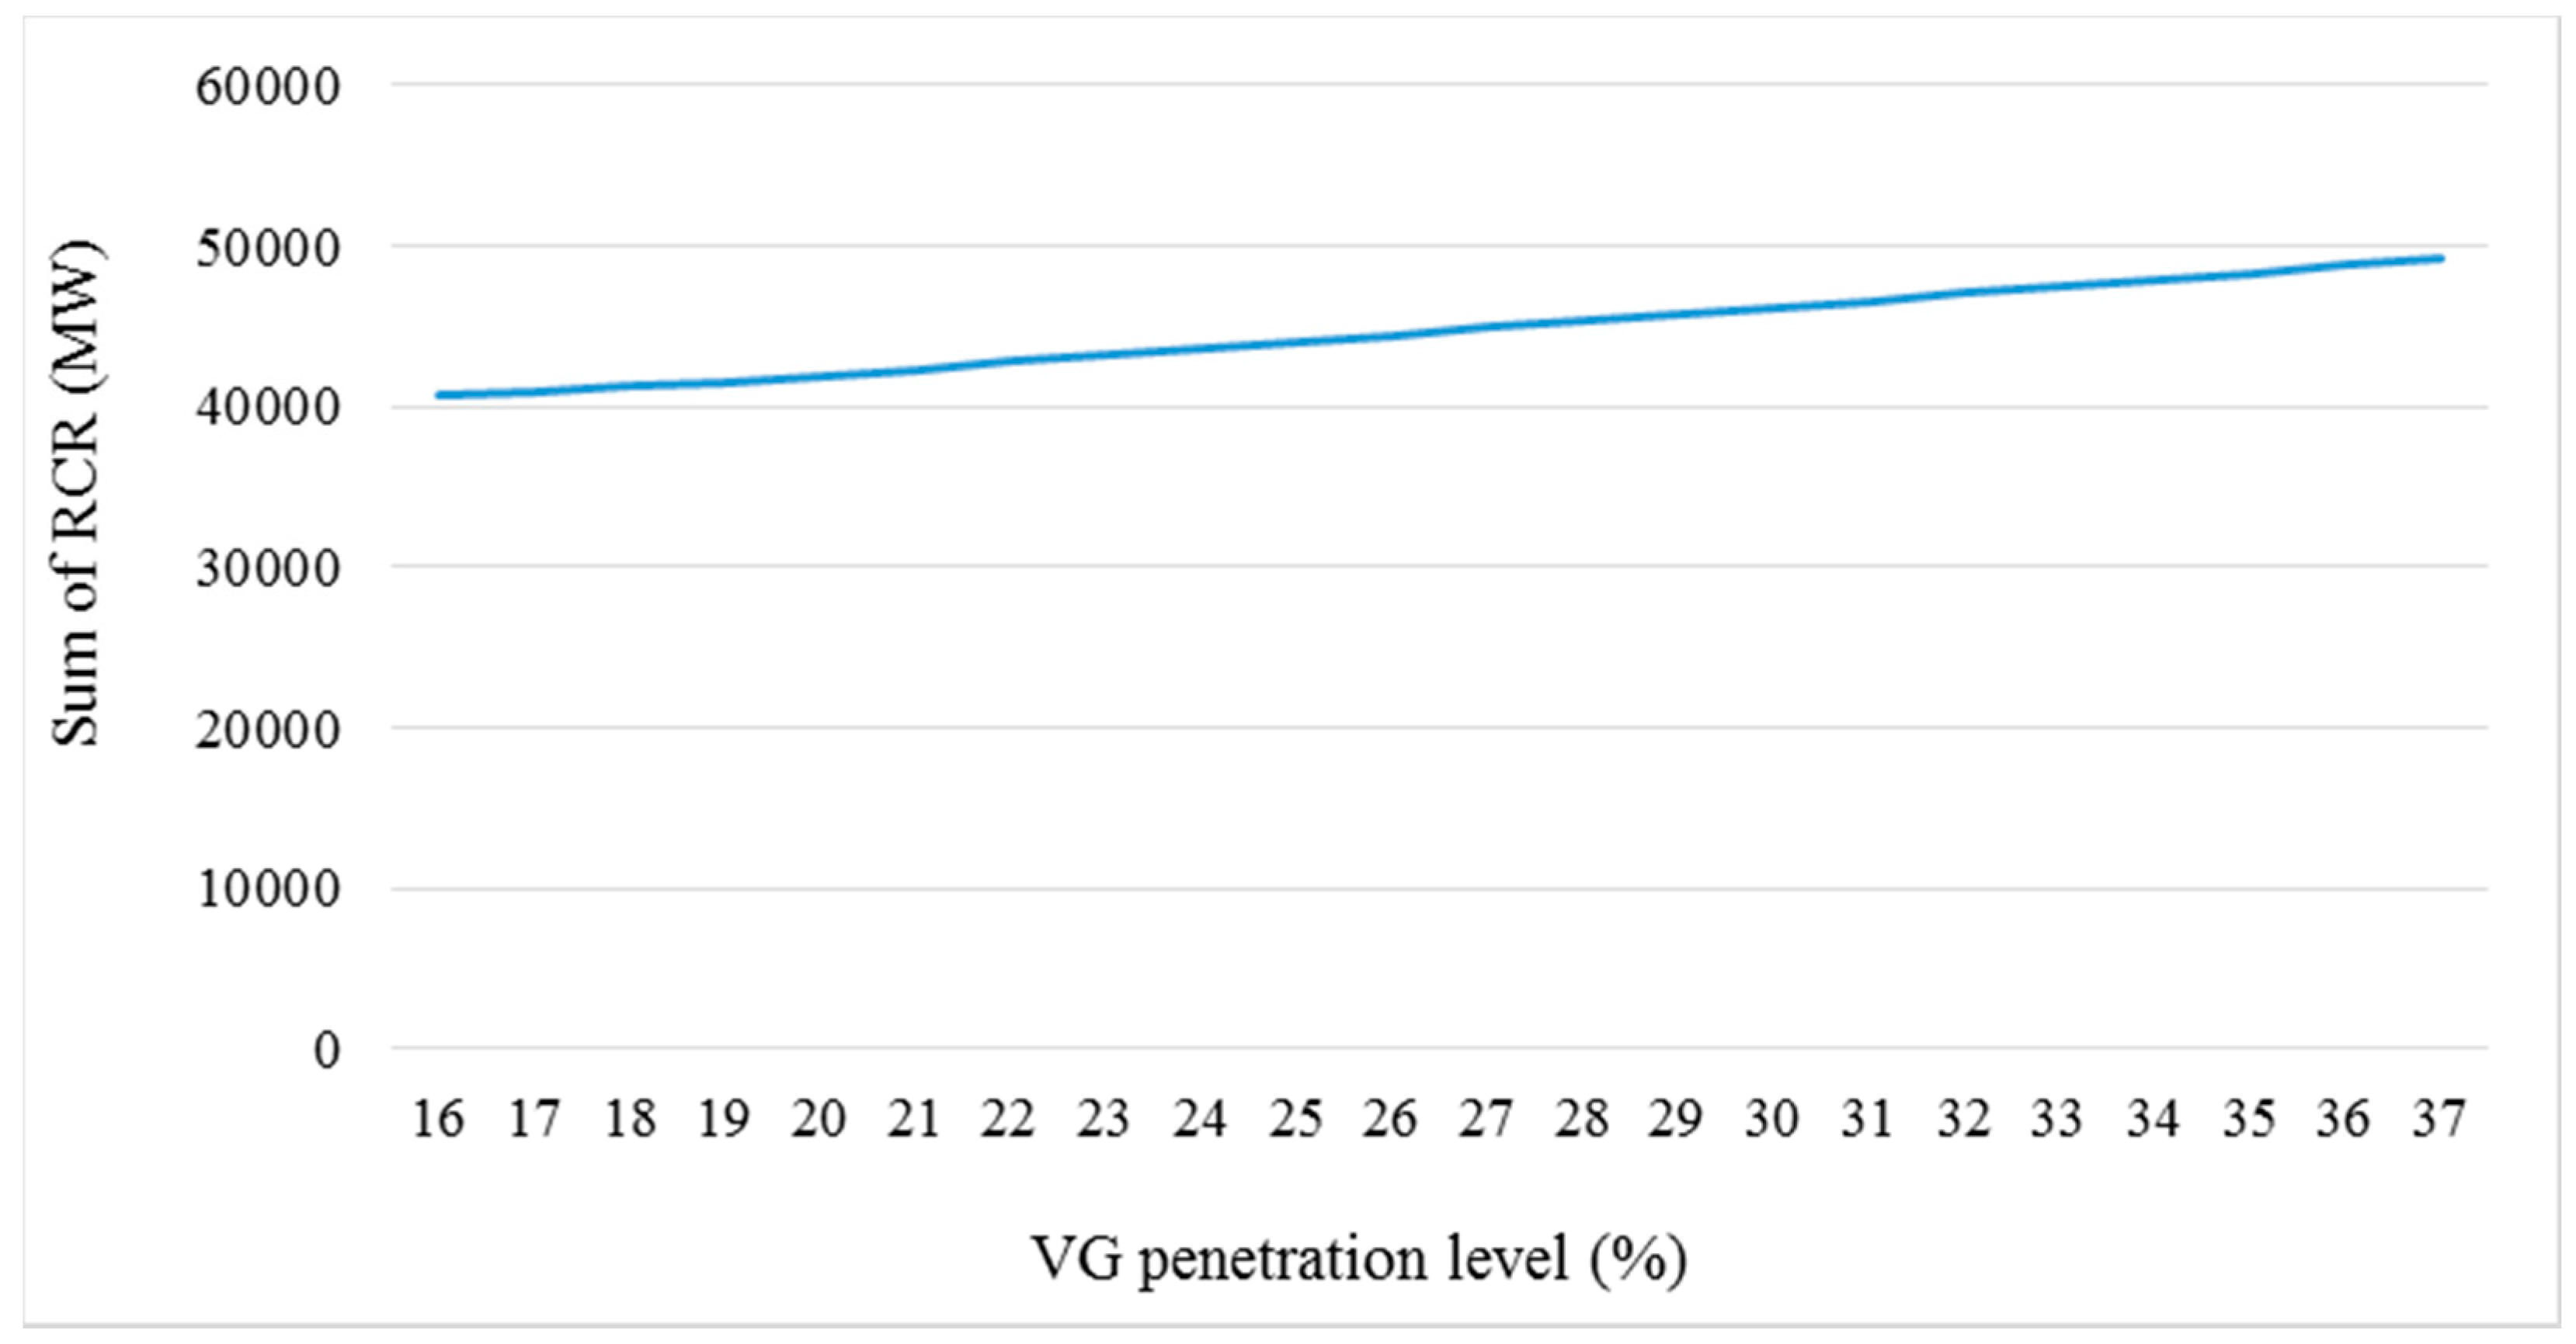
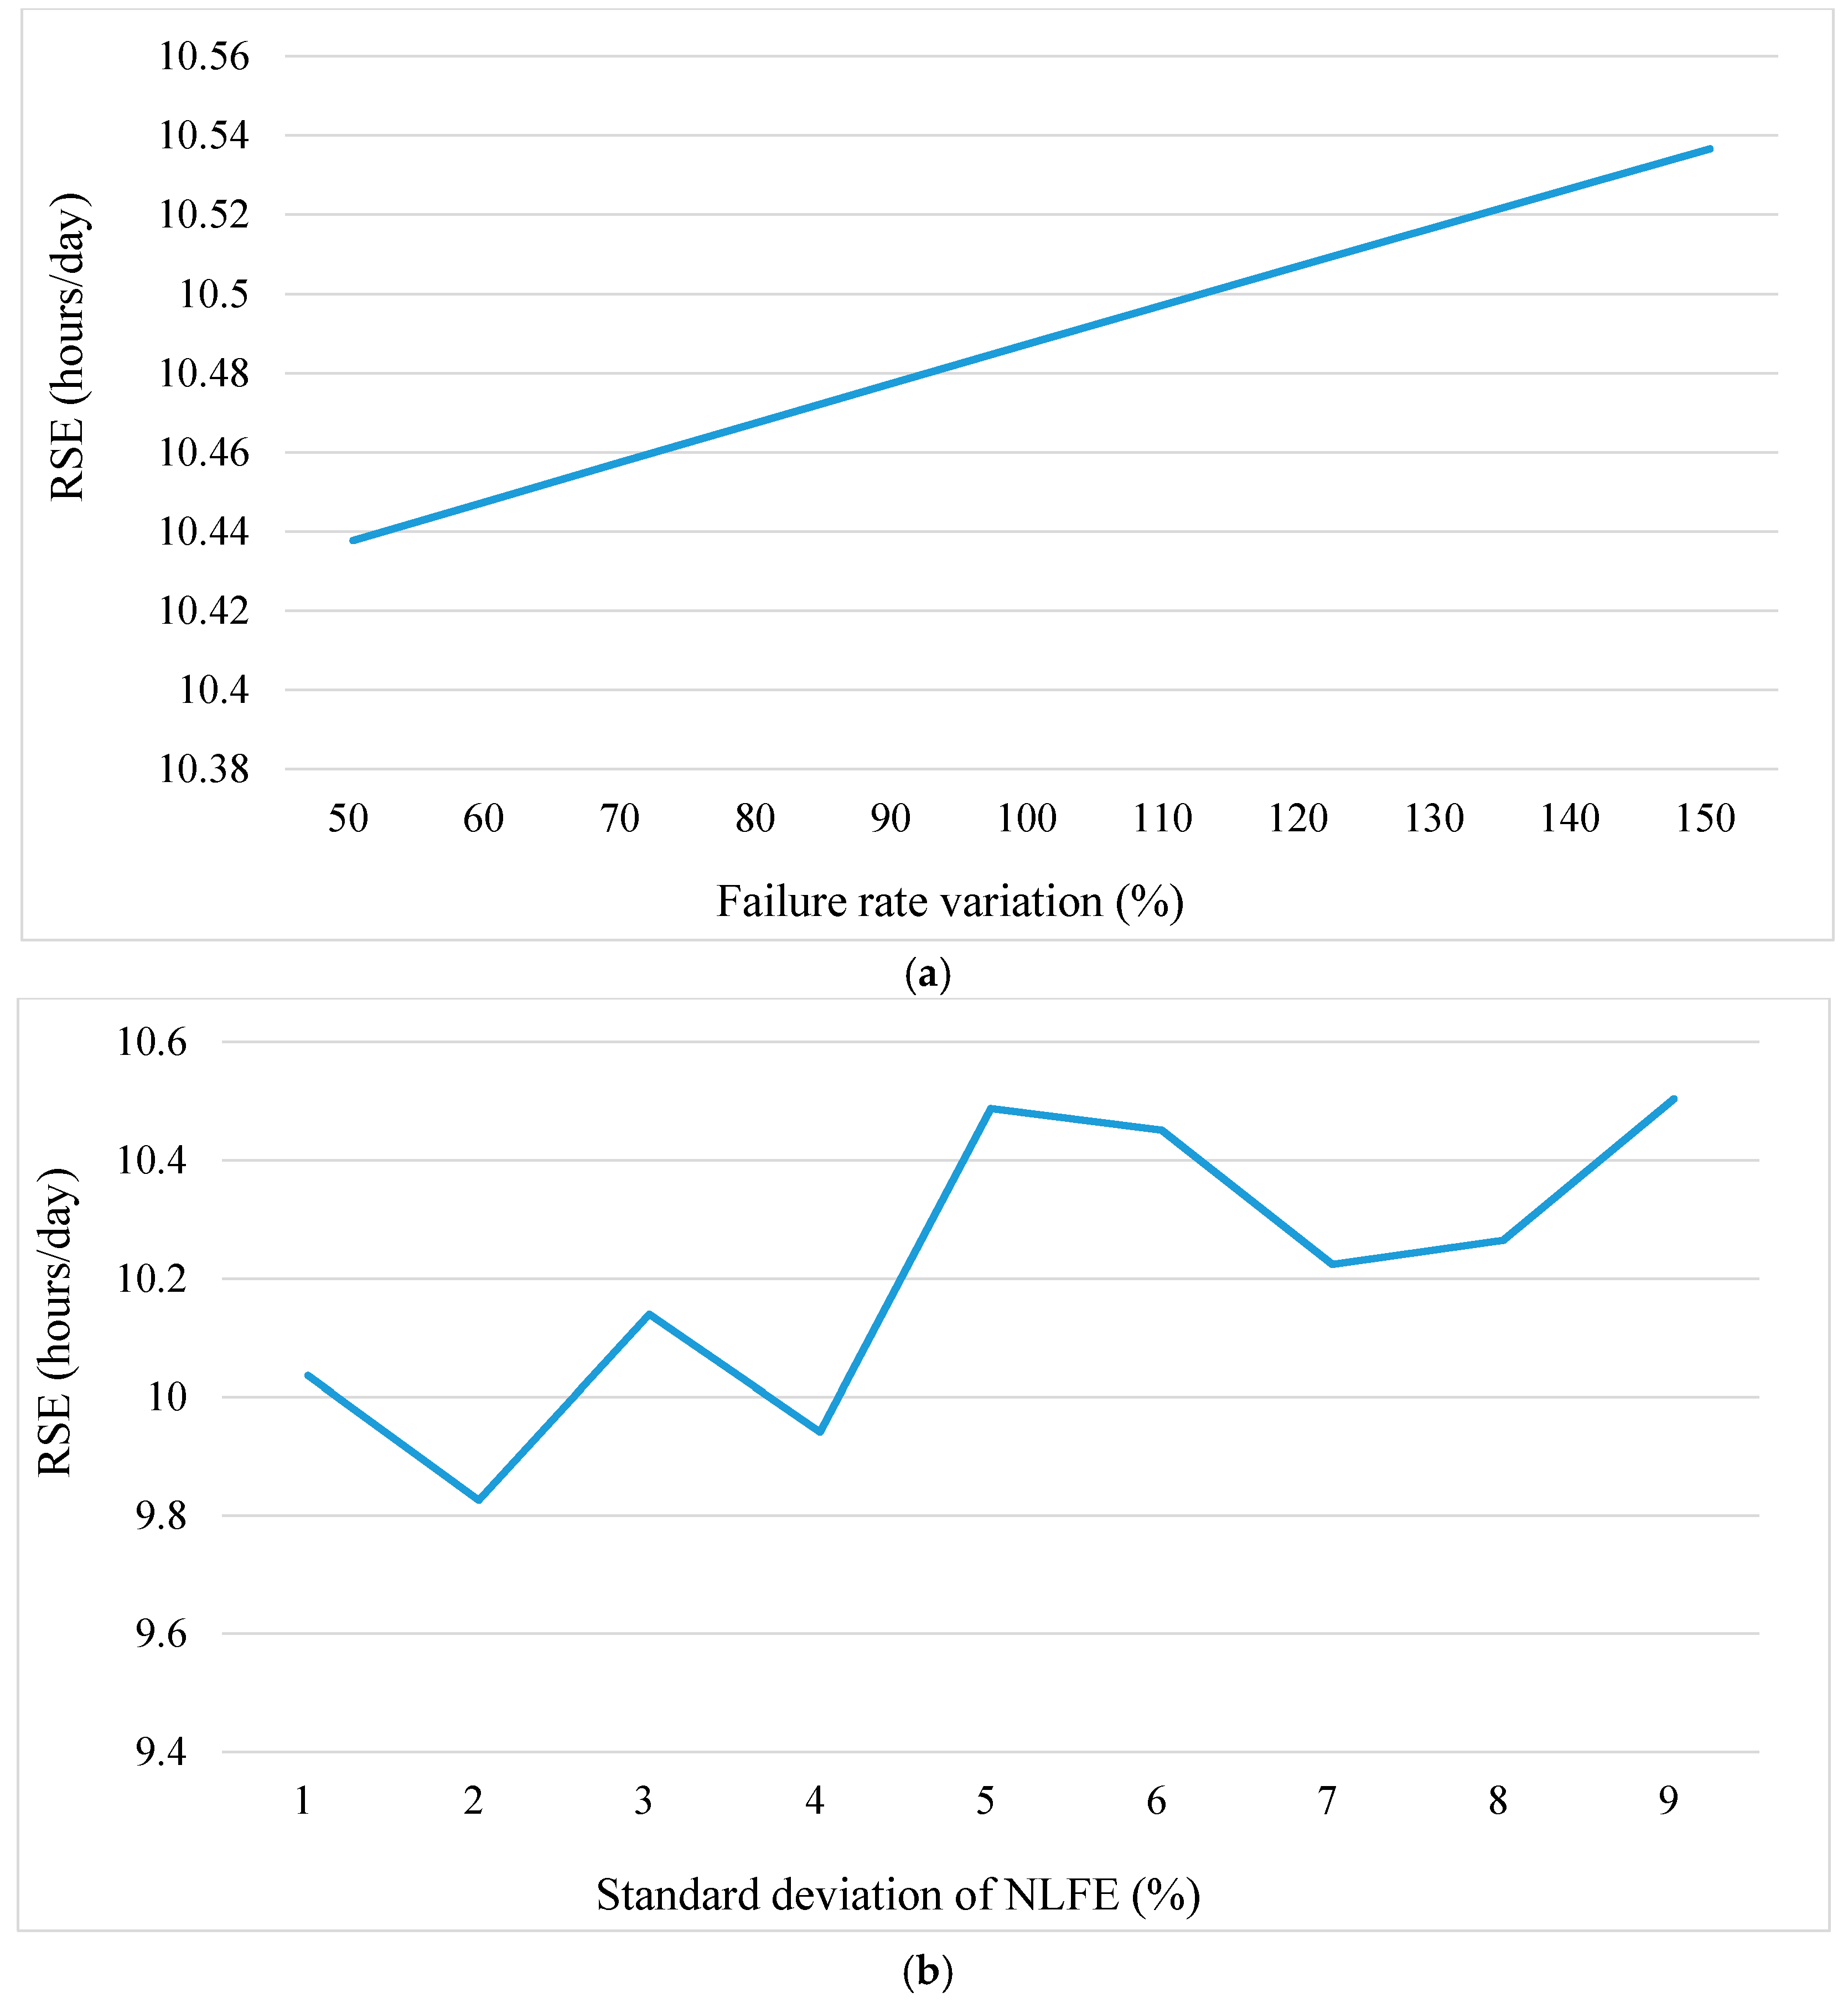
VG acceptability was evaluated to determine the maximum acceptable level of VG penetration with an adequate level of power system flexibility (i.e., RSE criterion). This evaluation procedure is based on the relationship between VG penetration level and flexibility. The RSE helps quantify the effects of VG penetration level on flexibility. As shown in Equation (4), the terms FNLt, NLFEt, Pi,t−Δt, Prob(e), and Probc are associated with VG penetration level and their changes directly affect the RSE. The RSE may decrease as VG penetration level increases, although the extent to which it decreases depends on the characteristics of the system. If a power system has many fast-ramping units, then the RSE is more likely to decrease gradually compared to a system with many slow-ramping units. However, system uncertainties, such as the failure rate of generators, can affect the RSE, thereby decreasing its value more abruptly.
After obtaining the relationship between the penetration level and RSE, the VG acceptability under the RSE criterion can be easily determined. In this study, the RSE value of the current power system was used as the RSE criterion in order to maintain the same flexibility level as that of the current system. This approach is reliable because the flexibility of the current system is empirically verified. RSE values above the RSE criterion and their corresponding VG penetration levels are feasible. The maximum value among the feasible VG penetration levels indicates the VG acceptability. Sensitivity analysis of the uncertainty parameters is then performed at this value to examine the effects of uncertainty parameters on VG acceptability.
Figure 1 shows the flexibility-based evaluation procedure. The basic information for calculating the RSE includes the forecasted net load profile for the worst case scenario, VG-related information, load distribution information, VG forecast error, and the technical information of generators. The forecasted net load profile can be obtained by combining the forecasted load profile and VG-related information. The distribution information of the load and VG forecast errors are factored into the uncertainty scenarios for NLFE (i.e., Ei,t−Δt in Equation (4)). The technical information of the generators, such as failure rate, repair rate, and maximum generation output, are used to calculate the generator states and their probabilities, which are then used to obtain uncertainty scenarios for FOPP (i.e., Ci,t−Δt in Equation (4)).

4. Case Study

The main objective of our simulation is not only to evaluate the maximum acceptable level of VG penetration in Korea for 2029 but also to examine the influence of uncertainty parameters on power system flexibility. The year of interest is 2029, which is the last forecasted year in the latest generation expansion plan [3]. In recent years, the annual peak load tends to occur in the winter season (i.e., December to February) in Korea. This is attributed to the use of equipment with temperature-sensitive loads, such as electric heaters. In addition, 16 December 2016 was chosen as one of the peak days [22]. Figure 2 shows the load profiles of the peak day; the peak load was 75,500 MW at around 10:00 a.m.
The generators in Korea can be classified into dispatchable and non-dispatchable units. The power system operator has no control over non-dispatchable units, which include not only VG systems but also non-VG systems such as units with power below 20 MW, units owned by community energy service providers [23], and new-energy units (i.e., units using energy converted from fossil fuels or obtained through the chemical reaction between oxygen and hydrogen—for example, fuel cells, integrated gasification combined cycle, hydrogen energy, etc.). We assumed that on the peak day in 2029, the output patterns of VG and non-VG systems are the same as that in 2016. However, to represent the changes in VG penetration level, the proportions of the PV and wind power systems were adjusted to their expected generation capacity in 2029. This assumption is based on the fact that the number of PV and wind power systems will proportionally increase from their current installation rates by region, which may be significant because of the smoothing effect. This means that fluctuations in total VG outputs are smoothened by the correlations between the VG outputs of each region [24]. Figure 3 shows the profiles of VG and non-VG outputs. The increase in VG output during hours 8–13 is because of PV power. With exception of PV power, most of the power of VG comes from wind systems. However, the output is flattened by the smoothing effect. Figure 4 shows the net load profiles. By employing an upscaling technique, the net load profile of the peak day in 2029 can be represented, with a peak load of 101,154 MW that occurs during hour 18.
On the peak day in 2016, the number of available generators was 202, excluding non-dispatchable units, units scheduled for maintenance, and failed units; the available capacity was 87,183 MW. The dispatchable units can be categorized into several types: combined-cycle (using both gas and steam turbines) fossil-fuel units, steam turbine fossil-fuel units, cogeneration units, hydraulic/pumped hydraulic units, and nuclear power units. In 2016, the ratios of non-available units to total units, with respect to the aforementioned types, were 1.3%, 10%, 4.8%, 45.5% and 21.7%, respectively. The same ratios were applied to each type of generator in 2029. Accordingly, the number of available dispatchable units is 296, with available capacity of 116,712 MW (as of 16 December 2029). Information on the type and size of generators in 2029 is listed in [3]. Technical information on newly installed generators from 2017 to 2029 is assumed to be the same as that of the latest generators (see Appendix A for the details of newly installed generators). Information on failure and repair rates can be seen in [25]. The NLFE is assumed to have a normal distribution with a standard deviation of 5%.
The generation schedule was determined using M-CoreS (version: 2.10.161101, Master’s Space, Seoul, Korea), a commercial software designed to simulate the short-term electricity market in Korea [26]. The Korean electricity market currently operates under the cost-based pool market rule; the latest market rule was applied for this simulation. The detailed market rule is given in [27]. A MATLAB program (R2013b version) (MathWorks, Natick, MA, USA) was used to compute the RSE for the resulting power generation schedule. Using a PC with a 3.7 GHz Intel Core i3-6100 CPU (Santa Clara, CA, USA) and 16 GB RAM, the computational time for the market simulation and RSE calculation were 5 and 13 min, respectively.
Figure 5 shows the generation schedule for the power system in 2029; “Hyd/pumped” is an acronym of “hydraulic/pumped hydraulic unit”. For reference, the results were obtained for the net load in 2029. The combined-cycle units followed the hourly variations in net load, and the hydraulic/pumped hydraulic units offset the sharp increase in net load. The negative values of the Hyd/pumped unit appeared during hours 4 and 13 because of the action of the pumped hydraulic units; these values, however, were too small to be seen in the graph.
Figure 6 shows the graph of RSE versus VG penetration level, with a step size of 1%, where the RSE criterion (i.e., 10.6720 h/day) is indicated with a blue dotted line. The RSE values (i.e., risk level) decreased in some sections as VG penetration level increased, although the sum of RCR during the entire period increased (that is, more RC was required) with the increase in VG penetration level, as shown in Figure 7. This may be because the system ramping capability is determined by the generation schedule. The market rule for the generation schedule requires the system operator to secure operating reserves. These are classified into three types: frequency regulation reserves (for governor free and automatic generation control services), standby reserves, and replacement reserves. The second and third type of reserves can either be spinning or non-spinning. The requirement for frequency regulation reserves is at least 1500 MW, while the minimum requirements for spinning and non-spinning reserves are 1500 MW and 1000 MW, respectively. The SRC can vary with this constraint and net load situations. For all VG penetration levels, the highest ramping up in net load occurred at hour 8. When comparing generation schedules based on VG penetration levels at hour 8, the result with larger RSE had greater SRC (i.e., more operating reserves).
The planned VG penetration level in 2029 is 22%, and the corresponding RSE is 10.4513 h/day, which is less than the RSE criterion. The RSE criterion intersects the RSE graph at two points, and the VG penetration levels at each point are 19.2% and 35.8%, respectively. The feasible VG penetration levels are between these two points. The larger one (i.e., 35.8%) corresponds to the maximum acceptable level of VG penetration. It should be noted that this value is not only 12% larger than the planned VG penetration level (i.e., 22%) but is also helpful in maintaining the same flexibility as that of the current system (as of 16 December 2016). According to the generation schedule, some RSE values may fall below the RSE criterion in some sections after a VG penetration of 37%. However, those values would be unstable because some variations in the values can lead to a violation of the RSE criterion.
In order to examine the impact of changes in system uncertainty on VG penetration level, sensitivity analysis was performed with the following uncertainty parameters: the standard deviation of NLFE and generator failure rates. The standard deviations of NLFE and generator failure rates were chosen as representative uncertainty parameters for the load and generation sides, respectively. Figure 8 shows the results of the sensitivity analysis. In Figure 8a, the graph was obtained by increasing/decreasing the failure rates of the generators from –50% to +50%; in the horizontal axis, the value of 100 indicates the original failure rates. It should be noted that the variations in RSE values did not exceed the RSE criterion (i.e., 10.6720 h/day), indicating that the power system can withstand, to some extent, future changes in failure rates. Moreover, the RSE changed linearly with the failure rates of the generators, as expected from Equation (4).
The impact of the standard deviation of NLFE on the RSE was also examined by increasing/decreasing its value from 1% to 9%, with a step size of 1%, as shown in Figure 8b. For reference, the default value was set to 5%. The graph shows the increase or decrease for each section, although it tends to increase with respect to standard deviation in general. The standard deviation can be used to interpret the accuracy of the forecasting technique. The results show that the higher the accuracy, the lower the risk (i.e., RSE). This result will vary depending on the type of system. The relationship between the RSE and uncertainty parameters enables the system operator to effectively manage system risks.

5. Conclusions

This study proposed a flexibility-based evaluation method for VG acceptability. We explicitly quantified power system flexibility using a risk index called the RSE. In this method, the RSE of the current power system was used as the acceptable level of flexibility (i.e., RSE criterion). The VG acceptability of the generation expansion plan in Korea for 2029 was evaluated using the proposed method. The results show that the VG penetration level could improve by approximately 12% compared to the planned VG penetration level. The results of sensitivity analysis also show the extent to which system uncertainty affected VG acceptability. As part of future work, it would be interesting to investigate the impact of flexible demand-side resources on the RSE. We also plan to examine the time complementarity between VG resources.

Acknowledgments

This research was supported by Korea Electric Power Corporation through Korea Electrical Engineering & Science Research Institute (Grant no.: R15XA03-55).

Author Contributions

Chang-Gi Min carried out the main body of research and Mun-Kyeom Kim reviewed the work continuously.

Conflicts of Interest

The authors declare no conflict of interest.

Appendix A. Newly Installed Generators from 2017 to 2029 (※ ST: Steam Turbine; CC: Combined Cycle; Nucl.: Nuclear)

Table A1. Generation output limits and coefficient of cost function.
Generator NameMaximum Output (MW)Minimum Output (MW)Coefficient of Cost Function
2nd-Order (Gcal/MW2)1st-Order (Gcal/MW)Constant (Gcal)
CC1-GT140480.0054542.48963918.7936
CC2-CC200820.0011151.84265318.01031
CC3-GT2741840.000031.871501157.2697
CC4-GT2741840.000031.871501157.2697
CC3-CC4002810.0003861.138112125.5207
CC4-CC4002810.0003861.138112125.5207
CC5-GT572.63300.0006431.19617472.335
CC5-CC10005420.0000071.501309100.2745
CC6-GT571.61880.0001112.11102765.73368
CC6-CC9504390.0000031.49452170.40799
CC7-GT572.63300.0006431.19617472.335
CC8-GT572.63300.0006431.19617472.335
CC7-CC9005420.0000071.501309100.2745
CC8-CC9005420.0000071.501309100.2745
CC9-GT306.21160.0000032.46141867.76106
CC9-CC4701750.0000771.55121640.38037
CC10-GT572.63300.0006431.19617472.335
CC10-CC9605420.0000071.501309100.2745
CC11-GT572.63300.0006431.19617472.335
CC11-CC10005420.0000071.501309100.2745
CC12-GT572.63300.0006431.19617472.335
CC12-CC9205420.0000071.501309100.2745
ST15952600.0001361.863031107.3797
ST25952600.0001361.863031107.3797
ST310226090.0000981.765468199.9551
ST410226090.0000981.765468199.9551
ST510006090.0000981.765468199.9551
ST610006090.0000981.765468199.9551
ST710006090.0000981.765468199.9551
ST810406090.0000981.765468199.9551
ST910406090.0000981.765468199.9551
ST105802600.0001361.863031107.3797
ST115802600.0001361.863031107.3797
ST1210406090.0000981.765468199.9551
ST1310406090.0000981.765468199.9551
ST1410506090.0000981.765468199.9551
ST1510506090.0000981.765468199.9551
ST1610506350.0000251.899346165.6219
Nucl.114007950.0001052.043505267.8154
Nucl.214007950.0001052.043505267.8154
Nucl.314007950.0001052.043505267.8154
Nucl.414007950.0001052.043505267.8154
Nucl.515007950.0001052.043505267.8154
Nucl.615007950.0001052.043505267.8154
Nucl.715007950.0001052.043505267.8154
Nucl.815007950.0001052.043505267.8154
Nucl.914007950.0001052.043505267.8154
Nucl.1014007950.0001052.043505267.8154
Nucl.1114007950.0001052.043505267.8154
Nucl.1214007950.0001052.043505267.8154
Table A2. Ramp and on/off constraints.
Generator NameRamp-Up Rate (MW/min)Minimum Up Time (h)Minimum Down Time (h)Ramp-Up Rate for Start Up (MW/min)Ramp-Down Rate for Shut Down (MW/min)
CC1-GT71177
CC2-CC8.7438.78.7
CC3-GT13.11.33.813.113.1
CC4-GT13.11.33.813.113.1
CC3-CC2043.82020
CC4-CC2043.82020
CC5-GT22.53.14.822.522.5
CC5-CC364.25.34848
CC6-GT22.51222.522.5
CC6-CC34.54334.534.5
CC7-GT22.53.14.822.522.5
CC8-GT22.53.14.822.522.5
CC7-CC364.25.34848
CC8-CC364.25.34848
CC9-GT11.54311.511.5
CC9-CC18.554318.618.6
CC10-GT22.53.14.822.522.5
CC10-CC364.25.34848
CC11-GT22.53.14.822.522.5
CC11-CC364.25.34848
CC12-GT22.53.14.822.522.5
CC12-CC364.25.34848
ST1156121515
ST2156121515
ST312.581830.630.6
ST412.581830.630.6
ST512.581830.630.6
ST612.581830.630.6
ST712.581830.630.6
ST812.581830.630.6
ST912.581830.630.6
ST10156121515
ST11156121515
ST1212.581830.630.6
ST1312.581830.630.6
ST1412.581830.630.6
ST1512.581830.630.6
ST1610.57.720.811
Nucl.10.978120.51.6
Nucl.20.978120.51.6
Nucl.30.978120.51.6
Nucl.40.978120.51.6
Nucl.50.978120.51.6
Nucl.60.978120.51.6
Nucl.70.978120.51.6
Nucl.80.978120.51.6
Nucl.90.978120.51.6
Nucl.100.978120.51.6
Nucl.110.978120.51.6
Nucl.120.978120.51.6

References

  1. The Ministry of Trade, Industry and Energy (MOTIE). The 2nd National Energy Master Plan; MOTIE: Sejong, Korea, 2015.
  2. The Ministry of Trade, Industry and Energy. The 4th New & Renewable Energy Basic Plan; MOTIE: Sejong, Korea, 2014.
  3. The Ministry of Trade, Industry and Energy. The 7th Basic Plan on Electricity Demand and Supply; MOTIE: Sejong, Korea, 2015.
  4. Ryan, J.; Ela, E.; Flynn, D.; O’Malley, M. Variable generation, reserves, flexibility and policy interactions. In Proceedings of the 2014 47th Hawaii International Conference on System Sciences (HICSS), Waikoloa, HI, USA, 6–9 January 2014; pp. 2426–2434. [Google Scholar]
  5. Lin, J.; Cheng, L.; Chang, Y.; Zhang, K.; Shu, B.; Liu, G. Reliability based power systems planning and operation with wind power integration: A review to models, algorithms and applications. Renew. Sustain. Energy Rev. 2014, 31, 921–934. [Google Scholar] [CrossRef]
  6. Lannoye, E.; Flynn, D.; O’Malley, M. Evaluation of power system flexibility. IEEE Trans. Power Syst. 2012, 27, 922–931. [Google Scholar] [CrossRef]
  7. Nosair, H.; Bouffard, F. Flexibility envelopes for power system operational planning. IEEE Trans. Sustain. Energy 2015, 6, 800–809. [Google Scholar] [CrossRef]
  8. Min, C.G.; Park, J.K.; Hur, D.; Kim, M.K. A risk evaluation method for ramping capability shortage in power systems. Energy 2016, 113, 1316–1324. [Google Scholar] [CrossRef]
  9. Holttinen, H.; Meibom, P.; Orths, A.; Lange, B.; O’Malley, M.; Tande, J.O.; Estanqueiro, A.; Gomez, E.; Söder, L.; Strbac, G.; et al. Impacts of large amounts of wind power on design and operation of power systems, results of IEA collaboration. Wind Energy 2011, 14, 179–192. [Google Scholar] [CrossRef]
  10. Adams, J.; O’Malley, M.; Hanson, K. Flexibility Requirements and Potential Metrics for Variable Generation: Implications for System Planning Studies; North American Electric Reliability Corporation (NERC): Princeton, NJ, USA, 2010. [Google Scholar]
  11. Denholm, P.; Hand, M. Grid flexibility and storage required to achieve very high penetration of variable renewable electricity. Energy Policy 2011, 39, 1817–1830. [Google Scholar] [CrossRef]
  12. Ulam-Orgil, C.; Lee, H.W.; Kang, Y.C. Evaluation of the wind power penetration limit and wind energy penetration in the mongolian central power system. J. Electr. Eng. Technol. 2012, 7, 852–858. [Google Scholar] [CrossRef]
  13. Huber, M.; Dimkova, D.; Hamacher, T. Integration of wind and solar power in Europe: Assessment of flexibility requirements. Energy 2014, 69, 236–246. [Google Scholar] [CrossRef]
  14. Xu, Q.; Kang, C.; Zhang, N.; Ding, Y.; Xia, Q.; Sun, R.; Xu, J. A probabilistic method for determining grid-accommodable wind power capacity based on multiscenario system operation simulation. IEEE Trans. Smart Grid 2016, 7, 400–409. [Google Scholar] [CrossRef]
  15. He, Y.; Xia, T.; Liu, Z.; Zhang, T.; Dong, Z. Evaluation of the capability of accepting large-scale wind power in China. Renew. Sustain. Energy Rev. 2013, 19, 509–516. [Google Scholar] [CrossRef]
  16. Ela, E.; Kirby, B. ERCOT Event on February 26, 2008: Lessons learned; National Renewable Energy Laboratory (NREL): Golden, CO, USA, 2008.
  17. Lannoye, E.; Flynn, D.; O’Malley, M. Transmission, variable generation, and power system flexibility. IEEE Trans. Power Syst. 2015, 30, 57–66. [Google Scholar] [CrossRef]
  18. Ma, J.; Silva, V.; Belhomme, R.; Kirschen, D.S.; Ochoa, L.F. Evaluating and planning flexibility in sustainable power systems. In Proceedings of the 2013 IEEE Power and Energy Society General Meeting, Vancouver, BC, Canada, 21–25 July 2013. [Google Scholar]
  19. Zhao, J.; Zheng, T.; Litvinov, E. A unified framework for defining and measuring flexibility in power system. IEEE Trans. Power Syst. 2016, 31, 339–347. [Google Scholar] [CrossRef]
  20. Wang, J.; Botterud, A.; Bessa, R.; Keko, H.; Carvalho, L.; Issicaba, D.; Sumaili, J.; Miranda, V. Wind power forecasting uncertainty and unit commitment. Appl. Energy 2011, 88, 4014–4023. [Google Scholar] [CrossRef]
  21. Wang, Q.; Guan, Y.; Wang, J. A chance-constrained two-stage stochastic program for unit commitment with uncertain wind power output. IEEE Trans. Power Syst. 2012, 27, 206–215. [Google Scholar] [CrossRef]
  22. Korea Power Exchange. Electric Power Statistics Information System. Available online: http://epsis.kpx.or.kr/epsis/ekesStaticMain.do?cmd=001001&flag=&locale=EN (accessed on 23 February 2017).
  23. Chung, M.; Lee, S.G.; Park, C.; Park, H.-C.; Im, Y.-H. Development of a combined energy-demands calculator for urban building communities in Korea. Environ. Plan. B 2013, 40, 289–310. [Google Scholar] [CrossRef]
  24. Marcos, J.; Marroyo, L.; Lorenzo, E.; García, M. Smoothing of PV power fluctuations by geographical dispersion. Prog. Photovolt. Res. Appl. 2012, 20, 226–237. [Google Scholar] [CrossRef]
  25. Billinton, R.; Allan, R. Reliability Evaluation of Power Systems, 2nd ed.; Springer Science & Business Media: New York, NY, USA, 2013. [Google Scholar]
  26. Master’s Space (MS). M-Core User’s Manual; MS: Anyang, Korea, 2016. [Google Scholar]
  27. Korea Power Exchange. Electricity Market Operation Rules; KPX: Naju, Korea, 2016. [Google Scholar]
Figure 1. Flexibility-based evaluation process of variable generation (VG) acceptability.
Energies 10 00825 g001
Figure 2. Load profiles of peak day in 2016.
Energies 10 00825 g002
Figure 3. VG/Non-VG output profiles of peak day in 2016.
Energies 10 00825 g003
Figure 4. Net load profiles of peak day.
Energies 10 00825 g004
Figure 5. Generation schedule on the peak day in 2029.
Energies 10 00825 g005
Figure 6. RSE versus VG penetration level.
Energies 10 00825 g006
Figure 7. Sum of RC requirement (RCR) versus VG penetration level.
Energies 10 00825 g007
Figure 8. Results of sensitivity analysis: (a) RSE and failure rates of generators; (b) RSE and standard deviation of net load forecast error (NLFE).
Energies 10 00825 g008

