Figure 1.
Layout and thermal cycle of the combined MGT-ORC power plant with the solar array integration.
Figure 1.
Layout and thermal cycle of the combined MGT-ORC power plant with the solar array integration.
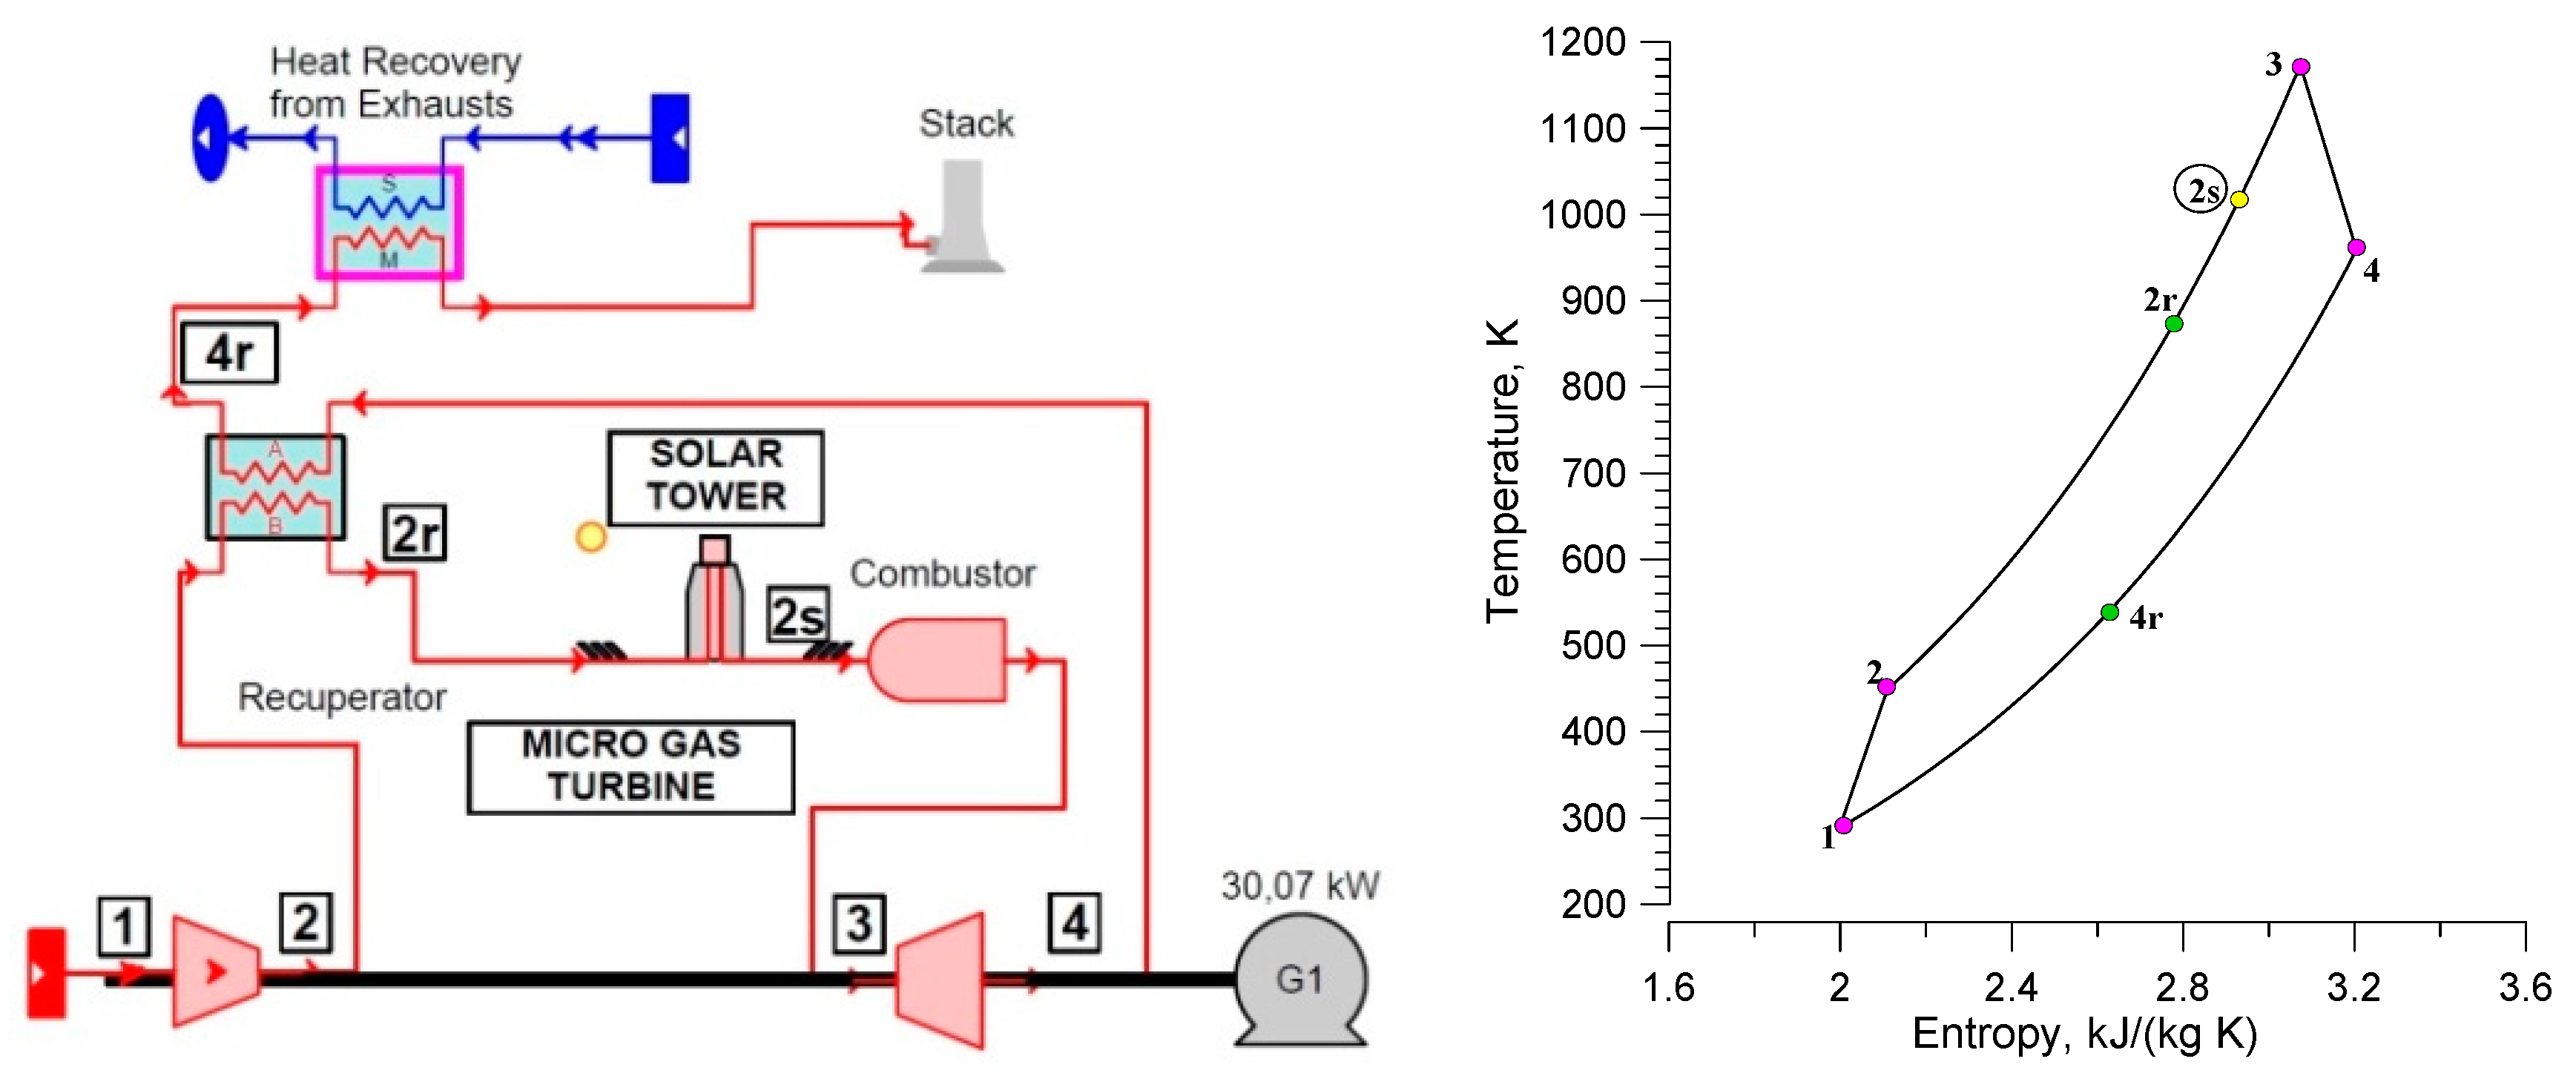
Figure 2.
Layout and thermal cycle of MGT power plant with the solar tower integration.
Figure 2.
Layout and thermal cycle of MGT power plant with the solar tower integration.
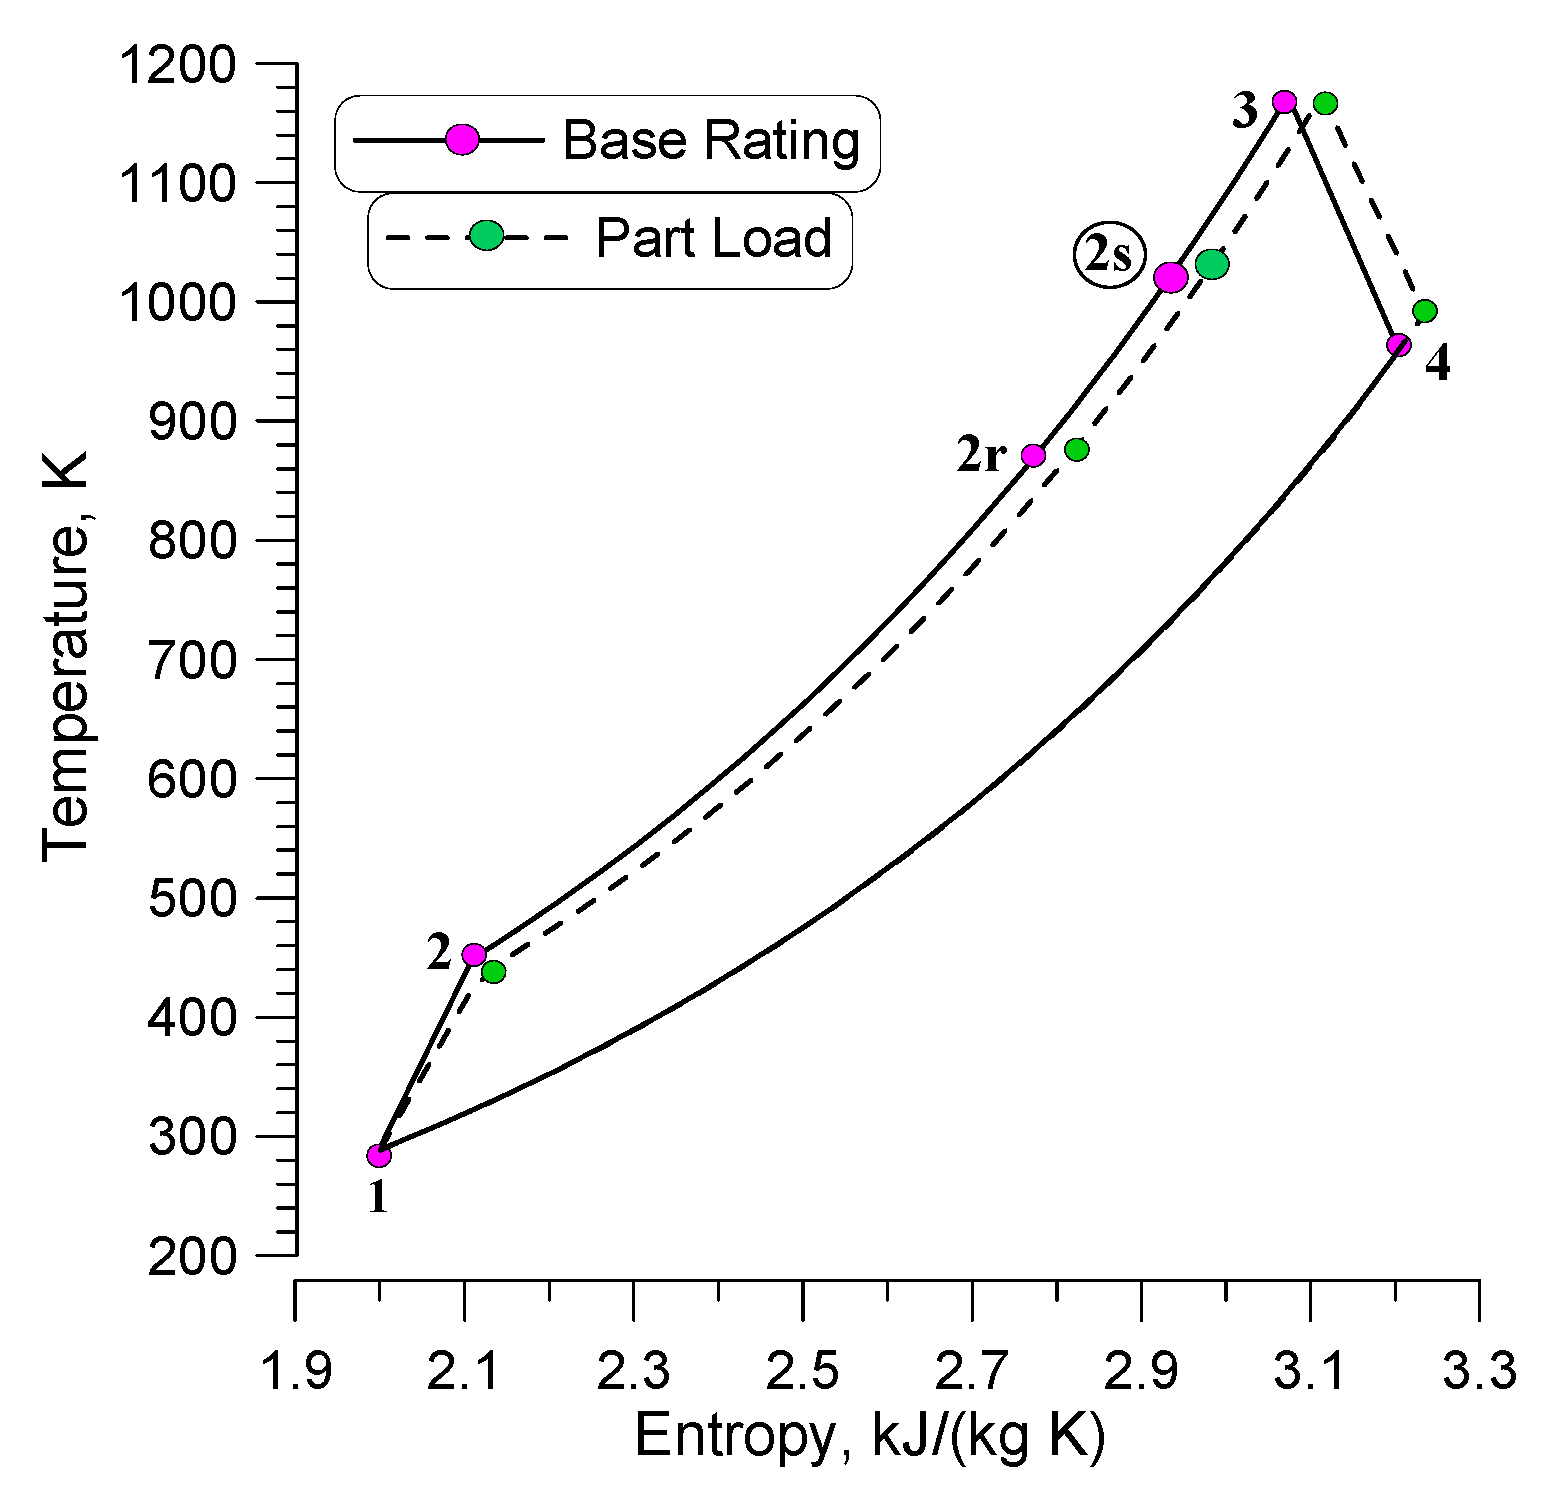
Figure 3.
Comparison between different solar-assisted Brayton cycles (layout in
Figure 2) at base rating and part load.
Figure 3.
Comparison between different solar-assisted Brayton cycles (layout in
Figure 2) at base rating and part load.
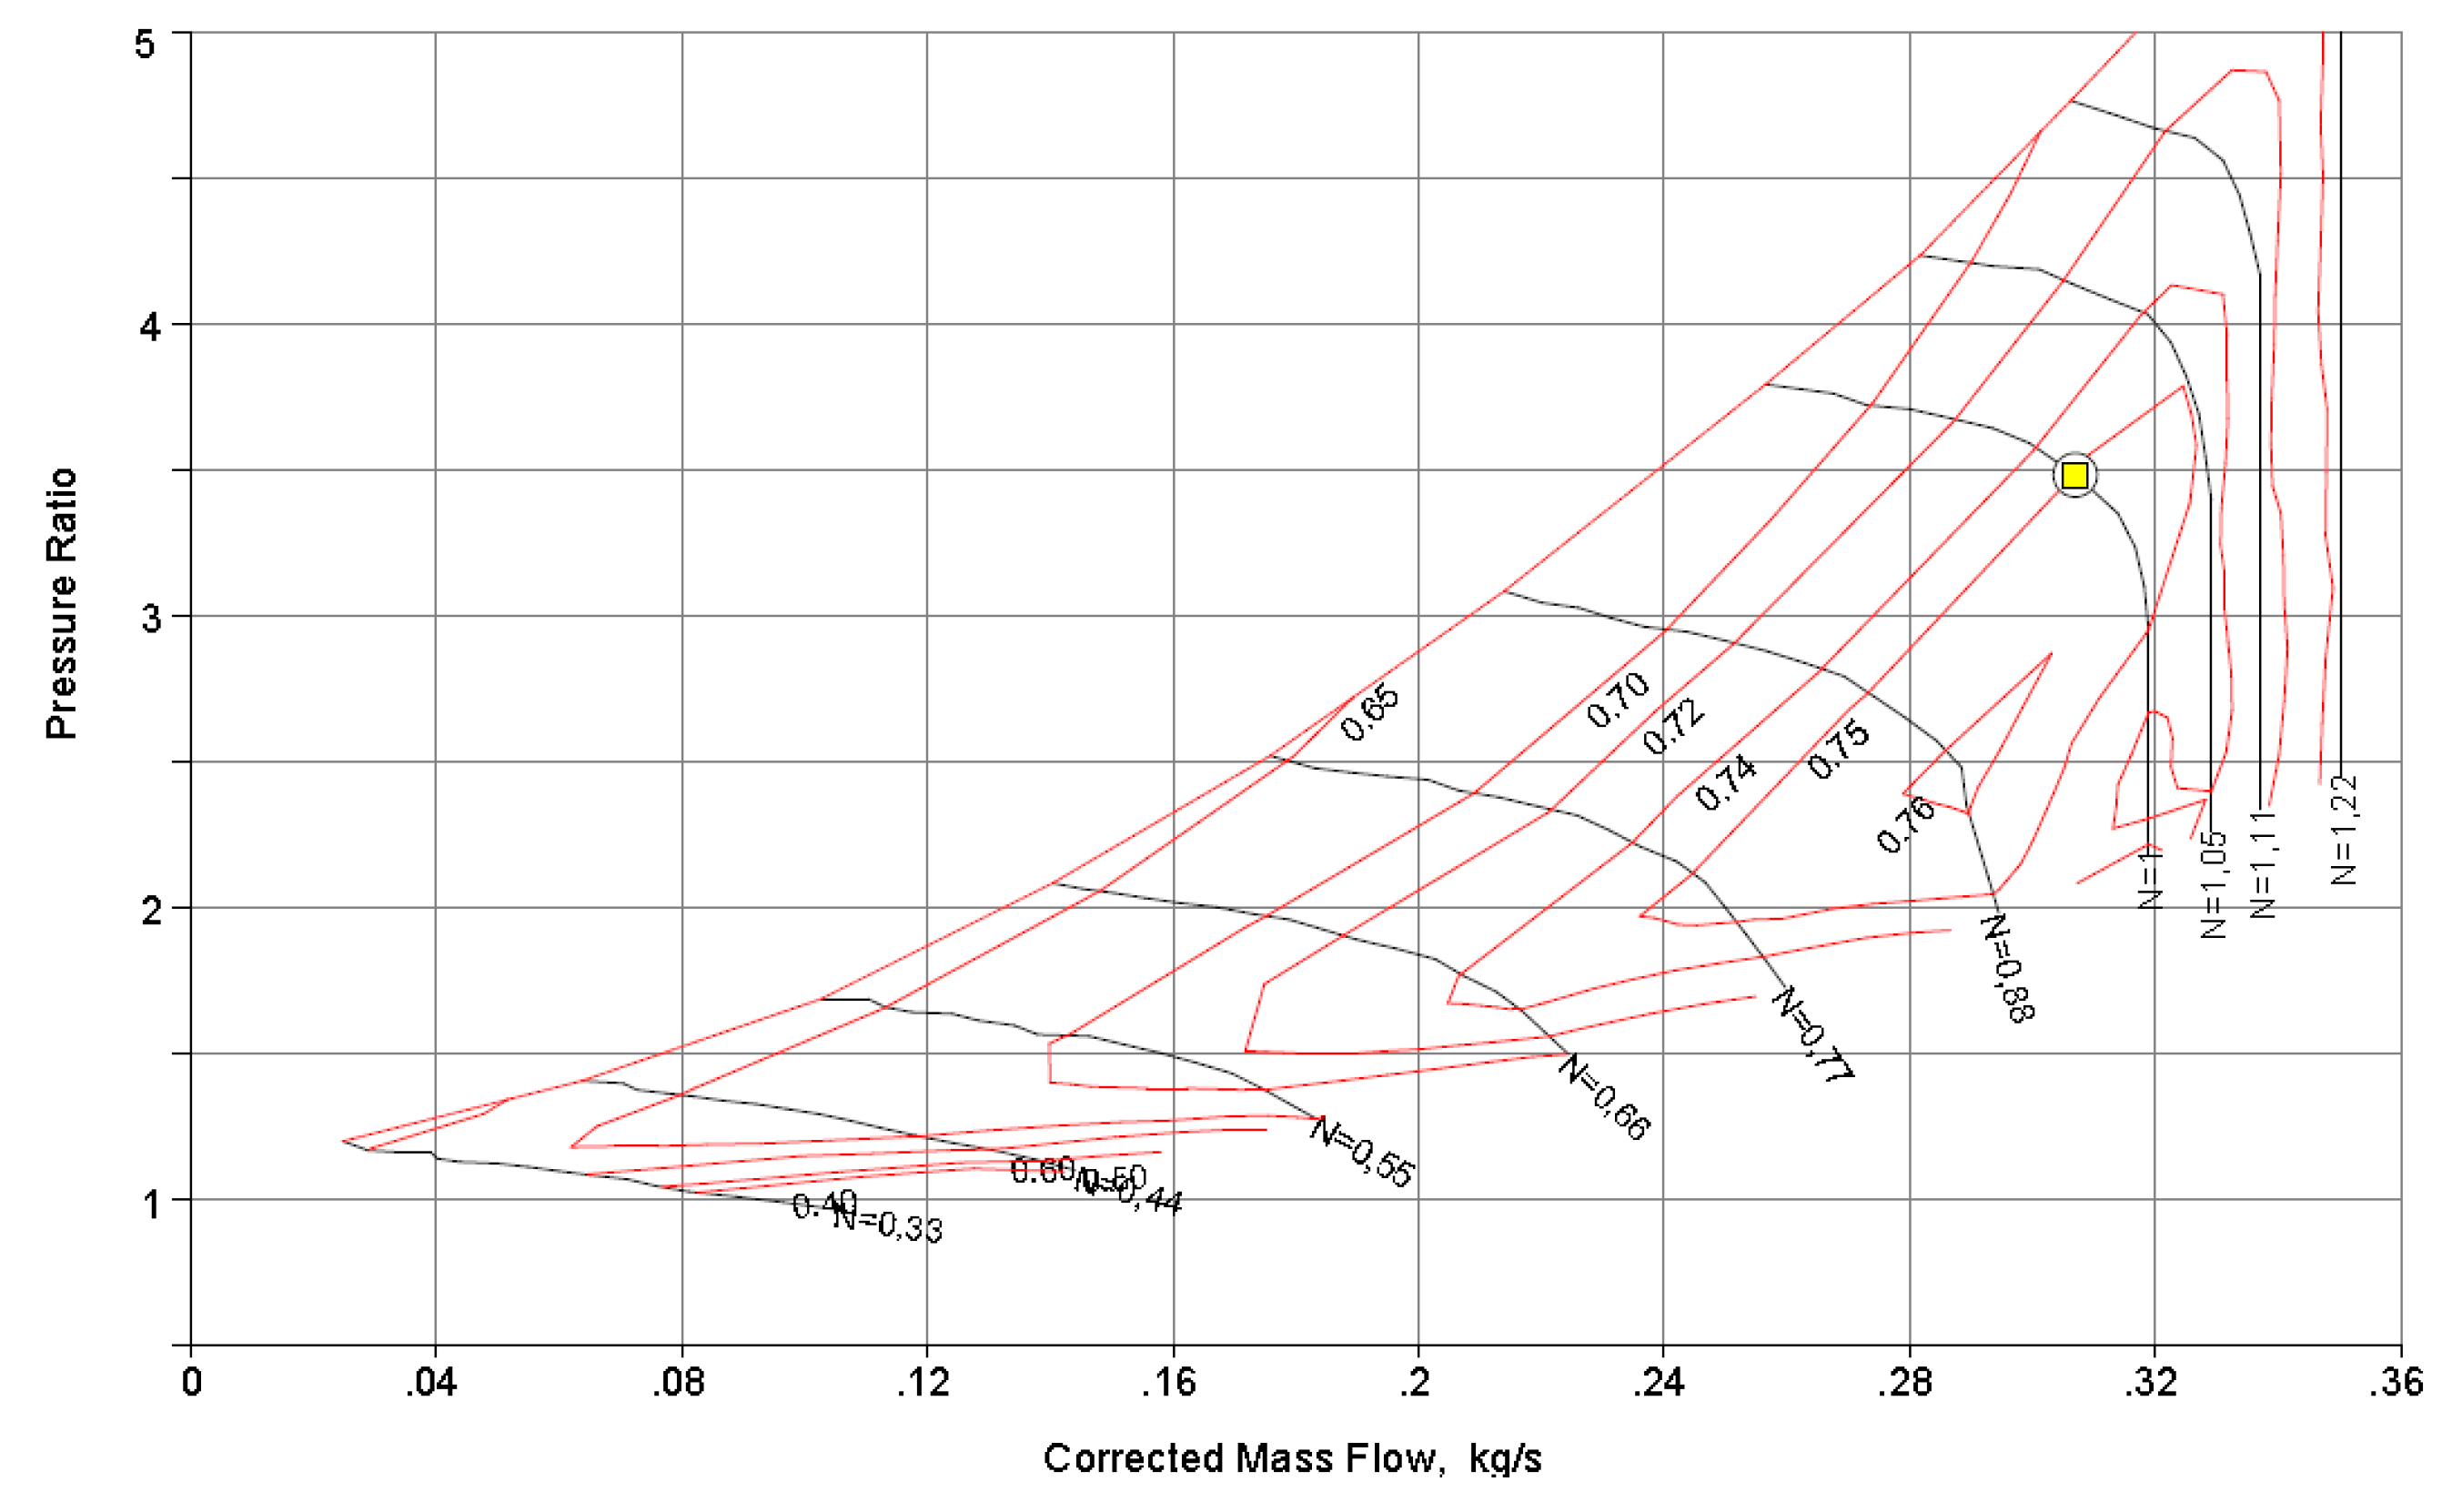
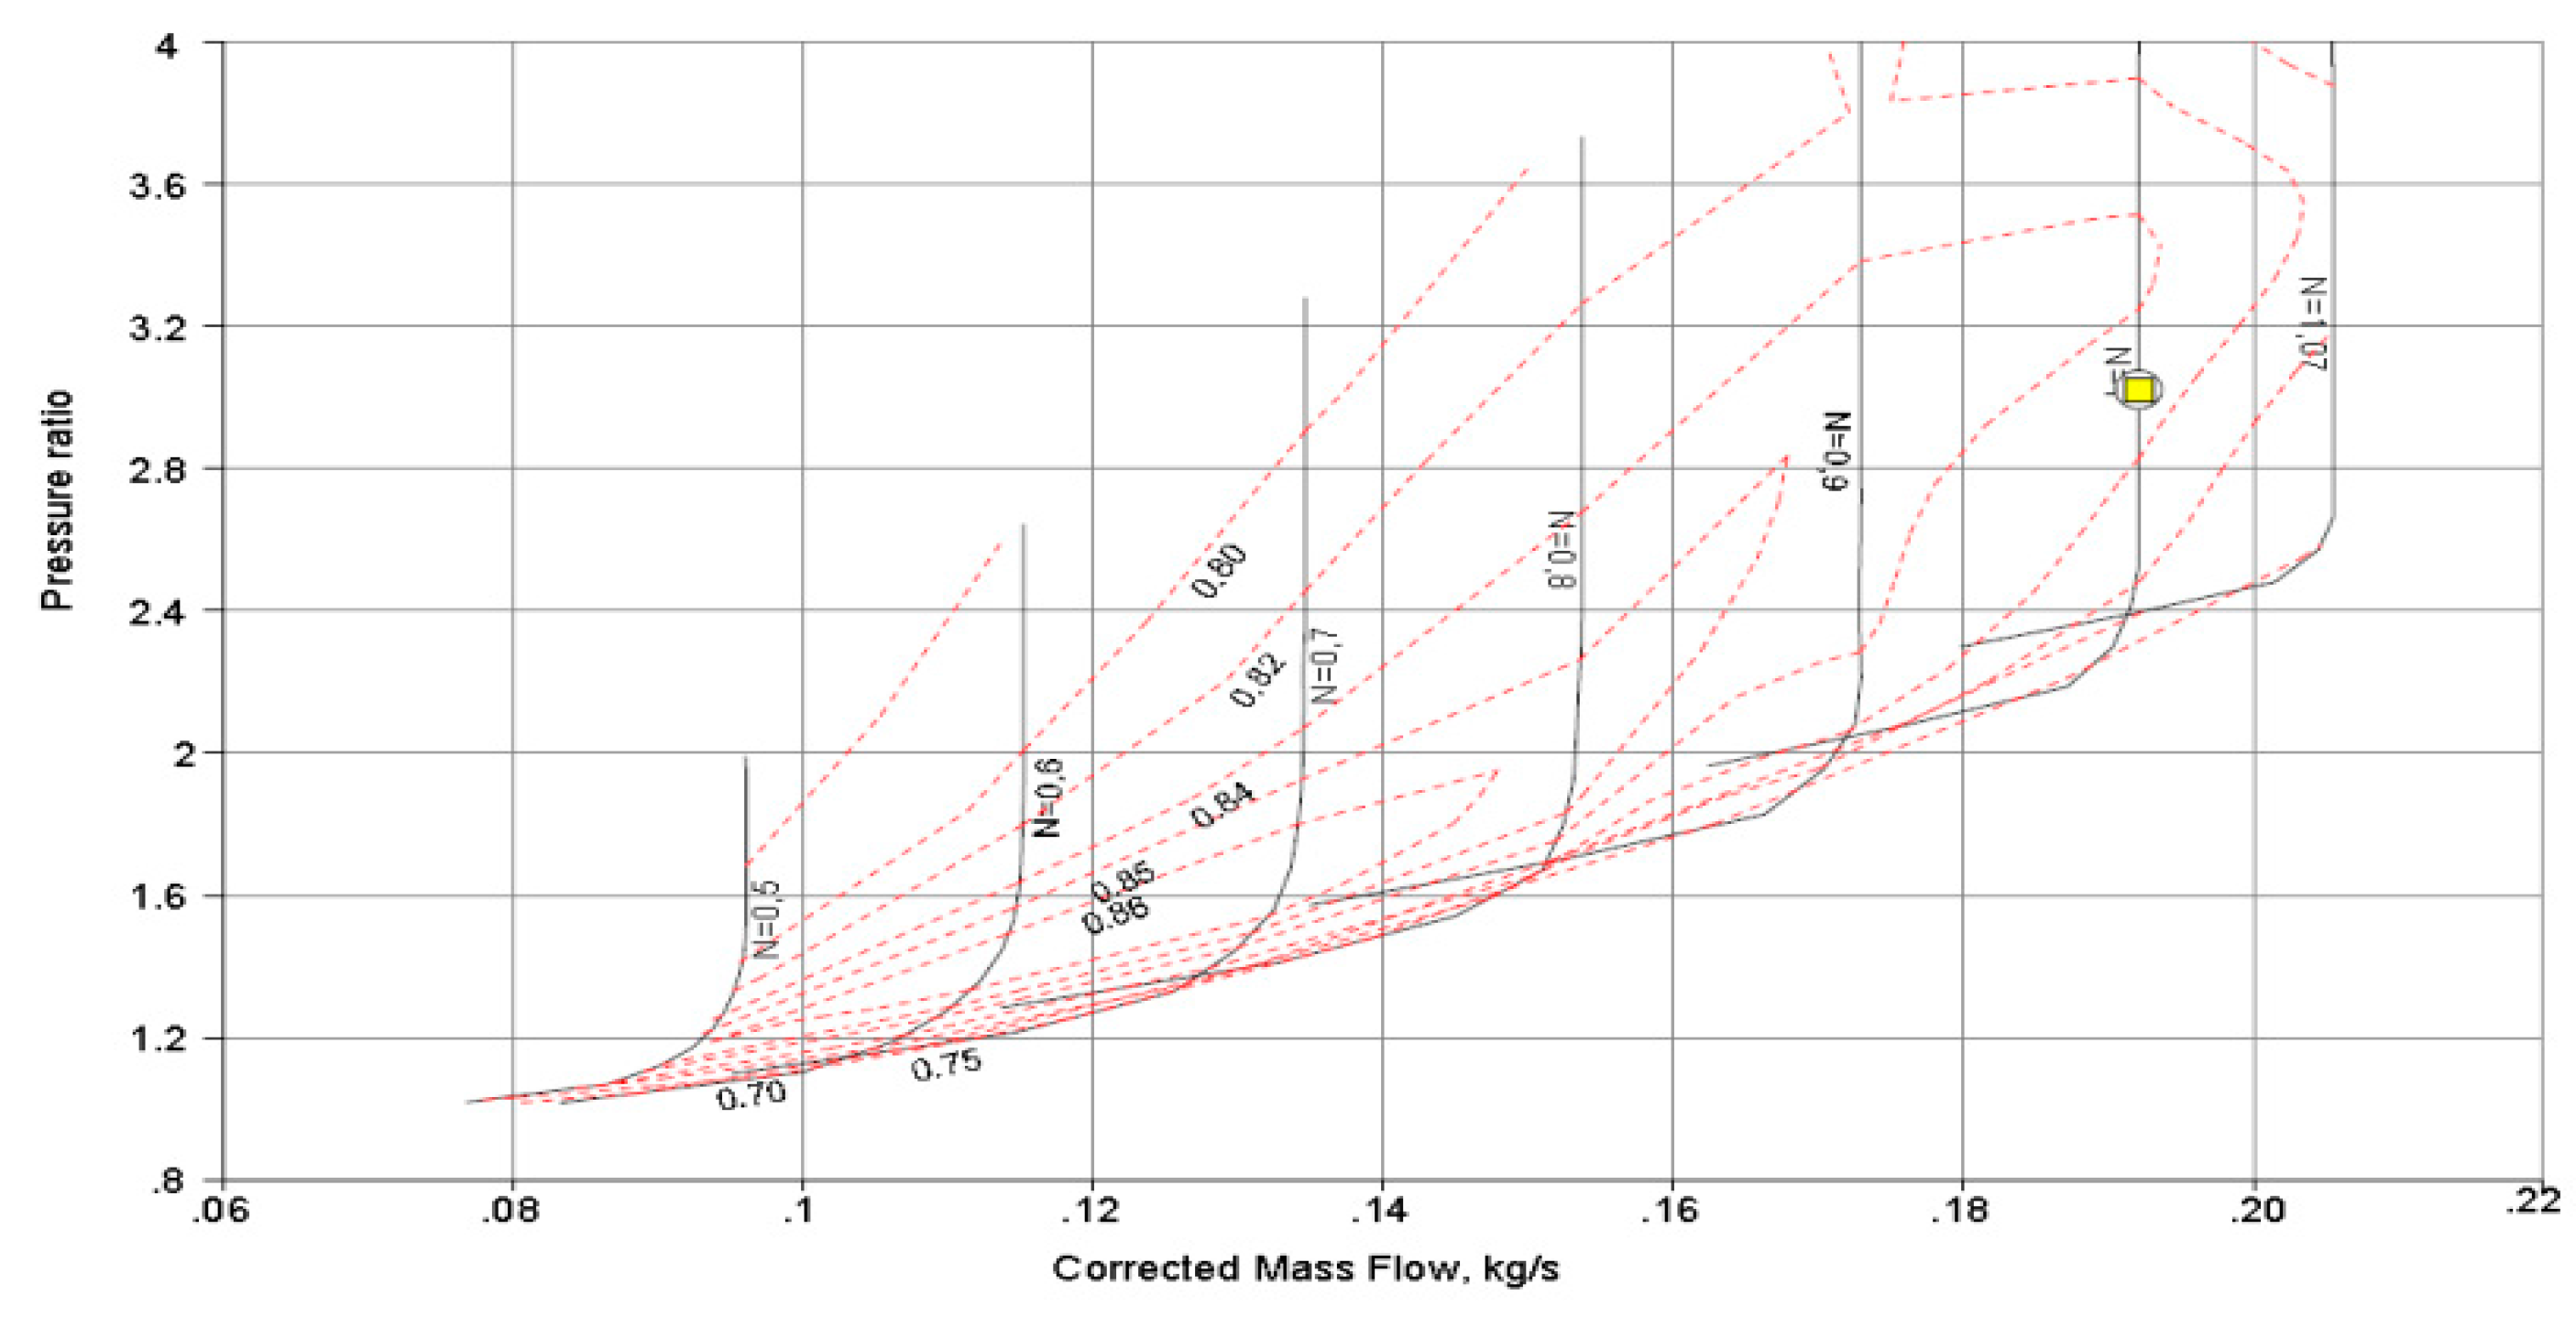
Figure 4.
Estimated C30 compressor maps.
Figure 4.
Estimated C30 compressor maps.
Figure 5.
Estimated C30 turbine map.
Figure 5.
Estimated C30 turbine map.
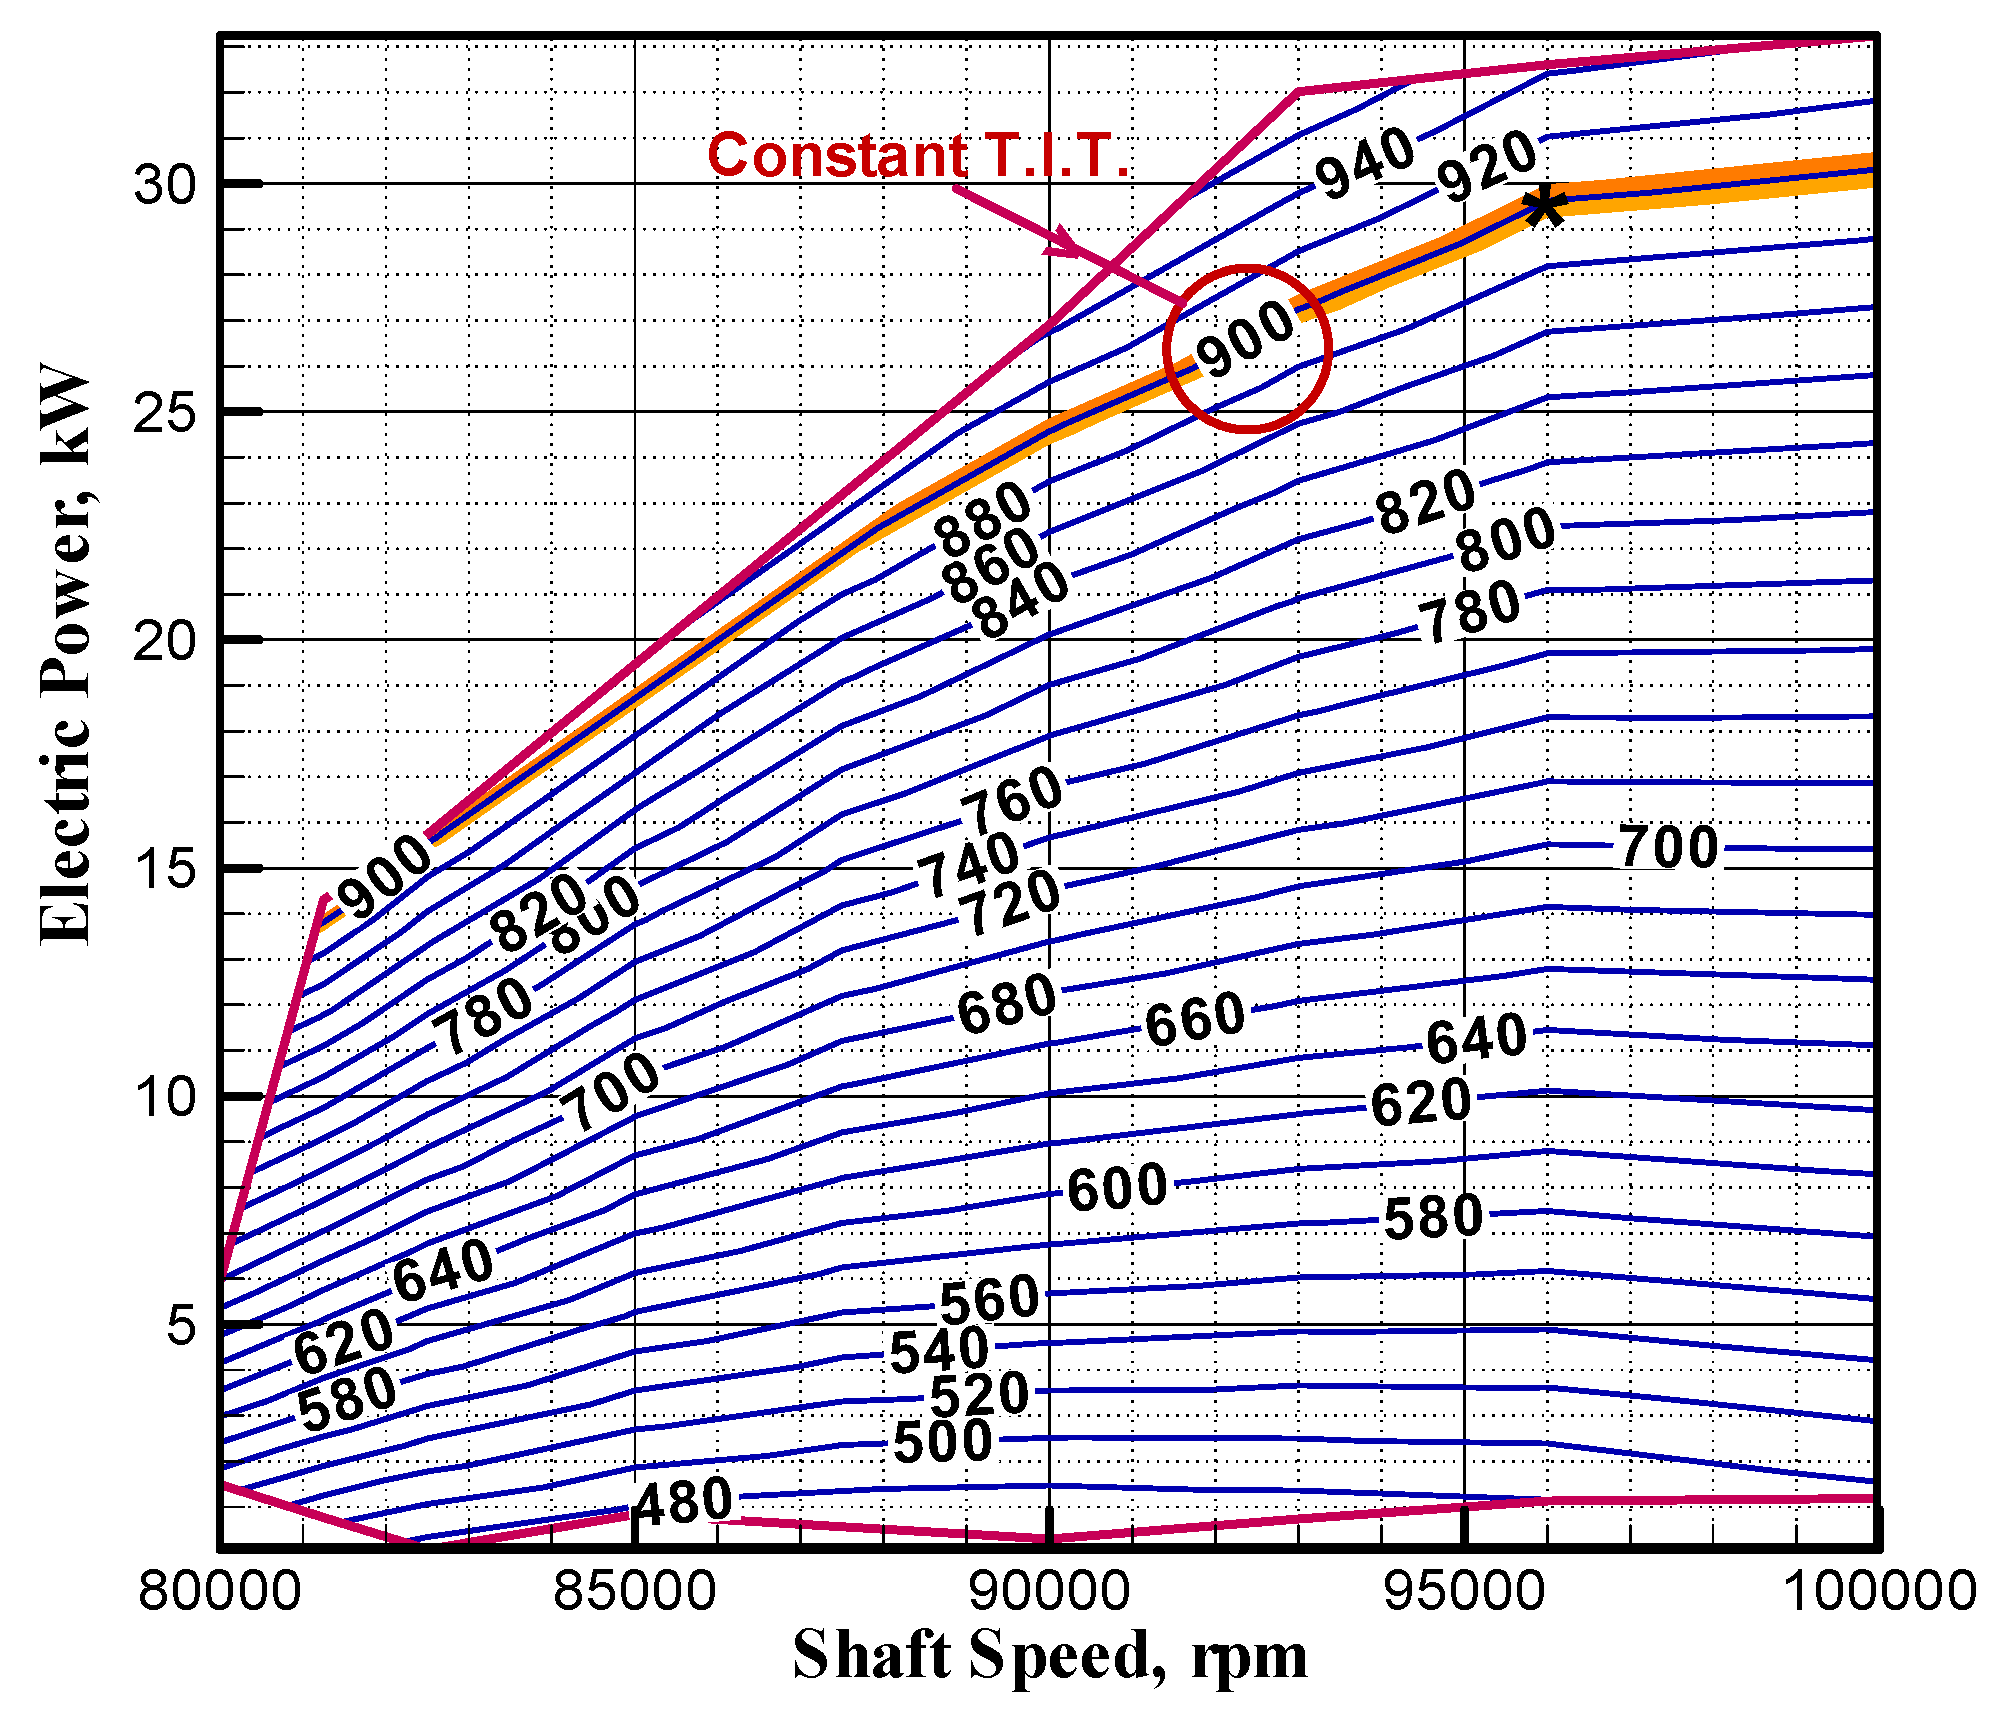
Figure 6.
Isolines of turbine inlet temperature (°C).
Figure 6.
Isolines of turbine inlet temperature (°C).
Figure 7.
Efficiency contours (%) in the MGT operating domain.
Figure 7.
Efficiency contours (%) in the MGT operating domain.
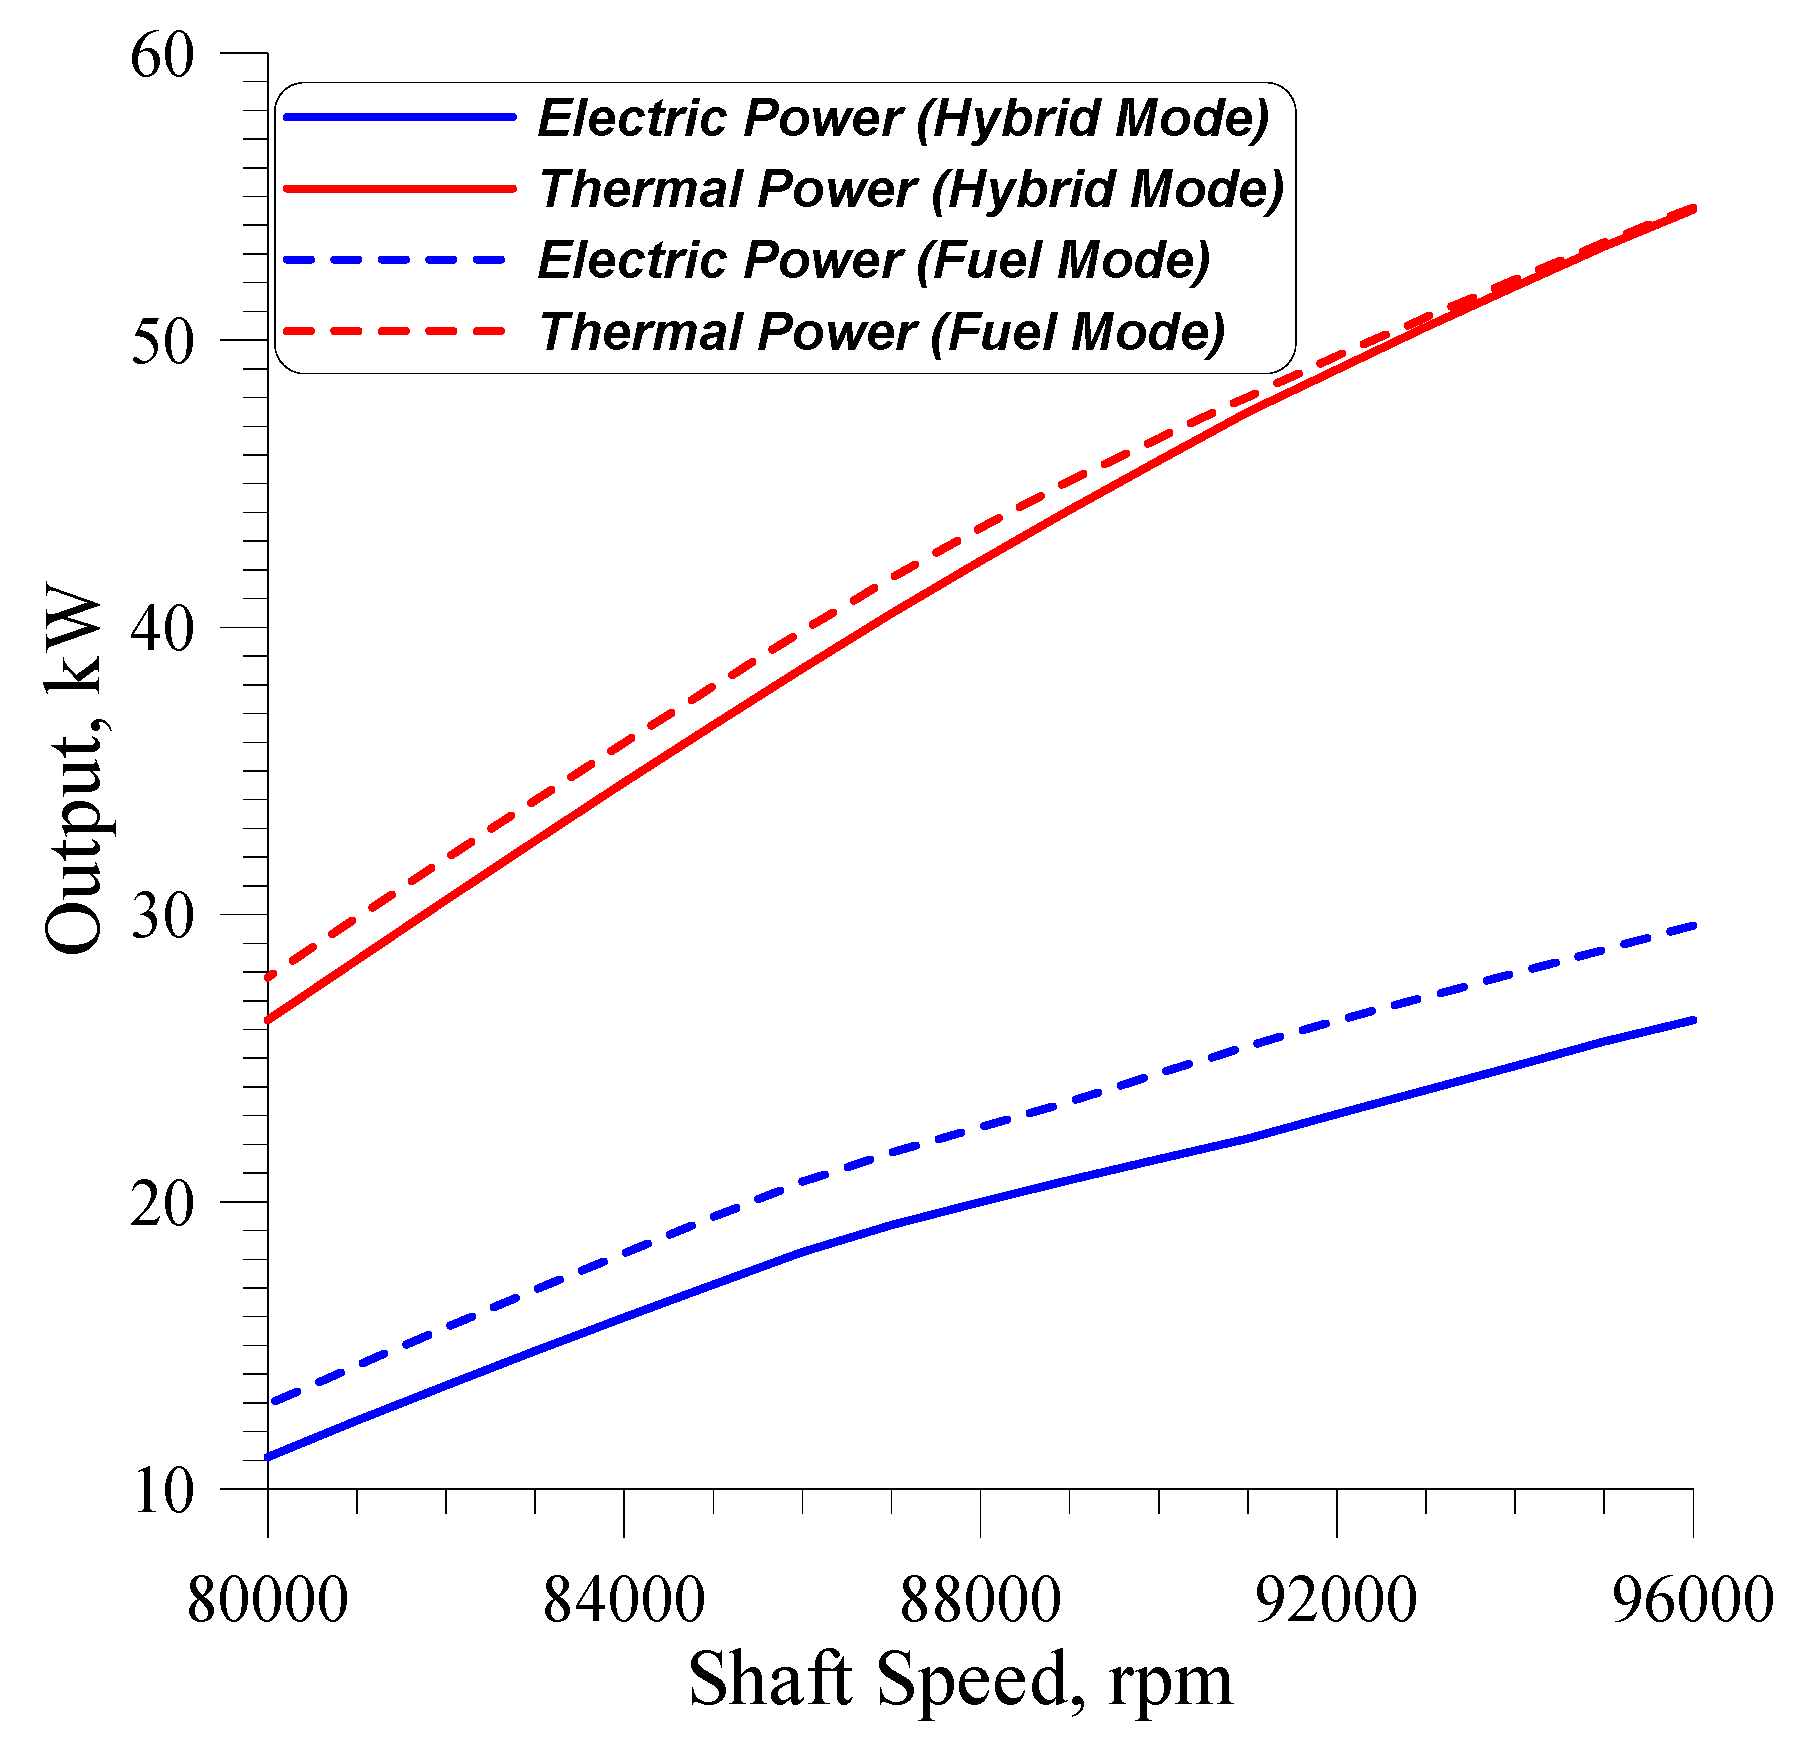
Figure 8.
Electric and thermal power with hybrid and fuel modes.
Figure 8.
Electric and thermal power with hybrid and fuel modes.
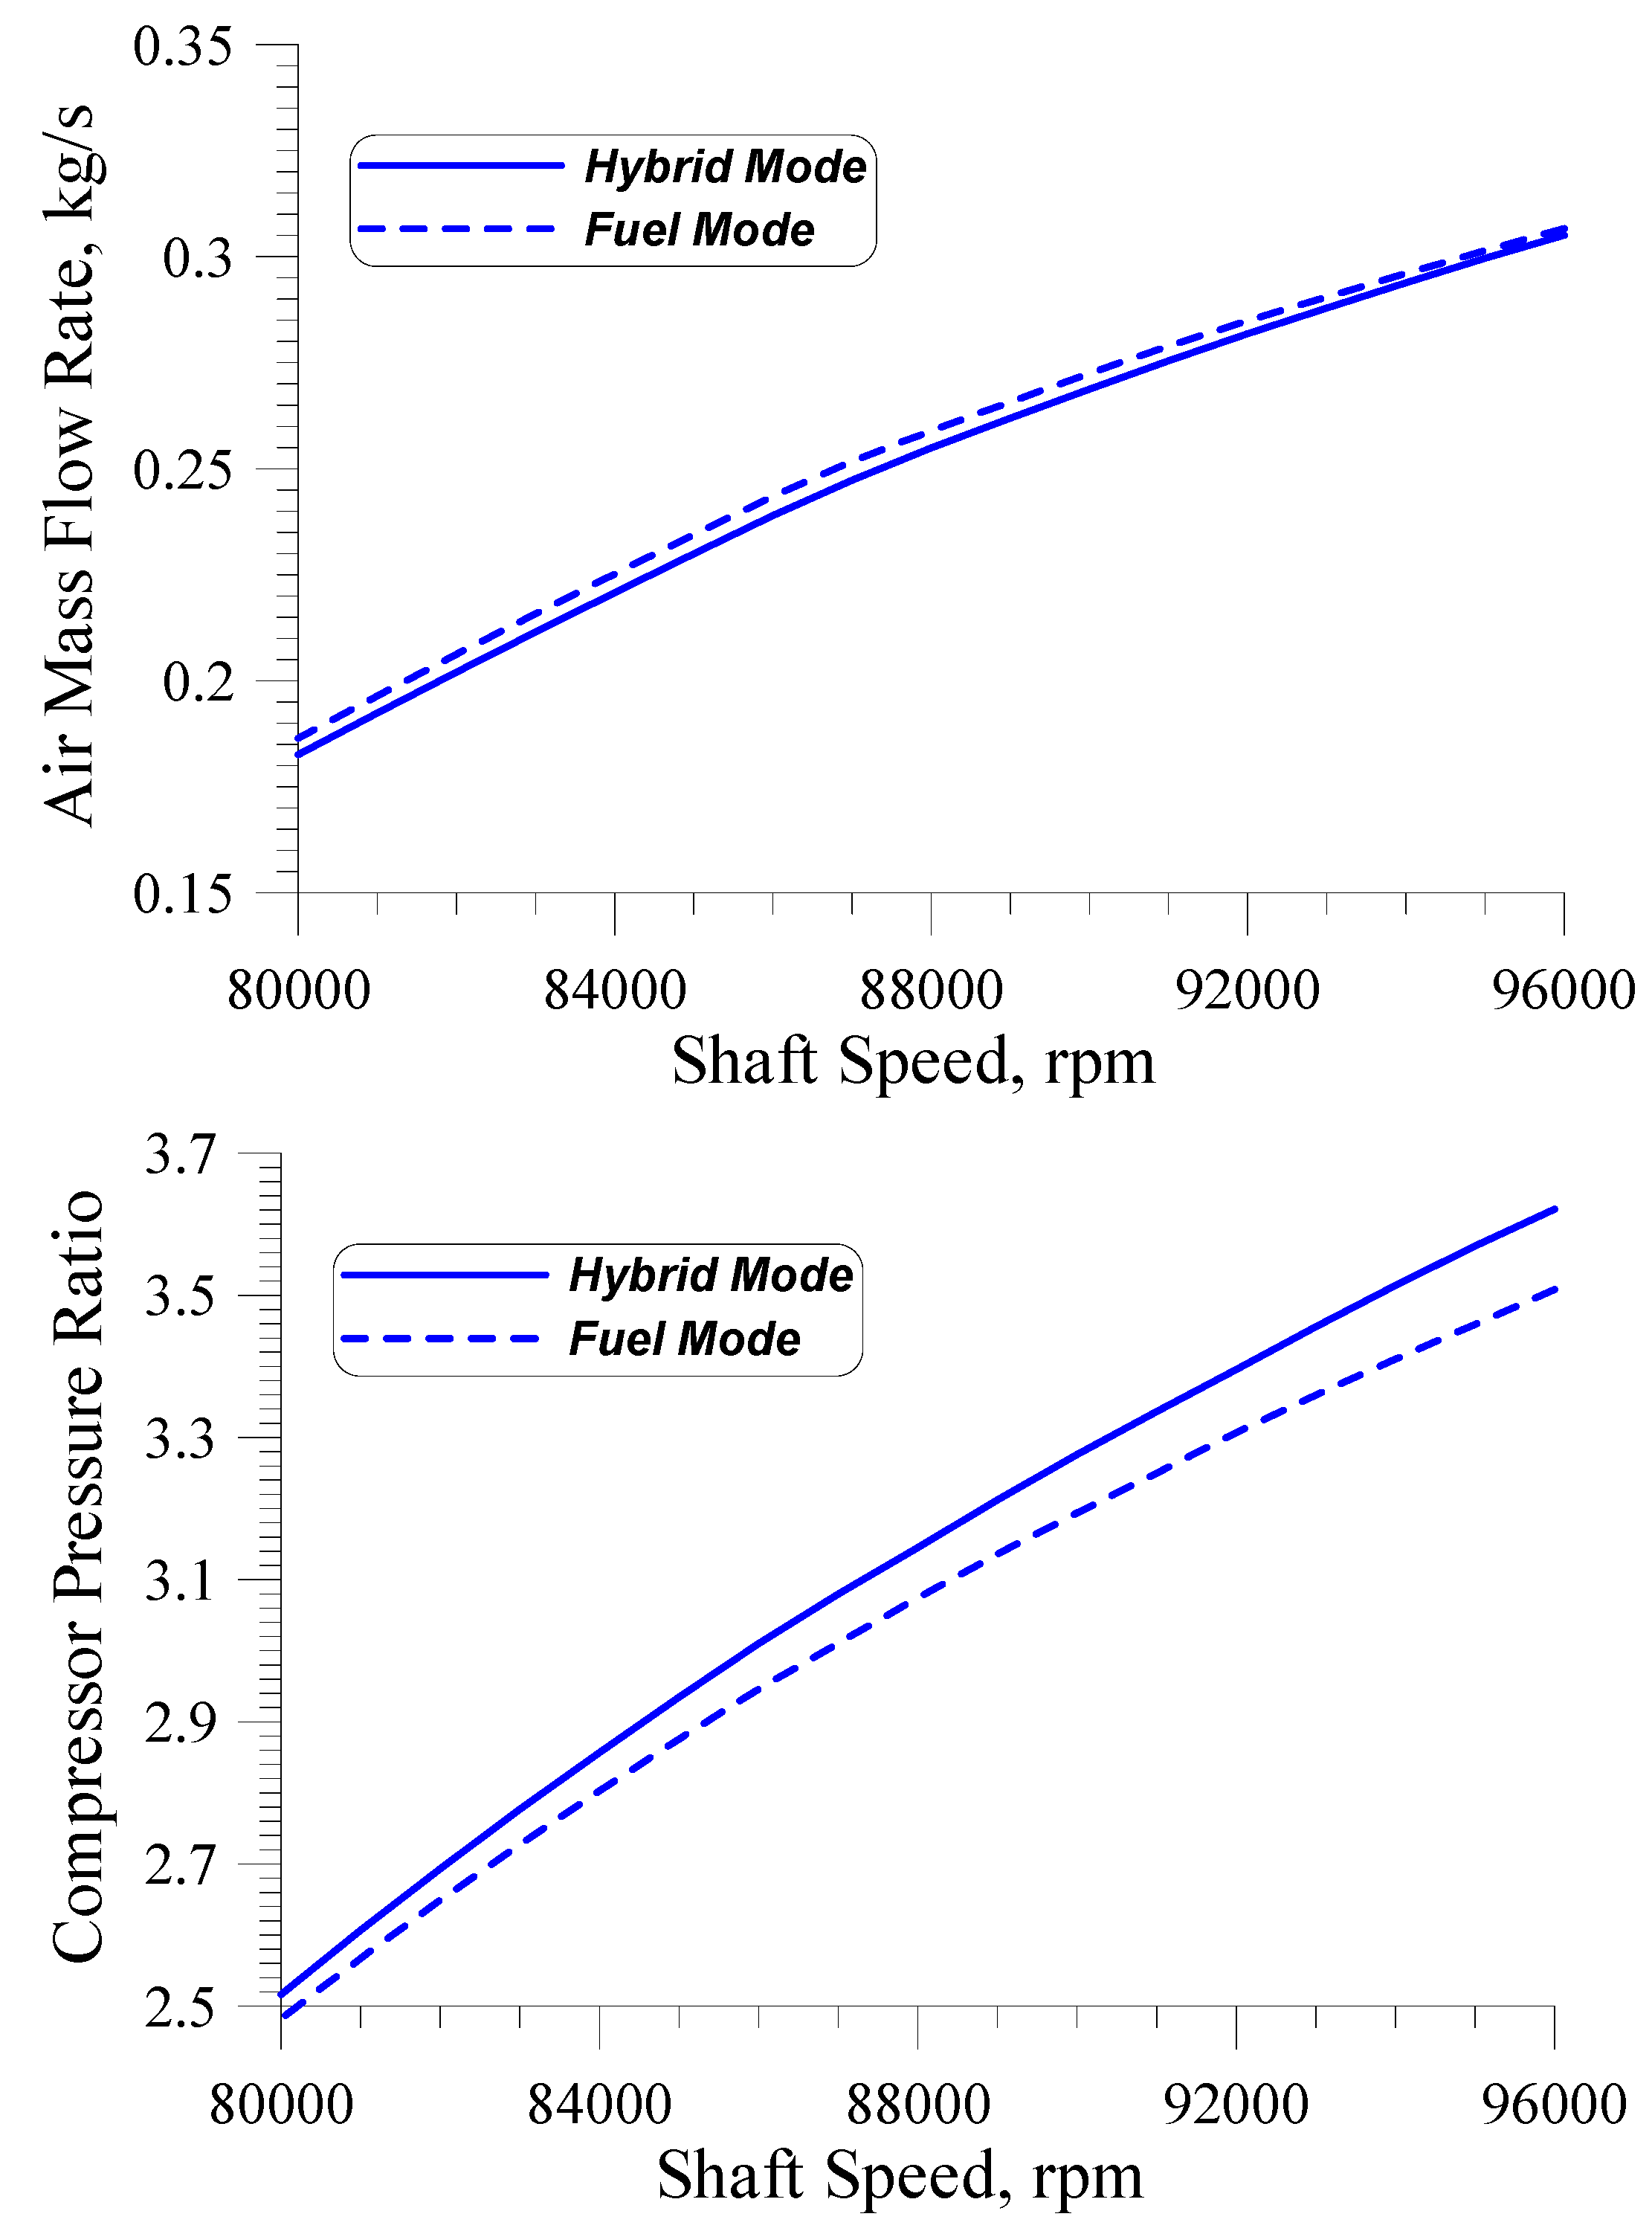
Figure 9.
Compressor operation parameters under hybrid and fuel mode conditions.
Figure 9.
Compressor operation parameters under hybrid and fuel mode conditions.
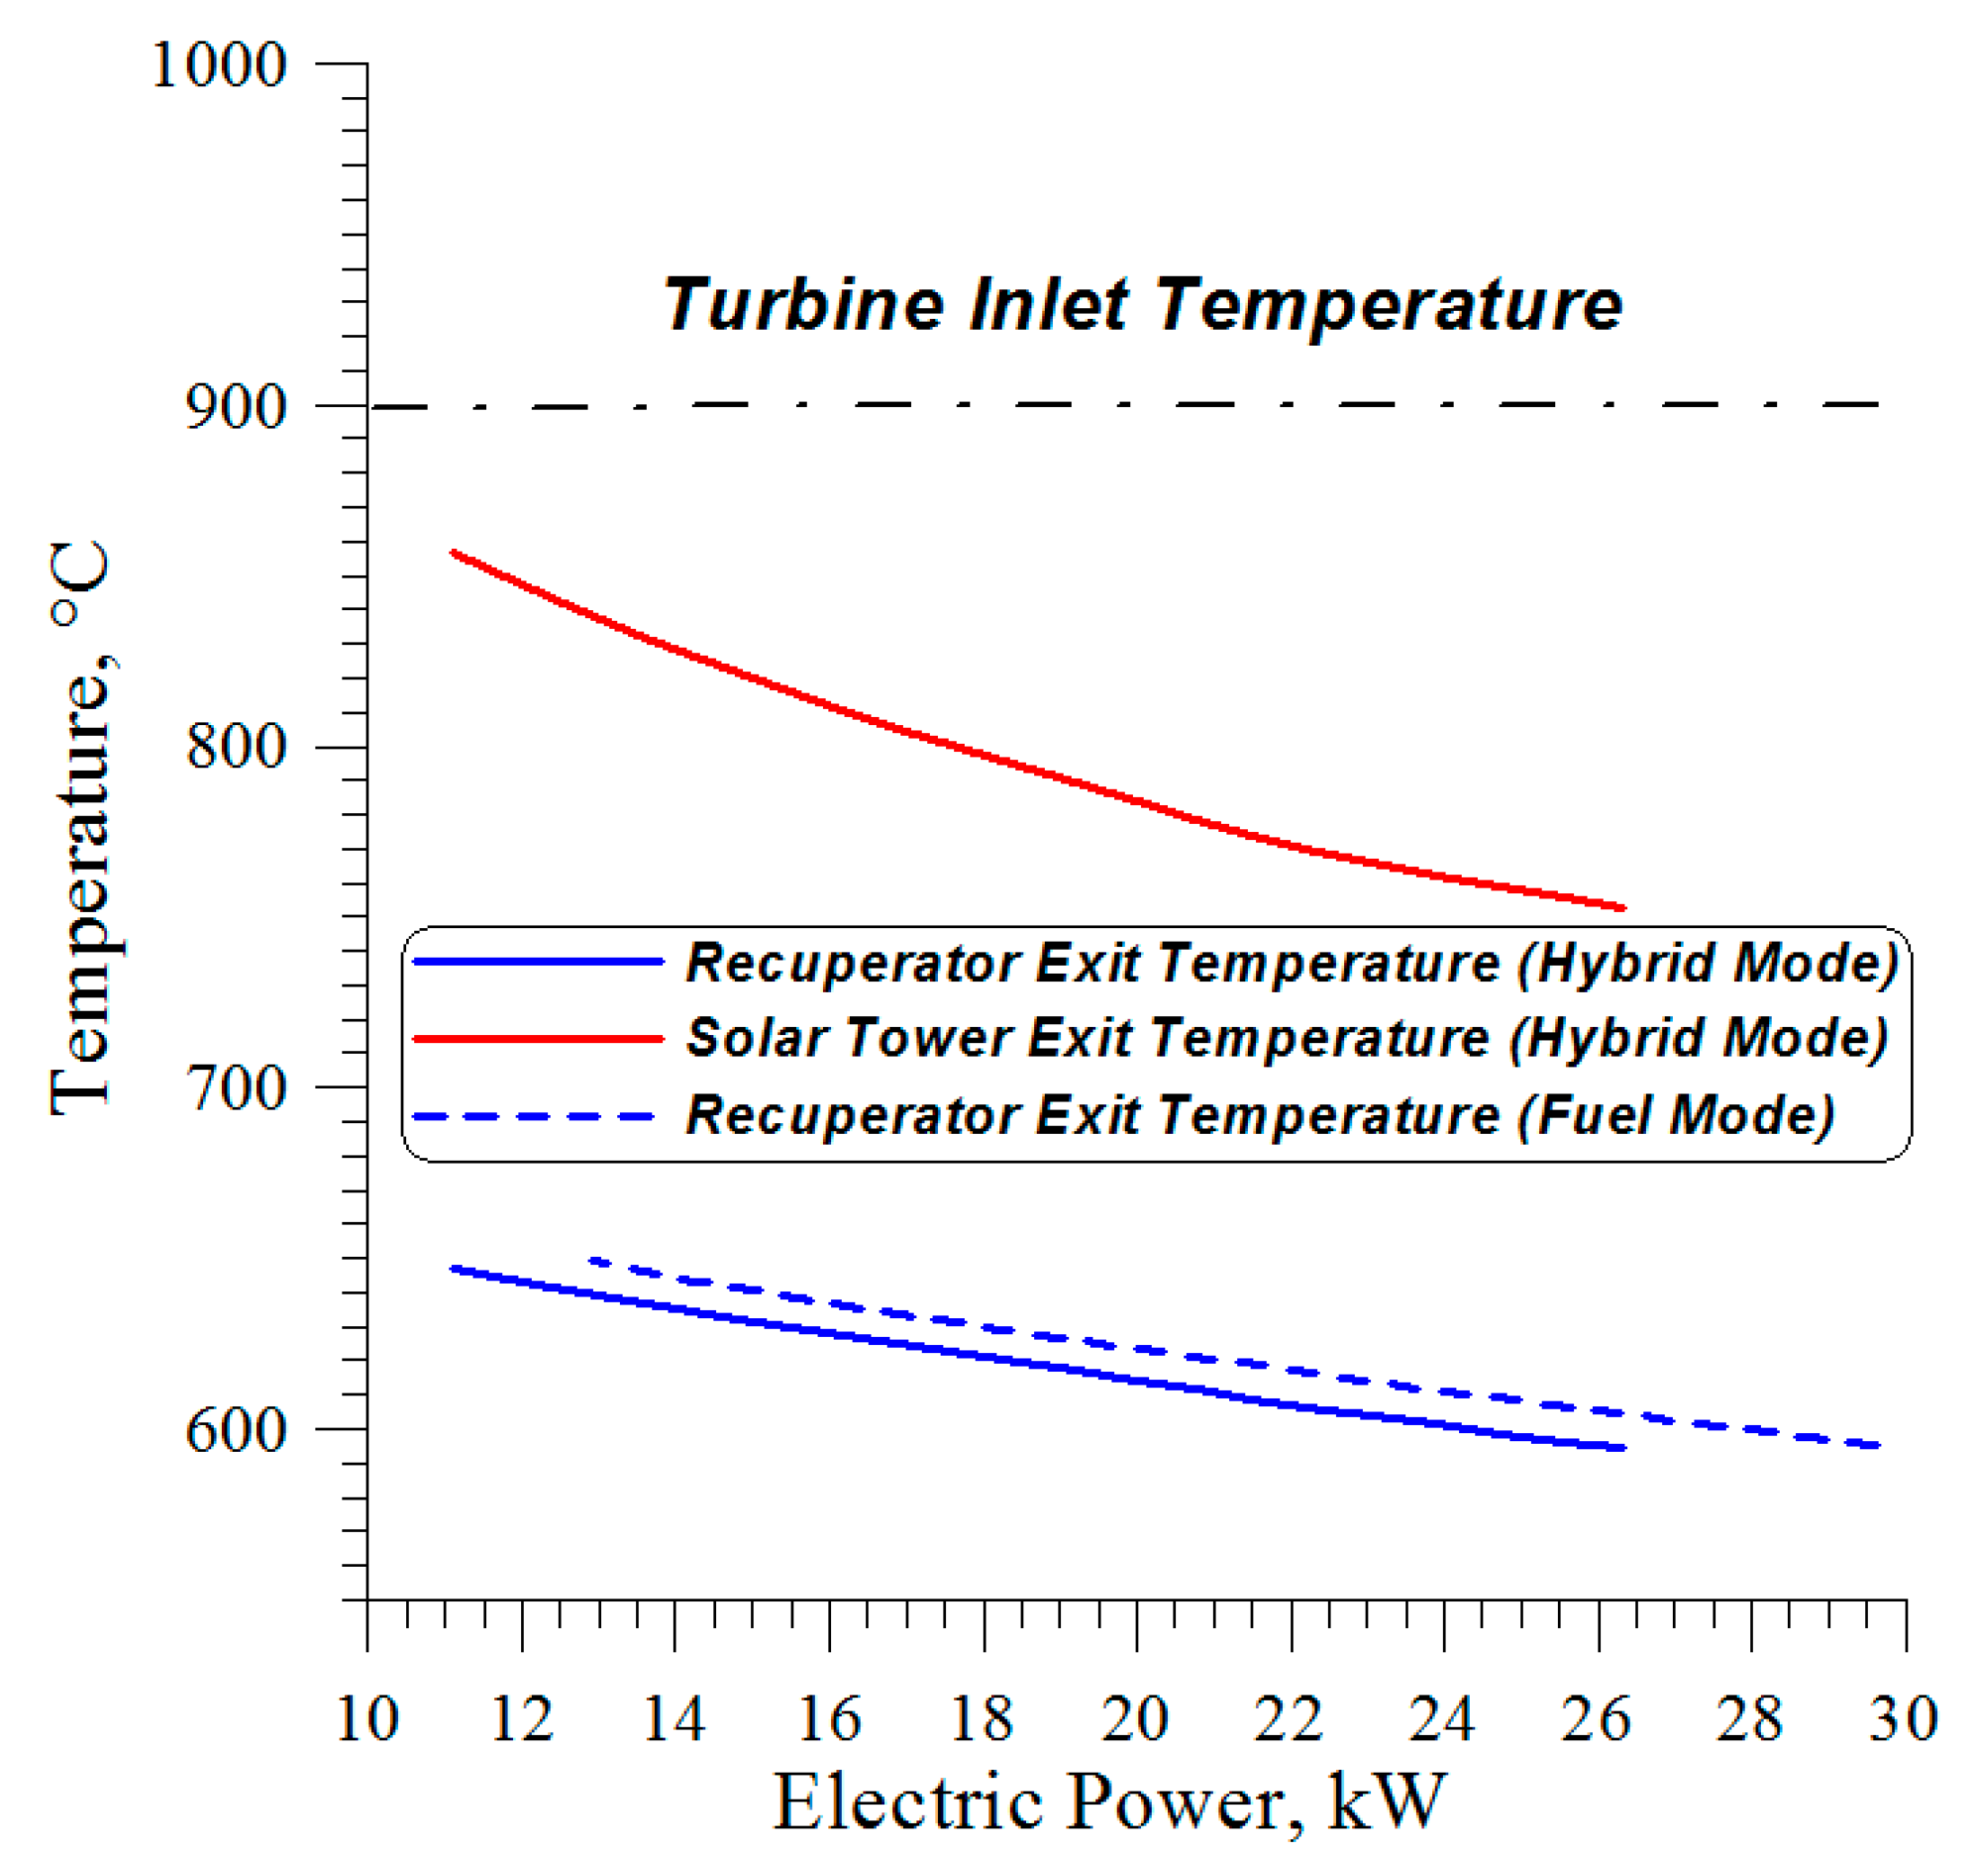
Figure 10.
Operating air temperatures at the MGT recuperator and solar tower exit.
Figure 10.
Operating air temperatures at the MGT recuperator and solar tower exit.
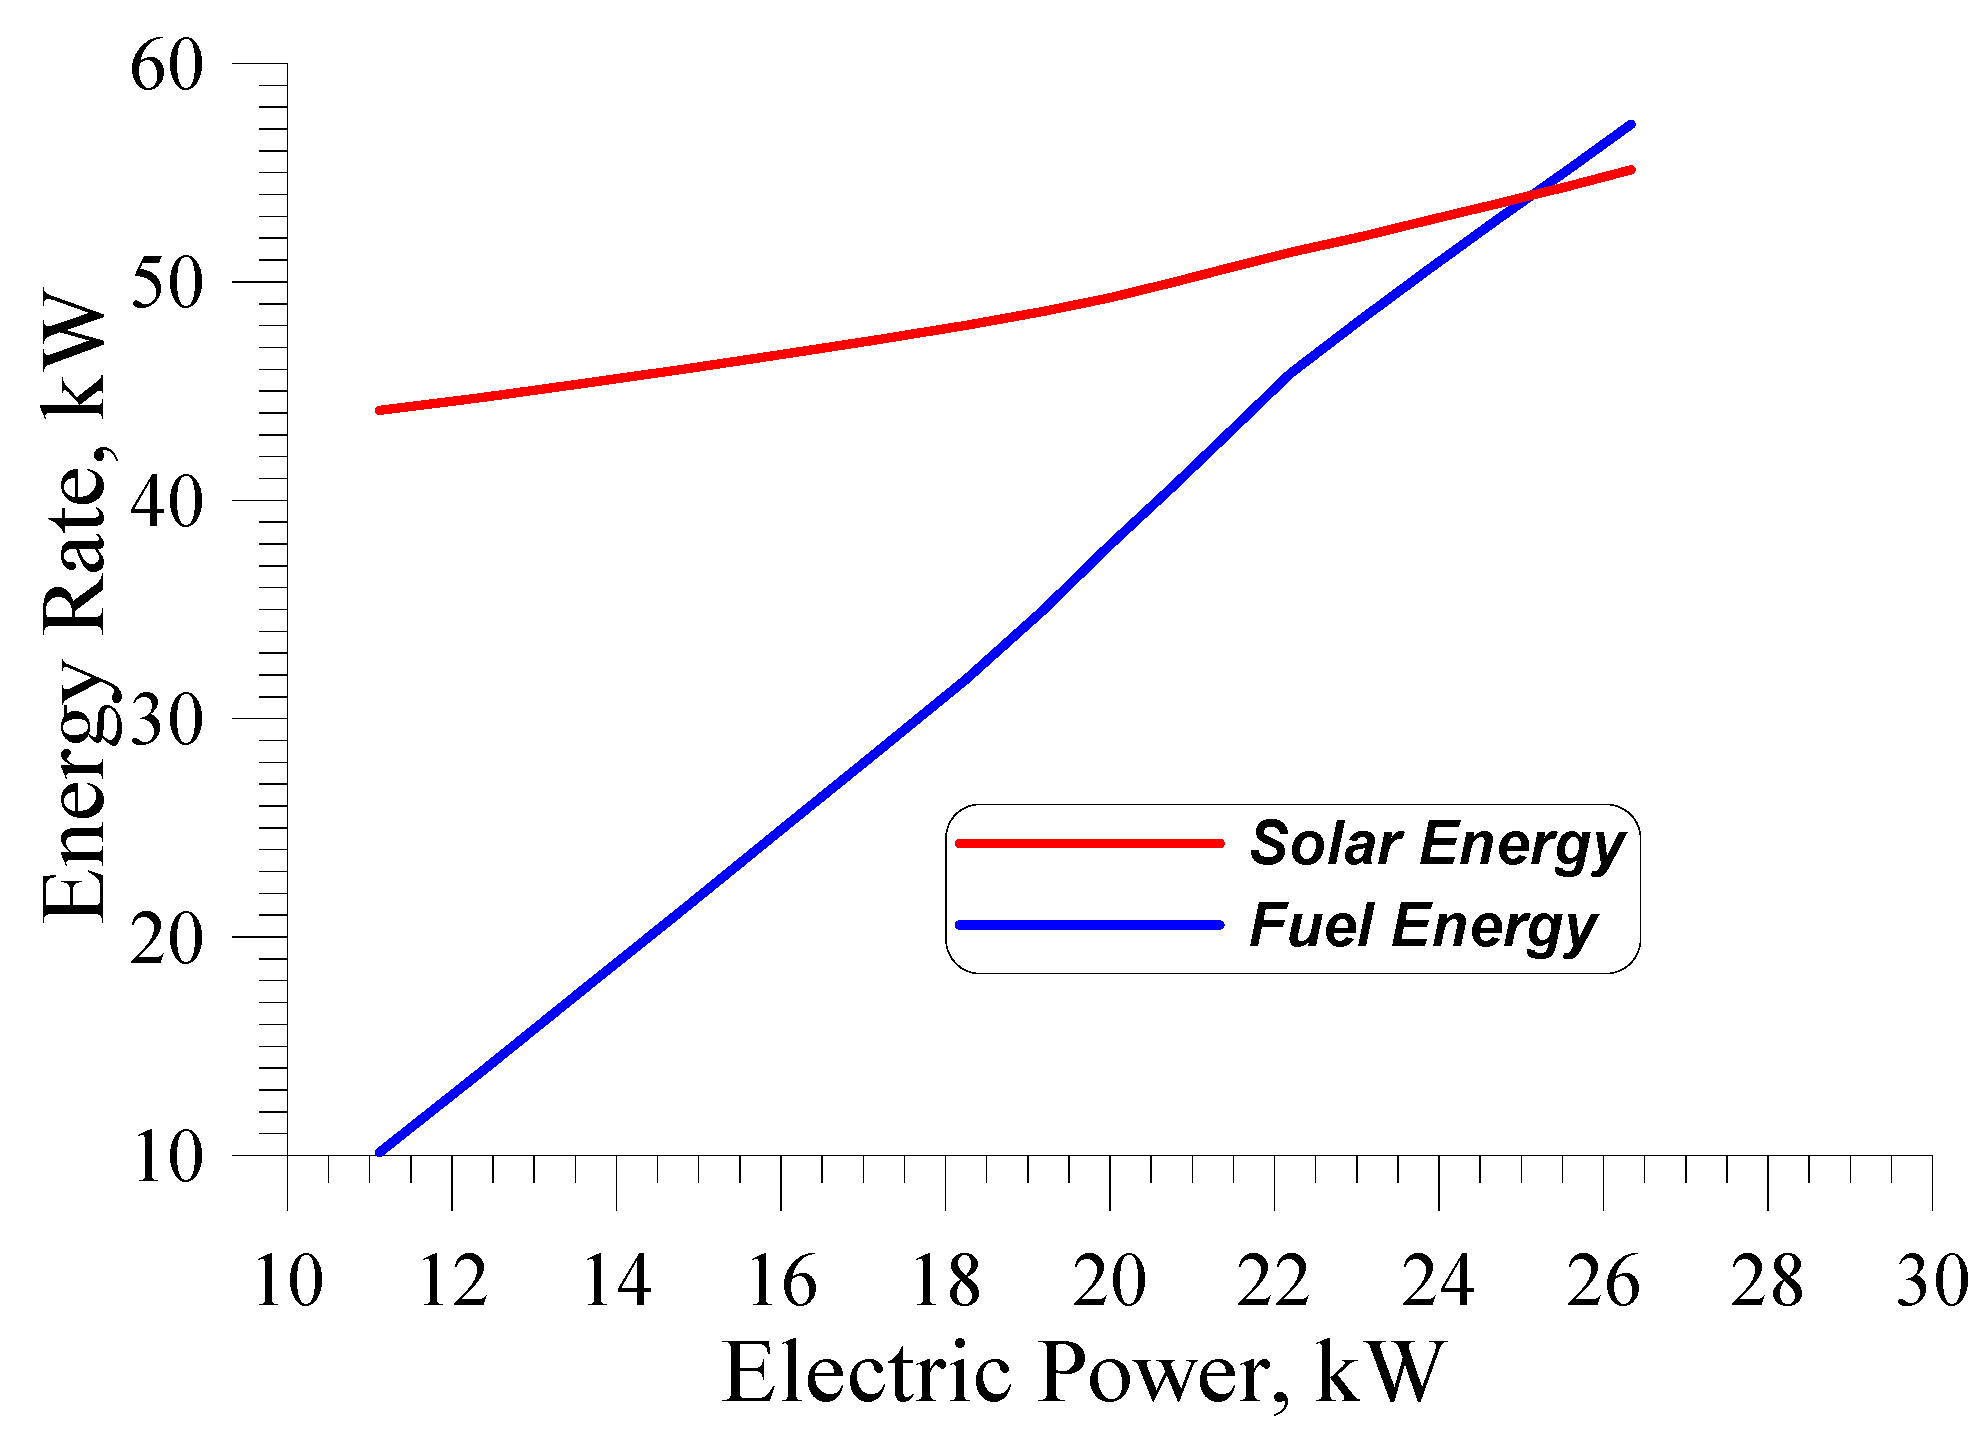
Figure 11.
Primary energy rates supplied to the solar-assisted micro gas turbine.
Figure 11.
Primary energy rates supplied to the solar-assisted micro gas turbine.
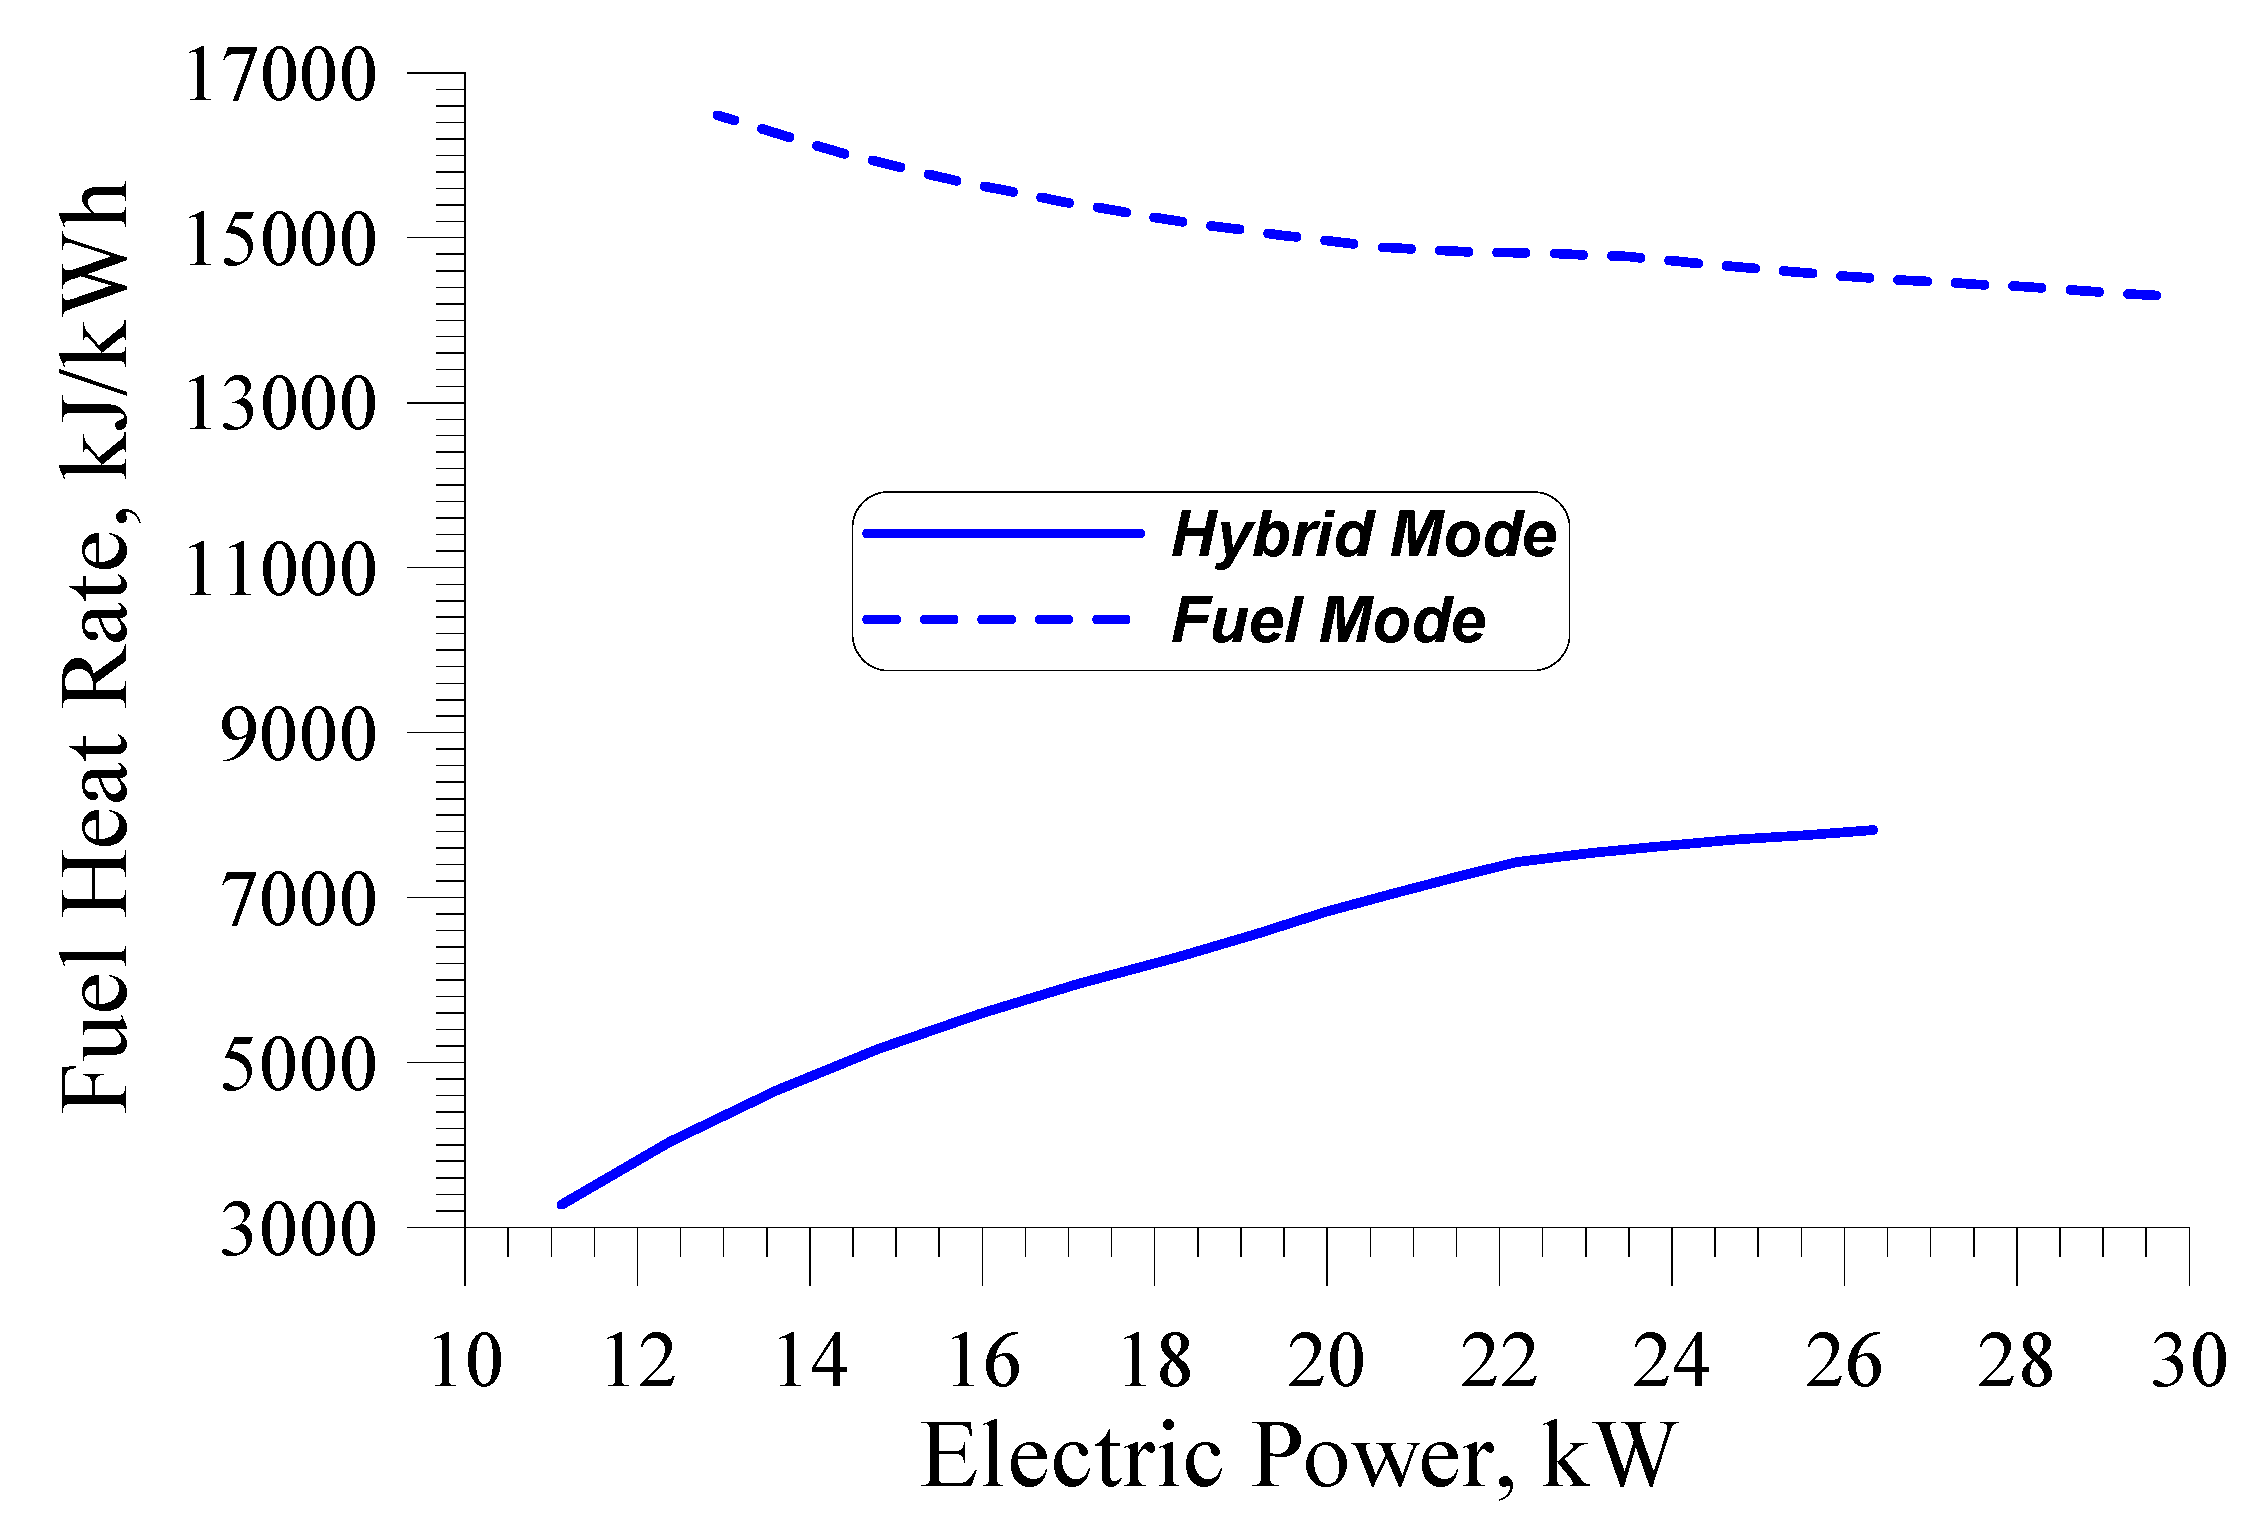
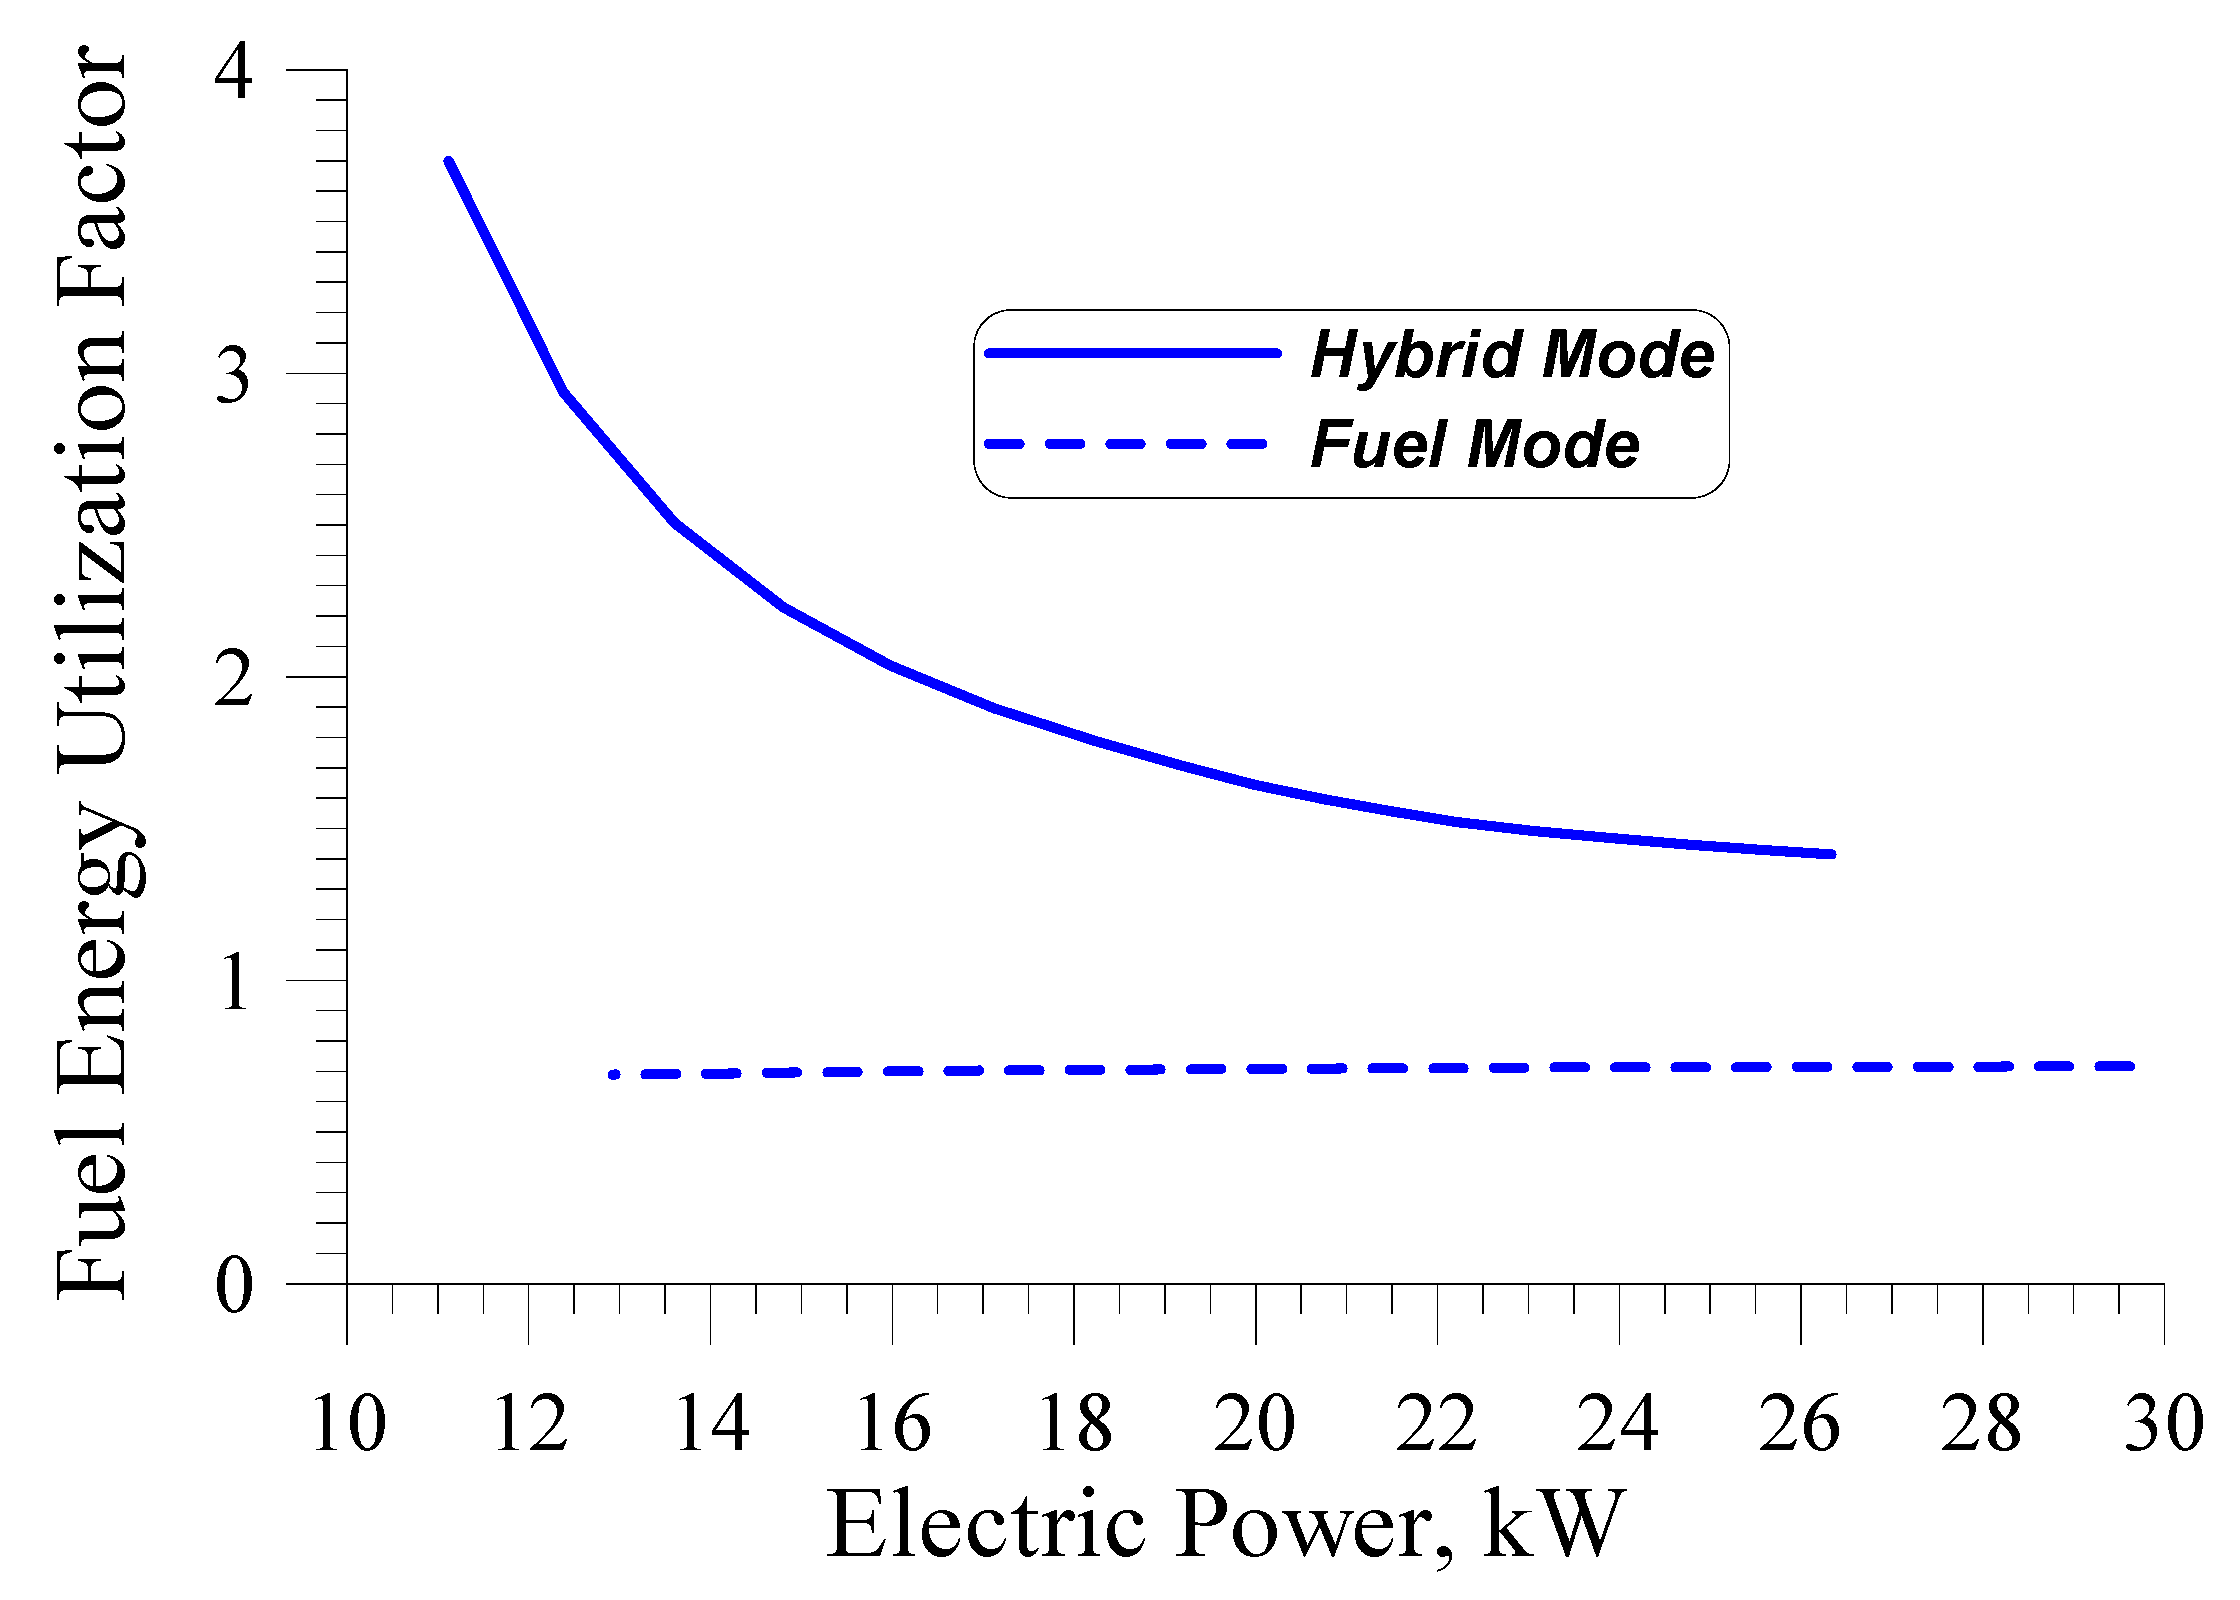
Figure 12.
Fuel consumption and utilization factor comparison in hybrid and fuel mode.
Figure 12.
Fuel consumption and utilization factor comparison in hybrid and fuel mode.
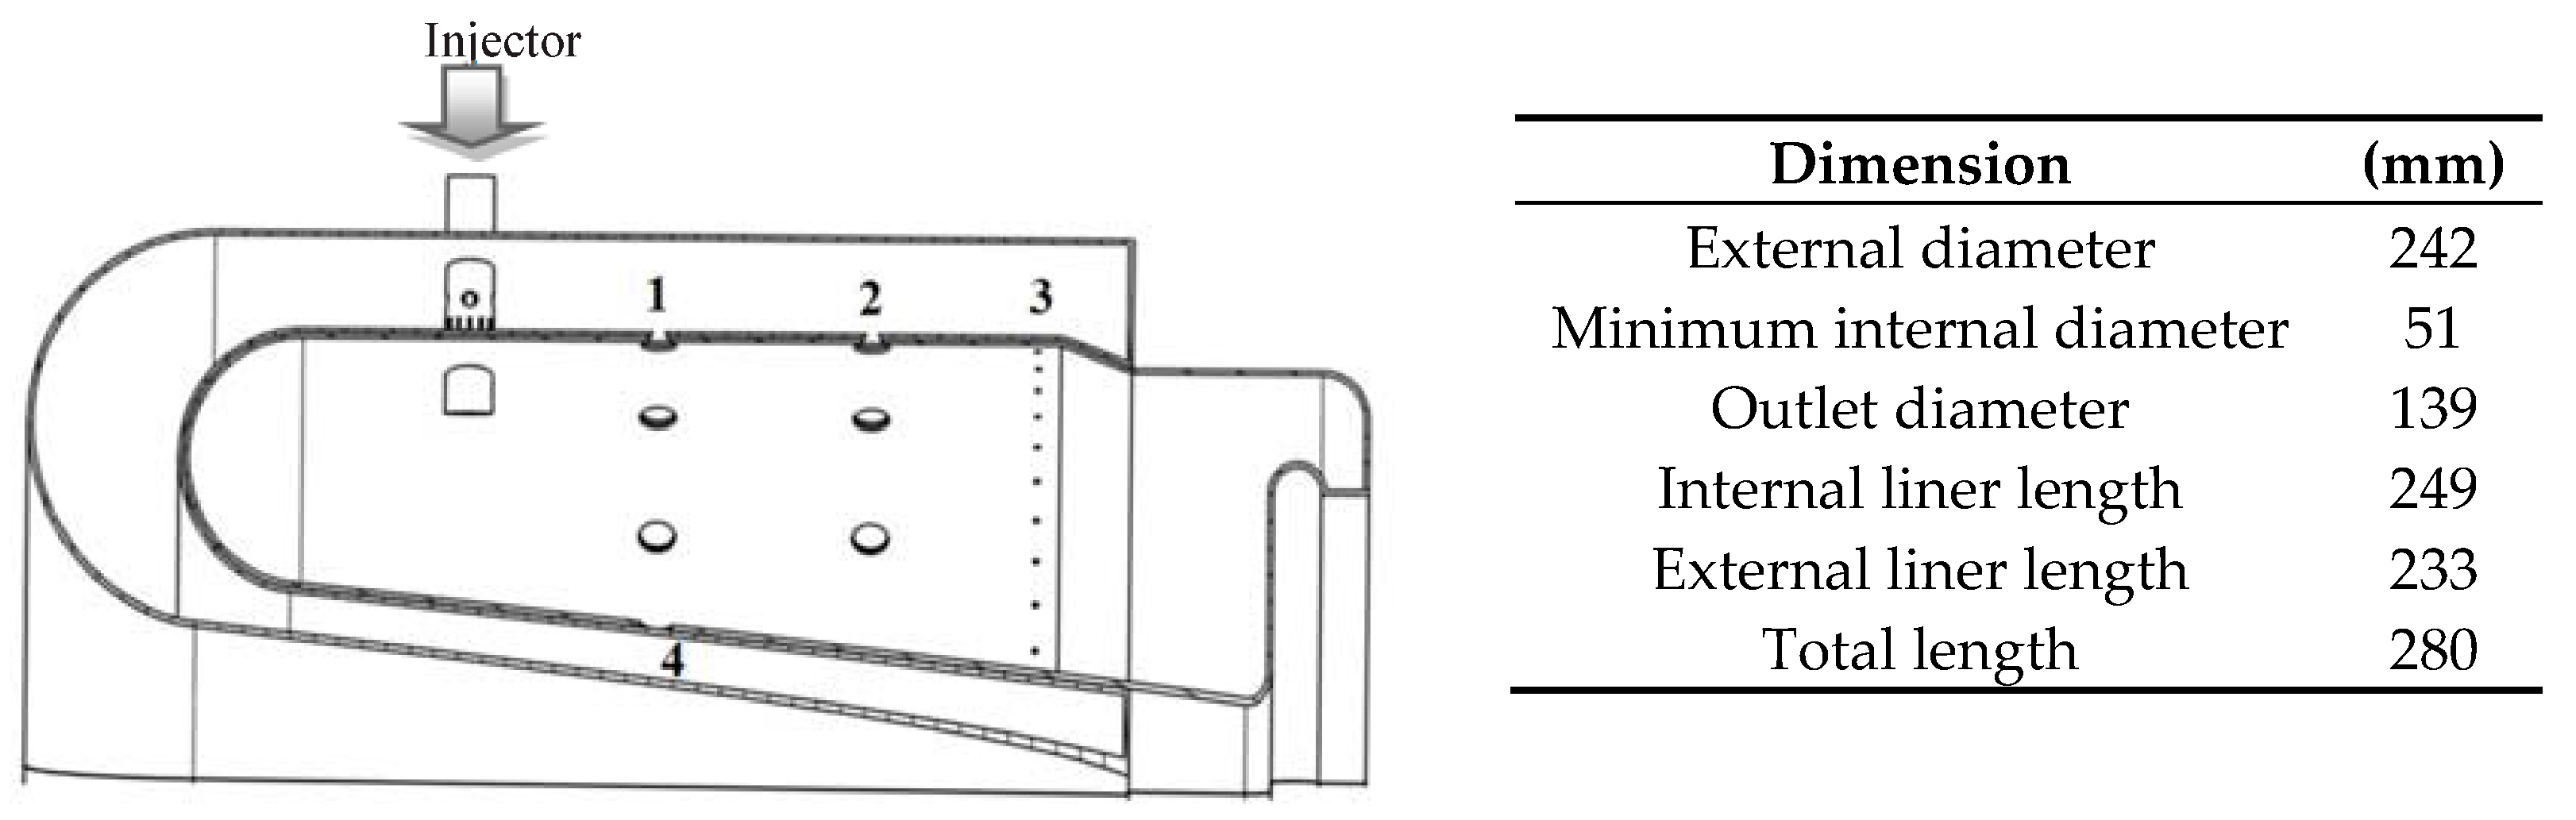
Figure 13.
Combustor cross section and dimensions and outer and inner secondary holes (1, 4), dilution holes (2) and cooling holes (3).
Figure 13.
Combustor cross section and dimensions and outer and inner secondary holes (1, 4), dilution holes (2) and cooling holes (3).
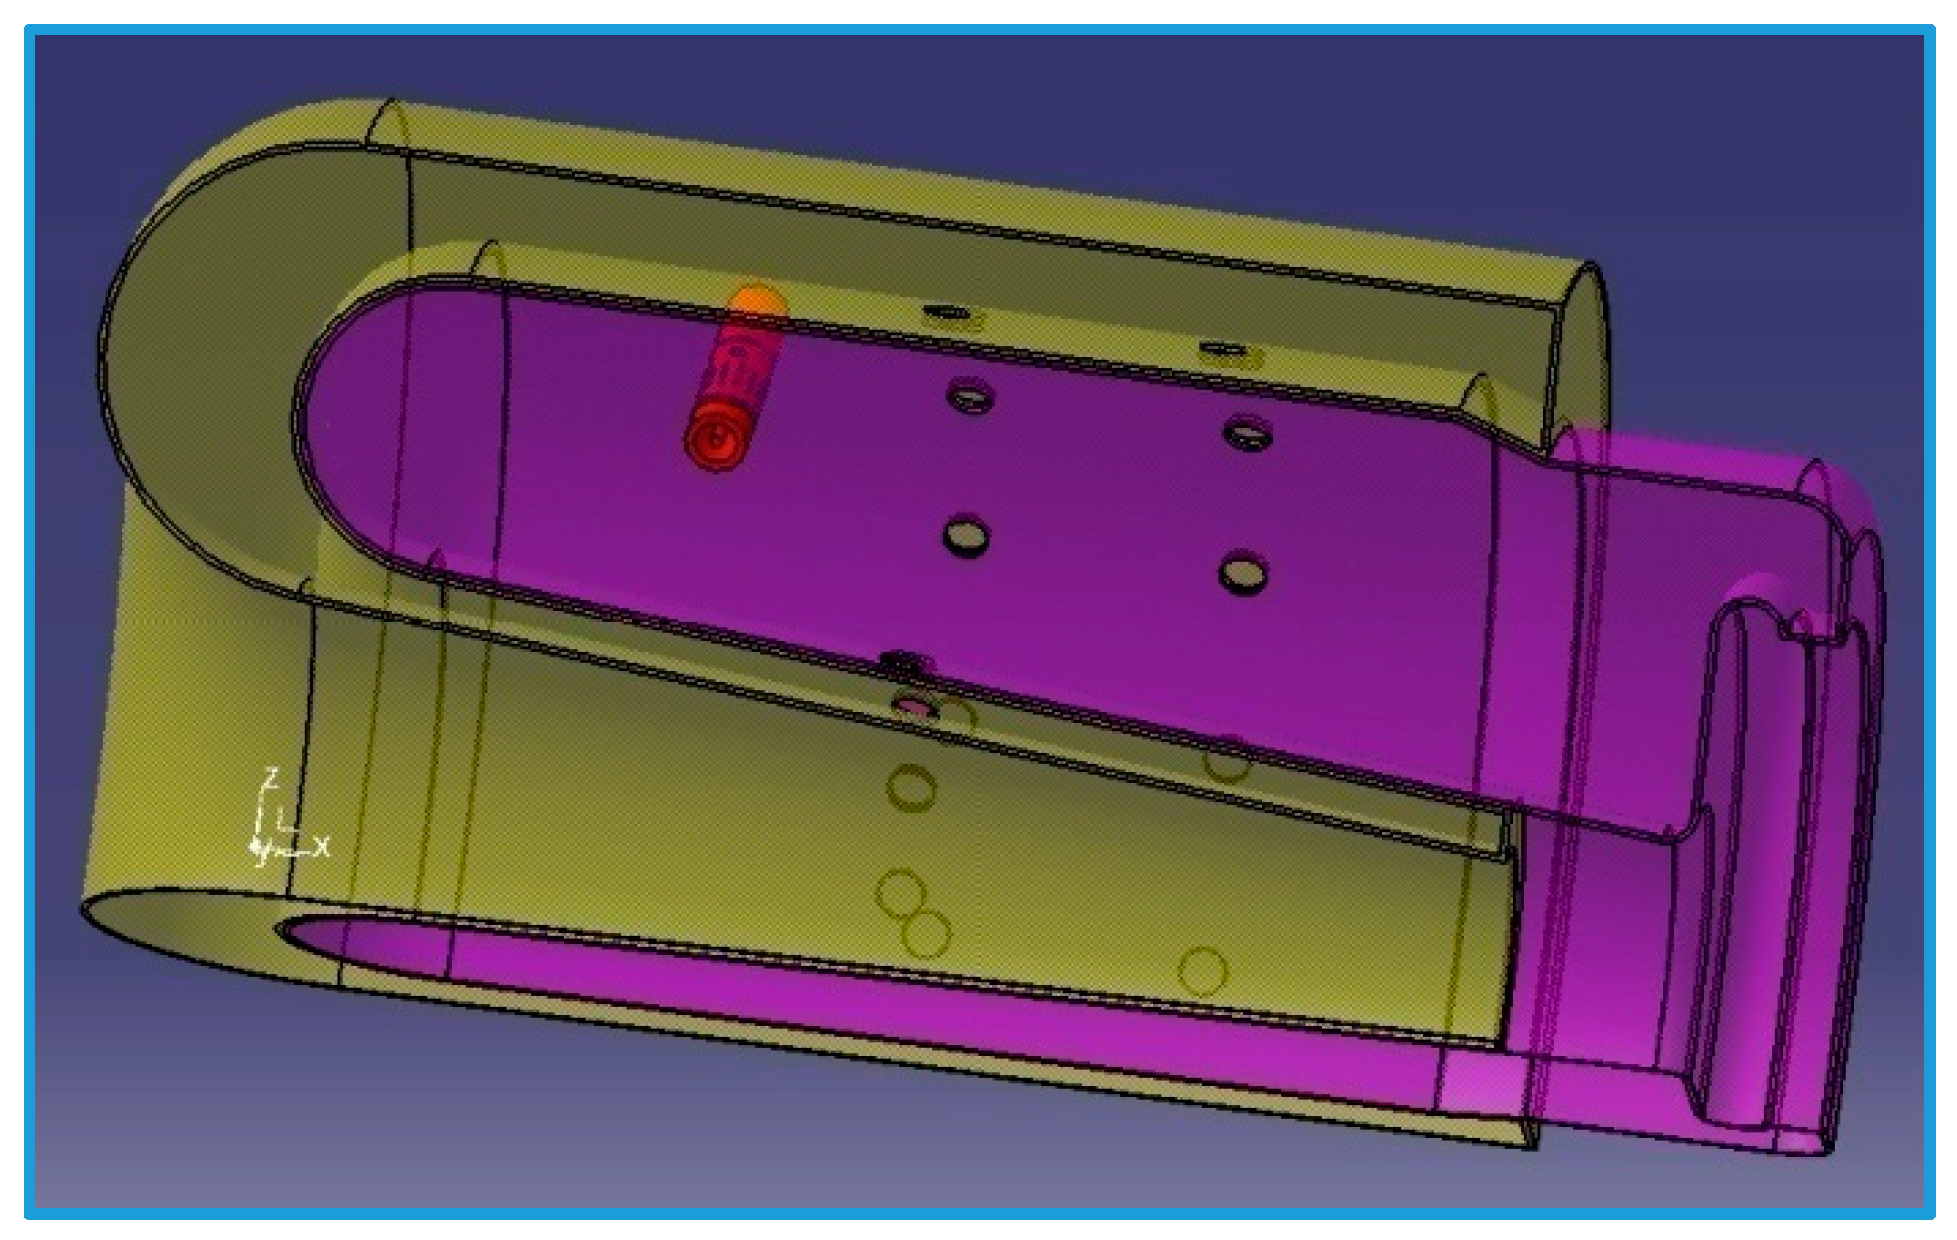
Figure 14.
View of the 120°, 3D sector of the combustor.
Figure 14.
View of the 120°, 3D sector of the combustor.
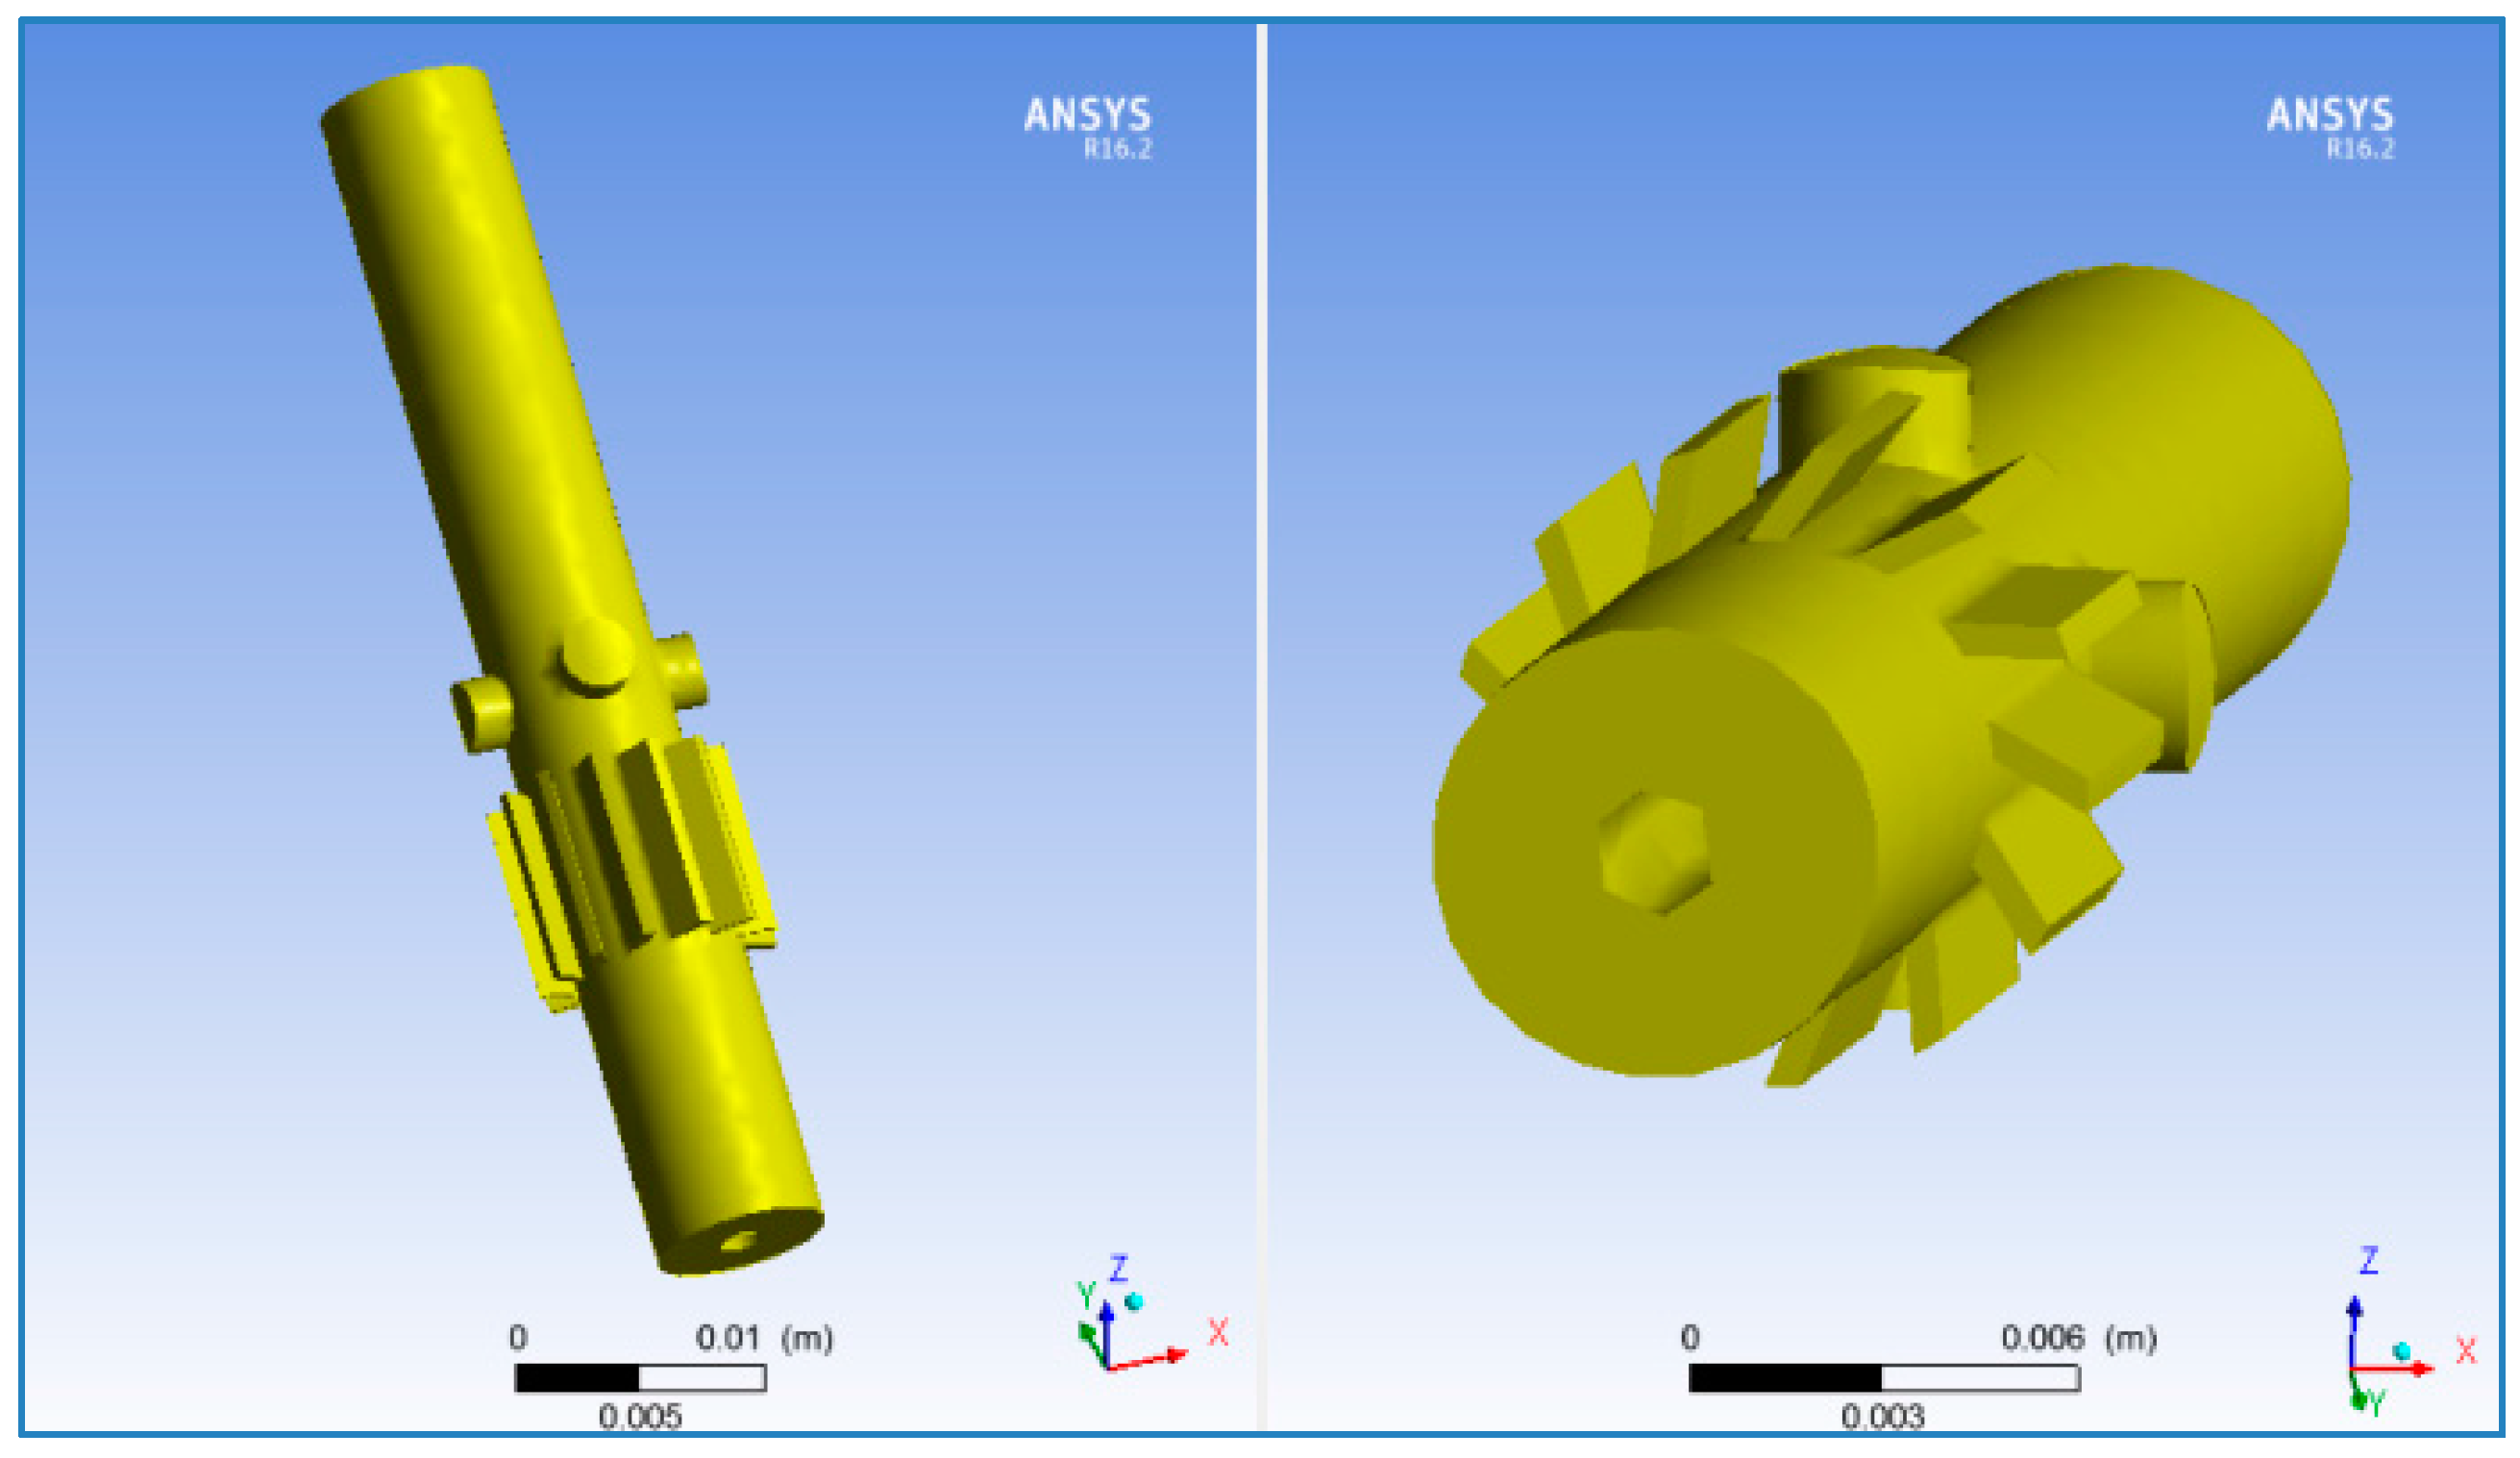
Figure 15.
Injector geometry.
Figure 15.
Injector geometry.
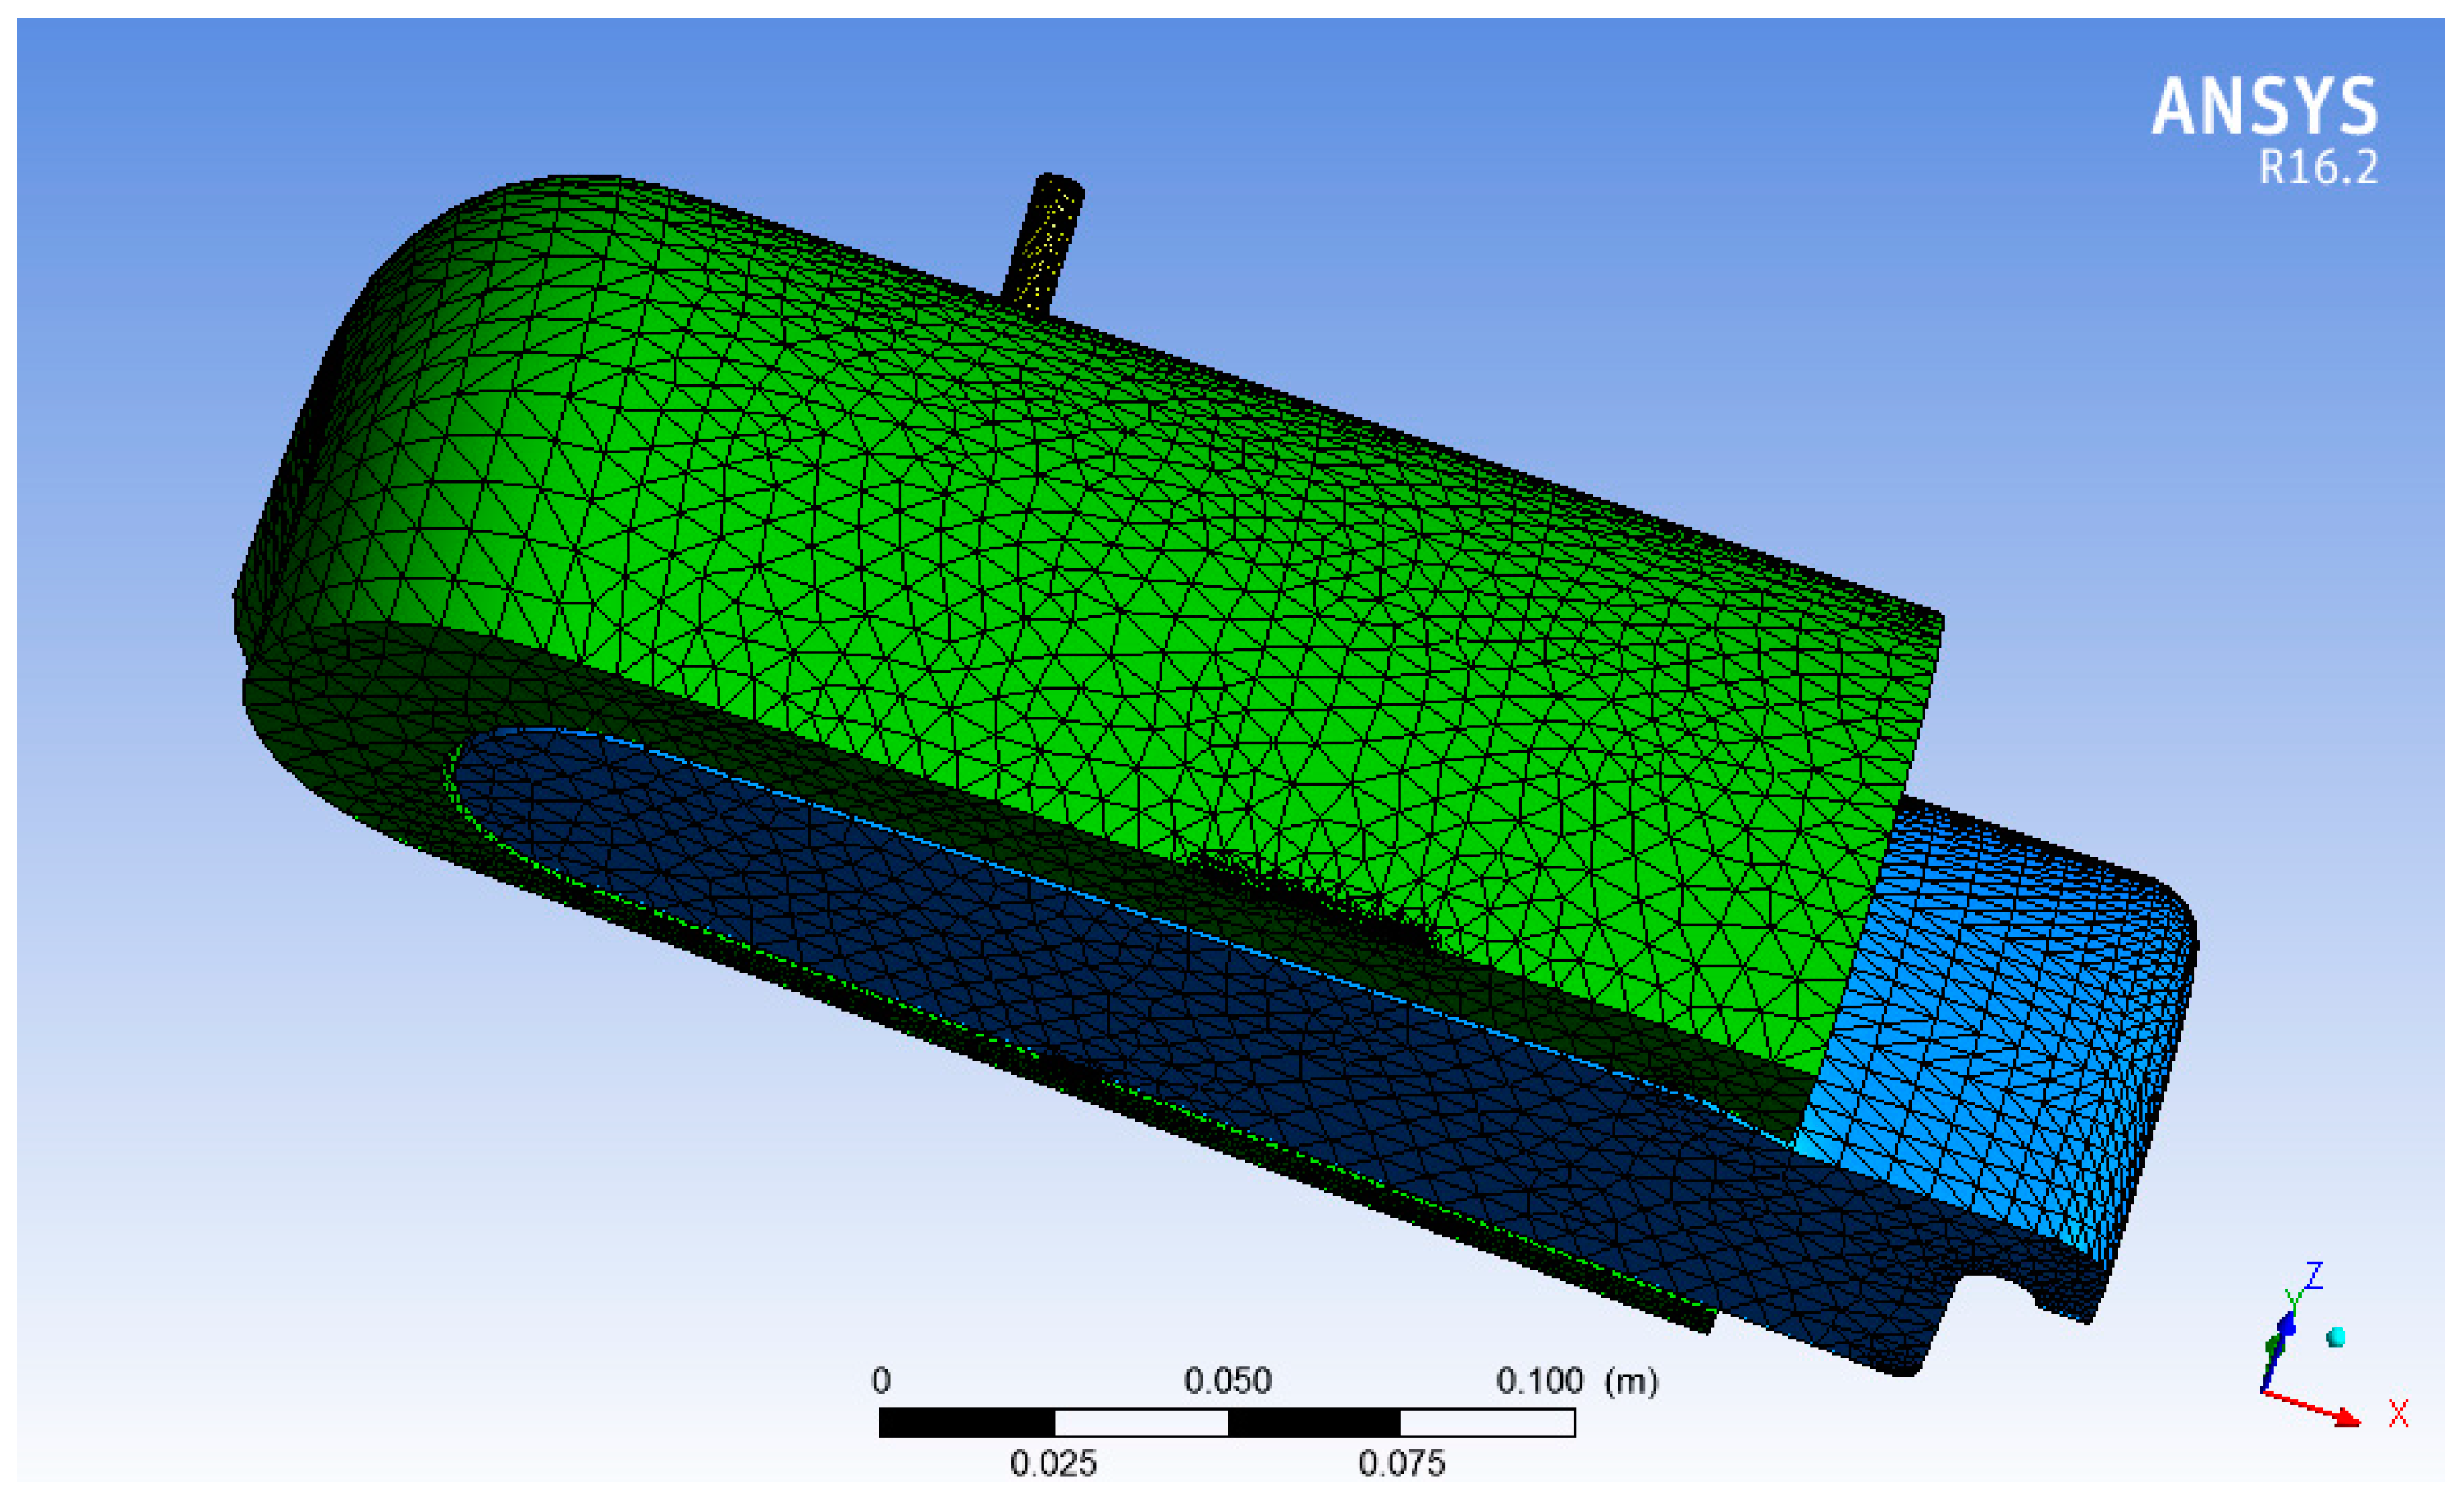
Figure 16.
Details of the computational mesh.
Figure 16.
Details of the computational mesh.
| Domain | Nodes | Cells |
|---|
| Core | 18,436 | 76,845 |
| Injector | 45,768 | 213,061 |
| Liner | 39,452 | 171,784 |
| All | 103,656 | 461,690 |
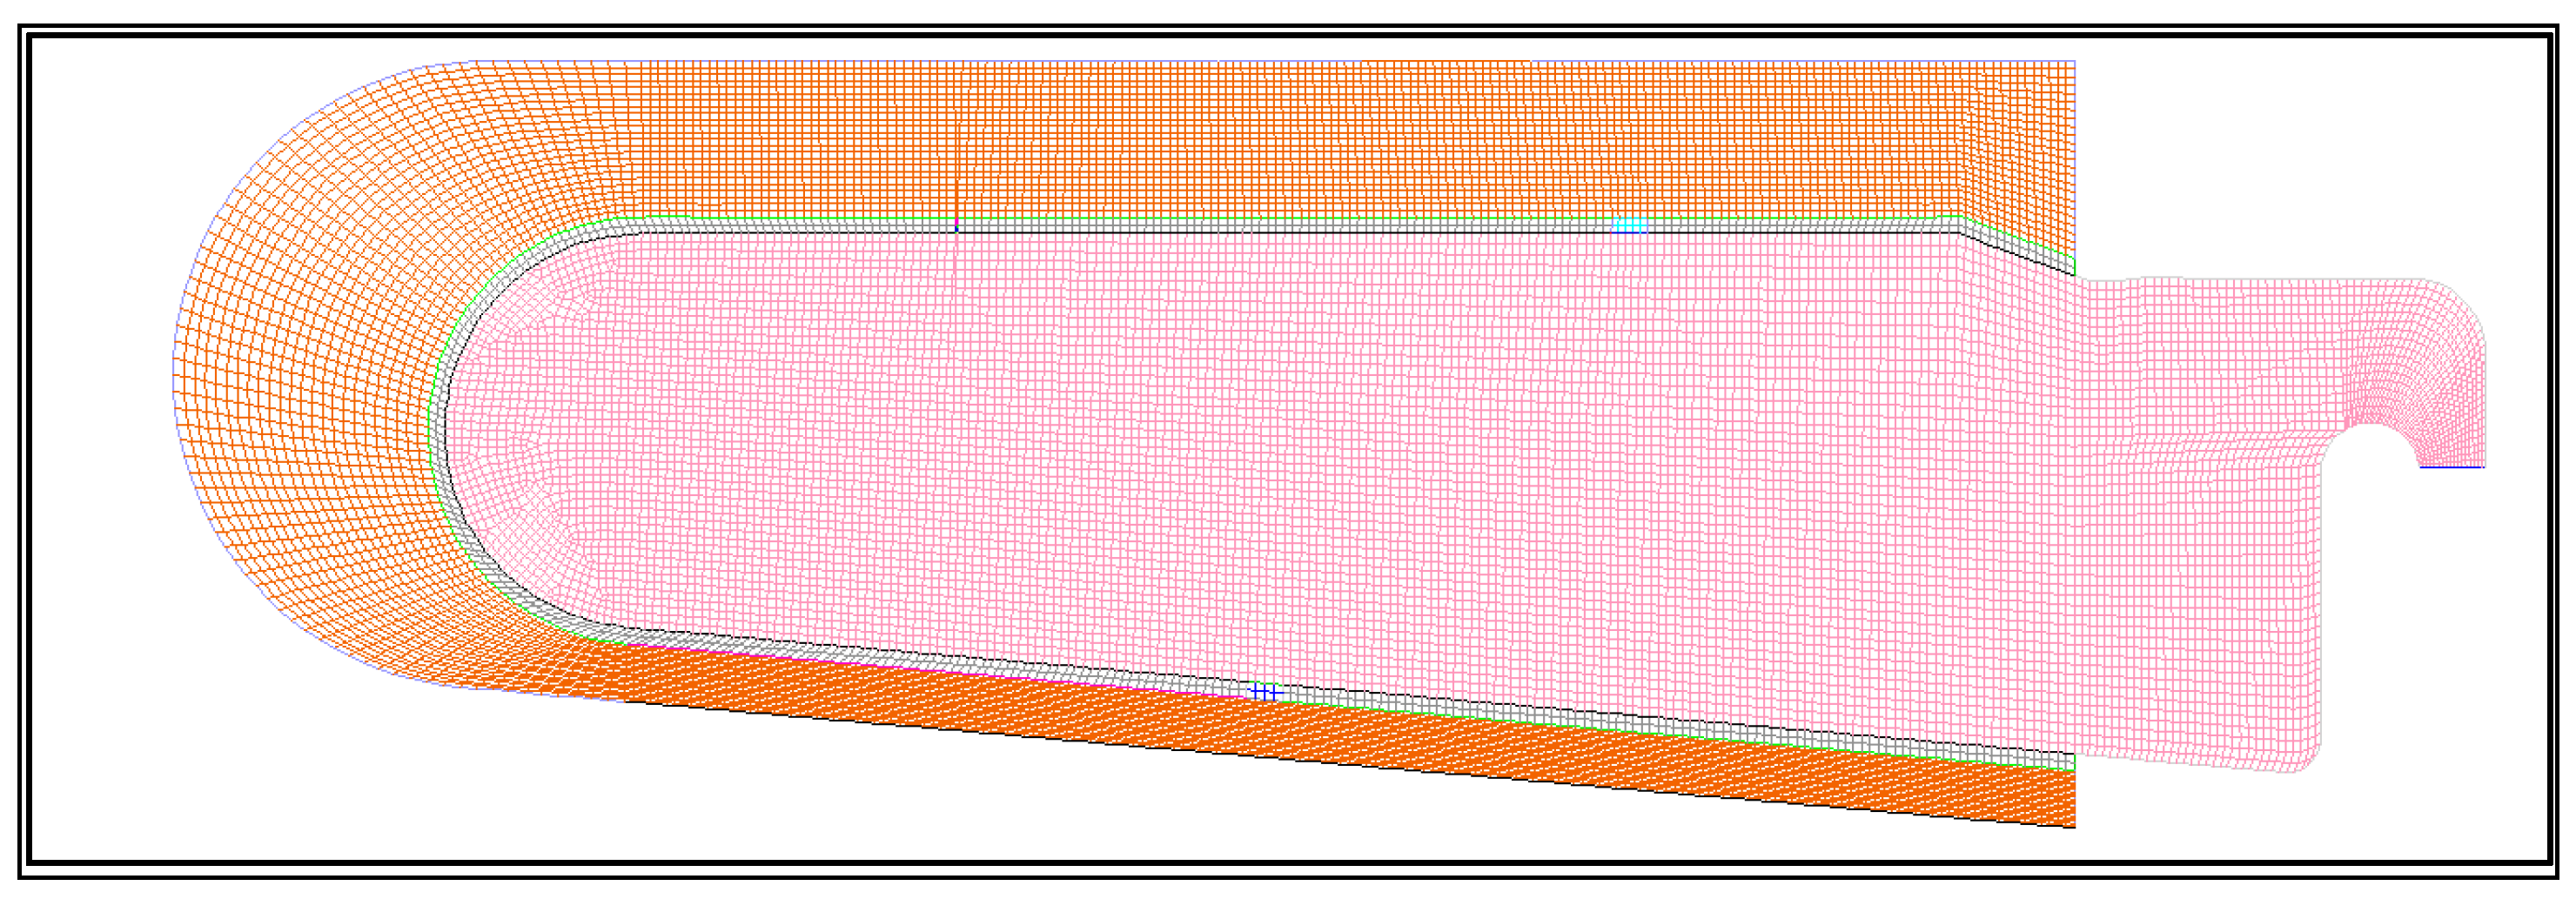
Figure 17.
Mesh of the 2D domain.
Figure 17.
Mesh of the 2D domain.
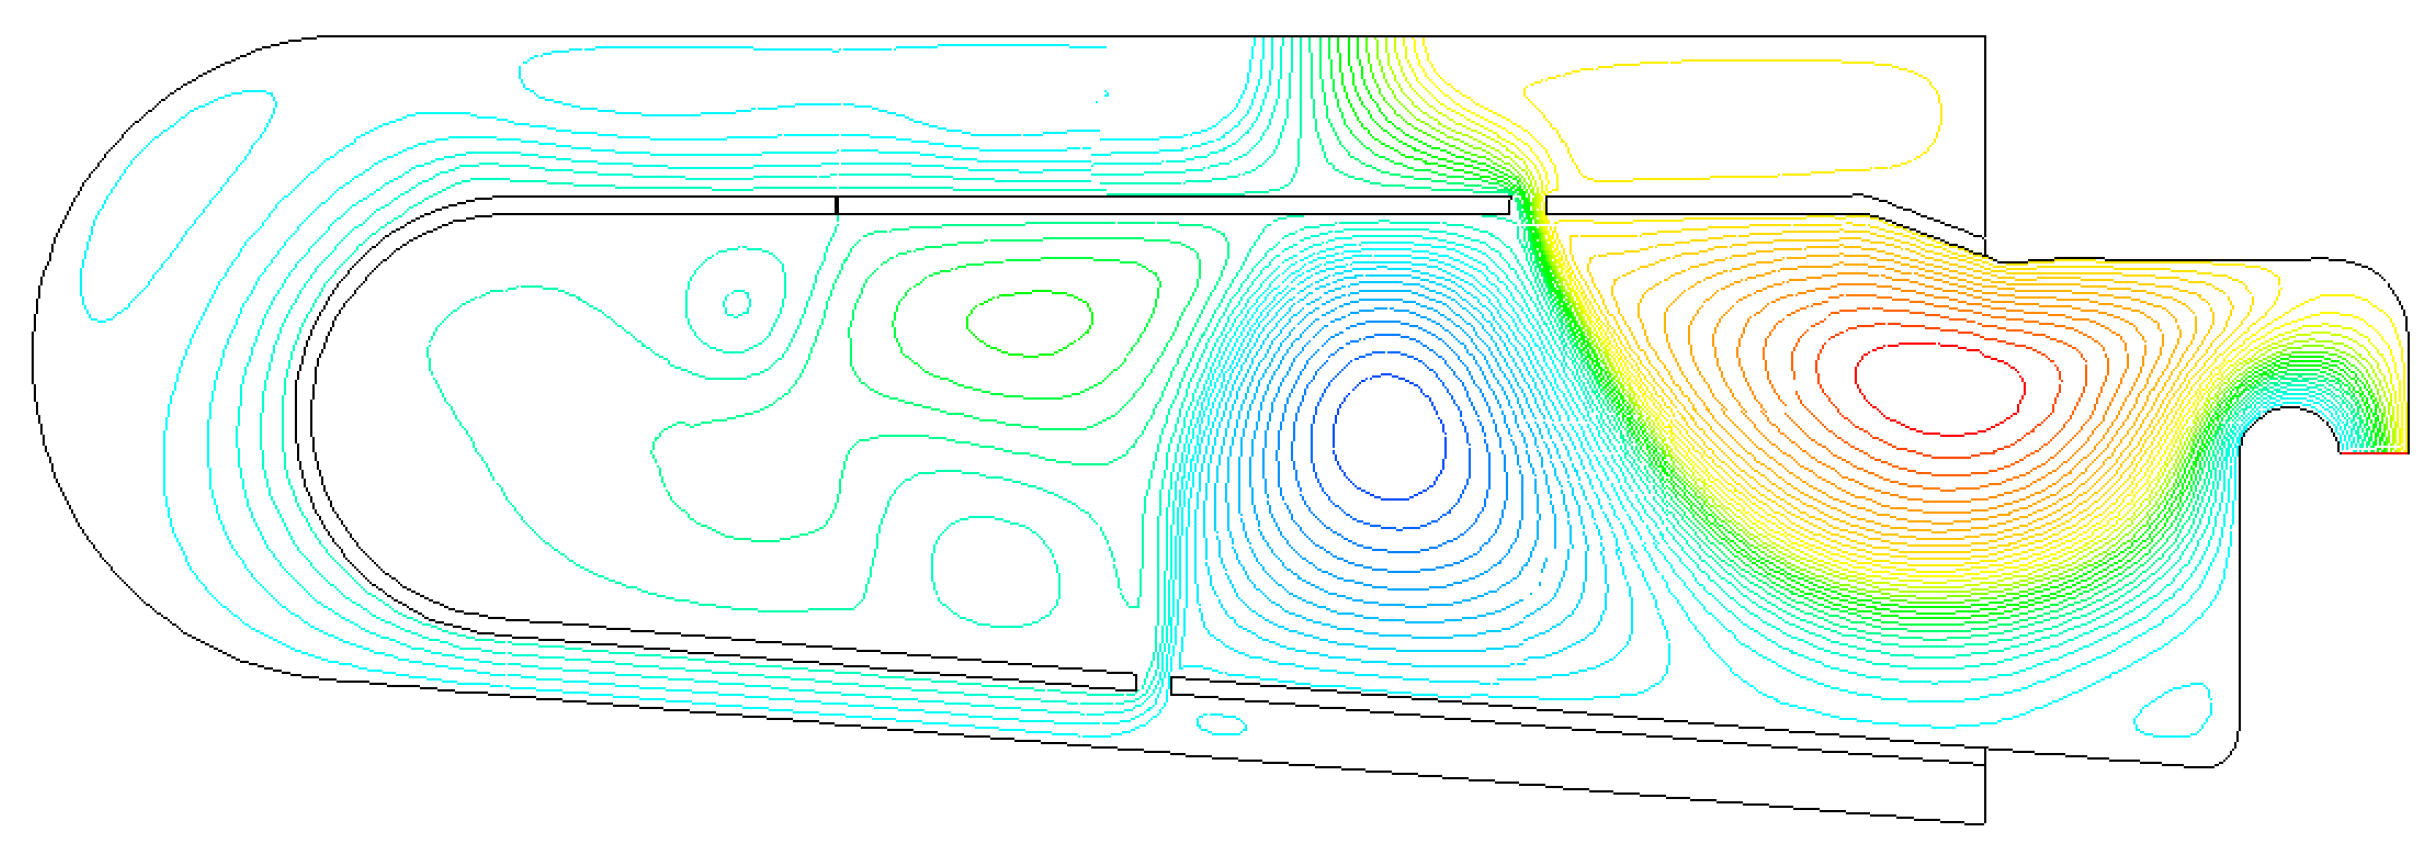
Figure 18.
Streamline pattern throughout the combustor.
Figure 18.
Streamline pattern throughout the combustor.
Figure 19.
Fuel/Air equivalence ratio in a meridional and a cross section (green = stoichiometric; yellow-red = rich).
Figure 19.
Fuel/Air equivalence ratio in a meridional and a cross section (green = stoichiometric; yellow-red = rich).
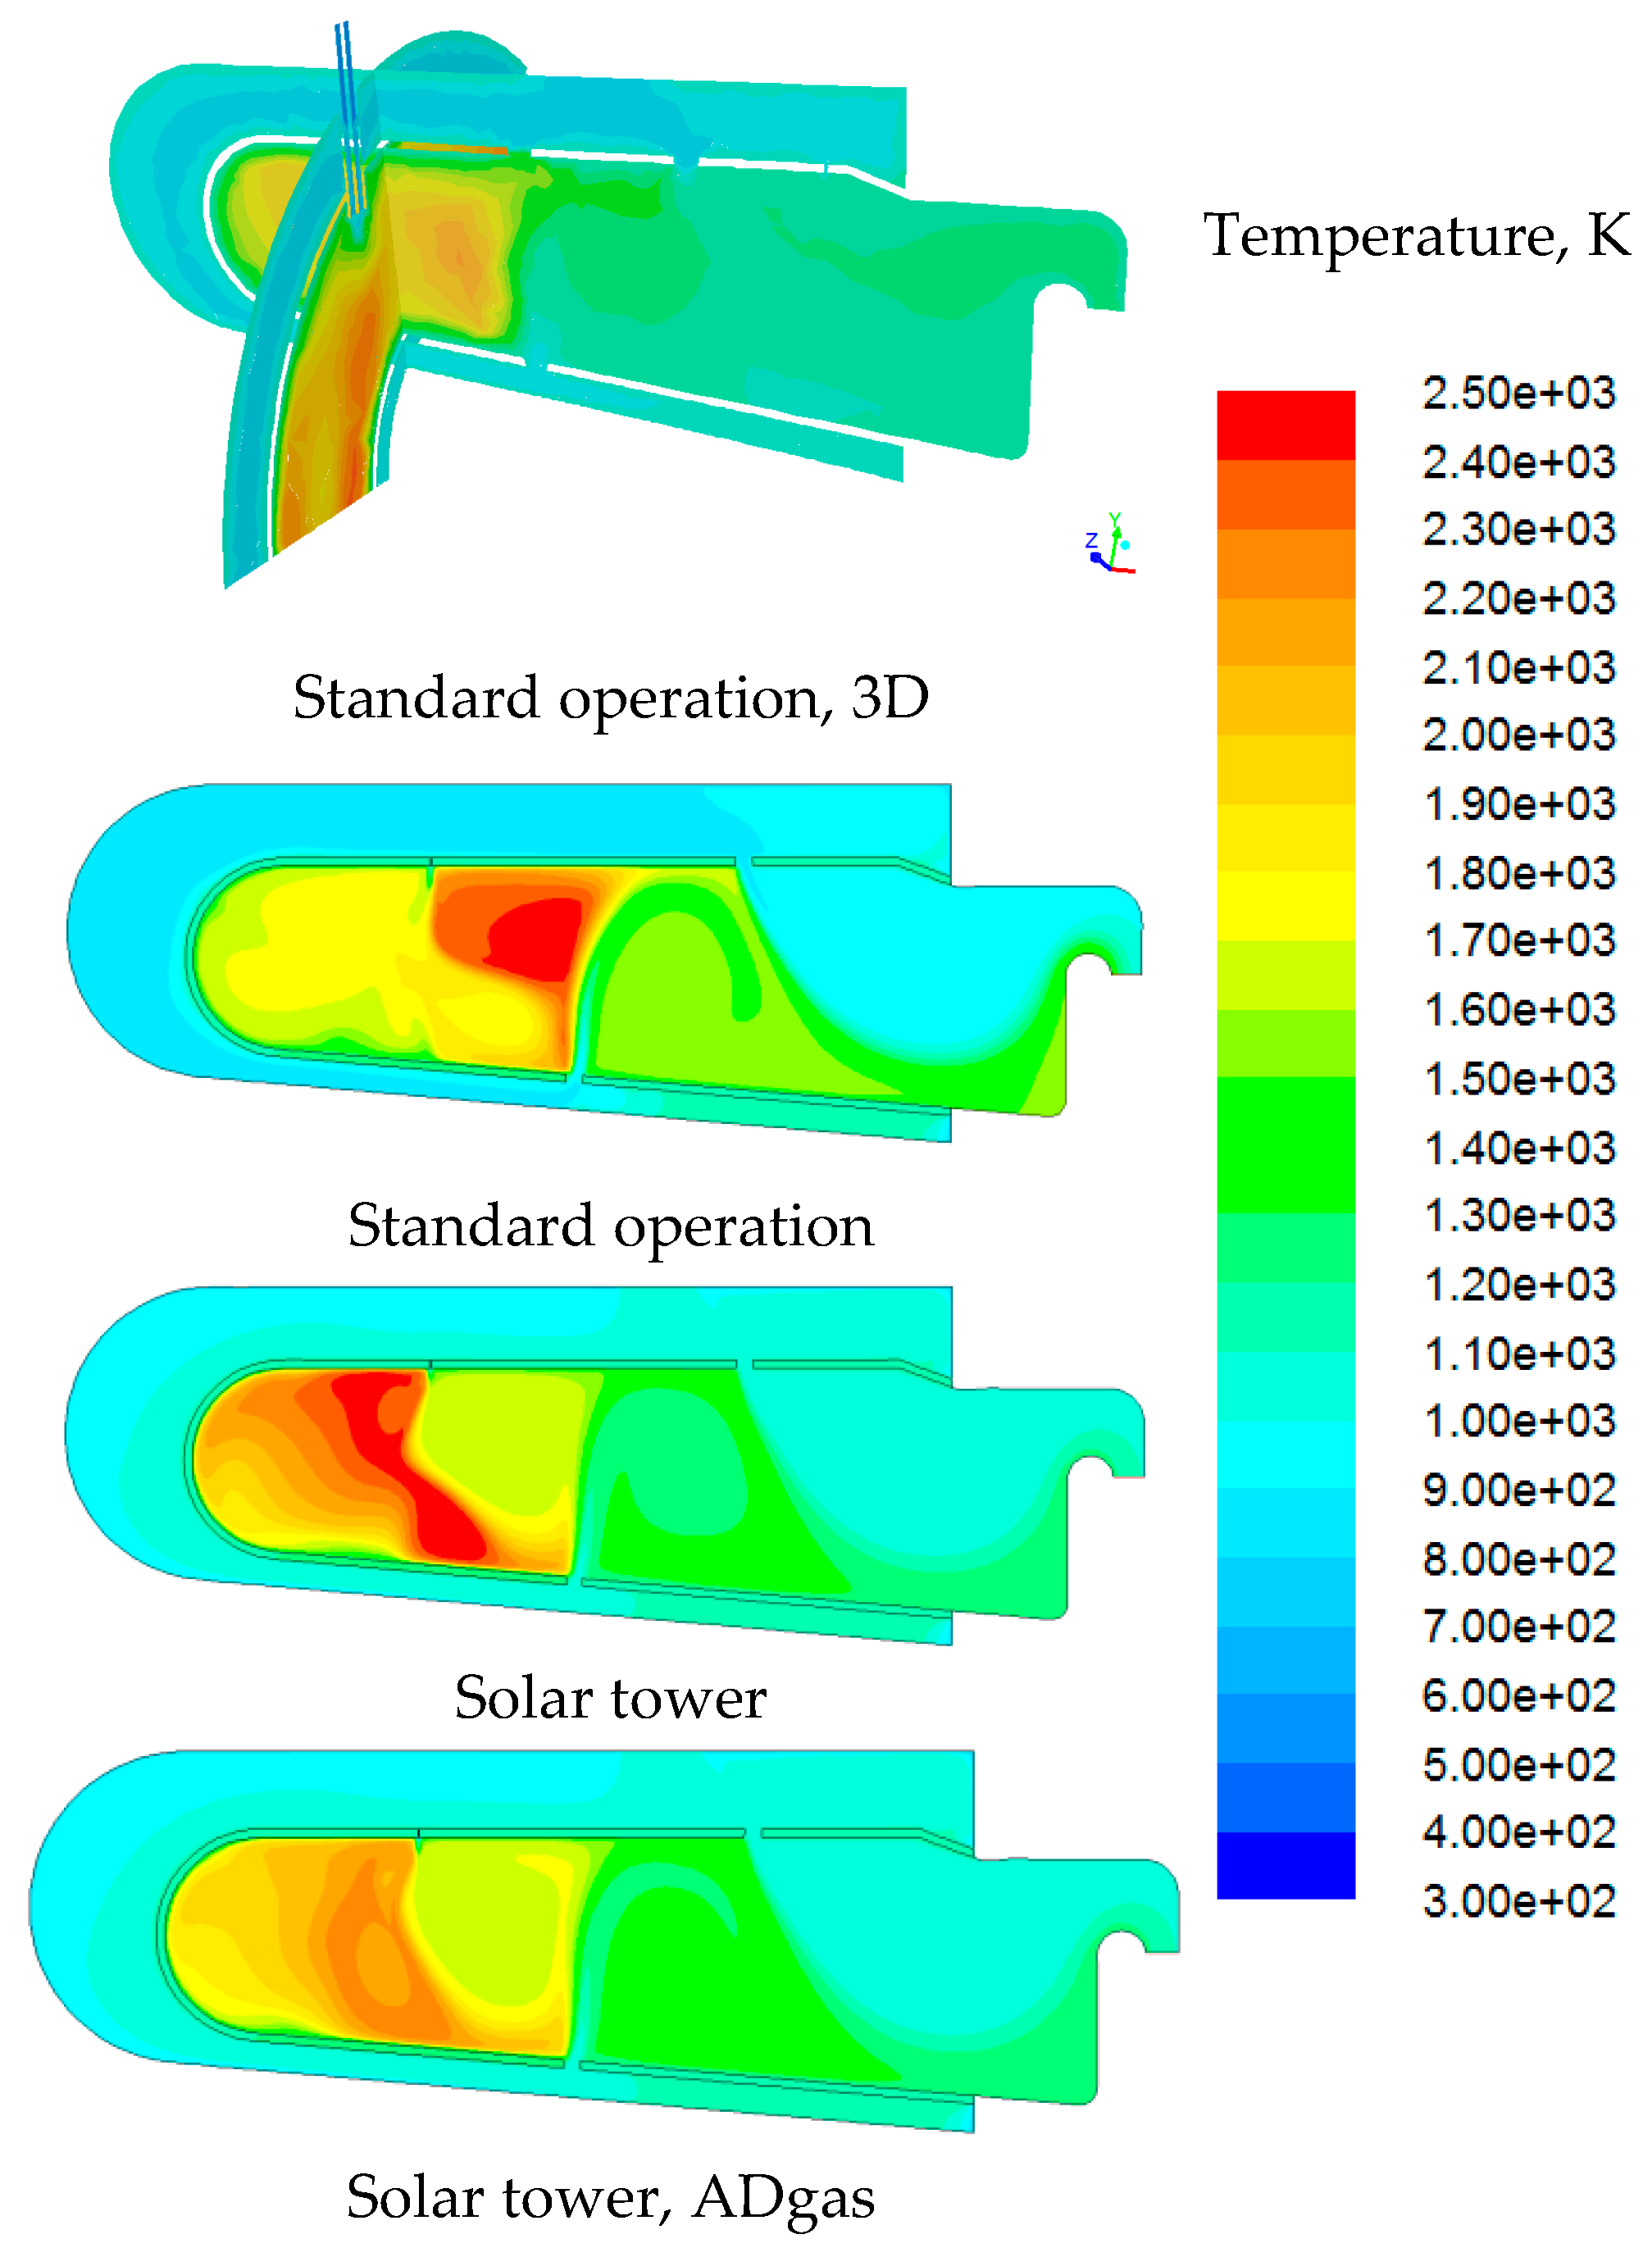
Figure 20.
Temperature distributions in the combustor.
Figure 20.
Temperature distributions in the combustor.
Figure 21.
Nitric oxide mass fraction distributions inside the combustor.
Figure 21.
Nitric oxide mass fraction distributions inside the combustor.
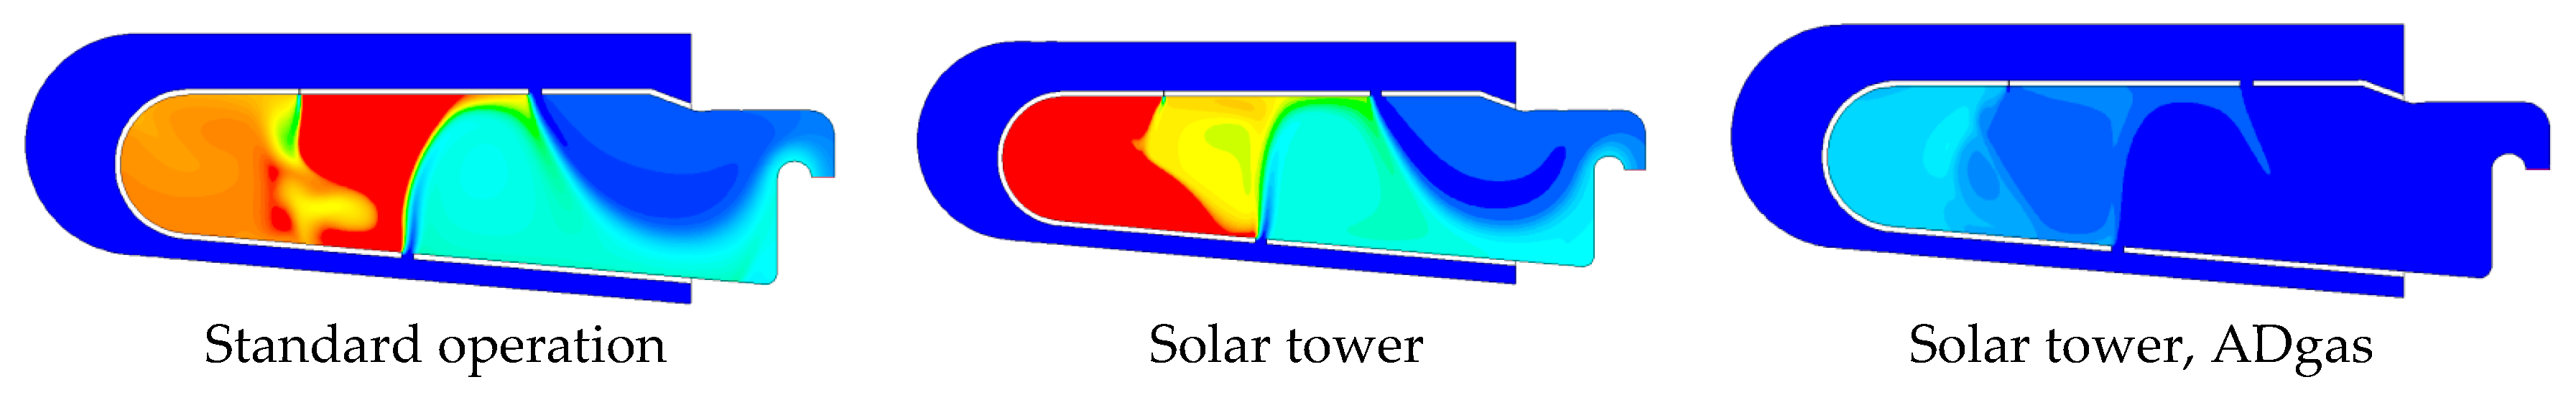
Figure 22.
Temperature distributions (K) in the MGT combustor (natural gas fuelling, high load).
Figure 22.
Temperature distributions (K) in the MGT combustor (natural gas fuelling, high load).
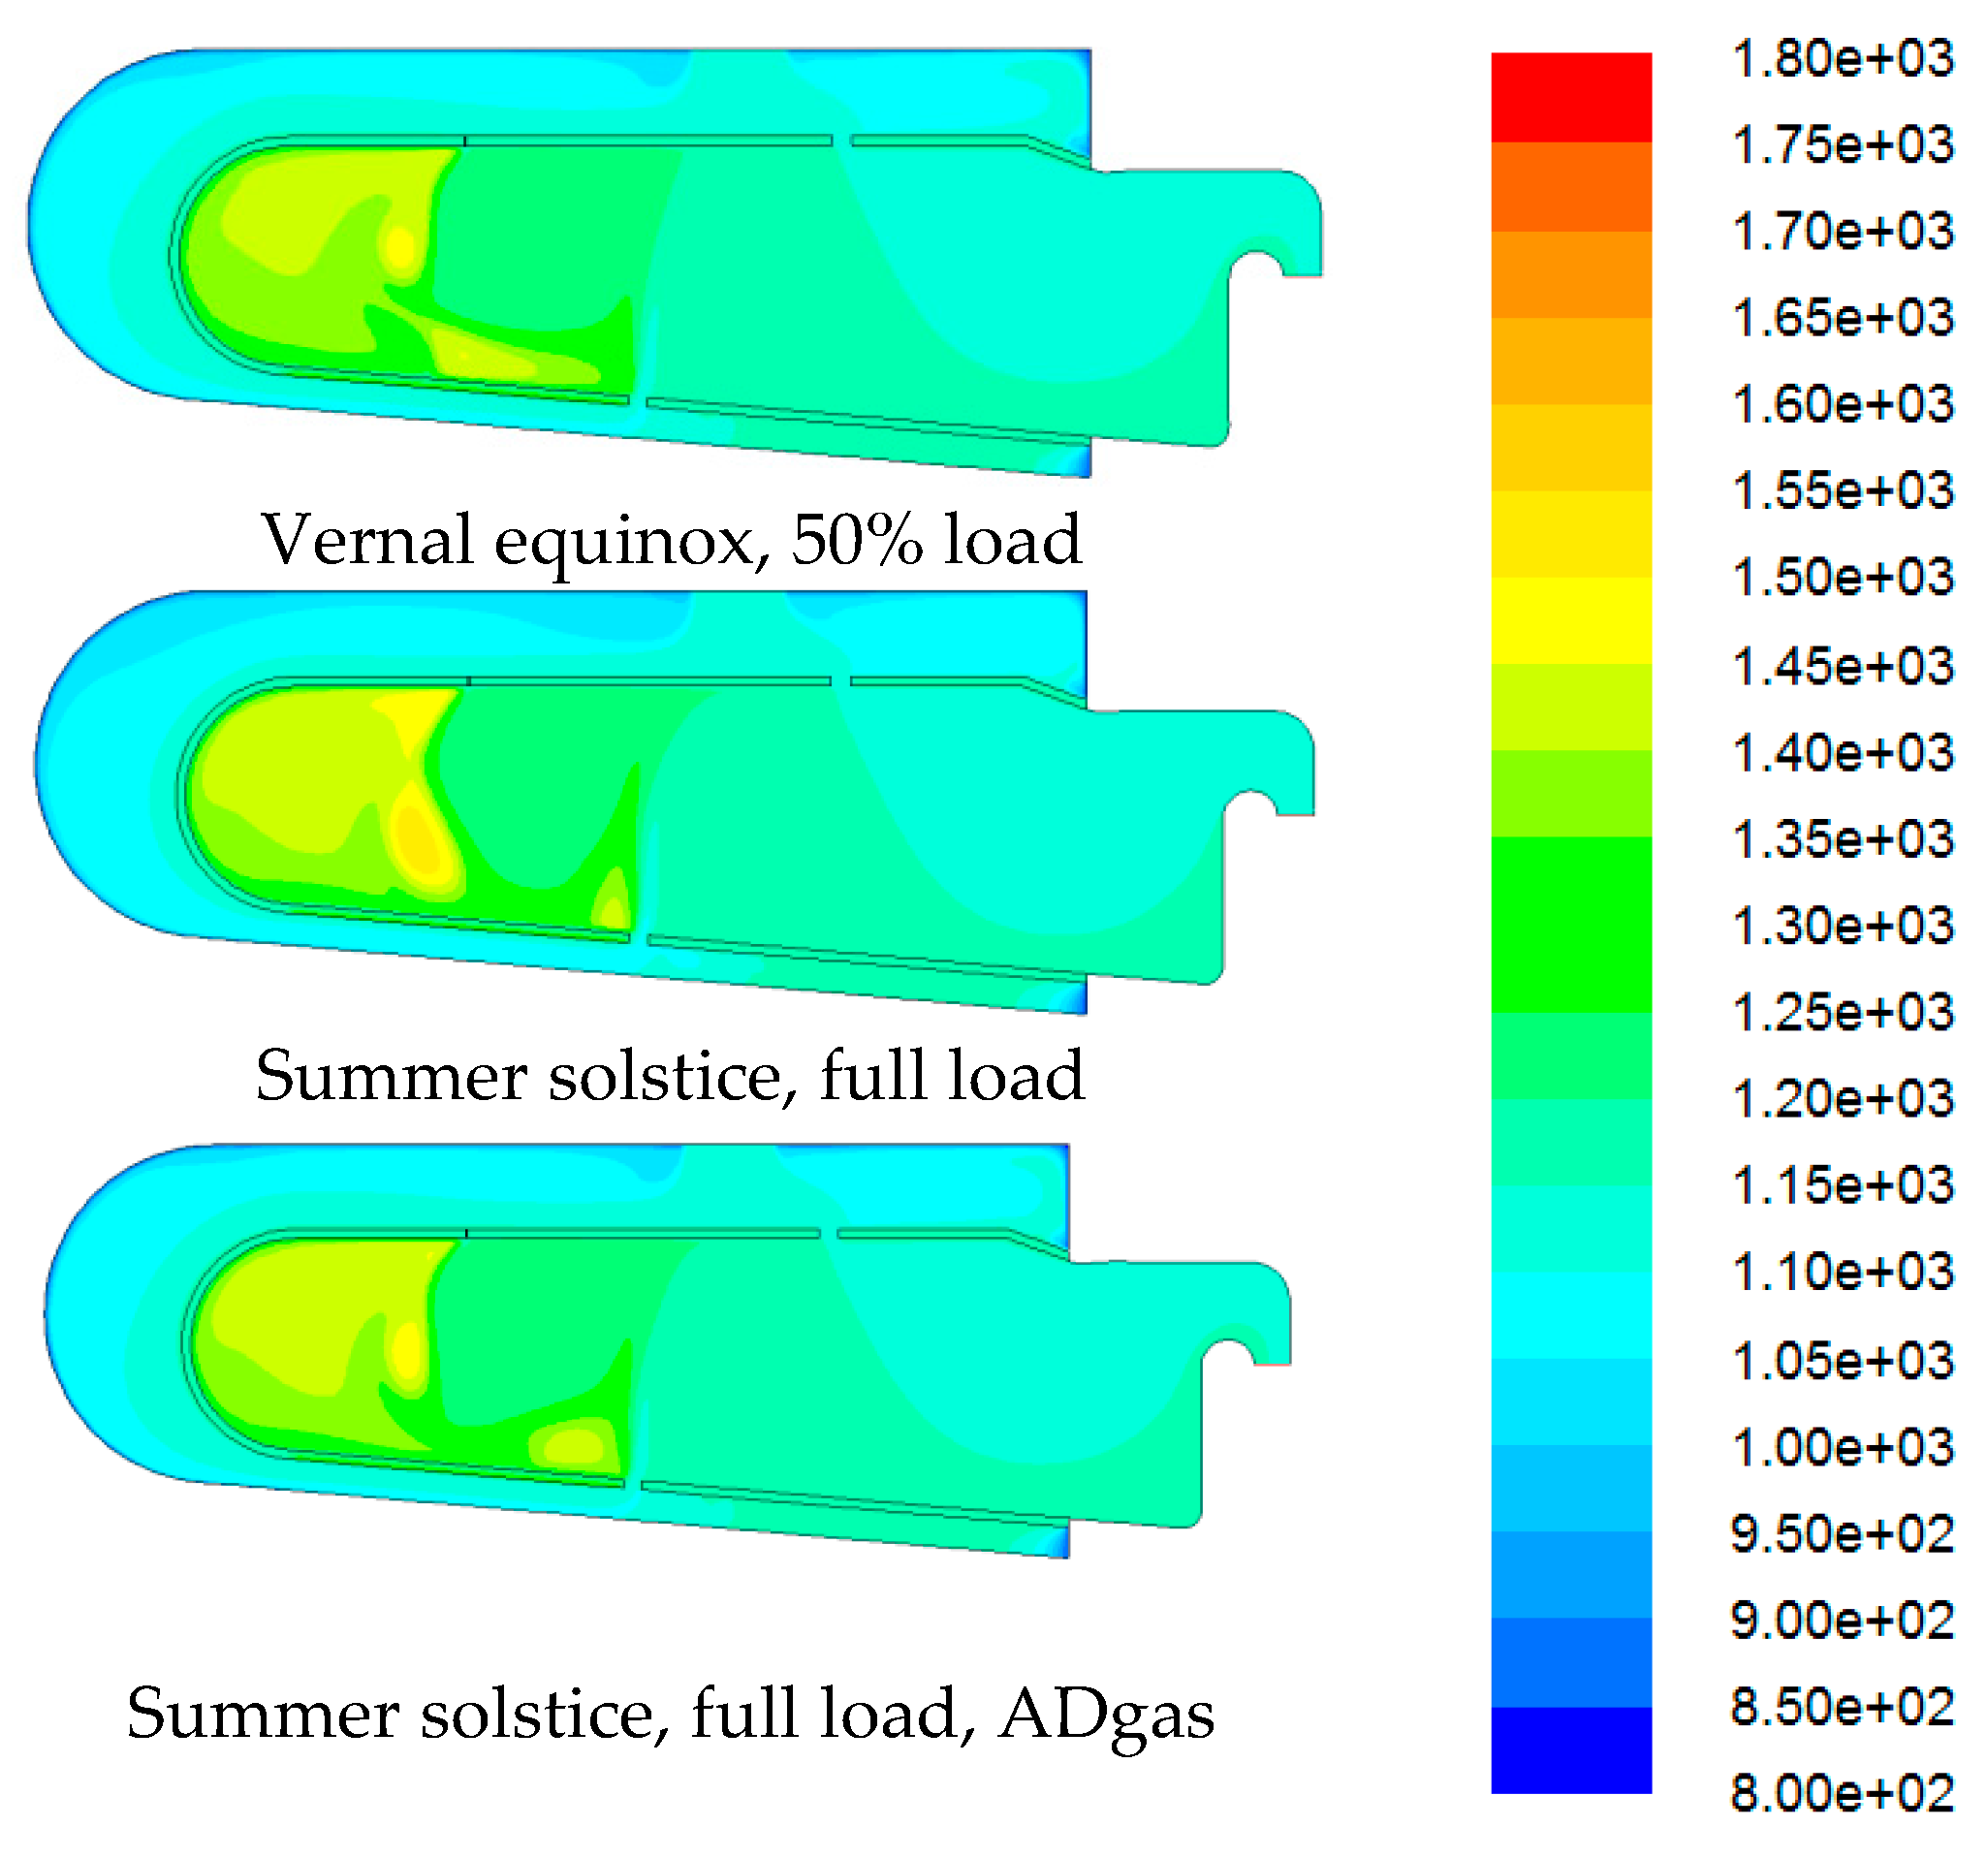
Figure 23.
Temperature distributions (K) in the MGT combustor (weak regime).
Figure 23.
Temperature distributions (K) in the MGT combustor (weak regime).
Table 1.
C30 micro gas turbine datasheet.
Table 1.
C30 micro gas turbine datasheet.
| Recuperator efficiency | 0.85 |
| Pressure ratio | 3.45 |
| Compressor polytropic efficiency | 0.78 |
| Turbine polytropic efficiency | 0.80 |
| Turbine inlet temperature (K) | 1173 |
| Net power output (kW) | 28 (+0/−1) |
| N (rpm) | 96,000 |
| Exhaust gas temperature (K) | 548 |
| Exhaust gas mass flow rate (kg/s) | 0.3 |
Table 2.
Data of the ORC bottoming plant.
Table 2.
Data of the ORC bottoming plant.
| Operating and Performance Data | C30-R134a |
|---|
| ORC mass flow (kg/s) | 0.4668 |
| ORC boiler input temperature, gas side (K) | 719.0 |
| ORC super-heating temperature (K) | 454.8 |
| ORC maximum pressure (bar) | 28.64 |
| ORC condensing pressure (bar) | 10.37 |
| ORC net power (kW) | 10.1 |
Table 3.
Temperatures (K) and operating data.
Table 3.
Temperatures (K) and operating data.
| Point | Layout Figure 1 | Layout Figure 2 |
|---|
| C30 Base | C30-R134a | C30-Solar Tower | C30-Solar Tower (ADgas) |
|---|
| 1 | 288.15 | 288.15 | 288.15 | 288.15 |
| 2 | 450.4 | 448.5 | 458.3 | 458.8 |
| 2′s | - | 683.1 | - | - |
| 2r | 866.9 | 906.1 | 869.0 | 868.7 |
| 2s | - | - | 1024.15 | 1024.20 |
| 3 | 1173.15 | 1173.15 | 1173.15 | 1173.15 |
| 4 | 939.5 | 948.6 | 938.0 | 938.6 |
| 4′r | - | 728.5 | - | - |
| 4r | 536.3 | - | 534.3 | 538.9 |
| Press. ratio | 3.48 | 3.49 | 3.62 | 3.63 |
| Air mass flow rate (kg/s) | 0.307 | 0.306 | 0.3051 | 0.3049 |
Table 4.
Performance data of the integrated solar-MGT-ORC CHP plant.
Table 4.
Performance data of the integrated solar-MGT-ORC CHP plant.
| Performance Data | Layout Figure 1 | Layout Figure 2 |
|---|
| C30 Base | C30-R134a | C30-Solar Tower | C30-Solar Tower (ADgas) |
|---|
| ORC net power (kW) | - | 10.56 | - | - |
| MGT net power (kW) | 30 | 26.84 | 26.89 | 27.02 |
| Fuel energy rate (kW) | 1184 | 103.8 | 57.97 | 59.97 |
| Net electric efficiency | 25.33 | 36.03% | 47.78% | 45.06% |
| Fuel heat rate (kJ/kWh) | 14,208 | 9991 | 7534 | 7989 |
| Net heat absorbed by solar array (kW) | - | 94.42 | 54.43 | 53.97 |
| Recovered heat from diathermic oil (kW) | - | 17.11 | - | - |
| Recovered heat from exhausts (kW) | 52.26 | 16.00 | 50.64 | 52.18 |
| Solar array reflecting area (m2) | - | 214.9 | 99.0 | 99.0 |
| Fuel energy utilization factor | 0.695 | 0.679 | >1 | >1 |
| Total energy utilization factor (TEUF) | 0.695 | 0.358 | 0.700 | 0.695 |
| CO2, kg/h (kg/kWh) | 24.37 (0.812) | 21.43 (0.573) | 11.84 (0.440) | 19.21 (0.711) |
Table 5.
Boundary condition data for the combustion simulation (base rating).
Table 5.
Boundary condition data for the combustion simulation (base rating).
| Boundary Data | Standard Operation | Solar Tower | Solar Tower, ADgas |
|---|
| Combustor inlet temp (K) | 870 | 1024 | 1024 |
| Oxidant mass flow rate (kg/s) | 0.306 | 0.3045 | 0.3040 |
| Fuel mass flow rate (kg/s) | 0.00292 | 0.00123 | 0.00312 |
| Air premix (%) | 2.45 | 2.47 | 2.49 |
| Overall equivalence ratio | 0.143 | 0.0660 | 0.0708 |
Table 6.
Combustor core and outlet properties from CFD based simulations.
Table 6.
Combustor core and outlet properties from CFD based simulations.
| Case | Core | Outlet |
|---|
| mol% | Tmax (K) | (K) | [NO] ppm | [CO] ppm | [UHC] ppm |
|---|
| Standard operation, 3D | 11.1% | 2511 | 1164 | 226 | 1200 | 2 |
| Standard operation | 10.2% | 2468 | 1173 | 86 | 3400 | 5 |
| Solar tower | 13.3% | 2480 | 1147 | 74 | 900 | 0.5 |
| Solar tower, ADgas | 12.9% | 2265 | 1150 | 7 | 1300 | 2 |
Table 7.
Off-design performance data of the integrated MGT-CHP plant.
Table 7.
Off-design performance data of the integrated MGT-CHP plant.
| Operating and Performance Data | Vernal Equinox Full Load | Vernal Equinox 50% Load | Summer Solstice Full Load | Summer Solstice Full Load (ADgas) | Winter Solstice Full Load |
|---|
| Ambient temperature, K | 288.15 | 288.15 | 301.15 | 301.15 | 280.15 |
| MGT net power (kW) | 26.89 | 14.11 | 20.75 | 21.11 | 30.69 |
| Fuel energy rate (kW) | 56.27 | 9.513 | 13.16 | 13.55 | 111.6 |
| Net heat rate (kJ/kWh) | 7534 | 2427 | 2283 | 2310 | 13.091 |
| Net heat from solar array (kW) | 54.43 | 54.43 | 81.66 | 81.66 | 10.33 |
| Recovered heat from exhausts (kW) | 50.64 | 27.33 | 47.94 | 48,20 | 52.40 |
| TEUF | 0.700 | 0.648 | 0.724 | 0.728 | 0.682 |
| Turbine outlet temperature, (K) | 938.0 | 1013.2 | 967.7 | 965.7 | 942.6 |
| Air temperature at combustor inlet (K) | 1024.15 | 1138.6 | 1137.0 | 1137.1 | 898.9 |
| Pressure ratio | 3.62 | 2.48 | 3.16 | 3.17 | 3.59 |
| 0.99 | 0.71 | 0.93 | 0.92 | 1.08 |
Table 8.
Boundary conditions for the combustor off-design (Natural Gas (NG) fuelling, numbers in brackets refer to ADgas fuelling).
Table 8.
Boundary conditions for the combustor off-design (Natural Gas (NG) fuelling, numbers in brackets refer to ADgas fuelling).
| Boundary Data | Vernal Equinox Full Load | Vernal Equinox 50% Load | Summer Solstice Full Load | Winter Solstice Full Load |
|---|
| Combustor outlet pressure (bar) | 3.820 | 2.235 | 2.821 (2.853) | 3.236 |
| Combustor inlet temperature (K) | 1024.1 | 1138.6 | 1137.0 (1137.1) | 898.9 |
| Oxidant mass flow rate (kg/s) | 0.3045 | 0.218 | 0.286 (0.285) | 0.329 |
| Fuel mass flow rate (kg/s) | 0.00123 | 0.000206 | 0.000284 (0.000717) | 0.00241 |
Table 9.
Off-design performance of the MGT combustor (NG fuelling, numbers in brackets refer to ADgas fuelling).
Table 9.
Off-design performance of the MGT combustor (NG fuelling, numbers in brackets refer to ADgas fuelling).
| Results | Vernal Equinox Full Load | Vernal Equinox 50% Load | Summer Solstice Full Load | Winter Solstice Full Load |
|---|
| Outlet temperature (K) | 1147 (1150) | 1149 | 1151 (1149) | 1122 |
| Unburned CH4 (ppm) | 0.5 (2) | 185 | 95 (4300) | 25 |
| CO (ppm) | 900 (1300) | 470 | 408 (462) | 2400 |
| NOx (ppm) | 74 (7) | <1 | <1 | 79 |
| Fuel oxidation efficiency | 0.997 (0.994) | 0.870 | 0.888 (0.882) | 0.994 |


