1. Introduction
Voltage sags (dips) are defined as a short duration (half-period to 1 min) reduction of phase voltages, where limits of the remaining voltages are usually between 10% and 90% of the nominal voltage [
1,
2]. The well-known and widely accepted classification [
3] divides voltage sag events into seven types (designated with letters A–G), and this grouping is used in this paper. The corresponding International Electro-technical Commission (IEC) standards [
4,
5] and International Council on Large Electric Systems (CIGRE)/International Conference on Electricity Distribution (CIRED)/International Union for Electricity applications (UIE) joint working group recommendations [
6] for equipment immunity assessment on power supply disturbances suggest unbalanced (designated as types I, II) and balanced (type III) voltage sags used for three-phase apparatus testing. Basic voltage sag characteristics regarding equipment immunity evaluation are sag type, duration, remaining voltage magnitude, and phase angle jump. Depending on the equipment under test (EUT), other parameters involved, including point-on-wave of dip initiation and ending [
7], rate of voltage change, and dip shape [
8], are of great importance.
Laboratory and in-field evidence confirmed significant voltage sag sensitivity of frequency converters (FCs), which manifests through production failure and a notable financial loss, especially in continuous process industry applications [
9]. Such sensitivity has been examined in numerous studies and research papers [
8,
10,
11,
12,
13], where the basic testing criteria was drive tripping (pass/fail). In the experimental study [
8], adjustable speed drive (ASD) sensitivity on symmetrical and unsymmetrical voltage sags was confirmed, where the sag type, remaining voltage magnitude, and motor load primarily influenced the drive susceptibility. Some voltage sags can provoke ASD performance degradation: symmetrical ones cause available torque reduction [
10,
11], while unsymmetrical ones predominantly increase DC-link voltage ripple. Unsymmetrical voltage sag effects on the torque and speed of ASDs were analytically examined in [
12,
13], taking into account a simple V/Hz control scheme. Reference [
14] presents some experimental results referring to voltage sag influence and recommends decreasing the usual limits for under-voltage protection settings aimed to overcome ASD fault. Simulation and experimental study [
15] shows that torque ripple appears in vector controlled drives in the case of unsymmetrical voltage sags and unbalances, along with maximum available torque reduction.
Researches applying only software modification of the existing control algorithm instead of additional hardware components [
16] for EUT voltage immunity improvement are of great importance, especially for cost saving. Comprehensive motor mechanical, iron, and cooper losses minimization [
17] in vector controlled ASD, only with control algorithm modification, enlarged the maximum duration of the ride-through in FC approximately by 1/3 compared to conventional methods. Simulation studies [
8] and [
11] referring to vector controlled ASDs present less sensitivity on voltage dips and demonstrate that field weakening can improve its response to voltage disturbance. Evidence on direct torque controlled (DTC) ASDs sensitivity rarely exists, so this article intends to contribute to experimental fact-finding, considering these high-performance drives.
This paper proposes a new modified control algorithm, effective in most common voltage sag events connected with a low voltage (LV) distribution network, which provides torque capacity utilization for undisturbed motor operation. Experimental evaluation has confirmed the proposed method as very convenient for DTC controlled ASDs, exactly for momentary flux response. Except for this, analytical relations and subsequent testing make recommendations to acknowledge voltage sag effects in the selection of nominal working speed.
The rest of the paper is organized as follows. The second section briefly describes the consequences of voltage sags on DTC controlled ASDs with emphasis on the capability to overcome DC-voltage reduction. The proposed scheme for voltage sag override is described in the following section, while the fourth section presents the extensive results of laboratory testing and performance verification. At the end, some conclusions and recommendations are drawn regarding the voltage sag sensitivity reduction.
2. Voltage Sag Effects on DTC Induction Motor ASD
The evaluation of EUT performances taken under the voltage sag effects in accordance with IEC 61000-4-11 and IEC 61000-4-34 classifies the achieved results into four categories in terms of function loss or performance degradation, wherein the highest level of equipment immunity can be expected in the first category. Statistical data referring to industrial and distribution networks [
6,
18,
19] emphasize the fact that single-phase voltage sags are most common. In addition, the majority of low-voltage level sags last up to ∆
t = 1 s, at which the remaining voltage level (
h) falls within the threshold of 70% and 90% of the rated value. Consideration of the voltage events ranged within the above-mentioned limits, with the intention to avoid ASD undesirable trip and performance violation in order to prevent production losses, is of particular importance.
The majority of modern low voltage ASDs with induction motor (IM) are supplied from FCs with two-stage power conversion. The power part of an FC usually consists of an input three-phase diode bridge rectifier, a DC-link with choke (L), an electrolytic capacitor (C) (designated as LC filter), and an output inverter with fully controlled IGBT (Insulated Gate Bipolar Transistor) switches. The control part consists of a digital signal processor (DSP) interfaced with digital and analogue signals from sensors and can be powered from the DC-link voltage or the external (back-up) source. Frequency converter protective functions are very sophisticated and complex and are aimed to prevent damage to the power electronic components and motors. The primary protective functions are DC-link under-voltage and output over-current protection that can have gradually stated limits for warning and trip function.
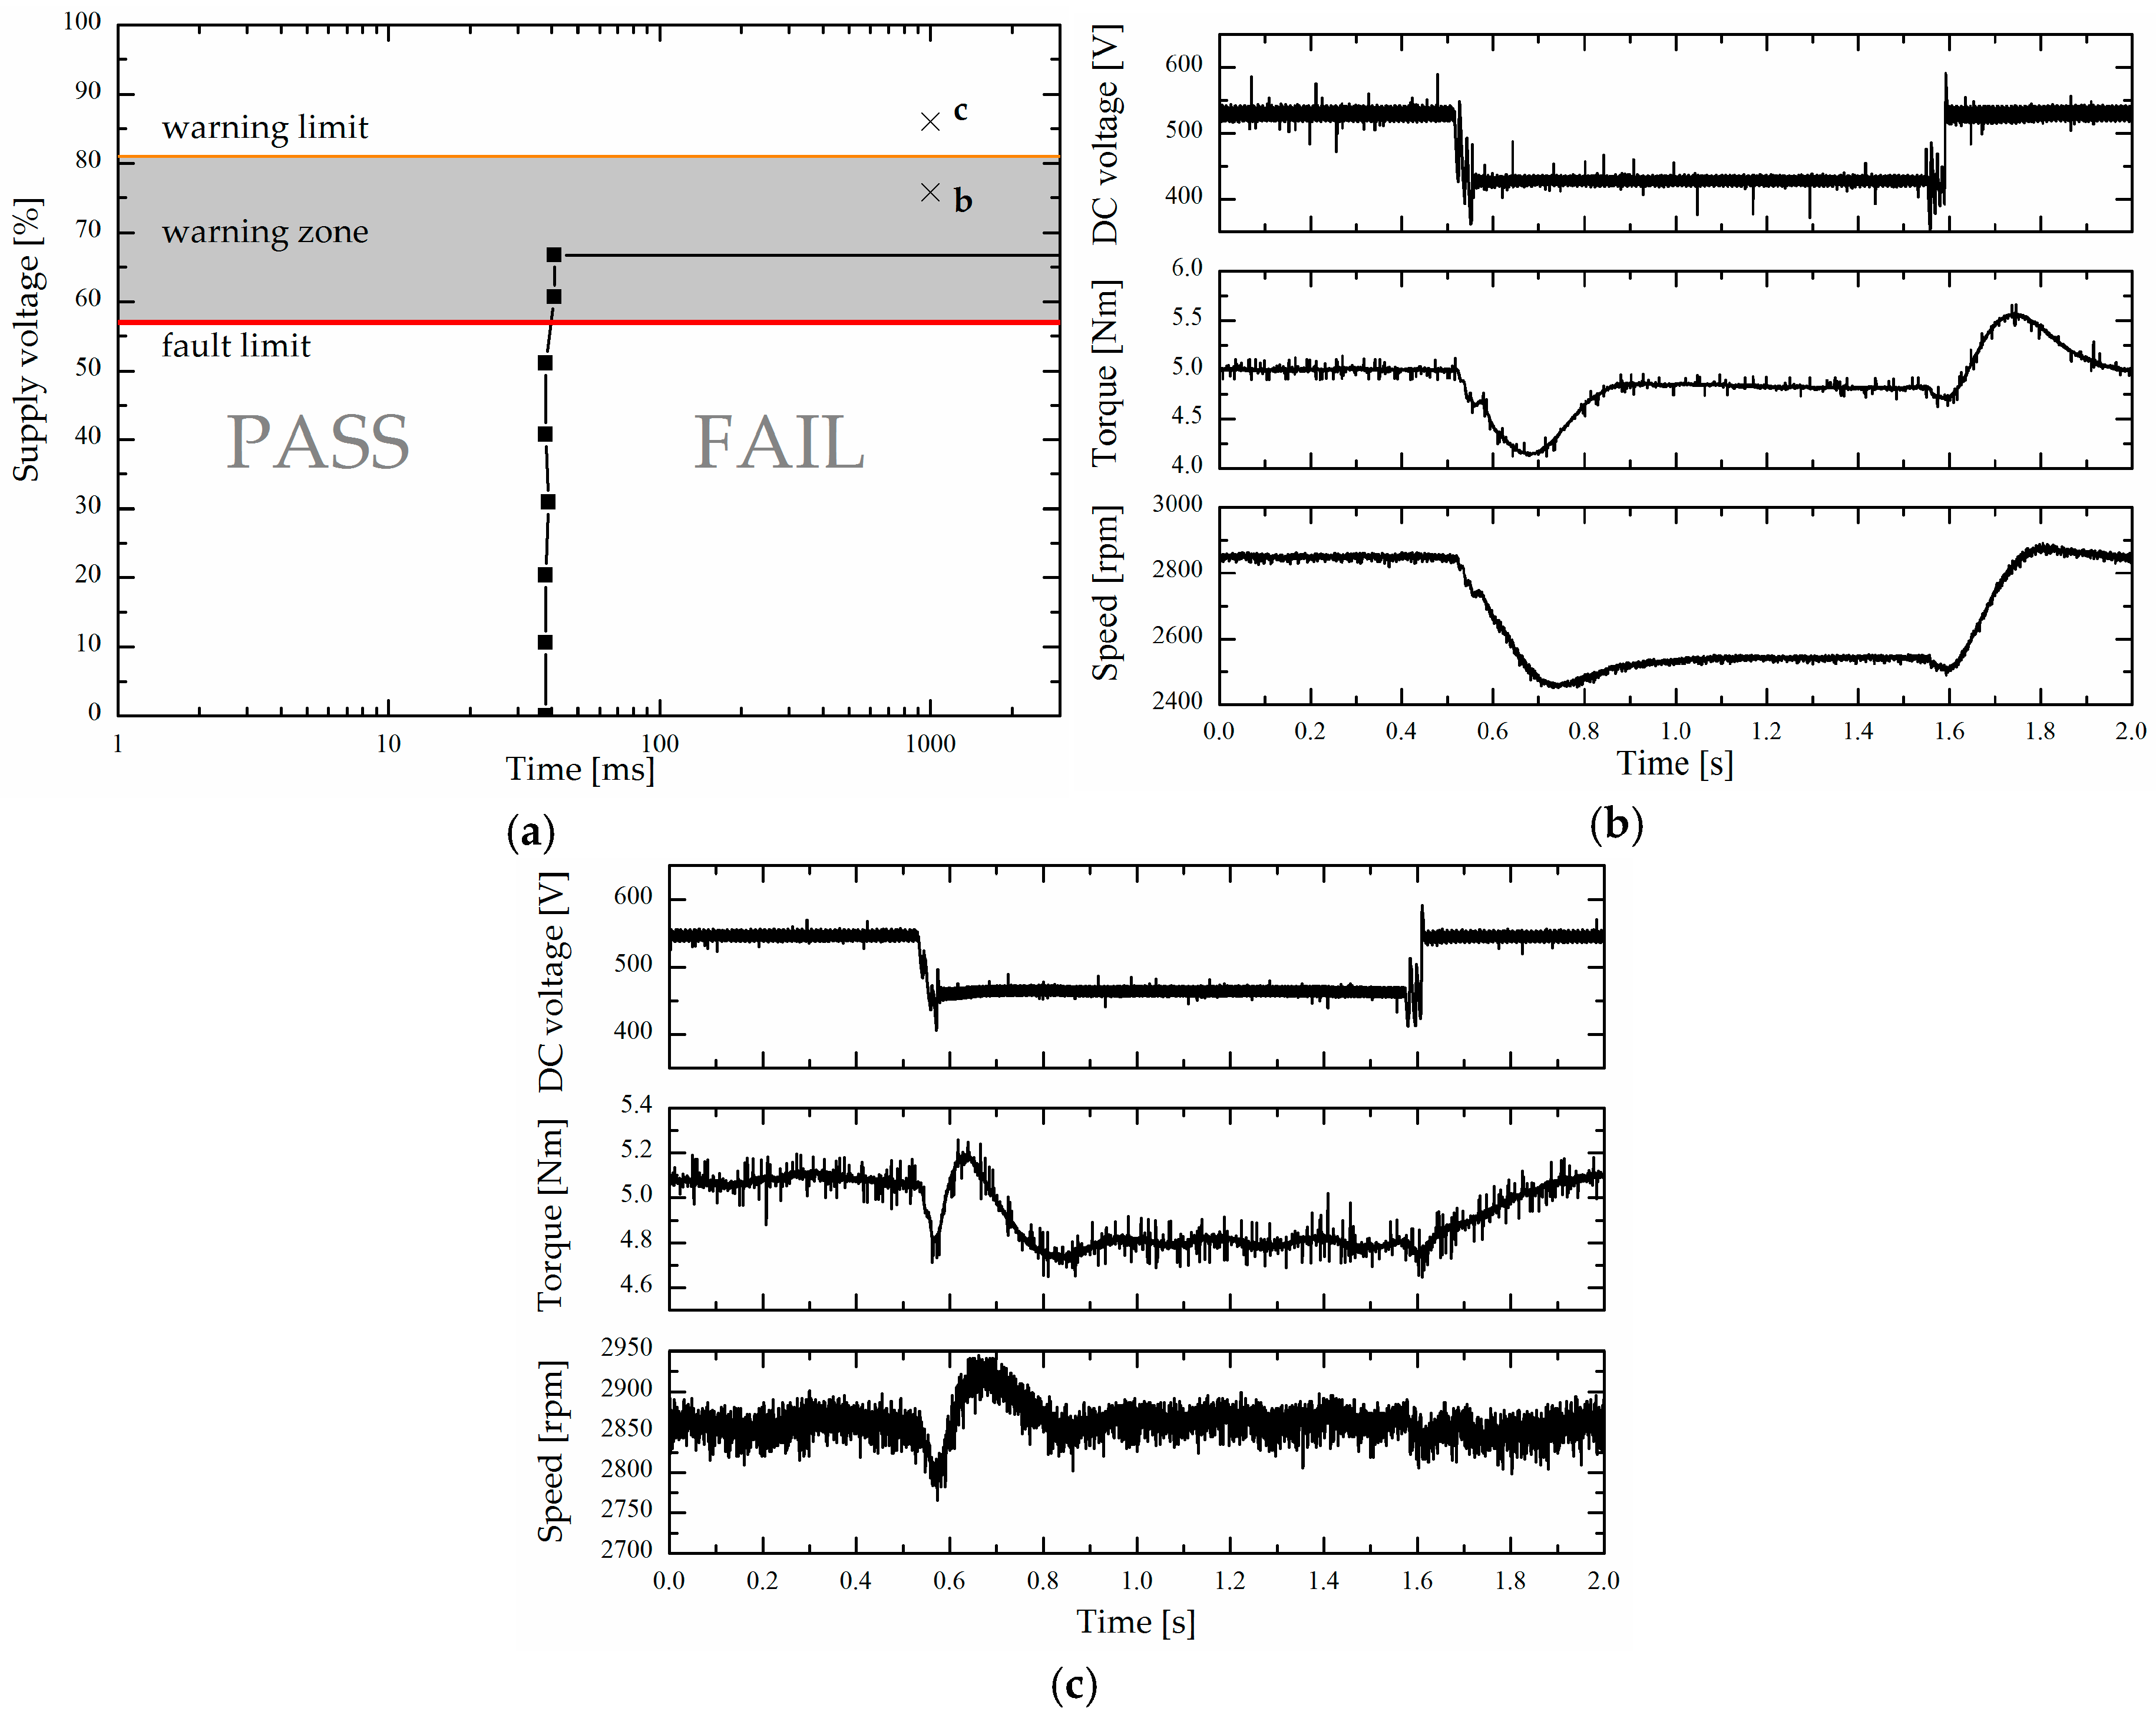
The experimentally obtained DTC controlled ASD trip curve for type A voltage dip is given in
Figure 1a. This industrial high performance FC has a gradual under-voltage protection response; the warning limit is set at 85% and the fault limit was adjusted at 60% of the DC-link reference voltage. The voltage sag sensitivity curve from
Figure 1a shows the existence of under-voltage trip only, without overcurrent faults. Some faults are indicated in the warning zone (above fault limit) because of the under-voltage trip initiation at voltage dip recovery, with an additional voltage drop caused by high input charging currents. The evaluated ASD did not exhibit any sensitivity at single-phase (type B) voltage sags and two-phase voltage sags originated from B type, transferred over transformer windings connection Dy (Dd), and with 1/3 ≤
h ≤ 1. In addition to this, the recorded curve (
Figure 1a) does not provide information about possible performance degradation (torque and speed deviation and ripple) in the pass area. Motor speed and torque variation under nominal load and during DC-voltage reduction caused by sag type A with Δ
t ≈ 1 s and
h = 0.75 (marked as point
b in
Figure 1a) are shown in
Figure 1b. Voltage sag with a magnitude above the warning limit (operation point
c) leads to a minor temporary speed deviation, as shown in
Figure 1c.
FC tripping, in case of DC-link voltage reduction, is bounded with the value of DC-under-voltage protection (
Vdcmin), which is usually out of user settings availability. Whether available motor torque reduction shall appear with a consequent speed drop, in cases when the DC-voltage
vdc across the filter capacitor is greater than the value of
Vdcmin, is analysed in [
15]. The following analysis, which is applicable to DTC controlled drives, is useful to alleviate this effect and to determine a possible control algorithm modification in the case of power disturbance.
An equivalent two-phase model of a symmetrical squirrel cage IM, represented in the synchronously rotating reference frame in terms of space vectors (denoted with an overbar) [
20], is:
where
denotes the stator voltage space vector;
and
are the stator and rotor current space vectors, respectively;
and
are the stator and rotor flux space vectors, respectively;
and
are the stator and rotor total inductances;
is the number of pole pairs;
,
,
are the synchronous, rotor electrical, and mechanical angular velocities, respectively; and
and
are the electromagnetic and load torques, respectively. Other parameters are explained in
Table 1.
Using amplitudes of converter maximal output current (
Imax) and voltage (
Vmax), the appropriate motor stator
dq- variables need to fulfil the following limitations:
where (7) and (8) are inequalities of current and voltage limits, respectively.
Generally, voltage
vdc can be presented as a sum of pure DC-component
Vdc and higher harmonic components with amplitudes
Vk, angular frequency
ωk, and relevant phase displacement
θk:
During symmetrical input power supply, in addition to dominant average value component
Vdc, sixth higher harmonics exist with amplitudes determined by the values of DC-capacitor
Cf and DC-link load
pdc. In addition to this, additional harmonics can appear at unsymmetrical input voltages that exist in the cases of B, C, and D voltage sag types. Oscillatory components commonly appear as a second and fourth harmonics of input angular frequency
ωi, where amplitudes depend on voltage type and
pdc [
15], [
12]. Therefore, with a reasonable accuracy, in case of input voltage disturbance, voltage
vdc can be presented as follows:
where the fourth harmonic of DC-voltage is neglected because of the low amplitude.
In a symmetrical voltage reduction case, average voltage Vdc is almost directly proportional to the value of the remaining voltage (h), whilst, in an unsymmetrical case, it depends on the maximal value of line-to-line voltages. The type of modulation by which DC-voltage (10) is transformed into stator three-phase voltages is important for the operation of IM, which in turn is connected to inverter output terminals.
Generally, modulation signals in carrier-based (CB) pulse width modulation (PWM) can be presented as in [
21]:
where
m is the modulation index,
ωe is the inverter fundamental output angular frequency (which determines synchronous angular velocity of
dq- coordinate frame),
ϕi represents voltage angular displacement (
ϕi = {0, −2π/3, 2π/3}) of the output phases (
i =
a,
b,
c), and
m0(
t) represents the zero-sequence signal (and also provides transformation space-vector (SV) PWM into CB PWM). Phase angle
ϕ corresponds to the initial phase voltage angle related to the
d-axis and its value can be arbitrary chosen.
Motor stator
dq- voltages can be calculated using (10) and (11):
where the angle
θ2 respects the point-on-wave of voltage sag initiation.
Lastly, Equations (12a) and (12b) point out that the DC-link voltage disturbance is directly reflected on the motor stator voltages and consequently on the remaining motor variables, currents and torque.
A DTC scheme is commonly realized using the two-phase model of IM in a stationary
αβ coordinate frame for motor control and variables estimation. Inner control loops in DTC drives are designed to keep stator flux
and motor torque
Te at the reference values (denoted by * in superscript). Speed is regulated by an additional proportional-integral (PI) controller, the output of which is fed to the torque controller (more details about the used DTC algorithms will be presented in the following section). In order to simplify voltage sag influence analysis, an additional ‘observing’ synchronously rotating coordinate frame (
dq) is introduced with the
d-axis aligned with the rotor flux vector. In the speed range below nominal, the flux controller keeps the stator flux amplitude at a constant value, which can be written in terms of
dq-components as:
The reference flux amplitude in base speed region is adjusted at the rated value or at any arbitrary value which is convenient for maximum torque or ASD efficiency.
In steady-state regimes, derivatives of the system states variables in (1) and (2) are equal to zero, and, with regard to the adopted ‘observing’ coordinate system, Equation (13) can be rewritten as:
with
σ = 1 −
LsLr/
M2.
Based on the previous equation, the equivalent
d-axis current for constant stator flux maintenance is:
The inequality for the voltage limit (8) in terms of
ids and
iqs can be rewritten as:
where the coefficients are:
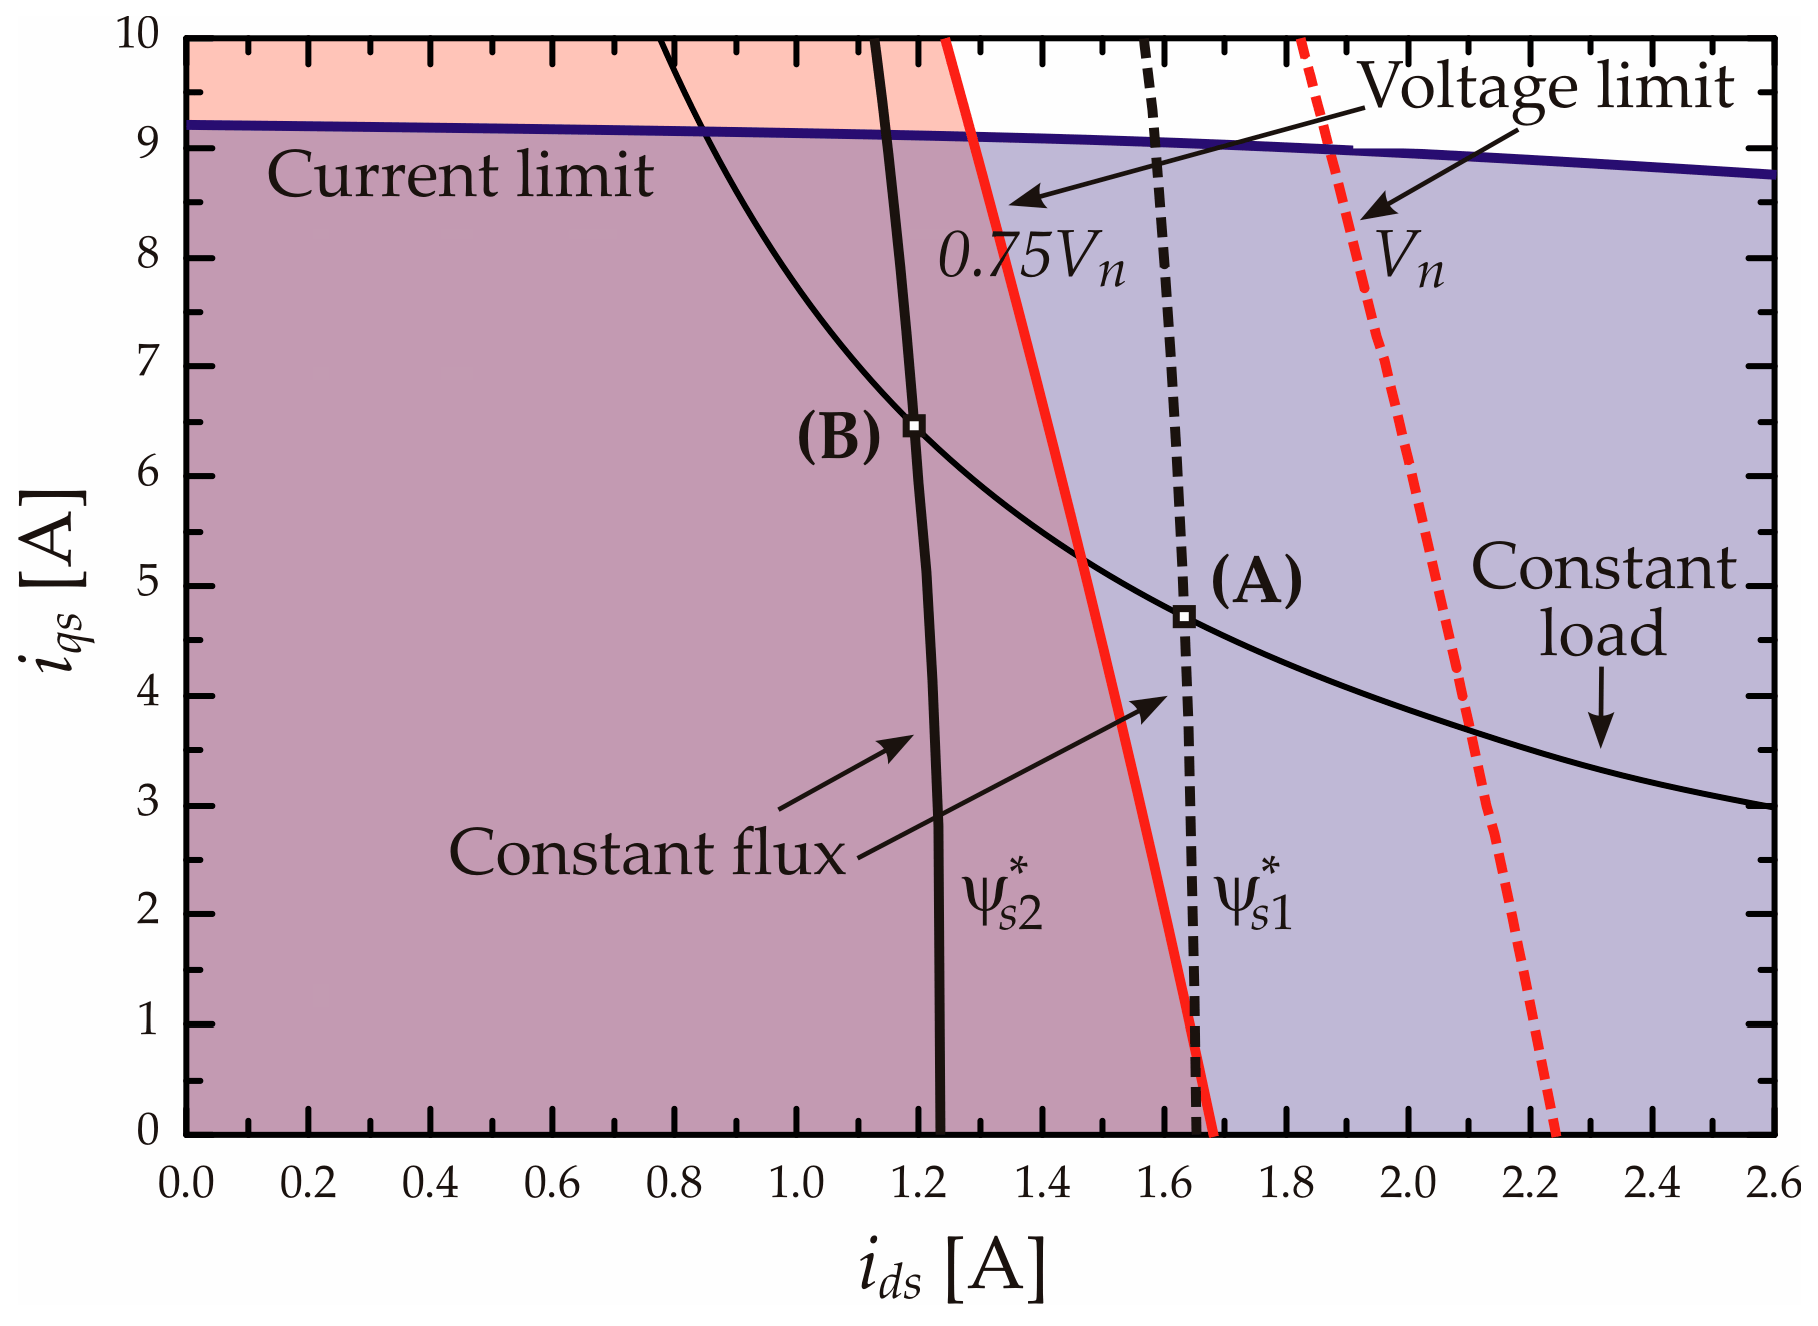
The inequalities that bound the operating ranges of DTC ASD are illustrated in
Figure 2: the current limit (7) for the given maximal current
Imax of frequency converter FC1 (
Table 2), the voltage limit (16), and constant flux (15) curves are drawn for rated and reduced (75% of nominal
Vn) stator voltages.
In order to analyse ASD behaviour under voltage dip, IM torque-speed characteristics are constructed for speed values under nominal (base speed range). The adopted coordinate system enabled calculation of IM electromagnetic torque, taking into consideration Equation (15) as:
where
c1 = (3/2)
Pp M2/
Lr.
Combining (15) and (16), the value of the
q-axis current
iqs(
ω,
Vmax,
) can be calculated for different IM rotor speed values
ω under specified stator flux value
, having in mind that:
Finally, by inserting this current value
iqs(
ω,
Vmax,
) into Equation (18), the maximum available torque at given voltage limit
Vmax can be calculated as:
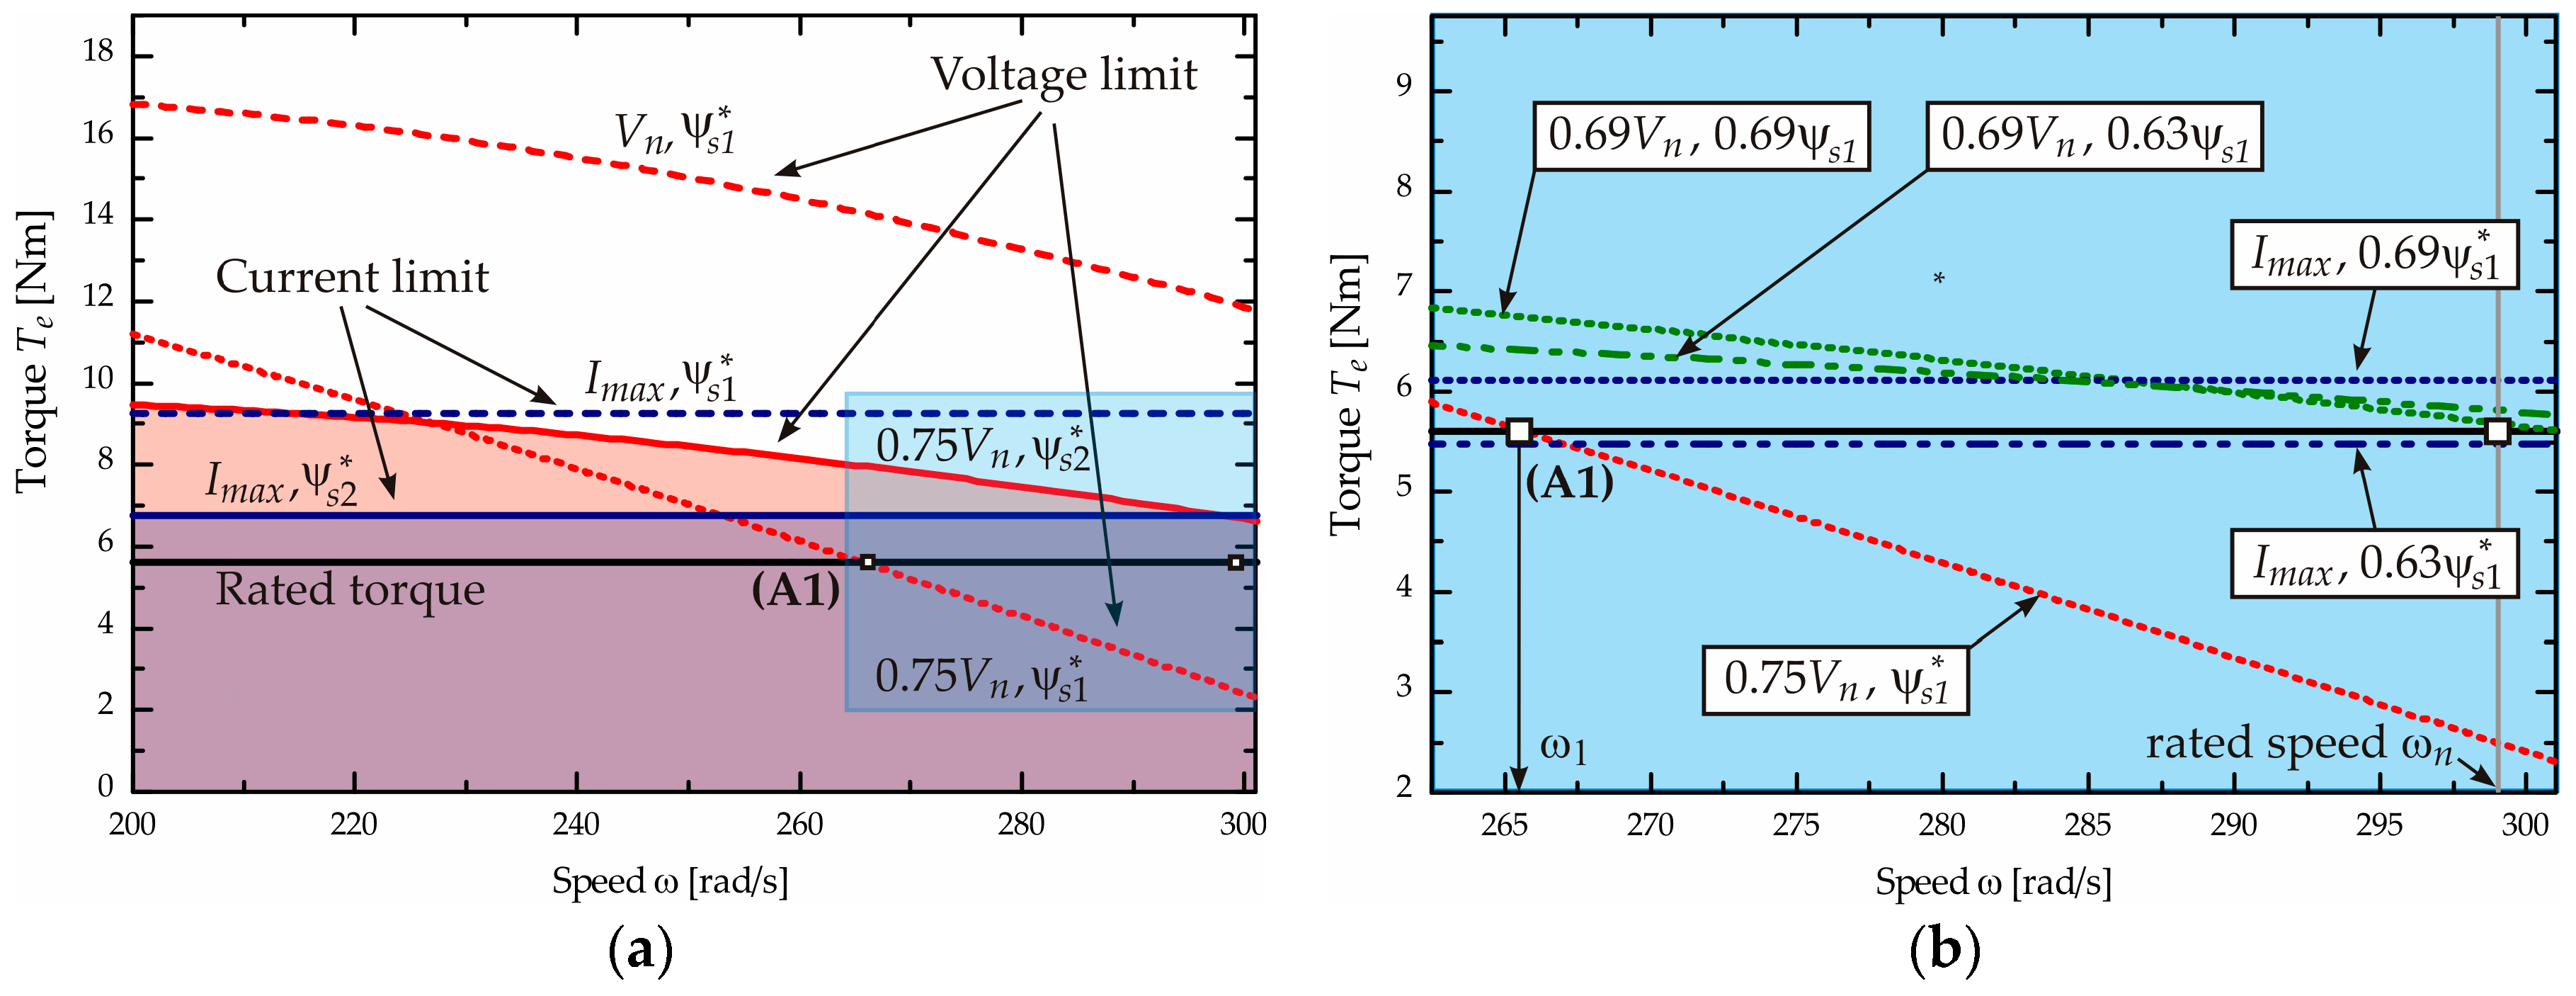
The last equation is impractical for analytical presentation, and numerical solving is used to establish a torque-speed curve close to the nominal speed, as shown in
Figure 3a.
Considering constant flux Equation (15), the motor torque value corresponding to the above-mentioned current limit (7) can be found as:
This equation is also presented in
Figure 3a as a straight line, and it only depends on stator flux reference value, motor inductances, and maximum value of converter output current. In case of constant stator flux, the maximal available torque of DTC controlled IM at voltage and current boundaries can be calculated using (20) and (21).
3. Improved Scheme for Ride-Through
The consequences of voltage dip effects on DTC controlled ASD were presented and analytically explained in the previous section. The presented formulas and diagrams provide an estimation of override possibilities for a DTC drive in order to keep the desired dynamic and steady-state features, which imply reference speed (torque) preservation in the entire speed range.
In
Figure 2, the steady-state operating point (marked with A) is located in the intersection of the rated load curve and the curve of constant flux value
= 0.749 Vs. In case of DC-link voltage dropping to the level of 75% of the nominal value, this operating point is out of working conditions bounded with voltage limit (16) for the remaining voltage. Considering the torque-speed curves from
Figure 3a, there is a visually notable significant lowering of the available motor torque on the reduced stator voltage. As a result of this, the drop in speed will persist on the new operation point designated with A1. Regarding this, it is necessary to readjust the stator flux to a new lowered value. For stator flux setting on the reduced value
= 0.562 Vs, a new steady-state operating point B will be established by crossing the constant load and constant flux curves, as shown in
Figure 2.
From the diagram shown in
Figure 3a, the following remarks regarding the possibilities of voltage sag influence override can be made:
With the help of flux weakening, a satisfactory torque amount can be provided for a wide range of sags with voltage reduction. Assuming that
Vdcmin is available for adjustment, by equating (20) with the rated electromagnetic torque, the value of the minimal reduced stator voltage can be calculated, under the condition that the flux weakening algorithm is still effective to provide sufficient torque. For IM data given in
Table 1, this minimum stator voltage is calculated as
Vsmin = 0.69
Vn, and the resulting torque-speed curve is shown in
Figure 3b. In the same figure, the curves of the rated torque and current-torque-limit from (21) are also presented, where the converter maximum current
Imax acting as limitation of maximum applicable torque can be noticed in case of
ψs* = 0.63
ψs1*. This result reveals the limitation of the proposed flux weakening method in terms of the reduction of under-voltage protection value, which simultaneously needs an increase of output inverter current capacity.
The selection of appropriate ASD operation speed in order to prevent a drop in speed is also an effective method. For the given under-voltage protection value
Vdcmin, a torque-speed curve (20) is drawn. The intersection of this curve and the motor rated load torque determines reduced speed
ω1. For motor IM1 and laboratory frequency converter FC1 (
Table 2), this critical speed is obtained at a value equal to 265 rad/s and under which a drop in speed does not appear for all disturbances without initiating under-voltage protection. This recommendation is especially suitable for high-performance ASDs, which do not permit a single minor speed deviation where an FC operates with
Vdcmin default value, which is unavailable for user settings.
To verify all presented conclusions, DTC control algorithms for IM with two different schemes are realized: the first one with classical hysteresis controllers and the second one with linear PI controllers. In its basic version [
22], DTC controlled ASDs use hysteresis comparators for torque and flux control based on which output switching table values are selected, and appropriate discrete voltage vectors are applied at a variable switching frequency. This scheme provides very fast responses at reference change with significant torque and motor current ripple. The previous problem can be solved in different ways [
23,
24,
25]; switching table modification, using multilevel hysteresis comparators, or duty ratio modulated DTC. This paper presents a simple modified scheme, which uses twelve-sector division (C12DTC) instead of the usual
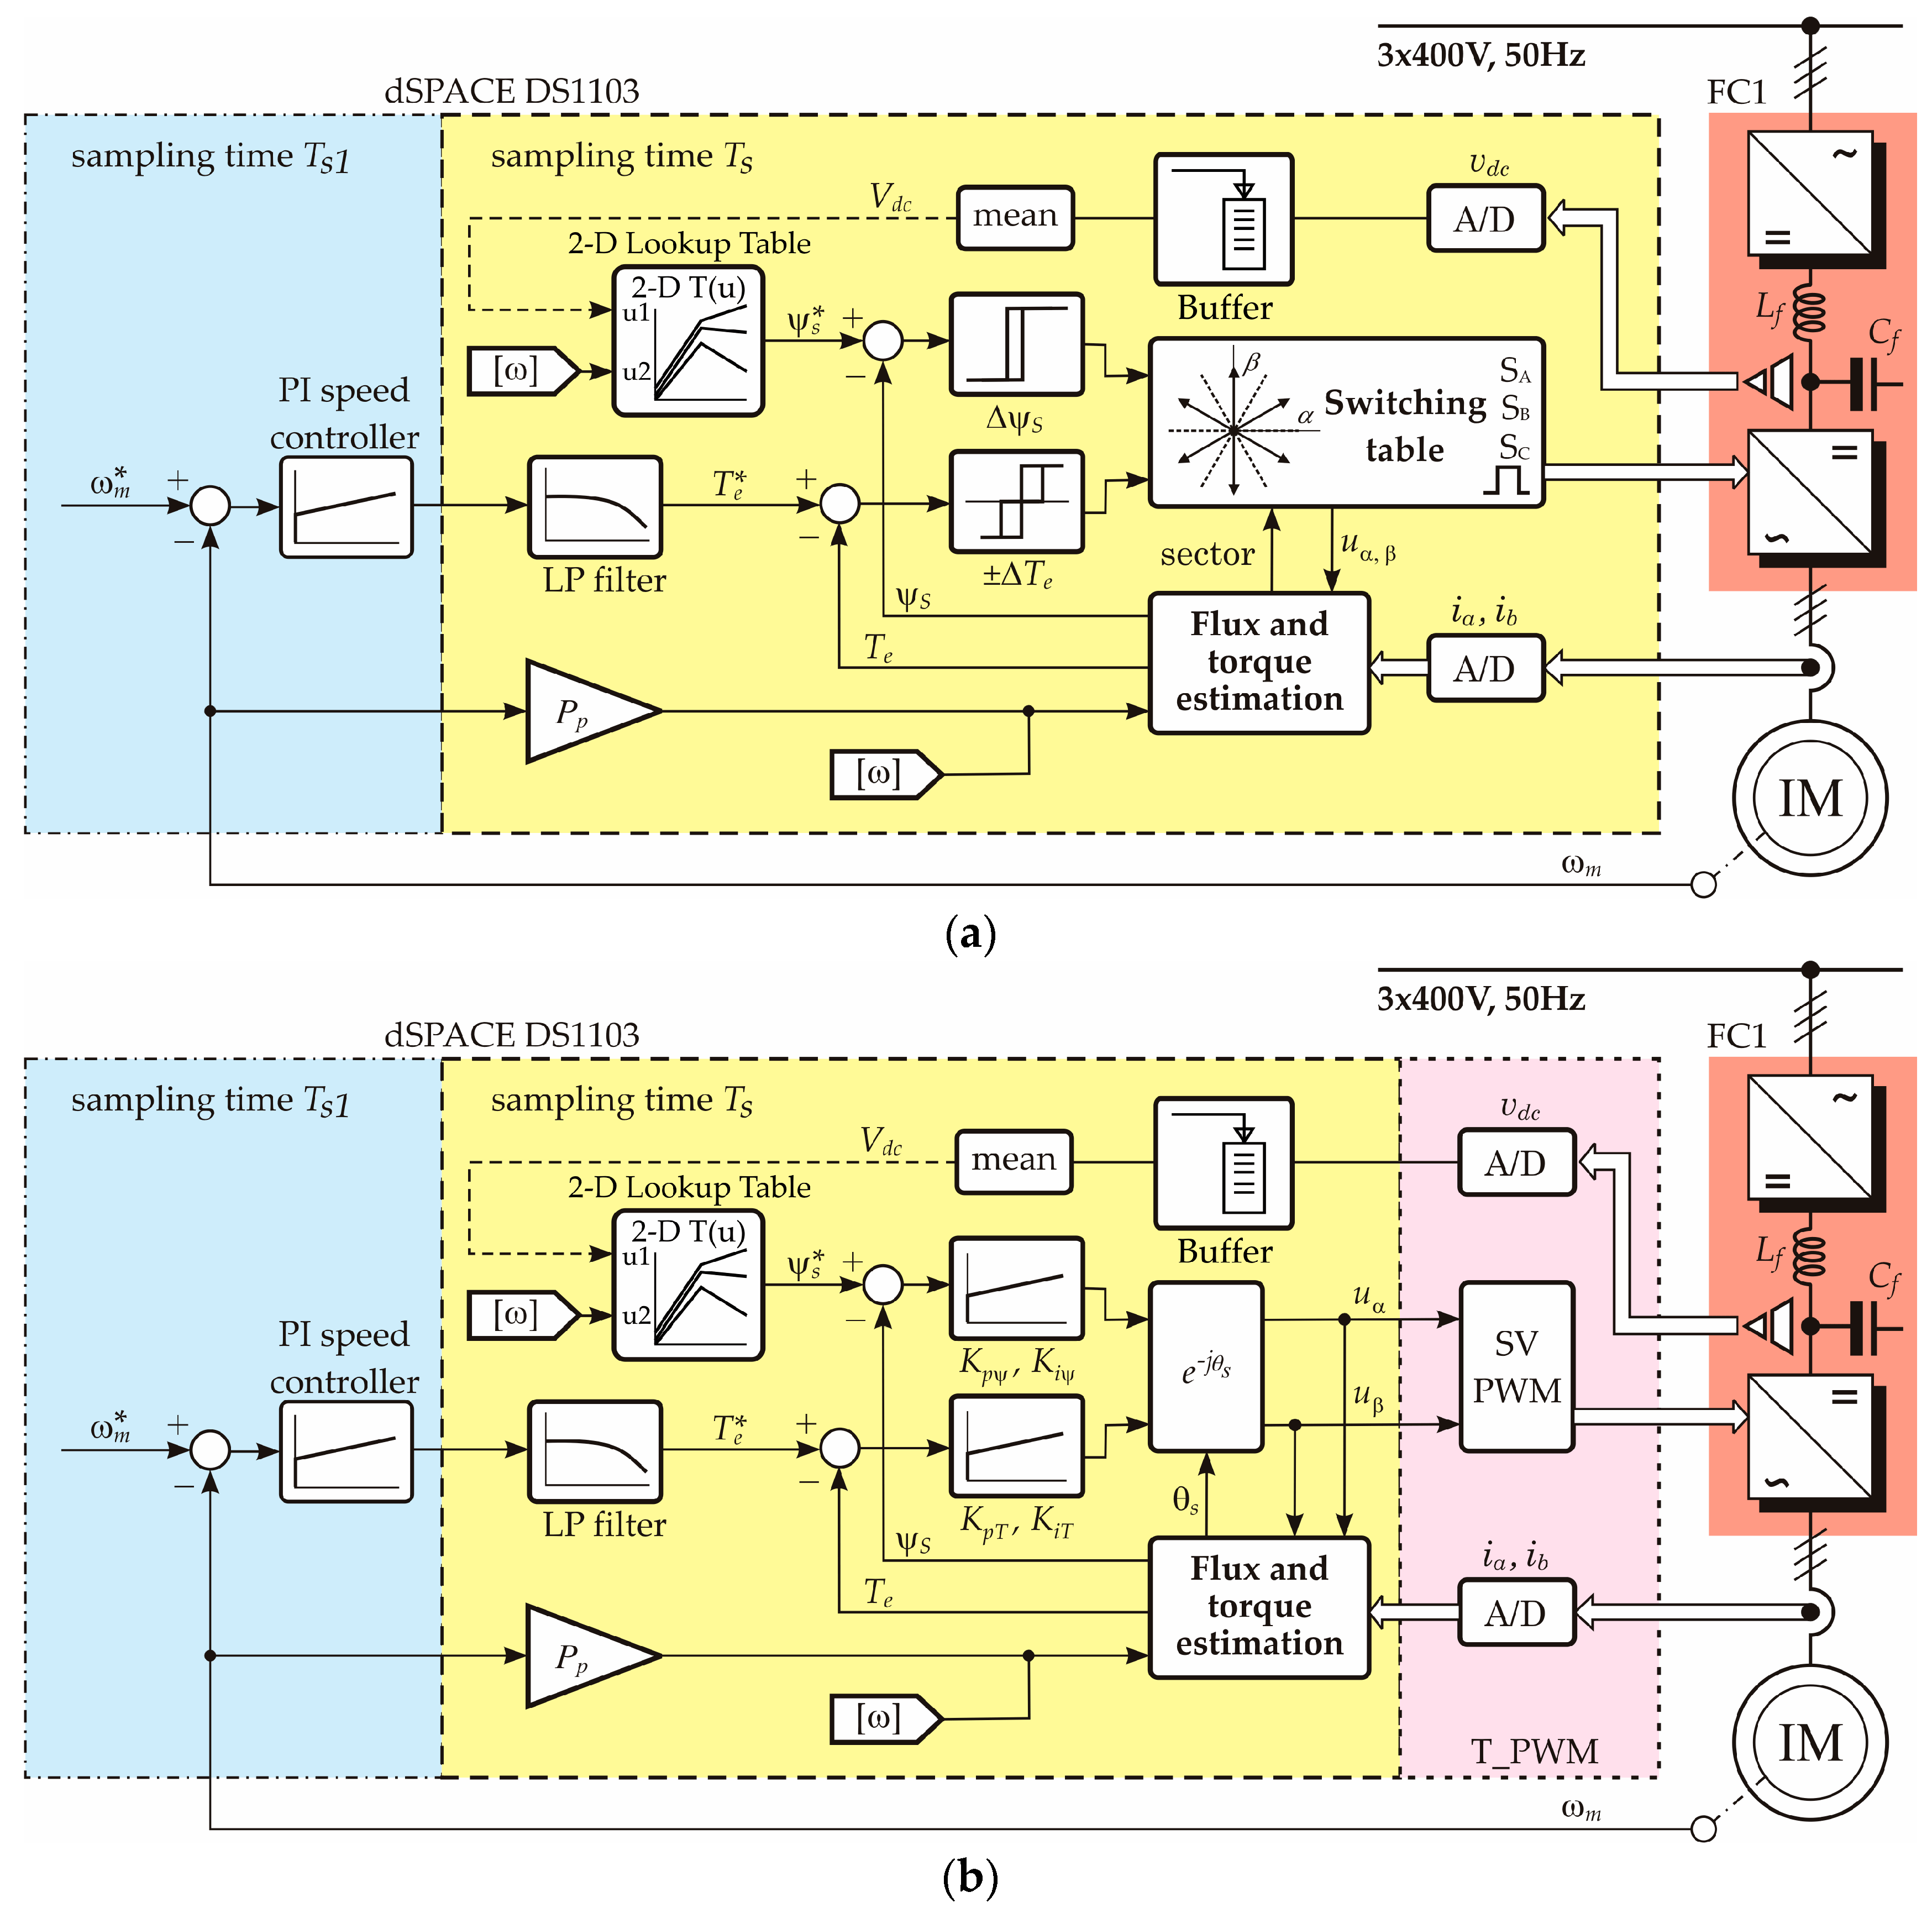
αβ plane division into six sectors.
Figure 4a consists of a diagram of the scheme for implementation in a rapid prototyping system, based on a dSpace DS1103 controller [
26] and with Matlab/Simulink R2012b software for control algorithm development.
Schemes with constant switching frequencies most often use space-vector pulse width modulation (SVPWM), wherein, instead of hysteresis controllers, linear (PI) or non-linear (sliding mode) are introduced. In this article, discrete-time PI controllers are used for torque and flux control (PIDTC), the parameters of which are set according to the recommendation from [
25]. A detailed scheme for DTC controller implementation is presented in
Figure 4b. Both schemes use the same torque and flux estimators, outer PI speed controllers, and identical sample times for control loops, as designated in
Table 1.
The proposed control algorithm modification—flux weakening based on the measured DC-link voltage, is realized using DC-voltage mean value (Vdc) calculated over a running average window of one cycle (10 ms). Look-up table (2D) is used for reference flux determination with operating speed and voltage mean values as inputs, which is presented in both figures.
4. Results and Discussion
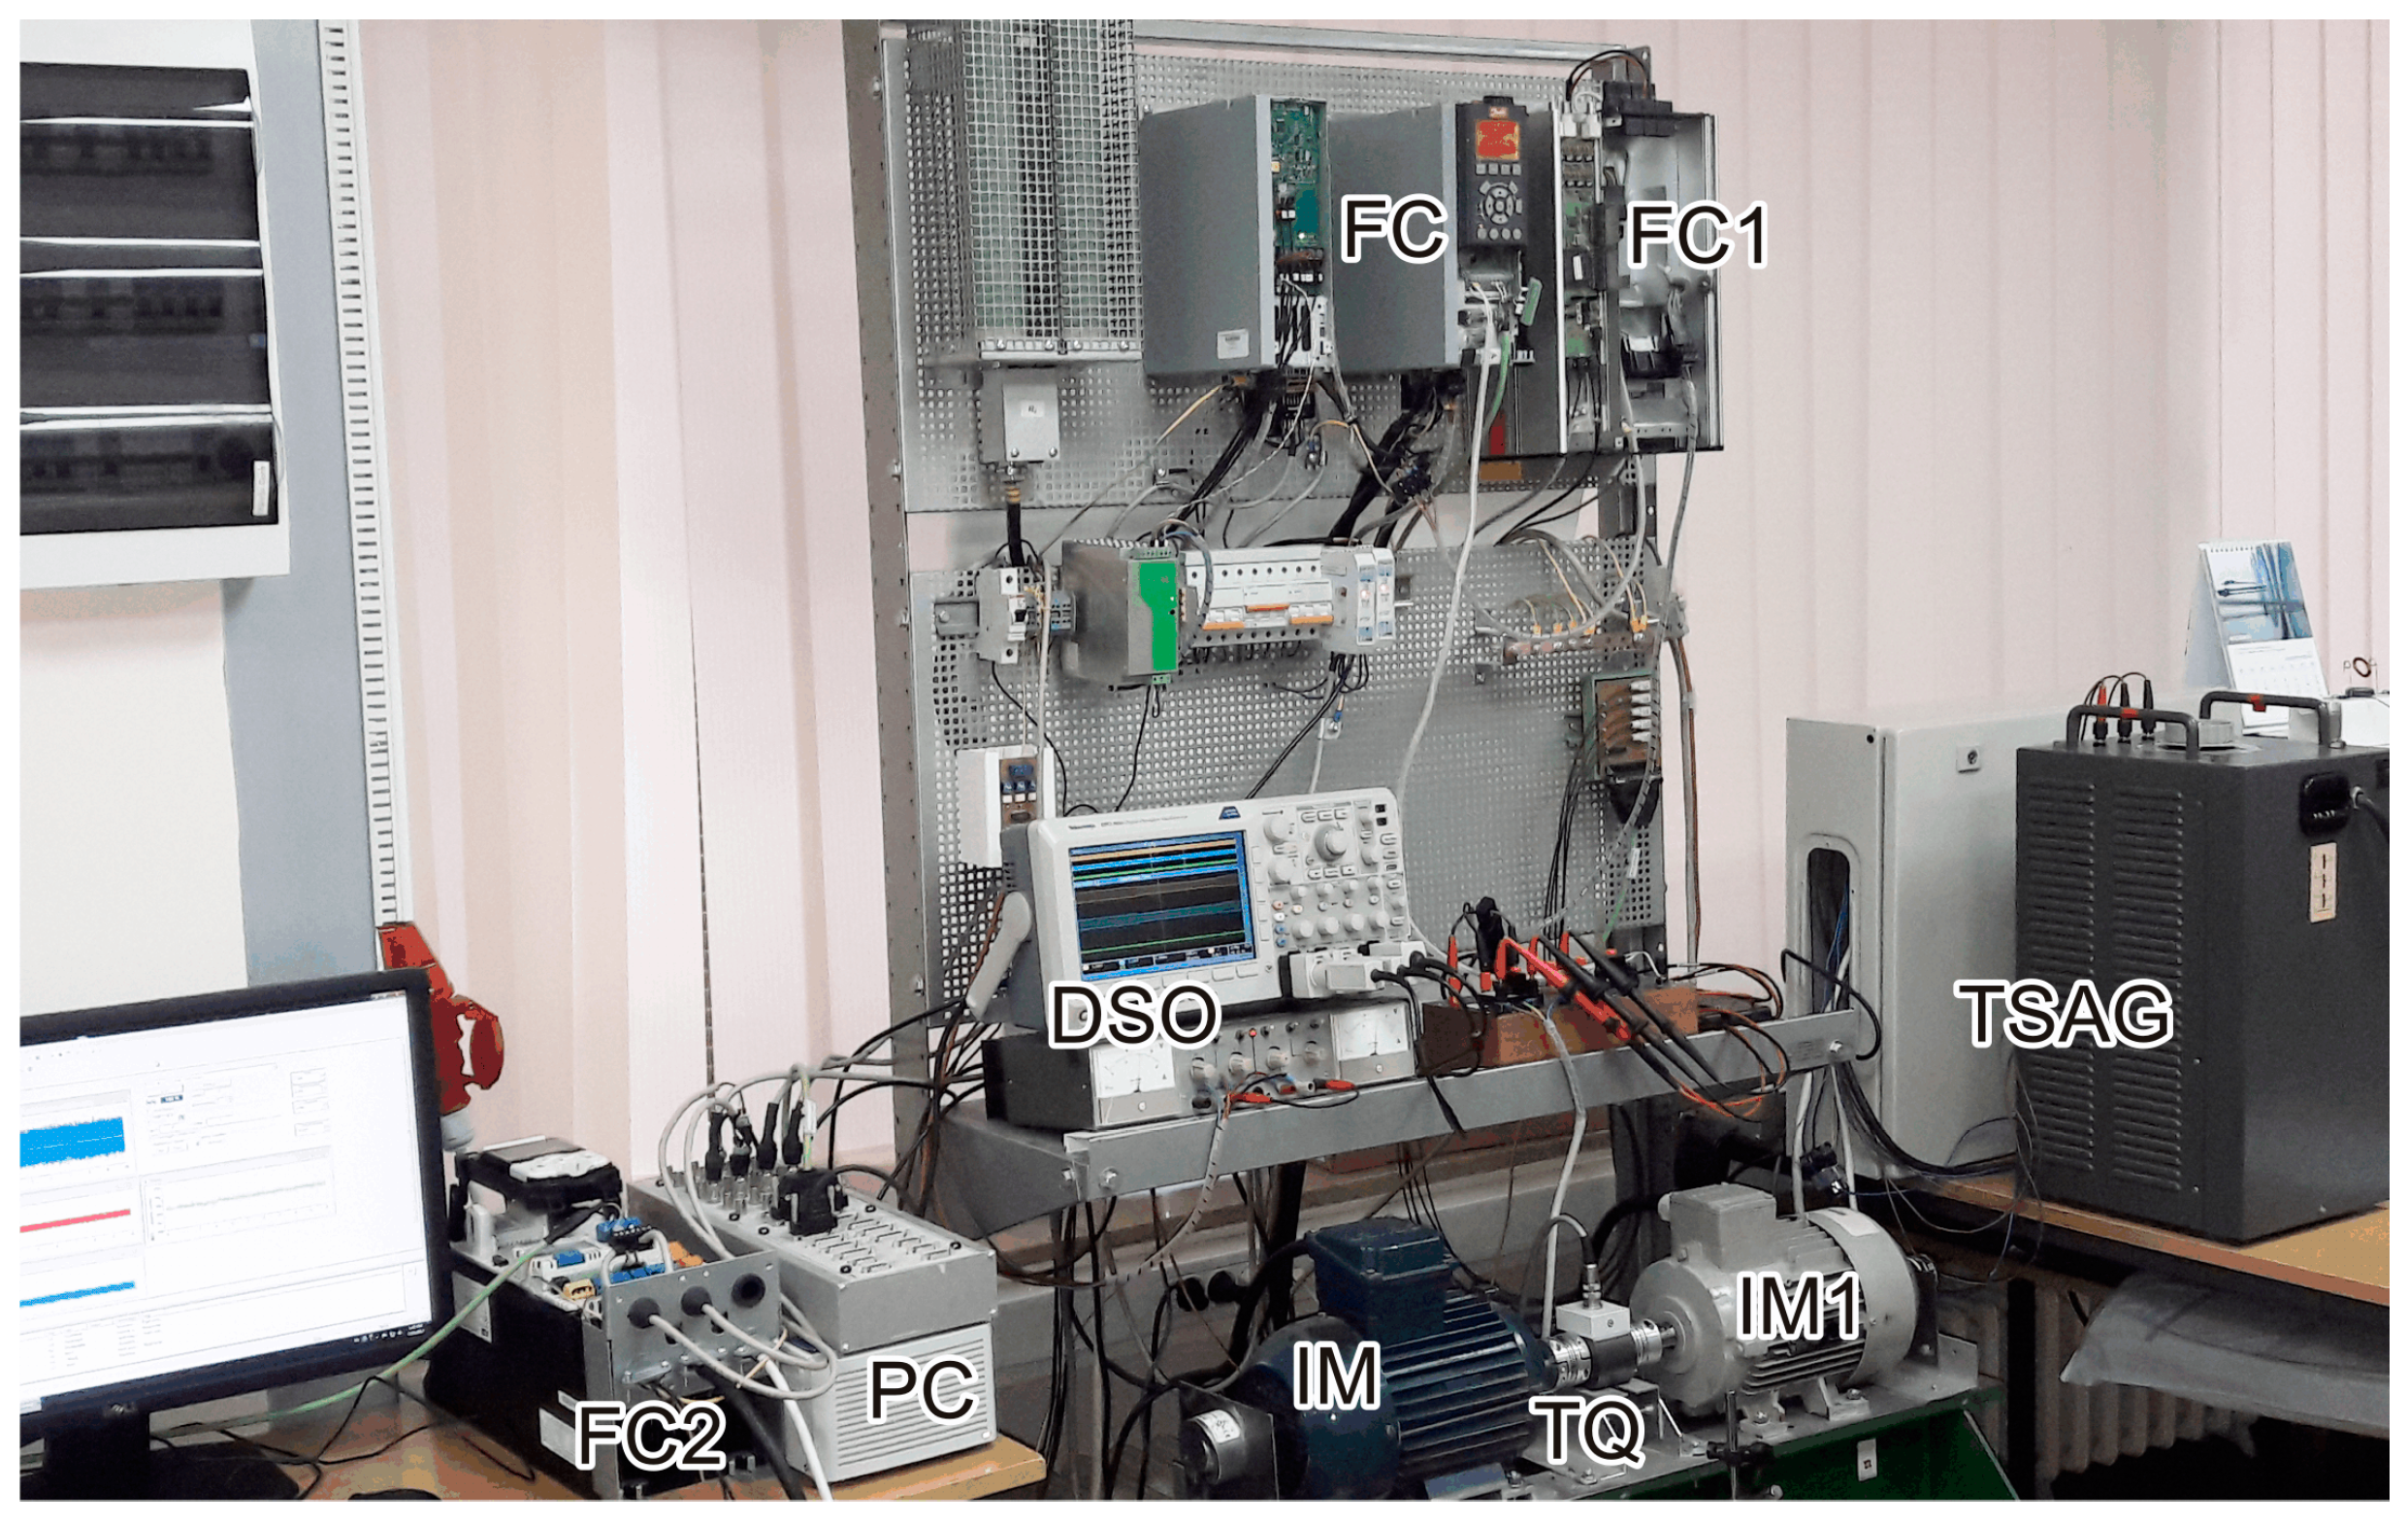
A detailed experimental investigation of voltage sag influence on a laboratory testing system, consisting of a frequency converter FC1 (equipment under test) that supplies induction motor IM1, is presented in this section. Converter FC1 is powered from a voltage sag generator made on the basis of a three-phase transformer and solid-state contactors [
27]. Loading of the motor IM1 is realized with a load emulator, which consists of an induction motor IM with 2.2 kW and 2885 rpm, (directly coupled to IM1 shaft) and a vector controlled induction motor drive FC (Danfoss FC302, 2.2 kW in torque control mode). The rapid prototyping system dSpace DS1103 is used for DTC algorithm implementation and simultaneously for control of the load emulator.
Figure 5 shows a photograph of the testing station with the main components denoted. Induction motor IM1 with the nominal data and parameters given in
Table 1 was used in experiments and in previous analytical findings. In
Table 2, the following data of DSP controlled frequency converter FC1 are given: LC filter, values of protection levels, switching frequency, and values of sampling time
Ts for inner and
Ts1 for the main speed control loop.
In the following experiments, instantaneous values of DC-voltage vdc(t), mean value Vdc, reference ψs*, estimated ψs stator flux, estimated electromagnetic torque Te, reference ωm*, and actual ωm speed are measured and acquired with ControlDesk software (version 3.7.5).
Tests were conducted on laboratory converter FC1 and a commercially available 1.5 kW DTC frequency converter, marked as FC2, which supplied the same induction motor IM1. FC2 converter has DC-link filter parameters
Lf = 3.7 mH and
Cf = 270 µF, while DC-under-voltage protection values are presented in
Figure 1a. Motor speed is regulated up to nominal, with speed feedback supplied from an incremental encoder with 1000 pulses/revolution. During experiments, IM1 was always loaded with constant torque. Due to restrictions on sag generator construction, only rectangular shape dips are analysed. C and D voltage dips are made as a result of single-phase sag propagation over the Dy and Dd transformer vector groups, respectively. The remaining voltage level
h designates the rms value of phase input voltages in accordance with the classification given in [
3].
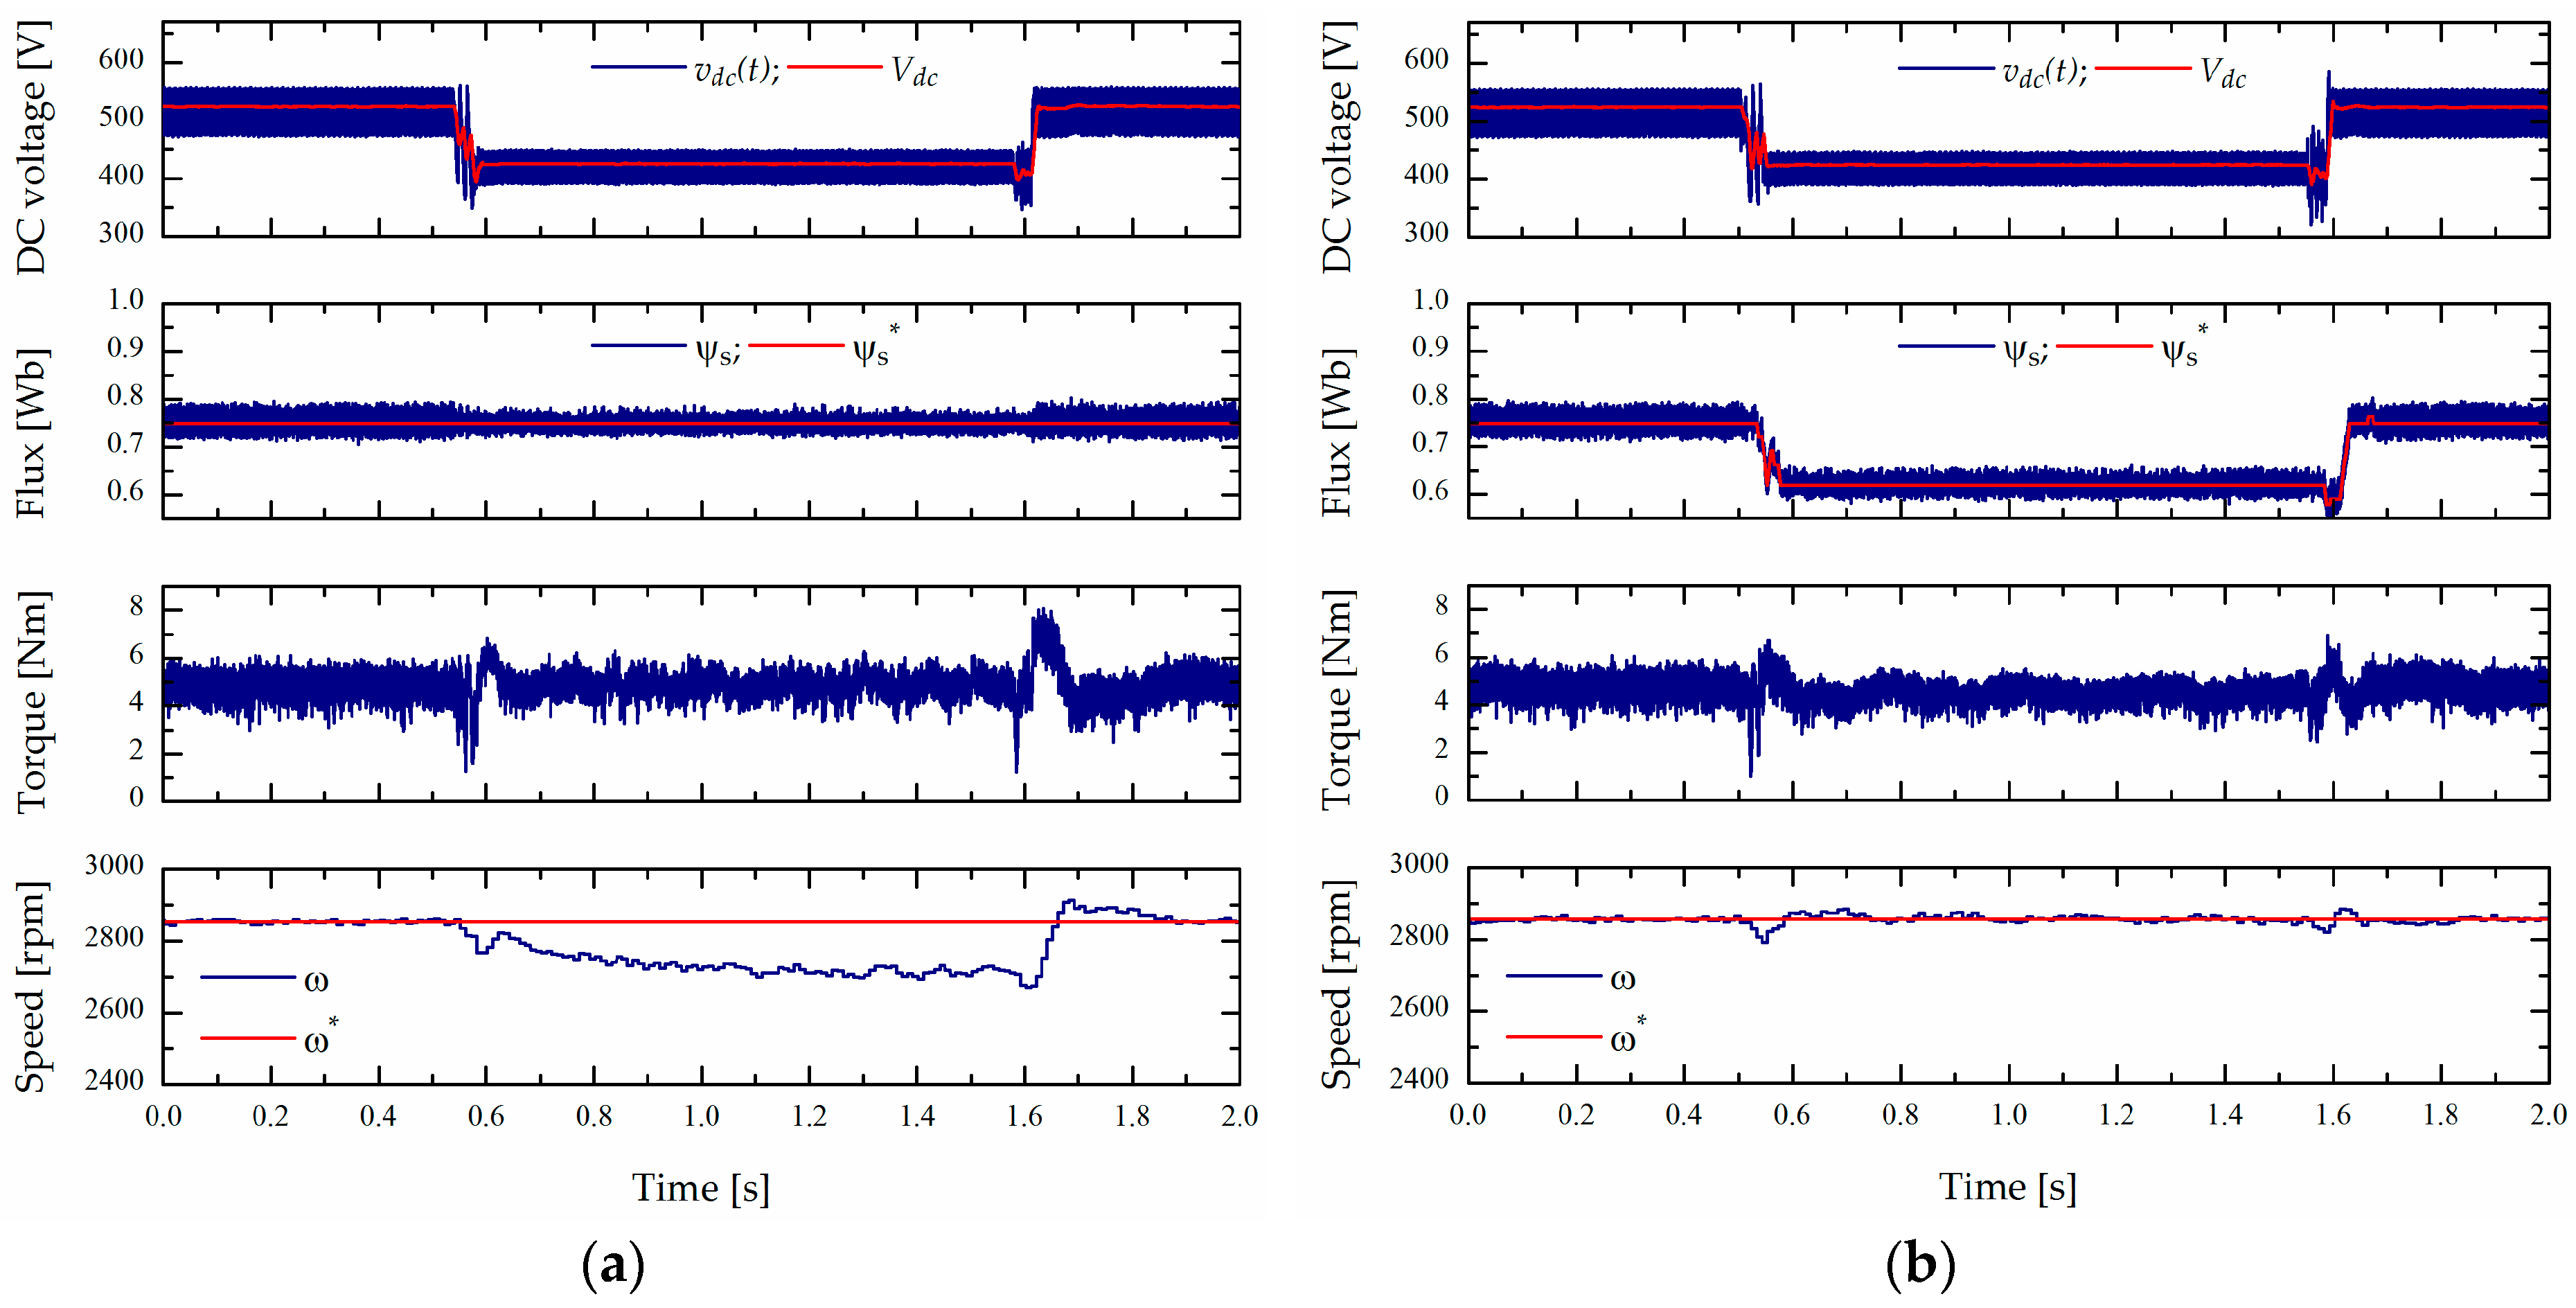
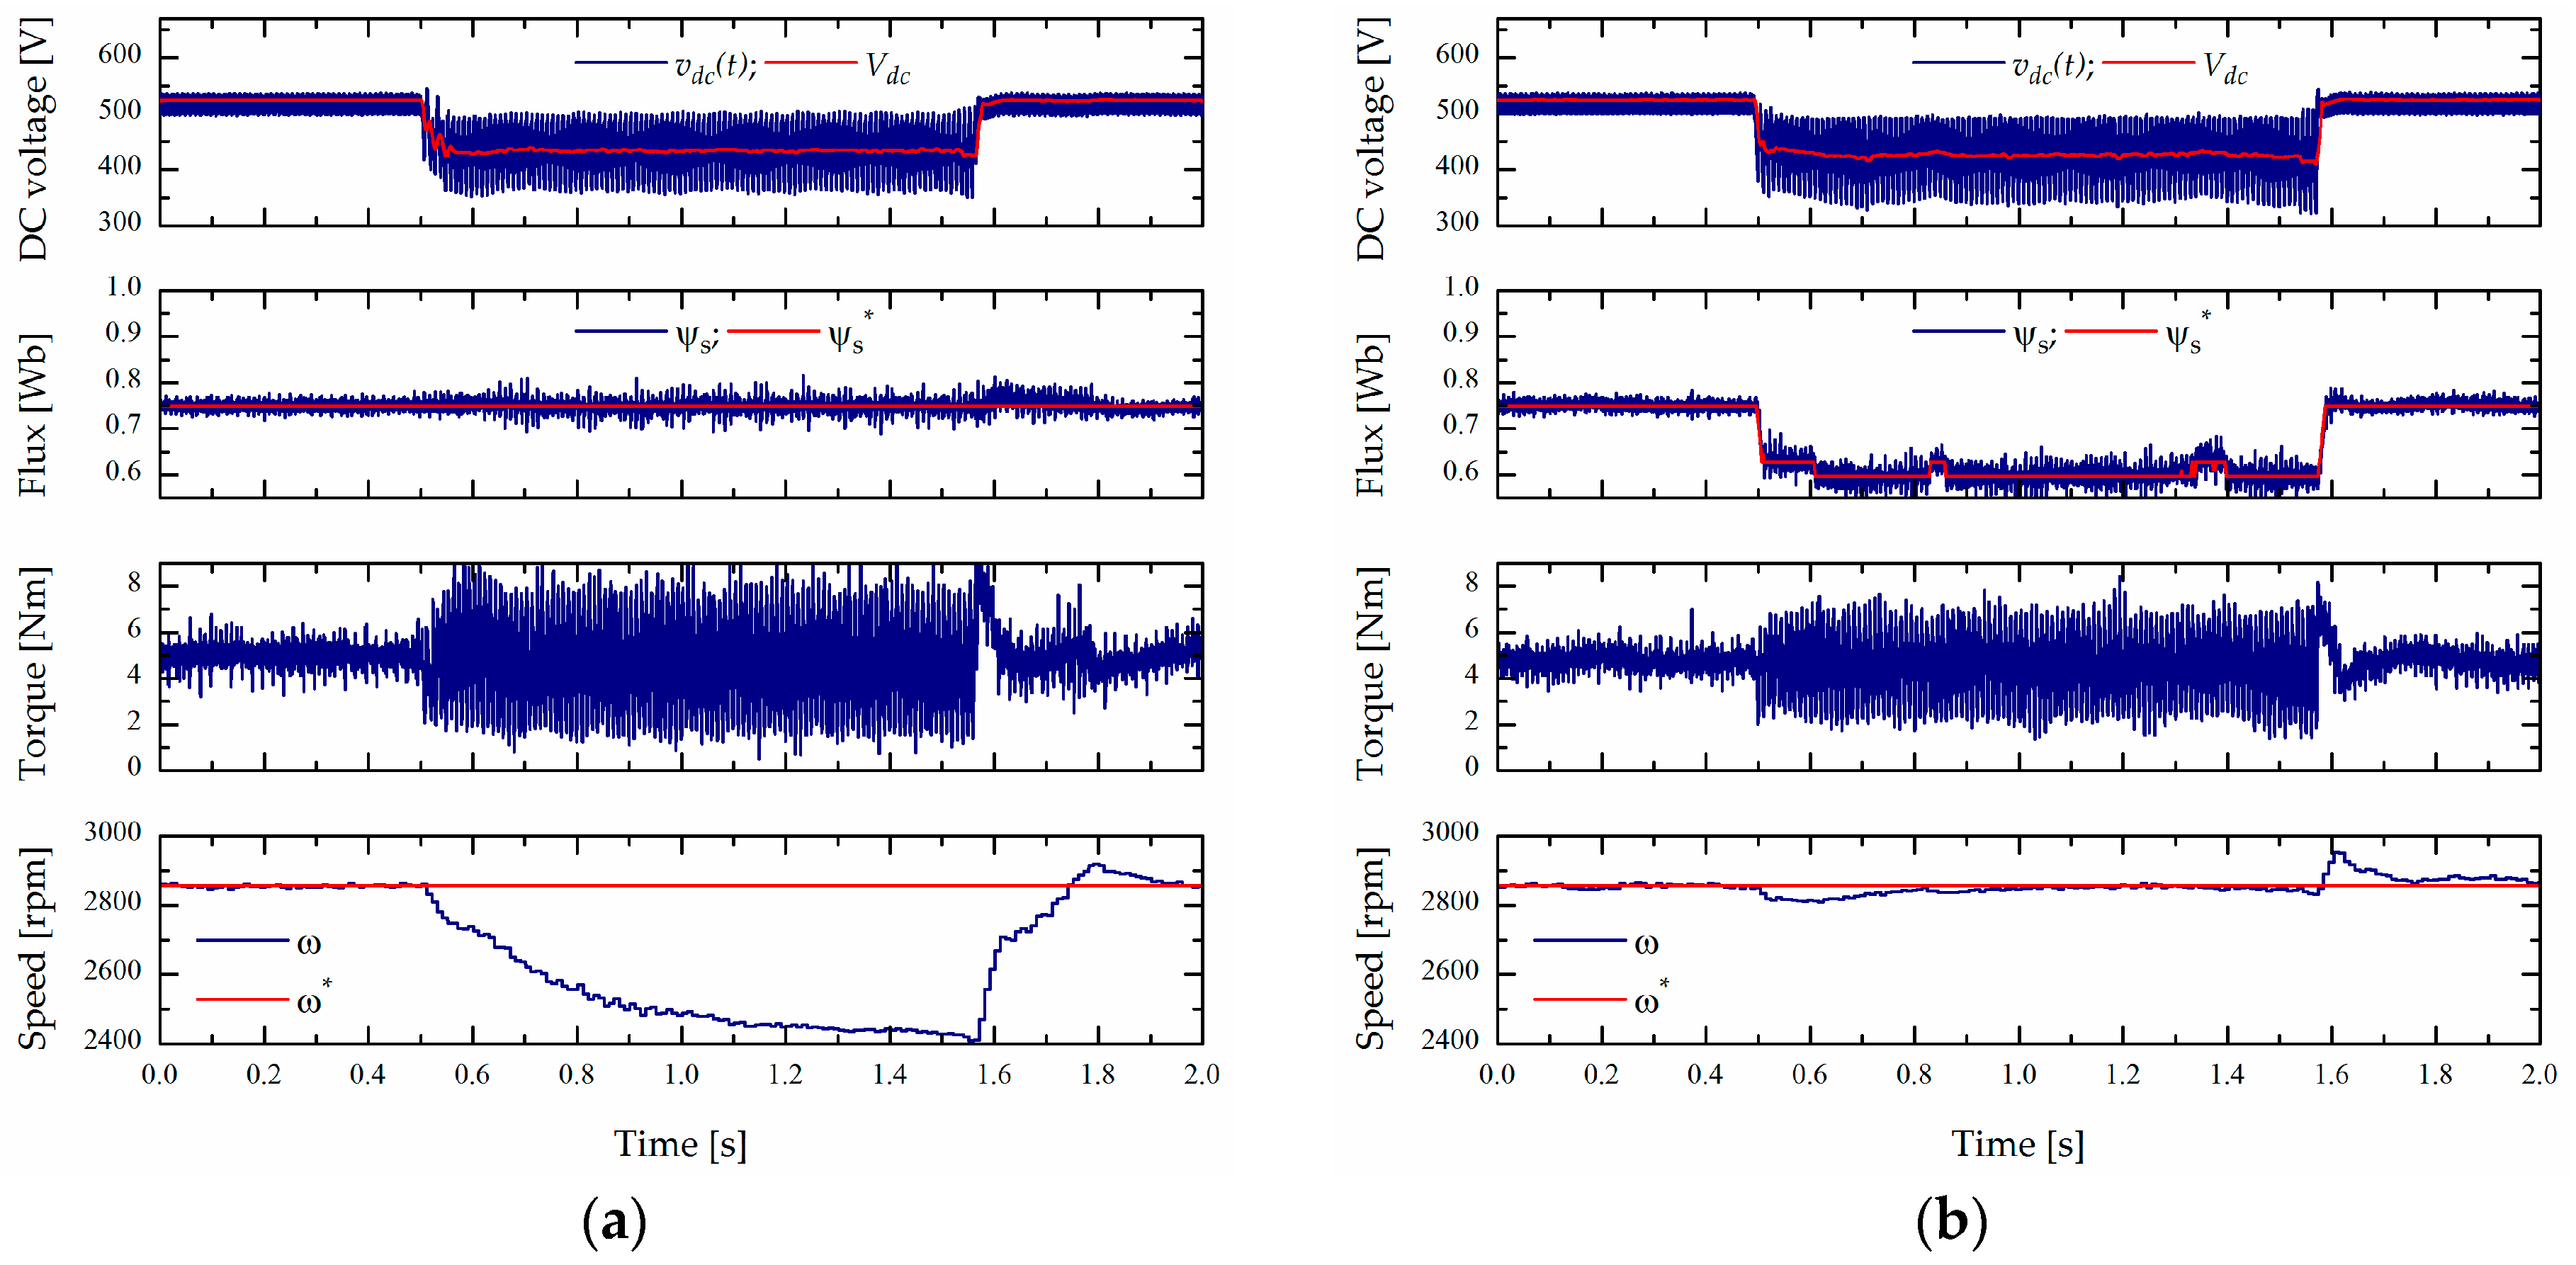
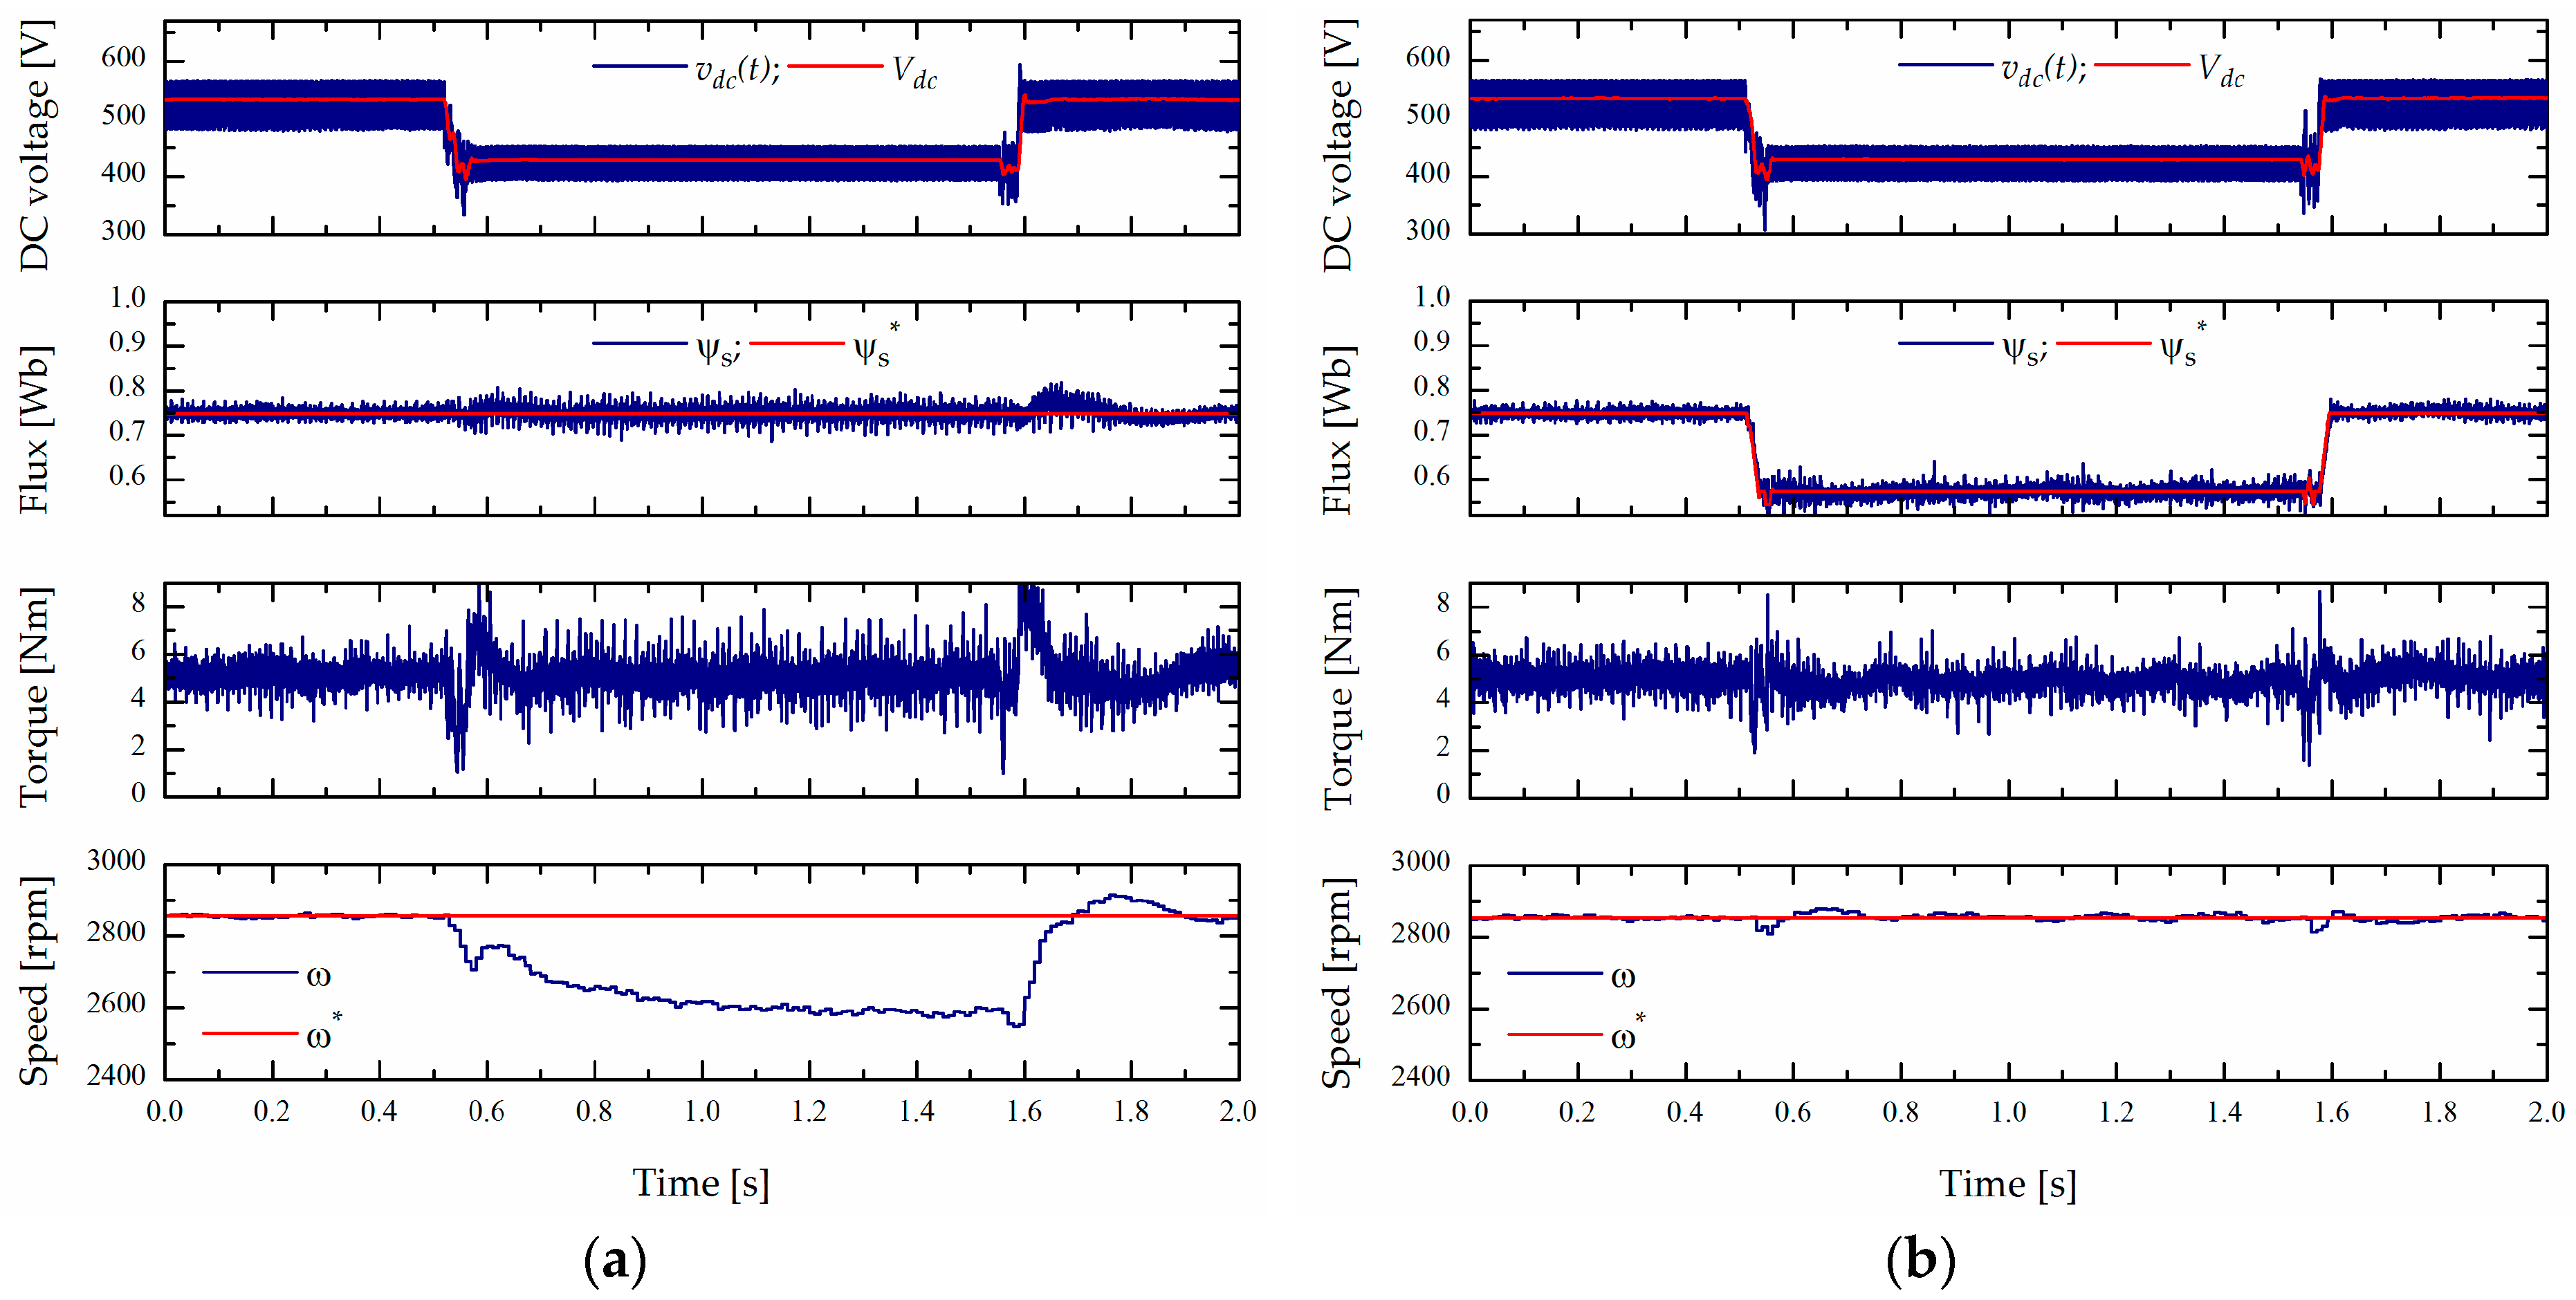
Three-phase symmetrical voltage sag (type A) impact is analysed first in the case of the remaining input voltage value at 75% of the nominal value, where DC-voltage is slightly above the under-voltage protection limit (
Vdcmin). The recorded results of the speed controlled C12DTC drive with rated load are presented in
Figure 6, with the reference speed equal to the nominal speed and the reference flux value calculated to provide breakdown torque. Notable speed reduction appears during sag as expected in accordance with
Figure 3a,b. This disturbance disappears, and regular control is established after sag ending.
Under the same conditions, the next experiment was conducted on the C12DTC drive with flux weakening referring to DC-link voltage. The results from
Figure 6b show that the drop in speed problem is efficiently solved during this supply disturbance, and ASD continuously operates with short speed deviation as the sag arises and ends.
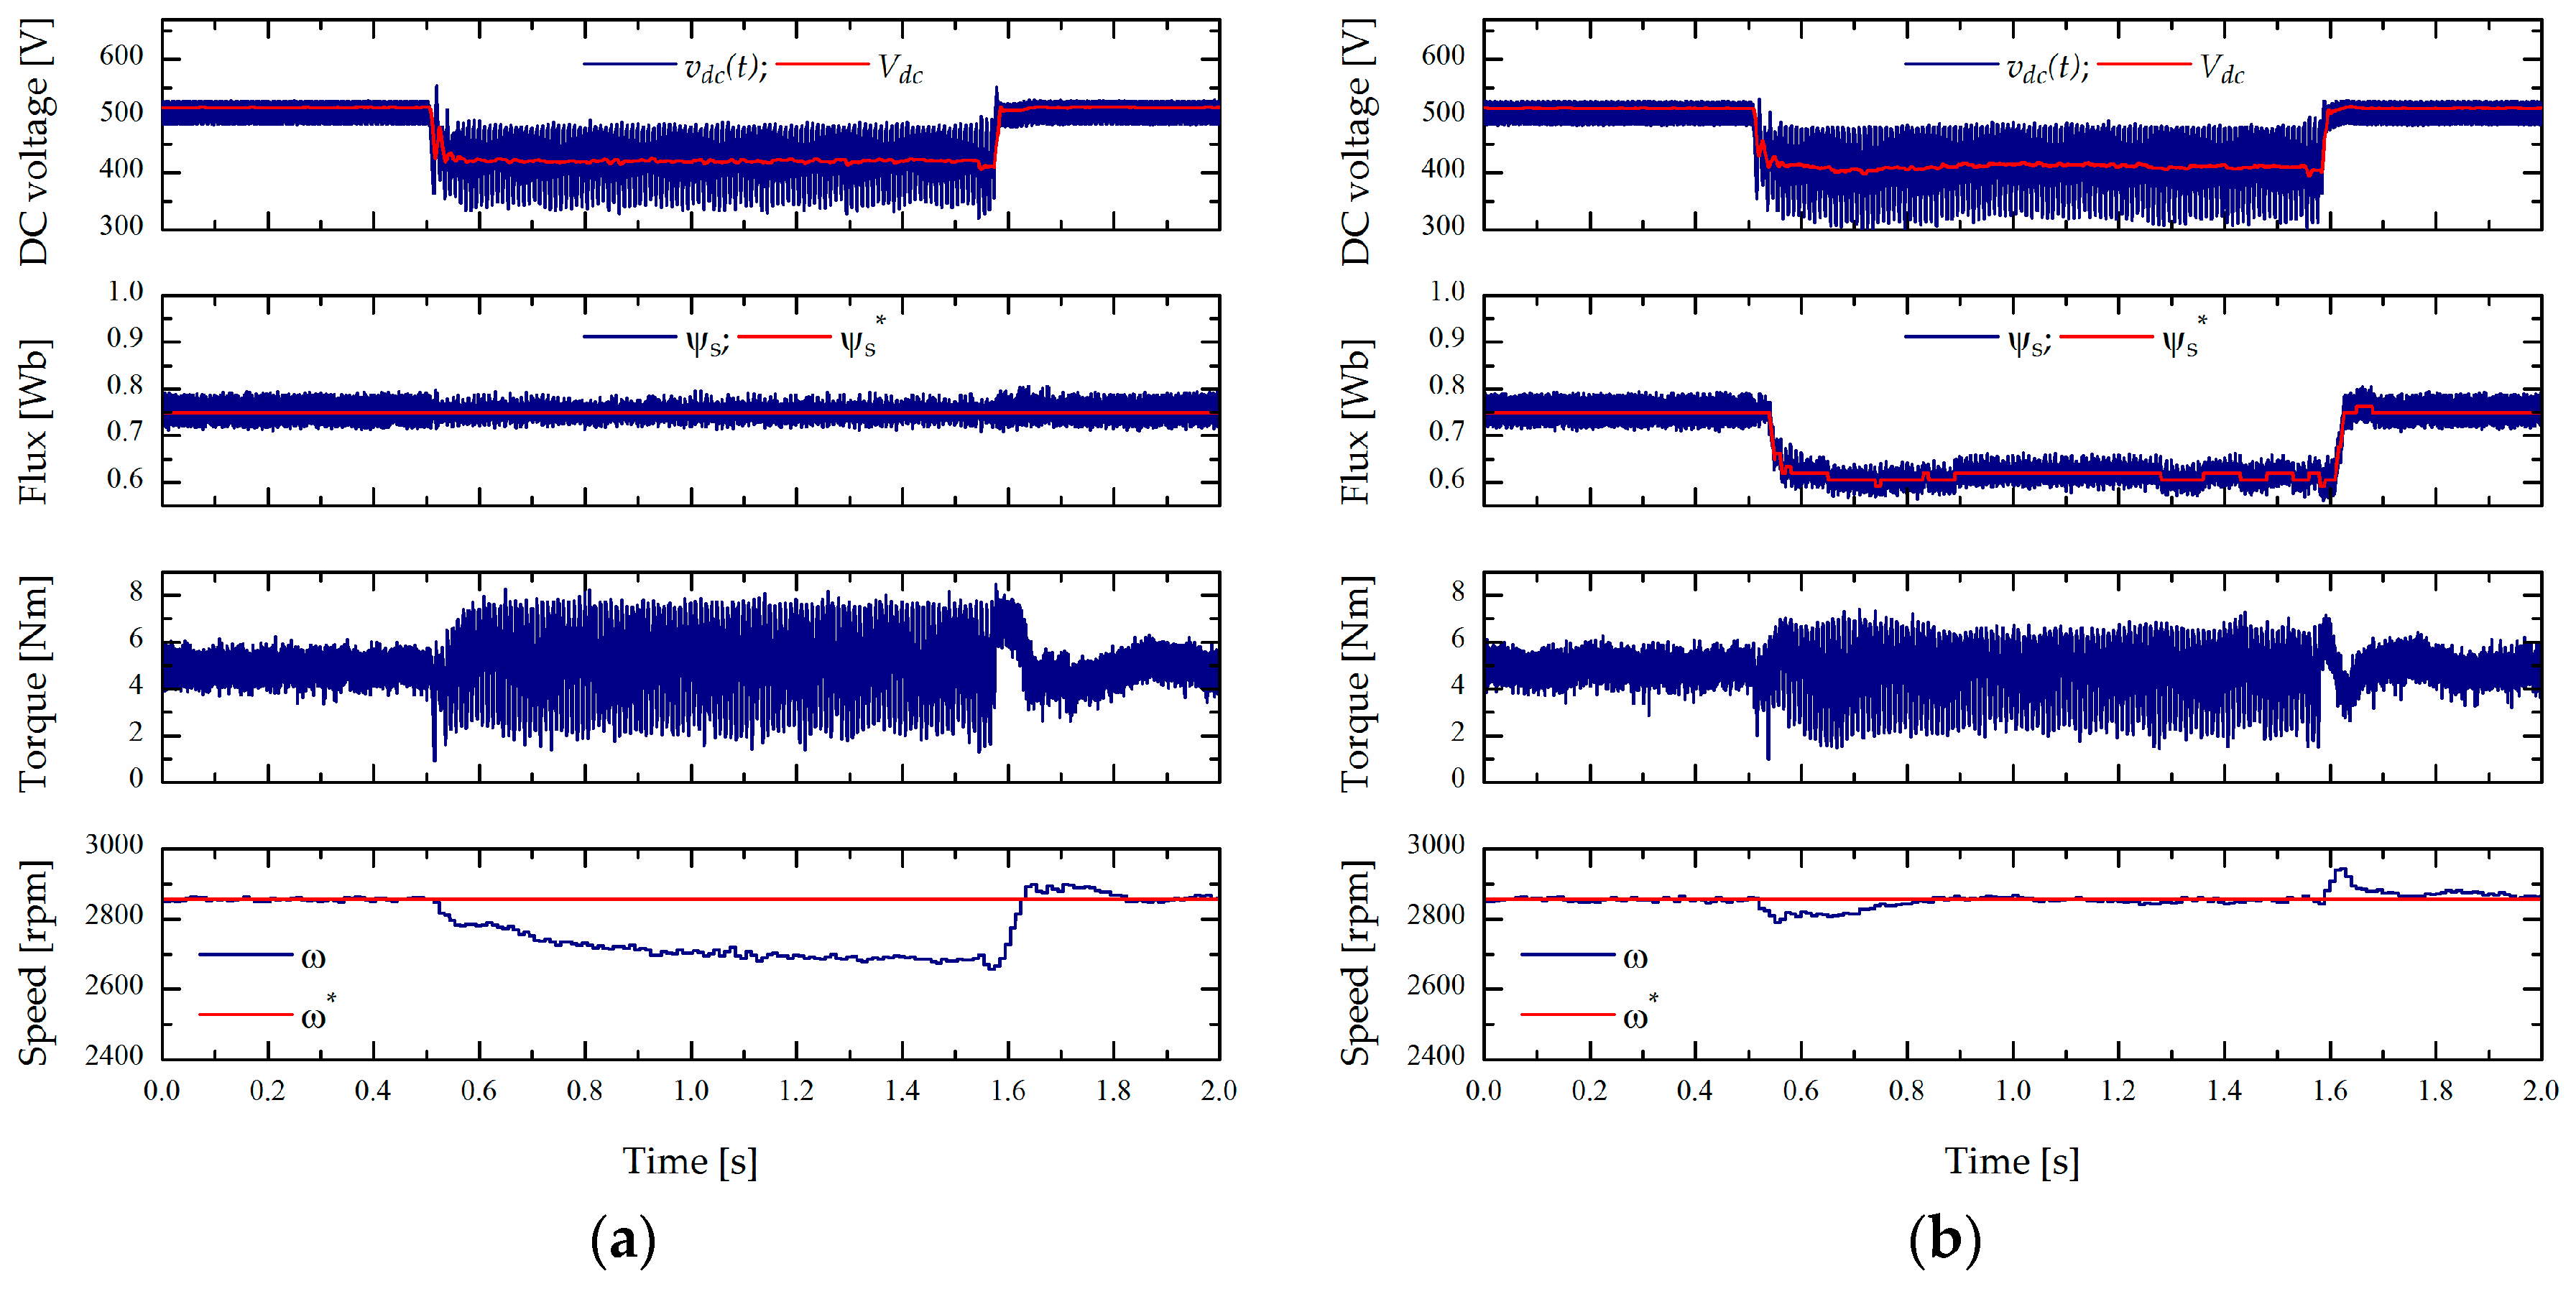
The examined PIDTC scheme uses SVPWM in the linear zone without over-modulation, and the obtained IM stator voltages are slightly lower compared to the classical DTC that uses vectors in hexagon vertices. In this case, the rms value of the fundamental voltage harmonic is reduced, and consequently the drop in speed is slightly higher, as shown in
Figure 7a. Applying the proposed flux-weakening algorithm, the rejection of DC-link reduction is a little bit slower (
Figure 7b) because of the reduced stator voltage (compared to C12DTC) caused by linear SVPWM.
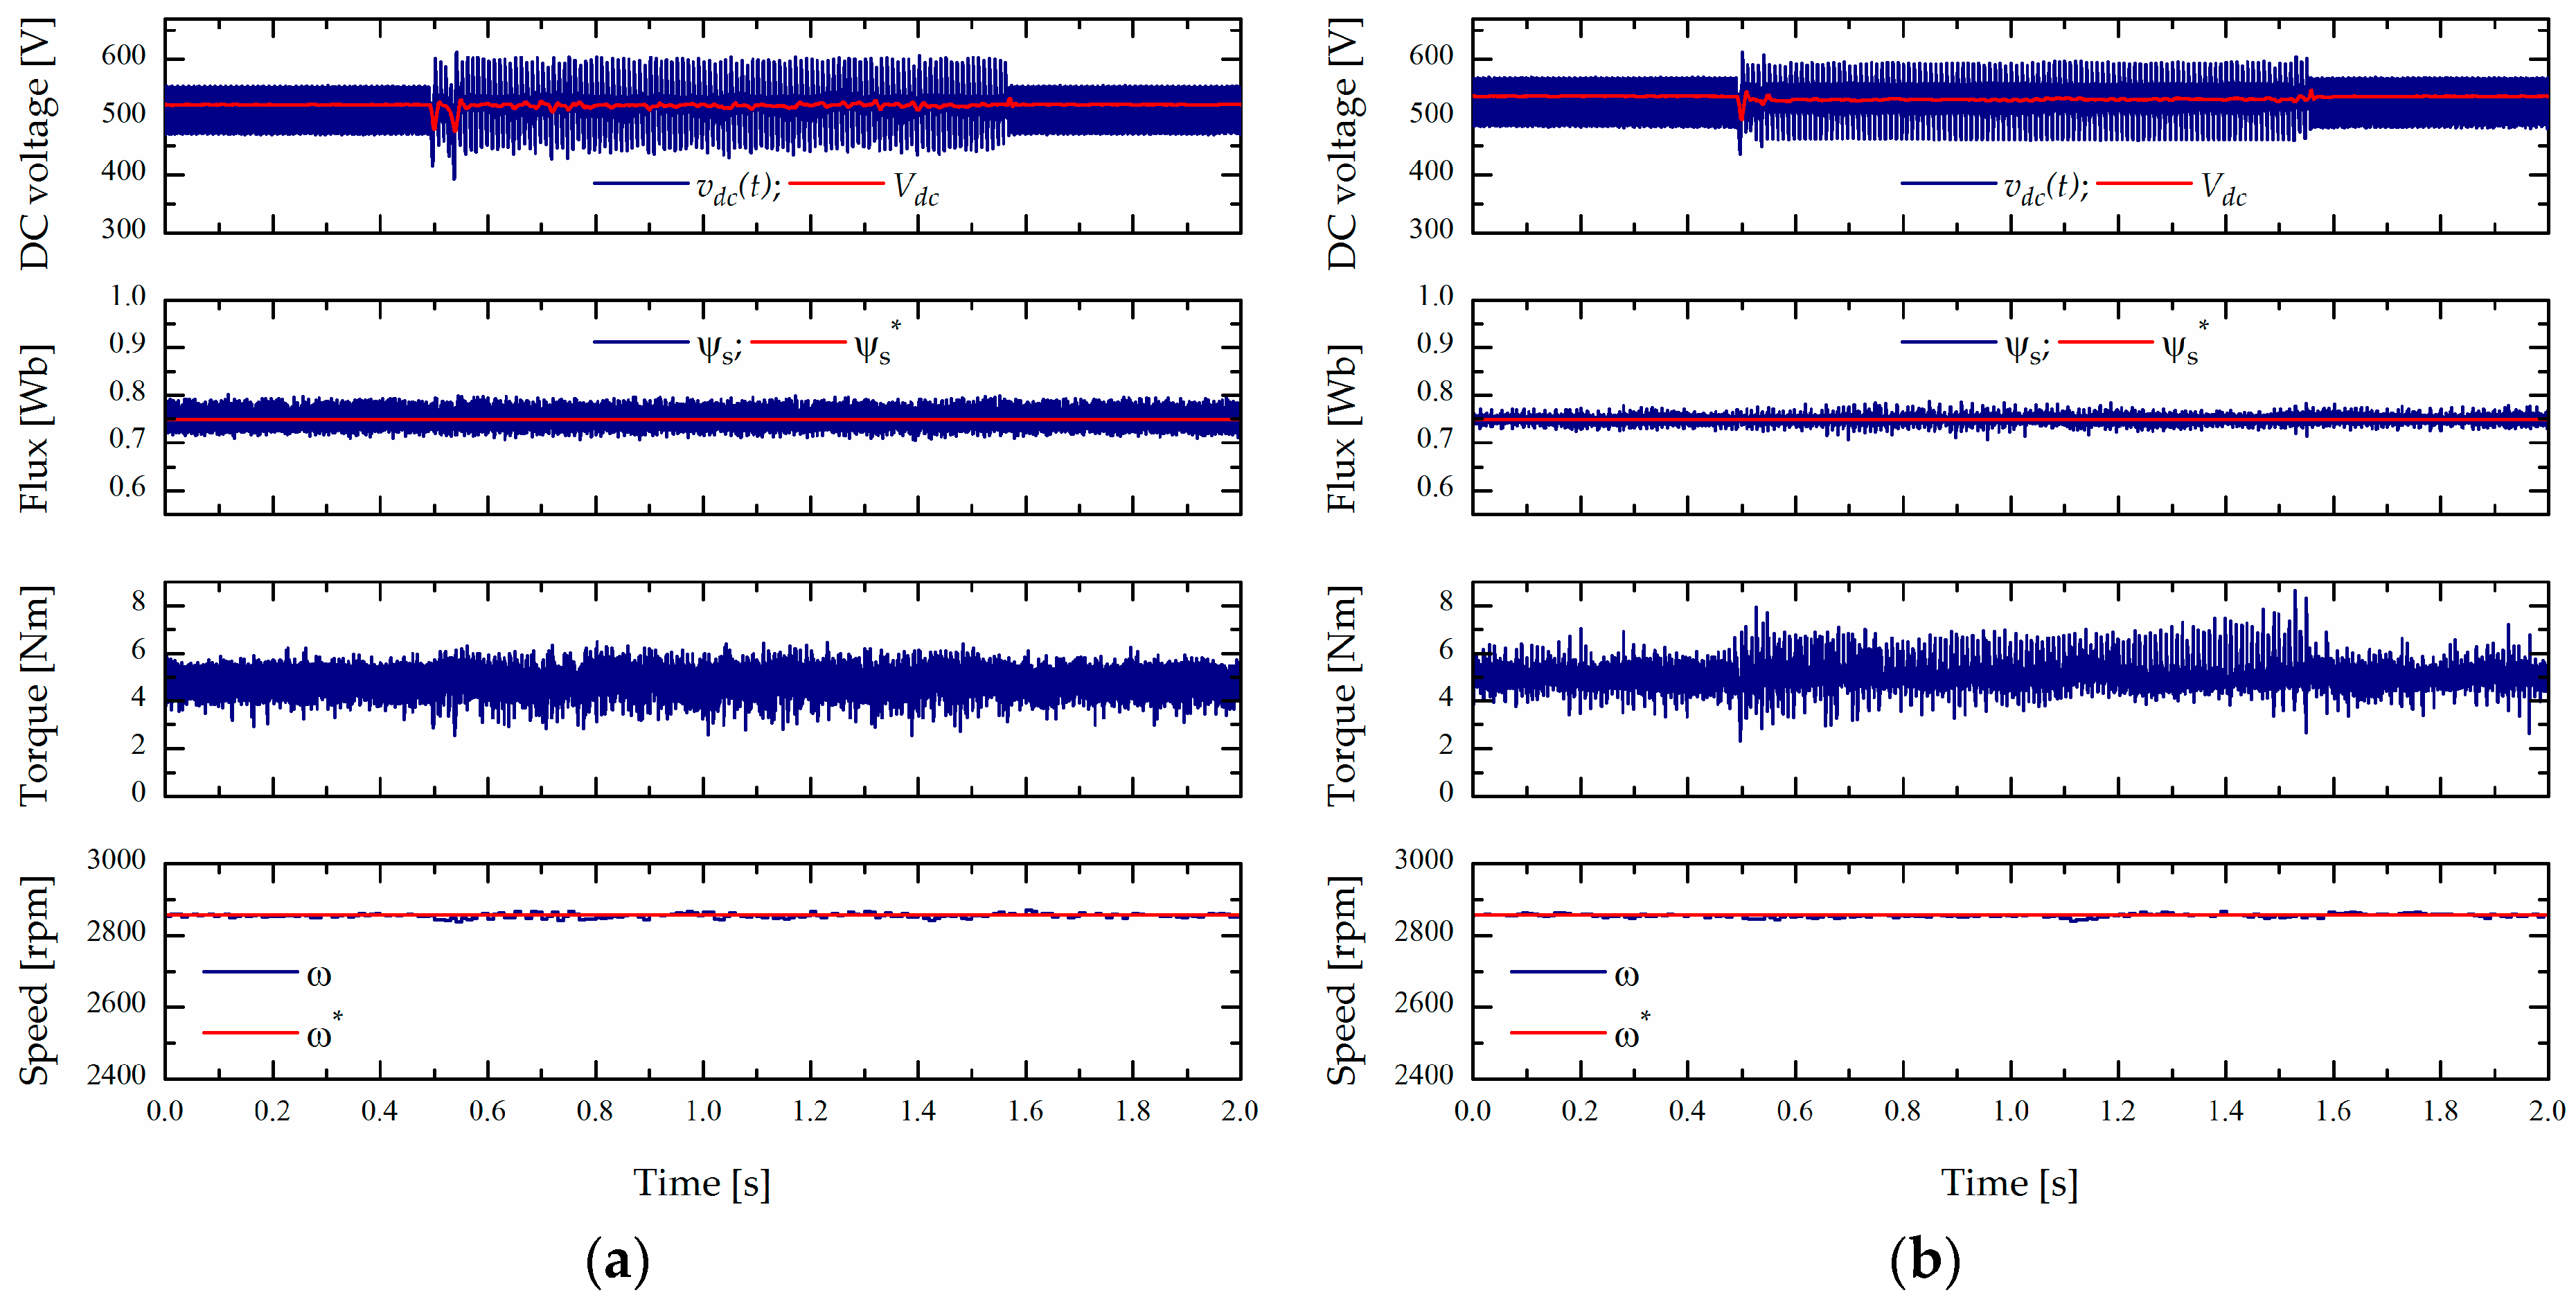
Unsymmetrical, single-phase voltage sag (type B) has a significant influence on increasing DC-voltage ripple, while its mean value remains unchanged, which can be seen in
Figure 8 on the DC-voltage diagram. In
Figure 8, C12DTC and PIDTC controlled drives responses are presented for type B voltage sag with the remaining voltage
h = 0. The application of the C12DTC control scheme completely suppresses higher harmonics in motor torque, whilst, in the case of PIDTC, this harmonics ripple exists with significant damping (more details can be found in [
15]). Having in mind that the majority of sag durations are less than 1 s, it can be concluded that this disturbance type has no important influence on DTC ASD performance degradation.
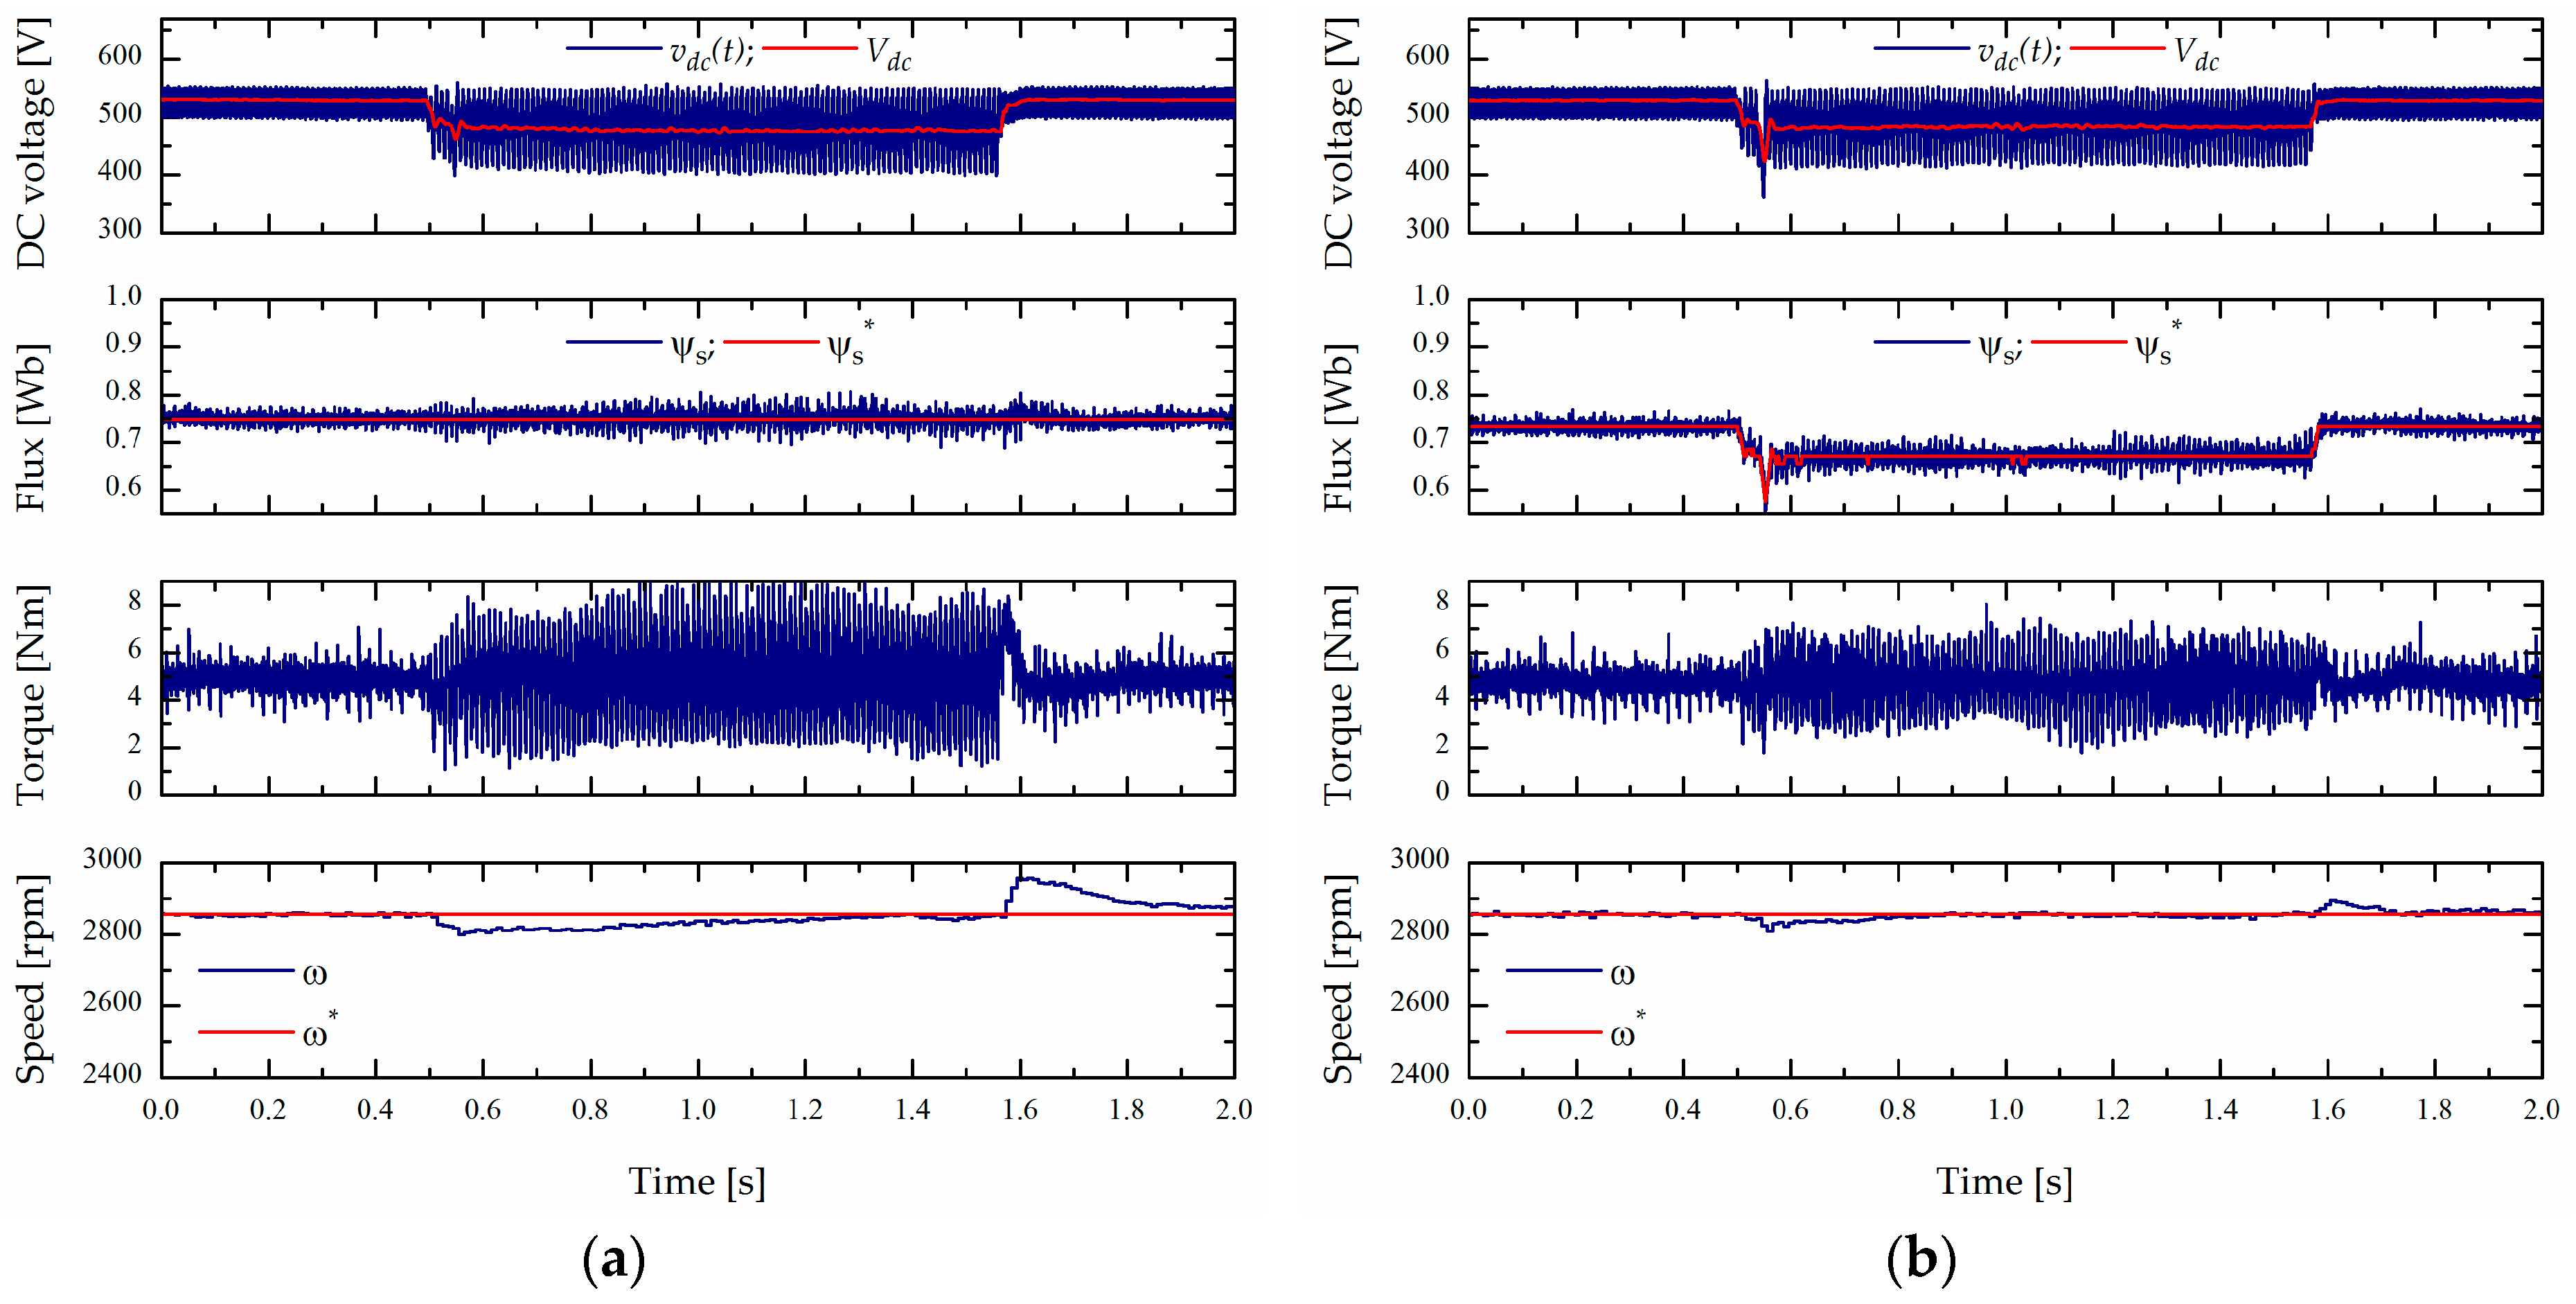
Two-phase unsymmetrical voltage sag with a phase shift (type C) simultaneously provokes DC-voltage reduction and a ripple increase, which is caused by the input rectifier operation mode transition from a six-pulse to a four-pulse regime.
Figure 9 presents the influence of this sag type, which originates from sag type B and is transferred over the transformer with vector group Dy when the remained voltage in sagged phases equals 1/3 of the rated value. At this supply disturbance, all line-to-line voltages deviate from the nominal value, alongside the displacement of phase angles, reflecting a significant DC-voltage ripple. If standard C12DTC control is used without flux weakening, a drop in speed is noticed (
Figure 9a), while the previously proposed flux reference modification solves this speed reduction efficiently (
Figure 9b).
Similar results are obtained (
Figure 10) in the case of a PIDTC controlled drive affected with the previous voltage sag events with the existence of significant torque oscillation. In this case, the proposed algorithm exhibits the expected features regarding the available torque increase.
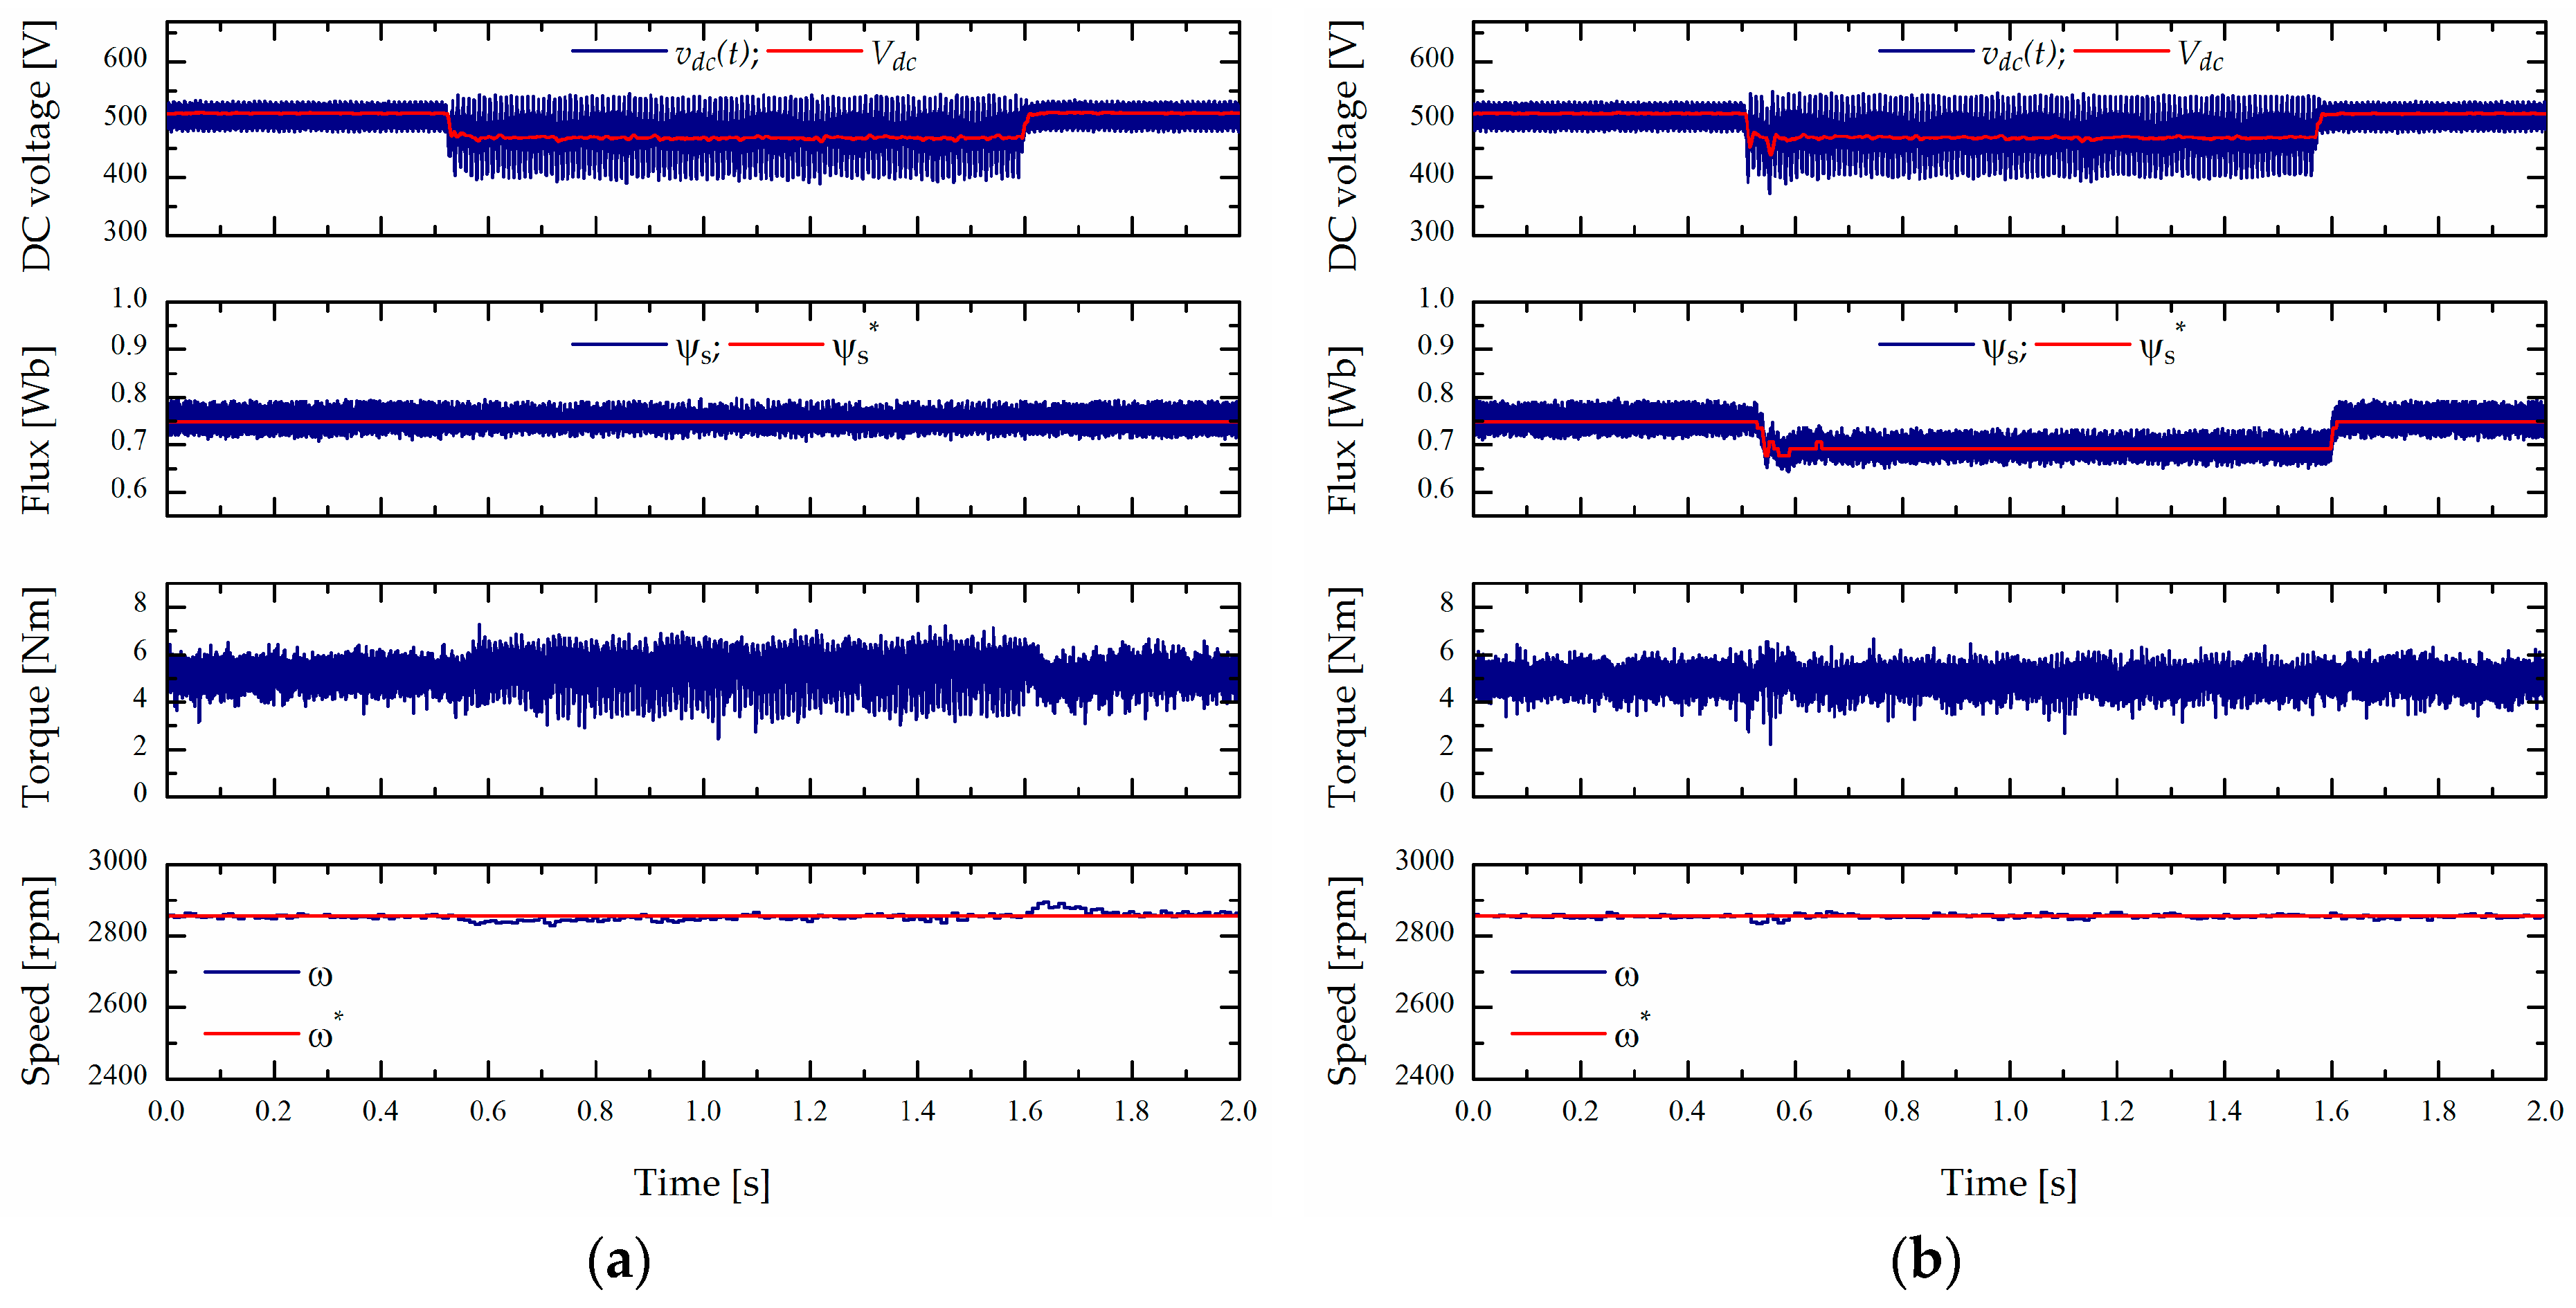
At voltage sag type D, the circumstances are similar as under type C; namely, voltage reduction with increased DC-voltage oscillation, but the
Vdc decrease is significantly smaller since, in this disturbance, a line to line input voltage rms value remains at a nominal level. In both analysed DTC schemes, the problem with the available torque reduction and speed deviation caused by the diminished IM stator voltage is solved with the application of a simple stator flux adaption to this reduced voltage, as shown in
Figure 11b and
Figure 12b.
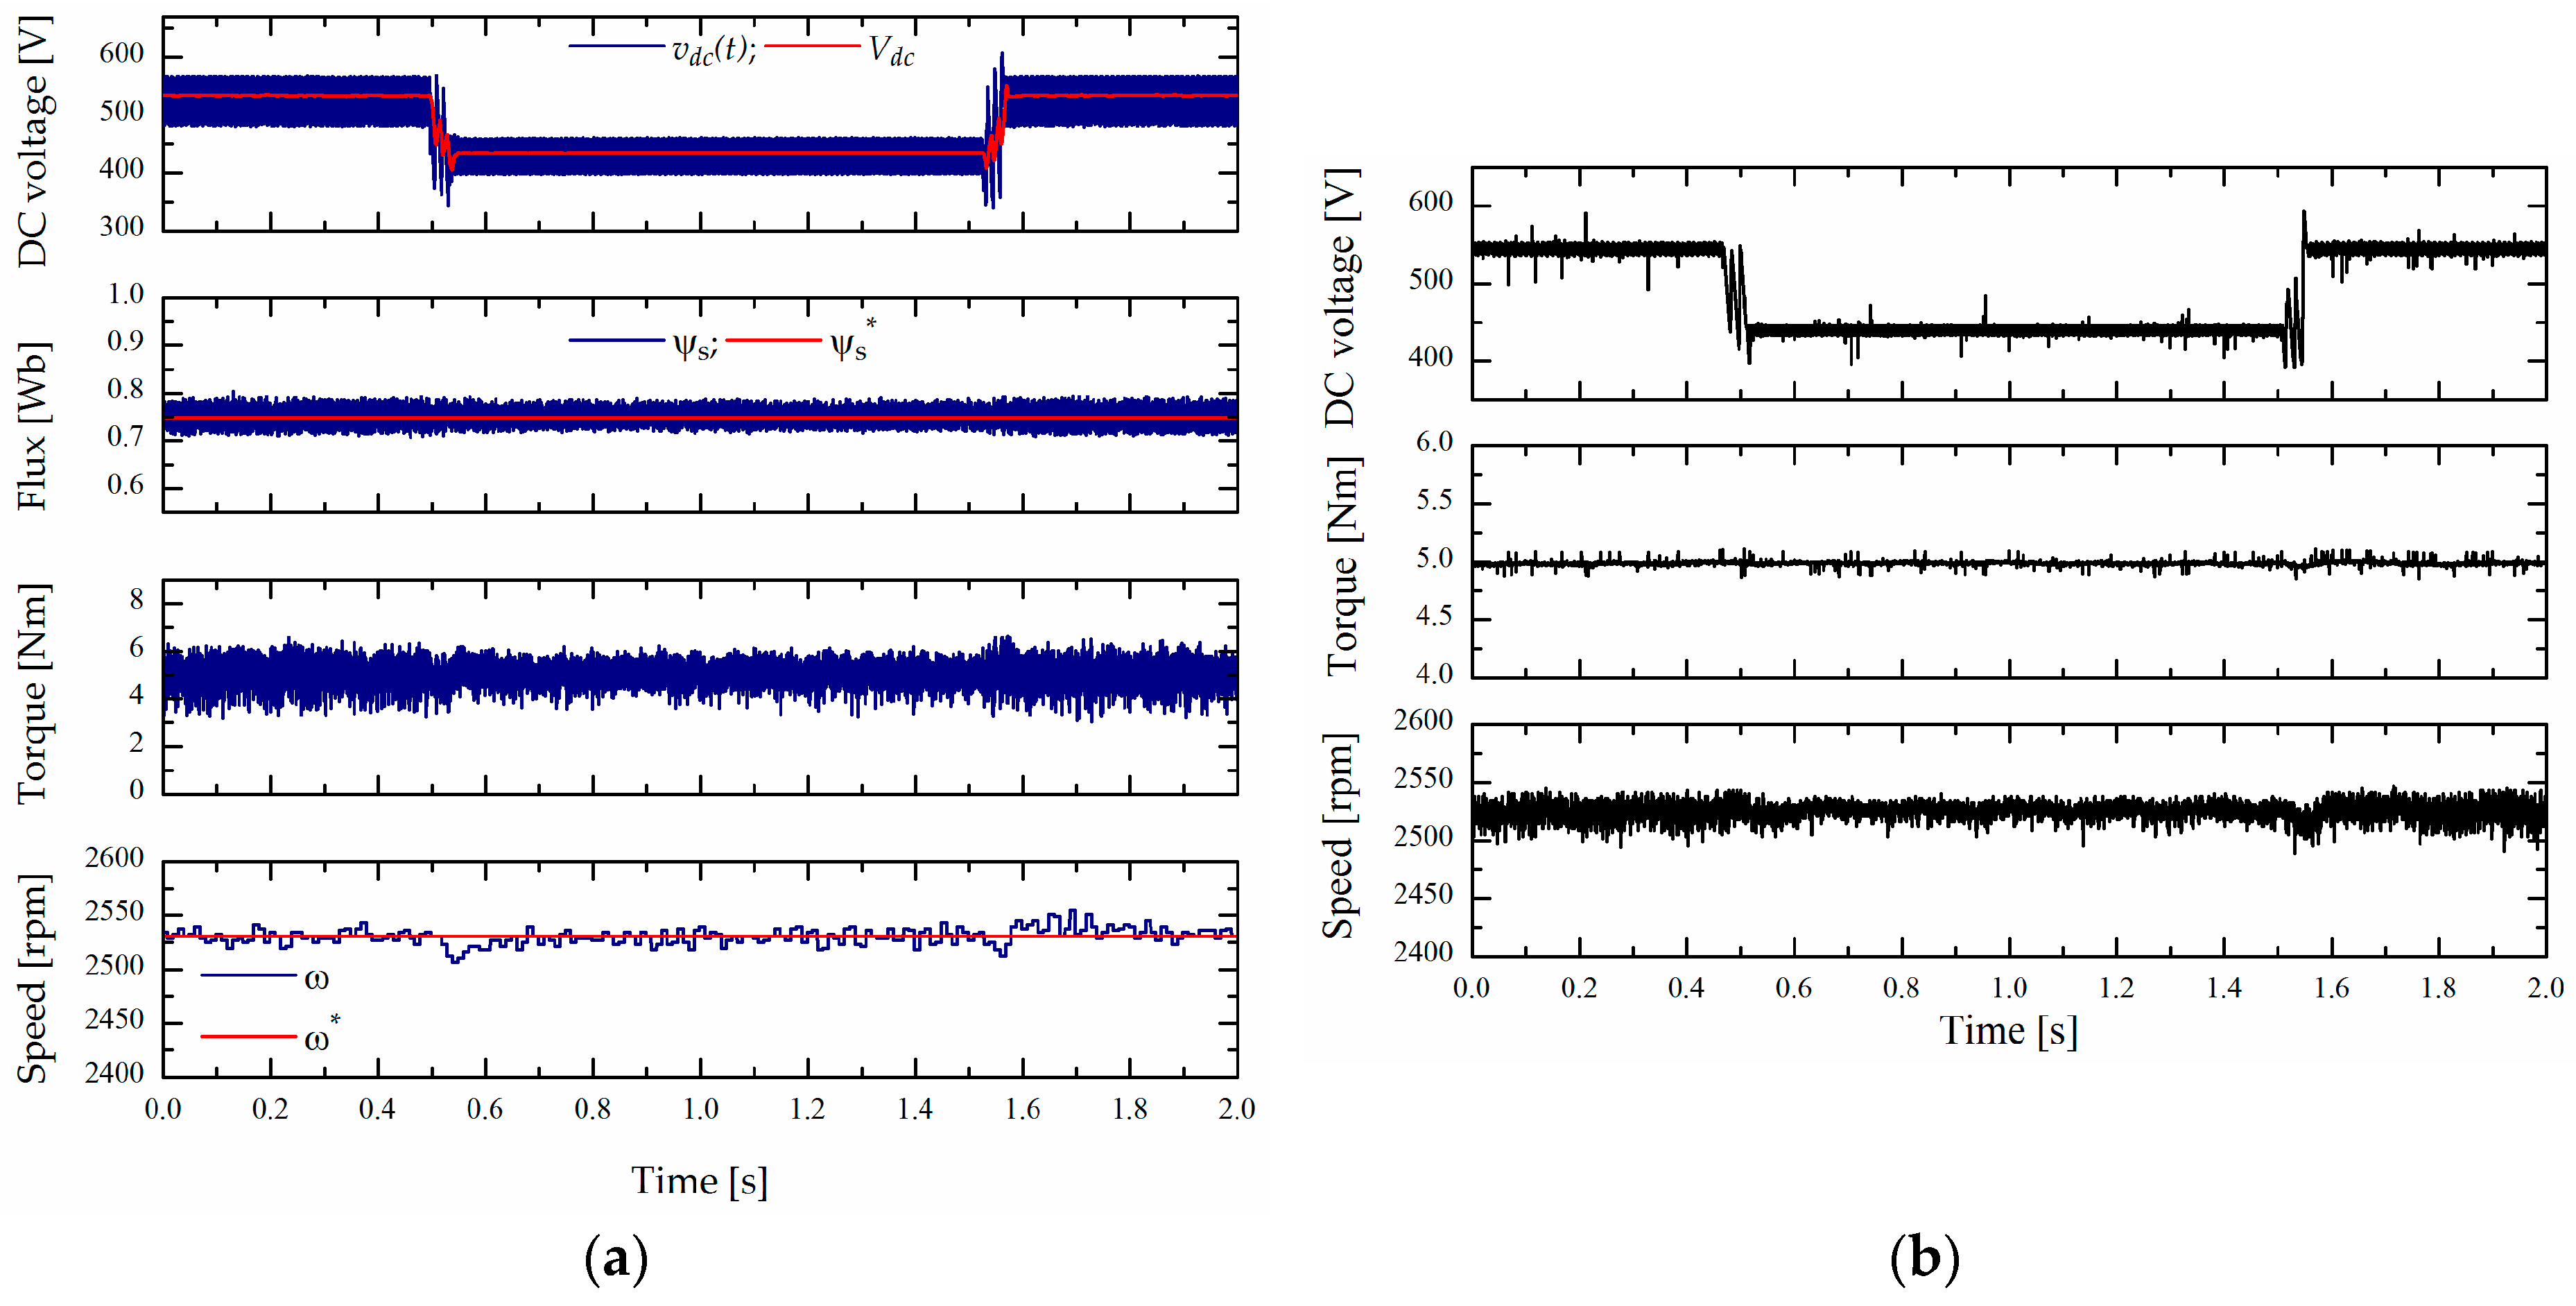
Finally, the experimental investigation approved possibilities to eliminate all disturbances with voltage reduction in the case of a working speed below critical
ω1, as explained in
Section 3. Time diagrams of the characteristic signals of the laboratory C12DTC drive are presented in
Figure 13a for sag type A with
h = 0.75 and am operating speed below critical
ω1 = 265 rad/s, without the application of proposed flux weakening.
In order to illustrate this advice for working speed selection, the mentioned industrial drive experiments have been conducted with the critical speed
ω1 = 265 rad/s. The latest results from
Figure 13b prove that this recommendation can be useful for the industrial application of DTC drives with no tolerance for speed reduction.


