
China’s Energy Transition in the Power and Transport Sectors from a Substitution Perspective

Abstract
:1. Introduction
2. Cleaner Energy Resource and Policies in Power and Transport Sectors
2.1. Cleaner Energy Potential and Accessibility
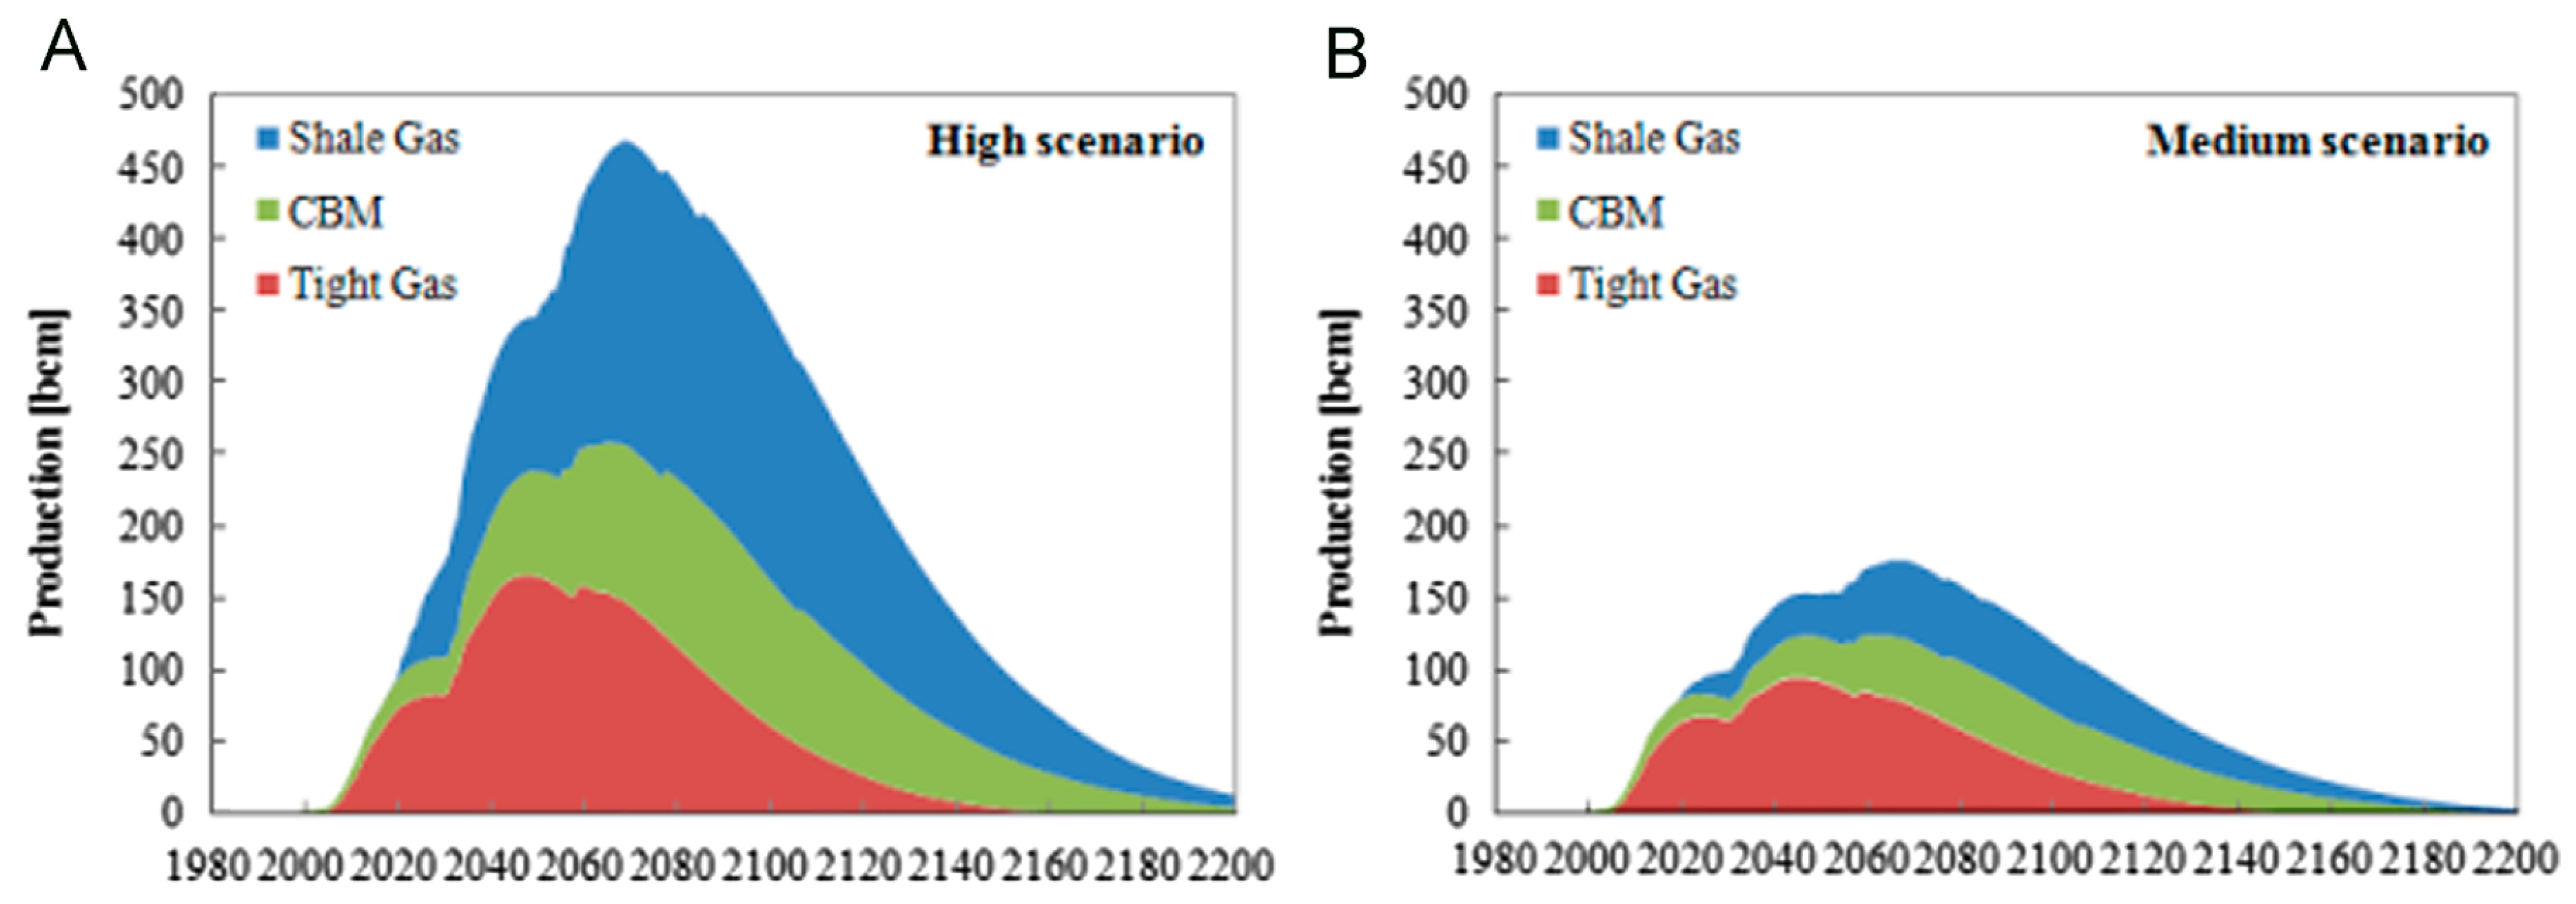
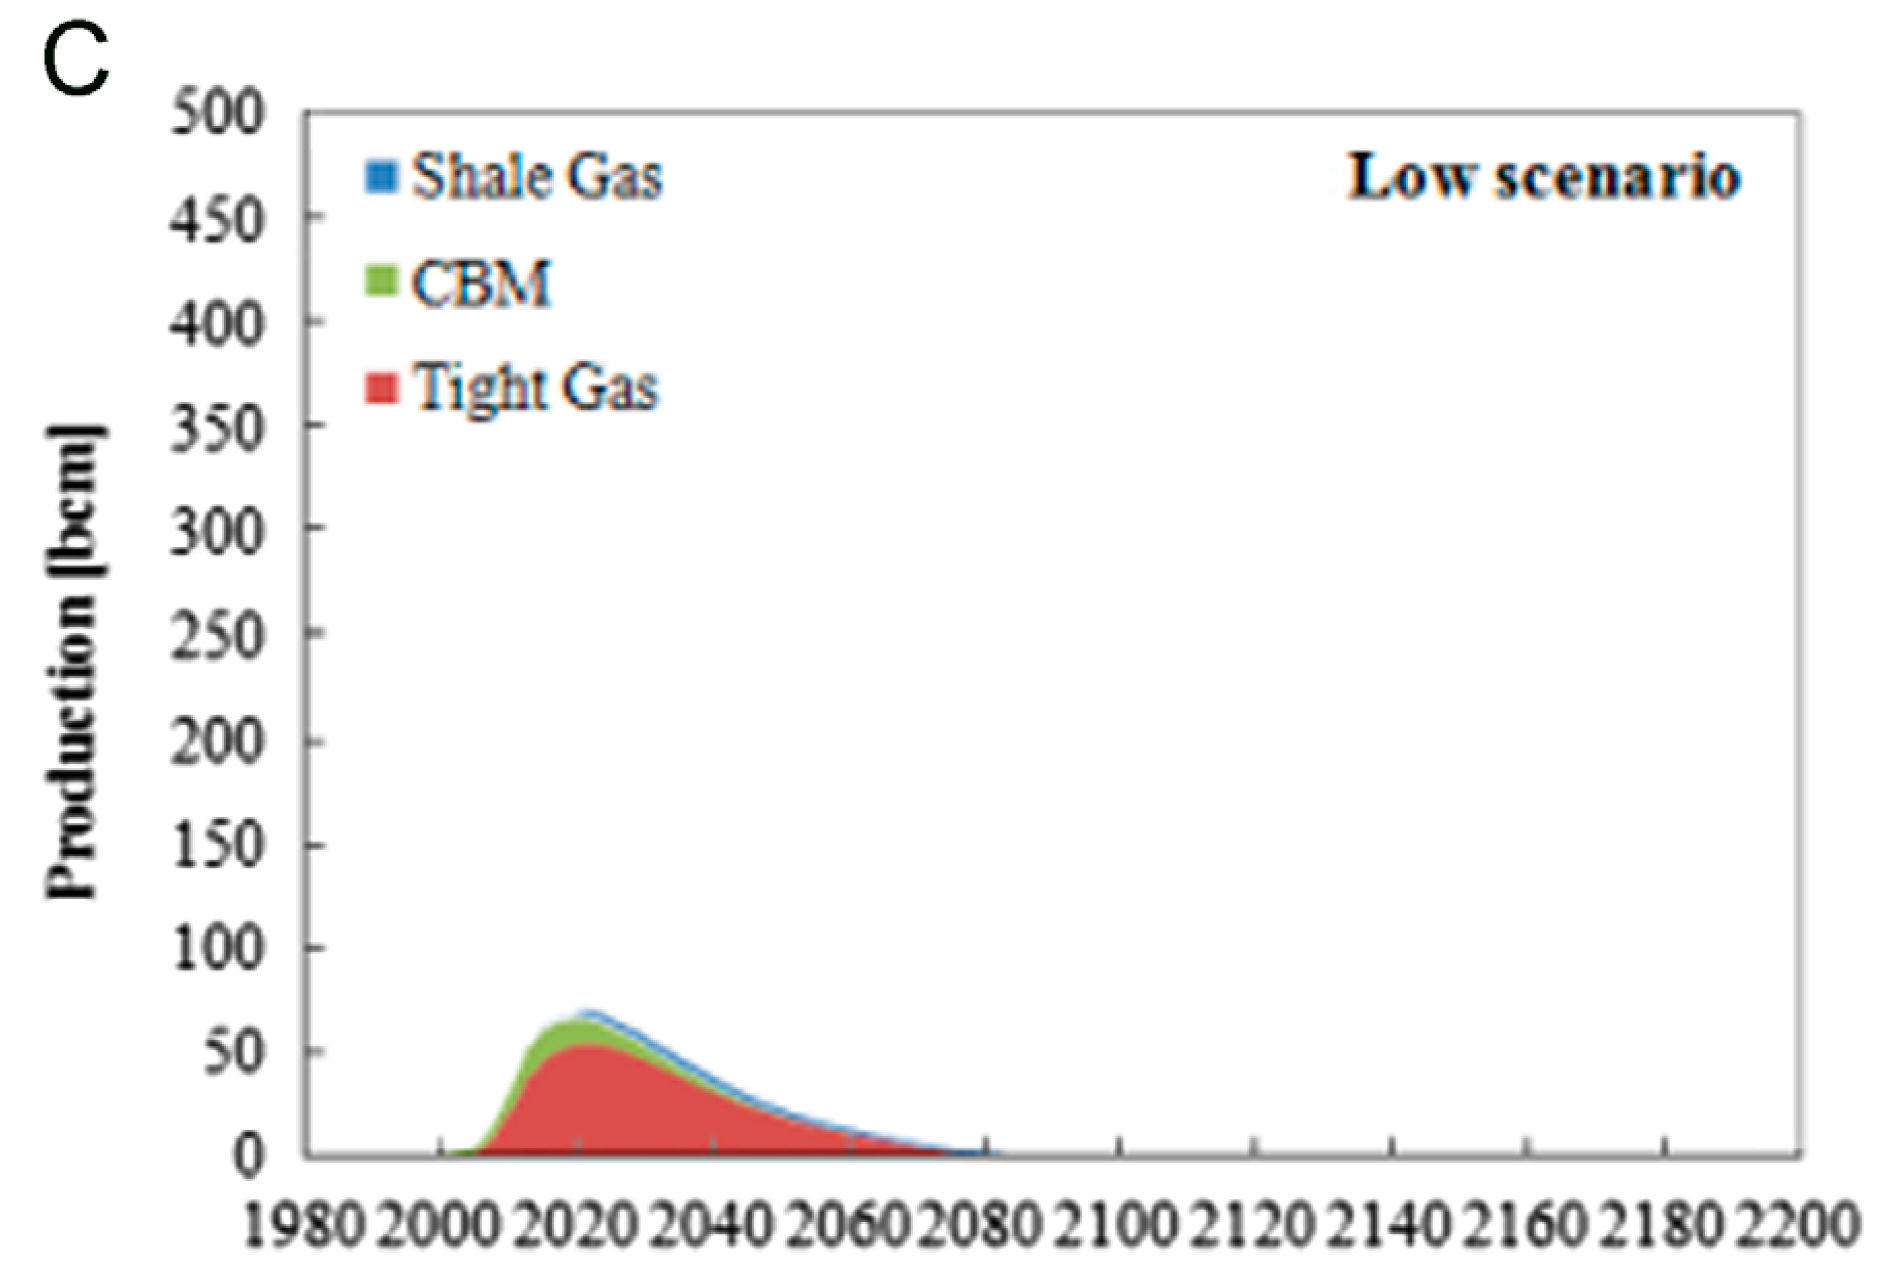
2.1.1. Natural Gas
2.1.2. Nuclear and Renewable Power
2.2. Energy Policy for Energy Substitution
2.2.1. Power Sector
2.2.2. Transport Sector
3. Materials and Methods
3.1. The LCOE Formula for the Power Sector
3.2. Total Ownership Costs (TOC) and Life Cycle Emissions Method for Transport Sector
3.3. Cost Assumptions Used
3.3.1. Generation Cost Assumptions
3.3.2. Transport Sector Assumptions
4. Results
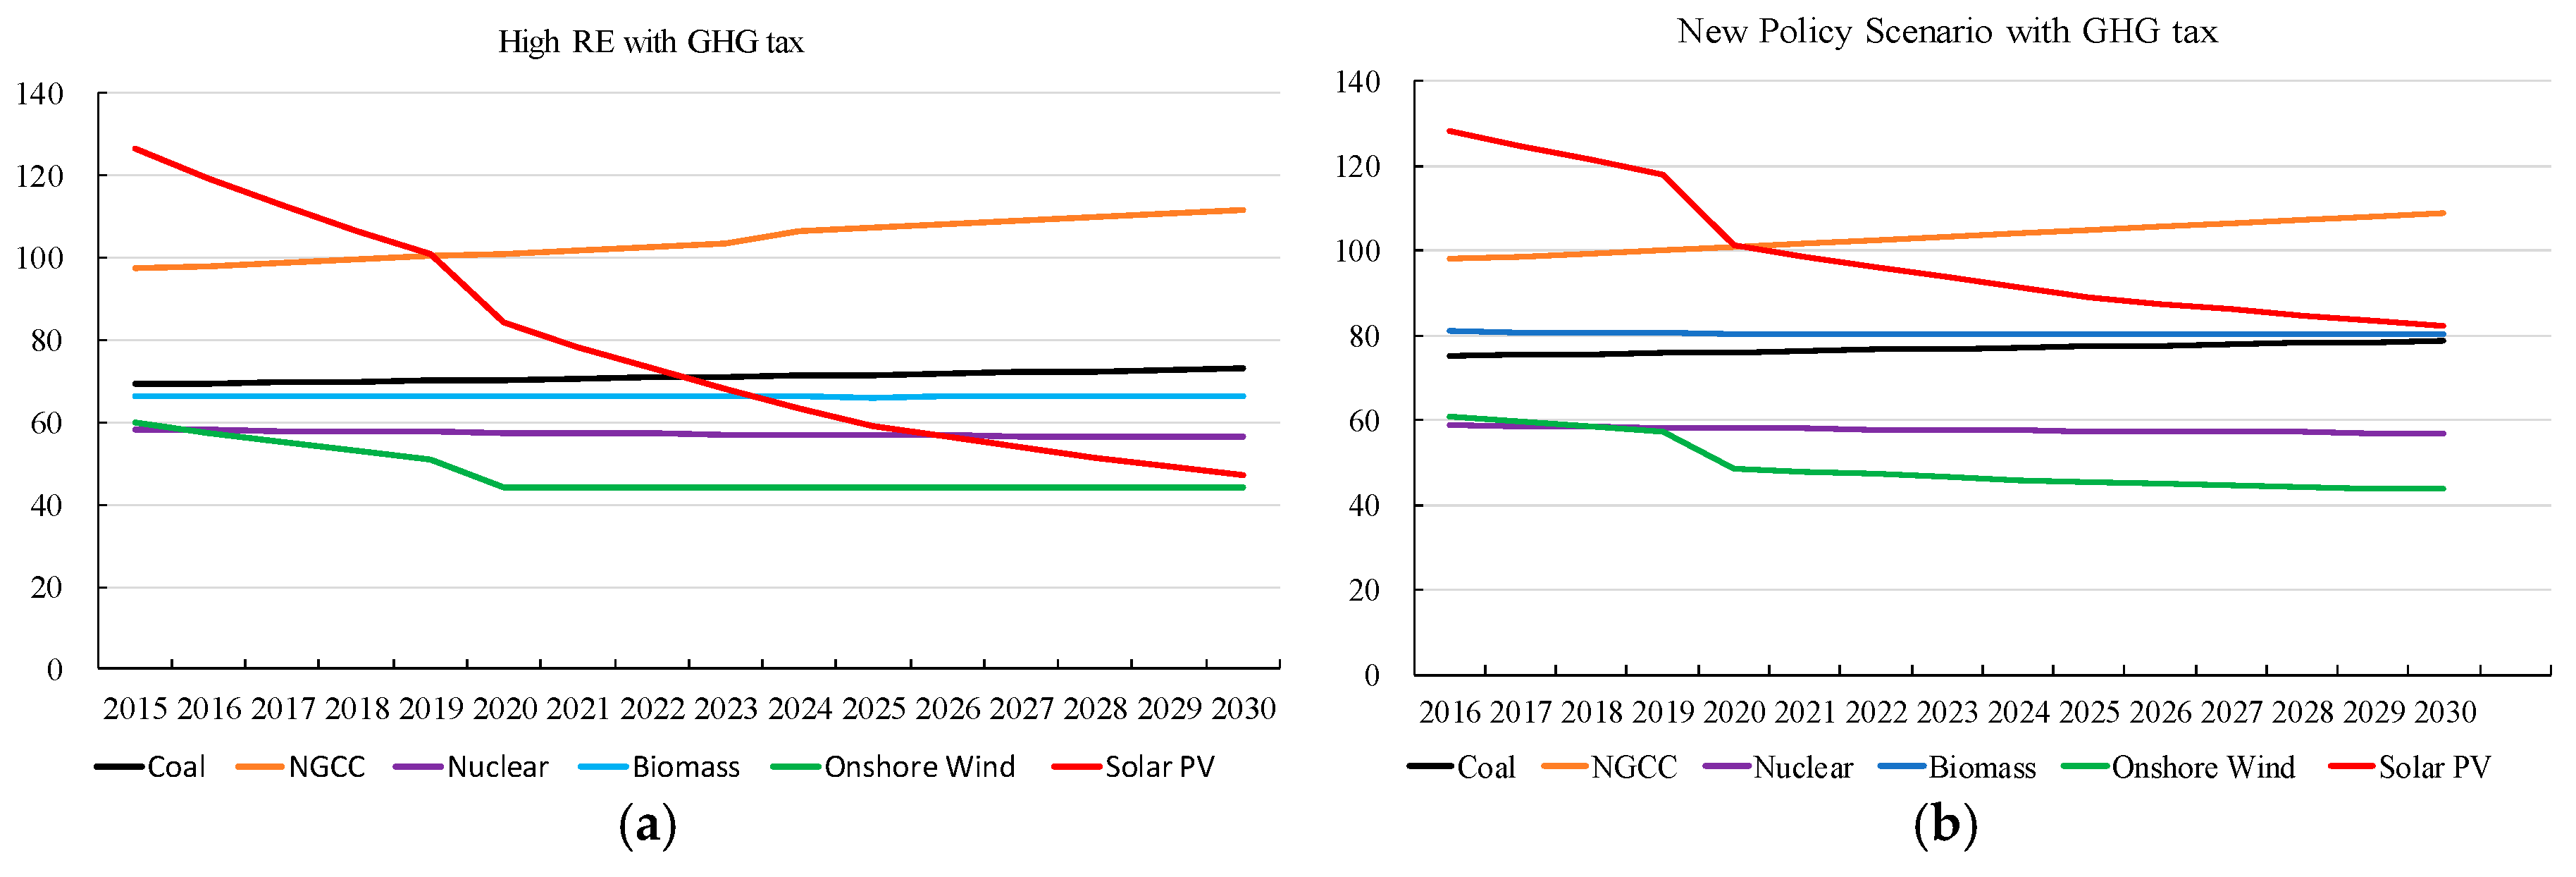
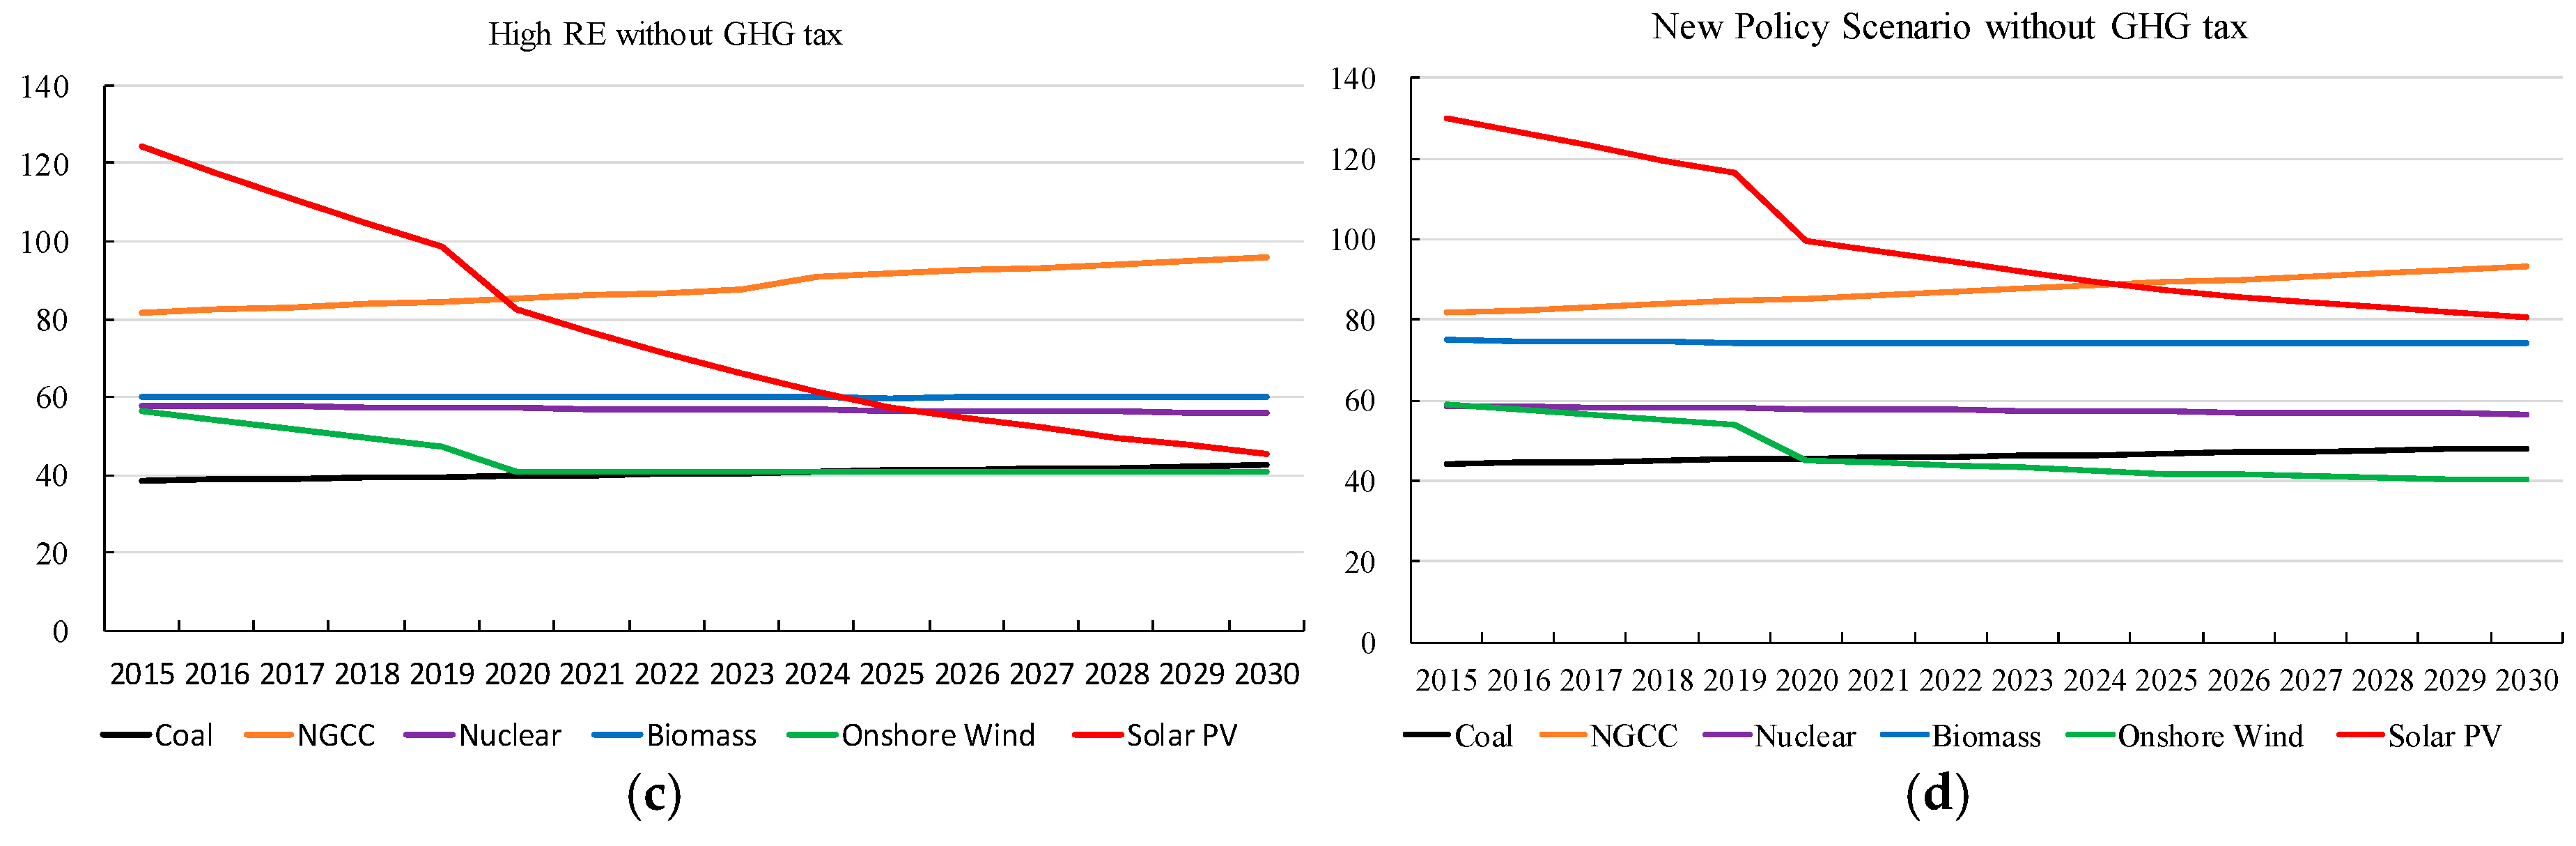
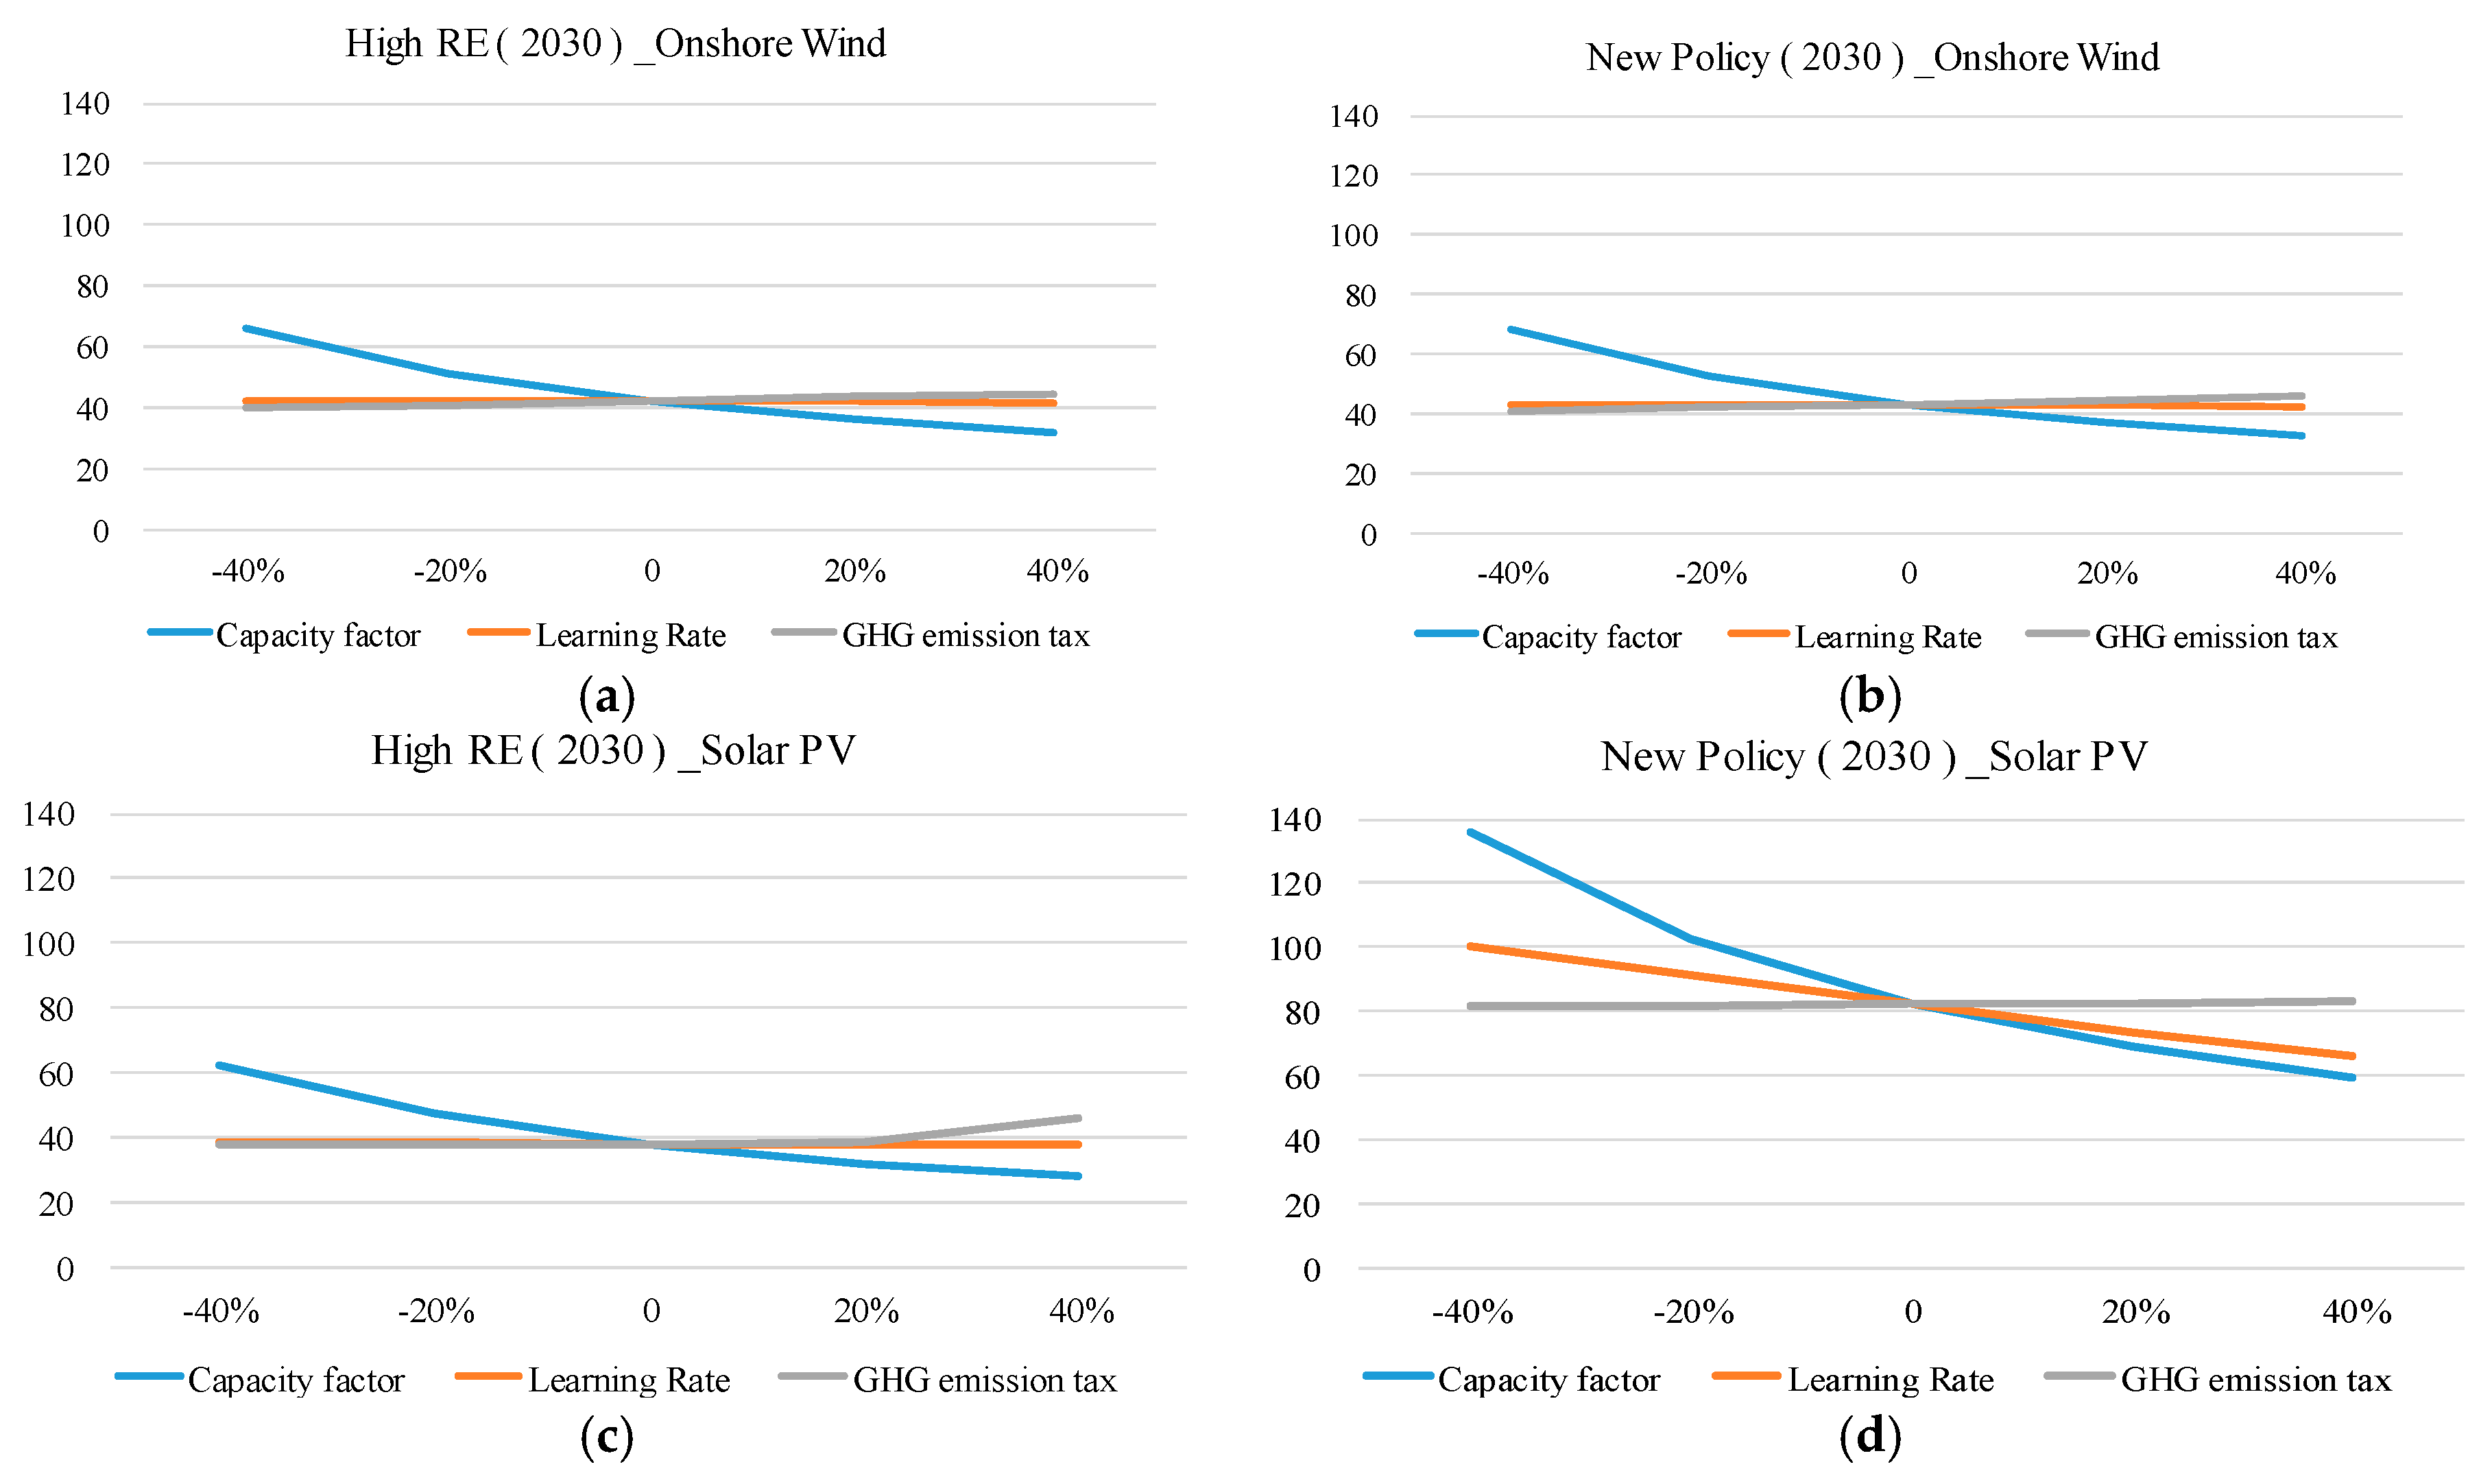
4.1. Power Sector
4.2. Transport Sector Cost
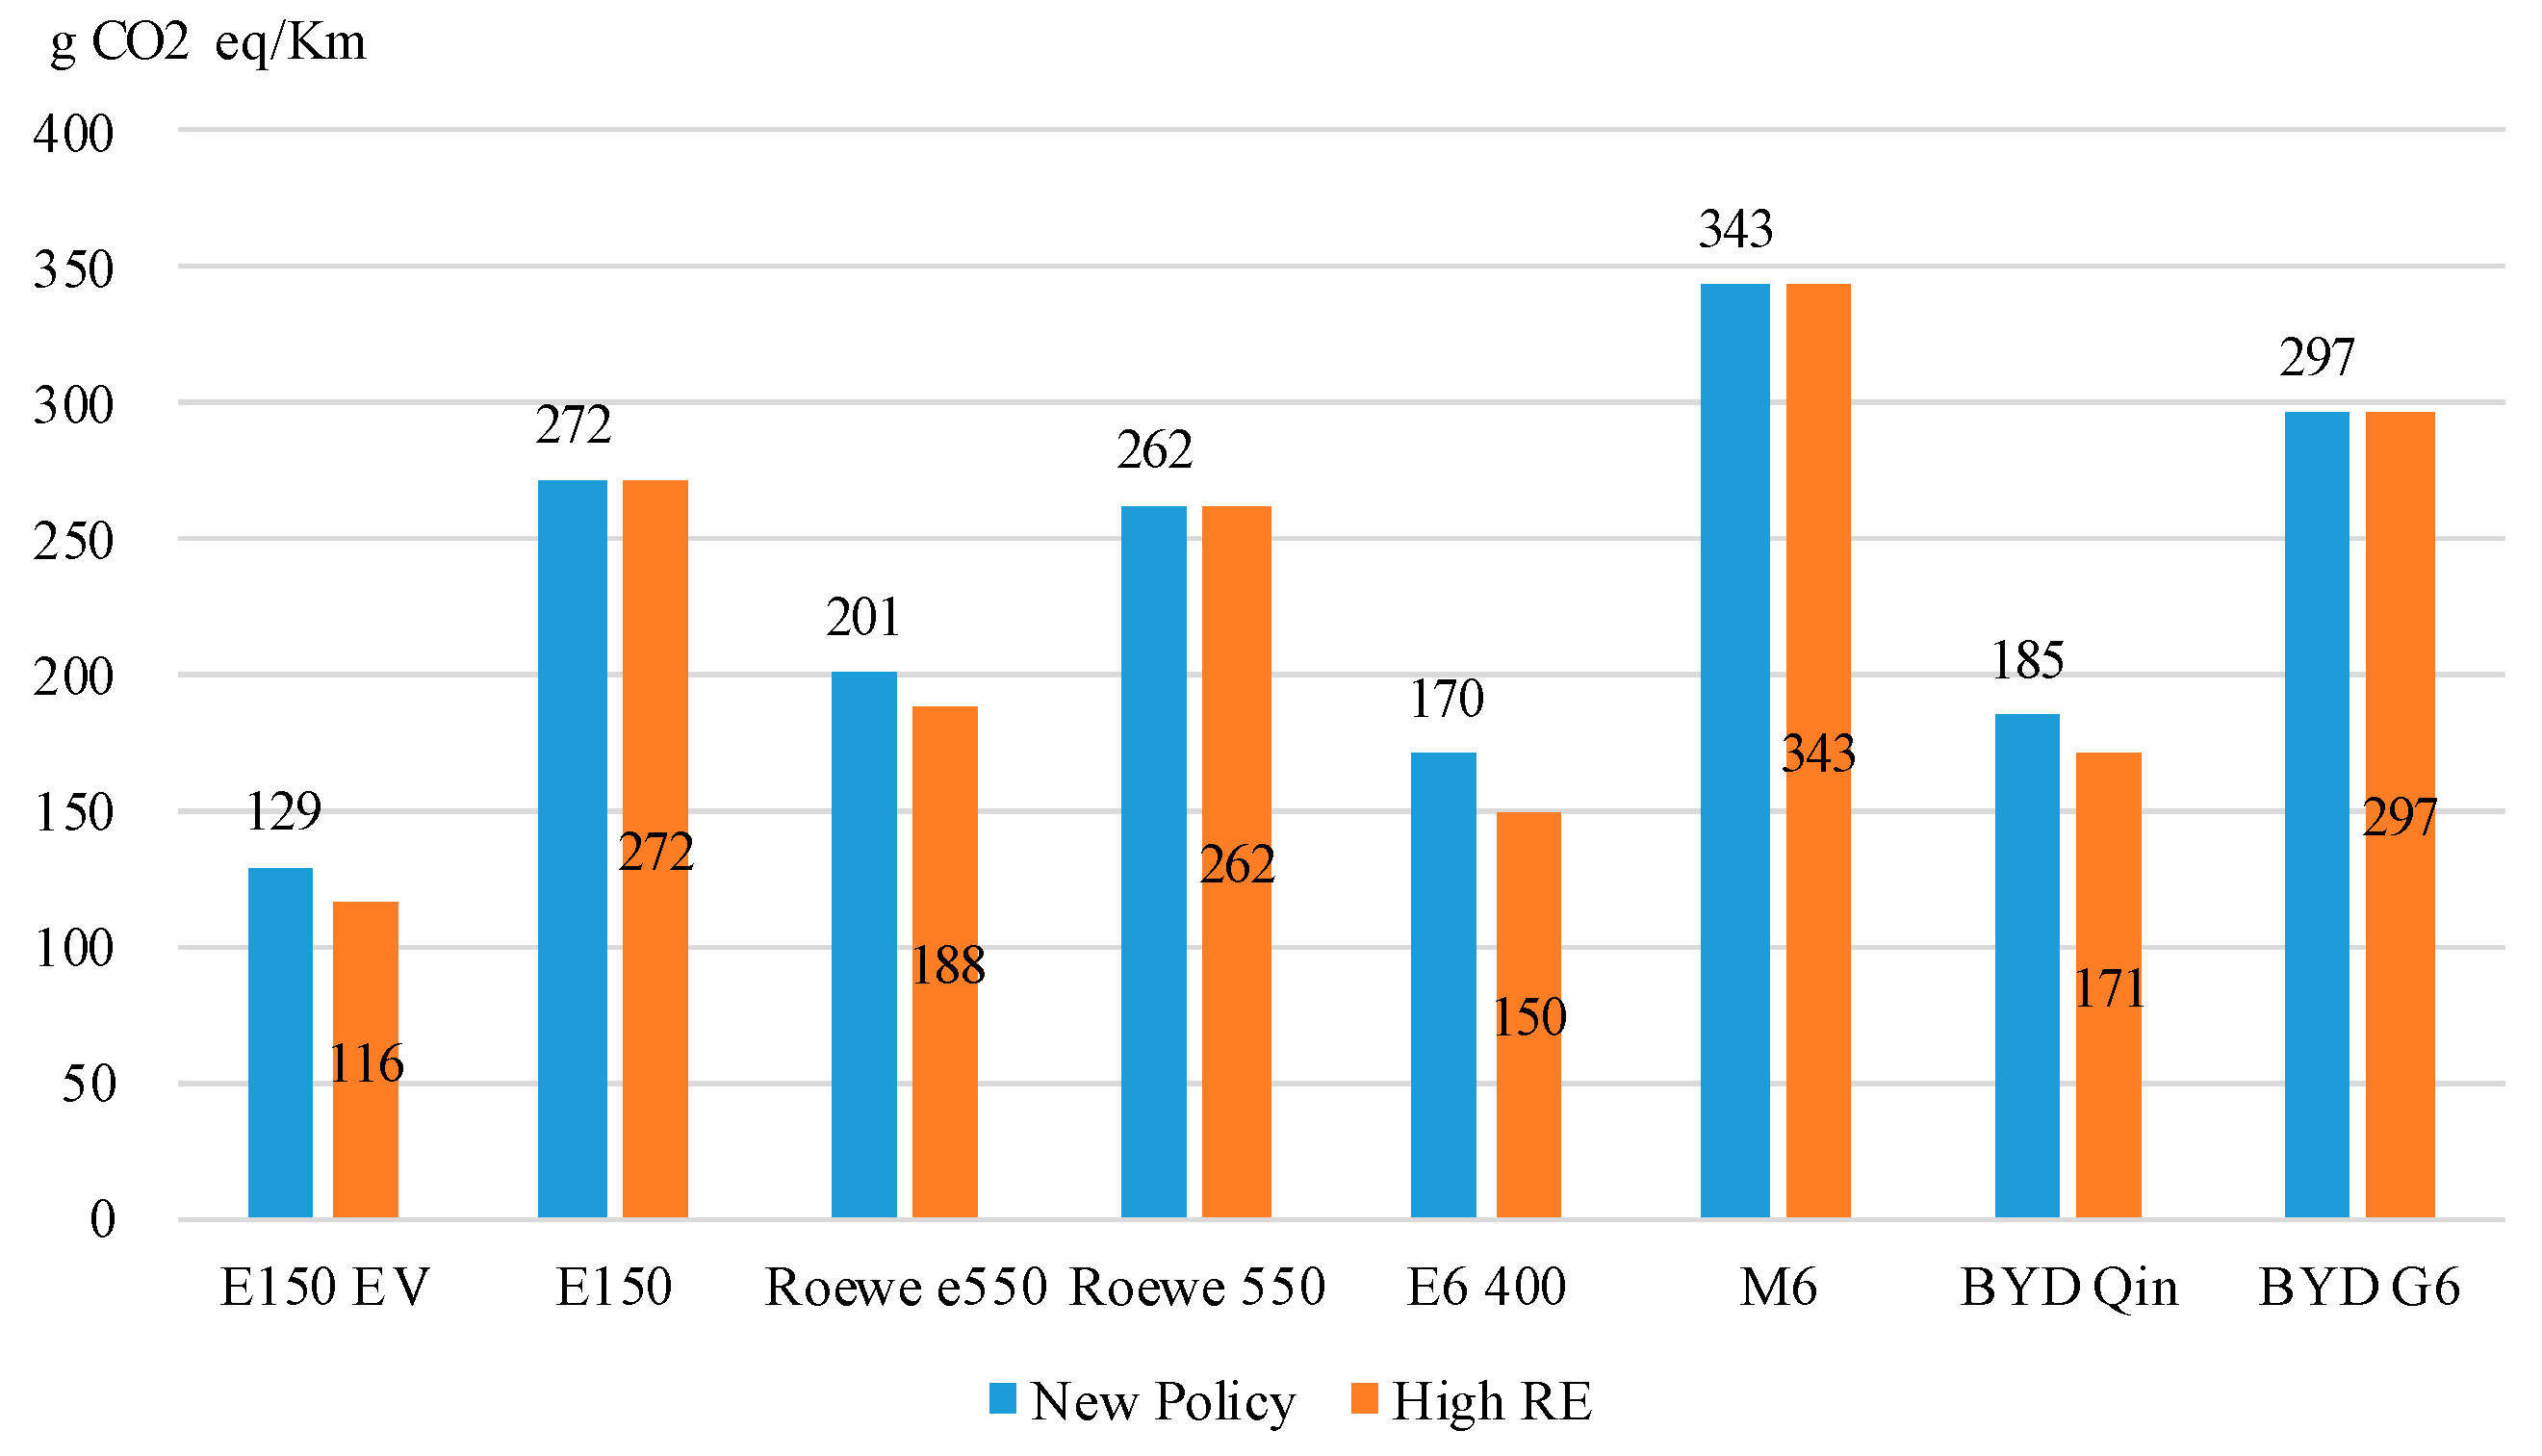
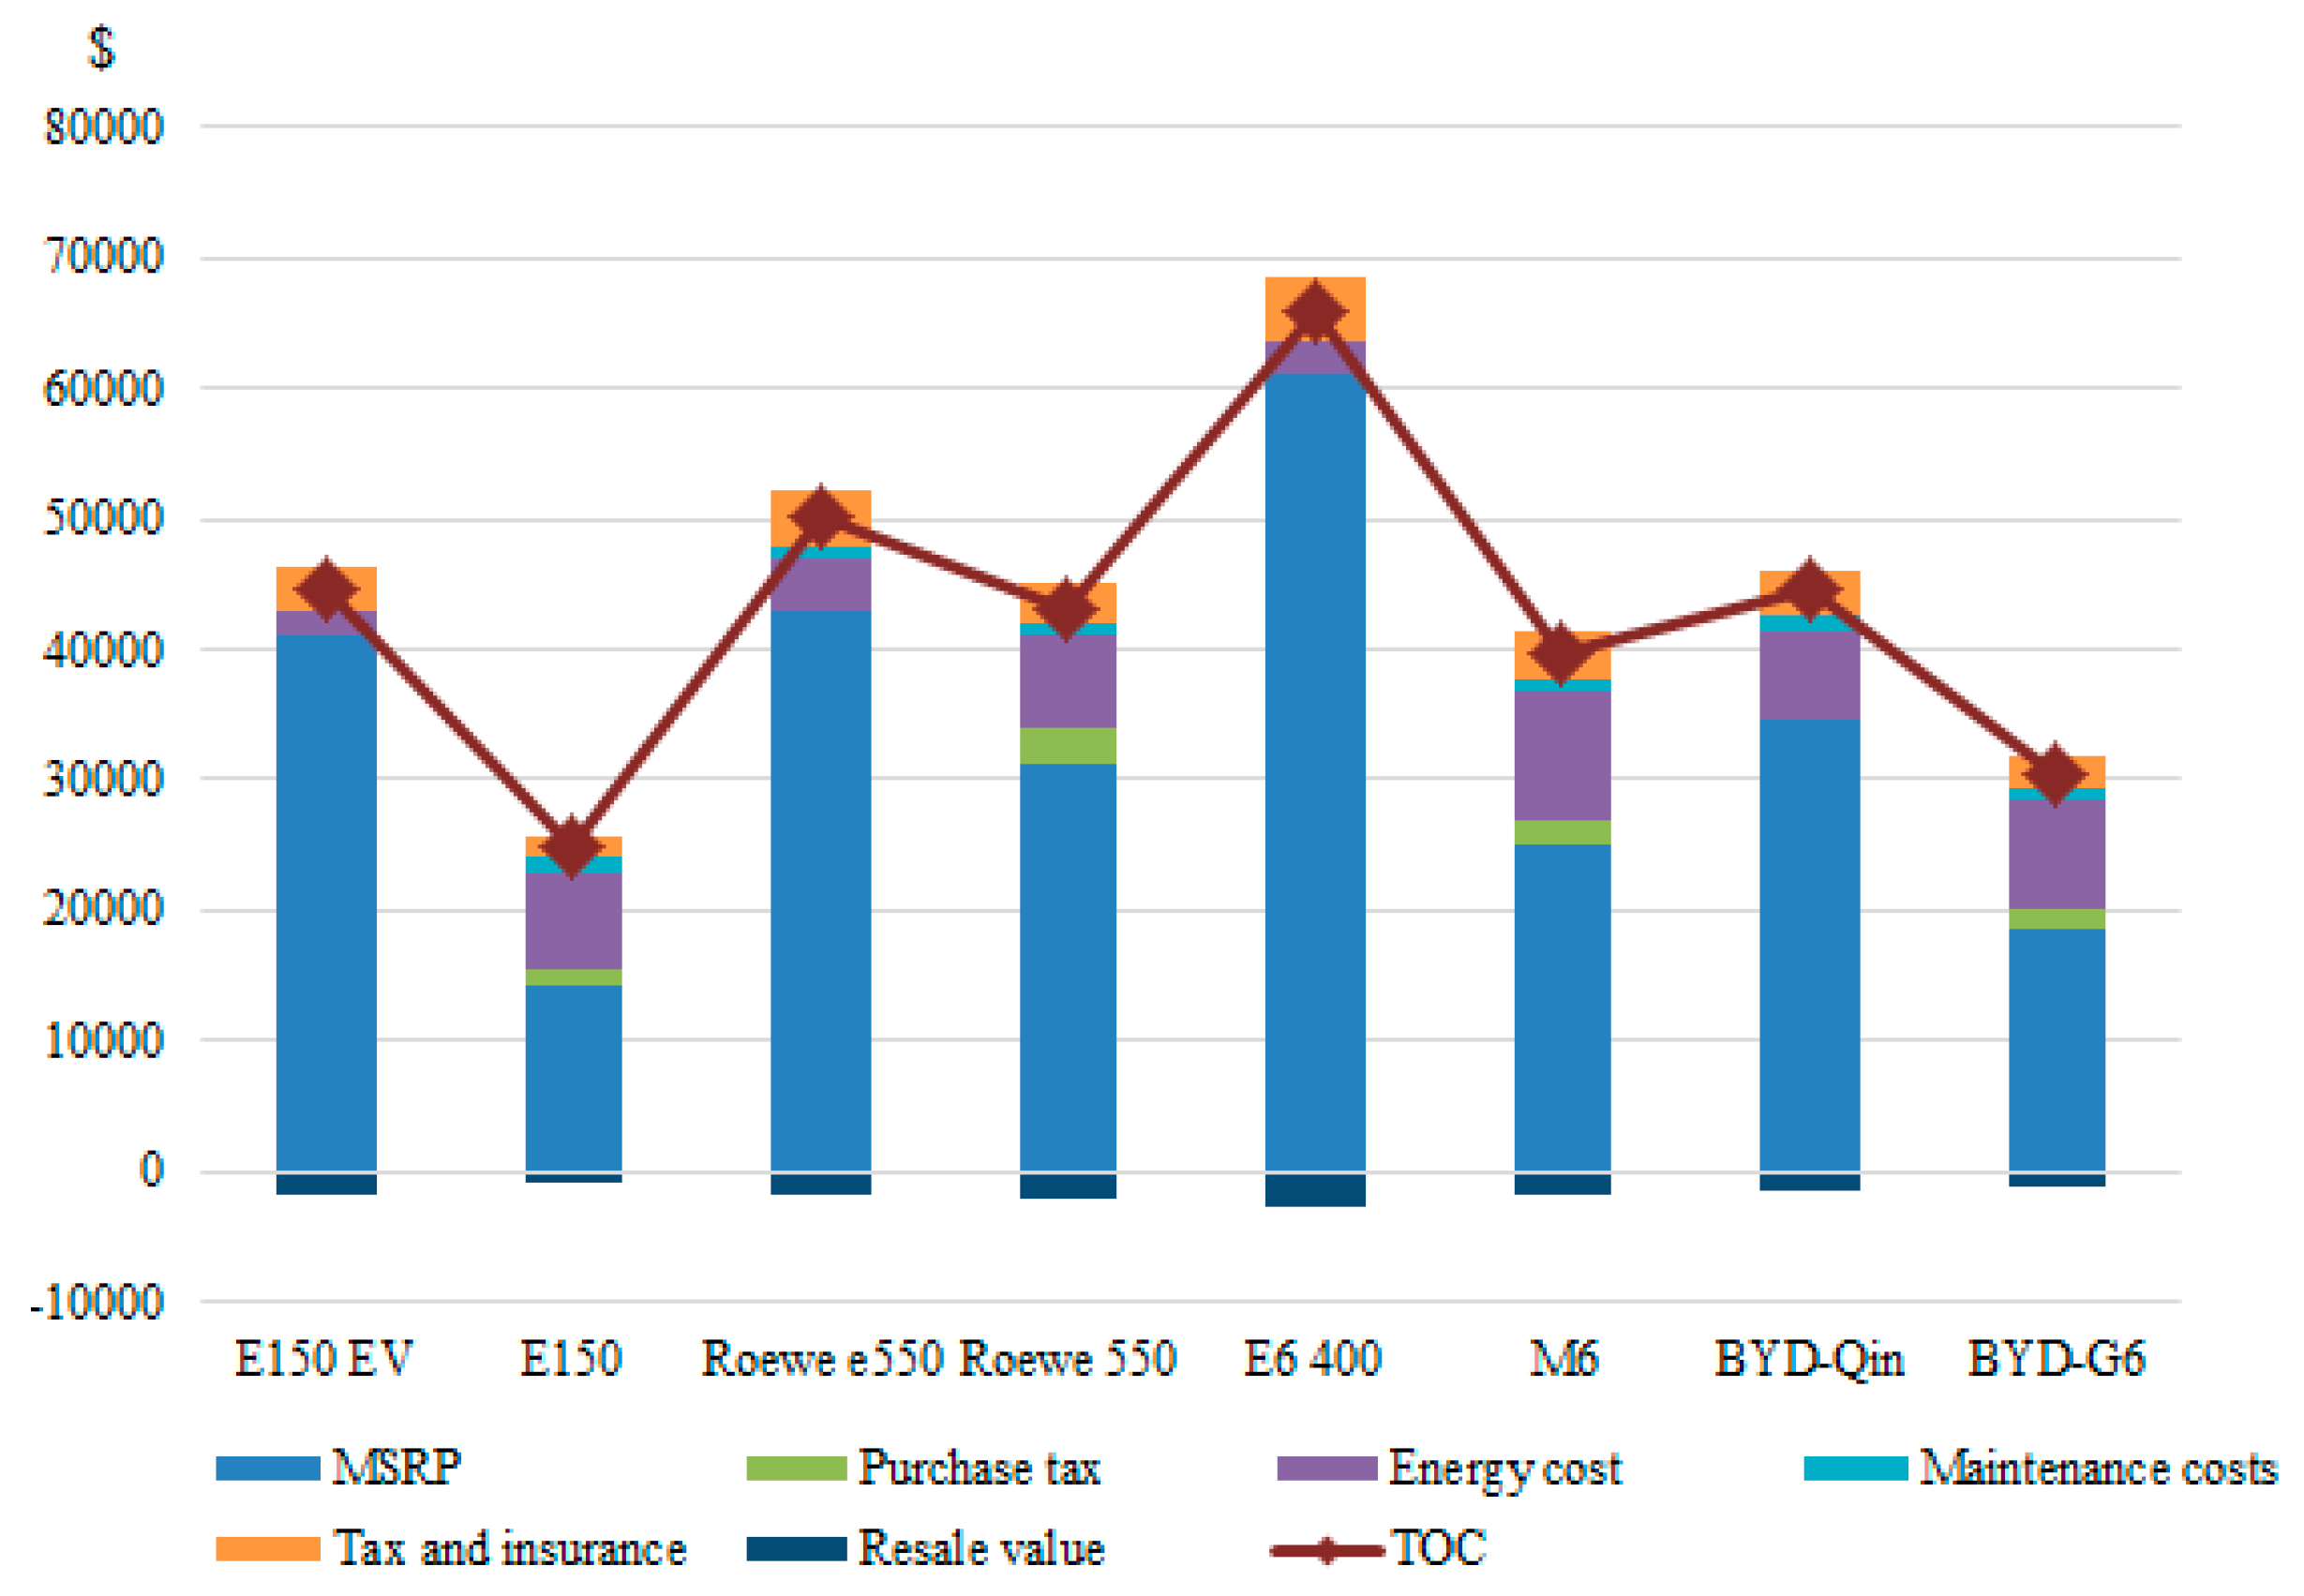
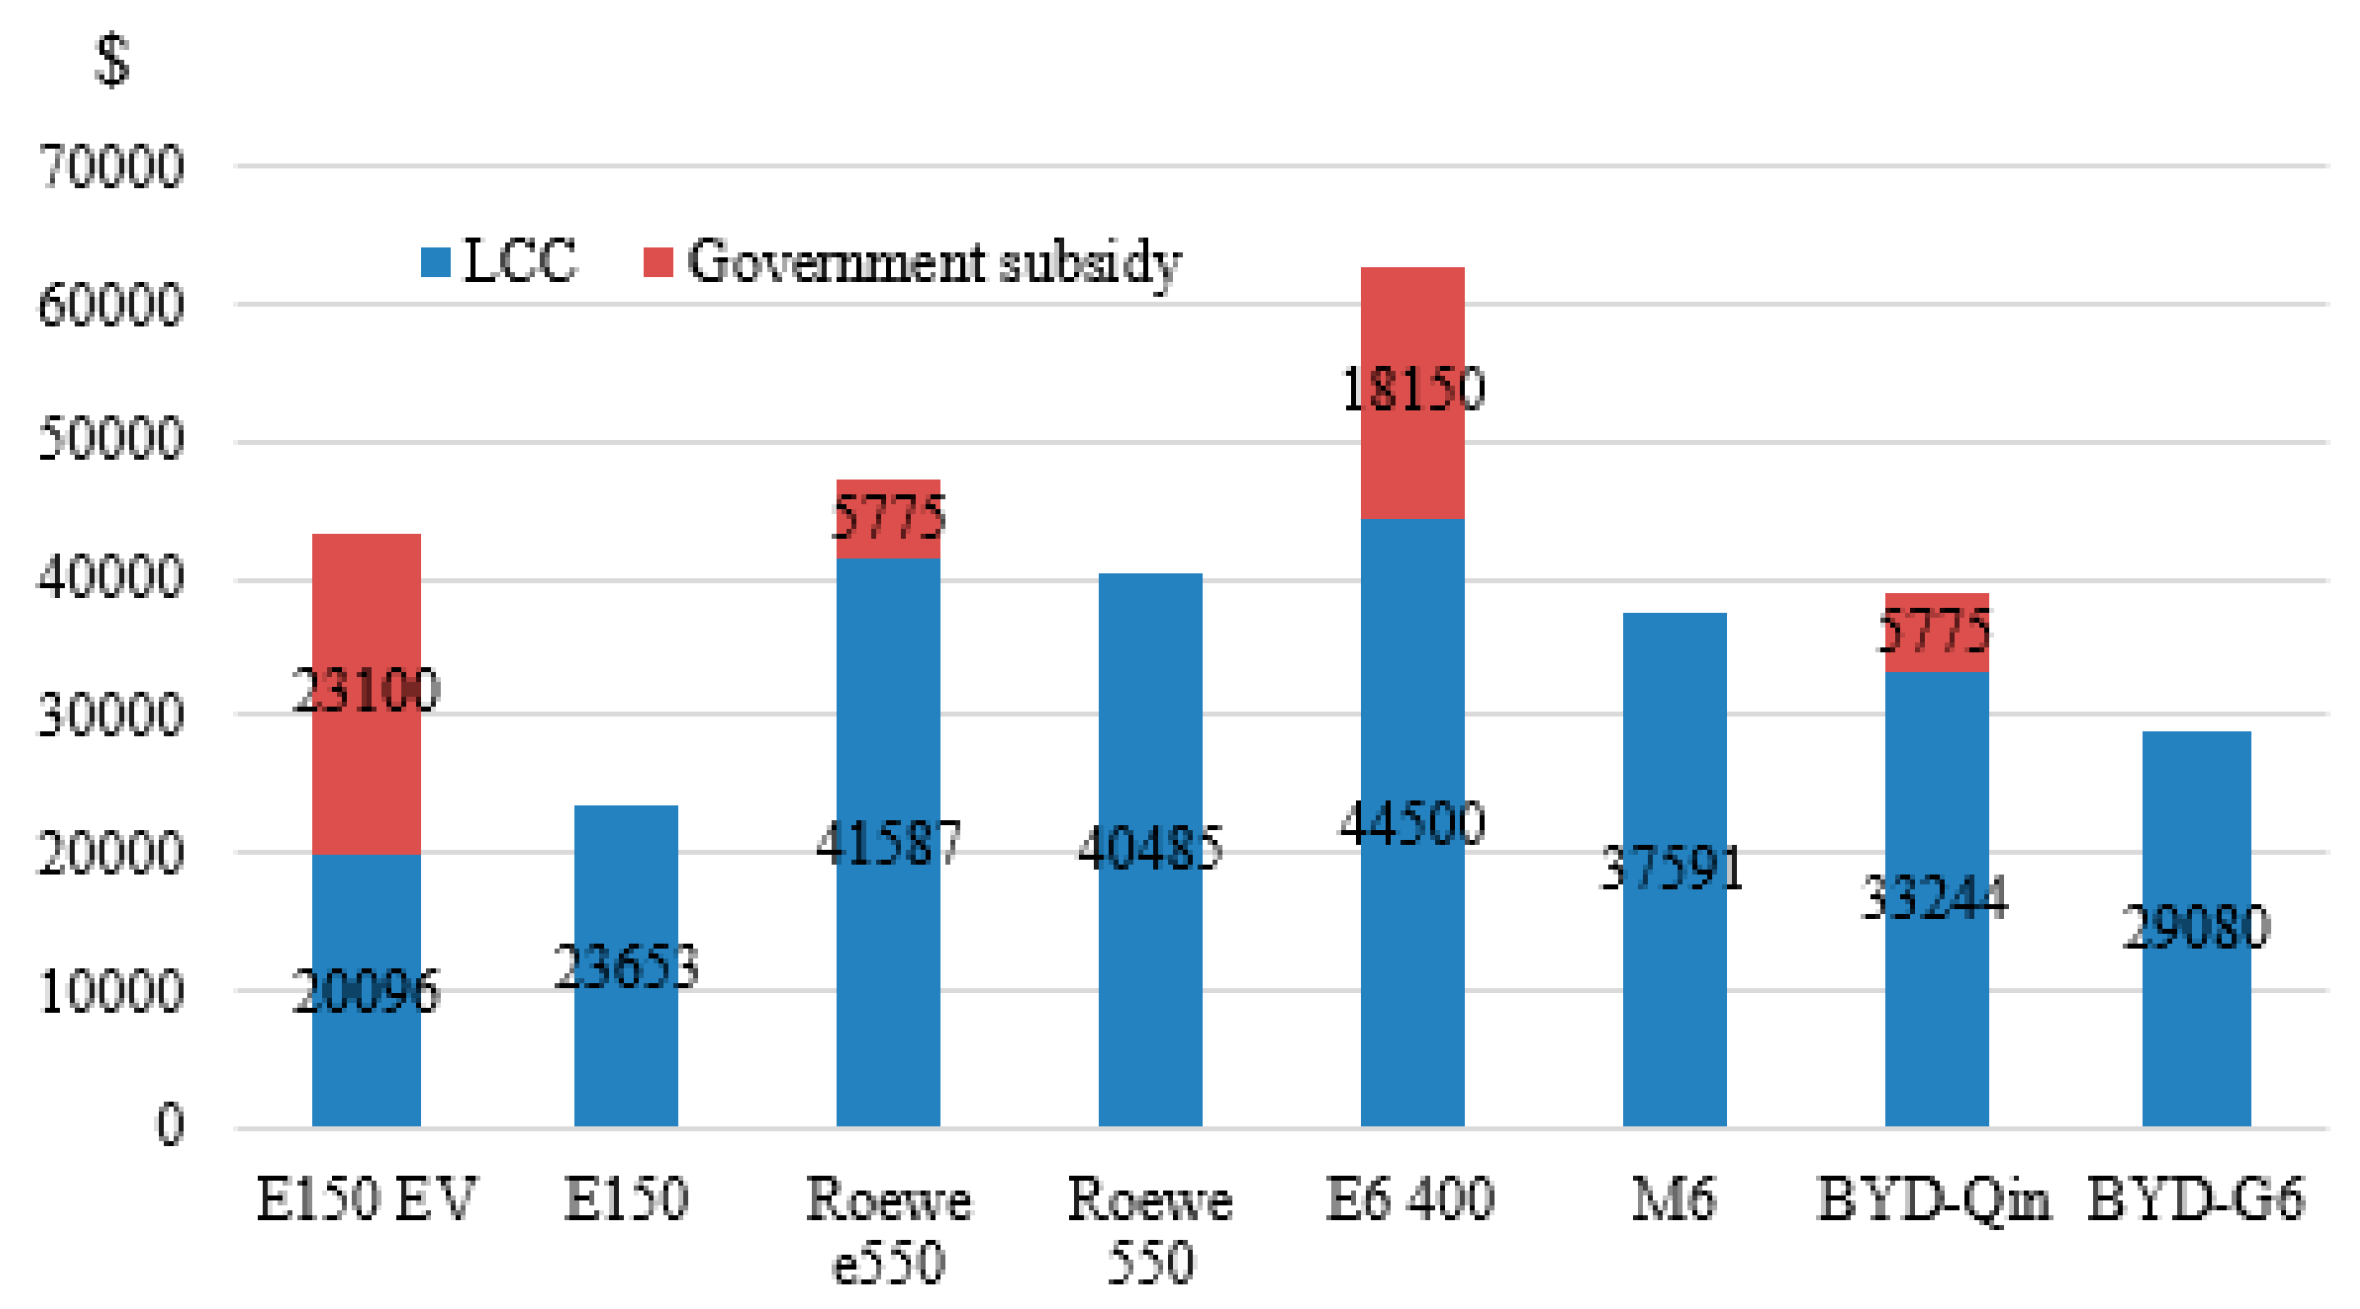
4.2.1. BEVs and PHEVs versus Conventional Vehicles
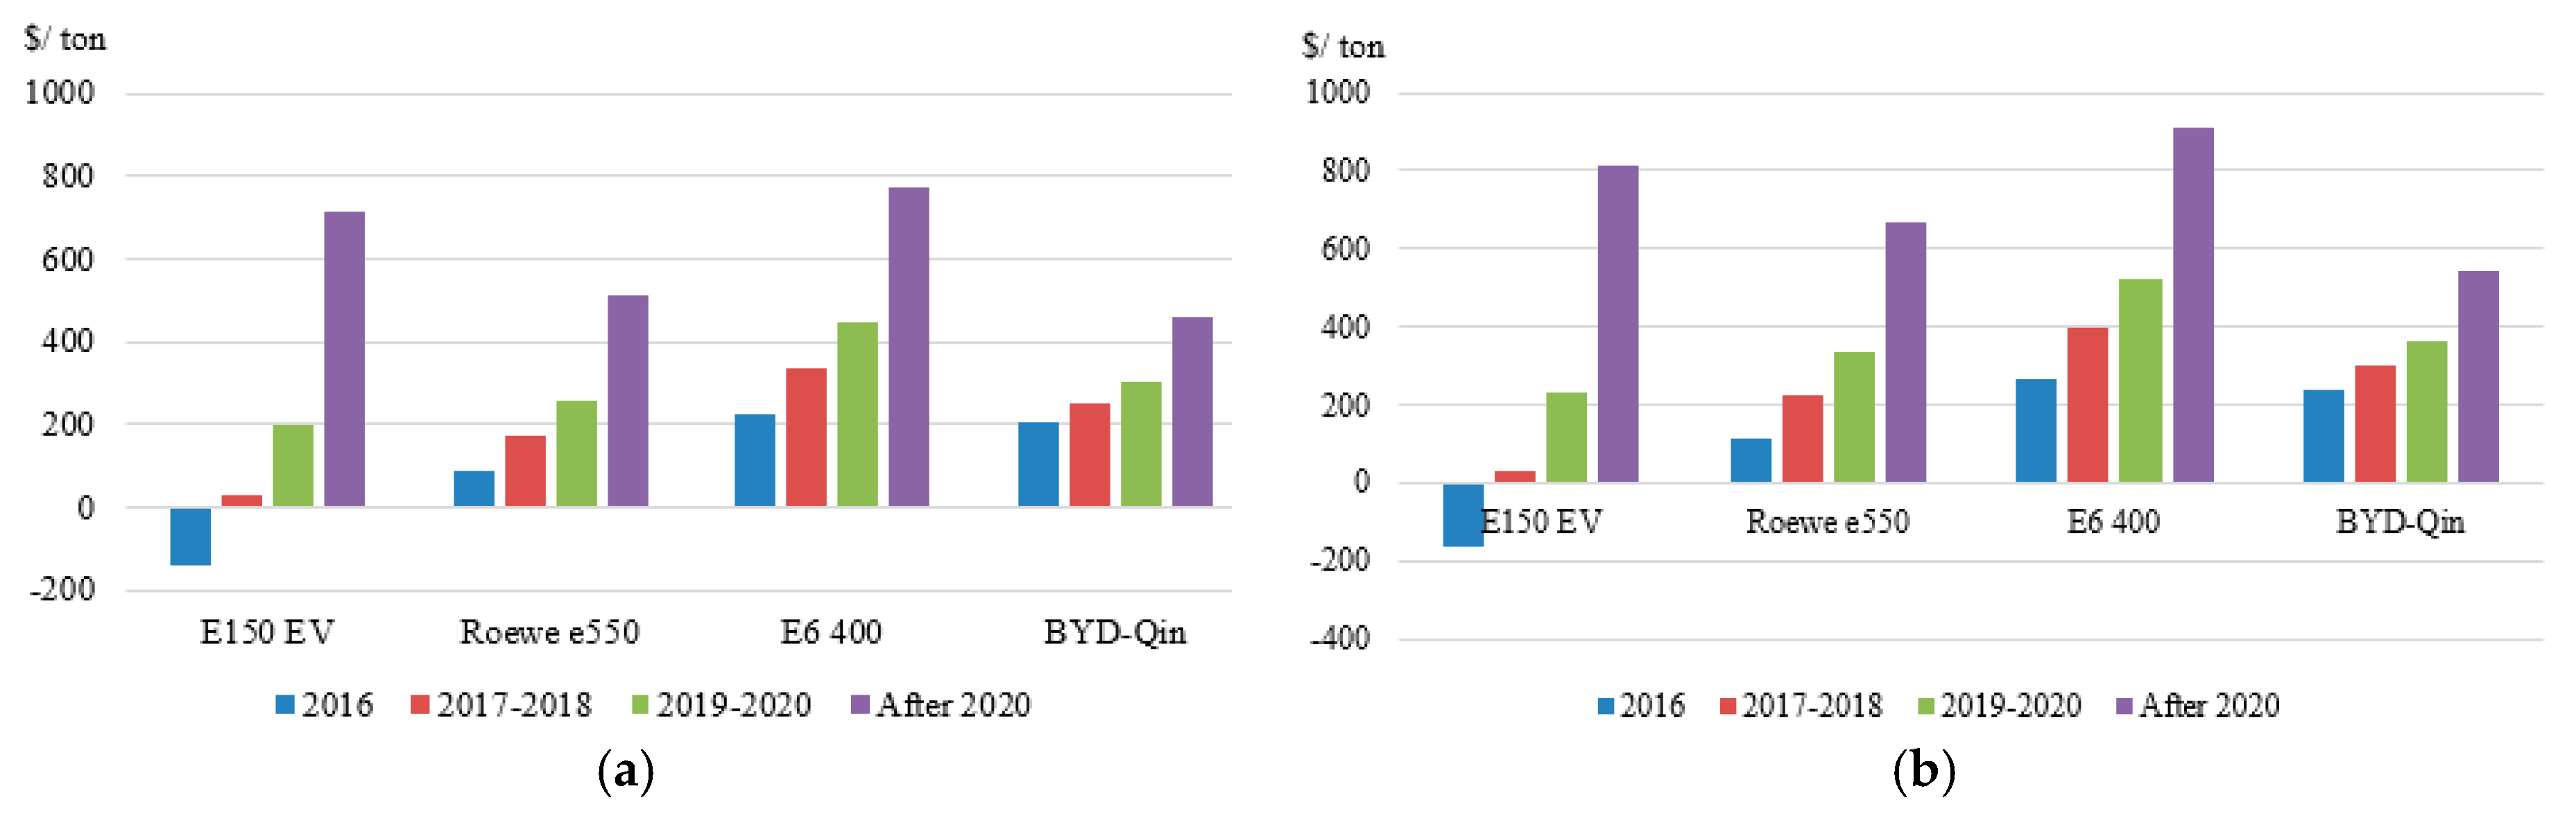
4.2.2. Natural Gas as an Alternative Energy to Replace Gasoline or Diesel-Fueled Vehicles
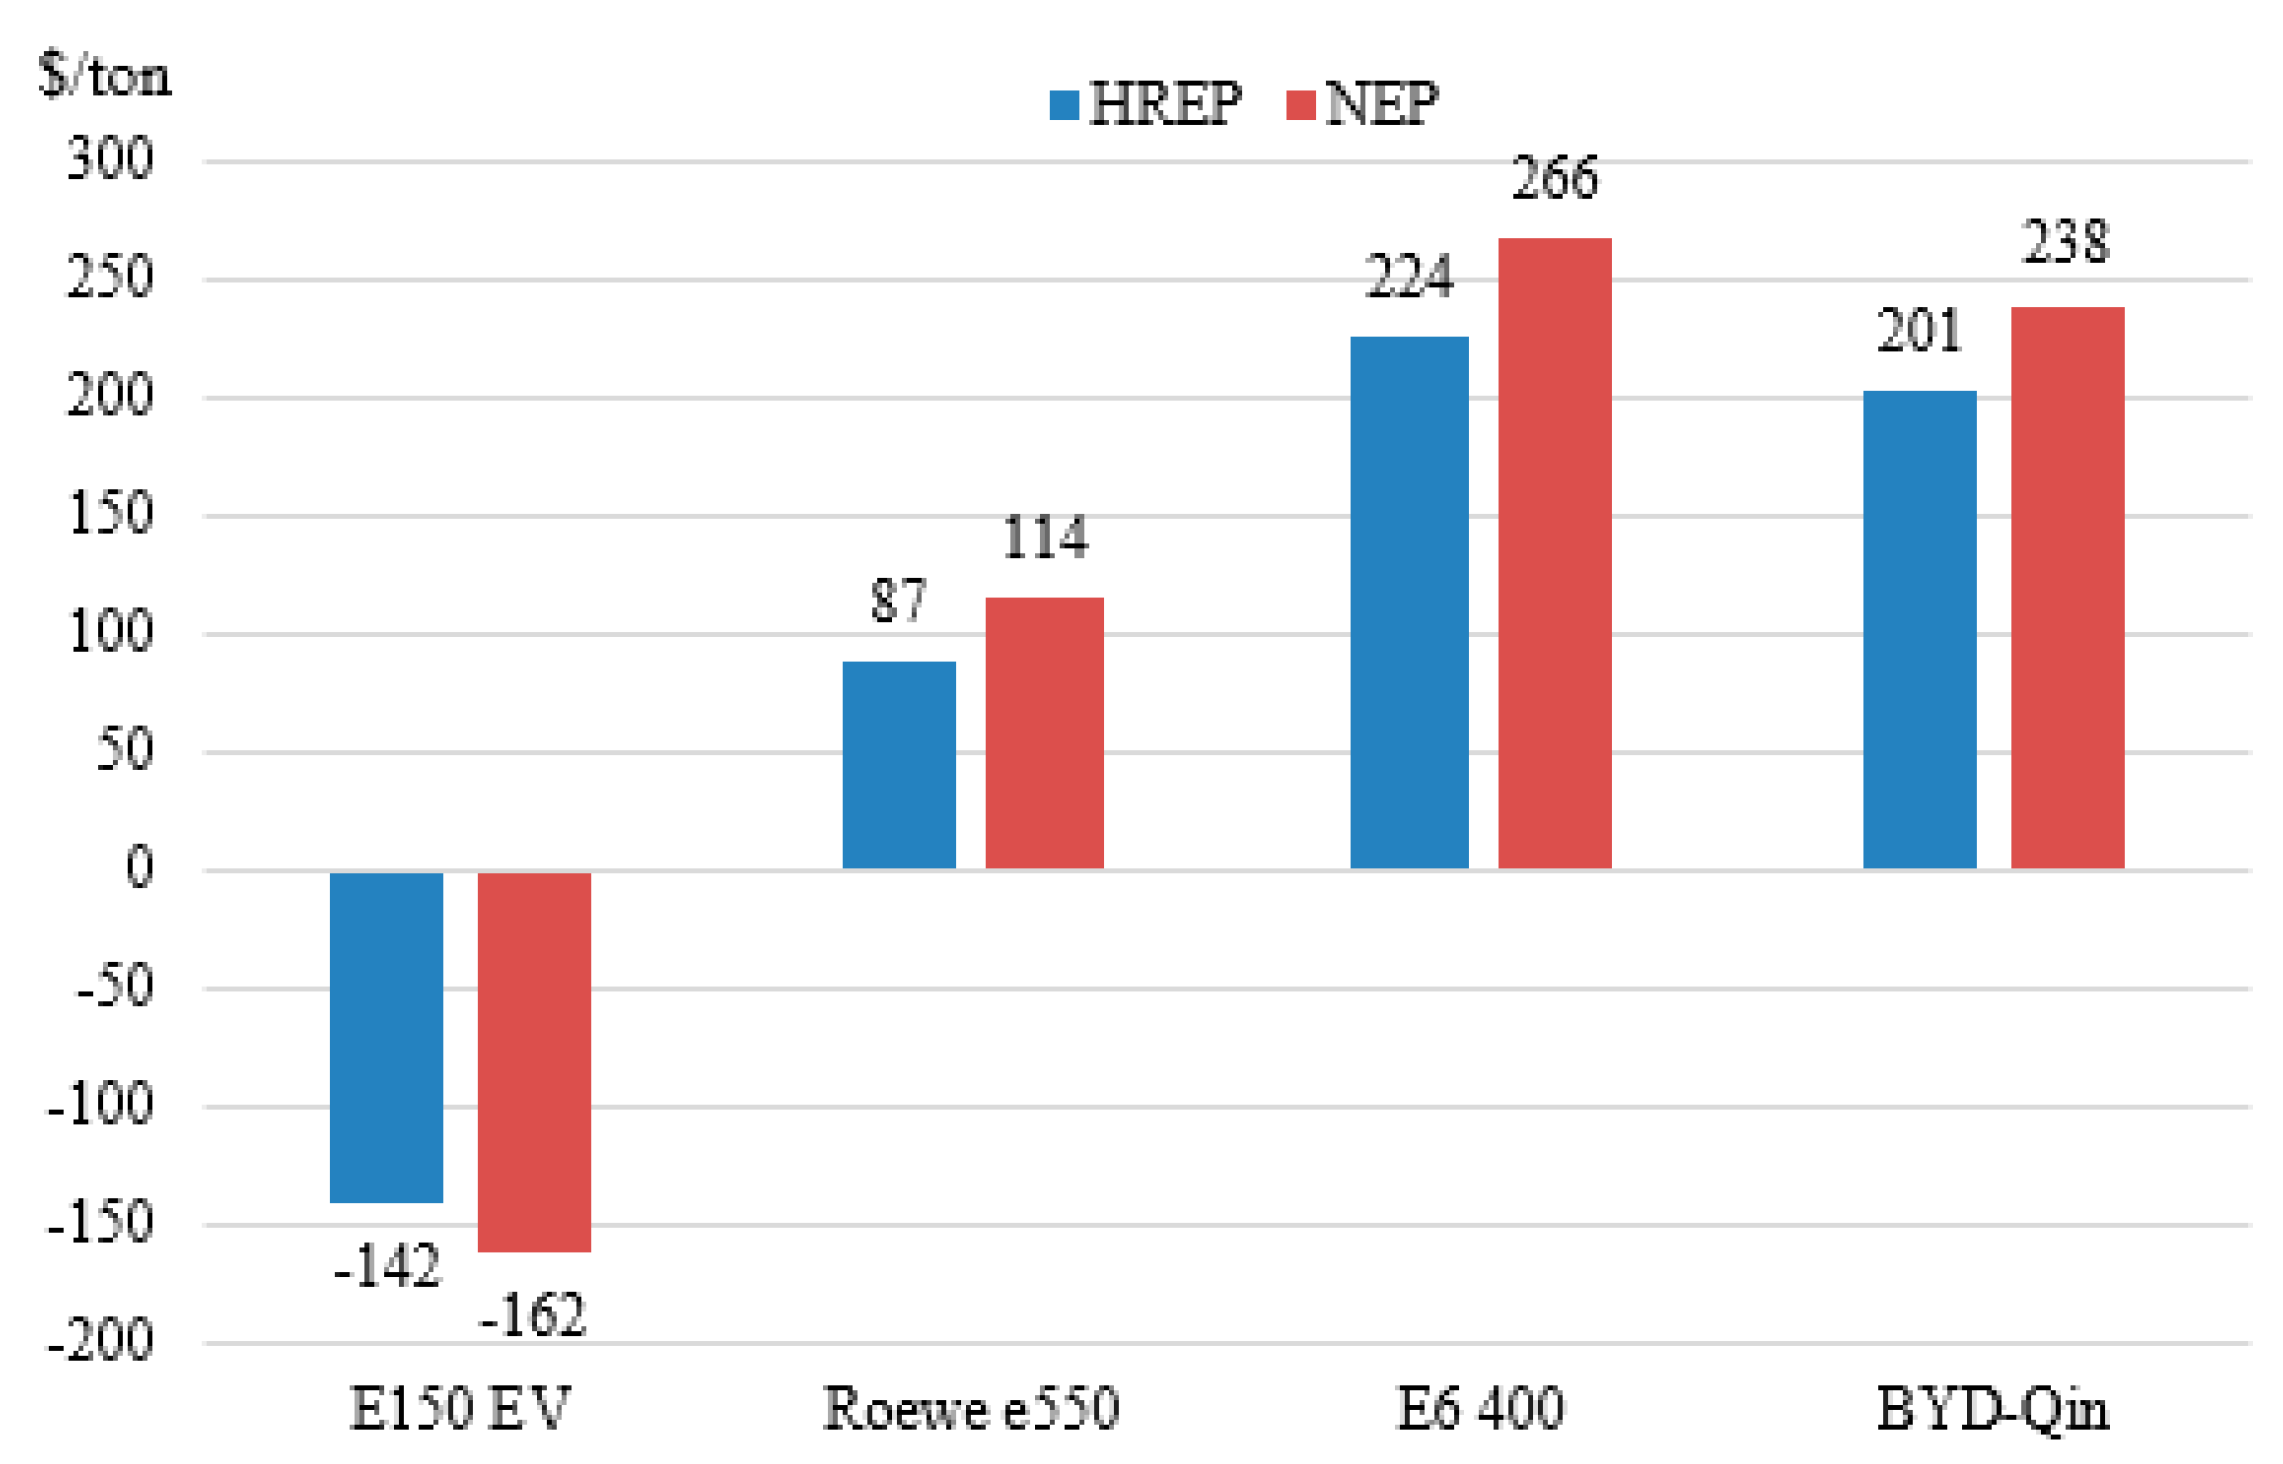
4.3. Subsidy Impacts
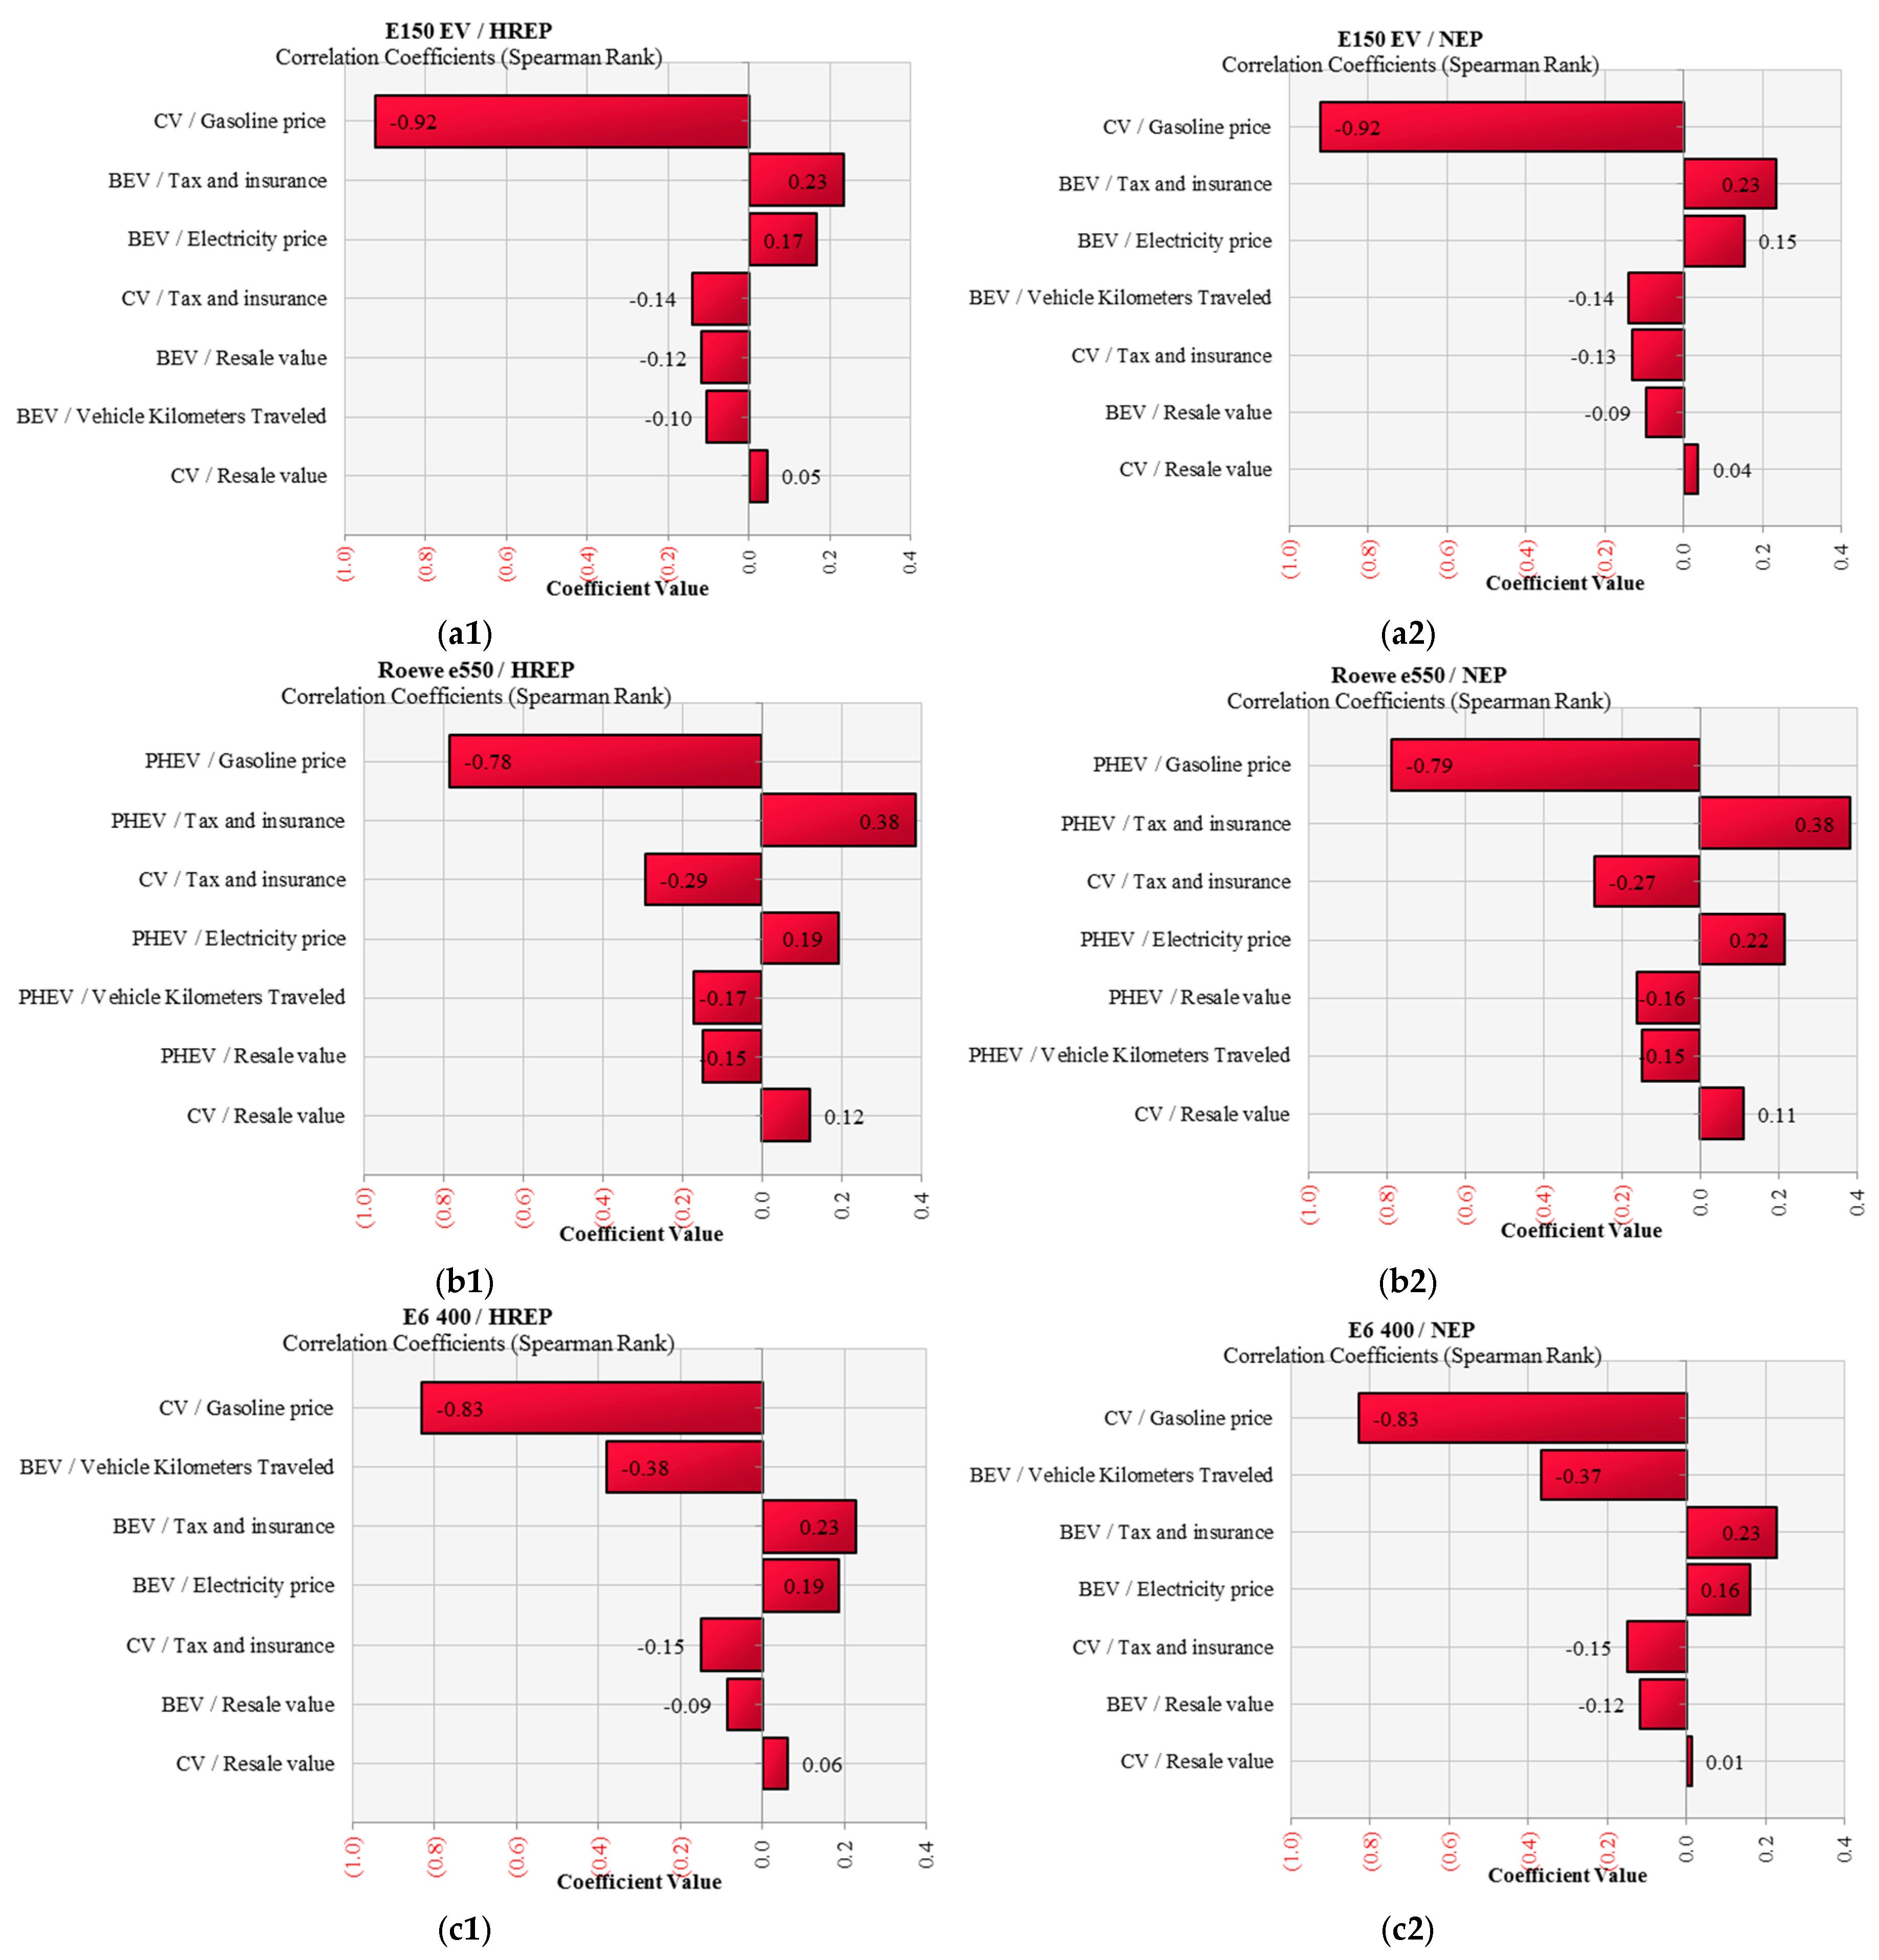
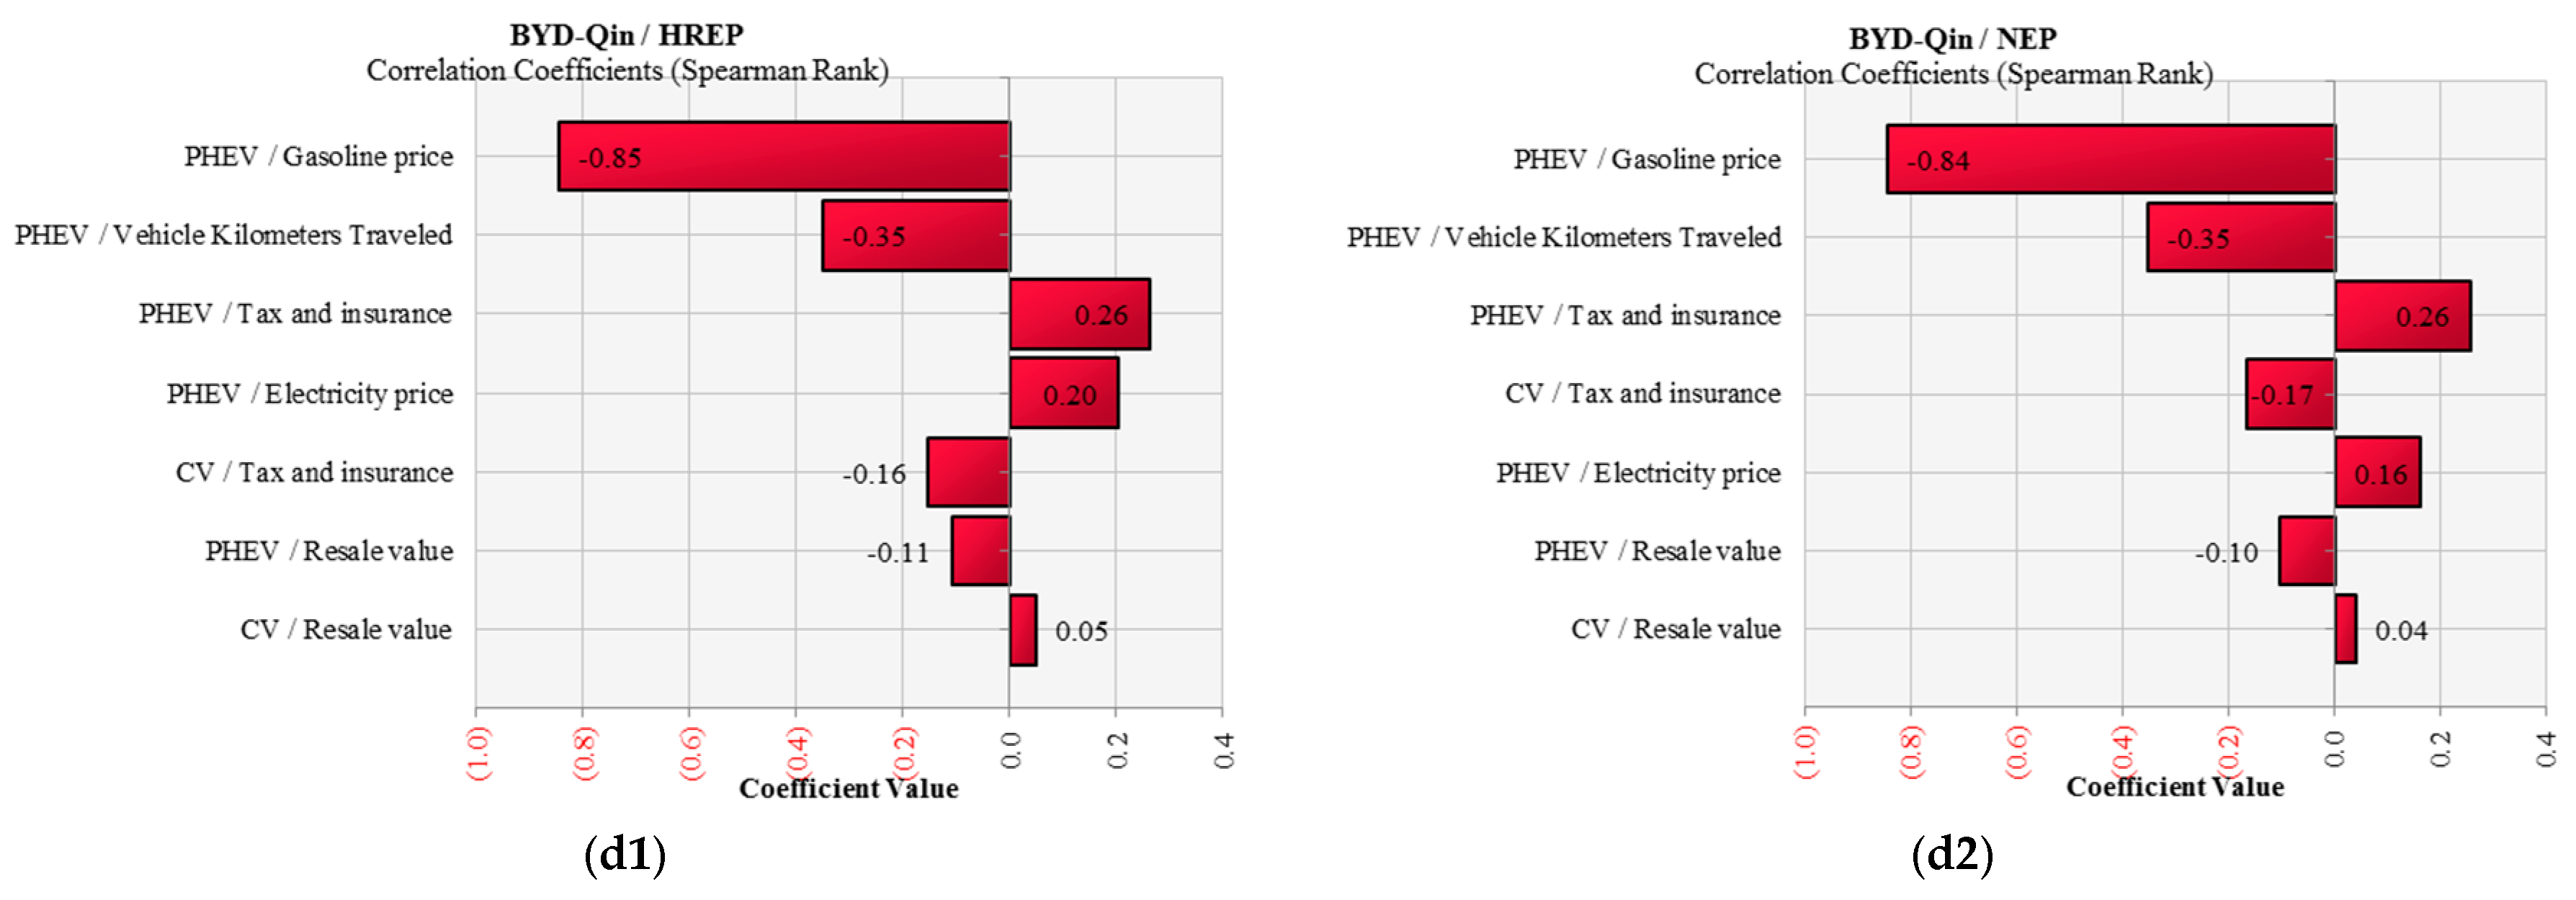
4.4. Fuel and Electricity Prices
5. Conclusions
Acknowledgments
Author Contributions
Conflicts of Interest
Abbreviations
| BEV | Battery electric vehicle |
| CBM | Coalbed Methane |
| EV | Electric vehicle |
| FIT | Feed-in-Tariff |
| GHG | Greenhouse Gas |
| HREP | High Renewable Energy Penetration |
| IEA | International Energy Agency |
| INDC | Intended Nationally Determined Contribution |
| LCOE | Levelized cost of electricity |
| LNG | Liquefied Natural Gas |
| MSRP | Manufacturer suggested retail price |
| NGCC | Natural Gas Combined Cycle |
| NGV | Natural gas vehicle |
| OECD | Organization for Economic Co-operation and Development |
| PHEV | Plug-in hybrid electric vehicle |
| RE | Renewable energy |
| tcm | trillion cubic meters |
| OCC | Overnight Capital Cost |
| URR | Ultimately recoverable resource |
Appendix A

| Process | GHG (kg CO2 eq/KWh) |
|---|---|
| Coal production | 9.888 × 10⁻² |
| coal | 1.890 × 10⁻² |
| equipment transportation | 4.136 × 10⁻⁴ |
| equipment production | 1.537 ×10⁻⁵ |
| power plant construction | 1.537 ×10⁻⁵ |
| Power plant operation | 9.143 ×10⁻⁴ |
| Total | 1.02 |
| Process | CO2 | CH4 | N2O |
|---|---|---|---|
| Building materials transportation | 7.48 × 10⁻³ | 3.80 × 10⁻⁷ | 3.68 × 10⁻⁵ |
| power plant construction | 1.40 | 6.21 × 10⁻³ | 9.34 × 10⁻⁵ |
| retirement | 1.40 × 10⁻¹ | 6.21 × 10⁻⁴ | 9.34 × 10⁻⁶ |
| Fuel production | 66 | 2.77 | 5.77 × 10⁻⁴ |
| fuel transportation | 3.42 × 10⁻¹ | 8.00 × 10⁻⁴ | 1.22 × 10⁻³ |
| combustion for power generation | 371 | 4.51 × 10⁻² | 0 |
| Total | 439 | 2.82 | 1.94 × 10⁻³ |
| Process | Material | Energy |
|---|---|---|
| Uranium mining | 0.495 | 1.83 |
| The transformation of uranium and uranium enrichment | 0.84 | 0.314 |
| Diffusion decommissioning project | 0.079 | - |
| fuel fabrication facility | 0.00787 | 0.21 |
| nuclear power plant | 0.451 | 1.96 |
| postprocessing | - | 5.29 |
| waste disposal | - | 0.433 |
| Total | 1.87 | 10 |
| Categories | GHG(g CO2 eq/KWh) |
|---|---|
| Rolled steel | 3.43 |
| concrete | 6.07 |
| diesel | 2.18 |
| inundated area | 7.56 |
| Total | 19.24 |
| Process | GHG (g CO2 eq/KWh) |
| Trees obtain | 6.39 |
| smash | 12.76 |
| transportation | 14.78 |
| Electricity generation | 44.41 |
| Sub-total | 78.34 |
| Upstream manufacture | |
| equipment | 26.36 |
| construction | 6.11 |
| water | 3.07 |
| lubricating oil | 0.35 |
| Sub-total | 35.9 |
| Total | 114.23 |
| Photovoltaic Solar Power Manufacturing | GHG Emissions (g CO2 eq/KWh) |
|---|---|
| Quartz mining | 0.202 |
| transportation | 34.6 |
| UMG-Siredox reaction | 0.4 |
| UMG-Si production | 2.88 |
| SoG-Si production | 21.3 |
| ingotting | 1.3 |
| wafer cutting | 3.38 |
| Cell production | 6.32 |
| module production | 6.32 |
| system integration | 7.91 |
| Manufacturing subtotal | 50.16 |
| Photovoltaic power station operation | 0.05 |
| transmission | 3.11 |
| Power station disposal | 5.81 |
| Total | 60.13 |
| Wind Turbine | Material | Tons |
| Rotor | synthetic resin | 154 |
| fiberglass | 106 | |
| pigging | 190 | |
| cabin | iron | 480 |
| steel | 560 | |
| silicon dioxide | 9.6 | |
| copper | 9.1 | |
| fiberglass | 0.9 | |
| synthetic resin | 1.3 | |
| tower | steel | 2100 |
| Transformer Substation | ||
| transformer | silicon dioxide | 0.6 |
| steel | 11 | |
| copper | 4.8 | |
| computer | - | 5 |
| Bauarbeit | ||
| Drum tower foundation | concrete | 8300 |
| rebar | 990 | |
| electric substation | concrete | 160 |
| rebar | 7.9 | |
| Operations and Maintenance | ||
| blade | synthetic resin | 52.1 |
| fiberglass | 35.9 | |
| dynamo | silicon dioxide | 0.72 |
| copper | 7.9 | |
| steel | 17 | |
References
- IEA Statistics. CO2 Emissions from Fuel Combustion Highlights. 2015. Available online: https://www.iea.org/publications/freepublications/publication/CO2EmissionsFromFuelCombustionHighlights2015.pdf (accessed on 24 October 2016).
- Organization for Economic Co-operation and Development (OECD). CO2 Emissions from Fuel Combustion. 2015. Available online: http://www.oecd-ilibrary.org/docserver/download/6115291e.pdf?expires=1470293242&id=id&accname=ocid195069&checksum=FAE956F9B01EBE9FED1E2DA439956DDC (accessed on 12 October 2016).
- BP. Statistical Review of World Energy 2016; BP P.L.C.: London, UK, 2016. [Google Scholar]
- Hofmann, J.; Guan, D.; Chalvatzis, K.; Huo, H. Assessment of electrical vehicles as a successful driver for reducing CO2 emissions in China. Appl. Energy 2016, 184, 995–1003. [Google Scholar] [CrossRef]
- Shahraeeni, M.; Ahmed, S.; Malek, K.; Van Drimmelen, B.; Kjeang, E. Life cycle emissions and cost of transportation systems: A Case study on diesel and natural gas for light-duty trucks in municipal fleet operations. J. Nat. Gas Sci. Eng. 2015, 24, 26–34. [Google Scholar] [CrossRef]
- The International Renewable Energy Agency (IRENA). Renewable Power Generation Costs in 2014. 2015. Available online: http://www.irena.org/documentdownloads/publications/irena_re_power_costs_2014_report.pdf (accessed on 20 October 2015).
- Organisation for Economic Co-operation and Development (OECD). Global EV Outlook 2016. 2016. Available online: https://www.iea.org/publications/freepublications/publication/Global_EV_Outlook_2016.pdf (accessed on 10 September 2016).
- McJeon, H.; Edmonds, J.; Bauer, N.; Clarke, L.; Fisher, B.; Flannery, B.; Hilaire, J.; Krey, V.; Marangoni, G.; Mi, R.; et al. Limited impact on decadal-scale climate change from increased use of natural gas. Nature 2014, 514, 482–485. [Google Scholar] [CrossRef] [PubMed]
- Moore, C.; Zielinska, B.; Pétron, G.; Jackson, R. Air impacts of increased natural gas acquisition, processing, and use: A critical review. Environ. Sci. Technol. 2014, 48, 8349–8359. [Google Scholar] [CrossRef] [PubMed]
- Vandewalle, J. Natural Gas in the Energy Transition—Technical Challenges and Opportunities of Natural Gas and Its Infrastructure as a Flexibility-Providing Resource. Ph.D. Thesis, University of Leuven, Leuven, Belgium, 2014. [Google Scholar]
- BP. Statistical Review of World Energy 2015; BP P.L.C.: London, UK, 2015. [Google Scholar]
- Paltsev, S.; Zhang, D. Natural gas pricing reform in China: Getting closer to a market system? Energy Policy 2015, 86, 43–56. [Google Scholar] [CrossRef]
- Xin, L. Natural Gas in China: A Regional Analysis; Oxford Energy Comment; Oxford Institute for Energy Studies: Oxford, UK, 2015. [Google Scholar]
- Johansson, B. Security aspects of future renewable energy systems—A short overview. Energy 2013, 61, 598–605. [Google Scholar] [CrossRef]
- Intergovernmental Panel on Climate Change (IPCC). IPCC Special Report on Renewable Energy Sources and Climate Change Mitigation; Cambridge University Press: Cambridge, UK; New York, NY, USA, 2011. [Google Scholar]
- Creutzig, F.; Goldschmidt, J.; Lehmann, P.; Schmid, E.; von Blücher, F.; Breyer, C.; Fernandez, B.; Jakob, M.; Knopf, B.; Lohrey, S.; et al. Catching two European birds with one renewable stone: Mitigating climate change and Eurozone crisis by an energy transition. Renew. Sustain. Energy Rev. 2014, 38, 1015–1028. [Google Scholar] [CrossRef]
- Zeng, M.; Wang, S.; Duan, J.; Sun, J.; Zhong, P.; Zhang, Y. Review of nuclear power development in China: Environment analysis, historical stages, development status, problems and countermeasures. Renew. Sustain. Energy Rev. 2016, 59, 1369–1383. [Google Scholar] [CrossRef]
- Dogan, E.; Seker, F. Determinants of CO2 emissions in the European Union: The role of renewable and non-renewable energy. Renew. Energy 2016, 94, 429–439. [Google Scholar] [CrossRef]
- Qi, T.; Zhang, X.; Karplus, V. The energy and CO2 emissions impact of renewable energy development in China. Energy Policy 2014, 68, 60–69. [Google Scholar] [CrossRef]
- Wang, J.; Feng, L.; Zhao, L.; Snowden, S. China’s natural gas: Resources, production and its impacts. Energy Policy 2013, 55, 690–698. [Google Scholar] [CrossRef]
- Energy Information Administration (EIA). Technically Recoverable Shale Oil and Shale Gas Resources: China. 2015. Available online: https://www.eia.gov/analysis/studies/worldshalegas/pdf/China_2013.pdf (accessed on 5 August 2016).
- Bundesanstalt für Geowissenschaften und Rohstoffe (BGR). Energy Study 2012: Reserves, Resources and Availability of Energy Resources. 2012. Available online: http://www.bgr.bund.de/DE/Gemeinsames/Produkte/Downloads/DERA_Rohstoffinformationen/rohstoffinformationen-15e.pdf?__blob=publicationFile&v=3 (accessed on 10 August 2015).
- Ministry of Land and Resources of PRC. China Mineral Resources. Ministry of Land and Resources, Beijing. 2015. Available online: http://www.mlr.gov.cn/sjpd/zybg/2015/201510/P020151030354926948039.pdf (accessed on 10 August 2015).
- Ministry of Land and Resources of PRC, 2016. Available online: http://www.mlr.gov.cn/xwdt/tpxw/201606/t20160613_1408483.htm (accessed on 9 August 2016).
- Jia, C.; Zheng, M.; Zhang, Y. Unconventional hydrocarbon resources in China and the prospect of exploration and development. Pet. Explor. Dev. 2012, 39, 139–146. [Google Scholar] [CrossRef]
- Bundesanstalt für Geowissenschaften und Rohstoffe (BGR). Energy Study 2013: Reserves, Resources and Availability of Energy Resources; BGR: Hannover, Germany, 2013. [Google Scholar]
- International Energy Agency (IEA). Golden Rules for a Golden Age of Gas. 2012. Available online: http://www.worldenergyoutlook.org/media/weowebsite/2012/goldenrules/weo2012_goldenrulesreport.pdf (accessed on 11 January 2016).
- International Energy Agency (IEA). World Energy Outlook 2013. 2013. Available online: http://www.worldenergyoutlook.org/weo2013/ (accessed on 11 January 2016).
- International Energy Agency (IEA). World Energy Outlook 2007; IEA: Paris, France, 2007. [Google Scholar]
- International Energy Agency (IEA). World Energy Outlook 2009; IEA: Paris, France, 2009. [Google Scholar]
- Tian, L.; Wang, Z.; Krupnick, A.; Liu, X. Stimulating shale gas development in China: A comparison with the US experience. Energy Policy 2014, 75, 109–116. [Google Scholar] [CrossRef]
- Mohr, S.; Evans, G. Long term forecasting of natural gas production. Energy Policy 2011, 39, 5550–5560. [Google Scholar] [CrossRef]
- Bloomberg. China’s Shale Gas Reserves Jump Fivefold as Output Lags Target. 2016. Available online: http://www.bloomberg.com/news/articles/2016-04-06/china-s-shale-gas-reserves-jump-fivefold-as-output-lags-target (accessed on 15 March 2016).
- Wang, J.; Mohr, S.; Feng, L.; Liu, H.; Tverberg, G. Analysis of resource potential for China’s unconventional gas and forecast for its long-term production growth. Energy Policy 2016, 88, 389–401. [Google Scholar] [CrossRef]
- Liu, Z.; Guan, D.; Crawford-Brown, D.; Zhang, Q.; He, K.; Liu, J. Energy Policy: A low-carbon road map for China. Nature 2013, 500, 143–145. [Google Scholar] [CrossRef] [PubMed]
- REN21. Renewables 2015 Global Status Report; REN21: Paris, France, 2015. [Google Scholar]
- Davidson, M.; Zhang, D.; Xiong, W.; Zhang, X.; Karplus, V. Modelling the potential for wind energy integration on China’s coal-heavy electricity grid. Nat. Energy 2016, 1, 16086. [Google Scholar] [CrossRef]
- He, G.; Kammen, D. Where, when and how much solar is available? A provincial-scale solar resource assessment for China. Renew. Energy 2016, 85, 74–82. [Google Scholar] [CrossRef]
- Liu, W.; Lund, H.; Mathiesen, B.; Zhang, X. Potential of renewable energy systems in China. Appl. Energy 2011, 88, 518–525. [Google Scholar] [CrossRef]
- Sun, X.; Zhang, B.; Tang, X.; McLellan, B.C.; Höök, M. Sustainable energy transitions in China: Renewable options and impacts on the electricity system. Energies 2016, 9, 980. [Google Scholar] [CrossRef]
- Yuan, J.; Hu, Z. Low carbon electricity development in China—An IRSP perspective based on Super Smart Grid. Renew. Sustain. Energy Rev. 2011, 15, 2707–2713. [Google Scholar] [CrossRef]
- Organisation for Economic Co-operation and Development (OECD). Technology Roadmap: Nuclear Energy; IEA: Paris, France, 2015. [Google Scholar]
- State Council. Energy Development Strategy Action Plan (2014–2020); State Council: Beijing, China, 2014.
- United Nations Framework Convention on Climate Change. China’s Intended Nationally Determined Contribution: Enhanced Actions on Climate Change. 2015. Available online: http://www4.unfccc.int/submissions/INDC/Published%20Documents/China/1/China’s%20INDC%20-%20on%2030%20June%202015.pdf (accessed on 15 March 2016).
- World Nuclear Association. Nuclear Power in China. 2016. Available online: http://www.world-nuclear.org/information-library/country-profiles/countries-a-f/china-nuclear-power.aspx (accessed on 15 March 2016).
- National Development and Reform Commission (NDRC). Natural Gas Utilization Policy. Available online: http://www.sdpc.gov.cn/zcfb/zcfbl/201210/t20121031_511891.html (accessed on 15 March 2016). (In Chinese)
- Central People’s Government of the People's Republic of China. The Renewable Energy Law of the People’s Republic of China. Available online: http://www.gov.cn/ziliao/flfg/2005-06/21/content_8275.htm (accessed on 15 March 2016). (In Chinese)
- National People’s Congress. The People’s Republic of China Renewable Energy Law (amendment). Available online: http://www.npc.gov.cn/huiyi/cwh/1112/2009-12/26/content_1533216.htm (accessed on 15 March 2016). (In Chinese)
- National Development and Reform Commission (NDRC). Renewable Energy Generation Related Regulations. Available online: http://www.sdpc.gov.cn/zcfb/zcfbtz/200602/t20060206_58735.html (accessed on 15 March 2016). (In Chinese)
- National Development and Reform Commission (NDRC); National Energy Administration (NEA). Improving Power Operations, Adjusting Incentives for Clean Energy Production Guiding Opinion. China National Development and Reform Commission, 2015. Available online: http://www.gov.cn/xinwen/2015-03/23/content_2837637.htm (accessed on 15 March 2016).
- National Development and Reform Commission (NDRC). The Central Committee of the Communist Party of the Several Opinions on Further Deepening the Reform of Electric Power System by the State Council. Available online: http://tgs.ndrc.gov.cn/zywj/201601/t20160129_773852.html (accessed on 15 March 2016). (In Chinese)
- Zhang, D.; Paltsev, S. The Future of Natural Gas in China: Effects of Pricing Reform and Climate Policy. Available online: https://dspace.mit.edu/handle/1721.1/103778 (accessed on 15 March 2016).
- National Development and Reform Commission (NDRC). Notification to Improve Nuclear Power Pricing Mechanism. 2013. Available online: www.sdpc.gov.cn/zwfwzx/zfdj/jggg/201307/t20130708_549225.html (accessed on 15 March 2016). (In Chinese)
- National Development and Reform Commission (NDRC). Notification to Improve On-Grid Wind Pricing Mechanism. 2009. Available online: www.sdpc.gov.cn/fzgggz/jggl/zcfg/200907/t20090727_748211.html (accessed on 15 March 2016). (In Chinese)
- Shen, J.; Luo, C. Overall review of renewable energy subsidy policies in China—Contradictions of intentions and effects. Renew. Sustain. Energy Rev. 2015, 41, 1478–1488. [Google Scholar] [CrossRef]
- National Development and Reform Commission (NDRC). Notification to Improve On-grid Solar PV Power Pricing Mechanism. 2011. Available online: http://www.sdpc.gov.cn/zwfwzx/zfdj/jggg/201108/t20110801_426507.html (accessed on 15 March 2016). (In Chinese)
- Zhao, X.; Li, S.; Zhang, S.; Yang, R.; Liu, S. The effectiveness of China’s wind power policy: An empirical analysis. Energy Policy 2016, 95, 269–279. [Google Scholar] [CrossRef]
- The Energy Saving and New Energy Vehicle Industry Development Plan 2012–2020. The State Council of China: Beijing, 2012. Available online: http://www.gov.cn/zwgk/2012-07/09/content_2179032.htm (accessed on 15 March 2016). (In Chinese)
- Wan, Z.; Sperling, D.; Wang, Y. China’s electric car frustrations. Transp. Res. D Transp. Environ. 2015, 34, 116–121. [Google Scholar] [CrossRef]
- Gong, H.; Wang, M.; Wang, H. New energy vehicles in China: Policies, demonstration, and progress. Mitig. Adapt. Strateg. Glob. Chang. 2013, 18, 207–228. [Google Scholar] [CrossRef]
- Wang, Y.; Li, K.; Xu, X.; Zhang, Y. Transport energy consumption and saving in China. Renew. Sustain. Energy Rev. 2014, 29, 641–655. [Google Scholar] [CrossRef]
- Hao, H.; Ou, X.; Du, J.; Wang, H.; Ouyang, M. China’s electric vehicle subsidy scheme: Rationale and impacts. Energy Policy 2014, 73, 722–732. [Google Scholar] [CrossRef]
- Huang, Y. China’s New Energy Vehicle Market and Policy Analysis; China Automotive Technology & Research Center: Tianjin, China, 2015. [Google Scholar]
- Miao, B. Outlook of Power Generation Technology Cost in China. Master’s Thesis, Norwegian School of Economics, Bergen, Norway, 2015. [Google Scholar]
- Larsson, S.; Fantazzini, D.; Davidsson, S.; Kullander, S.; Höök, M. Reviewing electricity production cost assessments. Renew. Sustain. Energy Rev. 2014, 30, 170–183. [Google Scholar] [CrossRef]
- Rubin, E.; Azevedo, I.; Jaramillo, P.; Yeh, S. A review of learning rates for electricity supply technologies. Energy Policy 2015, 86, 198–218. [Google Scholar] [CrossRef]
- Rose, L.; Hussain, M.; Ahmed, S.; Malek, K.; Costanzo, R.; Kjeang, E. A comparative life cycle assessment of diesel and compressed natural gas powered refuse collection vehicles in a Canadian city. Energy Policy. 2013, 52, 453–461. [Google Scholar] [CrossRef]
- Ou, X.; Zhang, X.; Zhang, X.; Zhang, Q. Life cycle GHG of NG-based fuel and electric vehicle in China. Energies 2013, 6, 2644–2662. [Google Scholar] [CrossRef]
- Energy Information Administration (EIA). Annual Energy Outlook 2017. Available online: https://www.eia.gov/outlooks/aeo/data/browser/#/?id=3-aeo2017&cases=ref2017~ref_no_cpp&sourcekey=0 (accessed on 12 July 2016).
- Li, Y.; Lukszo, Z.; Weijnen, M. The implications of CO2 price for China’s power sector decarbonization. Appl. Energy 2015, 146, 53–64. [Google Scholar] [CrossRef]
- National Development and Reform Commission (NDRC). China 2050 High Renewable Energy Penetration Scenario and Roadmap Study. 2015. Available online: http://www.efchina.org/Attachments/Report/report-20150420/China-2050-High-Renewable-Energy-Penetration-Scenario-and-Roadmap-Study-Executive-Summary.pdf (accessed on 12 July 2016).
- International Energy Agency (IEA). World Energy Outlook 2015; IEA: Paris, France, 2015. [Google Scholar]
- Diao, Q.; Sun, W.; Yuan, X.; Li, L.; Zheng, Z. Life-cycle private-cost-based competitiveness analysis of electric vehicles in China considering the intangible cost of traffic policies. Appl. Energy 2016, 178, 567–578. [Google Scholar] [CrossRef]
- China Briefing. China’s SAT Clarifies Issues Regarding Vehicle and Vessel Tax Collection. 2013. Available online: http://www.china-briefing.com/news/2013/08/07/chinas-sat-clarifies-issues-regarding-vehicle-and-vessel-tax-collection.html (accessed on 12 July 2016).
- Lin, C.; Wu, T.; Ou, X.; Zhang, Q.; Zhang, X.; Zhang, X. Life-cycle private costs of hybrid electric vehicles in the current Chinese market. Energy Policy 2013, 55, 501–510. [Google Scholar] [CrossRef]
- Zhao, X.; Doering, O.; Tyner, W. The economic competitiveness and emissions of battery electric vehicles in China. Appl. Energy 2015, 156, 666–675. [Google Scholar] [CrossRef]
- ChinaAutoWeb. Available online: http://chinaautoweb.com/ (accessed on 12 July 2016).
- Sun, C.; Ouyang, X. Price and expenditure elasticities of residential energy demand during urbanization: An empirical analysis based on the household-level survey data in China. Energy Policy 2016, 88, 56–63. [Google Scholar] [CrossRef]
- Hao, H.; Liu, Z.; Zhao, F.; Li, W. Natural gas as vehicle fuel in China: A review. Renew. Sustain. Energy Rev. 2016, 62, 521–533. [Google Scholar] [CrossRef]
- Wang, H.; Fang, H.; Yu, X.; Wang, K. Development of natural gas vehicles in China: An assessment of enabling factors and barriers. Energy Policy 2015, 85, 80–93. [Google Scholar] [CrossRef]
- Ou, X.; Zhang, X. Life-Cycle Analyses of Energy Consumption and GHG Emissions of Natural Gas-Based Alternative Vehicle Fuels in China. J. Energy 2013, 2013, 268263. [Google Scholar] [CrossRef]
- CBN. Natural Gas in China’s Transport Sector. 2016. Available online: http://www.gastechnology.org/Training/USChinaShaleWrkshps/March2016/CBN-Tao-Wang-Transportation-Mar2016-EN.pdf (accessed on 12 July 2016).
- Enerdata. Effect of Price Reforms on the Demand of LNG in Transport in China. 2014. Available online: http://www.enerdata.net/enerdatauk/press-and-publication/energy-news-001/china-lng-price-reforms-effets_30271.html (accessed on 12 July 2016).


| Types of reserves | Conventional | Shale Gas | Coalbed Methane | Tight Gas |
|---|---|---|---|---|
| Resources | 56 [20] | 31.6 [21], 8.6 [22] | - | - |
| Geologically | 35 [20], 68 [23] | 122 [24] | 36.8 [25] | 17.4–25.1 [25] |
| Recoverable | 40 [23] | 22 [26] | 10.9 [25] | 8.8–12.1 [25] |
| Reserves | 30 [26] | - | - | - |
| Remaining recoverable resources | - | - | 9 [27], 9.5 [28] | - |
| Proven reserves | 3.7 [29], 5.94 [30] | - | - | - |
| Recoverable, proven and probable reserves | 5 [29] | - | - | - |
| Technically recoverable reserves | - | 25.1 [31] | - | 12 [31] |
| Technically and economically producible reserves | 3.09 [30] | - | - | - |
| Ultimately recoverable resources | 5.28–12.82 [32] | - | 2.77–31.68 [32] | 1.5–10.31 [32] |
| Source | Capacity (GW) | Generation (TWh/y) |
|---|---|---|
| Theoretical hydropower | 694 [39] | 6082.9 [39] |
| Technically exploitable hydropower | 542 [39] | 2473.9 [39] |
| Economically exploitable hydropower | 402 [39], | 1750 [39], 1700 [41] |
| Technically exploitable wind energy | 2548 [39] | 7644 [39] |
| Wind power (10 m) | 250 GW (onshore) | 2000 [41] |
| 750 GW (offshore) | ||
| Wind power (50 m) | 2000–2500 | 4000–5000 [41] |
| Solar photovoltaic | - | 1296–6480 [39], 128,000 (theoretical) [41], 8000–69,900 [38] |
| Concentrate solar power (CSP) | 3900–32,700 [38] | 6600–60,700 [38] |
| Biomass | - | 1500–1750 [41] |
| Tidal energy | 20 [39] | >620 GWh [39] |
| Wave | - | >1500 [39] |
| Total | - | >12,666 |
| Policies | Description | References |
|---|---|---|
| Natural Gas Utilization Policy | Natural gas saving and improving energy efficient | [46] |
| Revised Natural Gas Utilization Policy | Highlight the role of natural gas share in primary energy consumption and encourage natural gas used as fuel preferentially in residential, manufacturing, electricity and transportation sectors | [46] |
| Renewable Energy Law | Enlarge the share of renewable energy, safeguard energy security and achieve the goal of sustainable economic development | [47] |
| Amendments to the Renewable Energy Law | Further, strengthen the process through which renewable electricity projects are connected to the grid and dispatched efficiently | [48] |
| Related Regulations on Renewable Energy Generation | Propose the standard development for renewable energy generation industry | [49] |
| Policy guidance document | Re-emphasize the need for priority dispatch for renewable energy | [50] |
| Relative Policies on Deepening the Reform of Power Industry No. 9 Document | Envisage China to further optimize its energy mix and improve the share of renewable energy in electricity generation | [51] |
| Sources | Policies | Amount | References |
|---|---|---|---|
| Natural gas | Value-added tax refund; feed-in tariffs for gas-fired power | - | [52] |
| Nuclear power | Feed-in tariff | $0.071/KWh | [17,53] |
| Onshore wind power | Four-category FITs | $0.084–0.0165/KWh | [54] |
| Notice on the Taxation of the Comprehensive Utilization of Resources and Other Value-additional | 50% discount in value-added tax | [55] | |
| Solar PV | Two-category FITs | $0.18/KWh and $0.19/KWh | [56] |
| Announcement of Value-added Policies for PV Generated Electricity | 50% discount in value-added tax | [57] |
| Country | 2015 | 2020 | 2025 | 2030 |
|---|---|---|---|---|
| US | 1 | 1 | 1 | 1 |
| China | 0.69 | 0.71 | 0.72 | 0.73 |
| India | 0.43 | 0.47 | 0.50 | 0.54 |
| Brazil | 0.98 | 0.82 | 0.76 | 0.70 |
| Turkey | 0.57 | 0.66 | 0.73 | 0.77 |
| Categories | Units (2015 USD) | Coal | NGCC | Nuclear | Wind | Biomass | Solar PV |
|---|---|---|---|---|---|---|---|
| Construction Time | years | 4 | 2 | 5 | 2 | 4 | 2 |
| Overnight Capital Cost | $/kW | 704 | 593 | 2751 | 1282 | 1701 | 1484 |
| WACC | % | 8.5% | 8.5% | 8.5% | 8.5% | 8.5% | 8.5% |
| Fixed O&M | $/kW | 10.23 | 16.17 | - | 26.466 | 17.8695 | 8.679 |
| Variable O&M | $/KWh | 0.006105 | 0.00231 | 0.02145 | - | - | - |
| Project Life | years | 20 | 20 | 20 | 20 | 20 | 20 |
| Capacity Factor | % | 54% | 54% | 85% | 26% | 54% | 16% |
| Heat Rate | BTU/KWh | 8740 | 6333 | 10,479 | - | 13,500 | - |
| Fuel Cost | $/MMBTU | 2.60205 | 9.9759 | 1.221 | 0 | 4.10685 | 0 |
| GHG emission tax | $/tonne (2030) | 30 | 30 | 30 | 30 | 30 | 30 |
| Generation Technologies | 2015 | 2020 | 2025 | 2030 |
|---|---|---|---|---|
| Coal | 884,000 | 1,083,388 | 1,079,878 | 1,052,150 |
| NG | 66,370 | 110,355 | 125,909 | 130,119 |
| Nuclear | 26,080 | 50,500 | 64,000 | 66,000 |
| Wind | 129,340 | 317,088 | 632,176 | 1,103,944 |
| Biomass | 10,300 | 39,306 | 39,304 | 39,304 |
| Solar PV | 43,180 | 157,025 | 500,235 | 1,048,858 |
| Hydropower | 267,099 | 313,973 | 402,363 | 440,752 |
| Generation Technologies | 2015 | 2020 | 2025 | 2030 |
|---|---|---|---|---|
| Coal | 884,000 | 979,000 | 1,044,000 | 1,115,000 |
| NG | 66,370 | 110,000 | 143,000 | 170,000 |
| Nuclear | 26,080 | 55,000 | 86,000 | 110,000 |
| Wind | 129,340 | 200,000 | 267,000 | 321,000 |
| Biomass | 10,300 | 30,000 | 41,000 | 48,000 |
| Solar PV | 43,180 | 100,000 | 151,000 | 194,000 |
| Hydropower | 267,099 | 365,000 | 410,000 | 454,000 |
| Technology | Global Learning Rate (%) | Local Learning Rate (%) | Global Cost Component (%) | Local Cost Component (%) |
|---|---|---|---|---|
| Coal | 5 | 5 | 10 | 90 |
| CCGT | 5 | 5 | 50 | 50 |
| Nuclear | 1 | 1 | 5 | 95 |
| Wind | 17 | 17 | 10 | 90 |
| Biomass | 5 | 5 | 10 | 90 |
| Solar PV | 20 | 20 | 10 | 90 |
| Generation Technologies | 2015 | 2020 | 2025 | 2030 |
|---|---|---|---|---|
| Coal | 1930 | 2094 | 2049 | 1687 |
| NG | 1475 | 1789 | 1810 | 2010 |
| Nuclear | 348 | 449 | 465 | 642 |
| Wind | 107 | 141 | 148 | 233 |
| Biomass | 427 | 710 | 769 | 1572 |
| Solar PV | 230 | 517 | 566 | 1278 |
| Vehicle Models | Type | MSRP ($) | Government Subsidy ($) | Energy Consumption Rate (/100 km) | Engine Displacement (L) | Curb Weight (kg) | |
|---|---|---|---|---|---|---|---|
| BAIC (Beijing) | E150 EV | BEV | 41,217 | 23,100 | 12.5 KWh | 0 | 1370 |
| E150 | CV | 14,322 | 0 | 7.1 L | 1.3 | 1090 | |
| Roewe e550 | PHEV | 42,867 | 13,695 | 12 KWh & 2.3 L | 1.5 | 1699 | |
| Roewe 550 | CV | 31,317 | 0 | 6.8 L | 1.8 | 1532 | |
| BYD | E6 400 | BEV | 51,117 | 18,810 | 19.5 KWh | 0 | 2380 |
| M6 | CV | 24,882 | 0 | 9.40 L | 2.4 | 1760 | |
| BYD-Qin | PHEV | 31,317 | 11,550 | 6.2 L & 2.5–3.0 KWh | 1.5 | 1720 | |
| BYD-G6 | CV | 18,612 | 0 | 7.9 L | 1.5 | 1450 | |
| Process | Upstream CO2 | Upstream CH4 | Upstream N2O | Direct CO2 | Direct CH4 | Direct N2O | Total |
|---|---|---|---|---|---|---|---|
| g/MJ | g/MJ | mg/MJ | g/MJ | g/MJ | mg/MJ | g CO2 e/L | |
| Gasoline | 20.2 | 0.05 | 0.49 | 67.9 | 0.08 | 0.002 | 3120.26 |
| Vehicle Types | Taxi | Heavy Duty |
|---|---|---|
| VKT | 350 km/day | 200 km/day |
| Life time (years) | 10 | 10 |
| Pa − Pc (USD) | 1650 | 11,500 |
| Fuel price | ||
| CNG | $0.7425/m3 | - |
| LNG | - | $0.7425/m3 |
| Gasoline | $0.924/L | - |
| Diesel | - | $1.254/L |
| Fuel consumption | ||
| CNG | 8.2 m3/100 km | - |
| LNG | - | 4.6 m3/100 km |
| Gasoline | 8 L/100 km | - |
| Diesel | - | 39 L/100 km |
| WTW GHG emission (g CO2, e/km) | ||
| CNG | 205 | - |
| LNG | - | 191–198 |
| Gasoline | 236 | - |
| Diesel | - | 212 |
| Generation Technologies | GHG Emissions (g CO2 e/KWh) |
|---|---|
| Coal | 1020 |
| Natural gas | 520 |
| Nuclear | 12 |
| Onshore Wind | 207 |
| Biomass | 114 |
| PV | 60 |
| Hydro | 19 |
| Mix (2030) High renewable energy penetration scenario | 485 |
| New Policies Scenario | 592 |
| Vehicles | Costs Add(US $) | GHG Emissions Reduction(Tons) | Ec$/Ton |
|---|---|---|---|
| Taxi | −8307 | 40 | −210 |
| Heavy duty | −52,833 | 10 | −5170 |
© 2017 by the authors. Licensee MDPI, Basel, Switzerland. This article is an open access article distributed under the terms and conditions of the Creative Commons Attribution (CC BY) license (http://creativecommons.org/licenses/by/4.0/).
Share and Cite
Han, S.; Zhang, B.; Sun, X.; Han, S.; Höök, M. China’s Energy Transition in the Power and Transport Sectors from a Substitution Perspective. Energies 2017, 10, 600. https://doi.org/10.3390/en10050600
Han S, Zhang B, Sun X, Han S, Höök M. China’s Energy Transition in the Power and Transport Sectors from a Substitution Perspective. Energies. 2017; 10(5):600. https://doi.org/10.3390/en10050600
Chicago/Turabian StyleHan, Shangfeng, Baosheng Zhang, Xiaoyang Sun, Song Han, and Mikael Höök. 2017. "China’s Energy Transition in the Power and Transport Sectors from a Substitution Perspective" Energies 10, no. 5: 600. https://doi.org/10.3390/en10050600
APA StyleHan, S., Zhang, B., Sun, X., Han, S., & Höök, M. (2017). China’s Energy Transition in the Power and Transport Sectors from a Substitution Perspective. Energies, 10(5), 600. https://doi.org/10.3390/en10050600