1. Introduction
Hydropower is a key base load provider of electricity generation for many power systems throughout the world. Additionally, due to the ability of hydropower plants to be brought online comparatively faster and more economically than conventional fossil fuel plants and other base load providers, hydropower has also been used to an increasing degree for peak load management. In a market with ever increasing penetration of often intermittent renewable energy resources, hydropower can provide flexible and reliable generation options for maintaining system stability and ensuring a secure electricity supply.
In the modern liberalised market, the flexible and comparatively rapid response of hydropower also presents additional opportunities for operators in the form of ancillary service markets. As such, there is a growing need for large-scale operators to develop a more comprehensive understanding of the full dynamic capabilities and safety limitations of a given hydropower plant. In general, greater confidence in the transient response characteristics of hydro generators will, in turn, enable and encourage increased contributions from other much needed large-scale renewable energy sources, such as wind and solar power, without compromising grid stability [
1].
This is ever more significant in the context of the Tasmanian electrical system, a subsystem of the Australian National Electricity Market (NEM). The relatively isolated and low inertia system, connected to the mainland Australian system via a high voltage direct current undersea cable, is predominantly supplied by renewable energy sources with an increasing contribution of wind power. While global frequency control is available, it is limited under high import. As such, both base load and system stability services must, by and large, be provided by hydro-turbine units. Furthermore, while hydropower makes up ~80% of the approximate 2615 MW of generating capacity, all the hydropower stations within the state are conventional installations, as opposed to pumped-storage, somewhat limiting operational options and further reinforcing the need for understanding safe dynamic behaviour. Additionally, it should be noted that within the Australian NEM, the fast frequency control ancillary service (FCAS) contribution is calculated within a 6 s window from the moment of frequency deviation outside of the normal operating band.
In general, most hydro-turbines are capable of providing some degree of fast raise FCAS by rapidly increasing machine output from either no-load or low load operation. However, operating at no-load (with just enough flow to overcome machine losses) wastes valuable water resources, while operation at low load, particularly within the so-called rough running zone, is associated with excessive machine vibration and decreased asset life and therefore should be avoided whenever possible [
2,
3,
4].
Additionally, many existing hydro-electric units have the capacity to allow operation in a synchronous condenser (SC) mode, providing a number of system support functions while motoring the generator/turbine with the tail water depressed. In SC mode, air is forced into the runner chamber such that the turbine runner is able to spin at synchronous speed in air rather than water, thus decreasing the friction on the runner and reducing the amount of power input required from the system. Historically, this mode of operation has been employed in order to control reactive power and provide voltage support to the system [
5,
6,
7,
8].
In recent years, there have been many static var devices installed making SC mode rarely used. However, operation in a modified SC mode may also enable very rapid machine start-up [
9,
10,
11]. Indeed, one of the primary roles of the Dinorwig pumped-storage hydro-electric power plant is to regulate system frequency of the British national grid, with the 317 MW units operating as spinning reserve able to be brought from zero to full power output in 10–15 s [
10,
11]. Magsaysay et al. [
9] describes the transition process from synchronous condenser mode to generation mode in which the air in the chamber is first evacuated, presumably through a relief valve, causing the tail water to rise and consequentially impinge on the turbine runner. As soon as the air is evacuated, the guide vanes are opened. These two events clearly contribute to two distinct decelerating torques applied to the runner resulting in an increase in power demanded from the grid in order to maintain synchronous speed. The reverse power flow, from grid to machine, was observed to last for 2.7 s with a maximum magnitude of approximately 40 MW. A similar power draw has also been reported on a 325 MW unit at the Ohkawachi Power Plant, Kamikawa (Hy
go), Japan, where the negative power flow was found to last for up to 60 s with a maximum magnitude of 60 MW [
9]. It should be clear that the increased negative torque is not due to the non-minimum phase characteristic of hydropower plants associated with the water column inertia, although this may be a contributing factor.
In order to mitigate the potentially adverse effect of the reverse power flow on the stability of weak systems, Magsaysay et al. [
9] investigated the use of static frequency converter (SFC) to apply an additional braking effect and thereby decelerate the turbine/generator set during transition. While effectively eliminating the reverse power flow, the use of a SFC actually increases the time required to produce net positive power due to the need to bring the unit back to synchronising speed and compensate for the power flow through the SFC. In the case tested at the Dinorwig pumped-storage plant with a 20 MW rated SFC, this equates to an increase from 4 s, up to 6.3 s, following which synchronisation is expected to be accomplished within an additional few seconds.
To facilitate a faster transition and potentially minimise the retarding torque, a modification of the above described transition procedure is investigated. The system operates in a modified SC mode with the main inlet valve open, guide vanes sealed and servomotor active. When a predefined frequency deviation or rate of change of frequency is detected, the guide vanes are rapidly opened with the air contained within the runner chamber expelled through the draft tube with the flow. This modified mode of operation allowing for rapid transition will be referred to as Tail Water Depression (TWD) mode. While rapid transition from TWD operation itself is not entirely new, there exists little, if any, reported quantitative data in the literature exploring the influence of key operational parameters such as initial TWD level and guide vane operating rate.
In the present study, the potential for hydro turbines to provide fast frequency regulation to the grid following rapid start-up from TWD mode was investigated experimentally at both full- and model scale, and through the development of a one-dimensional hydropower plant hydraulic model.
2. Experimental Methods
2.1. Full-Scale Rapid Transition Tests
Full-scale testing of the rapid transition from TWD mode was carried out by Hydro Tasmania (Hobart, Tasmania, Australia) on a 119 MW Francis turbine unit at the Reece Power Station situated on the north-west coast of Tasmania. Additional plant specifications are given later in
Section 5. The power station was selected as it met a number of desirable criteria, namely, the ability to efficiently dewater the draft tube, sealed guide vanes, a high load factor, short water acceleration time constant, short guide vane opening time, a programmable logic controller, and a short tail race.
In order to establish the optimal conditions and operational procedure for provision of FCAS, two key parameters were identified for investigation: the initial guide vane (GV) opening rate, and the initial level of tail water depression (as measured from the runner exit, given in terms of runner diameter,
D). Opening rates were chosen at 7.3 mm/s (low), 10.0 mm/s (mod.) and 18.5 mm/s (max.), measured from servomotor stroke movement, based on the current capabilities of the full-scale unit. Water depression level was based on the positions of two level indicators in the full-scale draft tube. Details of four key representative rapid transition tests are summarised in
Table 1. All full-scale data were acquired at a sampling frequency of 20 Hz.
2.2. Scale Model Rapid Transition Tests
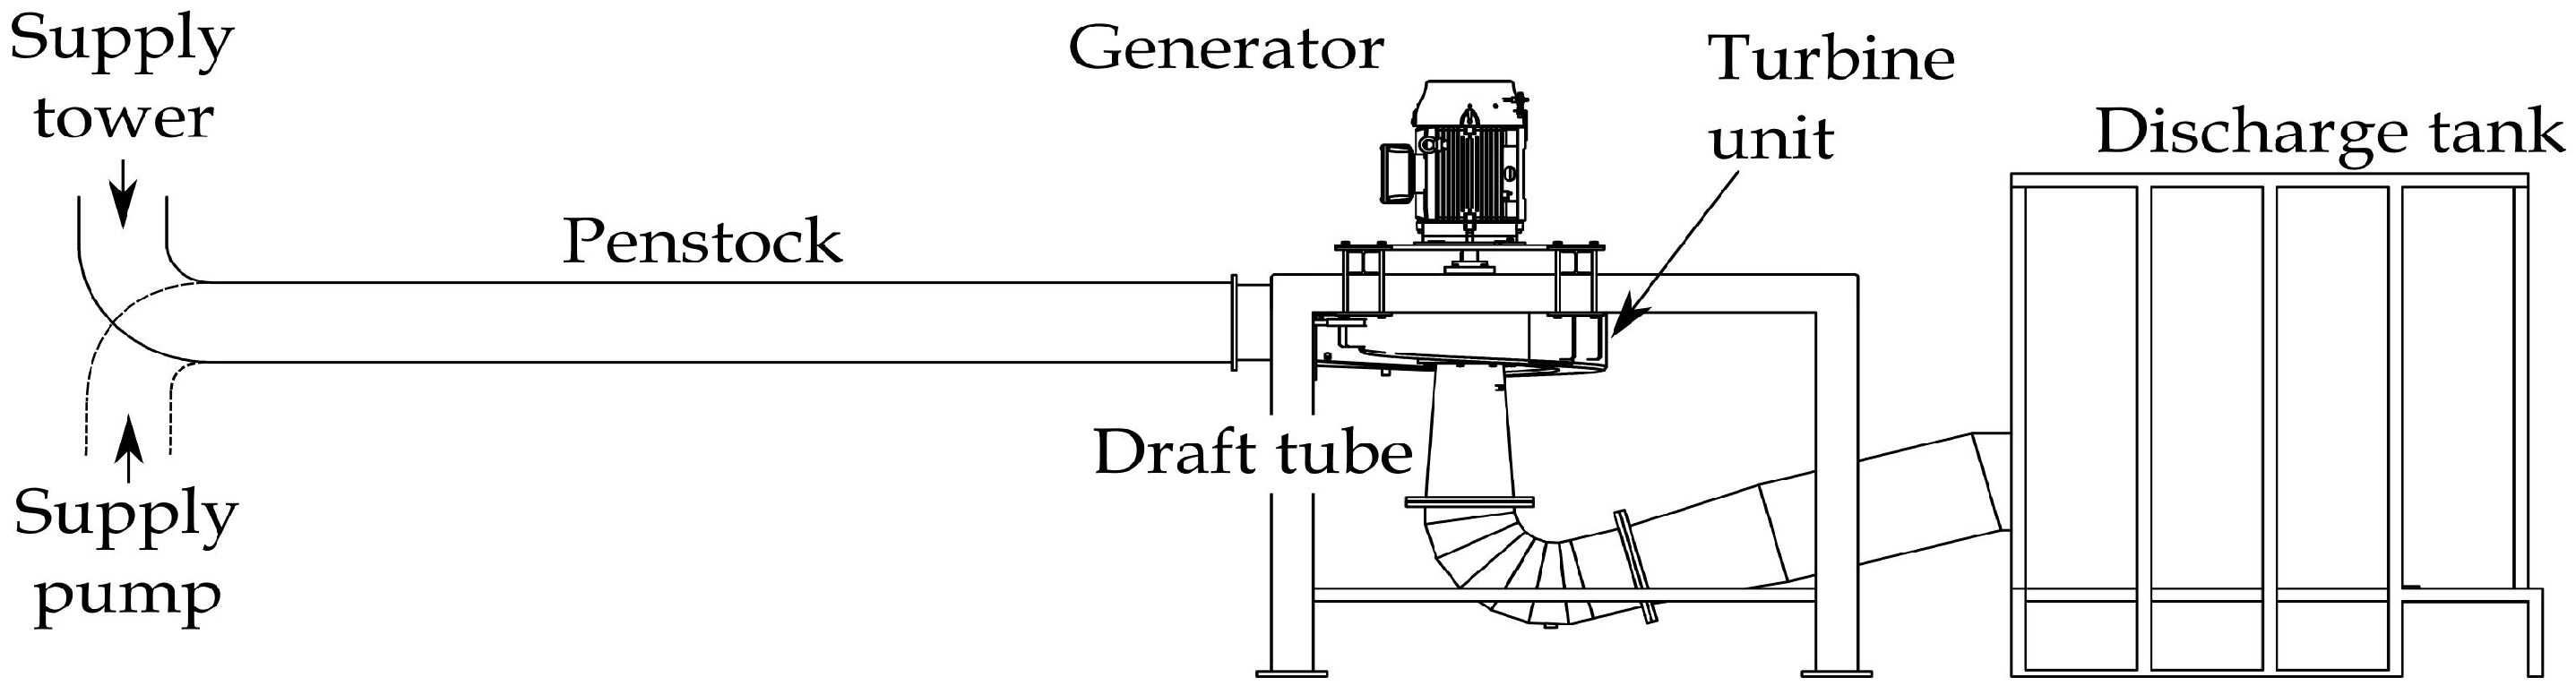
The experimental facility at the University of Tasmania was developed specifically to investigate the behaviour of hydraulic turbines and pump-turbines during transient operation. The system may be operated in open or semi-closed loop operation with the gravity fed open configuration providing the ability to investigate penstock hydraulic transients following rapid guide vane movement, while direct coupling to the supply pump offers a greater operating range of head and flow. A schematic of the facility is given in
Figure 1. Tests were performed on a 6.2 kW Francis-type micro-hydro turbine designed from pump-as-turbine principles using a 0.226 m diameter five blade impeller coupled to a 15 kW induction motor as generator (for a detailed description, see [
12]). All model tests were performed at constant upstream and downstream conditions, at rated turbine net head.
Equivalent transition tests were performed at model scale as presented in
Table 1. For ease of comparison, all values of power, pressure and GV position given are presented as normalised by rated values,
,
, and
, respectively, where rated GV position is defined as the guide vane opening angle at
. Guide vane opening rates at model scale are equivalent to those given above, scaled by the water starting time constant,
, where
is the rated flow rate,
L is the penstock length,
g is acceleration due to gravity, and
A the cross-sectional area of the penstock.
2.3. Scale Model Instrumentation
Pressure measurements were performed at spiral inlet and draft tube outlet using Druck UNIK 5000 gauge pressure transducers (GE Measurement & Control, Billerica, MA, USA). Each unit has a frequency response of 3.5 kHz and was calibrated over the full range, 0–100 kPa, with a maximum deviation of 0.06% full scale. A 500 hole optical encoder was rigidly mounted to the non-drive end of the generator shaft for high resolution rotational speed measurement for capturing speed deviation during rapid machine loading. An induction pick-up, independent of all data acquisition equipment, was mounted on the drive end for grid synchronization and over speed protection. Shaft torque measurement was achieved with a full bridge 350 strain gauge installed on an exposed section of turbine shaft with data acquisition via a Kraus Messtechnik (KMT) digital telemetry system (Munich, Germany). The encoder scanning rate was 6.9 kHz and system accuracy was stated at ±0.2%. Data acquisition was achieved at a sampling frequency of 2 kHz using the software package LabVIEW (v8.6, National Instruments, Austin, TX, USA) simultaneously recording measurements of pressure, rotational speed, shaft torque and actuator stroke.
3. Experimental Results
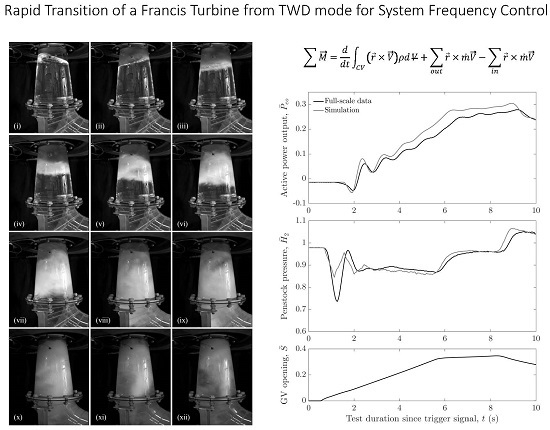
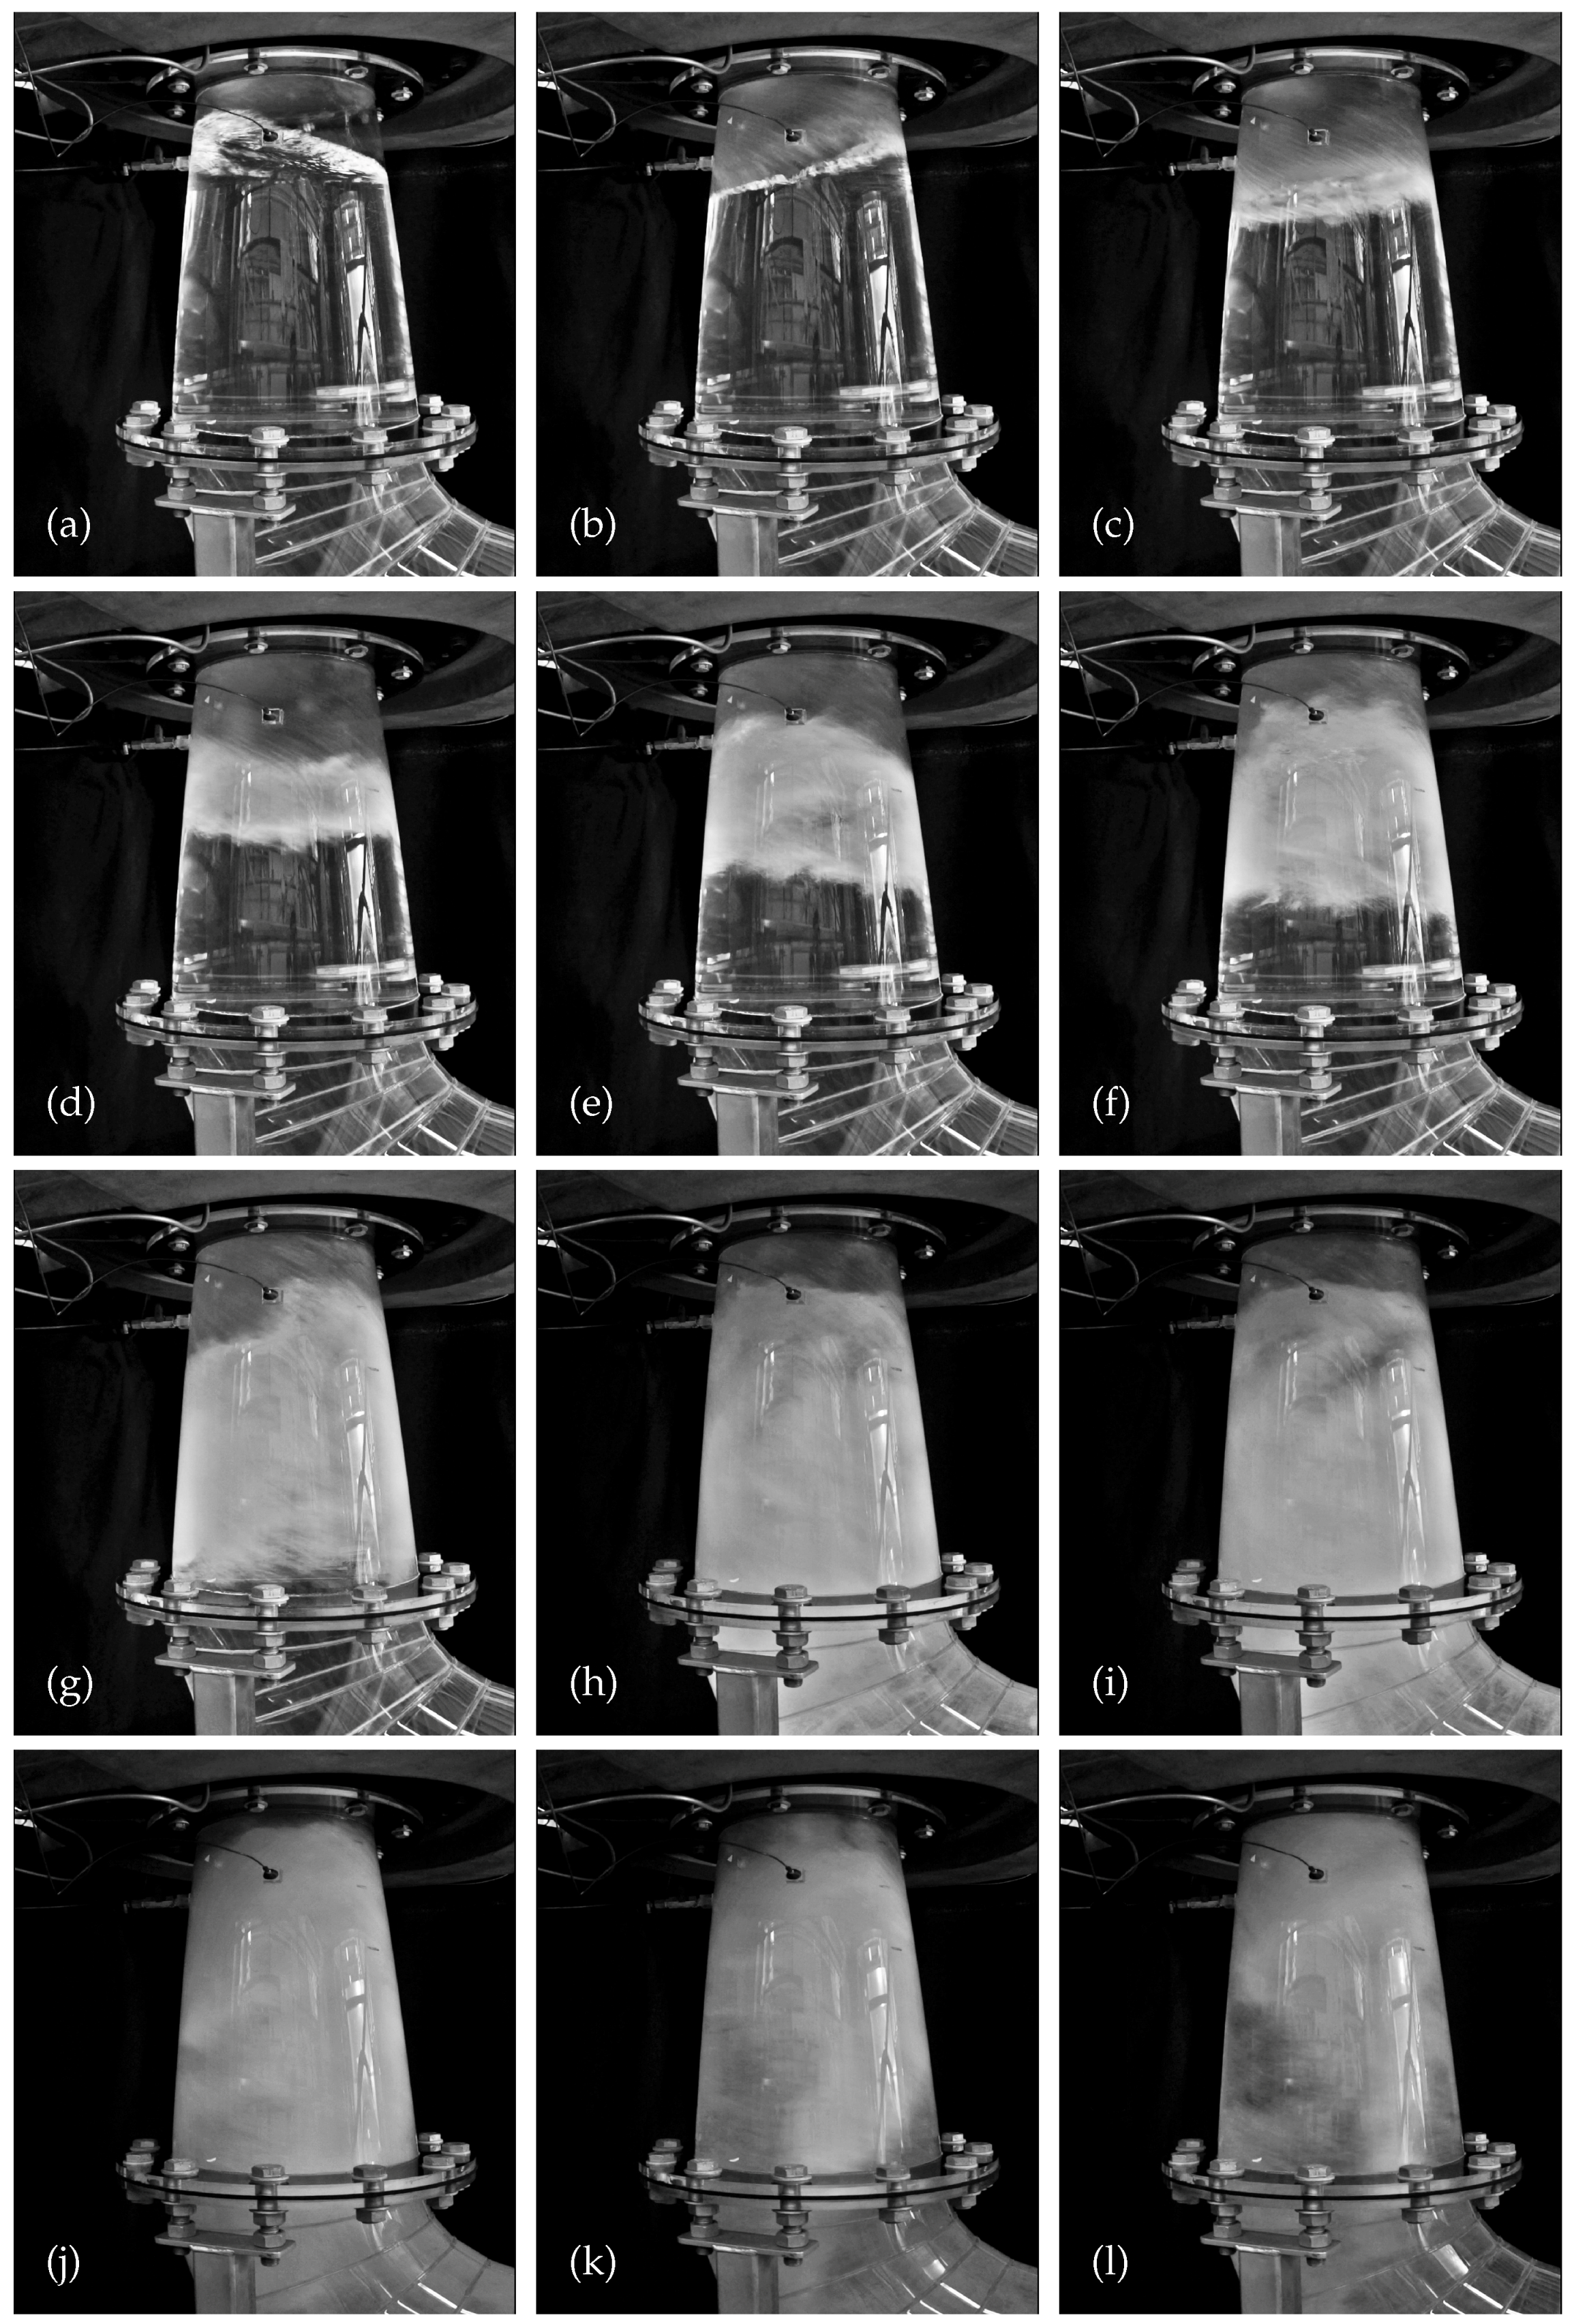
The rapid transition from TWD mode to generation mode at model scale for test case
-3
is shown sequentially in
Figure 2.
Prior to guide vane opening, depending on the level of TWD, a rotating wave-like phenomenon can be seen on the tail water free surface below the runner,
Figure 2a, as previously observed by Ceravola et al. [
5] on a range of units of varying specific speeds. Indeed, as also noted by [
5], the rotating wave reaches a maximum amplitude at a TWD level of approximately 1.0
D, but, more importantly, the amplitude diminishes as the level is decreased towards the runner and at no level is the surface seen to impinge on the turbine runner prior to transition. Furthermore, no impingement of a distinct boundary is observed during transition as is suggested by Magsaysay et al. [
9], where assisted air evacuation is used.
Following GV opening, the initial surge of water enters the runner chamber and is transported into the draft tube tangential to the walls with a high degree of swirl,
Figure 2b. During these initial stages, an inner cylinder of air remains within the draft tube with water on the periphery. As the flow rate increases, the surface level moves down and air begins to become entrained in the highly rotational flow. This results in a foamy mixture that grows in size to fill almost the entire draft tube as air begins to be expelled beyond the draft tube bend,
Figure 2h. For a considerable period of the transition, an air/bubbly-region interface remains clearly visible below the runner exit. As the two-phase flow becomes more established, a number of rotating regions, equal to the blade number, can be seen to form,
Figure 2i,j, eventually combining into one large poorly defined helical bubbly vortex,
Figure 2l. Depending on the final operating condition, this vortex coalesces and reduces in size as the remaining air is entrained and transported downstream through the draft tube until normal operation is established.
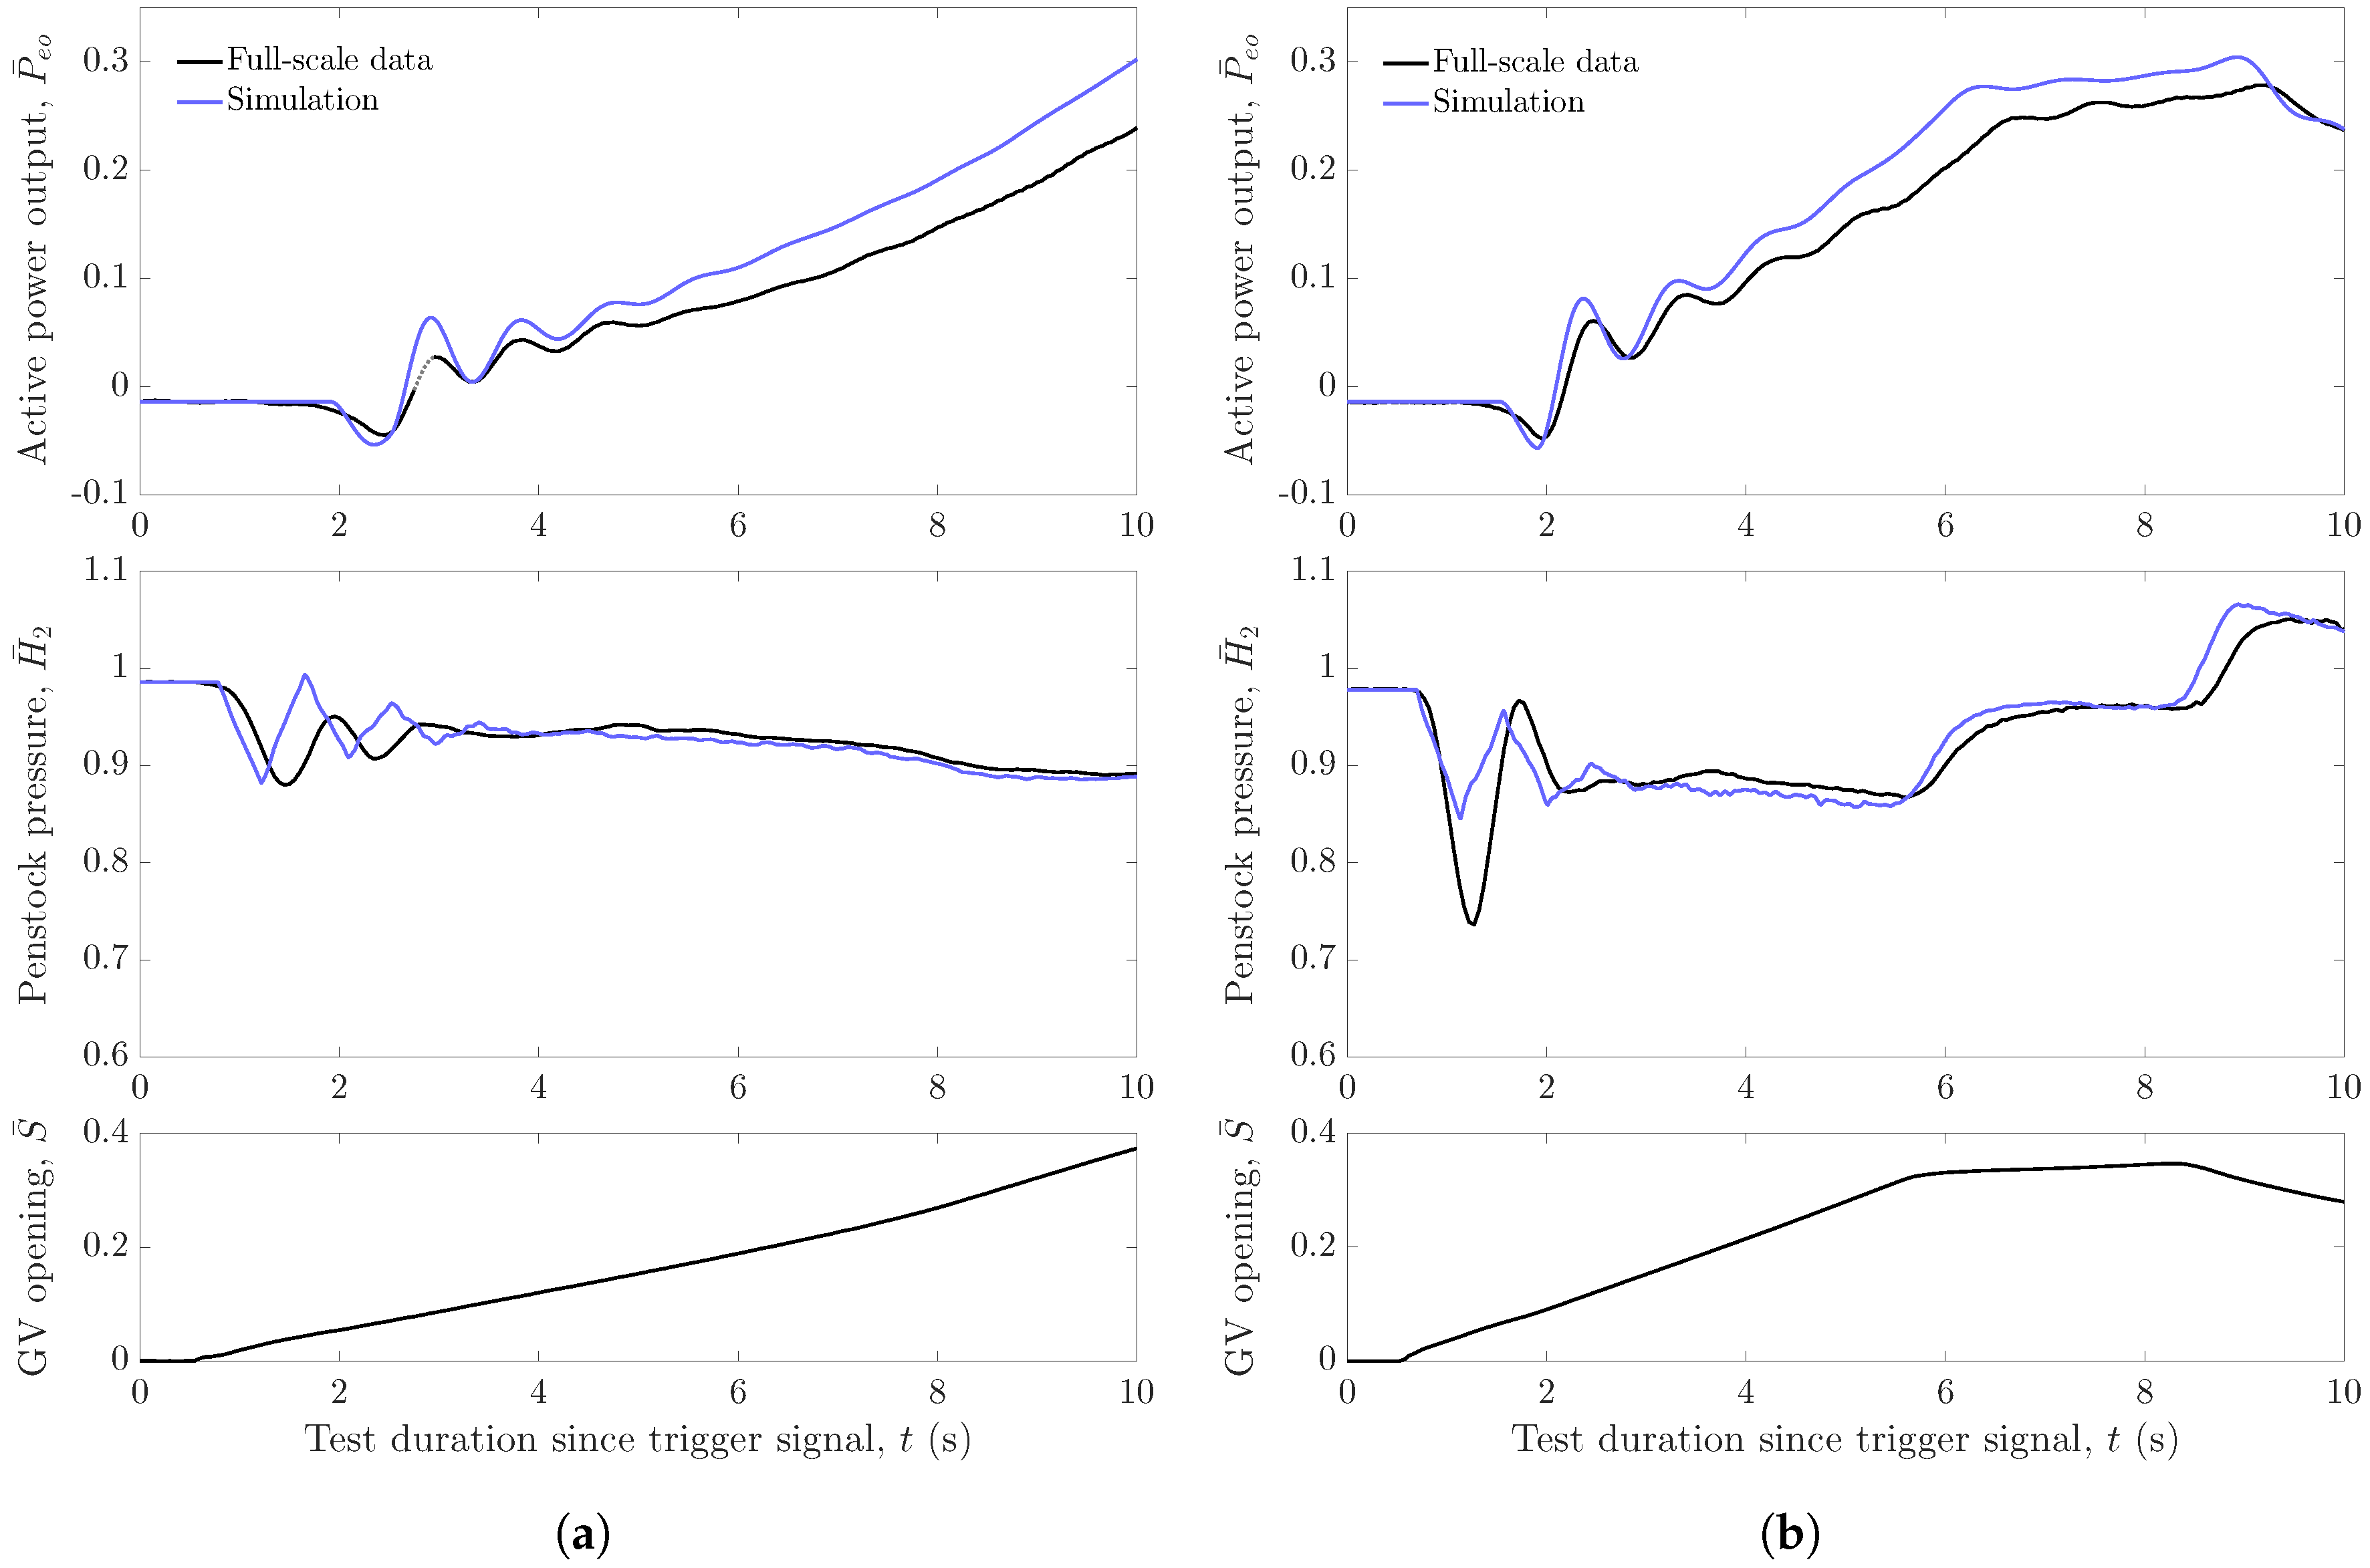
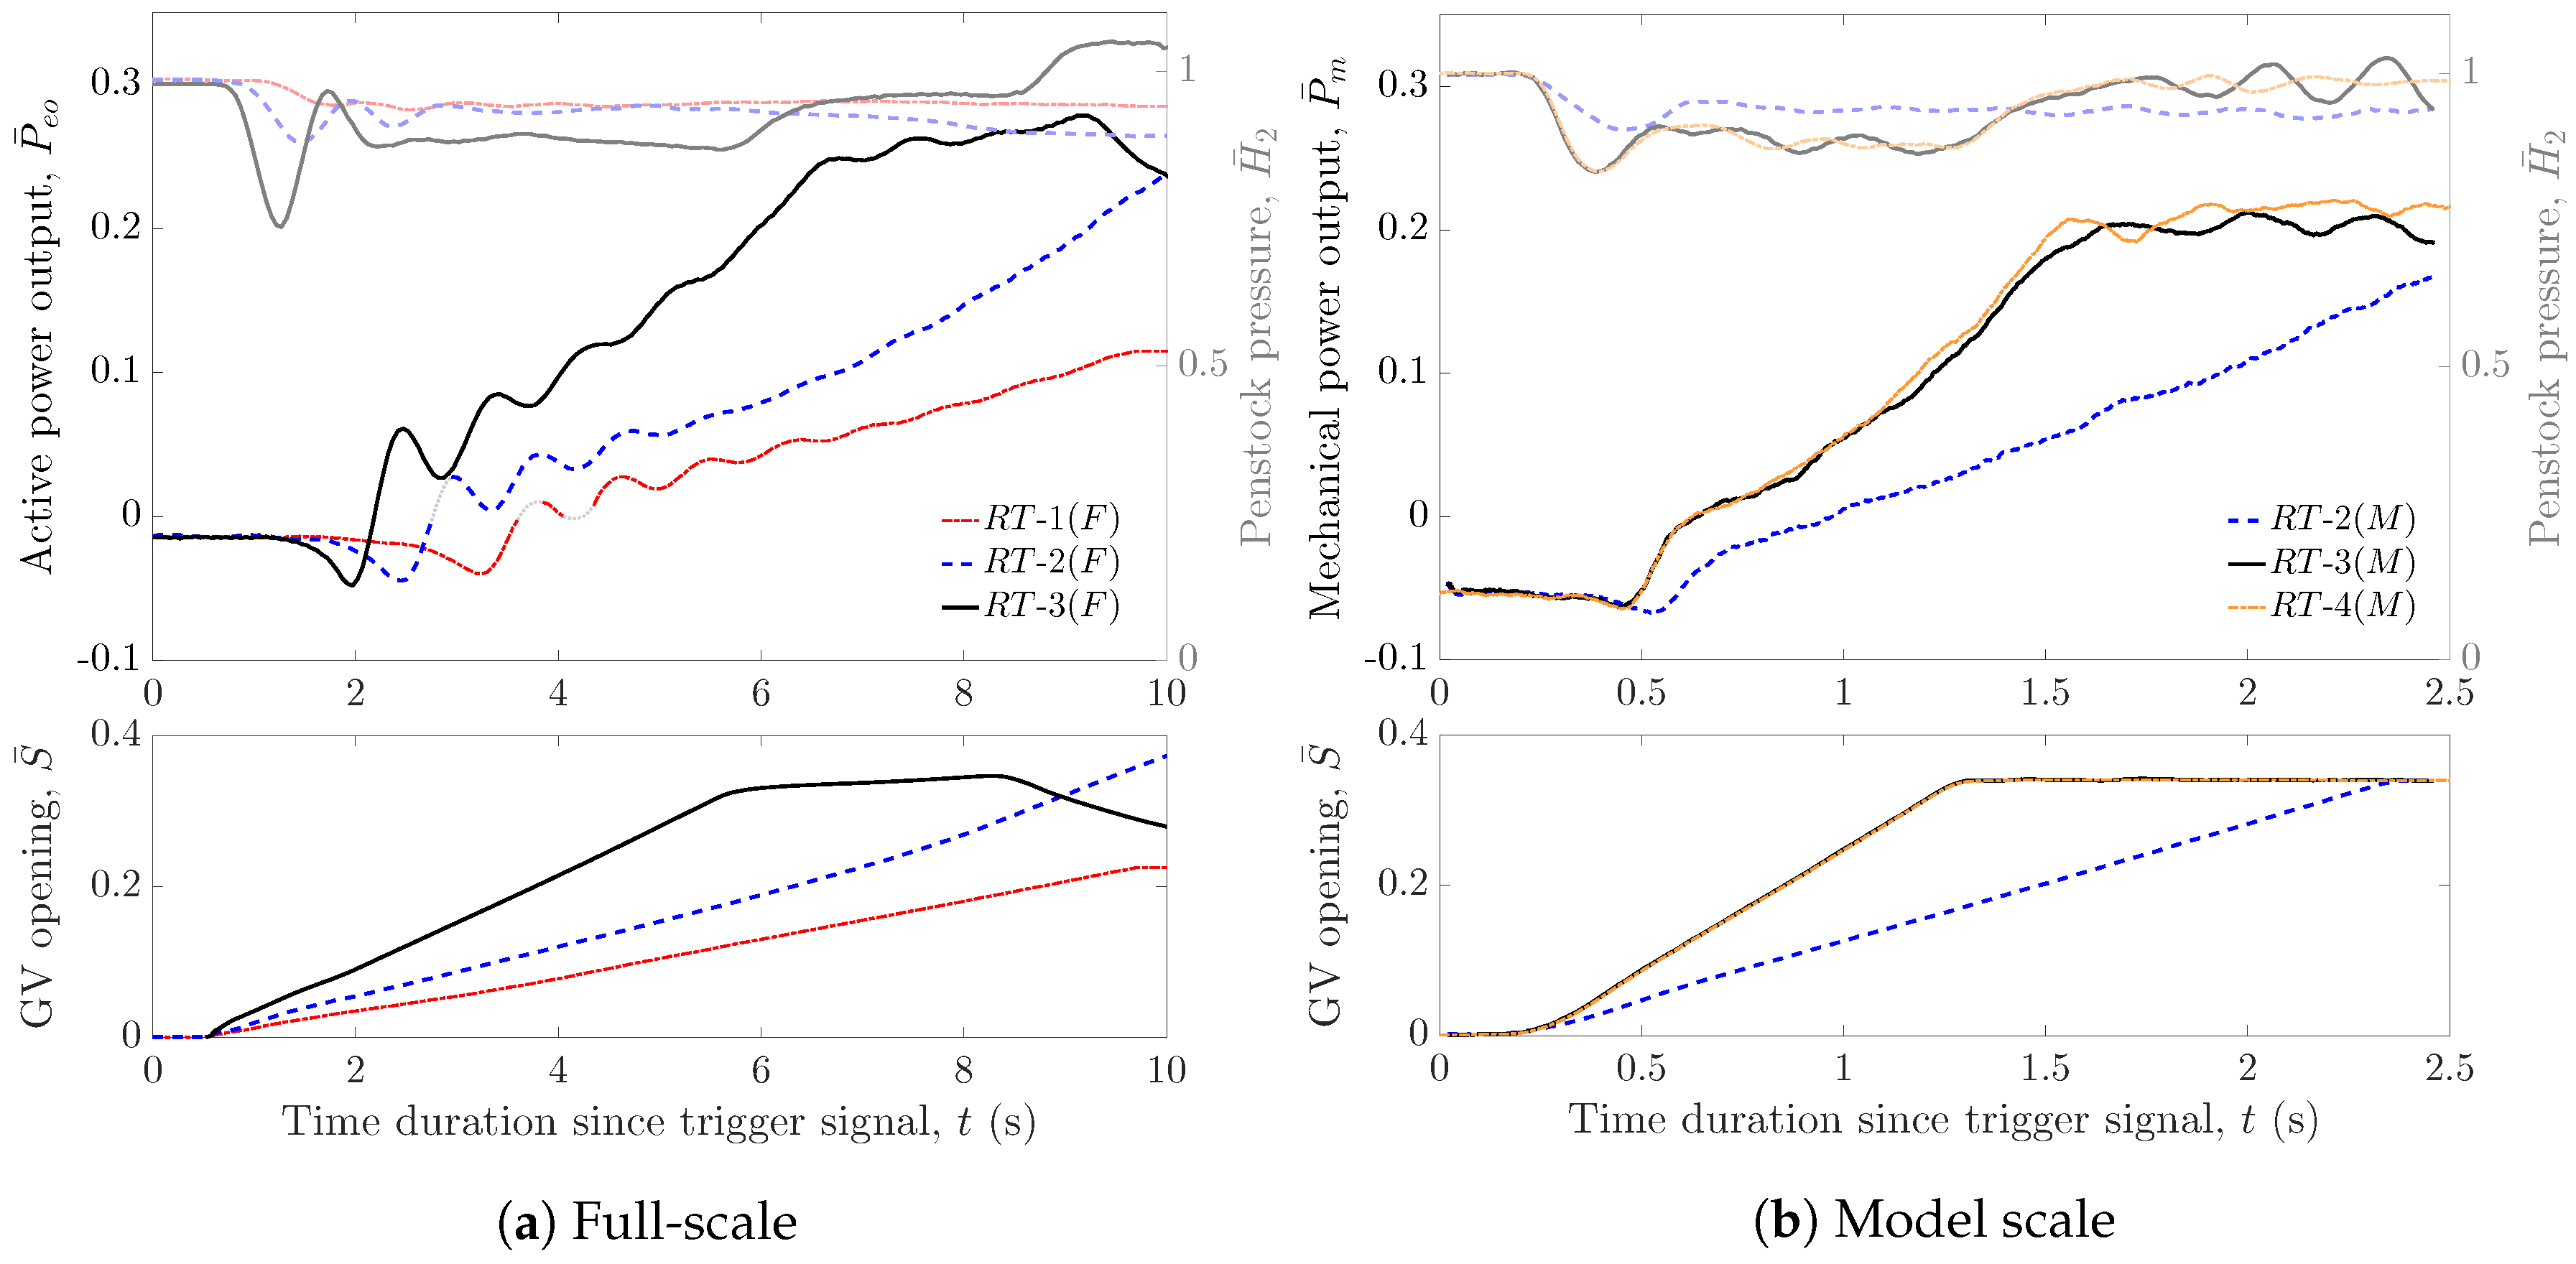
A comparison of representative transition tests looking at the effect of a moderate (
-2) and the maximum (
-3) GV opening rate are presented in
Figure 3, for both full-scale and model scale.
Both transition tests have an initial TWD level of 0.56
D. Additionally, a low opening rate test at full-scale,
-1(
F), is presented in
Figure 3a, while a high initial TWD level test at model scale,
-4(
M), is presented in
Figure 3b. Brief spans where the data acquisition dropped out during full-scale testing of
-1(
F) and
-2(
F) are indicated by the faint dotted lines.
Full-scale testing presented in
Figure 3a revealed a significant delay in active power response followed by an undesirable negative power flow, and subsequent power oscillations during transition from TWD mode to generation. As the fast raise FCAS contribution is calculated based on the time averaged MW output over the 6 s following the frequency trigger, this observed behaviour significantly inhibits FCAS production.
Although guide vane movement commences at 0.5 s following the detection of a contingency event trigger, there is a delay in power response of at least 1 s, one-sixth of the FCAS window, for -1, -2 and -3 tests. In all cases, the power drawn from the grid then increases, reaching a maximum power draw of approximately 4%–5% of rated in each case; at 3.2 s for -1, 2.4 s for -2, and 1.9 s for -3. At this point, it may be assumed that the mechanism causing the increased power draw is alleviated. While there is a slight increase in the magnitude of the power draw, the duration of negative power flow is reduced with the increased opening rate so that positive power generation is established at approximately 2.2 s for -3 compared to 2.8 s for -2, and 3.6 s for -1.
As expected, the decrease in penstock pressure following initial guide vane movement is increased as GV opening rate is increased, reaching a low of 74% of rated for -3(F). In all cases, however, the first low pressure wave, initiated by the guide vane movement, occurs well before any power response is seen. Furthermore, there is no apparent correlation between penstock pressure and the turbine power output during the transition.
Following the establishment of positive output power, active power oscillations with a frequency of approximately 0.9 Hz are present in all test cases.
Transition tests at model scale corresponding to
-2 and
-3 are presented in
Figure 3b along with
-4(
M). The turbine unit performance is given in terms of per unit mechanical power, recorded at turbine shaft, and the penstock pressure. A moving average filter with a 0.08 s window was applied to the acquired data presented in
Figure 3b.
As with the full-scale tests, the model scale tests also revealed a considerable delay from the first movement of the guide vane actuator to a discernible power response. An increased power draw is seen followed by a short, rapid positive increase in output before a more steady loading is established. Again, as observed on the full-scale unit, the penstock pressure immediately responds to the guide vane movement, decreasing more rapidly and to a greater extent for the faster opening -3 and -4(M) test cases.
The duration of the increased negative power flow is reduced considerably for the faster opening cases with positive power generation occurring at approximately 0.65 s for -3 and -4(M) compared to 1.05 s for -2. Unlike the full-scale response, the peak negative power flow appears to be somewhat less for the more rapid guide vane opening.
Rapid starting test -4(M) was performed with a higher tail water depression level at 0.23D below the runner exit plane, compared to 0.56D for -3(M), representing the high, and low, levels achievable at full-scale. Shaft power during transition was found to be completely independent of the initial tail water depression level, as was also indicated by full-scale tests.
Noticeably, the shaft power recording during micro-hydro unit tests did not display the periodic fluctuations following the initial power dip as observed at full-scale in which active electrical power measurements were recorded.
In order to provide a stable load during transition testing at model scale, the induction motor as generator was grid connected at synchronous speed. As such, the unit was subject to any minor fluctuations around the nominal 50 Hz system frequency. Rotational speed measurements were found to vary by ±2 rpm, or 0.3% of rated, although these fluctuations were of the order of 0.05 Hz while transition tests were of the order of 2.5 s. Additional sources of experimental errors include the use of a finite volume header tank resulting in a slight decrease in net head during tests, possible influence of penstock flexure and constraint on transients, variation in guide vane opening characteristics, and the measurement uncertainties discussed above.
Summary of Experimental Findings
The findings of full-scale testing and the tests performed on the micro-hydro unit may be summarised as follows:
An increased power draw during the initial stage of transition is observed for both full-scale and micro-hydro scale units;
Visual observations on the micro-hydro unit indicate that the tail water does not impinge on the runner during the transition;
The power output for both model and full-scale units was found to be independent of initial tail water depression level prior to transition;
There exists a significant delay between the initial guide vane movement and any discernible power response;
The penstock pressure response does not exhibit the same delay; indeed, the first low pressure wave passes prior to any significant power draw;
The magnitude of the negative power flow is not significantly influenced by guide vane opening rate;
The duration of negative power flow is reduced under an increased opening rate;
The temporal location of the maximum power draw decreases with increasing opening rate; however, the servomotor position at the peak draw is actually increased;
Power oscillations are observed at full-scale where active electrical output power is measured, while these are not observed on the model scale unit where shaft power is recorded.
4. Description of Transition Mechanism
Based on Findings 1–3 above, it is evident that the increased negative torque observed in rapidly switching a Francis turbine unit from TWD is not caused by impingement of the free surface on the turbine runner, as in the case with assisted air evacuation. As such, the transition sequence is described as follows:
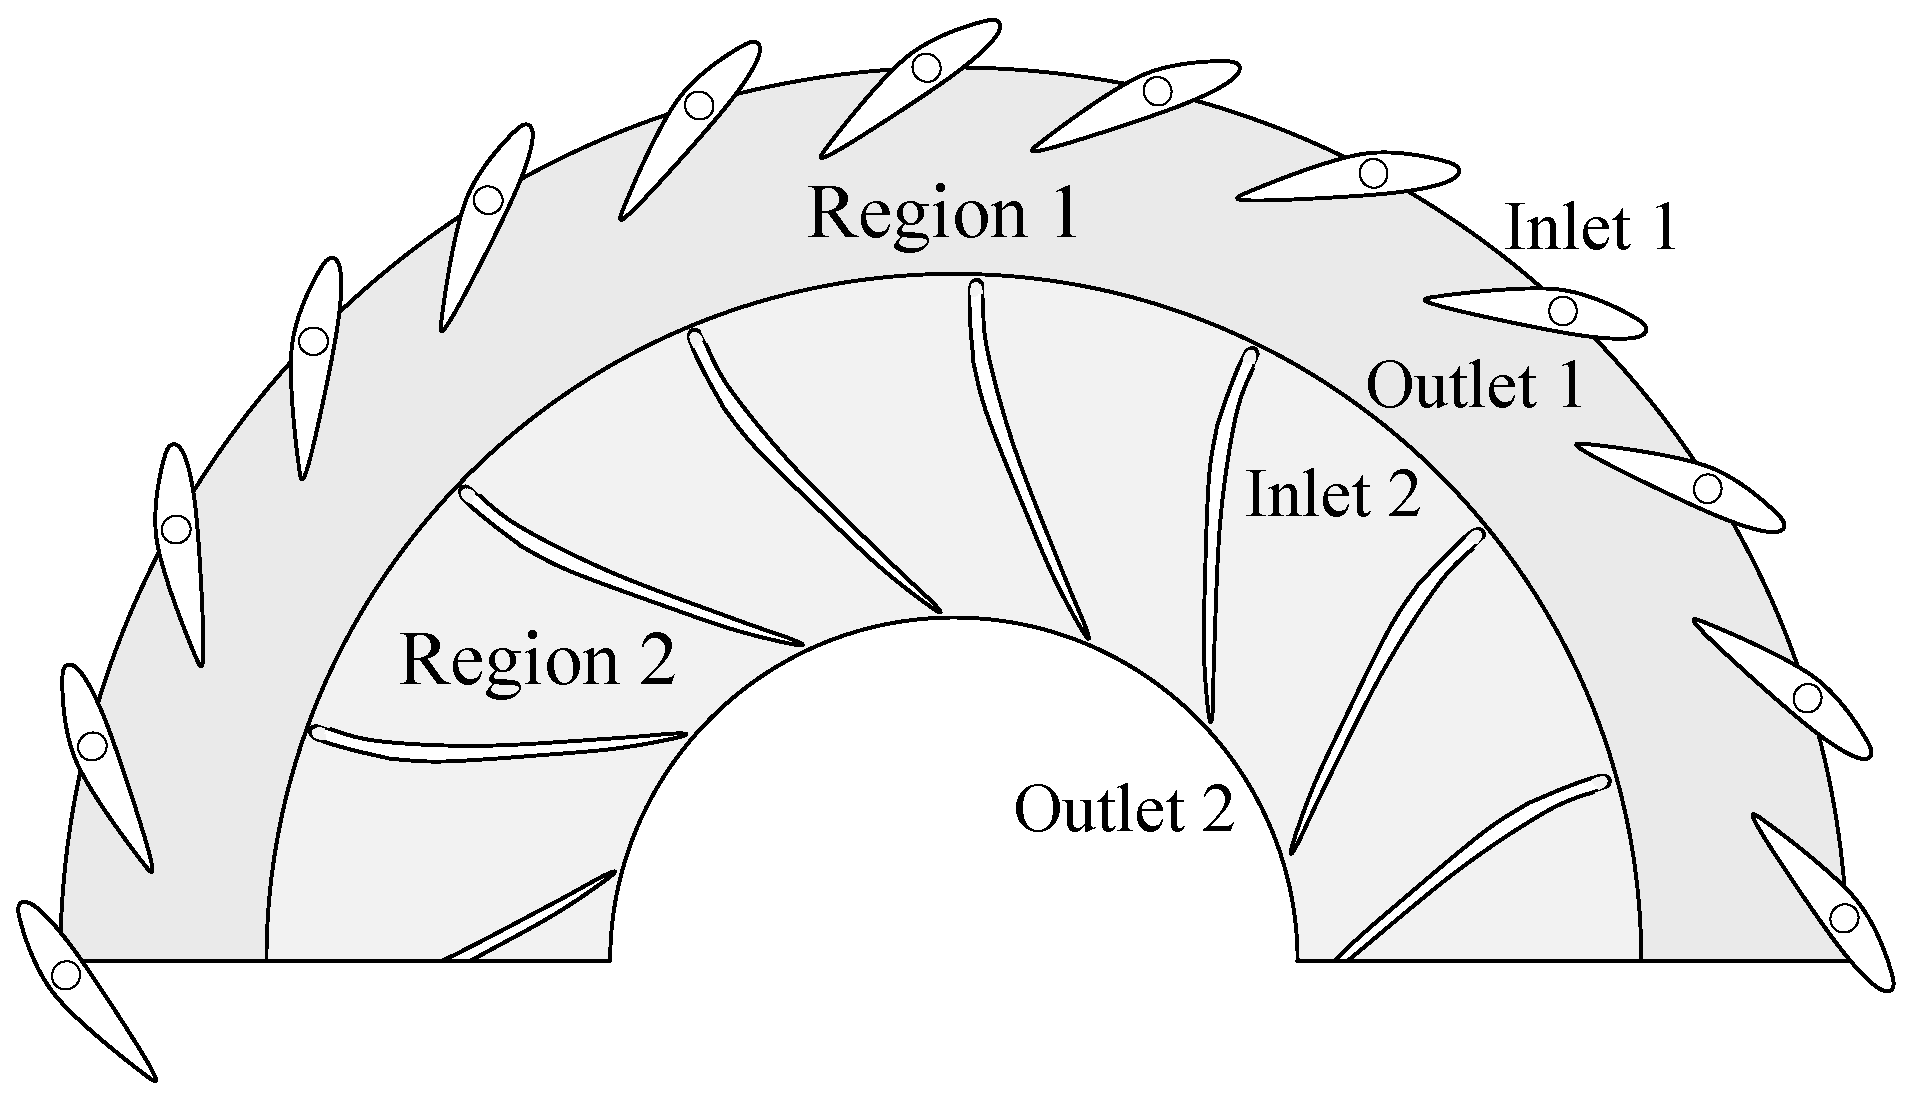
Initially, as evidenced by Findings 4 and 5, as the guide vanes are opened, water is accumulated in the vaneless annular volume that extends from the GVs to the runner inlet (designated as Region 1 in
Figure 4). The flow, due to the initially high tangential velocities, remains largely on the periphery of the enclosed volume resisting entry into the runner proper until a sufficient volume of water has been introduced, or the guide vane angle is such, as to direct water into the runner (Region 2).
At a given point following opening, dependent on opening rate, water will begin to enter the runner proper (Region 2), however, due to the low volumetric flow rate, will do so with a reduced inlet tangential velocity in relation to that required for positive power production as described by Euler turbine theory. Findings 6–8 all indicate a relationship between the inlet flow condition at the moment of, and directly following, the incursion of the water volume, and the negative torque applied to the runner causing the increased power draw. This resulting negative torque is due to the runner essentially bringing the incoming flow up to the required velocity. As the guide vanes continue to open, the volumetric flow rate continues to increase and the inhibiting torque applied to the runner by the low momentum fluid reaches a maximum.
Finally, the incoming tangential velocity component of the flow attains a value such that, for the current machine flow rate, positive power output is realised. The lack of subsequent power oscillations at model scale, where a direct measurement of shaft torque was taken, indicates that this aspect of the full-scale response is electro-mechanical in nature rather than a purely hydraulic phenomenon (Finding 9). This rectification of the inlet velocity triangle occurs relatively suddenly and results in a sudden change in electrical load angle of the generator causing the observed power oscillations. As load is increased at a steady rate, the power fluctuations subside and normal operation is established.
This process, outlined above, may be adequately described by considering the conservation of angular momentum across two control volumes (
CVs), Region 1 and Region 2, as defined in
Figure 4. The conservation of angular momentum applied to a single
CV is given by Equation (
1):
where
M is the applied moment,
r the radius,
V the fluid velocity,
the fluid density,
volume, and
the fluid mass flow rate.
Equation (
1) implies that the sum of all external moments acting on a control volume is equal to the time rate of change of angular momentum contained within the control volume plus the net rate of flow of angular momentum out of the control surface boundaries by mass flow. As the Euler turbine equation is just a particular application of the conservation of angular momentum, the mechanical power output is encapsulated in the model as the negative of the sum of the external moments acting on Region 2.
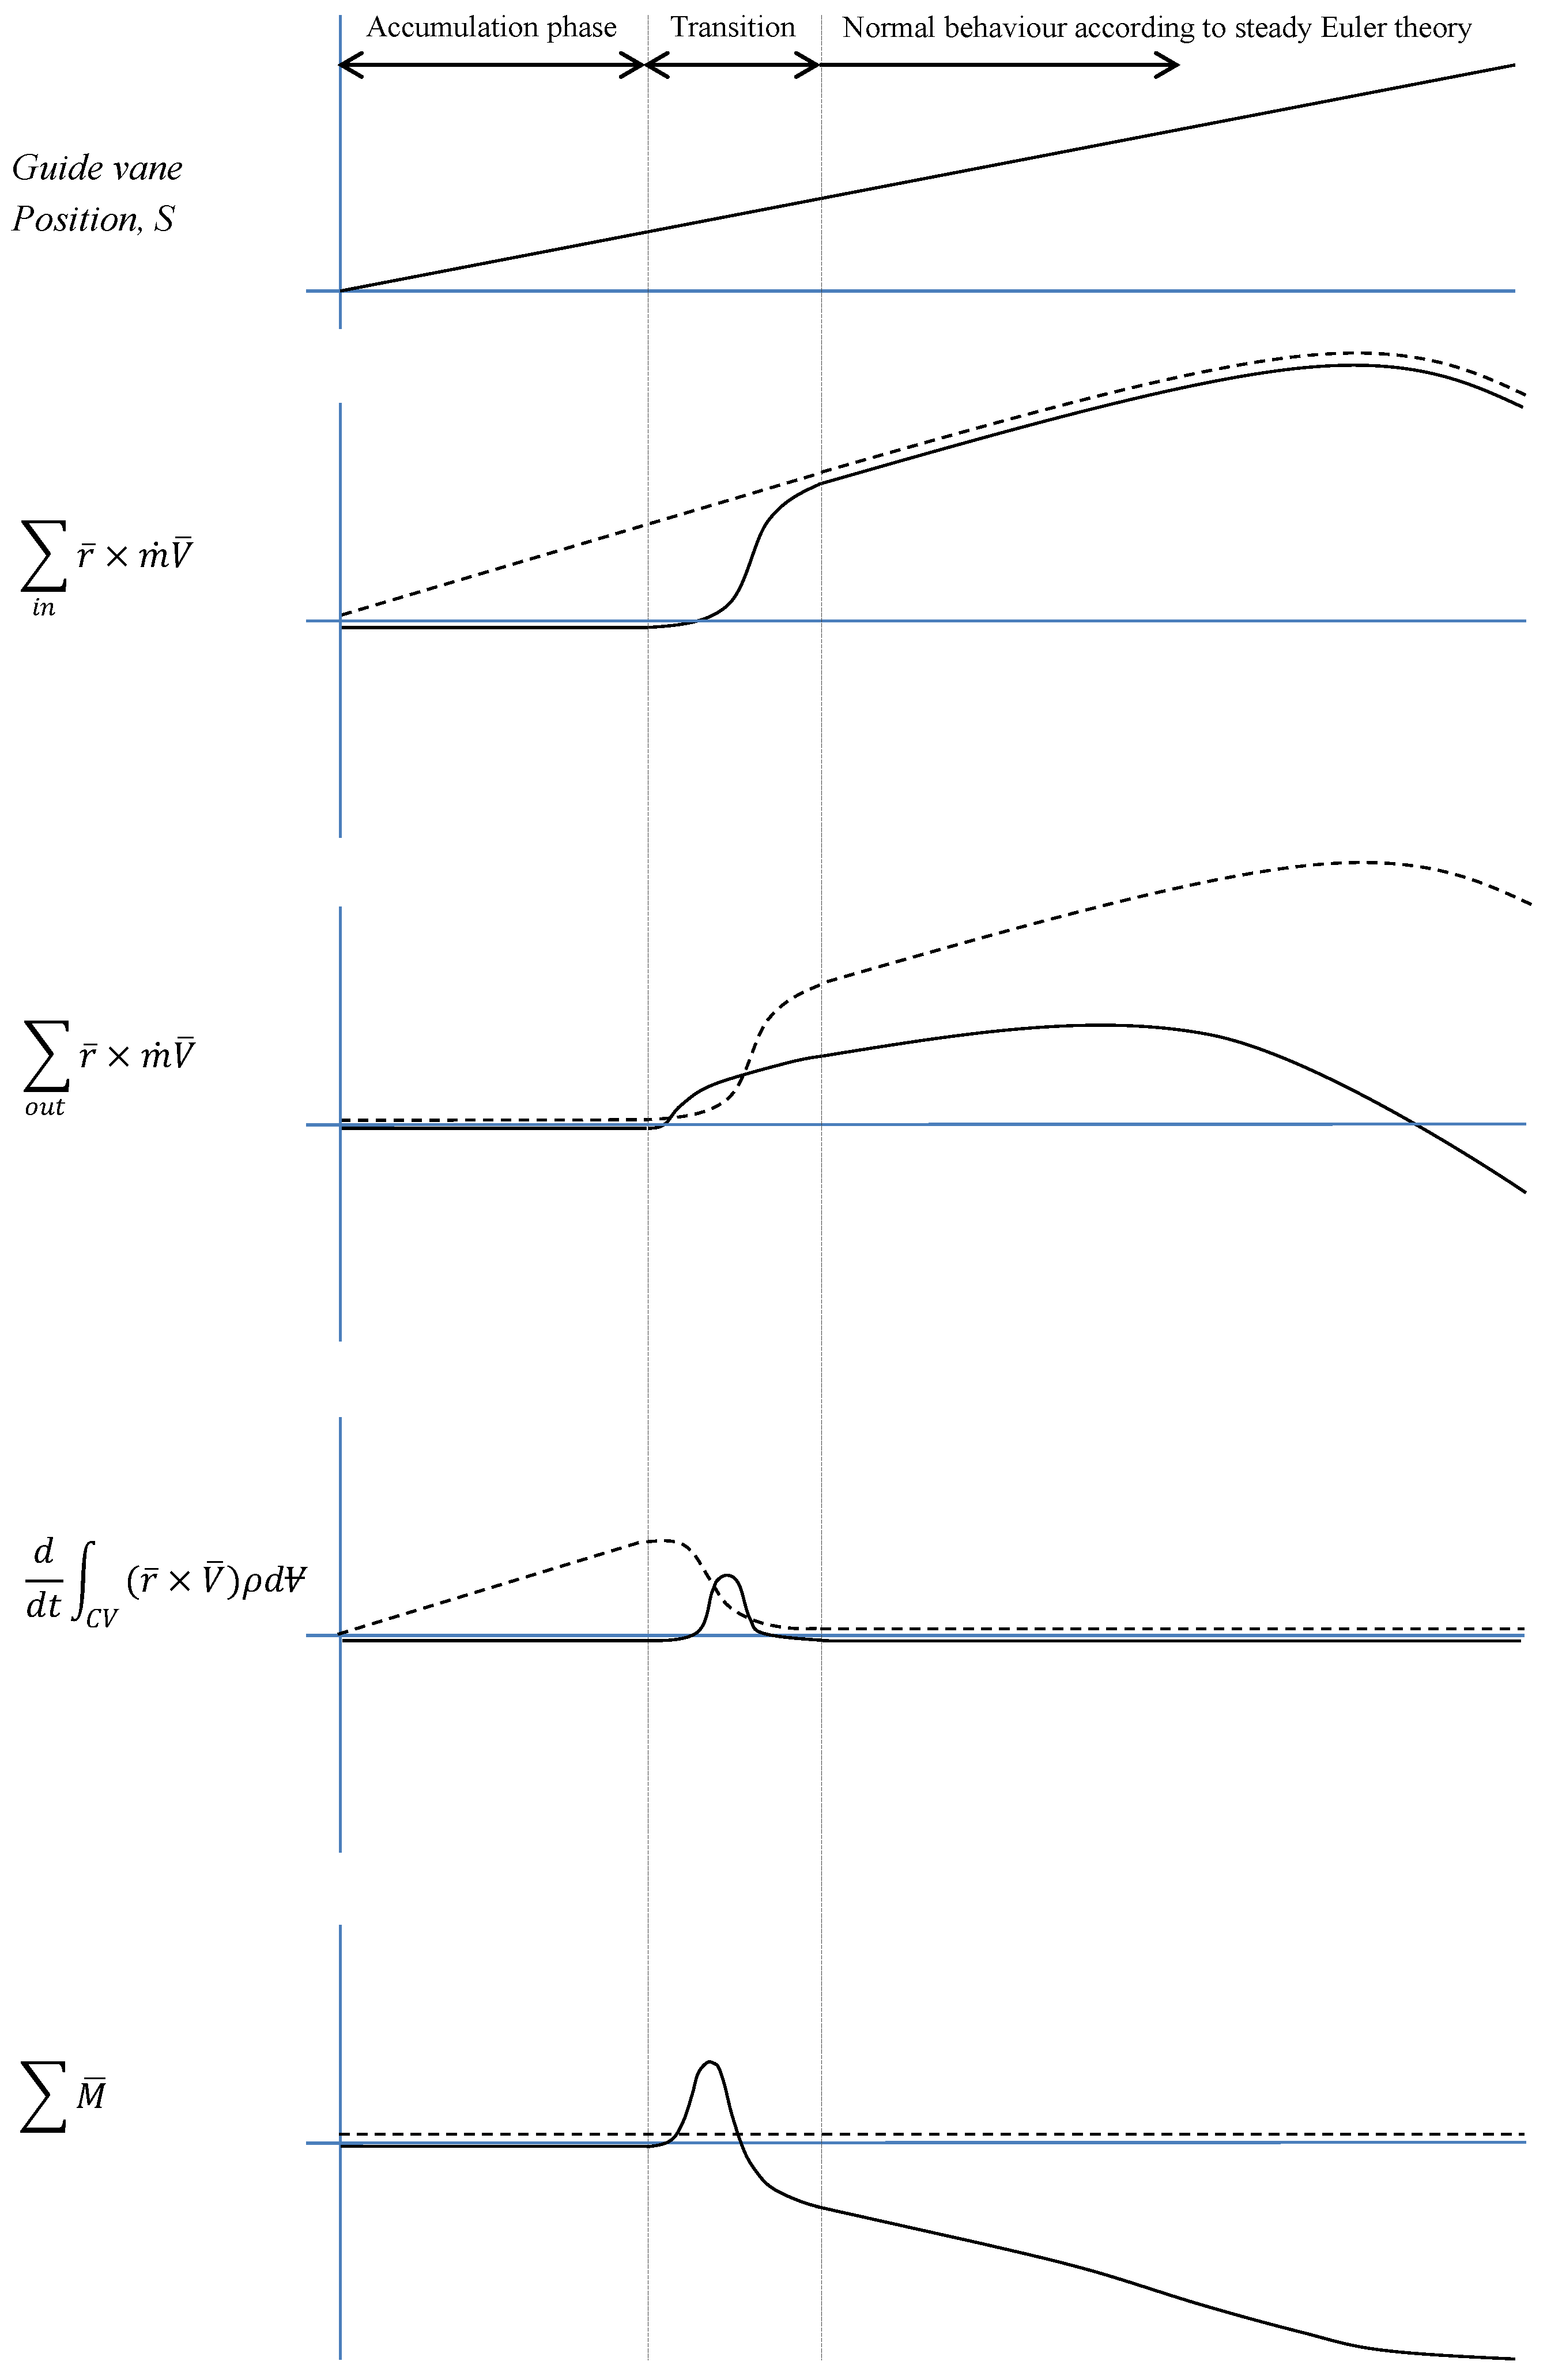
The process of rapid transition from TWD mode is illustrated graphically in
Figure 5 by considering each term of Equation (
1) separately for Region 1 and Region 2.
Figure 5 is comprised of five plots. The first shows a representative linear guide vane opening profile from zero (fully closed) to maximum opening. The four remaining plots show the flow rate of angular momentum into the control volume, the flow rate of angular momentum out of the control volume, the rate of change of angular momentum within the control volume (the accumulation term) and the sum of the moments acting on the control volume. Each angular momentum plot shows two curves: the dotted line represents the specific angular momentum term within Region 1, while the solid line represents the specific angular momentum term within Region 2.
The process is shown as three distinct phases: accumulation, transition, and normal behaviour according to Euler theory. The rapid transition from TWD mode as described above is concerned with the first two phases.
During the accumulation phase, the guide vanes are opened and flow enters the turbine but remains within Region 1. Therefore, the angular momentum within the annular volume increases from zero, the accumulation term of Region 1 increasing at the same rate as the inlet term of Region 1, while the outlet term of Region 1 remains zero.
The start of the transition phase is marked by entry of fluid into the runner proper. The exact nature of the flow within Region 1 prior to incursion into Region 2 is not at this stage known. It is likely that the flow remains on the periphery of the annular space due to the centripetal force associated with the highly tangential velocity vector. Additionally, the flow may be highly aerated, forming a non-distinct air-water boundary due to the throttling of the flow through the guide vanes. In any case, the flow rate of angular momentum entering Region 2 is not established instantaneously (and is the major contributing factor in the observed power draw and response delay).
While the angular momentum entering the control volume of Region 1 continues to increase with increasing guide vane opening, the Region 1 outlet term gradually increases from zero. As there is no moment transfer within Region 1, this increase in momentum outflow is reflected by a decrease in accumulation.
Neglecting any leakage flow, the momentum entering Region 2 is equal to that leaving Region 1. However, the flow rate of angular momentum entering Region 2 at this stage is extremely low. Some of the incoming flow is accumulated within the runner, while the remaining flow leaves the runner. The flow rate of angular momentum leaving Region 2 does so, however, with a higher angular momentum than what it entered Region 2 with. Referring to Equation (
1), the difference between the incoming angular momentum and the sum of the outgoing and stored angular momentum must be provided by an external torque. With the rotor locked to system frequency, this external torque is provided by an increased draw in power from the grid. Referring to Equation (
1), this external torque is applied to the control volume and so the sum of moments temporarily becomes positive (i.e., an increased power draw).
As the guide vanes are opened further, the flow condition, in terms of flow rate and inlet angle, becomes such that the flow rate of angular momentum entering Region 2 becomes greater than the sum of outgoing and stored angular momentum flows, thereby imparting a torque on the runner which is seen as a decrease in the sum of moments applied to the control volume.
As the torque increases, the power flow is reversed: the synchronous machine switches from acting as a motor and drawing power from the grid, to acting as a generator and providing power to the system. At the end of the transition phase, both storage terms go to zero and normal turbine operation according to traditional Euler theory is established.
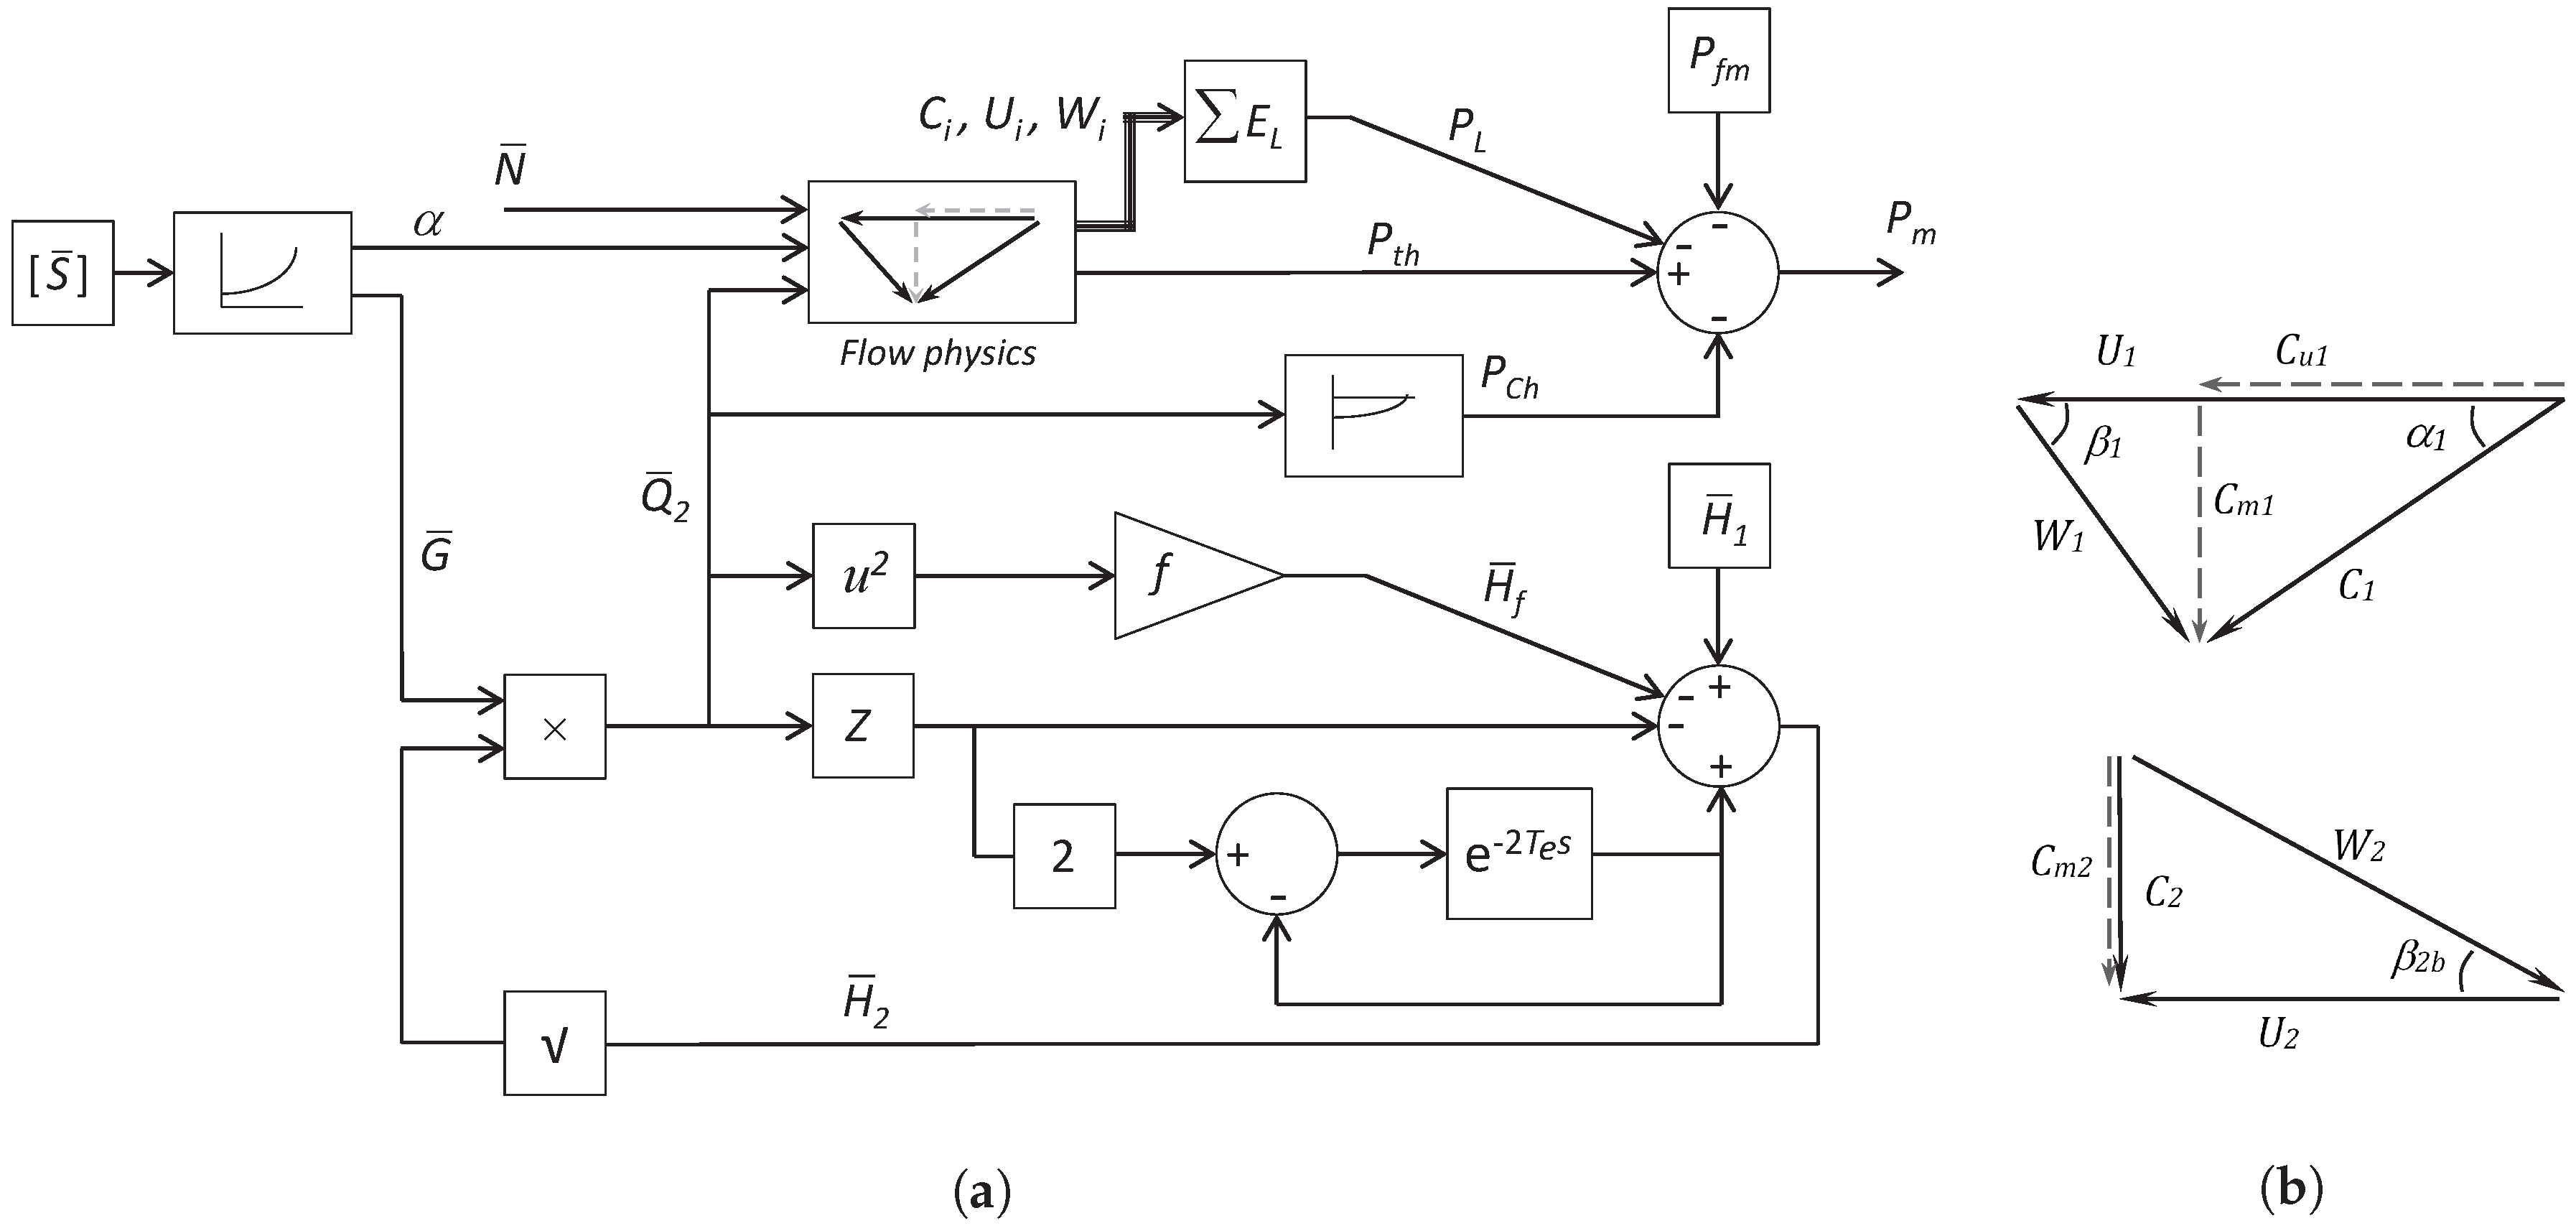
5. Analytical Model
The following model is an extension of the one-dimensional numerical model of a hydropower plant for system dynamic studies presented by Giosio et al. [
13], implemented within the MATLAB Simulink (v8.4, Mathworks, Natick, MA, USA) environment. The model replaces the conventional, simplified representation of the turbine unit by a consideration of turbine inlet and outlet velocity vectors, where machine output is calculated by the Euler turbine equation, based on the conservation of angular momentum. Major system loss components including blade incidence, residual swirl, mechanical friction and churning losses at low load were determined from test data. The model (
Figure 6) was shown to accurately predict electrical power output and penstock pressure over the full operating range for a number of rapid set-point variation tests for the hydropower plant specified in
Table 2.
As the runner chamber is vacated of water prior to the rapid transition from TWD mode, the predicted power output during transition is calculated with churning losses, , set to zero. Churning losses are the result of the resistance to rotation applied to the turbine runner by low momentum fluid within the runner proper. While this assumption of zero loss holds during the very initial stages of transition, losses will be incurred as water begins to be accumulated within Region 2.
Due to generator inertia, the rotor angle is not able to instantaneously adjust to a new equilibrium position when subject to a sudden increase in applied torque. The dynamic response is a function of how heavy the generator is loaded, generator output at the time of the event, transmission system properties, generator reactance and internal voltage magnitude, generator inertia, and the size of the network the generator is connected to [
14].
In order to capture the system interaction, a network model based on that given by Dessaint and Champagne [
15] was used in which the synchronous machine is connected to a 220 kV, 1600 MVA network through a Delta–Wye 210 MVA transformer. A local resistive load of 5% of the rated generator capacity is also provided. The size of the Tasmanian network typically varies between 1.0–2.0 GW depending on the time of day, and year. Simulation results presented below were performed on a representative Tasmanian grid of 1.6 GW.
In order to more accurately represent the physical processes occurring during the rapid transition from TWD mode, two additional features were incorporated into the hydraulic model.
5.1. Flow Accumulation
To account for the delay attributed to the accumulation phase, the flow rate, as calculated by the orifice equation, , is integrated over the simulation time to determine the volume of water that has passed into Region 1. The calculated flow rate, , is passed through to the waterway model, as this still effects the penstock dynamics; however, the flow rate input into the Euler equation (flow physics) calculation block is held to a value of zero until the accumulated volume has reached a certain proportion of the annular volume. The proportion used varied with GV opening rate as determined by inspection. For test cases -1, -2, and -3 (and -4), proportions of 0.6, 0.8, and 1.0× the total annular volume, respectively, were set as the accumulation limits to reflect observations indicating that the inflowing water started interacting with the runner before the full volume was reached.
5.2. Reduced Tangential Velocity
As the flow begins to enter Region 2, it will do so with a low mass flow rate, confused inlet flow angle, and a potentially highly aerated air-water boundary. Therefore, the calculated inlet flow angle is modified to reflect this initially low flow rate of angular momentum. A linear assumption is made whereby the apparent inlet angle varies from a purely radial flow, , at the end of the accumulation phase to the calculated angle at a GV opening determined by inspection of test data. This has the effect of gradually increasing the rate of flow of angular momentum into Region 2, bridging the accumulation and transition phases. While the linear approximation succeeds in gradually increasing the rate of flow of angular momentum (since ), it does result in a discontinuity in the time derivative of the value of the effective inlet flow angle, which may effect simulation results.
6. Model Results
Simulation results for the improved hydropower plant model are presented for rapid transition tests
-2 and
-3 in
Figure 7a,b, respectively.
The predicted power output in each case is shown to capture the general response characteristic of the test. Generally, the simulated power response over predicts the magnitude of both the negative power flow and, to a larger extent, the subsequent positive power flow due to the model assumptions made concerning the reduced tangential velocity and flow accumulation. Furthermore, the absence of an accumulation term within Region 2, and the associated requirement for the inclusion of some form of transitional churning loss, causes a significant over prediction in power output following the initial transient phase where load is being steadily increased.
The ability of the proposed model to accurately predict penstock pressure following rapid guide vane movement under normal operating conditions, verified in [
13], was not observed in the rapid transition tests from TWD mode. For test case
-2, the magnitude and frequency of the penstock pressure transients were well predicted, although it is apparent that a degree of backlash is present, resulting in slightly delayed and gentler pressure transients not captured in the model. Furthermore, it has been shown by numerous authors [
16,
17] that both transient attenuation and phase shift can be improved by the inclusion of an unsteady friction model for cases in which the initiating event is sufficiently rapid. The inclusion of such a term in the current model would likely improve the results presented in
Figure 7.
The pressure response from the more rapid opening, -3, was not captured however, the model under-predicting the pressure by approximately 15%. This discrepancy is, in part, due to the calculation of the nonlinear guide vane function, , which is based on steady state data and the head difference between upstream and downstream measurement sections. In the case of rapid transitions from TWD mode, where flow is essentially throttled through the guide vane assembly to the runner chamber filled with air at near atmospheric pressure, the discharge coefficient will be significantly modified.
In order to verify that the inability to predict this low penstock pressure did not affect the predicted power response, the hydraulic model was modified to include the measured penstock pressure as a model input, replacing the elastic waterway equation. Flow rate calculated from the measured penstock pressure was then used as the input to determine the accumulated volume and runner torque according to the Euler equation block. Results of this simulation confirm that the initial power response is not affected by the penstock pressure during the early stages of transition.
This under prediction does highlight, however, that further refinement is required to be able to specify safe operating limits in terms of GV opening rates while remaining above the minimum allowable penstock pressure during the proposed rapid starting procedure. Furthermore, operation in TWD mode poses additional considerations that must be evaluated, including, but not limited to: initiation of penstock resonance, air admission into the penstock, interruption of opening procedure, and the unbalanced loading of runner vanes.
7. Conclusions
This paper presents full-scale test data and results from laboratory testing of a micro-hydro turbine unit to investigate the transition that occurs when a Francis turbine is rapidly brought online from a proposed tail water depression mode for the purpose of providing fast system frequency control.
A detailed description of the process is given based on experimental findings. The transition process is shown to be adequately described by a consideration of the conservation of angular momentum applied across two adjacent control volumes representing the vaneless space between the guide vanes and runner, and the runner itself.
The formulation of a one-dimensional hydropower plant model is presented, building on the work by Giosio et al. [
13], utilising the law of conservation of angular momentum with additional modifications to account for flow accumulation, and the nature of the incoming velocity vector during transition. Simulation results, validated against full-scale data, are shown to capture the general characteristic of the power and penstock pressure response during rapid transition, providing further validation of the proposed transition description. However, simulation results were unable to predict the magnitude of the initial low pressure transient event, highlighting the need for further refinement in order to adequately assess the risks involved in such a mode of operation.
Ultimately, the research presented assesses the rapid transition a Francis turbine unit from tail water depression mode to generation for the purpose of providing rapid load support to the grid. A three-stage transition mechanism responsible for the observed output response is proposed based on the findings from both experimental and numerical investigations, testing key operational parameters such as guide vane opening rate and tail water depression level.


