Multi-Objective Optimized Aggregation of Demand Side Resources Based on a Self-organizing Map Clustering Algorithm Considering a Multi-Scenario Technique

 , ,
, ,
Abstract
1. Introduction
2. Multiple Scenarios Construction of DSR Aggregation
2.1. Demand Side Resource Characteristics Analysis and Features Quantities Extraction
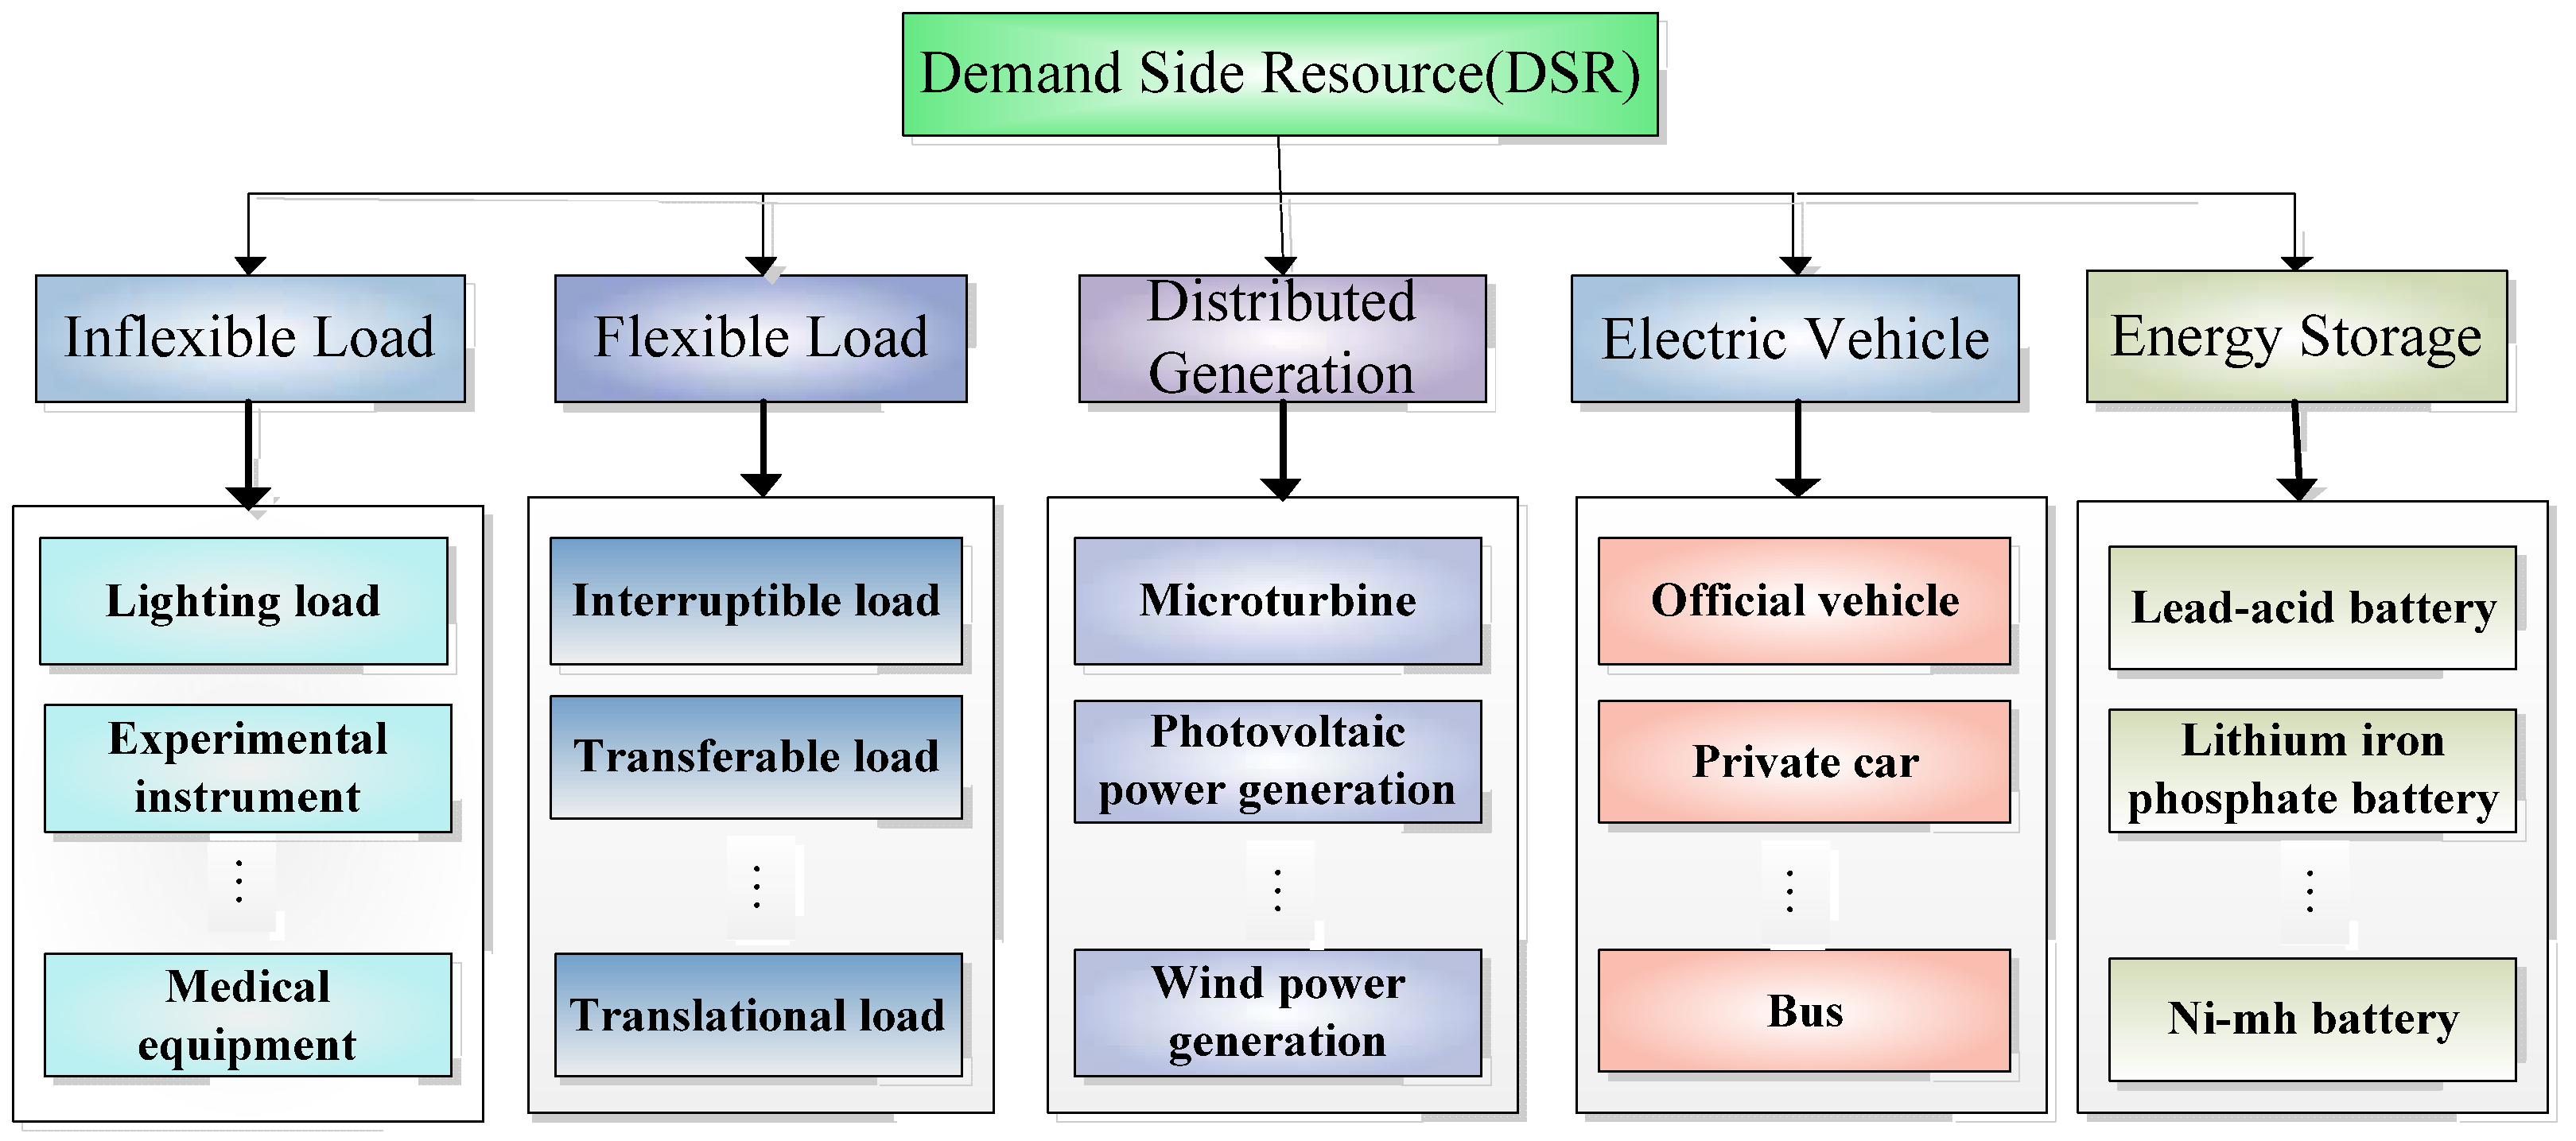
2.1.1. Demand Side Resource Introduction
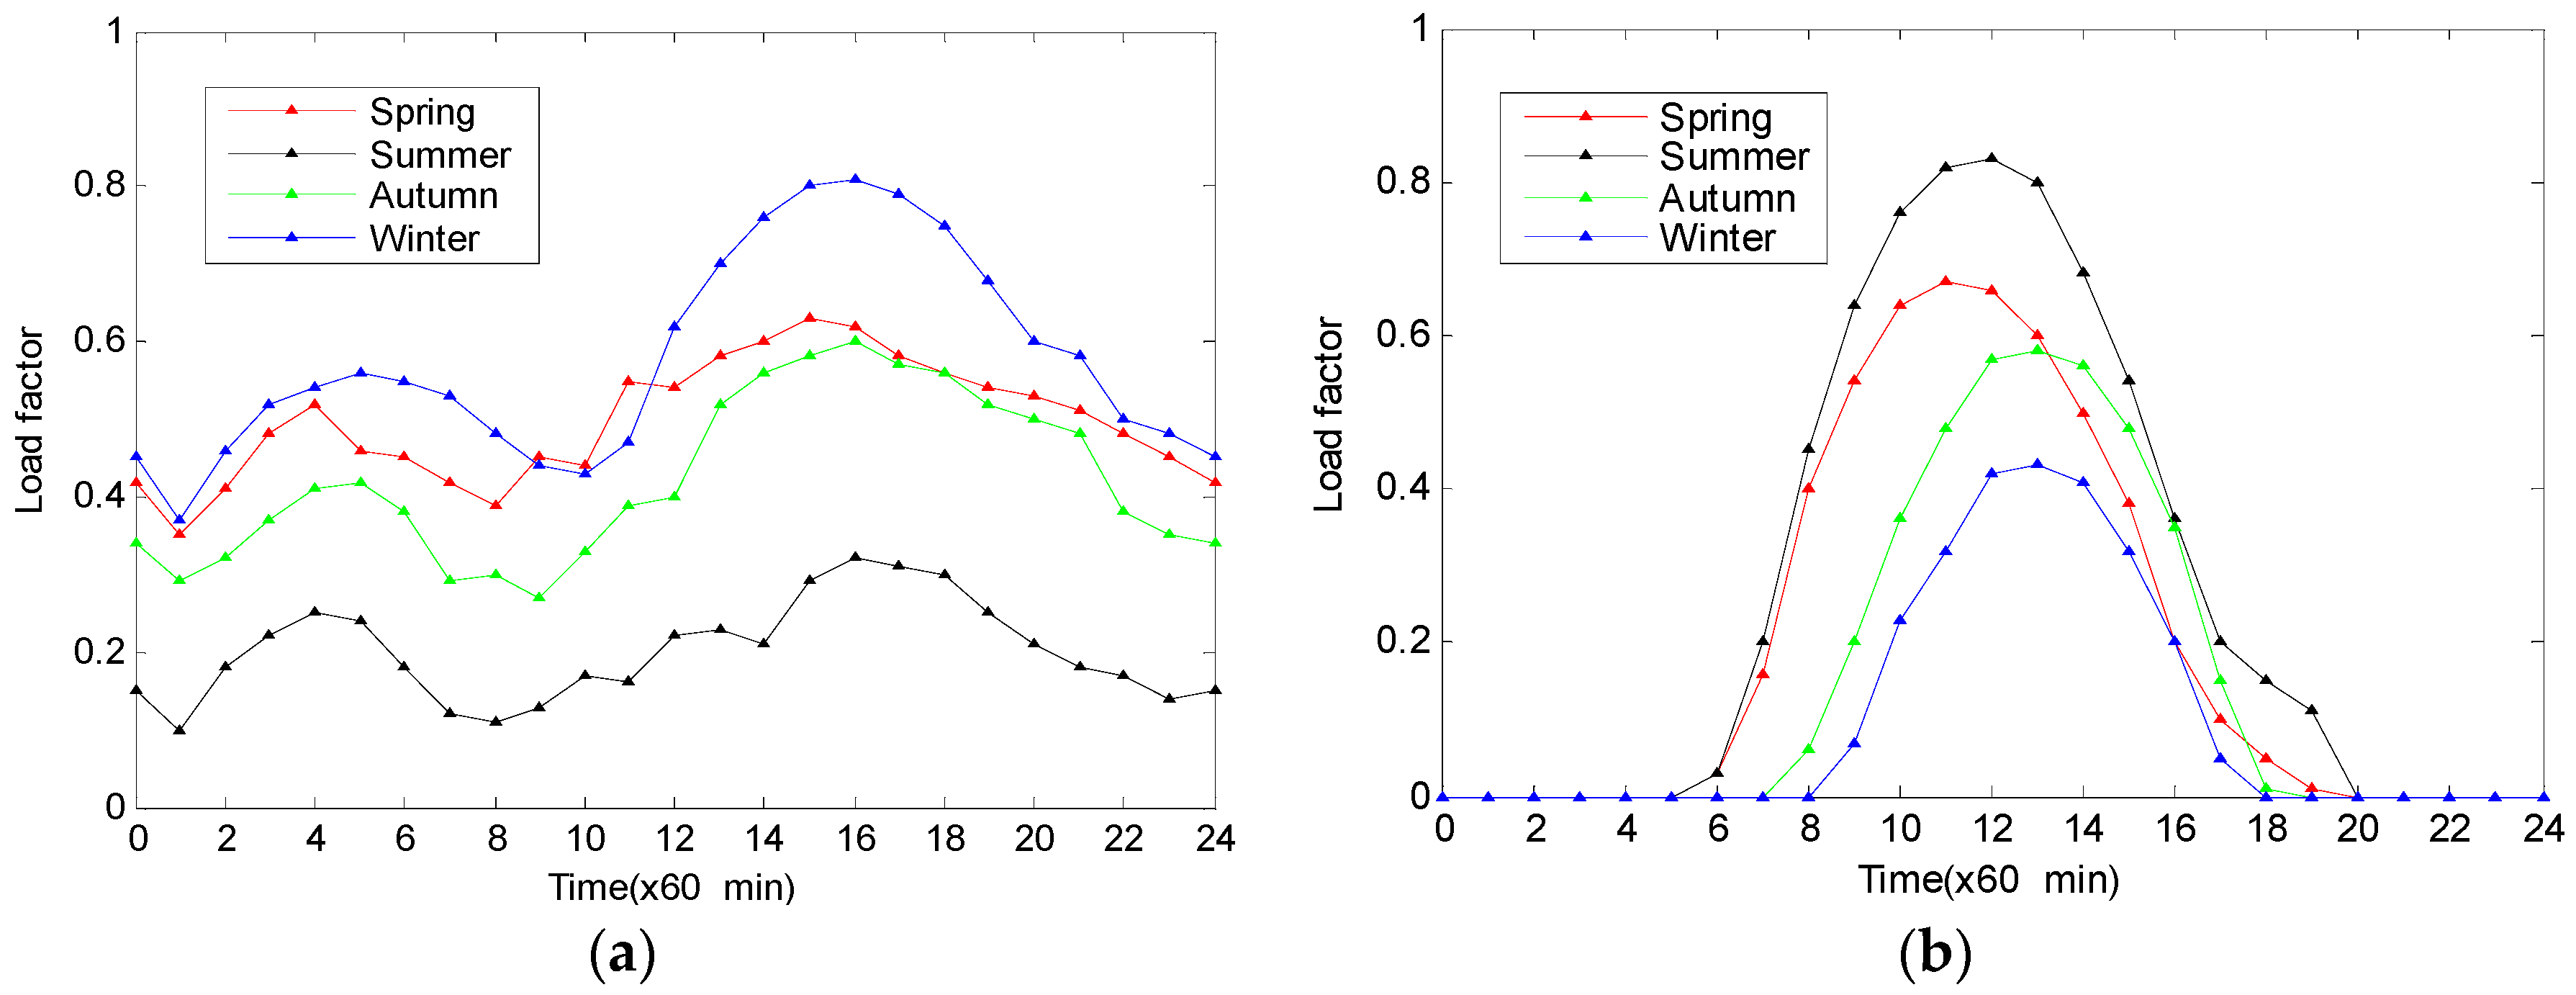
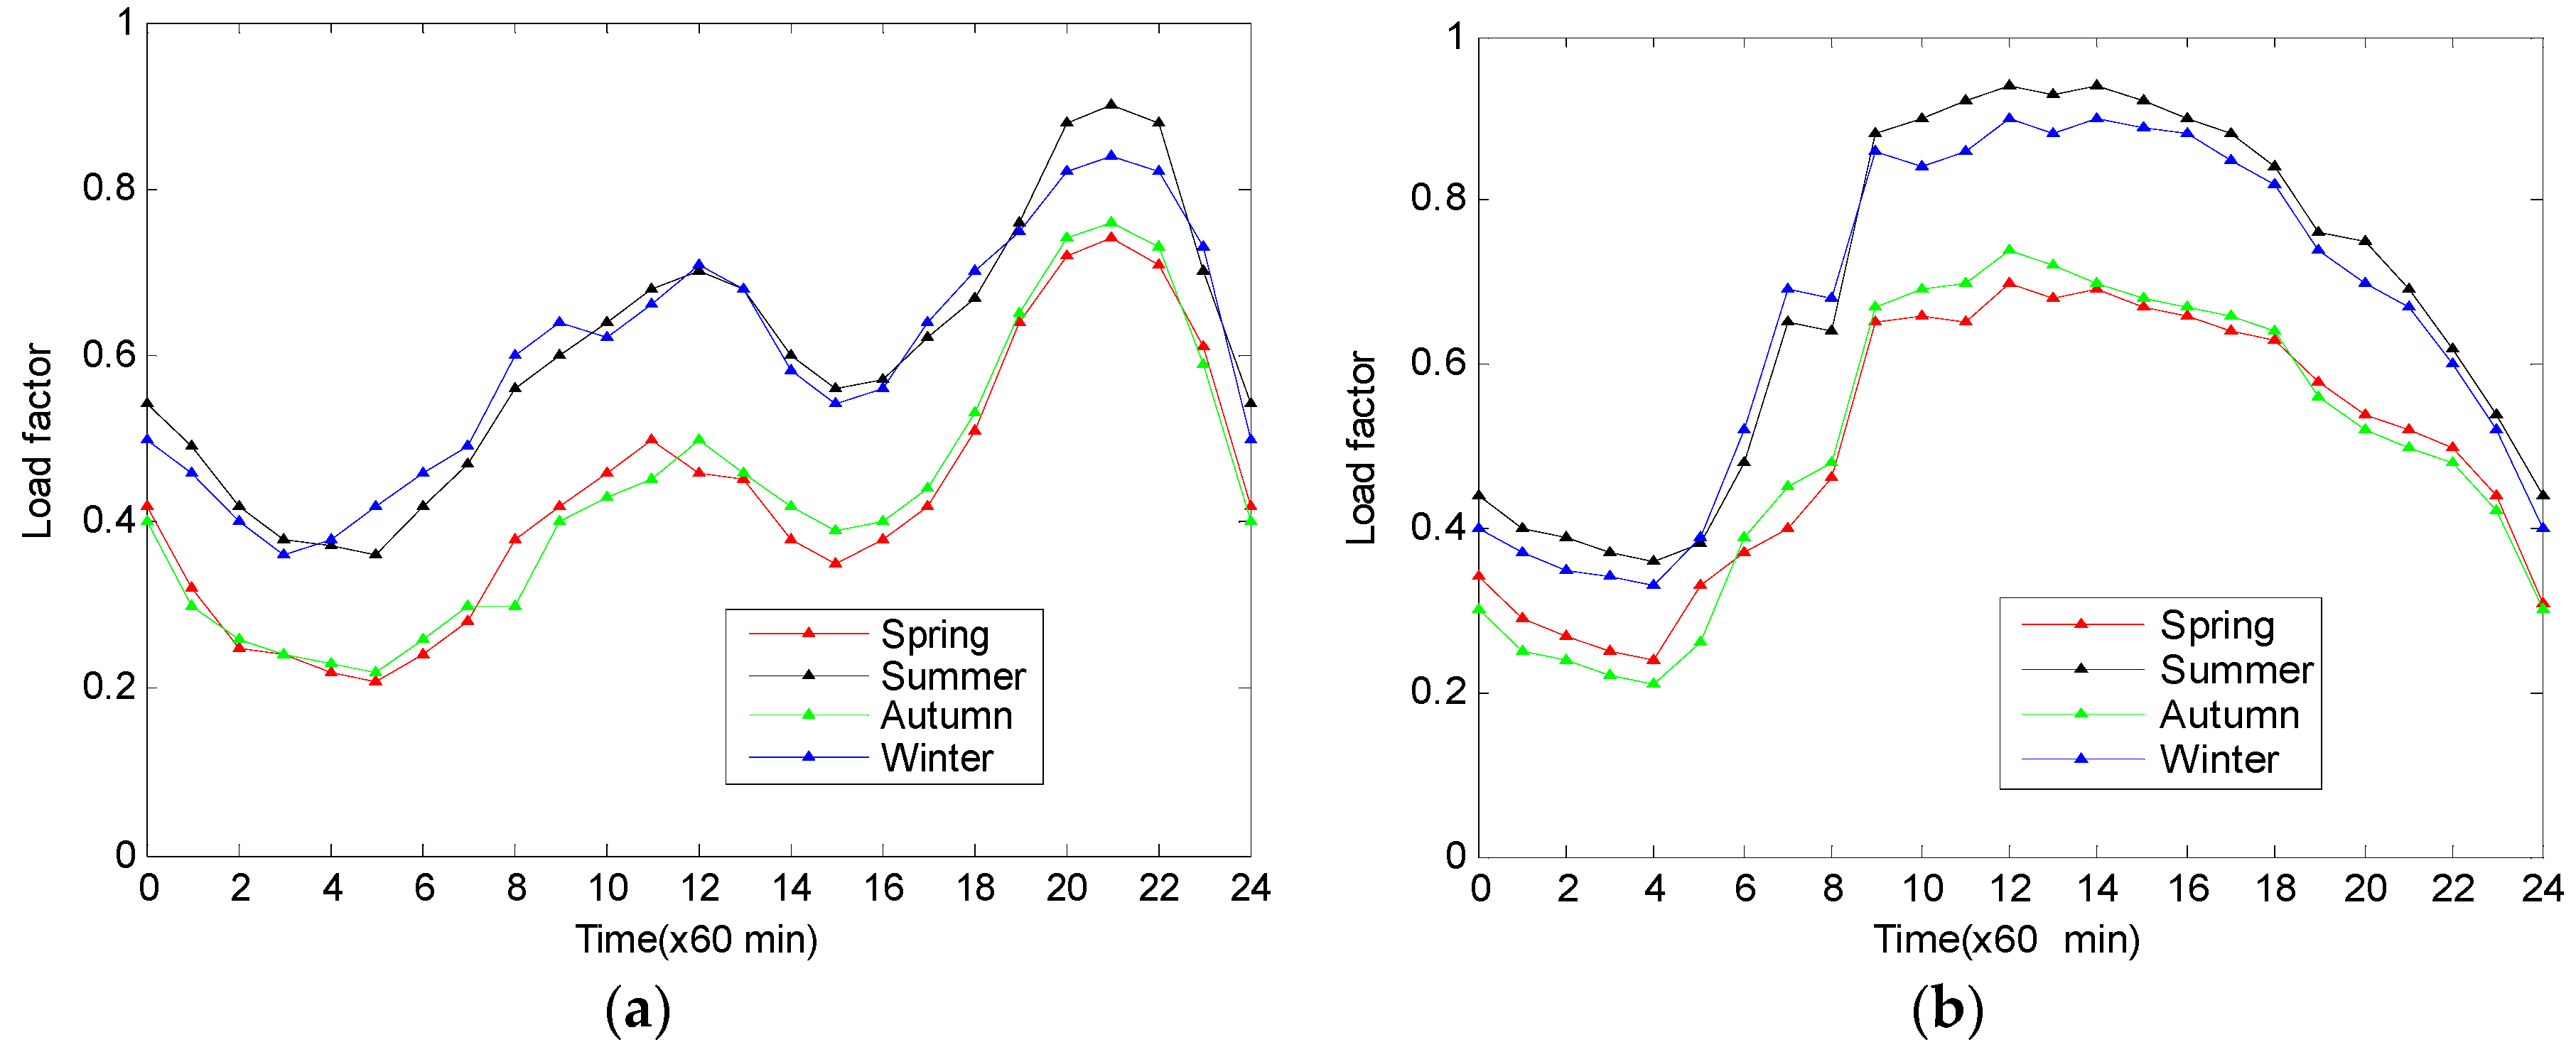
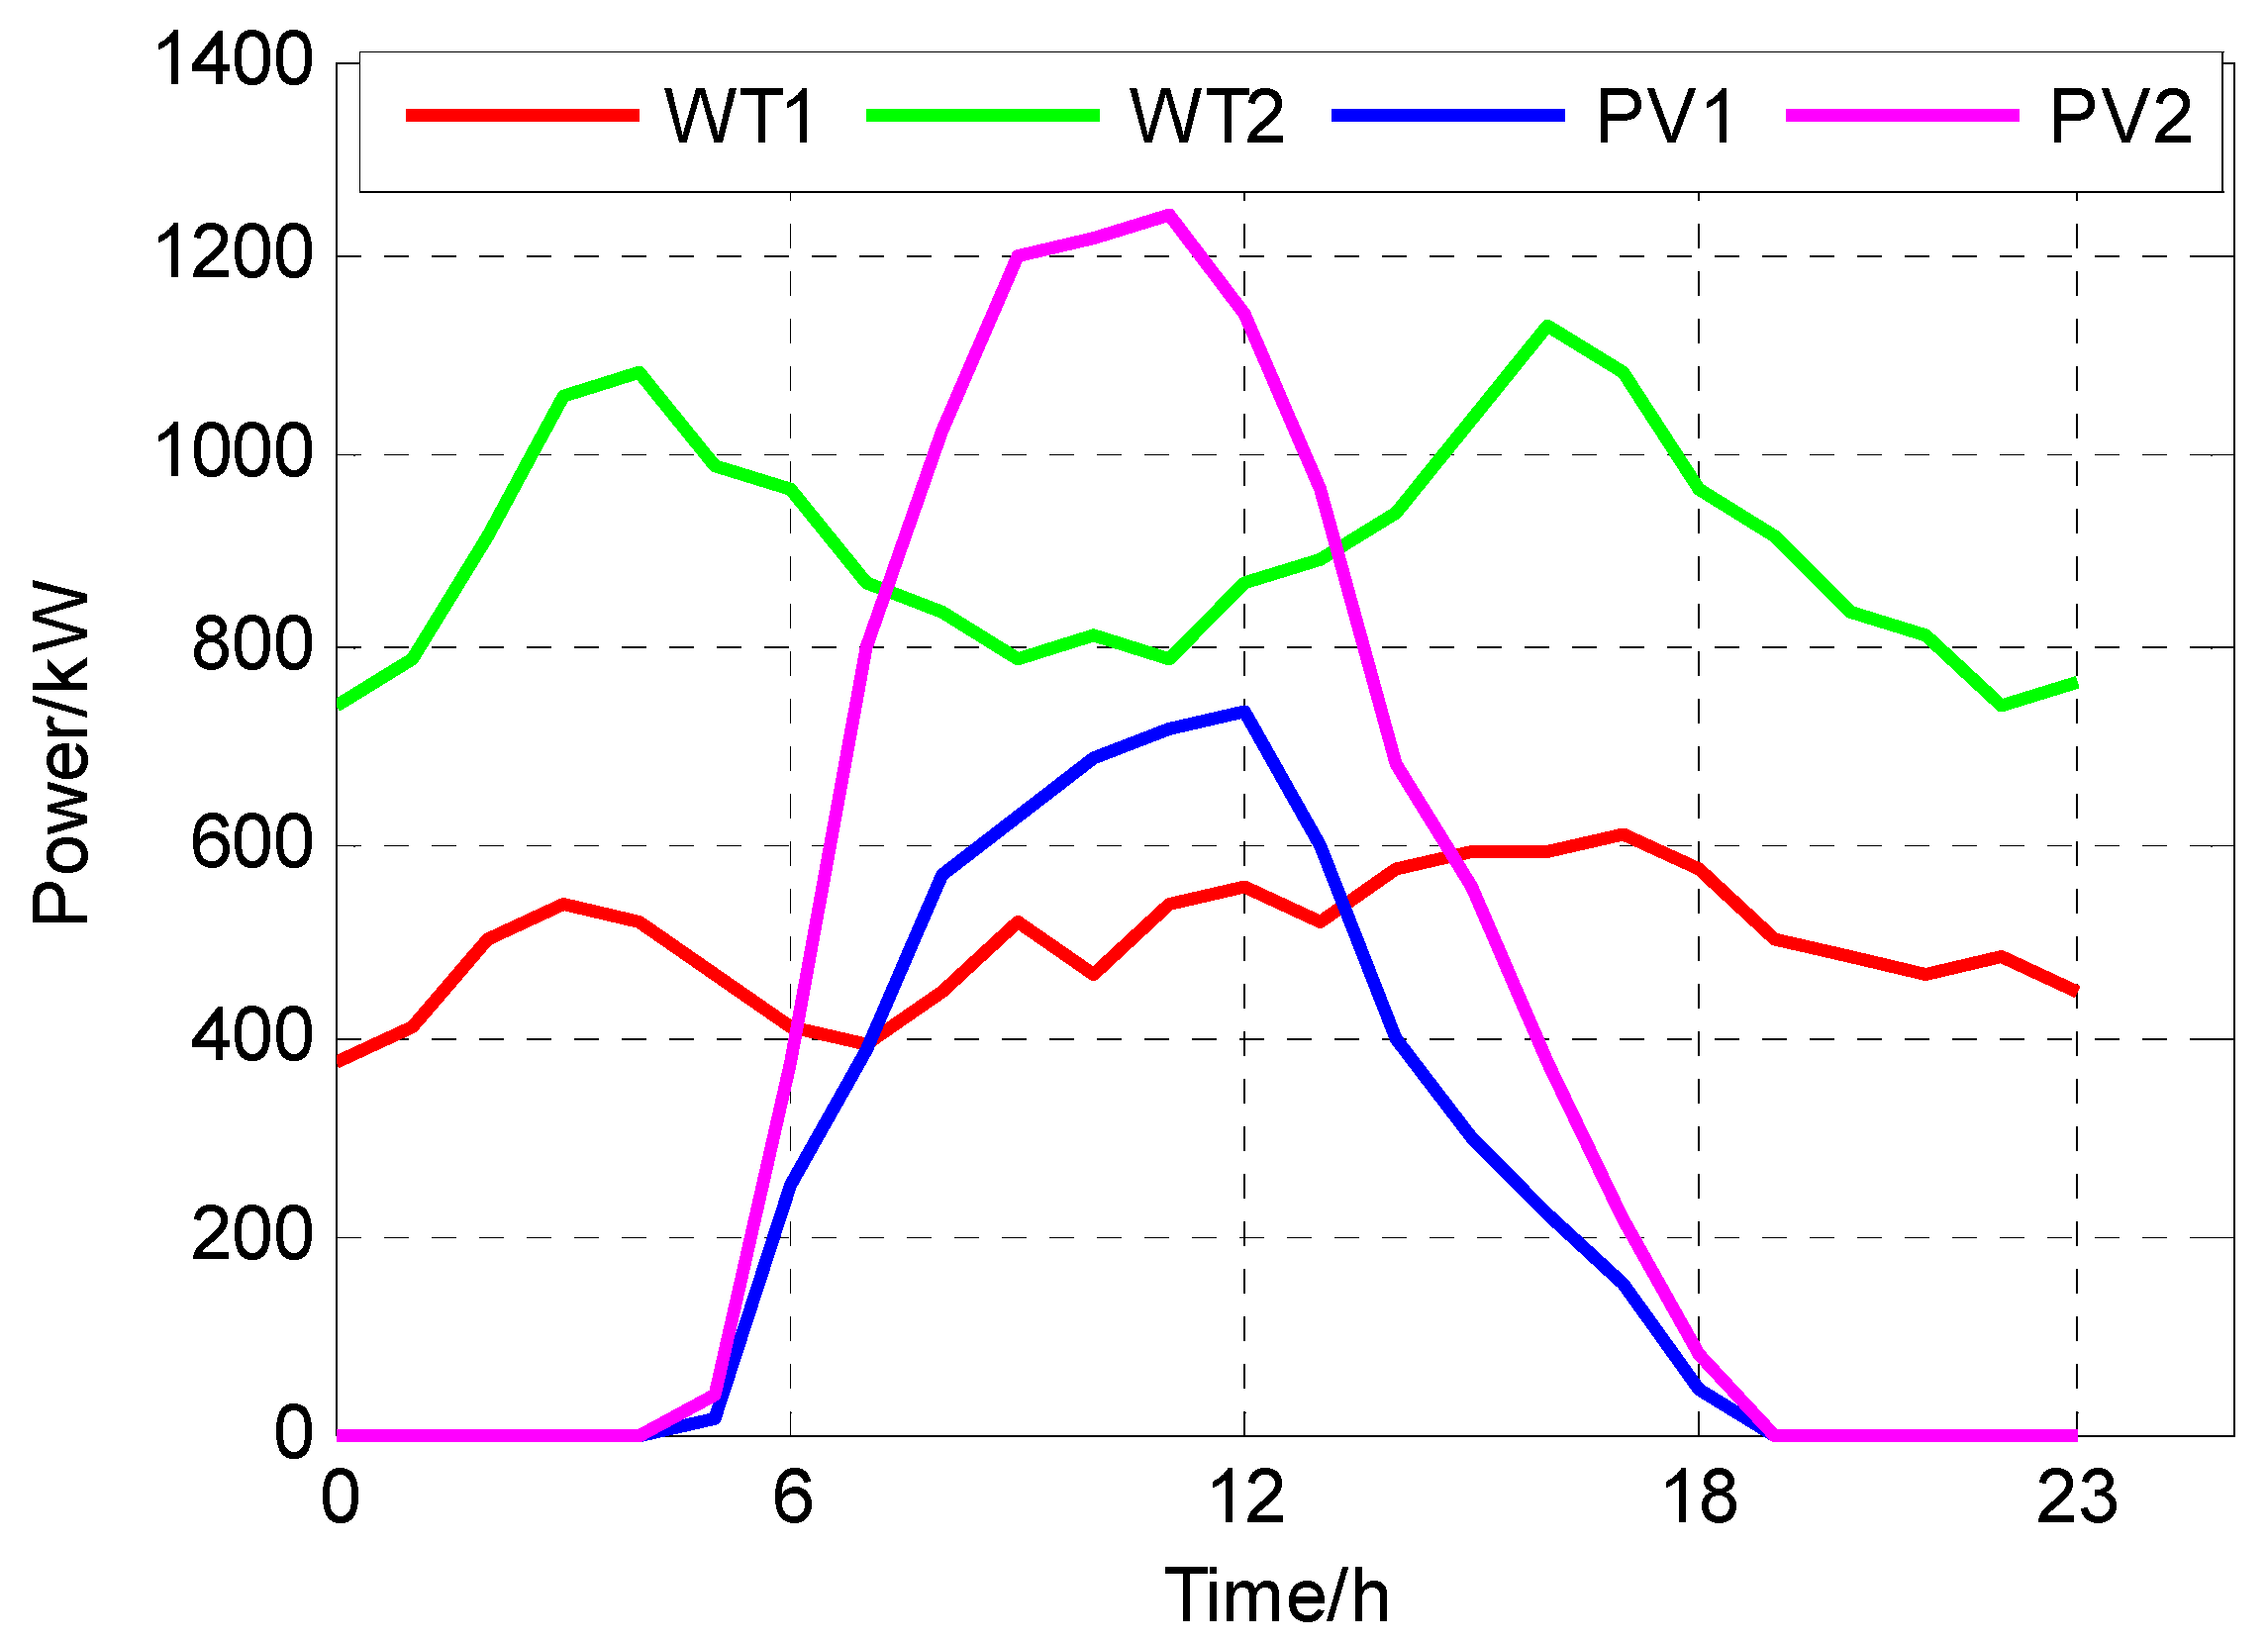
2.1.2. The Timing Characteristics Analysis and Daily Features Quantities Extraction of DG Output and Load Fluctuation
2.1.3. The Response Characteristics and Features Quantities Extraction of the Demand Response Resources
2.1.4. The Constitution of Clustering Analysis Features Quantities
2.2. The Multiple Scenarios Building Based on Quarterly Division and SOM Algorithm
2.2.1. DSR Quarterly Analysis
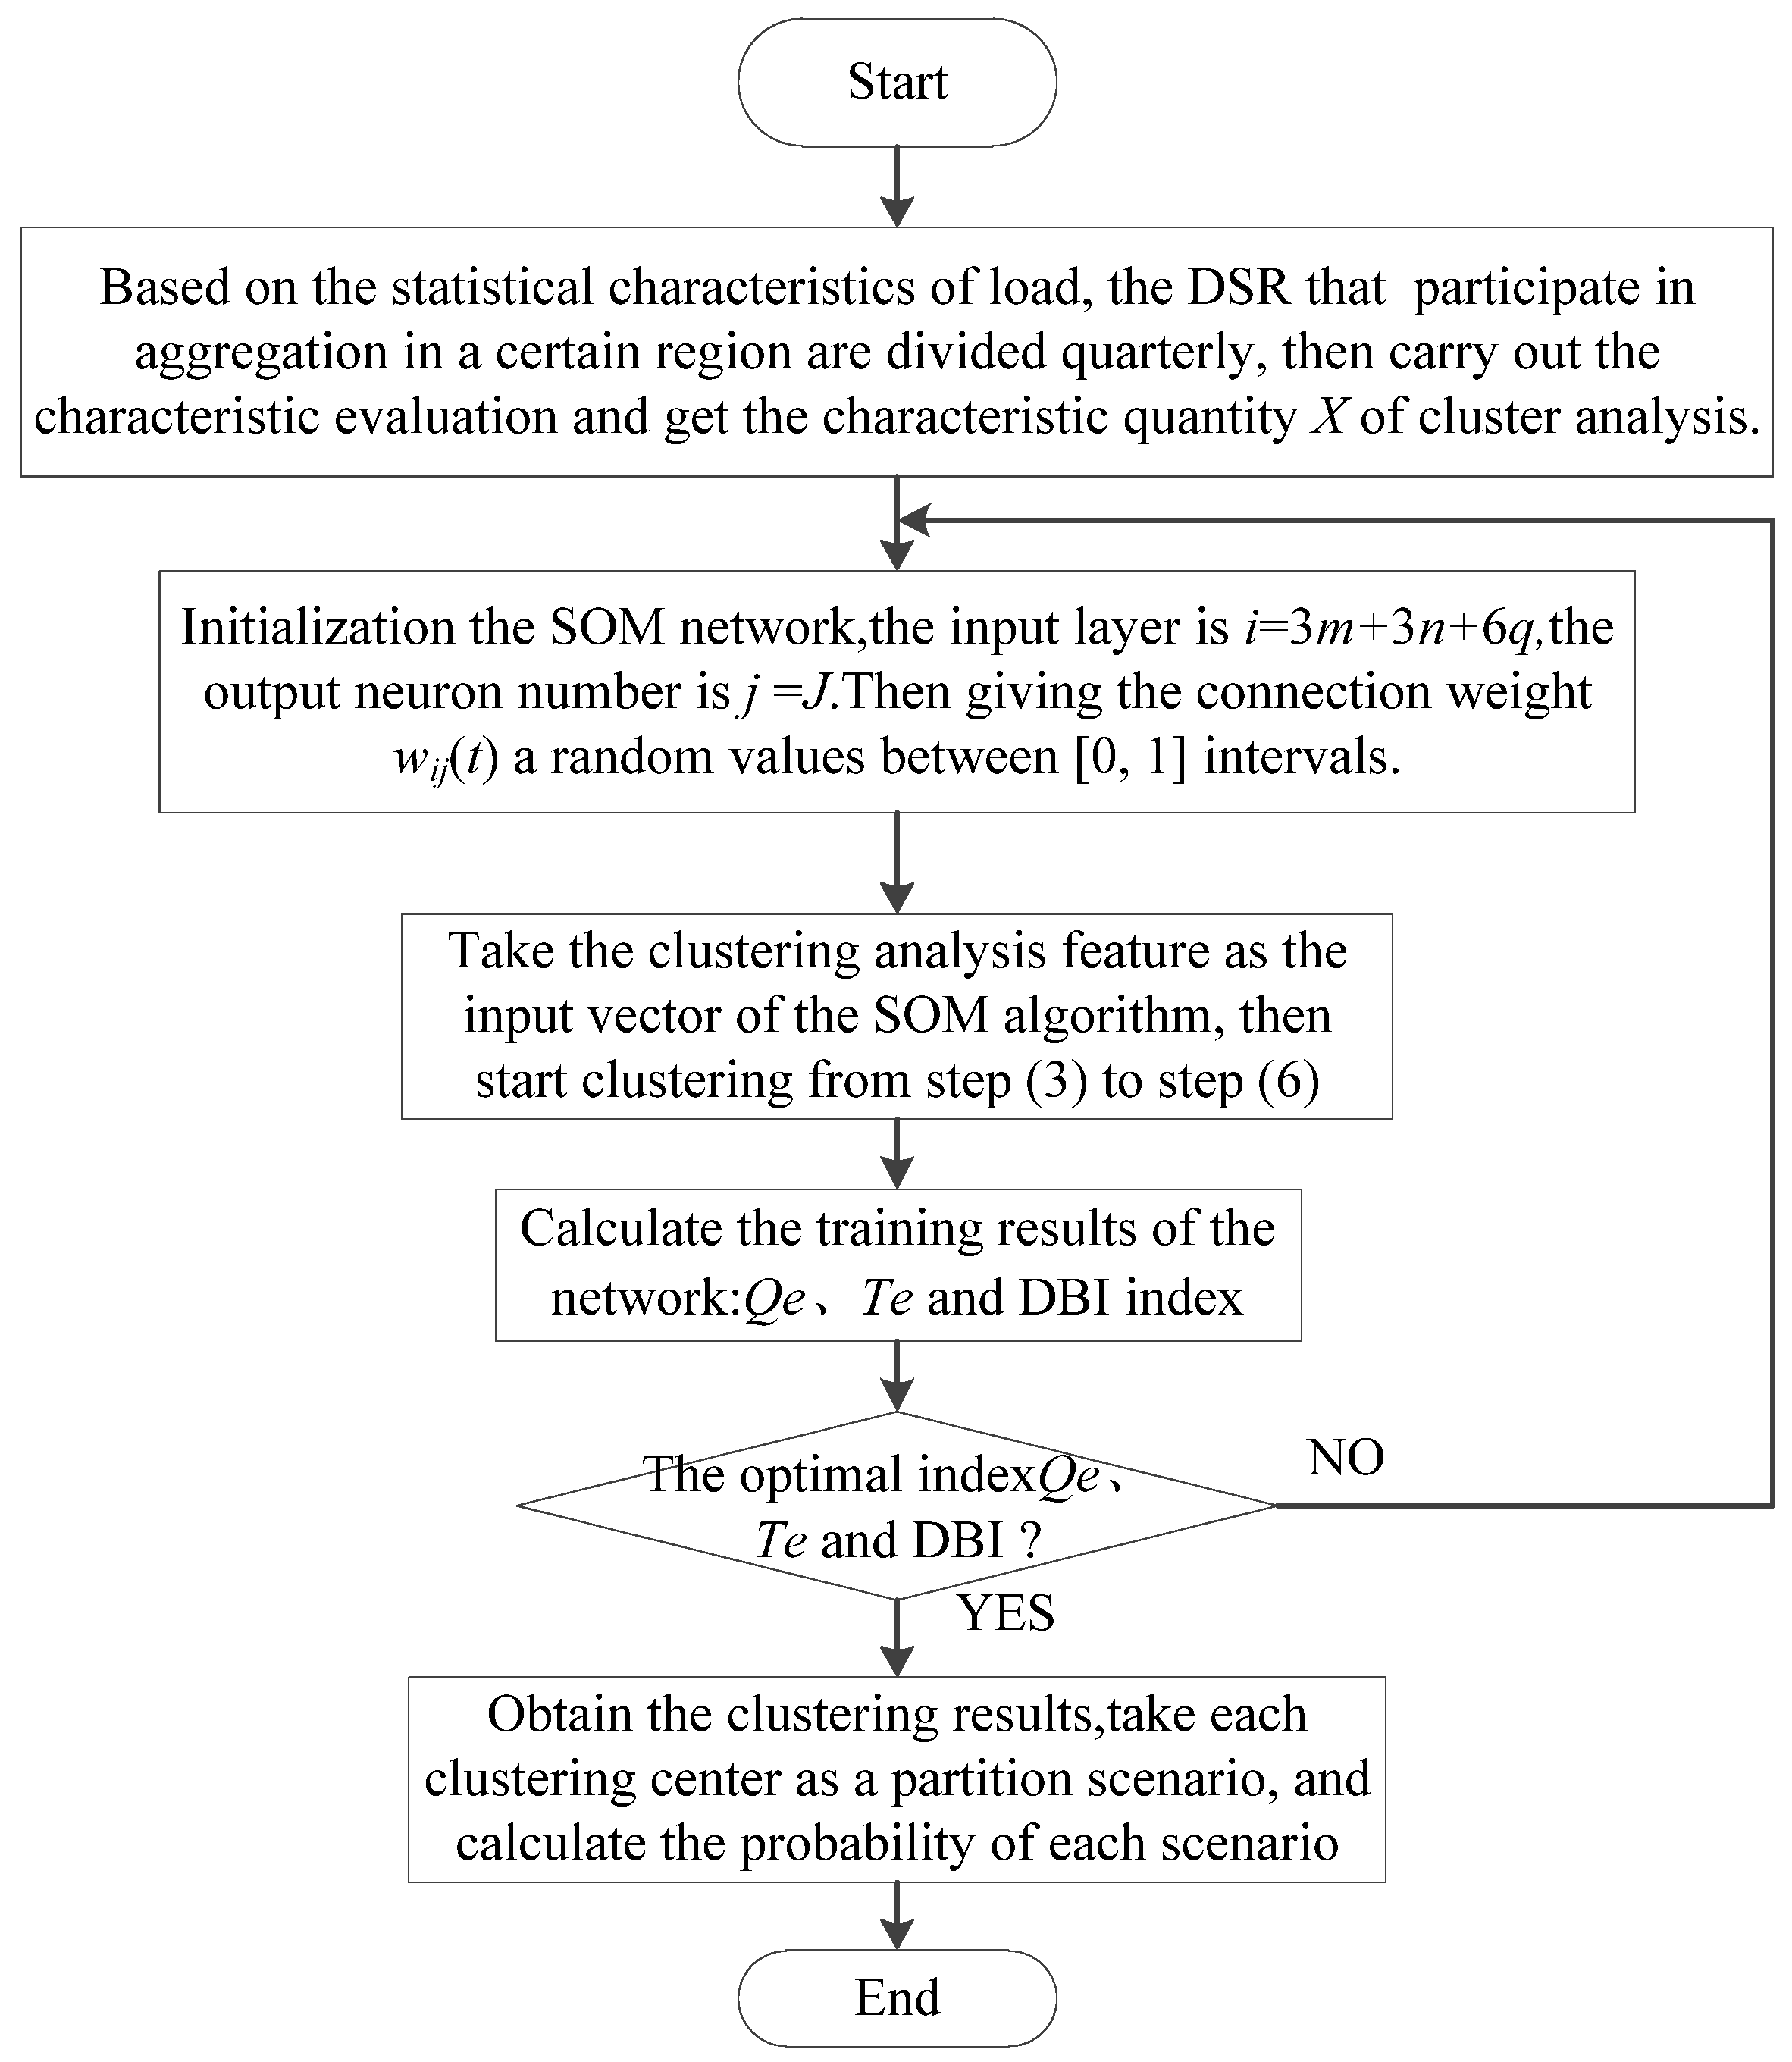
2.2.2. SOM Algorithm
- (1)
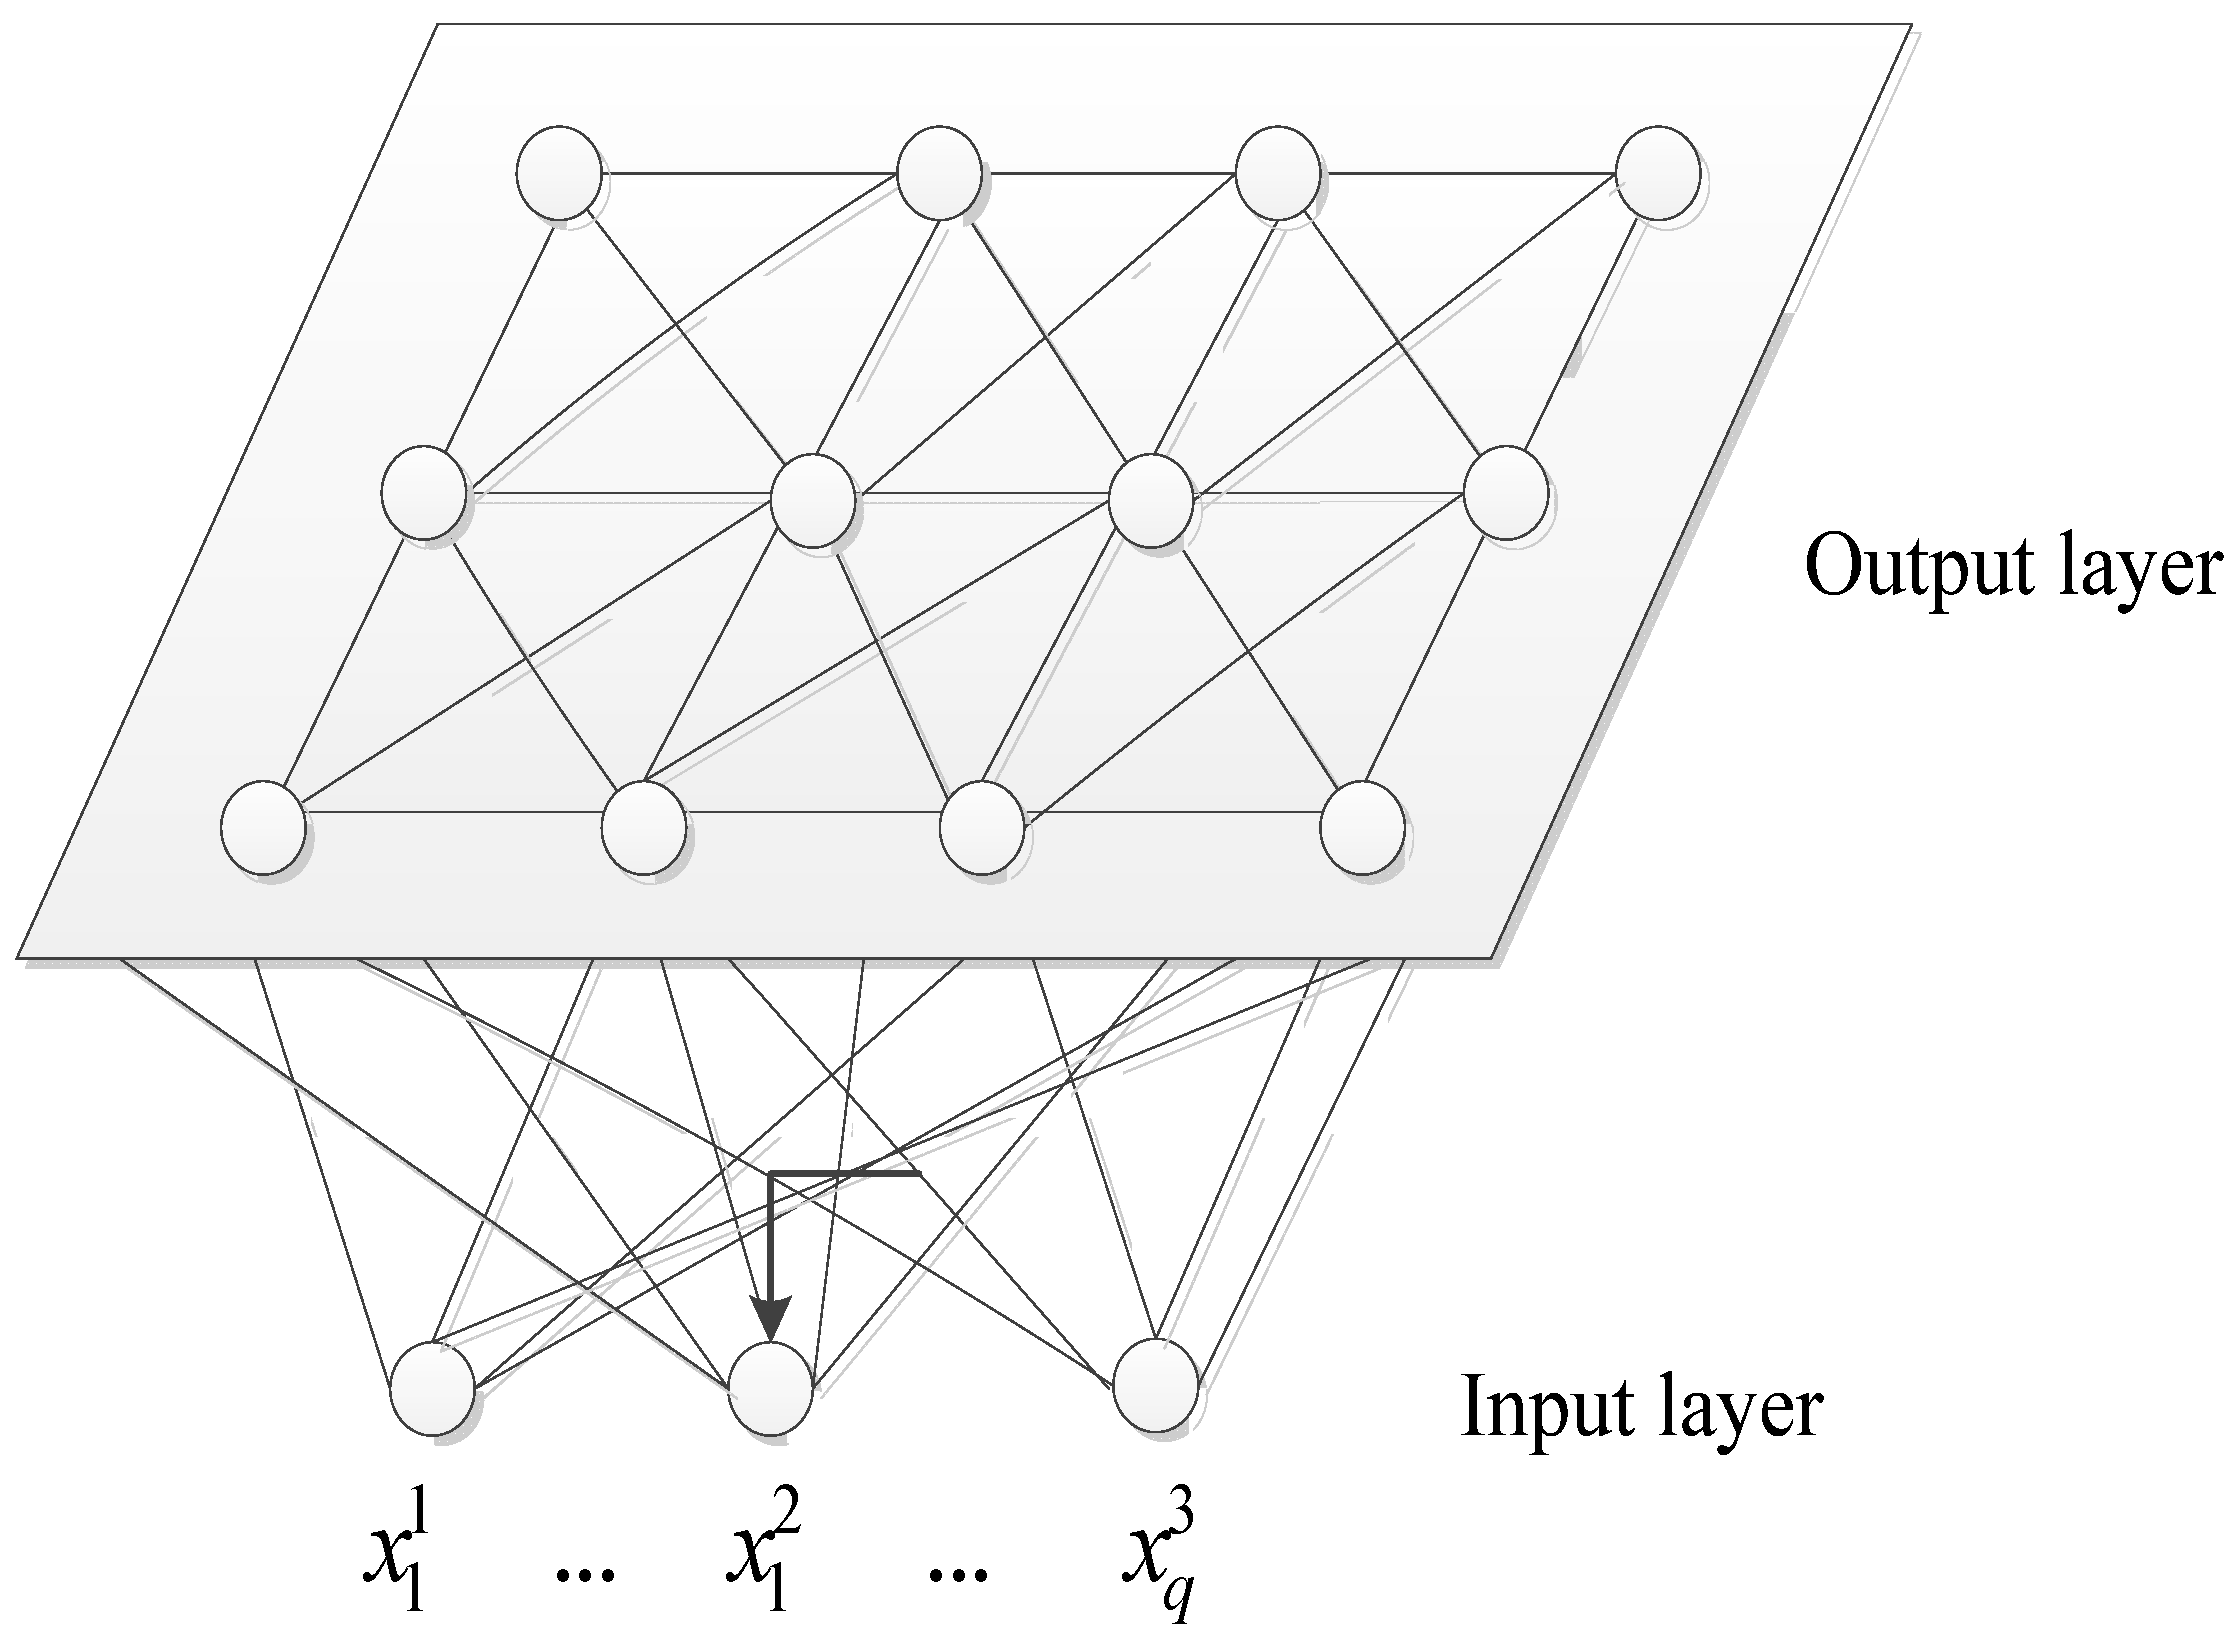
- Confirm the neural network structure. The number of neurons in the input layer is i = 3m + 3n + 6q (the dimension of the vector X), each neuron corresponds to a component of the input vector, and the output neuron number is j = J.
- (2)
- Initialization. The connection weight wij(t) of the input layer neuron to the output layer neuron is given a random values between [0,1] intervals.
- (3)
- The feature vector X, which is composed of various DSR features, is provided to the input layer of the network and deals with it normalized:
- (4)
- Calculate the Euclidean distance. Among them, the neuron j* with minimum Euclidean distance is the winning neuron:
- (5)
- Adjust connection weight vector. Updated the connection weight vector of neurons of j* and its neighborhood Nj*(t):where η(t) is variable learning speed; j* and neighborhood Nj*(t) are decreased along with time.
- (6)
- Select the feature vector of the new day of aggregation DSR, repeat the learning process from step 3, and until complete the daily feature samples training of each quarter.
- (7)
- At the end of training, the same output number of neuron represent the class with similarity feature which can be divided into the same class and record the number of days of each category. Taking each category as a segmentation scenario, the probability of occurrence of the scenario is determined by Equation (9).where K is the number of categories after clustering, and the number of each category is n1, n2, …, ns, …, nK; ps is the probability of the s scenario.
- (8)
- Obtain the clustering centers of each cluster DSR feature quantities and take it as the features quantities of DSR in each scenario.
3. The Multi-Scenario Optimized Aggregation Model of DSR
3.1. Objective Functions
3.2. Constraint Conditions
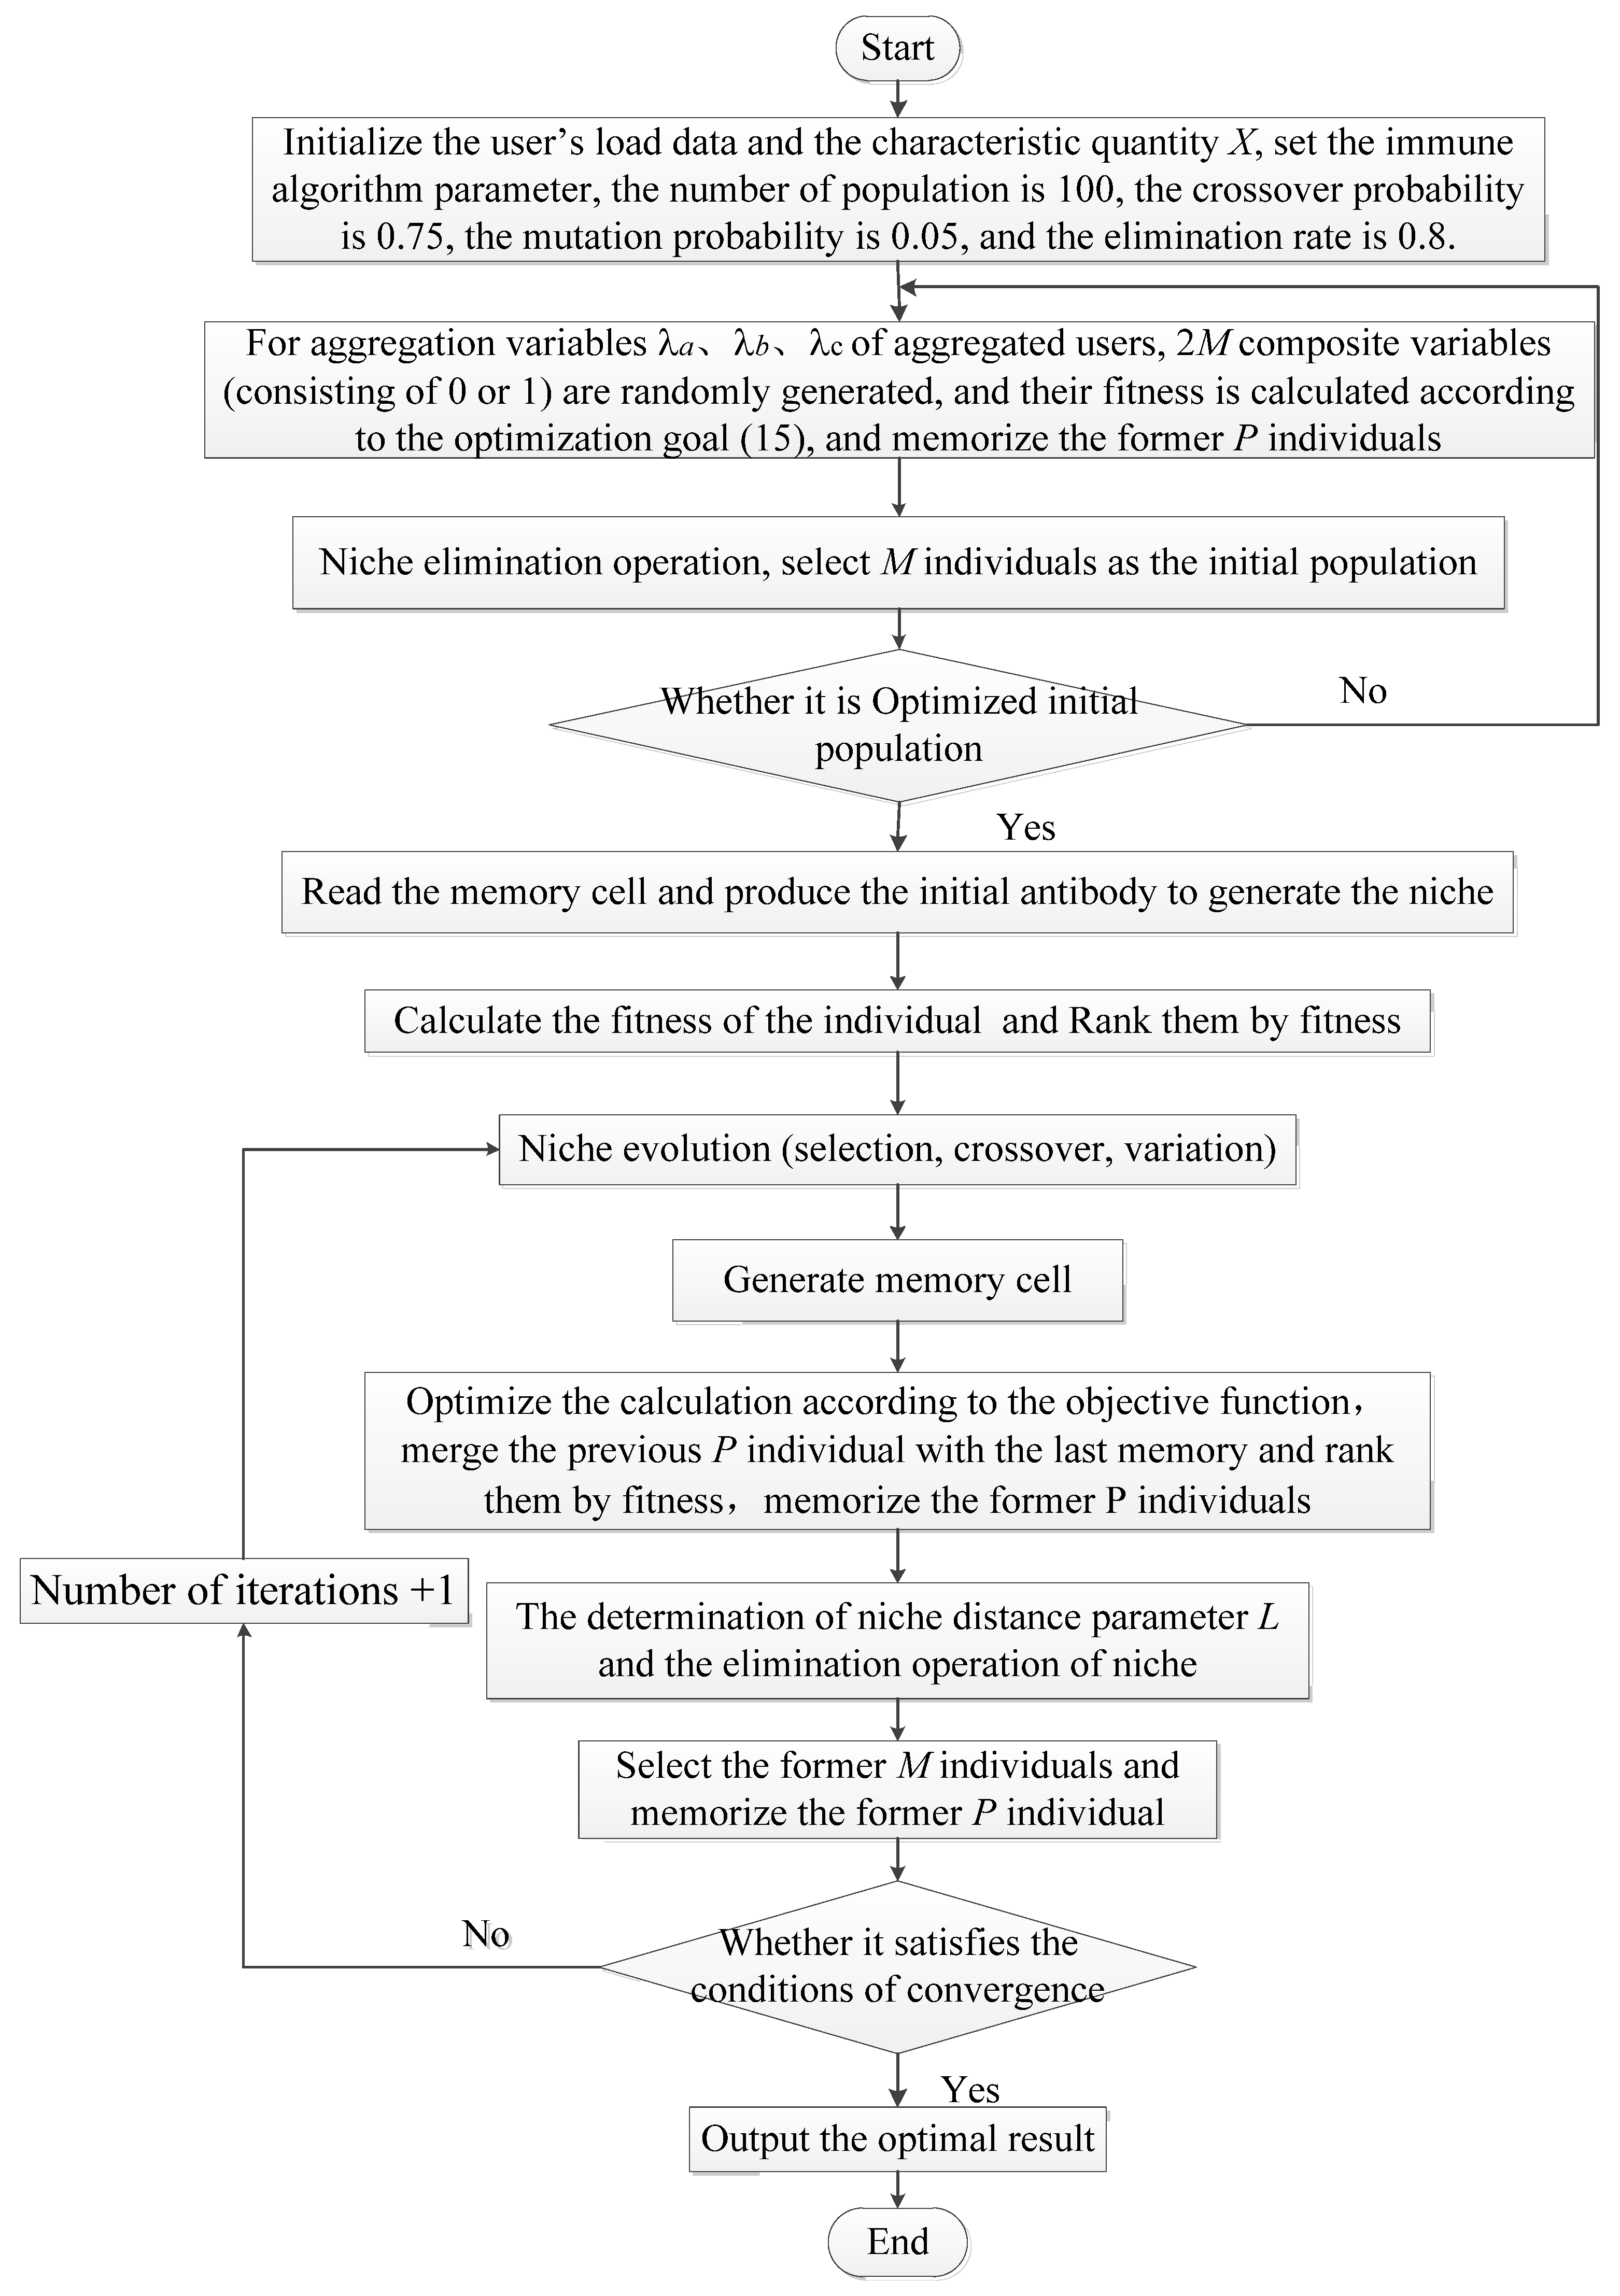
3.3. Model Solution
4. Example Analysis
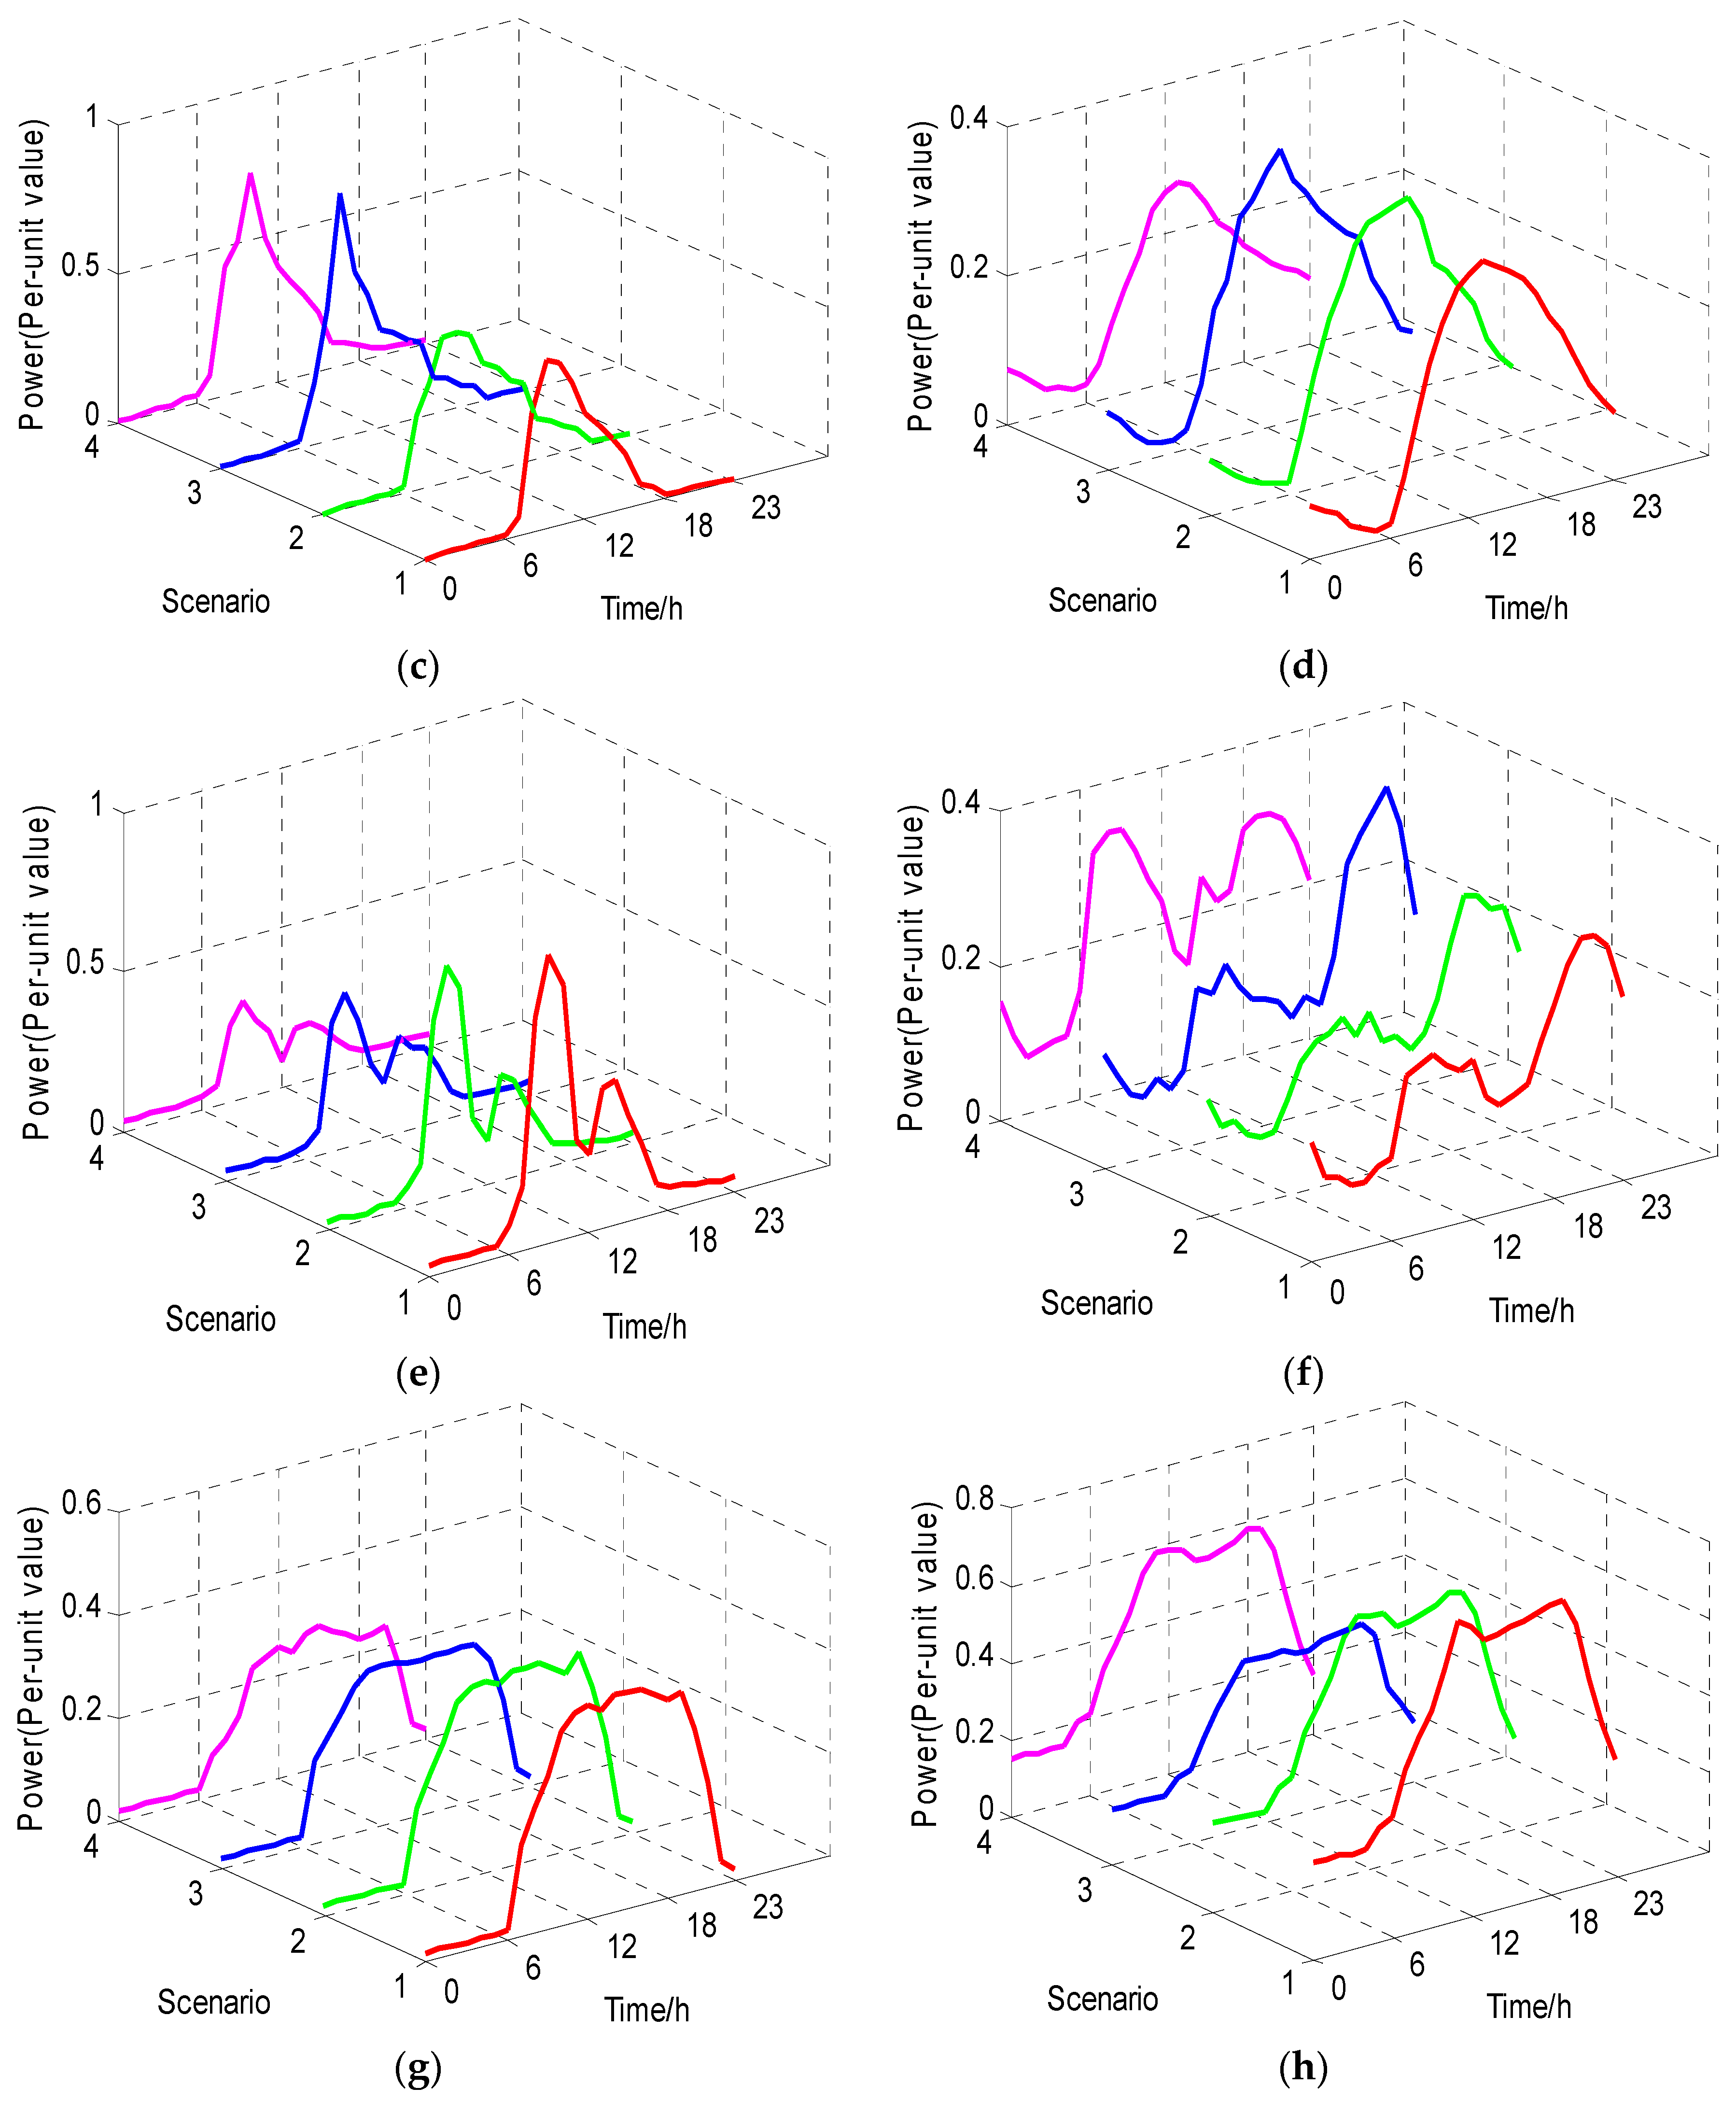
4.1. Multi-Scenario Construction and Analysis
4.2. Multi-Scenario and Multi-Objective Optimized Aggregation of DSR
5. Conclusions
- (1)
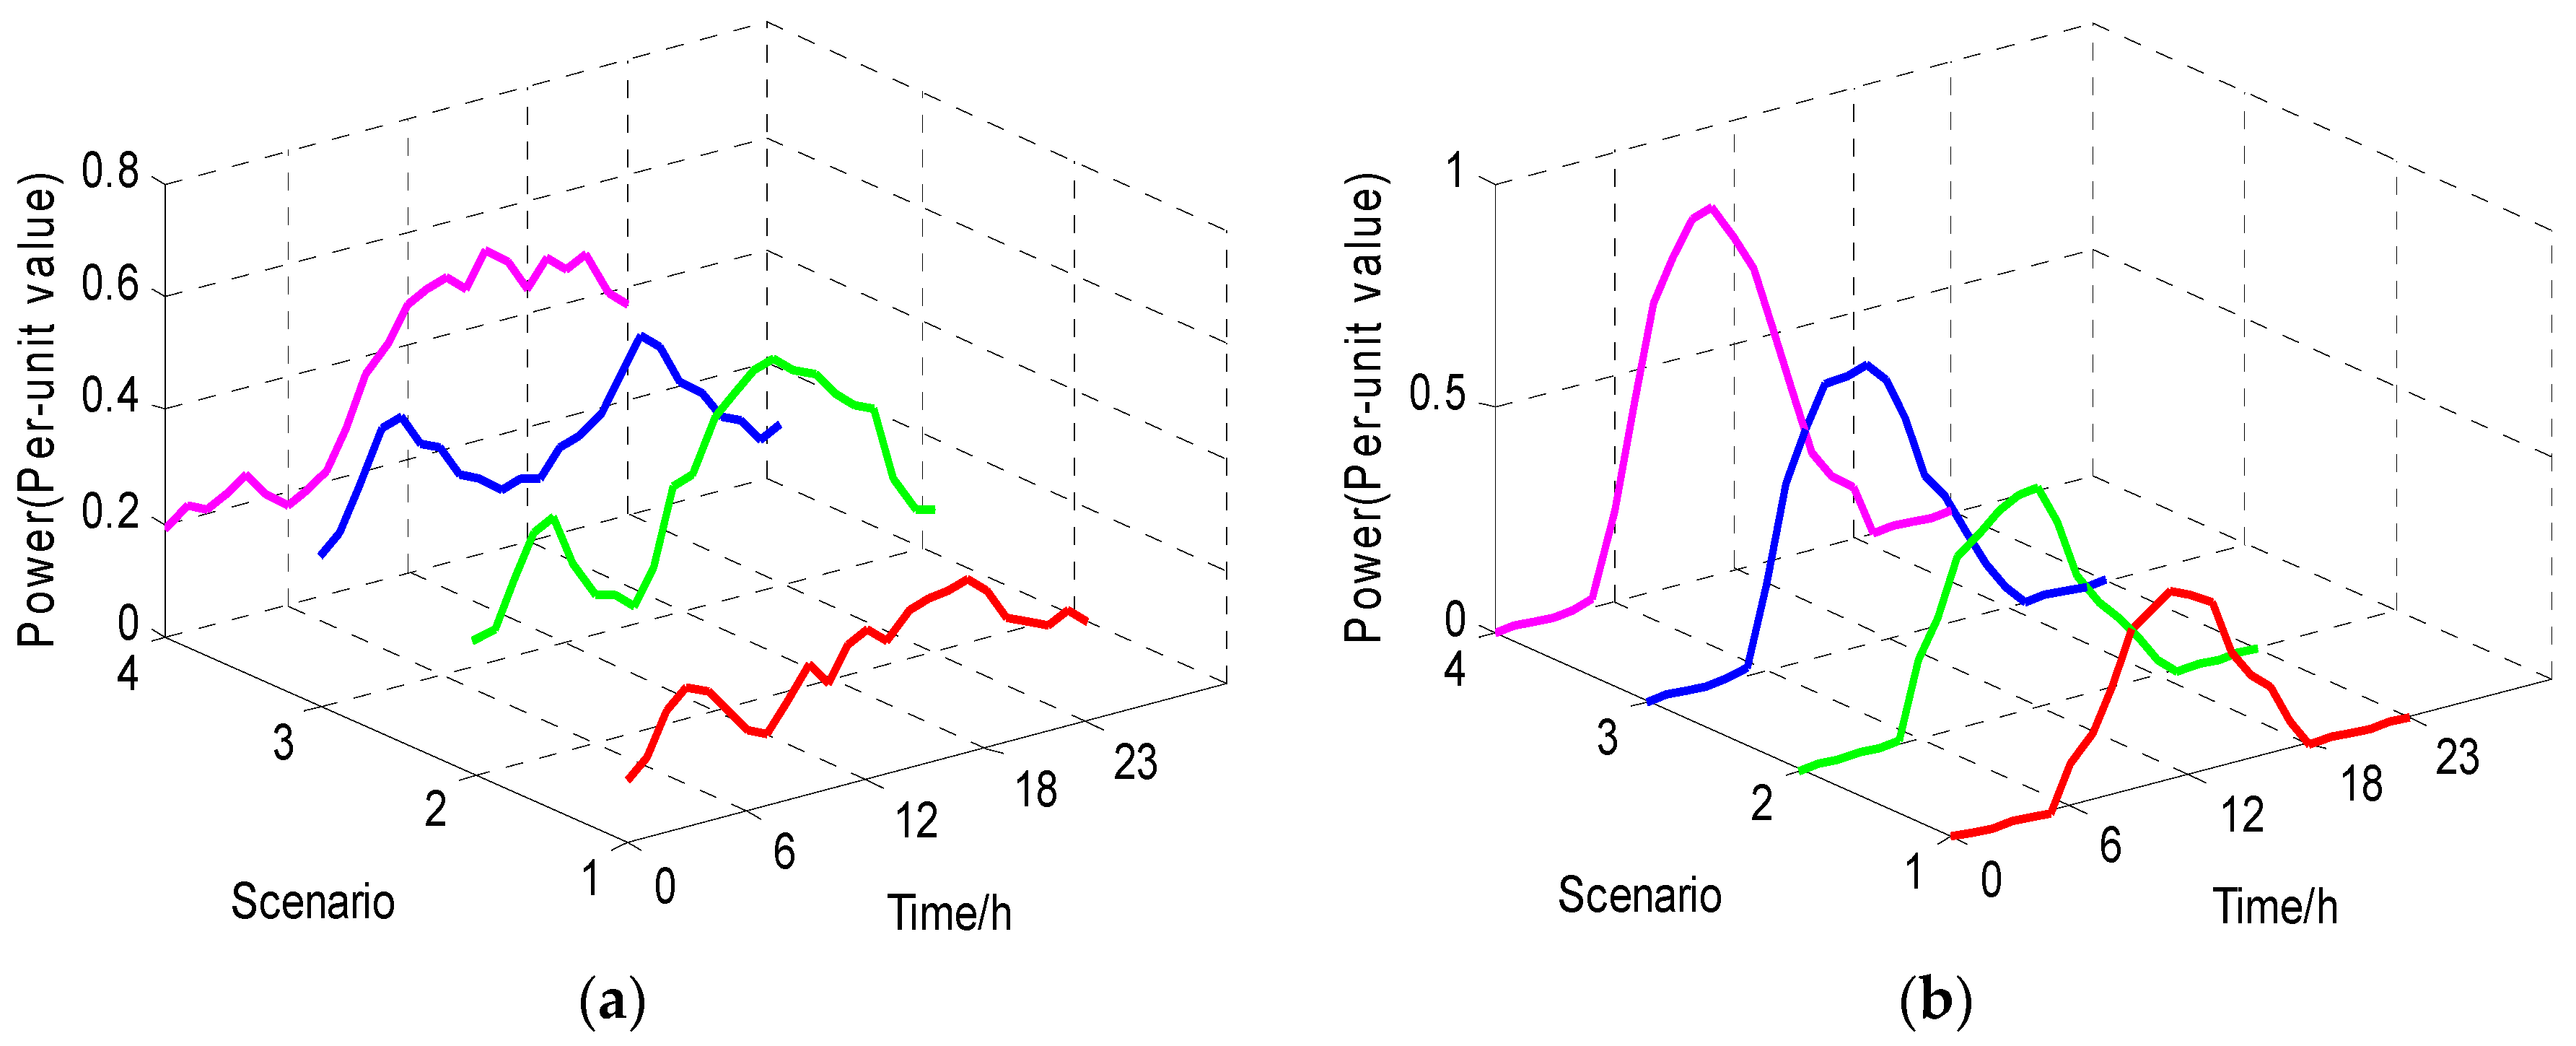
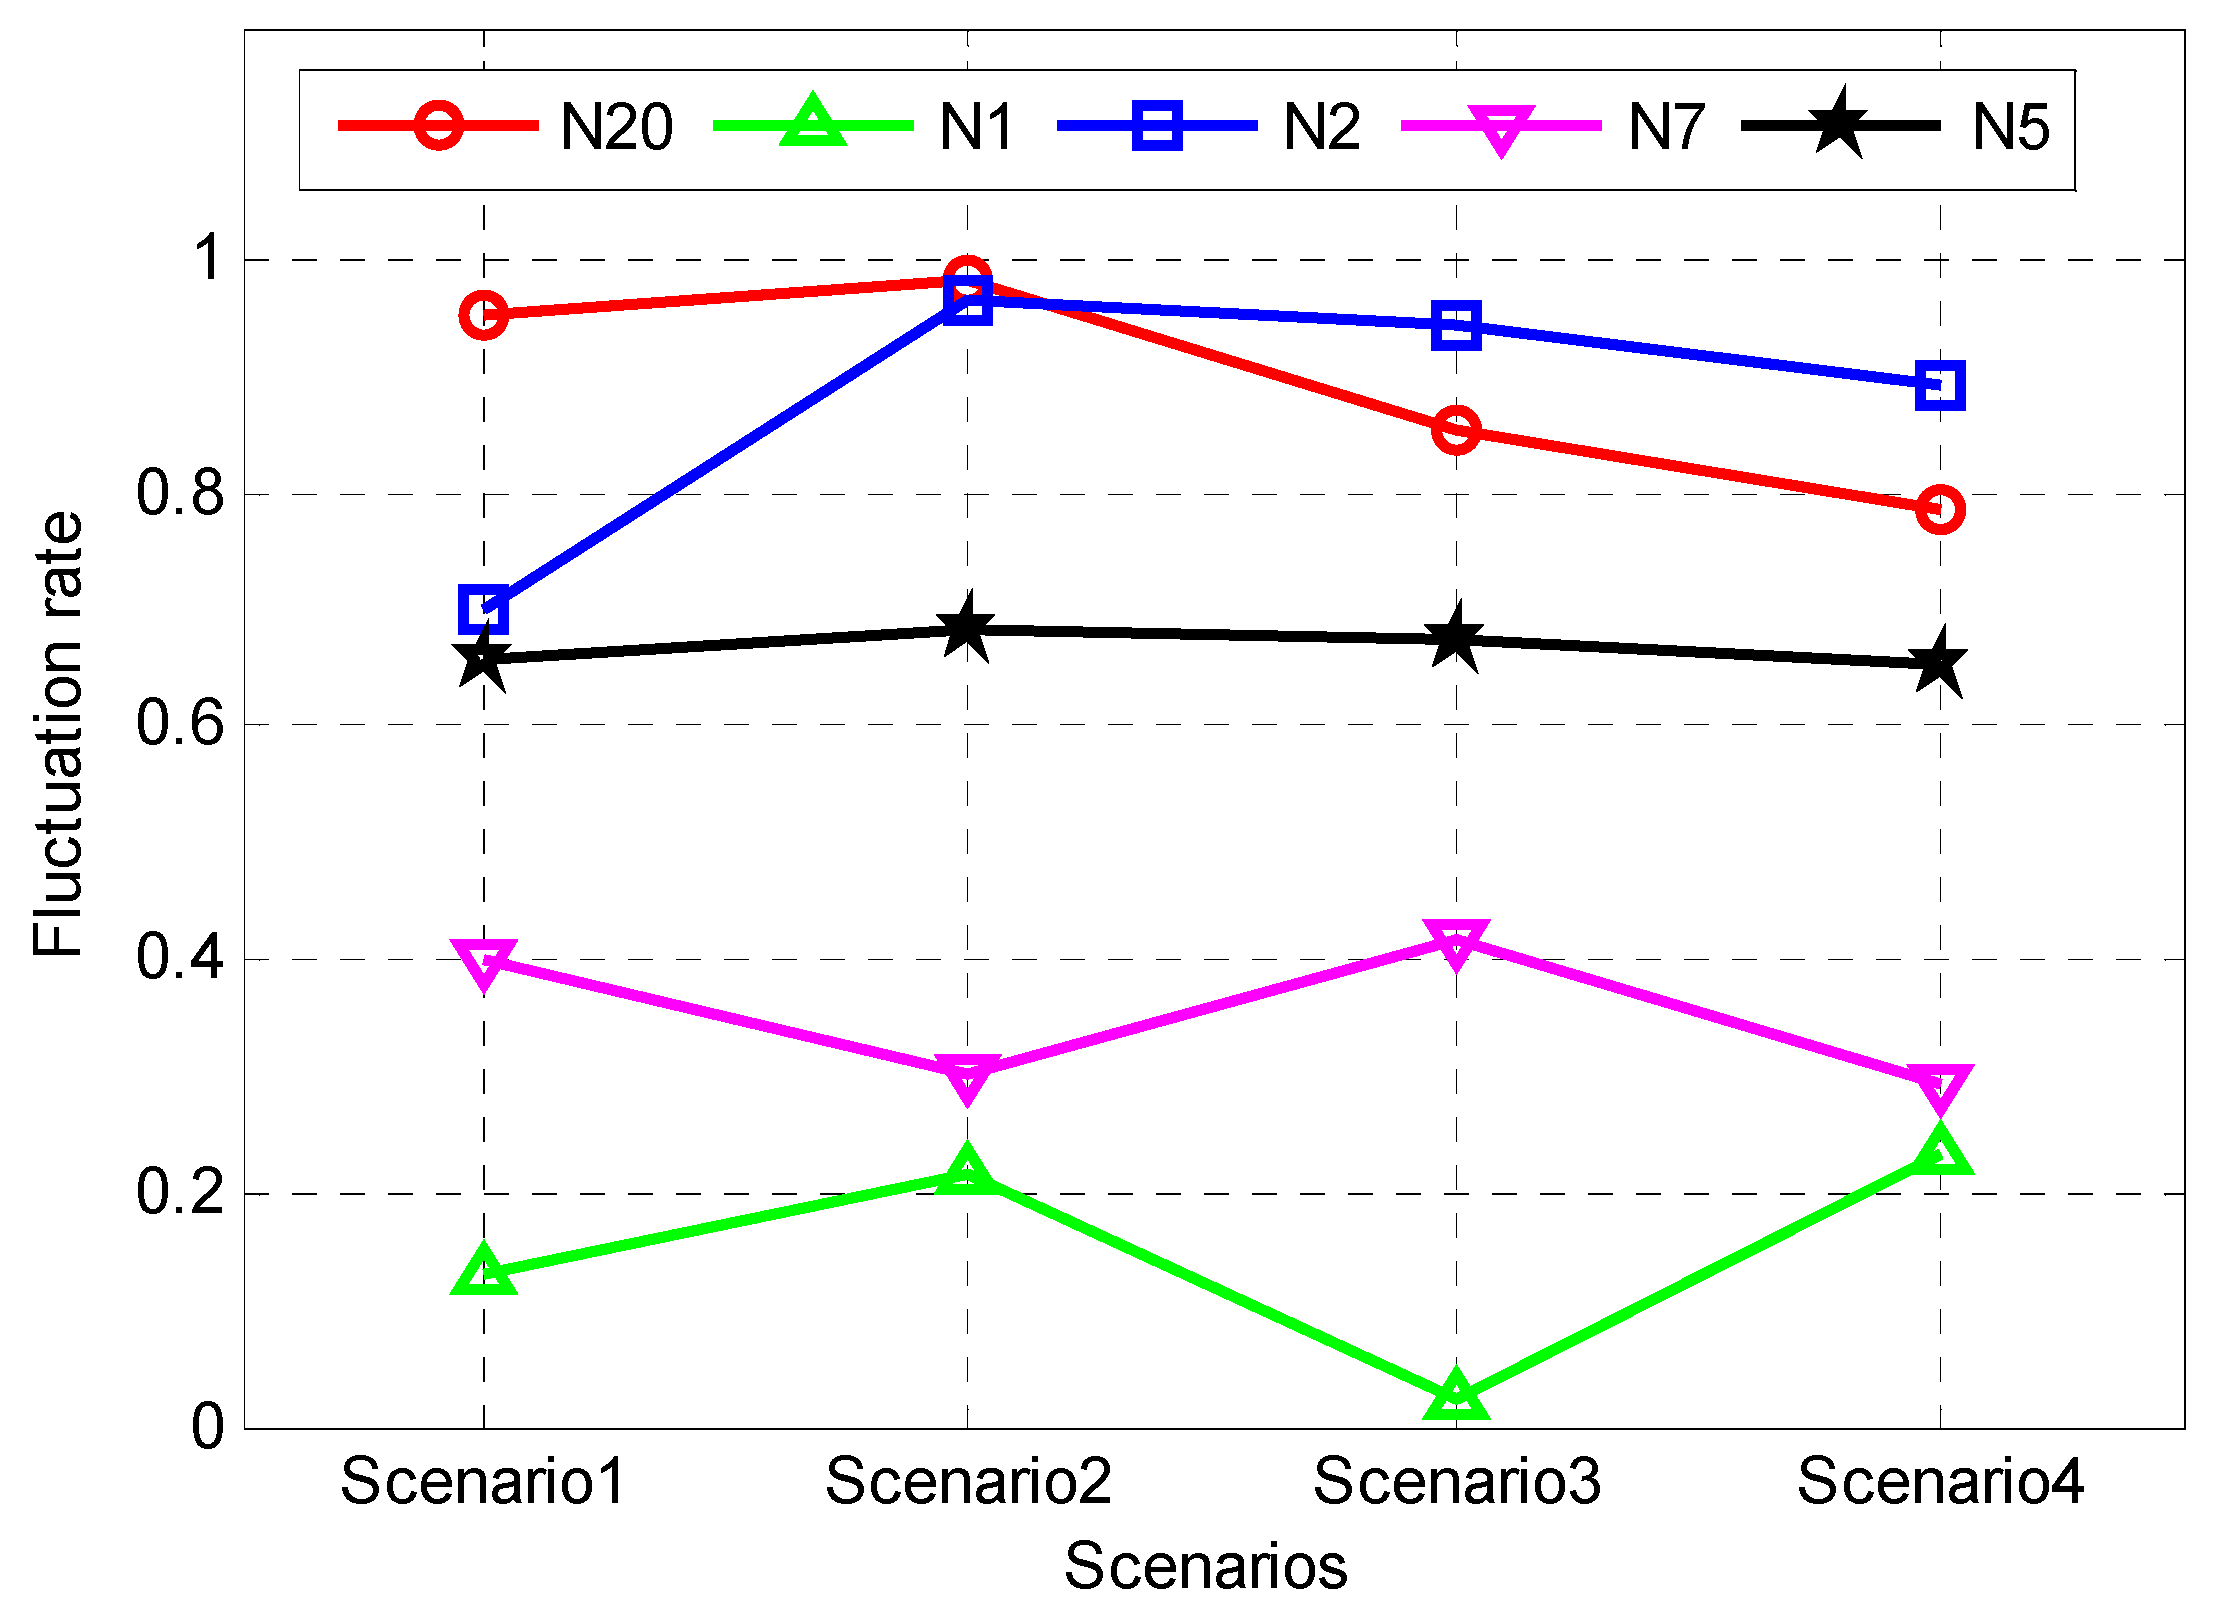
- It is feasible and effective to divide the scenario by cluster analysis. The load characteristics and response characteristics of DSR in multiple scenarios obtained by clustering are obviously different.
- (2)
- In the case of similar electric scale in RA polymerization, the correlation characteristic of the RA considering the scenario division is better than that of the single typical scenario, which verified the necessity of considering the existence of multiple scenarios.
- (3)
- Due to the different characteristics of DSR in different quarters, the users who participated in the aggregation in different quarters are different in the case of little change in aggregate capacity and related characteristics, which verified the reasonableness of building the RA in the quarter.
Acknowledgments
Author Contributions
Conflicts of Interest
Abbreviations
| DSR | Demand side resources |
| SOM | Self-organizing map |
| RA | Resource aggregation |
| DG | Distributed generation |
| AND | Active distributed networks |
| DER | Distributed energy resources |
| DN | Distributed networks |
| MG | Microgrid |
| EV | Electric vehicle |
| VPP | Virtual power plant |
| LA | Load aggregator |
| TL | Transferable load |
| IL | Interruptible load |
References
- Fan, M.; Zhang, Z.; Su, A.; Su, J. Enabling technologies for active distribution systems. Proc. CSEE 2013, 33, 12–18. [Google Scholar]
- Yue, J.; Hu, Z.; Li, C.; Vasquez, J.C.; Guerrero, J.M. Economic Power Schedule and Transactive Energy through an Intelligent Centralized Energy Management System for a DC Residential Distribution System. Energies 2017, 10, 916. [Google Scholar] [CrossRef]
- Cong, P.; Tang, W.; Zhang, L.; Zhang, B.; Cai, Y. Day-Ahead Active Power Scheduling in Active Distribution Network Considering Renewable Energy Generation Forecast Errors. Energies 2017, 10, 1291. [Google Scholar] [CrossRef]
- Shen, Y.; Yue, Y.; Yan, H.; Chen, X.; Li, D.; Yi, Y.; Guo, B. Research on Aggregation and Optimization Strategies of Demand Response Resources for Regional Power Grid. Power Syst. Technol. 2017, 41, 3341–3348. [Google Scholar]
- Sun, L.; Gao, C.; Tan, J.; Cui, G. Load aggregation technology and its application. Autom. Electr. Power Syst. 2017, 41, 159–167. [Google Scholar]
- Xu, Y.; Ai, Q. Optimal operation of multi-microgrid aggregation based on landscape theory. Power Syst. Prot. Control 2015, 43, 50–56. [Google Scholar]
- Xia, M.; Lai, Q.; Zhong, Y.; Li, C.; Chiang, H.D. Aggregator-Based Interactive Charging Management System for Electric Vehicle Charging. Energies 2016, 9, 159. [Google Scholar] [CrossRef]
- Papadaskalopoulos, D.; Strbac, G. Decentralized participation of flexible demand in electricity markets-part I: Market mechanism. IEEE Trans. Power Syst. 2013, 28, 3658–3666. [Google Scholar] [CrossRef]
- Vasirani, M.; Kota, R.; Cavalcante, R.L.; Ossowski, S.; Jennings, N.R. An agent-based approach to virtual power plants of wind power generators and electric vehicles. IEEE Trans. Smart Grid 2013, 4, 1314–1322. [Google Scholar] [CrossRef]
- Gao, Y.; Cheng, H.; Zhu, J.; Liang, H.; Li, P. The optimal dispatch of a power system containing virtual power plants under fog and haze weather. Sustainability 2016, 8, 71. [Google Scholar] [CrossRef]
- Zhang, J.; Seet, B.C.; Lie, T. An Event-Based Resource Management Framework for Distributed Decision-Making in Decentralized Virtual Power Plants. Energies 2016, 9, 595. [Google Scholar] [CrossRef]
- Faria, P.; Vale, Z.; Baptista, J. Demand Response Programs Design and Use Considering Intensive Penetration of Distributed Generation. Energies 2015, 8, 6230–6246. [Google Scholar] [CrossRef]
- Gkatzikis, L.; Koutsopoulos, I.; Salondidis, T. The role of aggregators in smart grid demand response markets. IEEE J. Selexted Areas Commun. 2013, 31, 1247–1257. [Google Scholar] [CrossRef]
- Ruiz, N.; Cobelo, I.; Oyarzabal, J. A direct load control model for virtual power plant management. IEEE Trans. Power Syst. 2009, 23, 959–966. [Google Scholar] [CrossRef]
- Hemmati, R.; Hooshmand, R.A.; Taheri, N. Distribution network expansion planning and DG placement in the presence of uncertainties. Int. J. Electr. Power Energy Syst. 2015, 73, 665–673. [Google Scholar] [CrossRef]
- Liu, Z.; Wen, F.; Ledwich, G. Optimal Siting and Sizing of Distributed Generators in Distribution Systems Considering Uncertainties. IEEE Trans. Power Deliv. 2011, 26, 2541–2551. [Google Scholar] [CrossRef]
- Gao, Y.; Zhu, J.; Cheng, H.; Xue, F.; Xie, Q.; Li, P. Study of Short-Term Photovoltaic Power Forecast Based on Error Calibration under Typical Climate Categories. Energies 2016, 9, 523. [Google Scholar] [CrossRef]
- Gao, Y.; Hu, X.; Yang, W.; Liang, H.; Li, P. Multi-Objective Bi-level Coordinated Planning of Distributed Generation and Distribution Network Frame Based on Multi-Scenario Technique Considering Timing Characteristics. IEEE Trans. Sustain. Energy 2017, 8, 1415–1429. [Google Scholar] [CrossRef]
- Gao, Y.; Li, R.; Liang, H.; Cheng, H. Two Step Optimal Dispatch Based on Multiple Scenarios Technique Considering Uncertainties of Intermittent Distributed Generations and Loads in the Active Distribution System. Proc. CSEE 2015, 35, 1657–1665. [Google Scholar]
- Peng, C.; Yu, R.; Sun, H. Multi-objective DG planning based on K-means clustering and multi-scenario timing characteristics analysis. Electr. Power Autom. Equip. 2015, 35, 58–65. [Google Scholar]
- Xu, Y.; Huang, X.; Cao, Y.; Zhang, Z.; Dai, L. Aggregation of air conditioner load based on self-organizing feature map neural network. Proc. CSU-EPSA 2015, 27, 26–33. [Google Scholar]
- Panwar, L.; Konda, S.; Verma, A.; Panigrahi, B.; Kumar, R. Demand response aggregator coordinated two-stage responsive load scheduling in distribution system considering customer behaviour. IET Gener. Transm. Distrib. 2017, 11, 1023–1032. [Google Scholar] [CrossRef]
- Xu, L.; Sun, T.; Xu, J.; Sun, Y.Z.; Li, Z.S.; Lin, C.Q. Mid-and long-term daily load curve forecasting based on functional nonparametric regression model. Electr. Power Autom. Equip. 2015, 35, 89–94. [Google Scholar]
- Zhang, H.; He, R.; Liu, Y. The characteristics clustering and synthesis of electric dynamic loads based on kohoen neural network. Proc. CSEE 2003, 23, 1–5. [Google Scholar]
- Jeong, K.S.; Hong, D.G.; Byeon, M.S.; Jeong, J.C.; Kim, H.G.; Kim, D.K.; Joo, G.J. Stream modification patterns in a river basin: Field survey andself-organizing map (SOM) application. Ecol. Inform. 2010, 5, 293–303. [Google Scholar] [CrossRef]
- Davies, D.L.; Bouldin, D.W. A cluster separation measure. IEEE Trans. Pattern Anal. Mach. Intell. 1979, 2, 224–227. [Google Scholar] [CrossRef]
- He, W. On the index of power load characteristic. J. Changsha Univ. Electr. Power Nat. Sci. Ed. 2004, 19, 68–71. [Google Scholar]
- Gong, W.; Liu, J.; He, X.; Liu, Y. Load Restoration Considering Load Fluctuation Rate and Load Complementary Coefficient. Power Syst. Technol. 2014, 38, 2490–2496. [Google Scholar]
- Wang, X.; Ai, Q.; Xu, W.; Han, P. Multi-objective optimal energy management of microgrid with distributed generation. Power Syst. Prot. Control 2009, 37, 79–83. [Google Scholar]


| Resource Level (RL) | Response Capacity QDR (kW) | Response Time TDR (h) | Penalty Level (PL) | Default Power Qbre (kW) |
|---|---|---|---|---|
| RL1 | (≥200) | (≥2) | PL1 | (≤0.2 QDR) |
| RL2 | (100~200) | (0.5~2) | PL2 | (0.2~0.4 QDR) |
| RL3 | (≤100) | (≤0.5) | PL3 | (≥0.4 QDR) |
| DSR Classification | Basic Profile |
|---|---|
| First Class DSR | Including two wind and two photovoltaic power plants, namely, m = 4 |
| Second Class DSR | The number of industrial users, residential communities and business users who do not participate in the demand response are 2, 3 and 2 respectively, namely, n = 7 |
| Third Class DSR | The number of industrial users, residential communities, commercial users and electric vehicle charging stations participating in the demand response are 2, 3, 2 and 2 respectively, namely q = 9 |
| Heading | Users | Response Capacity QDR (kW) | Responsetime TDR (h) | Default Electricity Qbre (kW) | Resource Level RL | Penalty Level cPL |
|---|---|---|---|---|---|---|
| Scenario 1 | N12 | 294 | 2.5 | 35 | RL1 | PL1 |
| N13 | 251 | 2.3 | 56 | RL1 | PL2 | |
| N14 | 208 | 2.0 | 31 | RL1 | PL1 | |
| N15 | 110 | 1.8 | 60 | RL2 | PL3 | |
| N16 | 153 | 1.5 | 50 | RL2 | PL2 | |
| N17 | 199 | 1.2 | 26 | RL2 | PL1 | |
| N18 | 203 | 2.2 | 51 | RL1 | PL2 | |
| N19 | 97 | 0.4 | 14 | RL3 | PL1 | |
| N20 | 86 | 0.3 | 13 | RL3 | PL1 | |
| Scenario 2 | N12 | 228 | 3.0 | 45 | RL1 | PL1 |
| N13 | 272 | 2.1 | 80 | RL1 | PL2 | |
| N14 | 179 | 1.8 | 25 | RL2 | PL1 | |
| N15 | 132 | 1.9 | 55 | RL2 | PL3 | |
| N16 | 145 | 1.3 | 28 | RL2 | PL2 | |
| N17 | 221 | 2.2 | 56 | RL1 | PL2 | |
| N18 | 168 | 2.0 | 33 | RL2 | PL1 | |
| N19 | 112 | 0.6 | 20 | RL2 | PL2 | |
| N20 | 80 | 0.3 | 17 | RL3 | PL3 |
| Heading | Multi-Scenario of Summer | Typical Scenario of Summer |
|---|---|---|
| Aggregation Users | N2, N3, N4, N6, N7, N8, N9, N13, N14, N15, N16, N18, N19 | N2, N3, N4, N5, N6, N7, N8, N12, N13, N14, N15, N16, N18 |
| Aggregation Number | 13 | 13 |
| Aggregation Capacity | 4.75 × 10⁴ kW | 4.39 × 10⁴ kW |
| Peak-Valley Difference | 1651 kW | 2555 kW |
| Volatility | 0.4115 | 0.5680 |
| Response Capacity | 2506 kW | 2600 kW |
| Response Cost | 441.25 yuan | 653.67 yuan |
| DG Accommodation Rate | 93% | 93% |
| Heading | Summer RA | Winter RA |
|---|---|---|
| Aggregation Users | N2, N3, N4, N6, N7, N8, N9, N13, N14, N15, N16, N18, N19 | N1, N2, N4, N6, N7, N8, N9, N11, N12, N13, N14, N15, N16, N18, N19, N20 |
| Aggregation Number | 13 | 16 |
| Aggregation Capacity | 4.75 × 10⁴ kW | 5.14 × 10⁴ kW |
| Peak-Valley Difference | 1651 kW | 1972 kW |
| Volatility | 0.4115 | 0.4523 |
| Response Capacity | 2506 kW | 2011 kW |
| Response Cost | ¥441.25 | ¥323.6 |
| DG Accommodation Rate | 93% | 89% |
© 2017 by the authors. Licensee MDPI, Basel, Switzerland. This article is an open access article distributed under the terms and conditions of the Creative Commons Attribution (CC BY) license (http://creativecommons.org/licenses/by/4.0/).
Share and Cite
Gao, Y.; Sun, Y.; Wang, X.; Chen, F.; Ehsan, A.; Li, H.; Li, H. Multi-Objective Optimized Aggregation of Demand Side Resources Based on a Self-organizing Map Clustering Algorithm Considering a Multi-Scenario Technique. Energies 2017, 10, 2144. https://doi.org/10.3390/en10122144
Gao Y, Sun Y, Wang X, Chen F, Ehsan A, Li H, Li H. Multi-Objective Optimized Aggregation of Demand Side Resources Based on a Self-organizing Map Clustering Algorithm Considering a Multi-Scenario Technique. Energies. 2017; 10(12):2144. https://doi.org/10.3390/en10122144
Chicago/Turabian StyleGao, Yajing, Yanping Sun, Xiaodan Wang, Feifan Chen, Ali Ehsan, Hongmei Li, and Hong Li. 2017. "Multi-Objective Optimized Aggregation of Demand Side Resources Based on a Self-organizing Map Clustering Algorithm Considering a Multi-Scenario Technique" Energies 10, no. 12: 2144. https://doi.org/10.3390/en10122144
APA StyleGao, Y., Sun, Y., Wang, X., Chen, F., Ehsan, A., Li, H., & Li, H. (2017). Multi-Objective Optimized Aggregation of Demand Side Resources Based on a Self-organizing Map Clustering Algorithm Considering a Multi-Scenario Technique. Energies, 10(12), 2144. https://doi.org/10.3390/en10122144