1. Introduction
Currently, the availability of resources is an important factor for high shares of biomass to penetrate the energy markets [
1]. Globally, biomass fuel is becoming more and more attractive as a suitable substitute for fossil fuels due to the increasing demand for clean energy [
2,
3,
4]. Furthermore, biomass is a renewable energy source, and its importance will increase as national energy policies and strategies focus more heavily on renewable sources and conservation [
5]. The modern use of biomass is distinguished from the traditional use of biomass energy by its conversion into high-quality energy carriers, such as electricity and biomass liquid fuels for transportation [
1]. Therefore, biomass is considered to be the renewable energy source with the highest potential to contribute to the energy needs of modern society for both industrialized and developing countries worldwide [
5], while providing less harm to the environment [
6]. The conversion of plant material into a suitable form of energy, usually electricity or a fuel for an internal combustion engine, can be achieved using a number of different routes, each with specific pros and cons [
4,
5]. So far, much research has been focused on sustainable and environmentally-friendly energy from biomass to replace conventional fossil fuels, such as Lewandowski [
7], Gumisiriza et al. [
8], Singh [
9], Suzuki et al. [
10] and many others. Compared to other energy sources such as solar, wind, water and geothermal, the main advantage of biomass (as a biofuel resource) lies in the lack of necessity of conversion into the electric energy type [
11].
Worldwide, the most important biomass energy sources are wood and wood wastes, agricultural crops and their waste by-products, municipal solid waste, animal waste, fruit waste, waste from food processing, aquatic plants and algae [
5,
12]. Currently, more focus is given to the second-generation fuels consuming waste residues and challenging the development of additional technology improving the efficiency of the waste-based biofuels production [
13]. Official distribution of biomass is stated by mandatory technical standards, which include the following: wood, herbaceous, fruit, aquatic and mixed [
14]. Mentioned standards describe parameters and requirements of all biomass kinds in detail, while every biomass kind is suitable for the production of different types of biofuel. Guo et al. [
15] define biofuels in liquid, gaseous and solid types; the process of biofuel production is different for each type. Solid biofuels are produced by using the densification process, which works with the application of high pressure to increase biomass (feedstock material) bulk density; products created using such technologies are mostly bio-briquettes intended for direct combustion [
16]. The advantage of using bio-briquettes as a fuel is an increase in heating value, longer burning time, improvement of chemical parameters (less smoke), and easier handling and transportation than biomass in bulk form [
17].
Although wood biomass is the most commonly used kind of biomass for the production of bio-briquette fuel for commercial purposes (high content of natural binder—lignin) [
18], other kinds of biomass can also be suitable for this purpose. Moreover, principles of proper waste management urge the utilization of all kinds of biomass, thus, current investigations are focused on bio-briquette production from various waste biomass kinds. Research conducted by Sellin et al. [
19] investigated the suitability of bio-briquettes produced from banana leaves, which represented herbaceous waste biomass kind and Brand et al. [
20] focused on utilization of waste biomass from the processing of rice (husk, straw) for such purposes. In general, the agriculture sector produces a great amount of herbaceous biomass potentially suitable for bio-briquette production. For example, waste biomass from post-harvesting lines represented by husks of poppy, oat, and wheat [
21] or waste corn stovers [
22] have already been investigated with satisfactory results. Bio-briquettes produced from aquatic plants are also the topic of public interest; utilization of water hyacinth and other water plants and weeds were investigated in recent scientific contributions by Rezania et al. [
23] and Brunerová et al. [
24]. The issue of reusing specific fruit waste biomass for bio-briquette production was studied by Brunerová et al. [
25] where the energy potential of feedstock materials originating from the production of jatropha oil and date fruit products was determined. Mixed biomass contains two or more kinds of biomass; the advantage of using more kinds of biomass includes the possibility of improvement of final bio-fuel parameters by a combination of different chemical and mechanical properties of used biomass kinds. A clear example of this type of biomass is digestate—a by-product from biogas plants [
26]. The suitability of digestate for bio-briquette production was already proved in a study conducted by Brunerová et al. [
27].
In the developing world, energy from biomass is mainly used for cooking and heating [
28]. As concluded in Singh and Setiawan [
29], the Indonesian energy strategy lacks the promotion biomass for household energy usage, and the use of wood biomass as a fuel can often result in deforestation. Since Indonesia is a country that conducts a lot of agriculture (approximately 14% of GDP in 2016), there is an enormous potential of utilizing biomass as a renewable energy source. Some products, such as corn, bean, cassava, sugar cane, coconut and oil palm, have already been used in some other developing countries as a fuel alternative [
30]. As described in Singh and Setiawan [
29] and Putrasari et al. [
11], energy resource from biomass in Indonesia can be discussed through several categories: (i) forestry residues, (ii) agricultural residues, and (iii) waste resources.
Such residues represented potential feedstock materials for bio-briquette production, which have become an alternative fuel used in Indonesia. As was reported, coal briquettes are used in small households [
31] but subsequent investigations proved that using coal briquettes resulted in negative impacts on environmental and human health due to air pollution [
32]. Thus, the production of bio-briquettes from biomass feedstock materials represents a more suitable solution. The suitability of sawdust bio-briquettes was investigated by Saptoadi [
33], while bio-briquettes produced from spent bleaching earth were also tested with satisfactory results [
34]. As previously mentioned, the agriculture sector produces a great amount of waste biomass; utilization of agriculture waste for bio-briquette production was investigated by Mulyana et al. [
35], who tested the suitability of corncob and rice husk bio-briquettes in local conditions of Indonesia. Utilization of tree waste from Indonesia, more specifically the leaves of the
Cerbera manghas tree combined with tapioca starch, was described in the study by Anggono et al. [
36].
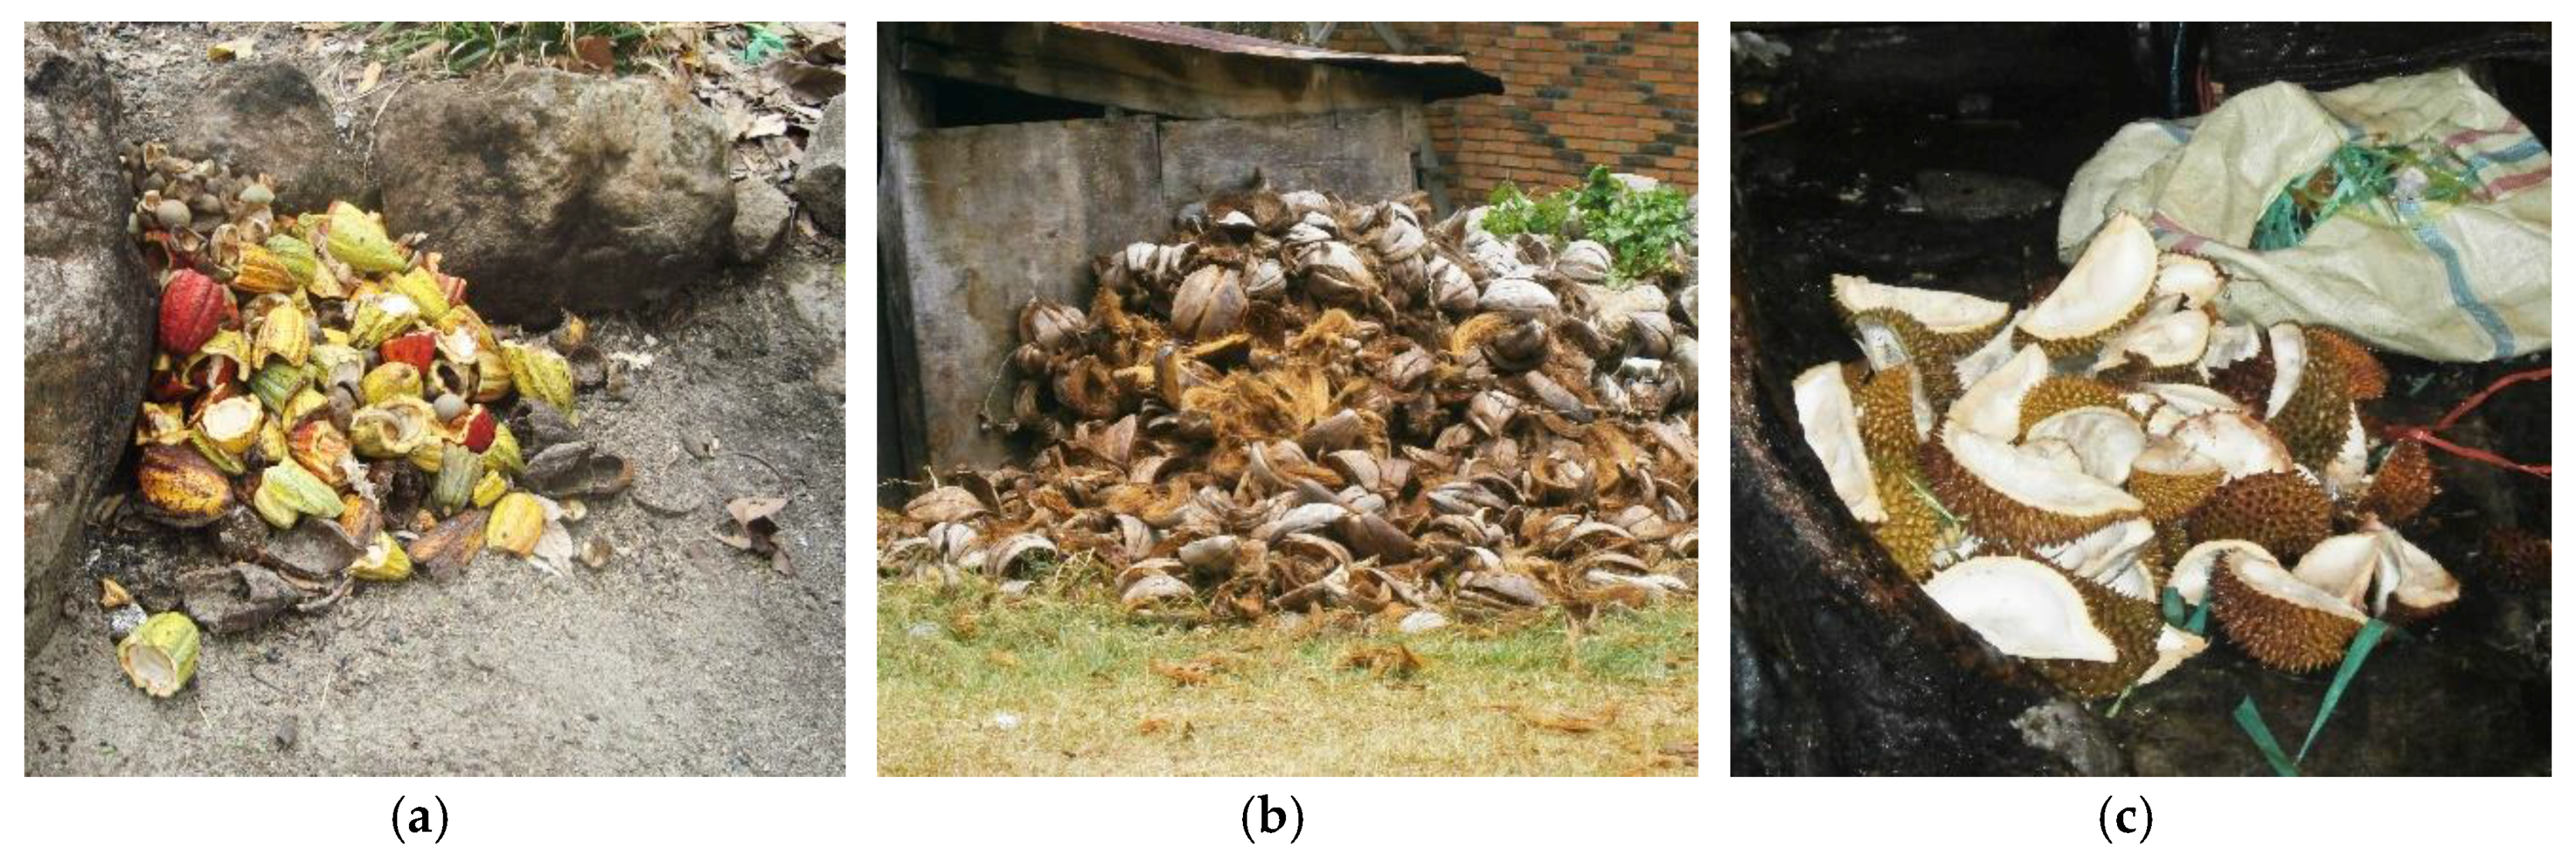
Nowadays, Indonesia is characterized by the cultivation of countless kinds of tropical fruit. Such production indicates a great amount of fruit waste biomass. Without a doubt, cultivation of oil palm represents the biggest source of fruit biomass in Indonesia. Approximately four kilograms of fruit waste biomass, in the form of empty fruit bunches, are produced within the production of one kilogram of crude palm oil [
37]. Nevertheless, production of oil palm products is considered controversial and faces worldwide criticism [
38]; thus, other fruit waste biomass could be of interest. The area occupied by plantation fruit trees in Indonesia was equal to 6,116,970 ha in 2014: namely, trees of banana, cacao, coconut, and coffee were counted [
39]. Unfortunately, subsequent utilization of fruit waste biomass, produced during the processing of the previously mentioned fruit kinds, is not always performed in the most effective way (as shown in
Figure 1).
Current available literature discusses the possibility of reusing various fruit waste biomass kinds for production of solid biofuels, i.e., bio-briquettes and bio-pellets, intended for direct combustion. Production of bio-briquette fuel from durian fruit waste biomass was investigated and proved to be a suitable solution in areas of East Java, Indonesia [
40]. Awareness of the possibility of bio-briquette production from coconut fruit biomass waste was monitored in many countries in Asia due to the great extension of coconut palm cultivation. A study by Moral [
41] monitored the suitability of such production in Bangladesh, India. Meanwhile, other research investigated the production and supported the use of coconut fruit waste biomass bio-briquettes in Indonesia [
42]. The viability and efficiency of bio-pellets produced from cacao fruit waste biomass were proven in a study by Syamsiro et al. [
43], while other research proved the suitability of cacao fruit waste biomass as a household fuel in Ghana [
44]. Utilization of coffee fruit waste biomass as a feedstock for bio-briquette production in Indonesia was described in the study by Suryaningsih et al. [
42]. The production of banana fruit waste biomass bio-briquettes was investigated in studies performed in Thailand with satisfactory results [
45,
46]. Information about rambutan fruit waste biomass kind (utilization and energy production) was not available in the literature. However, research on the subsequent utilization of rambutan seeds for production of flour were performed in Thailand [
47,
48]. In general, the production of such bio-briquette fuel is not common practice; thus, mentioned investigations were mostly focused on the feasibility and practicality of creating such bio-briquettes.
Considering all of the information that was previously stated, the main objective of this study is to determine the potential use of tropical fruit waste biomass for the production of solid bio-fuels (namely bio-briquettes) in Indonesia. In order to reach this objective, the available amounts of tropical fruit waste biomass have been measured and their chemical parameters, elemental composition, and energy potential have been determined. Additionally, the energy demands of production of such bio-briquettes have been calculated and the parameters of the mechanical quality of such bio-briquettes have been measured. Furthermore, the current use of this waste biomass and the sustainability of its use in Indonesia are discussed. The purpose of this study is to provide the necessary background information for the selection of the most suitable and convenient sources (in terms of availability and energy value) for the production of compressed bio-briquette fuels.
2. Materials and Methods
The entire experimental part of the present study was performed in accordance to mandatory technical standards related to the specific measurement practice within solid bio-fuel production problematics. Experimental testing included the processes of feedstock preparation and bio-briquette sample production, measurement of bio-briquette samples, and evaluation of obtained result values; specific standards used are described in related chapters.
2.1. Materials and Samples
Collected samples used for this experimental investigation are represented primarily by unprocessed fruit samples of specific selected kinds and secondary by biological waste materials originating from such fruit kinds. Such waste materials were defined as a fruit waste biomass (according to ISO 17225–1 [
14])—fruit exocarp (husk, skin, cover) and mesocarp (pulp, fibre).
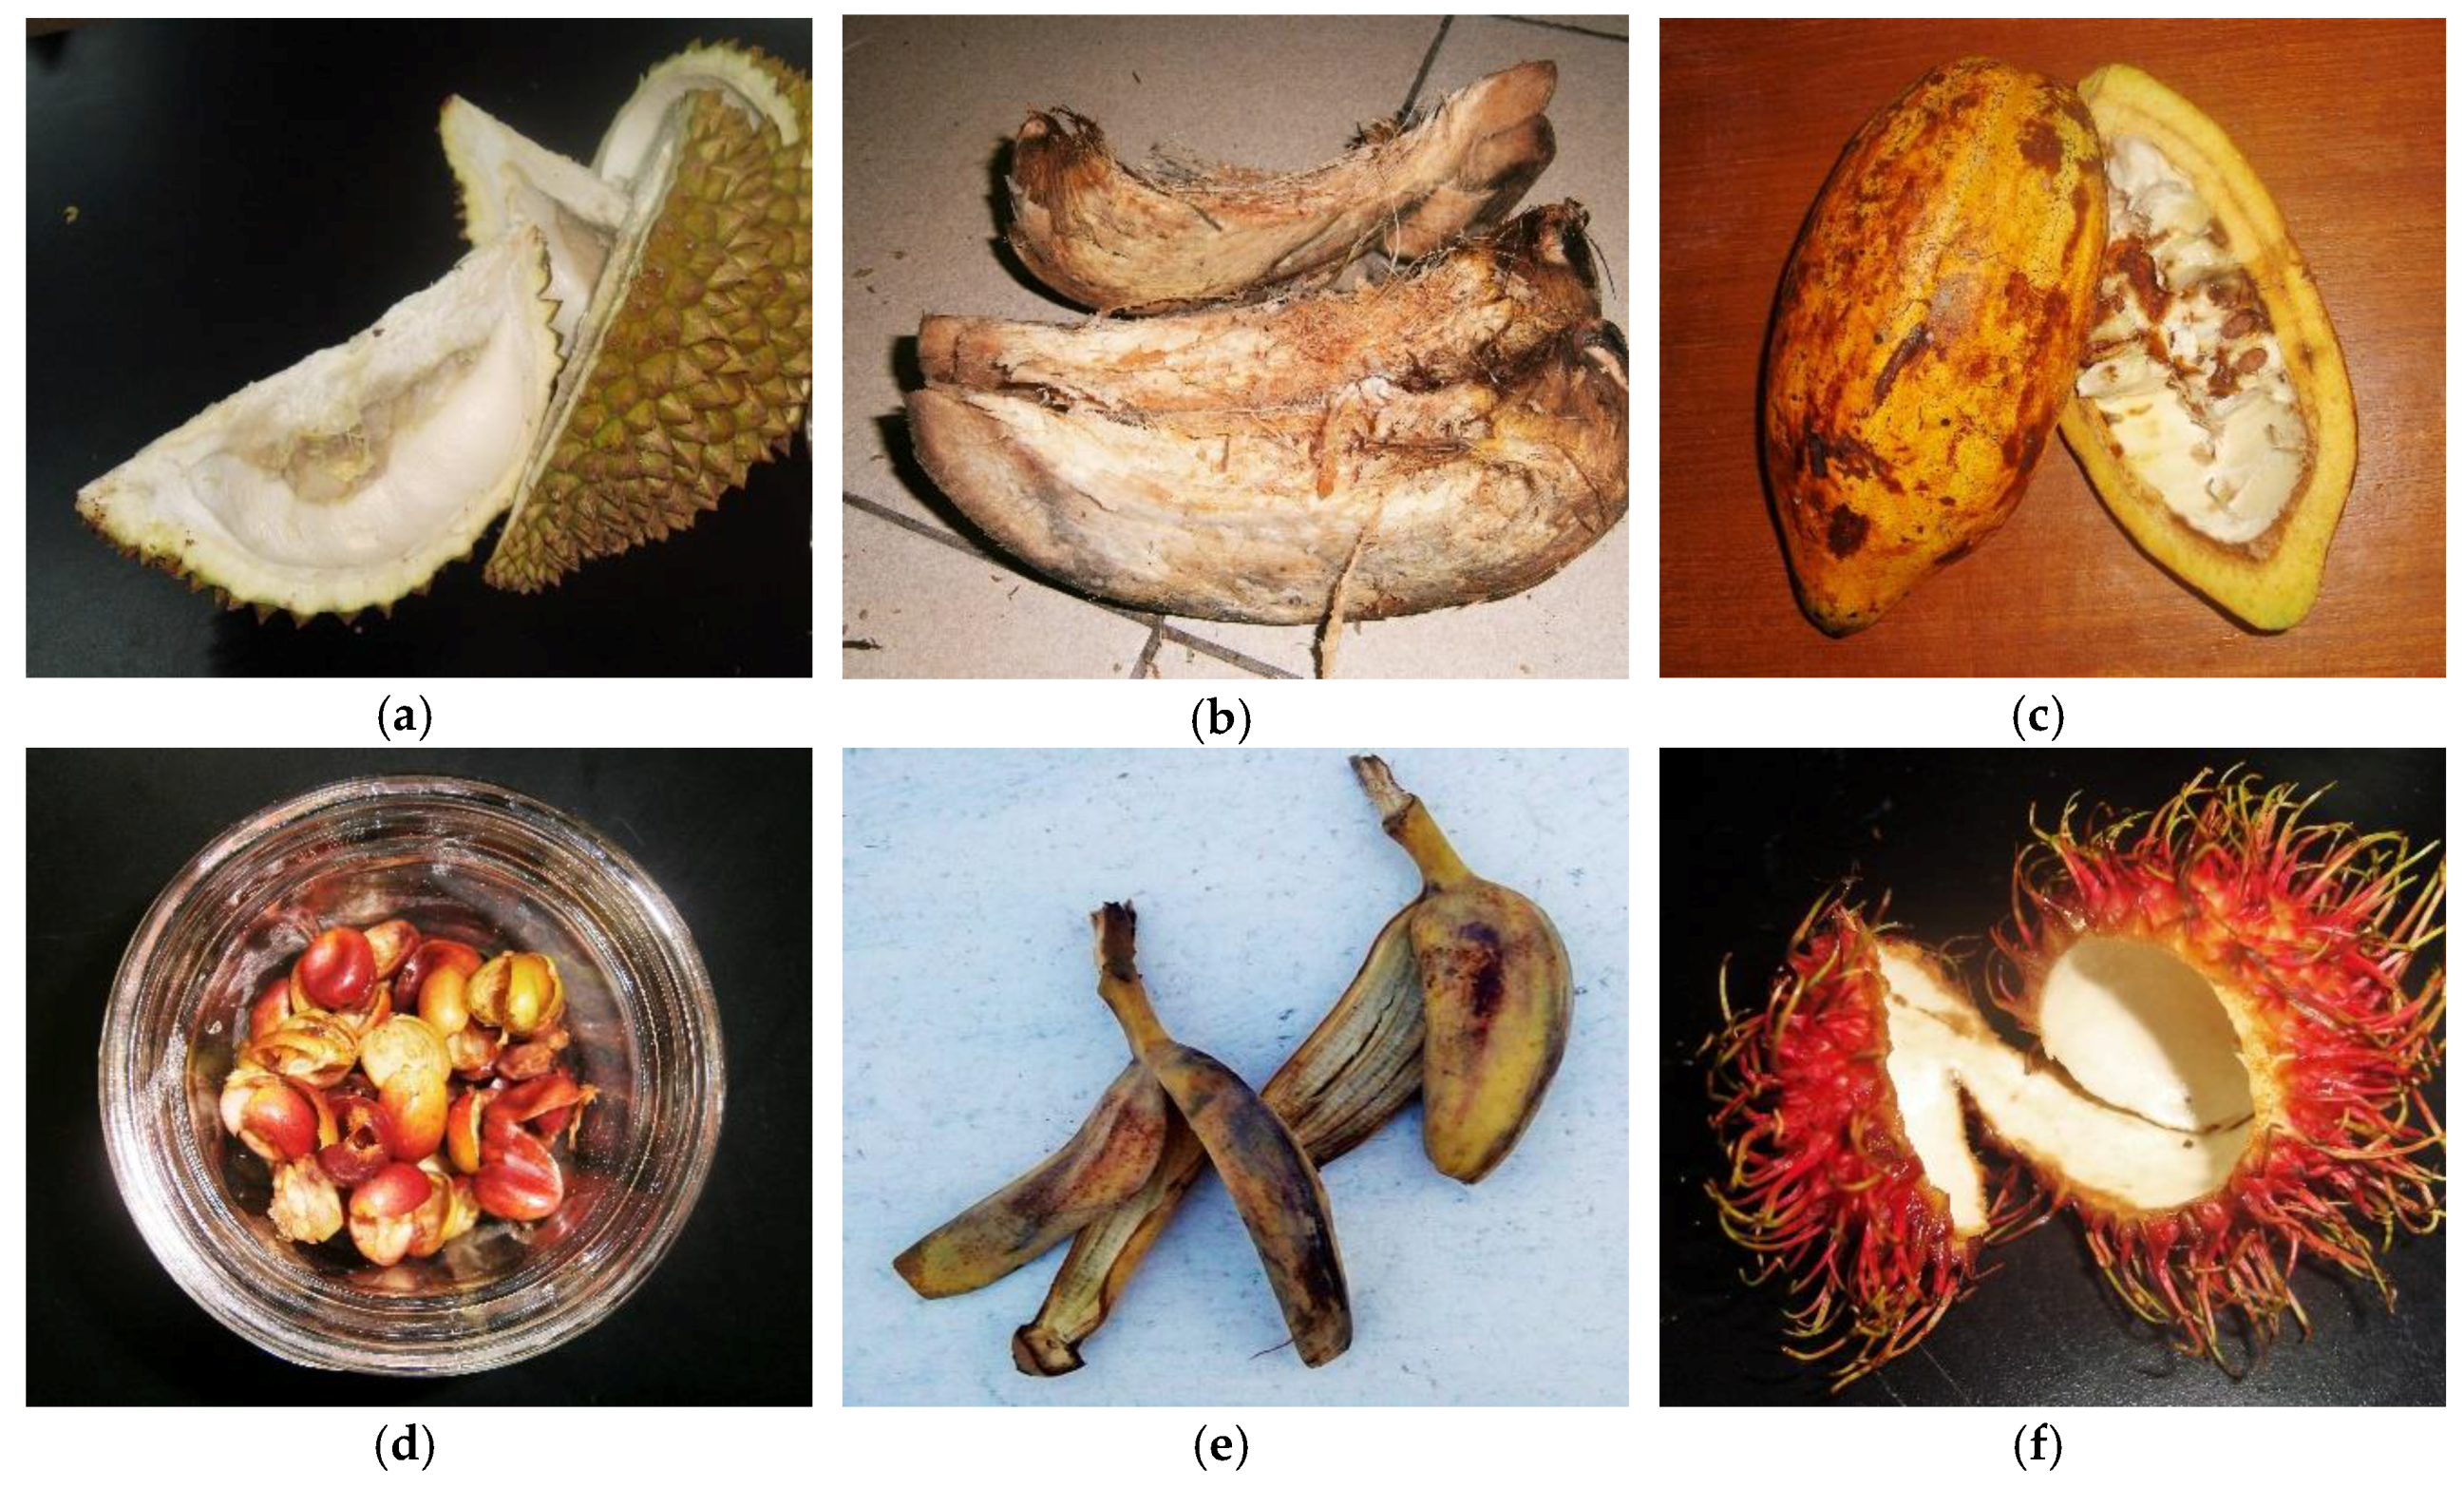
Thus, unprocessed fruit samples and fruit waste biomass of the following six tropical fruits (as shown in
Figure 2) were collected: (1) durian fruit (
Durio zibethinus), (2) coconut fruit (
Cocos nucifera), (3) coffee fruit (
Coffea arabica), (4) cacao fruit (
Theobroma cacao), (5) banana fruit (
Musa acuminata) and (6) rambutan fruit (
Nephelium lappaceum). Such fruit kinds were selected due to common and frequent consumption by the local population and consequently due to the high production in the target area. Thus, such fruit waste biomass represented a potential source of renewable energy.
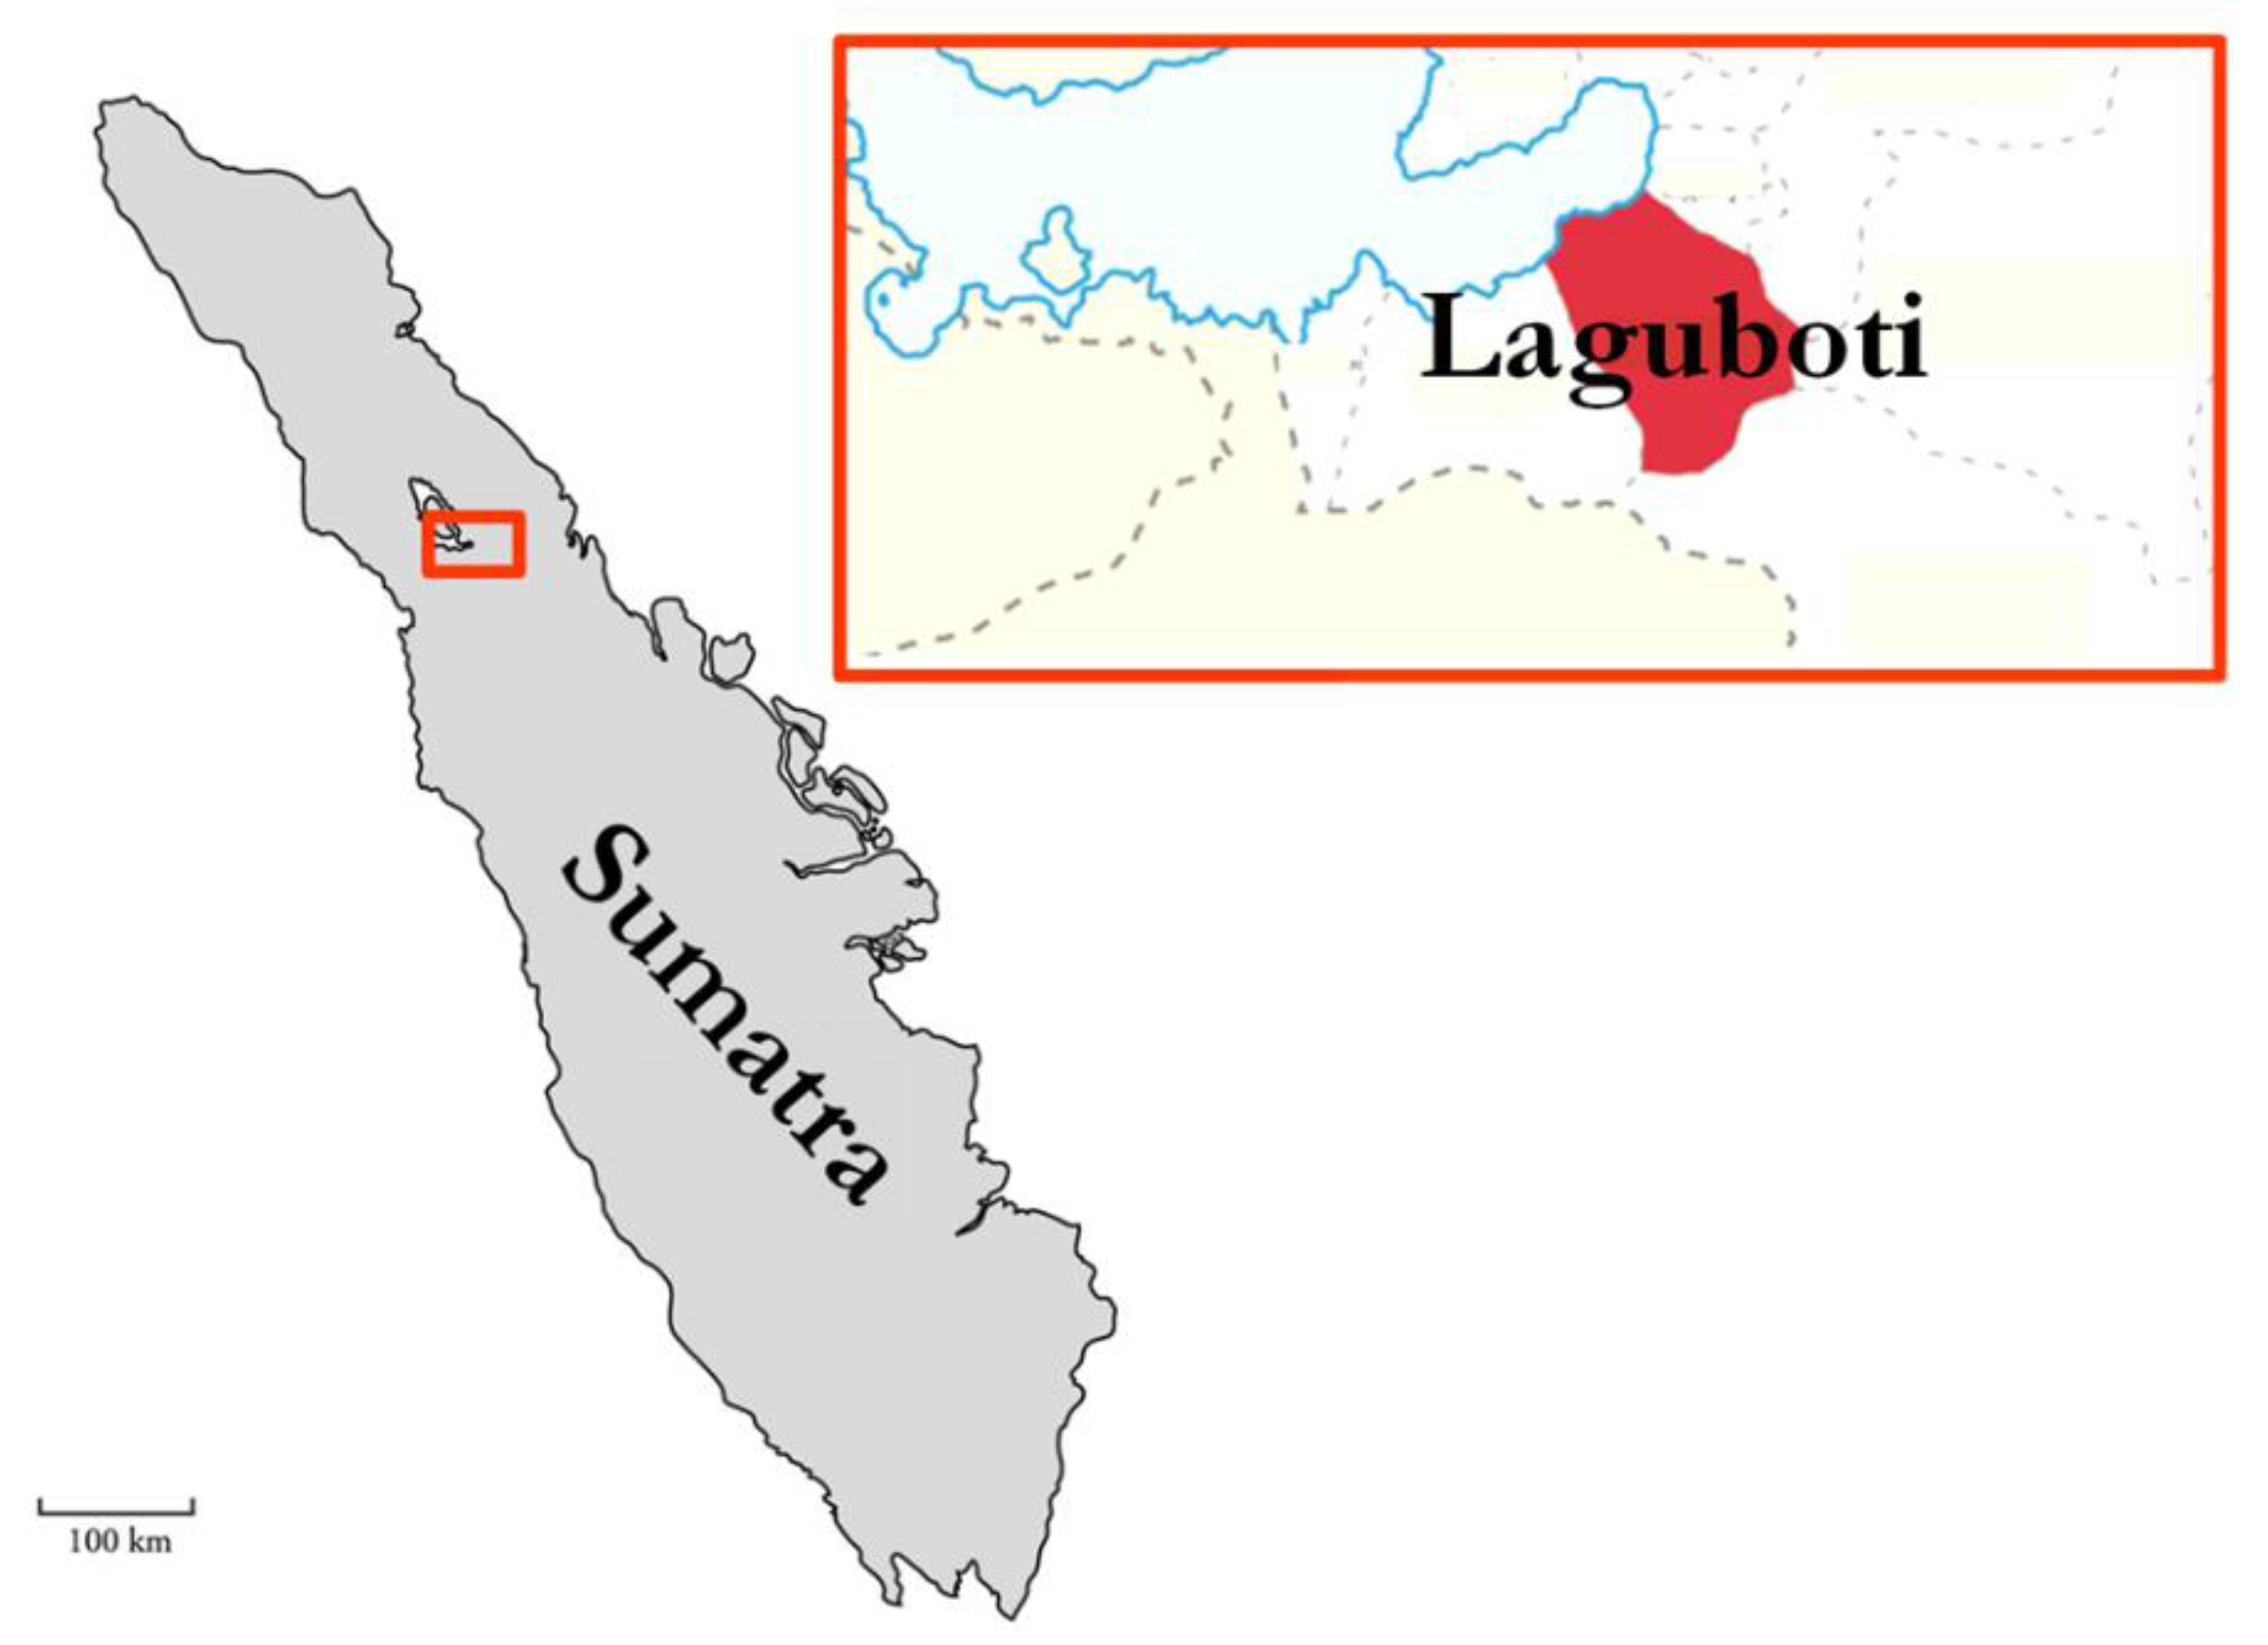
Secondary, whole unprocessed pieces of fruits of different kinds (durian, coconut, cacao, coffee, banana and rambutan) from which the mentioned fruit waste biomass originated were also collected. All mentioned samples (fruit waste biomass and unprocessed fruits) were collected at the local markets in Laguboti city or Balige city, in the district of Laguboti, Regency of Toba Samosir, North Sumatra, Republic of Indonesia (IDN) (as shown in
Figure 3) during the summer period from August to September 2016.
These markets took place regularly on one specific day of the week; thus, all samples of each specific fruit kind were collected during one specific day and were subsequently transported to the place of processing by local public transport (minibuses). The selected fruit waste biomass samples were collected at random and did not originate from the same plant. Precise weights of collected fruit waste biomass kinds were not measured, but detailed numbers of collected unprocessed fruit samples and their overall weights are noted in
Table 1.
Particular emphasis was placed on the time between sample collection and processing; both activities took place on the same day, and the time interval between collection and processing was not longer than 10 h. All fruit samples were processed by the authors of this paper. Processing of fruit samples was performed in the laboratory of a local university, Institut Teknologi Del (IT DEL) in Laguboti. In respect to the common local practices and in attempt to simulate local processing methods of small farmers (the source of obtained fruit samples), the processing was performed manually. The machete, bought at a local market in Balige city, was used for processing durian and coconut fruit samples, and a snap-off knife, also bought at a local market, was used for processing cacao fruits samples. Rambutan, banana, and coffee fruit samples were processed by hand without using any equipment. Specific kinds of processing related to specific experimental measurements are described in related chapters below.
2.2. Waste Ratio
Primarily, the mass of fruit waste biomass originating from each collected fruit kind was the topic of investigation. Experimental measurement was performed as follows: every piece of unprocessed fruit sample was weighed separately before any processing, and thus the initial mass of fruit, mf, was identified. Subsequently, each previously-weighed fruit sample was subjected to processing, which consisted of removing of the skin, pulp, or fibre from the unprocessed fruit sample until the part of fruit intended for subsequent ingestion (or further resale) was cleaned completely. All of the residues (fruit waste biomass) generated from one specific piece of fruit sample were collected and weighed. The resulting weight of whole fruit waste biomass, mw (g), originating from one specific piece of fruit sample was compared to the initial weight of the same unprocessed fruit sample, mf (g). By using of these two values (mw, mf), the final ratio of produced fruit waste biomass of each fruit kind was determined.
Directly after processing and measurements, an initial moisture content, M
c (%), of the generated fruit waste biomass was determined by using a laboratory oven Daihan Labtech, type LDO–080F (New Delhi, India). The process of drying was performed in accordance with mandatory technical standard ISO 18134–2 [
49].
2.3. Chemical Analysis
Analyses of chemical components and parameters of the investigated tropical fruit wastes were determined. This attempted to state their suitability for energy generation by direct combustion, which includes ensuring their environmental harmlessness and efficiency as feedstock materials for bio-briquette fuel production.
Before laboratory testing, all samples were adequately prepared. First, all samples were dried in the laboratory dryer LAC (Rajhrad, Czech Republic) at a temperature of 105 °C for 20 h and ground into suitable particle size (<0.1 mm) by using a hand knife mill (with adjustable speed
v equal to 20,000 rpm∙min
−1). Prepared samples were subsequently subjected to determination of basic chemical parameters, such as moisture content—M
c (%), ash content—A
c (%), volatile matter content—VM
c (%), calorific values as a gross calorific value—GCV (MJ∙kg
−1), net calorific value—NCV (MJ∙kg
−1), elementary composition of carbon—C (%), hydrogen—H (%), nitrogen—N (%), sulphur—S (%), and oxygen—O (%). All of the observed result values within chemical analysis were represented by average values (at least three suitable measurements were performed) and were converted into dry basis state (d.b.) in accordance with standard ISO 29541 [
50].
2.3.1. Chemical Parameters
The thermogravimetric analyser, LECO, type TGA 701 (Saint Joseph, MO, USA) was used for determination of basic chemical parameters (M
c, A
c, VM
c). All processes were performed in accordance with the following standards: EN ISO 18122 [
51], EN ISO 18123 [
52] and ISO 18134–2 [
49]. First, for the moisture content determination, all samples were dried at 107 °C to a constant weight and volatile matter content was determined after samples were subsequently dried at 900 °C for 7 min; a coal standard (with 41.4% VM) was used for correction. Eventually, burning in oxygen at 550 °C was performed until the samples’ weights were constant. This was to determine the ash content.
2.3.2. Elementary Composition
The C, H, N, S contents of the investigated samples were determined according to the standard EN ISO 16948 [
53] by using the laboratory instrument, LECO, type CHN628+S (Saint Joseph, MO, USA); helium was used as a carrier gas. All samples were primarily burned in the oxygen and subsequently, the flue gases were determined. The presence of C, H, and S were tested in infrared absorption cells; the presence of N was tested in thermal conductivity cell. A weight of 0.2 g of each sample was burned at 1350 °C within the analysis of S content, and coal and rye flour were used as calibrating standards. Meanwhile, for the determination of C, H, and N, 0.15 g of samples were burned at 950 °C and rye flour and ethylenediaminetetraacetic acid (EDTA) were used as a calibrating standard.
2.3.3. Calorific Value
Two parameters were determined within the present testing, namely, gross calorific value (GCV) and net calorific value (NCV), both in MJ∙kg
−1. GCV was determined by using an isoperibol calorimeter, LECO, type AC 600 (Saint Joseph, MO, USA); the testing was conducted in accordance with the standard EN ISO 18125 [
54]. All samples were densified into the pellet form (approximately 0.7 g each) and burned within the experimental testing. The statement of NCV is defined by the relation between NCV and GCV, which is described in the standard ISO 1928 [
55] and was determined by using the supplied software.
2.4. Energy Demands on Bio-Briquette Production
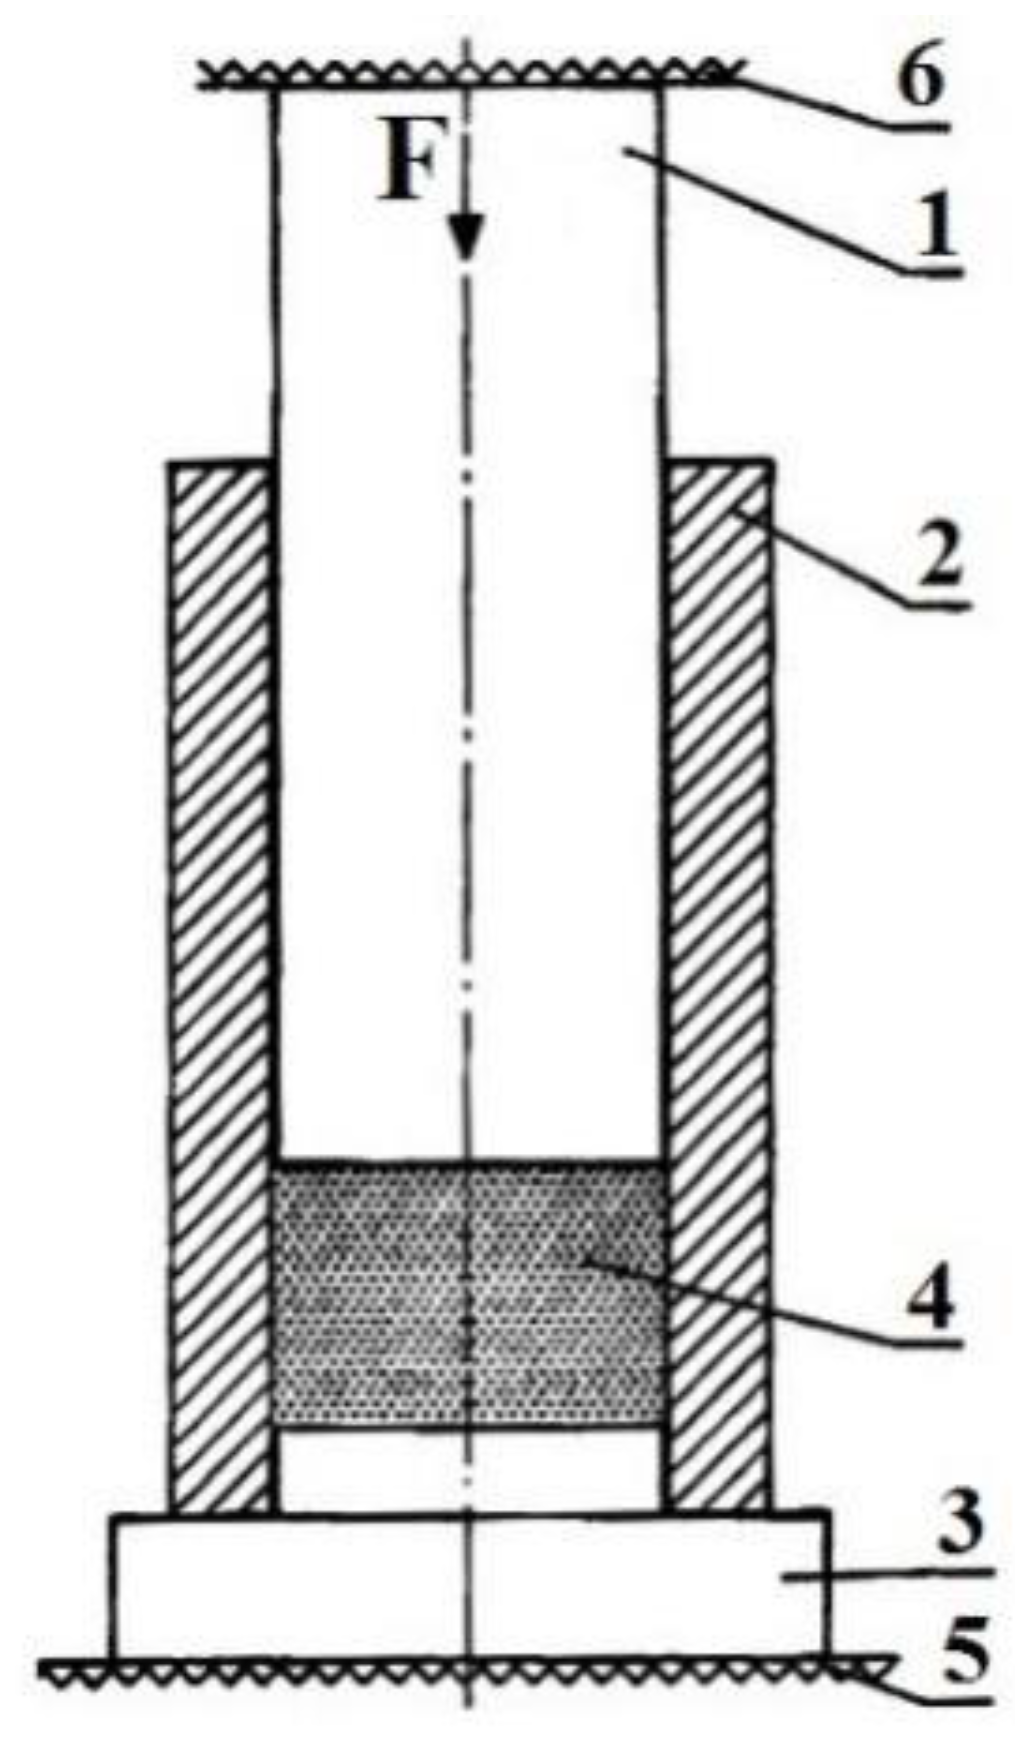
The present chapter describes the efficiency of bio-briquette production from investigated tropical fruit waste biomass. Basic data used for the determination of such efficiency were obtained within the experimental investigation which monitored the energy inputs of the densification process and final mechanical quality of produced bio-briquette samples. Such a measurement was performed during the compression of feedstock materials in a specially designed laboratory hand crafted briquetting press [
56]. The aforementioned laboratory press (
Figure 4) was equipped with a pressing chamber of a diameter of 40 mm, thus, produced bio-briquette sample diameter was equal to 40 mm. The height of the pressing chamber was 120 mm while there was an underlay of 9 mm placed in the chamber. The pressing chamber could not be filled to the edge, thus, the initial height of investigated feedstock materials before pressing was equal to 108 mm.
This press simulated the work of a pressing chamber of commonly used high–pressure briquetting presses and used the universal hydraulic tensile compression testing machine type ZDM 50 (VEB, Dresden, Germany) as a source of loading force. Technical parameters of the testing machine were as follows: maximum compression loading Pmax was 500 kN, pressing speed vp was 1 mm∙s−1. The experimental conditions in the laboratory were constant during the whole process of measurement, i.e., air temperature was 22.5 °C and relative air humidity was equal to 40% (both averages). First, the values of compression force F (N) and displacement of the piston s (mm) were determined; movement of the piston inside the pressing chamber caused by force action resulted in deformation of investigated feedstock materials (decreasing of feedstock height). Such values were measured directly during the feedstock material deformation and corresponded to increasing bulk density ρ (kg·m−3) of just the emerging bio-briquette sample. The relation between piston movements and compression force F described in detail the process of bulk density ρ increasing.
Result values of such parameters represented initial data for the subsequent determination of required deformation energy Ed (J) which was consumed during the densification process (bio-briquette production) and bulk density ρ (kg∙m−3) of the final products—the bio-briquette samples—at specific levels. In general, those two factors were assigned to each other, i.e., bio-briquette samples’ bulk density ρ were monitored at levels from 800 until 1300 kg∙m−3 (with an interval of 50 kg∙m−3) and the corresponding amount of consumed energy Ed for each specific bulk density ρ was determined for all tested samples. In such an assignment, the required deformation energy Ed represented the financial input of densification process and bulk density ρ represented bio-briquette quality and suitability of feedstock material for such production.
A tangent curve function (expressed in Equation (1)) was used for the expression of deformation energy E
d; the following tangent curve function was chosen in respect to previous studies dealing with a similar issue [
57,
58].
where C
0—force coefficient (N), C
1—deformation coefficient (m
−1), C
2—exponent of fitted function (–).
The coefficients of the tangent curve model were determined for each investigated fruit waste biomass kind by using the mentioned tangent curve function (Equation (1)). Measured data of compressing force F (N) and feedstock materials deformation s (m) were processed in MathCAD 14 software (PTC, Needham, MA, USA) through the “genefit” function.
Expression of consumed deformation energies Ed of each fruit waste biomass kind was performed by integral of used tangent curve function (Equation (2)).
Final result values of consumed deformation energies Ed were expressed as an area located under the tangent curve.
The increase of bulk density ρ of specific investigated bio-briquette samples were measured from the beginning of the densification process (i.e., from the beginning of compression process caused by displacement of the piston) until the achievement of a maximal possible level of bulk density ρ (which differed for each investigated material). Nevertheless, for the purpose of the present investigation, the bio-briquette bulk density ρ was monitored and considered after achieving a level equal to 800 kg·m−3. These were lower levels of bio-briquette volume densities ρ, and these were not relevant for commercial bio-briquette production (mechanical quality requirements). However, these were appropriate for the present investigation. The monitored bulk density ρ levels ranged from 800–1300 kg·m−3 with step 50 kg·m−3. Thus, determined deformation energy Ed values were assigned to such specific bulk density ρ levels.
3. Results and Discussion
The present chapter is divided into four sections in accordance with the different topics of the experimental measurements (waste ratio, chemical analysis, energy demands and supporting results from field survey). The obtained results and findings represent the overall evaluation of the different fruit waste biomass that were investigated, and that can potentially be used for bio-briquette fuel production.
3.1. Waste Ratio
The first experimental measurement was focused on determination of the ratio of the harvested fruit (their various parts) and fruit waste biomass left behind as residues. The result values (
Table 2) described a large production of fruit waste biomass, encouraging the use of these residuals for alternate purposes to reduce waste and practice proper waste management.
The obtained result values were expressed as a fruit waste biomass weight in grams and as a proportion of mass fruit waste biomass of total fruit sample mass in percentage.
The highest percentage of residue mass was equal to 83.82% (in average) of total fruit mass for cacao, followed by 62.56% (in average) of durian, and 56.83% (in average) of coconut. However, the observed result values expressed in waste biomass weights had different results. The coconut had the greatest mass of produced residue, followed by the durian fruit, and by the cacao. Despite the fact, that order of the first three fruit samples with the highest proportion of fruit waste biomass differed within the form of its results expression (percentage or weight), it can be concluded that the biggest potential of fruit waste biomass production was found to be the coconut fruit kind (Cocos nucifera), the durian fruit kind (Durio zibethinus), and the cacao fruit kind (Theobroma cacao). Other investigated fruit samples (coffee, banana, and rambutan fruit kinds) also proved to have a high percentage of residue mass to the total fruit mass, but the weight of their fruit waste biomass was very low compared to the durian, coconut and cacao fruits. Such results are naturally related to the size and taxonomy of the mentioned fruit kinds. Within the evaluation of investigated fruit kinds, as a source of feedstock material for bio-briquette production (for combustion purposes), the low mass of fruit waste biomass must be considered as a limitation of specific fruit kinds. A collection of such residue would consume more time and energy.
Statistical data published by the Food and Agriculture Organization of the United Nations (FAO) provide us with detailed numbers (shown in
Table 3) related to the production parameters of selected tropical fruits in Indonesia, namely, of banana, coconut, cacao, and coffee fruit kinds. A combination of such data, with the mentioned data being obtained within the present research (percentage of waste biomass produced within specific fruit kinds), provides us the approximate theoretical amount of fruit waste biomass in tonnes of selected fruit kinds (last column in
Table 3). These quantities of fruit waste biomass warrant the need for a subsequent utilization in order to practice proper waste management.
Result values indicate the theoretical potential of fruit waste biomass for subsequent utilization, such as for energy production purposes. When comparing the result values, there are clear differences between the fruit kinds that were investigated. These differences can be attributed to the different parameters involved in fruit production, which may influence the results.
Despite the fact that cacao fruit kind exhibited the highest amount of fruit waste biomass (82.11% in average), its overall theoretical potential occurred at much lower level (in comparison with the coconut and the banana fruit kinds) because of the low level of fruit yield. Such results are inherently associated with the taxonomy and structure of fruit trees and the fruit itself. This is supported by the case of the banana fruit kind, which represented the smallest harvested area but exhibited an extremely high level of yield, which resulted in the second largest theoretical amount of investigated fruit waste biomass. Specific data related to the production of durian and rambutan fruit kinds in Indonesia (suitable for calculation of a theoretical amount of waste biomass) were not available.
Present observation clearly proved that yield of tropical fruits and area of fruit trees cultivation play an important role in the evaluation of the potential for fruit waste biomass production.
3.2. Chemical Analysis
The determination of basic chemical parameters, elementary composition, and energy potential of investigated fruit waste biomass kinds described their suitability for energy generation by combustion methods.
Primarily, the initial moisture content of the fruit waste biomasses was determined right after their separation and collection. This parameter played an important role in subsequent treatment; inappropriate moisture content (>10%) could complicate subsequent bio-briquette production [
49].
Observed result values (
Table 4) expressed an extremely high moisture content, which is not suitable for the densification process. In general, such observation indicated the necessity of drying the investigated fruit waste biomasses before their utilization, thus, the necessity of energy input. Such issue could be partly solved by using solar power energy available in the target area and in similar geographic areas.
Comparable result values of the initial moisture contents were published in studies describing the potential of aquatic biomass for energy generation purposes in Indonesia and Malaysia. More specifically, the initial moisture content of the water hyacinth (
Eichhornia crassipes) and of the waterweeds (
Hydrilla verticillata,
Myriophyllum spicatum) ranged from 85.30% to 92.00% [
23,
24].
The investigated fruit waste biomass should represent feedstock materials for bio-briquette fuel production. Thus, their chemical contents were important indicators of their suitability for this purpose. The combustion of untested (i.e., potentially unsuitable) feedstock materials can cause low bio-fuel efficiency, exhibit a negative impact on combustion equipment, or cause damage to the environment. Therefore, detailed analyses of the investigated fruit waste biomasses were required. The specific result values of experimental measurements are expressed in
Table 5.
The energy potential and chemical composition of specific fruit waste biomass have already been investigated; providing some data for comparison with result values from the present research (
Table 6).
The elemental composition of the investigated fruit waste biomasses was expressed in
Table 7. These described the biomasses’ behaviours during combustion. The level of oxygen (%) is the main indicator of the ability of materials to burn, while, a low level of oxygen (<40%) is preferred. Since all investigated fruit waste biomasses had levels of oxygen below 40%, all are considered suitable for combustion purposes.
The values expressed in
Table 8 are the results which were not influenced by the presence of ash during the experimental measurements. The content of ash is related to other chemical parameters and elemental compositions of investigated samples and could increase with contamination of tested samples by external agents during the collection, transport or manipulation. Thus, the result values of the tested parameters and compositions might not be accurate.
Therefore, the values expressed in dry ash free state represented more relevant results. However, when comparing the result values in
Table 5,
Table 7 and
Table 8, it is possible to conclude that the differences between specific observed values were minor in most cases. However, given the fact that investigated samples are fruit waste biomass kinds without subsequent utilization, their reuse should be supported in every case.
3.3. Energy Demands of Bio-Briquette Production
The present chapter evaluated the suitability of the investigated fruit waste biomass as potential feedstock materials for bio-briquette fuel production by the energy demands for the production of such bio-briquettes.
Within the present investigations, the required deformation energy Ed (J) used for the production of the bio-briquette samples was monitored and compared with related bio-briquette bulk density ρ (kg∙m−3). By considering these two indicators, it was possible to state the ideal production of bio-briquettes from investigated feedstock materials at specific levels of volume densities ρ. Moreover, the densification process has a specific moment where the increase of the required deformation energy Ed (J) is disproportionately faster than increasing of bio-briquette bulk density ρ (kg∙m−3). In that case, such bio-briquette production represented energy loss, thus, its disadvantage could be indicated.
It is also important to highlight that deformation energy Ed, which was monitored by the present experimental measurements, was an energy consumed exclusively for specific bio-briquette sample production (densification process) and not an energy consumed by work of pressing machine or other consumed energies associated with the briquetting process.
The observed results are represented by the coefficients of the tangent curve model, which were used within the initial mathematical calculations. Detailed values for each kind of fruit waste biomass are presented in
Table 9.
Next, the observed results were used for the statement of maximal achieved bulk density ρ of specific bio-briquette kinds, thereby stating the level of such bio-briquette mechanical quality. In general, higher level values are required while the lowest allowable level is 800 kg∙m
−3 [
22,
64,
65]). The maximal bulk density ρ achieved by specific fruit waste biomass kinds are noted in detail in
Table 9. Specific amounts of required deformation energy E
d were assigned to all monitored bio-briquette volume densities ρ (range from 800 to 1300 kg∙m
−3). These relations evaluate the efficiency of the densification process, as well as the comparison between all investigated fruit waste biomass kinds. All obtained result values are expressed in
Table 10.
The highest level of bulk density ρ was achieved by the rambutan fruit samples. The measurements also proved that the rambutan fruit waste is the only sample to achieve all monitored levels of bulk density ρ (800–1300 kg∙m−3). The second-highest level of bio-briquette bulk density ρ was achieved by durian fruit and banana fruit waste biomass samples. However, if we compare all obtained result values, it is obvious that production of bio-briquette samples from banana fruit waste biomass consumed less energy than the production of residue bio-briquette samples from durian waste biomass. Bio-briquette samples produced from coffee fruit waste biomass also achieved a very high level of bulk density ρ (1200 kg∙m−3). However, when compared with other result values, it is obvious that production of such bio-briquette samples consumed more deformation energy Ed than the banana or rambutan fruit waste biomass samples.
The second-worst results were achieved by coconut fruit waste biomass bio-briquette samples, while the lowest efficiency level was obtained for bio-briquette samples from cacao fruit waste biomass. The amount of required deformation energy Ed for production of such bio-briquette samples was very high even at the lowest monitored level of bulk density ρ (800 kg∙m−3) if compared with other investigated samples. Moreover, the cacao fruit waste biomass bio-briquette samples achieved the lowest level of bulk density ρ from all samples. Thus, the suitability of cacao waste biomass for bio-briquette samples was weakest from all samples. Nevertheless, it is important to consider that the bio-briquette volume densities ρ achieved by investigated fruit waste biomass bio-briquettes occurred at a satisfactory level in general, therefore fulfilling mandatory requirements for commercial production.
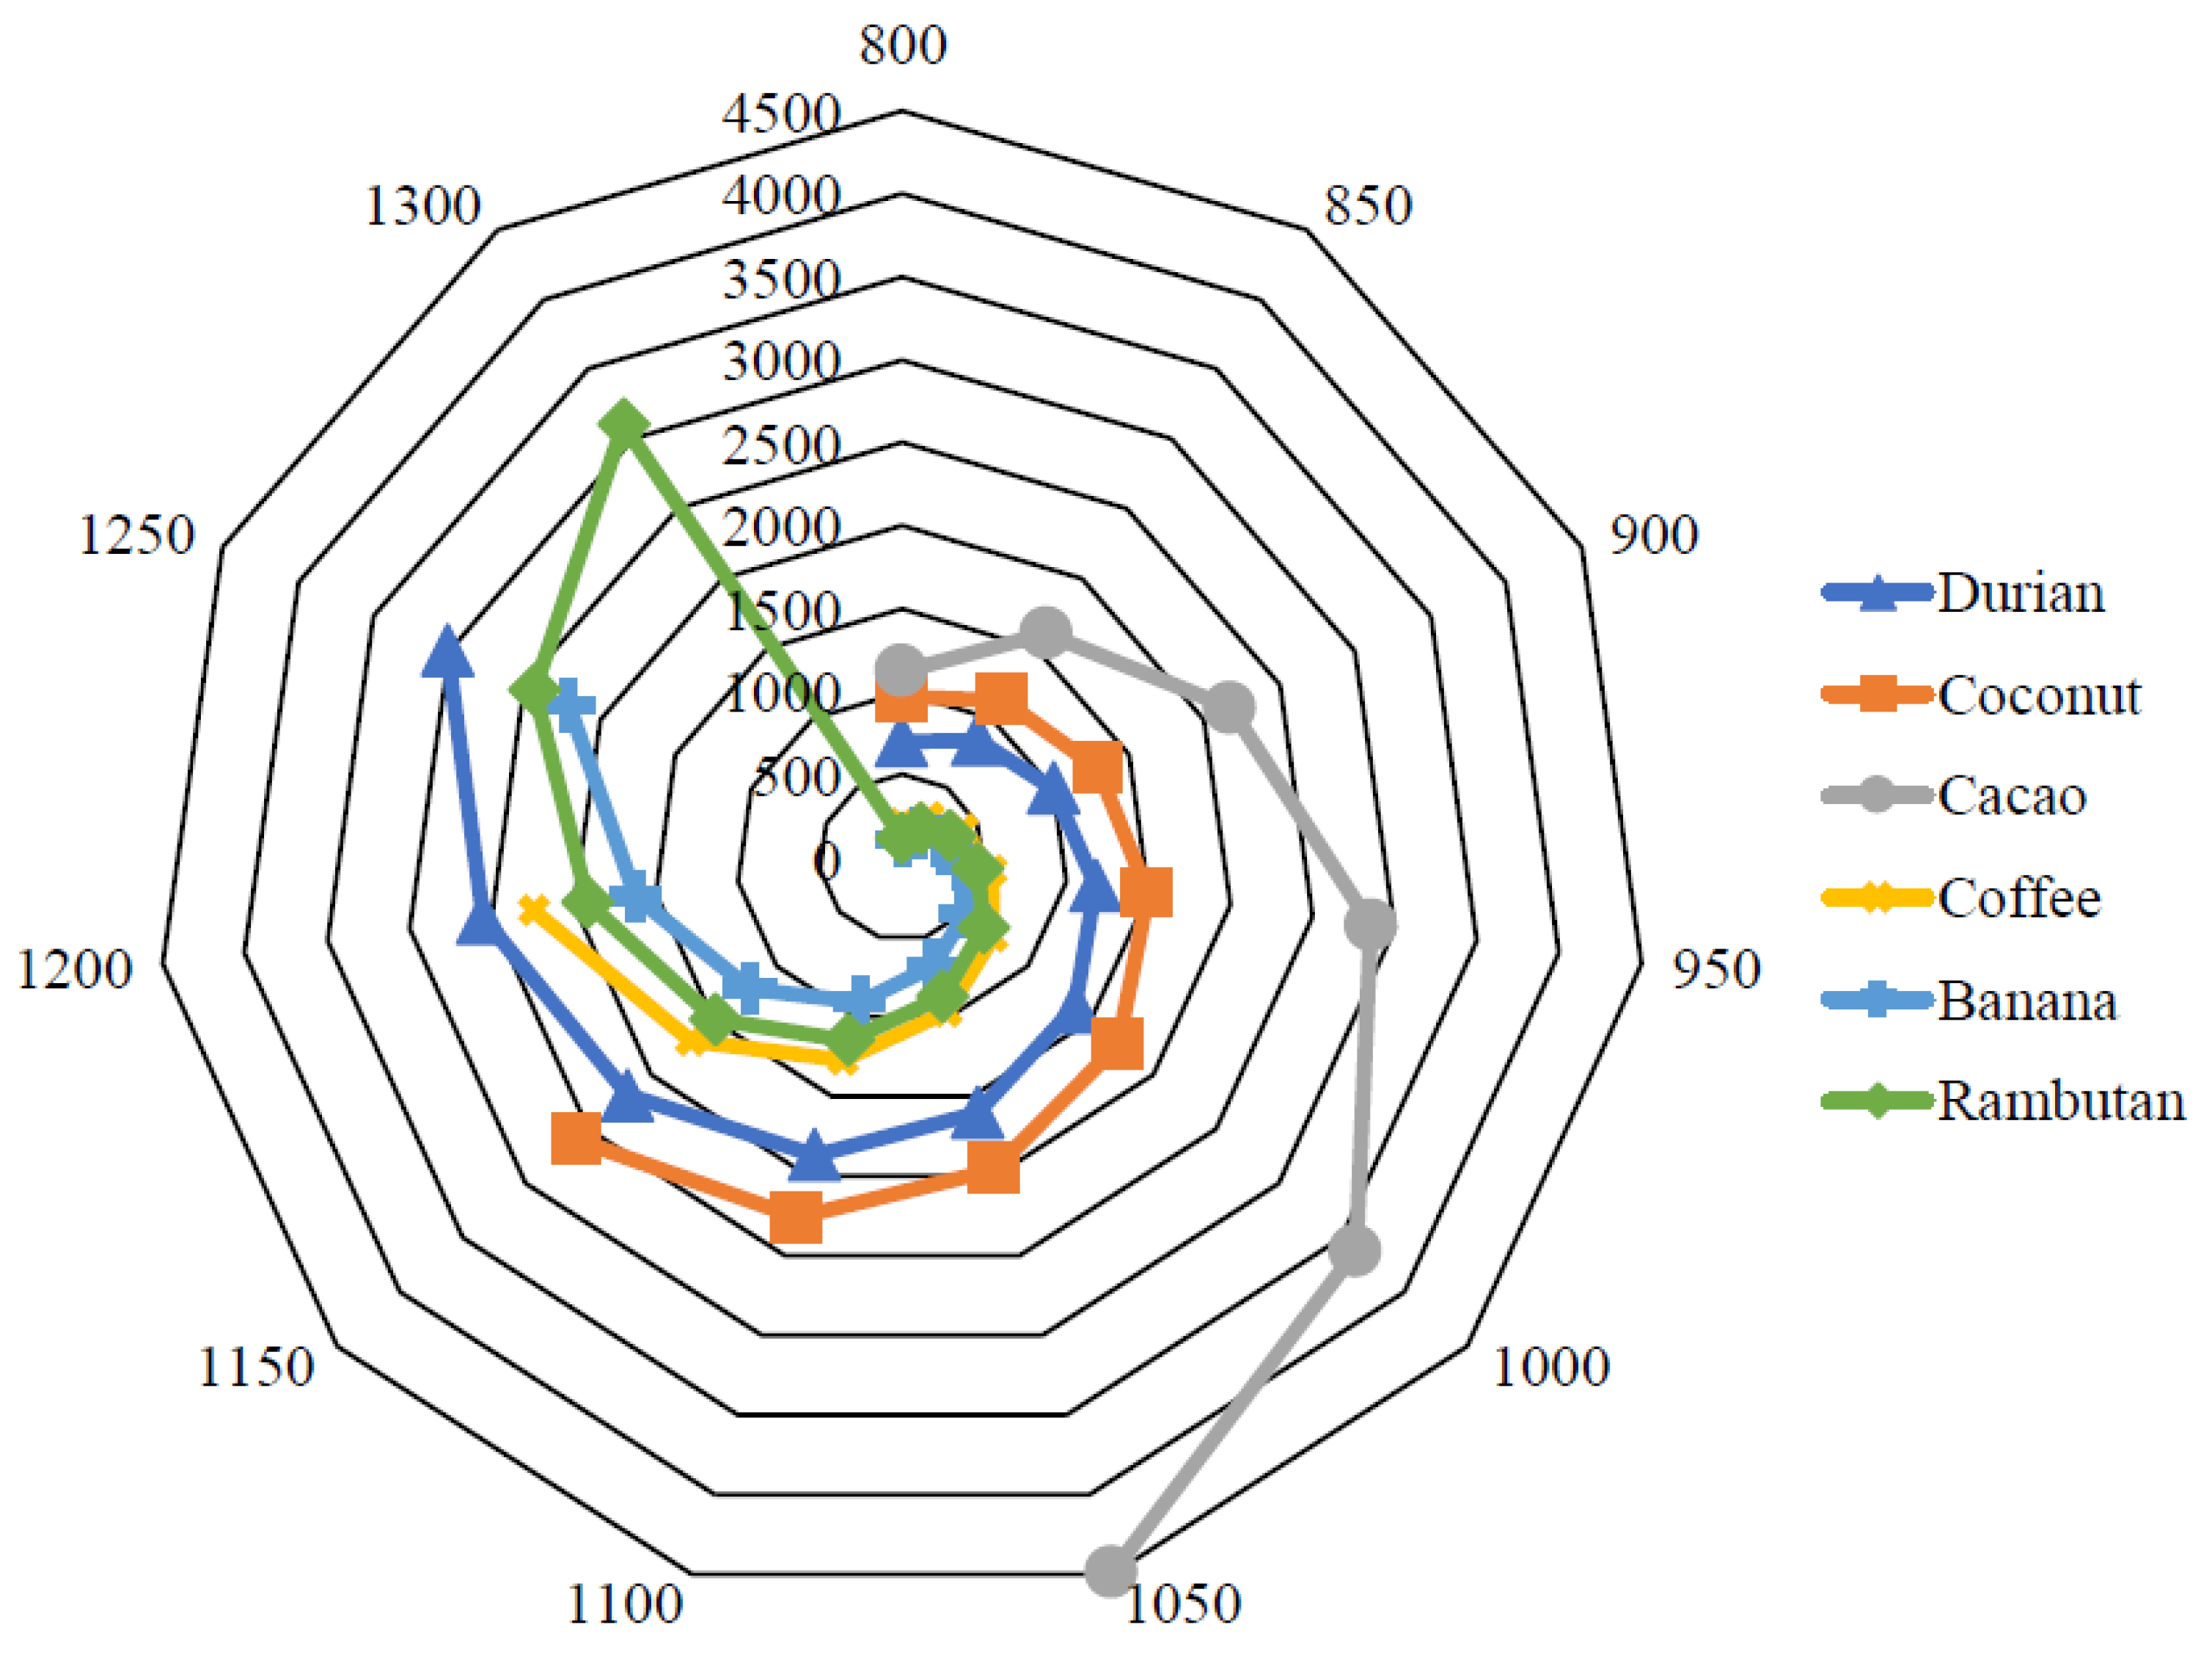
The process of increasing deformation energy E
d, which plays a role in the energy demands of briquetting process, is expressed in
Figure 5. The biggest difference between consumed deformation energies E
d at specific levels of bulk density ρ was observed between bulk density ρ levels equal to 1050 kg∙m
−3, then 1000 and 950 kg∙m
−3. The fastest growth of required deformation energy E
d was observed for cacao fruit waste biomass bio-briquette samples. If we compare required deformation energy E
d of banana fruit waste biomass bio-briquette samples (lowest amount of consumed energy) with cacao fruit waste biomass bio-briquette samples (highest amount of consumed energy), the resulting values were more than ten times higher. In general, all investigated fruit waste biomass samples had similar results, with the exception of the above-mentioned cacao fruit waste biomass bio-briquette samples.
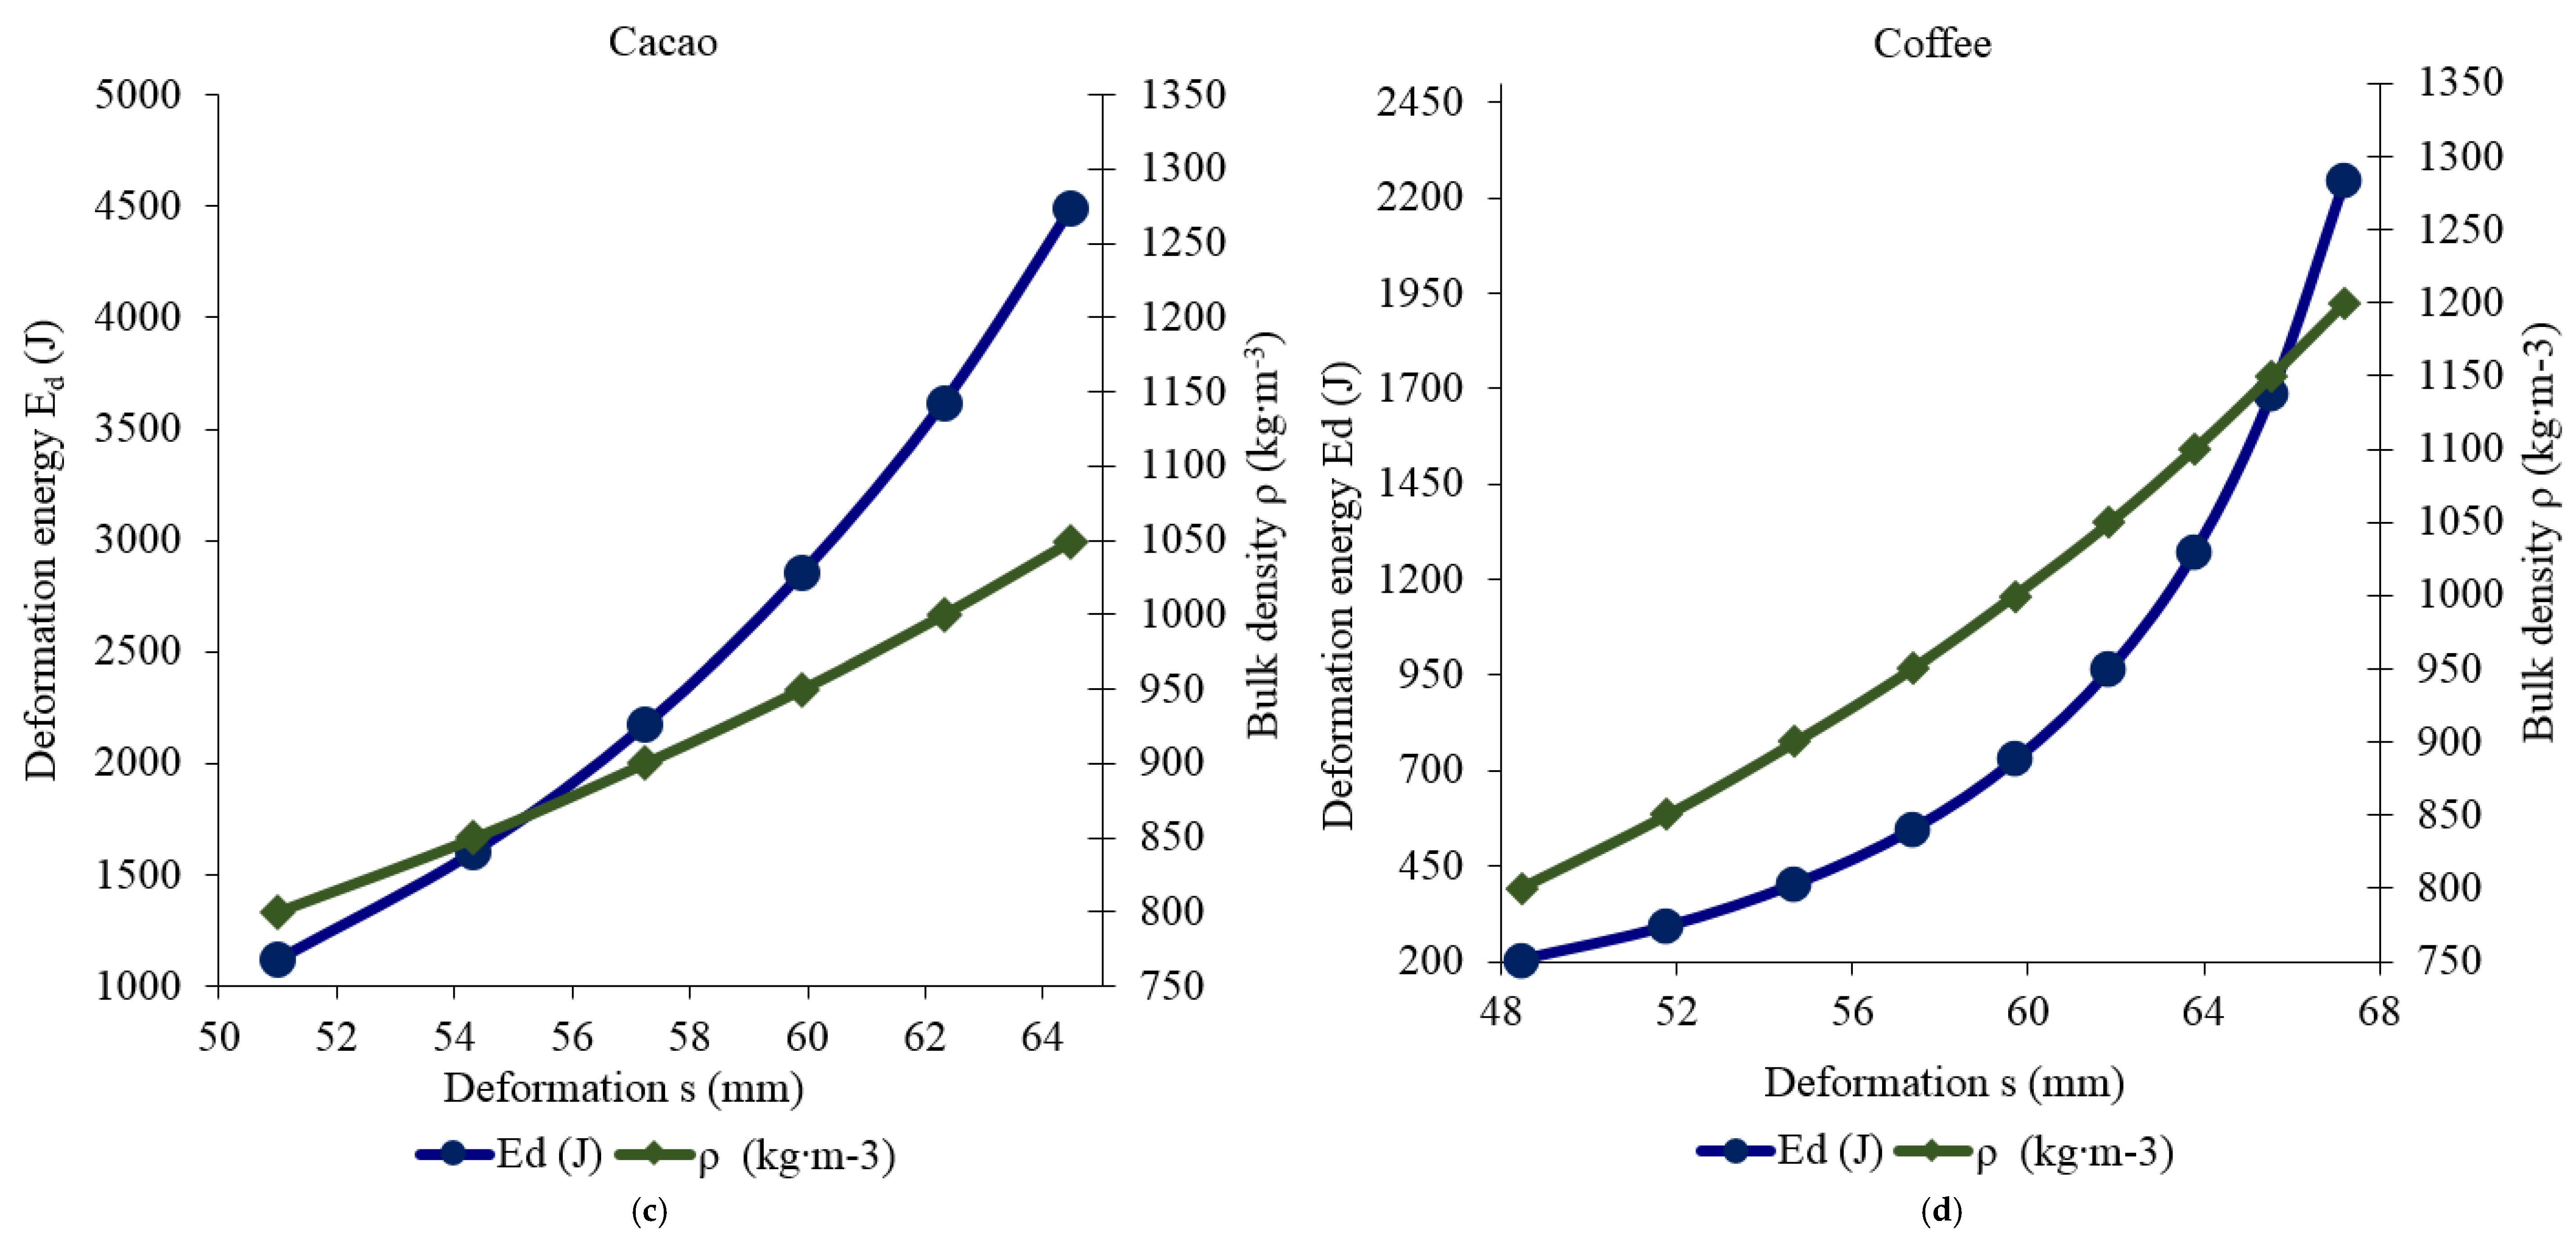
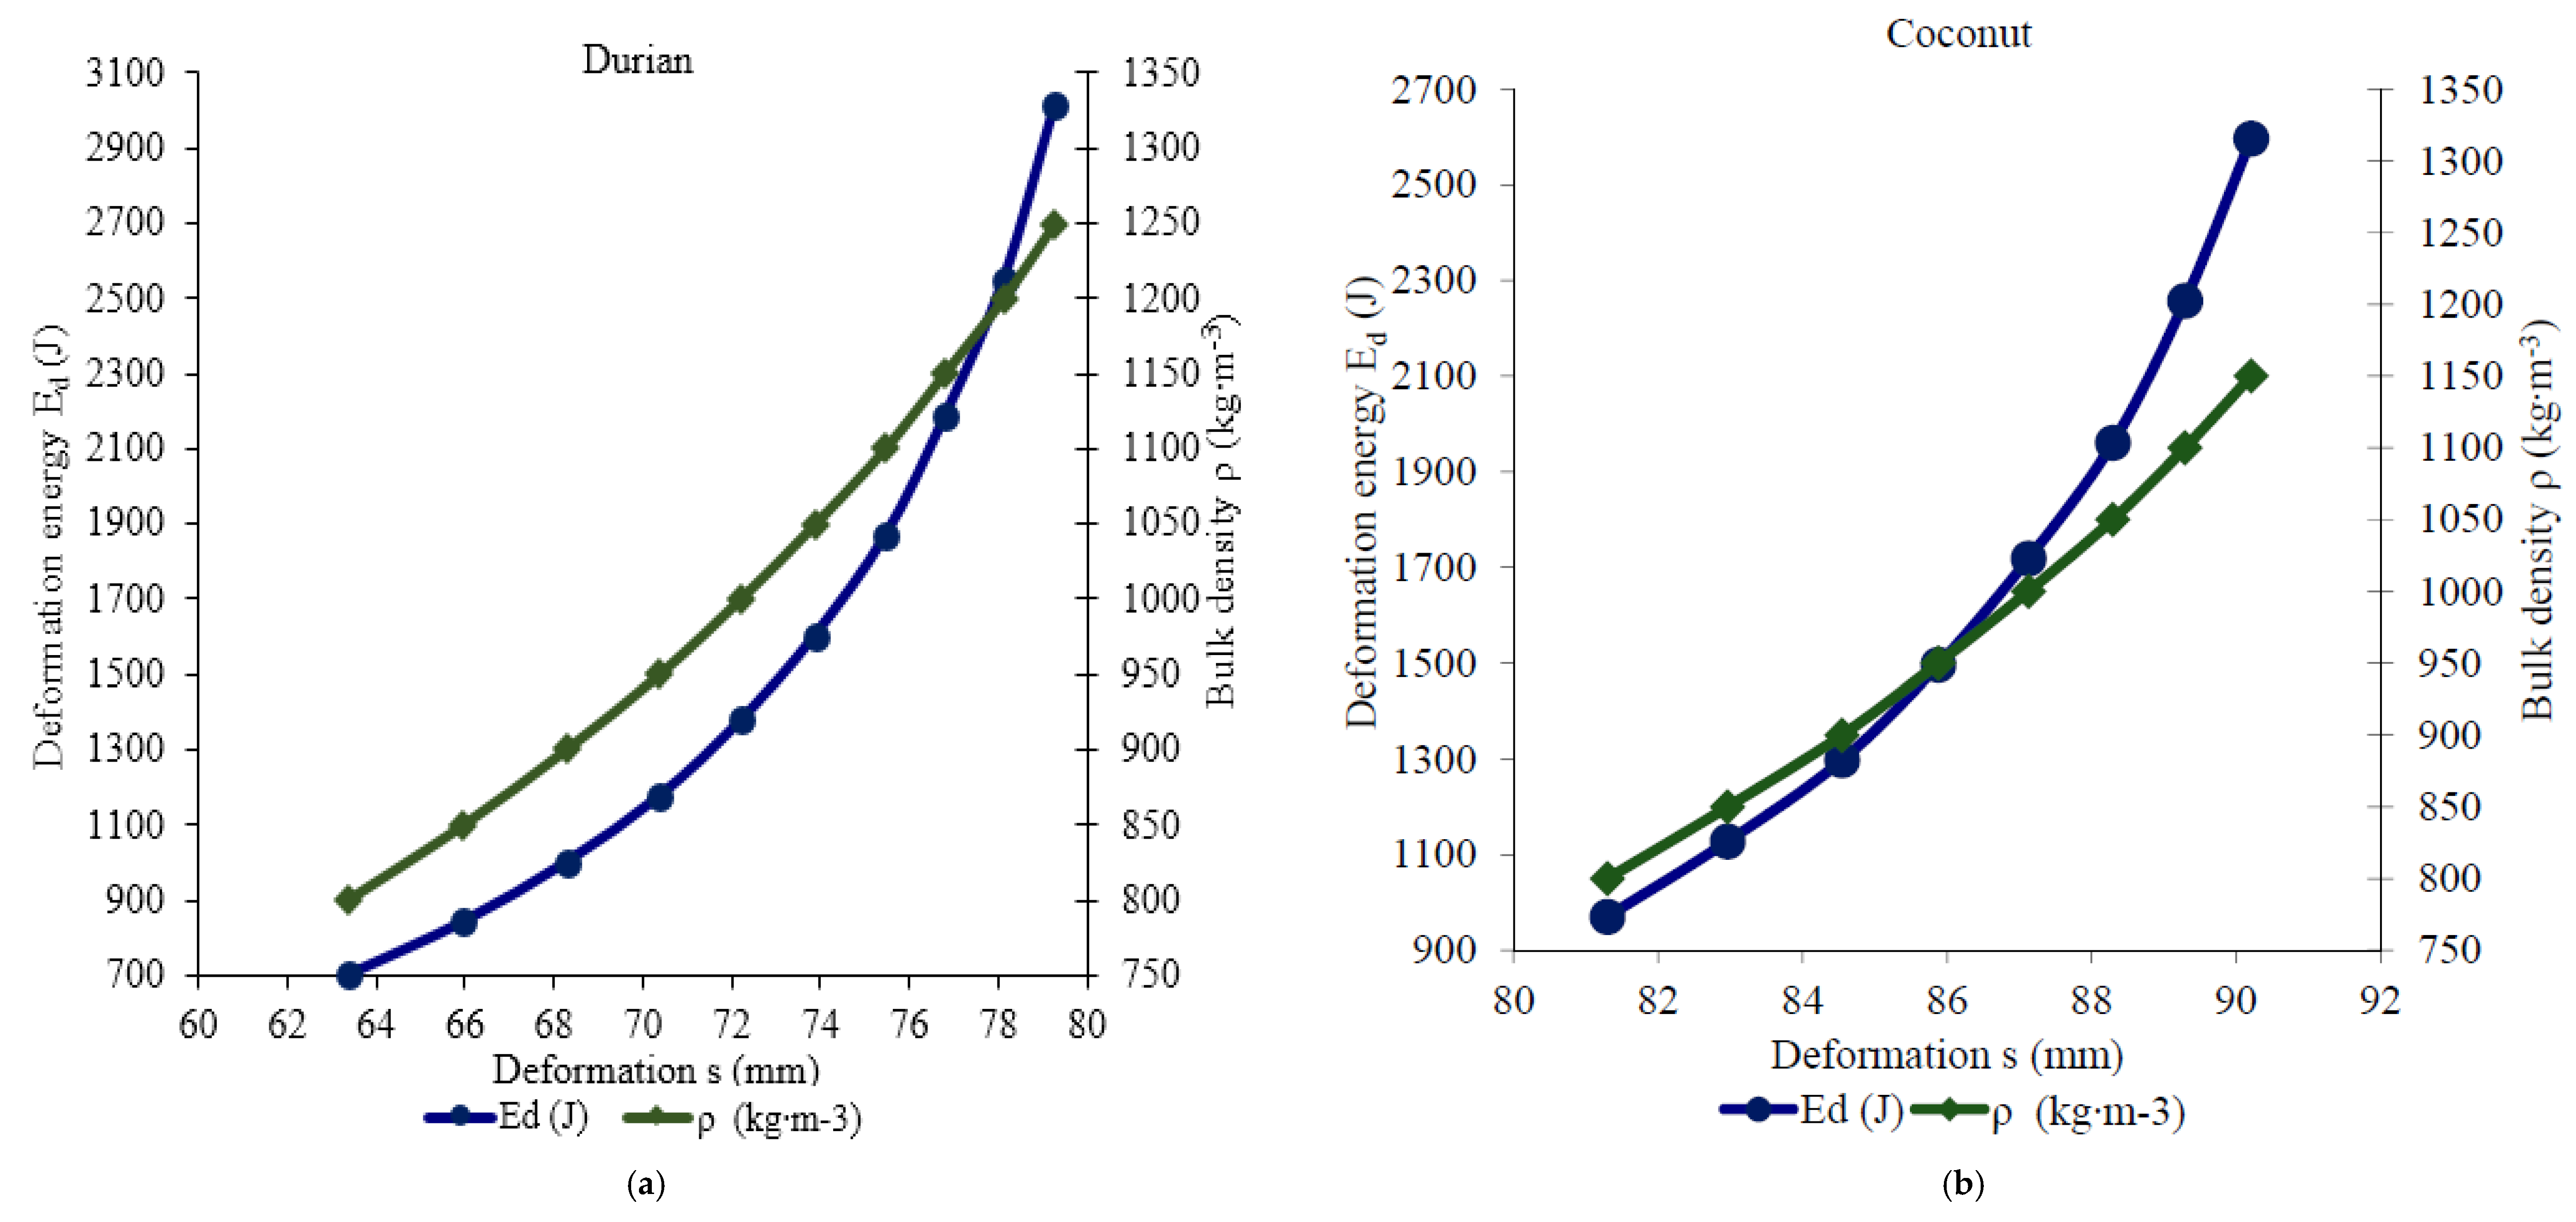
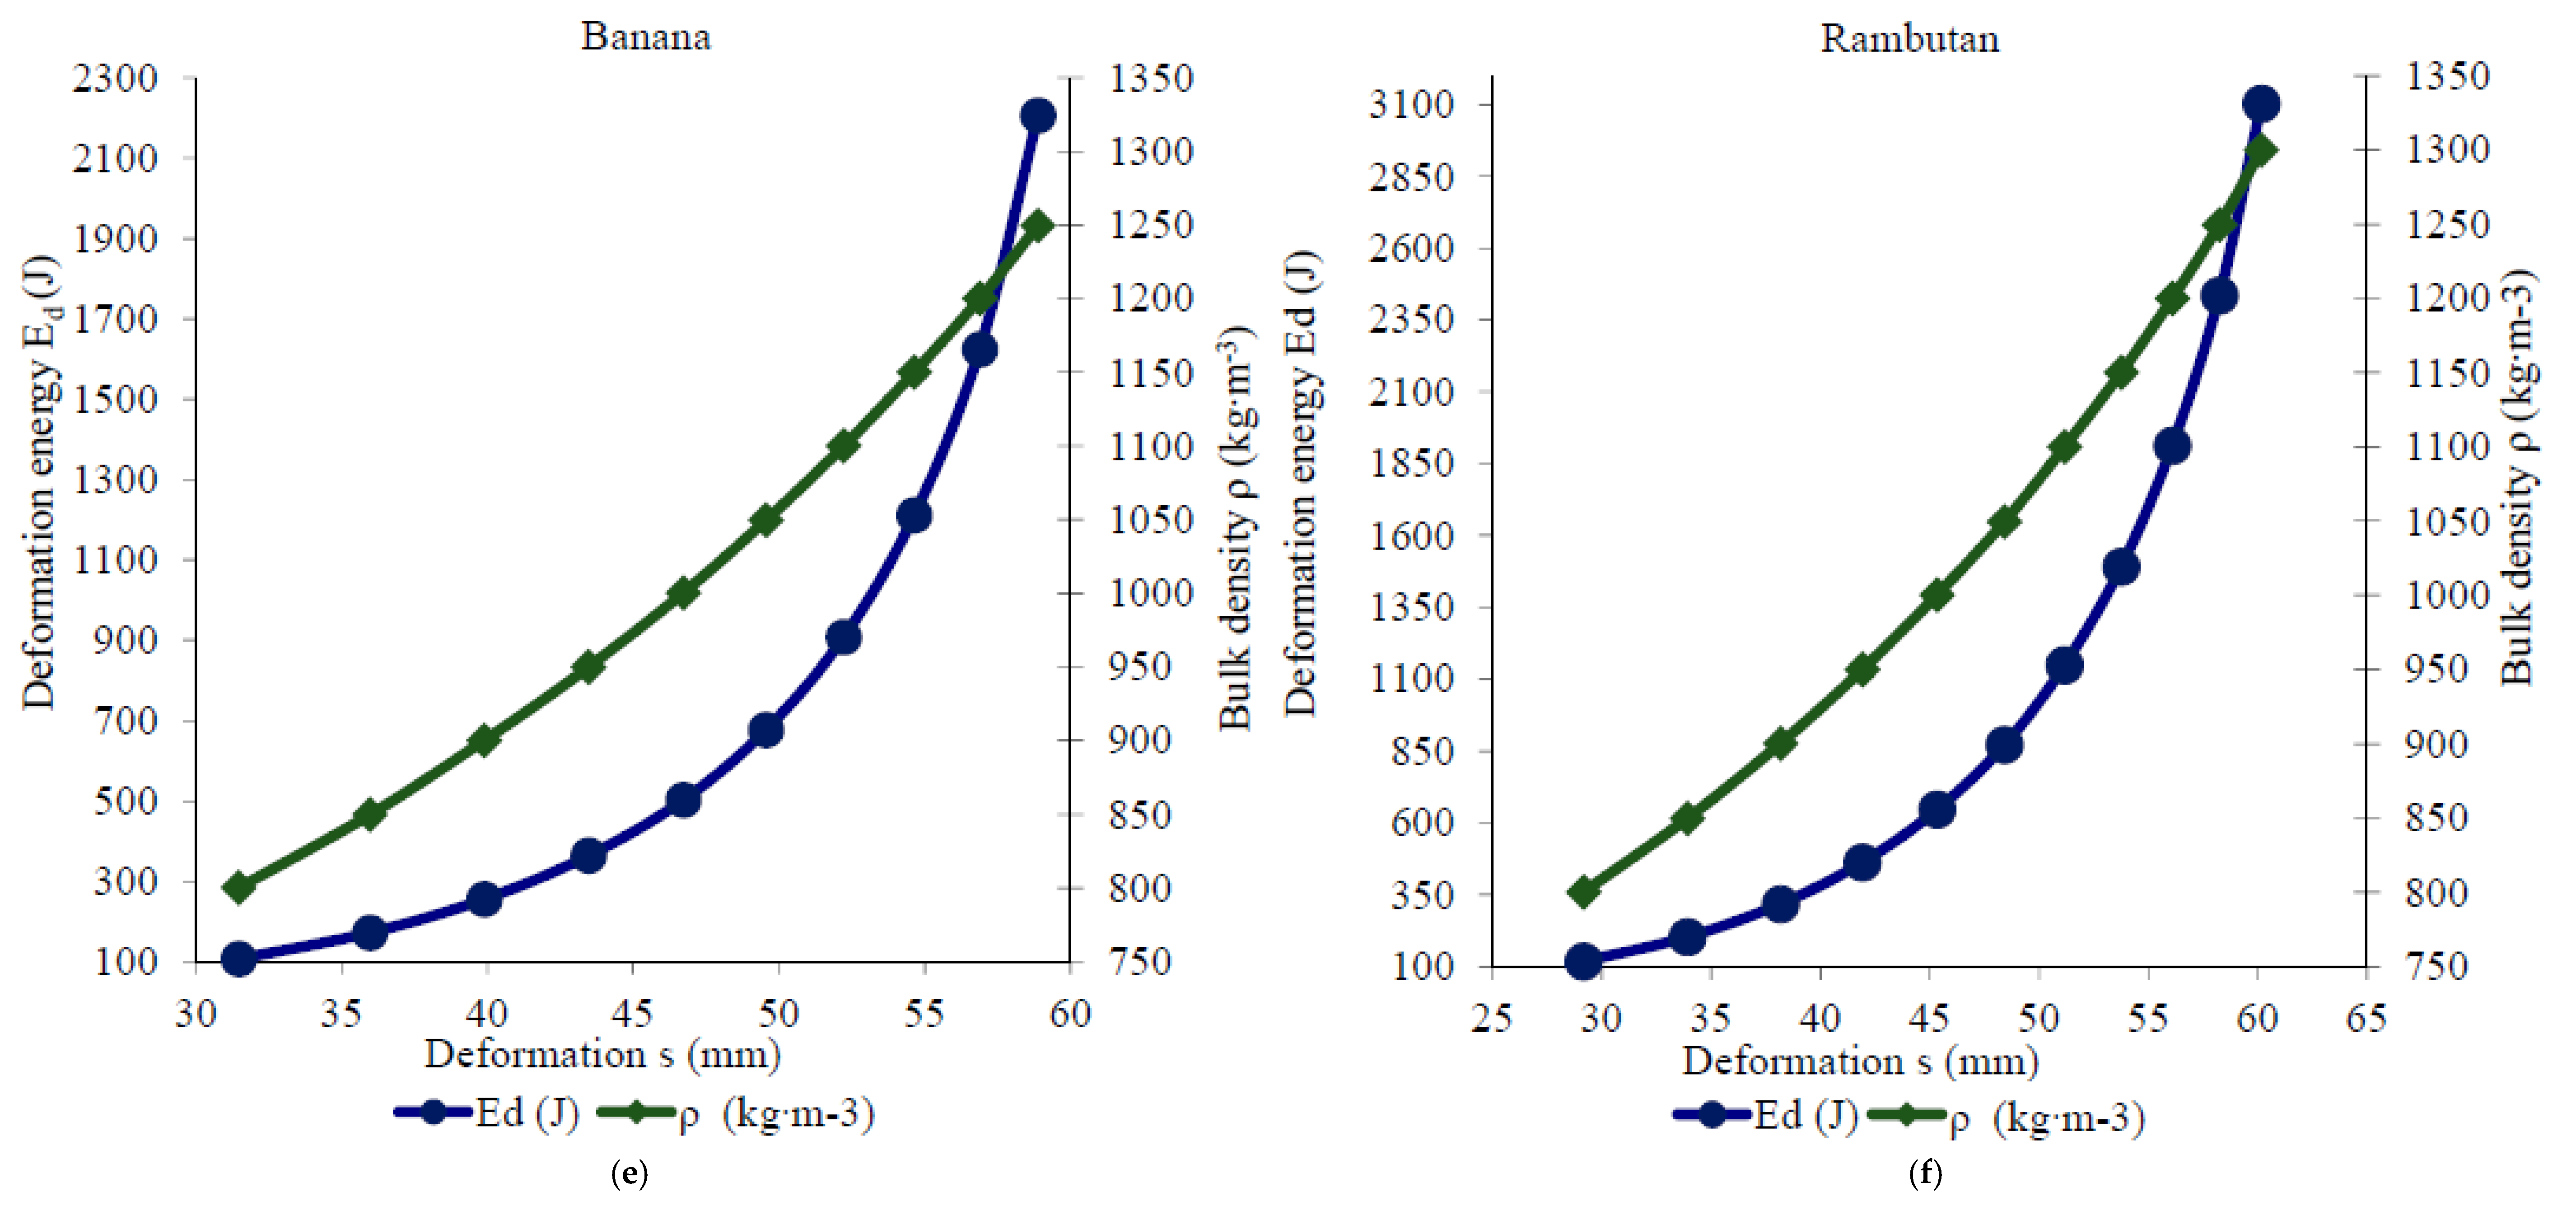
Figure 6 described the relationship between the increase of required deformation energy E
d and the increase of bulk density ρ. Expressed curves and their intersection point proved that the increase of consumed energy E
d is disproportionately faster than the increase in bulk density ρ from one specific moment; this was different for each investigated bio-briquette sample. Therefore, since this one specific moment during the densification process, it was not advantageous to continue in the compressing of feedstock material, thus, it was not advantageous continue in production of bio-briquette samples with higher level of bulk density ρ due to increased energy inputs.
Moreover, it must be considered that, according to standards and previous investigations, the bio-briquettes’ bulk density ρ in the range 800–1000 kg∙m
−3 is sufficient for high-quality bio-briquettes [
22,
64,
65]). Thus, production of bio-briquettes with higher bulk density is not necessary, and it is questionable if we should consider the high energy demands of such production.
The process of increasing both of the mentioned parameters (E
d, ρ) was different for each fruit waste biomass sample, but the maximal achieved volume densities ρ, which were still advantageous, were as follows (expressed in
Table 11).
It is important to realize that the production of biomass bio-briquettes obtained from the waste is feasible and easily reachable with on-site fuel [
20,
66]. Indonesia, similar to many other Southeast Asian countries, is in urgent need of alternative fuels to secure its future energy sources as well as improve the environment. Furthermore, biofuels derived from waste biomass and waste emerge as a great addition to renewable energy sources without compromising food production [
67]. Therefore, tropical fruit waste biomass for production of bio-briquette fuels can play a key role in providing a promising solution to the energy, food, and environment trilemma.
4. Conclusions
This paper extends the current state of knowledge of tropical fruit waste biomass as a potential source for bio-briquette production in Southeast Asia. Specifically, the exocarp (husk) and mesocarp (pulp, fibre) of durian (Durio zibethinus), coconut (Cocos nucifera), coffee (Coffea arabica), cacao (Theobroma cacao), banana (Musa acuminata) and rambutan (Nephelium lappaceum) fruits were investigated with the best results (suitability for stated purpose) achieved by durian, coconut and banana fruit waste biomass kinds.
The fruit waste biomass kinds that presented the highest likelihood of being produced originated from durian, coconut and cacao fruits (represented by the amount of waste biomass produced during fruit processing). Yet, statistical data, which described the harvested area (ha) and fruit yield (t·ha−1) of such tropical fruit kinds in Indonesia proved a great amount of theoretical potential for fruit waste biomass of coconut and banana fruit kinds.
Chemical analyses identified the waste biomass of durian, coconut and banana fruits as having the highest level of energy potential (combination of highest levels of calorific values and lowest levels of initial moisture, ash and oxygen content). Specifically, net calorific values achieved highest levels in case of fruit waste biomass originating from coconut, banana and durian samples (in that order). The lowest level of ash content was related to the rambutan, coconut and durian fruit waste biomass samples, while banana fruit waste biomass exhibited the highest level of ash content. Elemental composition of investigated fruit waste biomass kinds exhibited expected outcomes during combustion due to the level of oxygen content; however, banana, coffee and cacao fruit waste biomass kinds exhibited the best results (the lowest level). When focused on energy demands of such bio-briquette production and bulk density of final products, the results have shown that the best results (the lowest level of required deformation energy and of the highest level of bio-briquette bulk density) were achieved during production of rambutan, durian and banana fruit waste biomass bio-briquette samples. The highest amount of deformation energy was consumed during production of cacao fruit waste biomass bio-briquette samples, simultaneously with the lowest achieved level of bulk density. However, overall evaluation indicated a satisfactory level of bulk density (>1050 kg∙m−3) for all investigated bio-briquette samples. Thus, production of high quality bio-briquette fuel was proved. Moreover, production of such bio-briquettes was also supported by results of other studies, which proved its practicability and viability.
In conclusion, our results suggest that tropical fruit waste biomass is suitable material for bio-briquette production, offering a potential attractive energy source in Southeast Asian countries with many benefits, especially in rural areas. Moreover, it can bring environmental, social, market and development prospects.

 ,
, 


