Article

Bioethanol Production from Cachaza as Hydrogen Feedstock: Effect of Ammonium Sulfate during Fermentation

1
Energy, Materials, and Environmental Laboratory, Department of Chemical Engineering, Universidad de La Sabana, Campus Universitario Puente del Común, Km. 7 Autopista Norte, Bogotá 25001, Colombia
2
Doctoral Program in Biosciences, Faculty of Engineering, Universidad de La Sabana, Campus Universitario Puente del Común, Km. 7 Autopista Norte, Bogotá 25001, Colombia
3
Agroindustrial Process Laboratory, Agroindustrial Process Engineering, Universidad de La Sabana, Campus Universitario Puente del Común, Km. 7 Autopista Norte, Bogotá 25001, Colombia
*
Author to whom correspondence should be addressed.
Energies 2017, 10(12), 2112; https://doi.org/10.3390/en10122112
Submission received: 30 October 2017 / Revised: 27 November 2017 / Accepted: 8 December 2017 / Published: 12 December 2017
(This article belongs to the Section L: Energy Sources)

Abstract

:
Cachaza is a type of non-centrifugal sugarcane press-mud that, if it is not employed efficiently, generates water pollution, soil eutrophication, and the spread of possible pathogens. This biomass can be fermented to produce bioethanol. Our intention is to obtain bioethanol that can be catalytically reformed to produce hydrogen (H2) for further use in fuel cells for electricity production. However, some impurities could negatively affect the catalyst performance during the bioethanol reforming process. Hence, the aim of this study was to assess the fermentation of Cachaza using ammonium sulfate ((NH4)2SO4) loadings and Saccharomyces cerevisiae strain to produce the highest ethanol concentration with the minimum amount of impurities in anticipation of facilitating further bioethanol purification and reforming for H2 production. The results showed that ethanol production from Cachaza fermentation was about 50 g·L−1 and the (NH4)2SO4 addition did not affect its production. However, it significantly reduced the production of branched alcohols. When a 160 mg·L−1 (NH4)2SO4 was added to the fermentation culture, 2-methyl-1-propanol was reduced by 41% and 3-methyl-1-butanol was reduced by 6%, probably due to the repression of the catabolic nitrogen mechanism. Conversely, 1-propanol doubled its concentration likely due to the higher threonine synthesis promoted by the reducing sugar presence. Afterwards, we employed the modified Gompertz model to fit the ethanol, 2M1P, 3M1B, and 1-propanol production, which provided acceptable fits (R2 > 0.881) for the tested compounds during Cachaza fermentation. To the best of our knowledge, there are no reports of the modelling of aliphatic production during fermentation; this model will be employed to calculate yields with further scaling and for life cycle assessment.

Graphical Abstract

1. Introduction

Hydrogen fuel cells (H2-FC) are an attractive solution for supplying electricity due to their high efficiency compared to other technologies. The fuel cell operation and maintenance cost (O & M cost) has been reported to be reasonably lower (0.0019 $ kW−1) than that for other technologies such as turbine, photo voltaic, and wind turbine (the turbine O & M cost was 2.63 times higher than that of FC), with efficiencies of approximately 40–60% [1,2]. Moreover, a H2-FC avoids greenhouse gas (GHG) emissions when renewable H2 is employed [2].
H2 could be obtained from biomass by coupling a biological process that involves bioethanol production from a biomass and a catalytic process, which includes bioethanol steam reforming and purification of the H2 stream. In this process, it is possible to achieve higher H2 yields than other processes such as direct glucose steam reforming and H2 production from fermentative pathways, due to the ease of yeasts to transform sugars into ethanol and the use of stable and selective catalysts that can efficiently transform ethanol into H2 [3,4].
The biomass Cachaza, a type of non-centrifugal sugarcane press-mud, is an agroindustrial waste obtained from sugar mills and non-centrifugal sugar (NCS) facilities. This waste is produced after sugarcane juice clarification, and it was reported to be a relevant source of carbohydrates (32–56 wt %) [5,6,7,8]. In Colombia, Cachaza production is approximately 700 MTon year−1, and it is mainly employed as fertilizer and compost. However, such applications could have several drawbacks such as (i) health effects due to the presence of possible pathogens; (ii) water pollution; (iii) soil eutrophication; and (iv) GHG emissions due to improper disposal [9]. Rather than being used as a fertilizer or compost, up-grading Cachaza is more attractive in terms of environmental impact and the possibility of boosting NCS facilities. Due to NCS being one of the most relevant agroindustrial sectors in Colombia, the furtherance of new products from this sector could increase its performance, thus improving the farmers’ economic and social development.
Cachaza has been employed as an alternative source of valuable products throughout different conversion pathways. For instance, López-González et al. [6] assessed the methane (CH4) production from sugar cane press mud, achieving a yield of 337 mL CH4 per gram of volatile solids. Similarly, Kuruti et al. [10] evaluated the bioethanol and volatile fatty acids production throughout an acidogenic pathway by using a microbial consortium. Results showed that 40 kg ethanol and 270 kg volatile fatty acids could be obtained per ton of sugar press mud by this pathway. In addition, Ansari et al. [5] employed sugarcane press mud to produce chemicals through thermochemical pathways such as pyrolysis; they obtained a wide variety of valued by-products like gas and liquid hydrocarbons, alcohols, phenols, acids, aldehydes, ketones, and biochar. Radjaram et al. [11] developed a process to obtain H2 by the anaerobic decomposition of this waste, achieving 59 mol% H2 and 890 mL H2 per kg of press mud. Therefore, Cachaza has been identified as an alternative feedstock to produce a wide spectrum of products. Nevertheless, there are no reports of the Cachaza harness throughout a process that combines a biological and a catalytic process to produce H2. Therefore, this research paper highlights the production of bioethanol from Cachaza by a fermentative pathway, for its further conversion into H2 by a catalytic pathway.
Bioethanol concentration is a critical factor to produce electricity from biomass because higher bioethanol production represents a downstream energy savings and the lower amount of by-products represents a better catalytic performance. Thus, several authors have shown that an increase in the substrate concentration leads to a higher ethanol production. A lower water concentration in the bioethanol stream corresponds to a lower energy consumption for bioethanol purification [12]. For instance, Lu et al. [13] concluded that a proportional increase of final ethanol concentration was achieved between 10 wt % and 30 wt % solids, when corn stover was used as feedstock. Similarly, Siqueira et al. [14] assessed the effect of the initial soluble solids concentration (Brix) on the ethanol concentration from the fermentation of soybean molasses; they found that the highest ethanol concentration (i.e., 61.35 g·L−1 ethanol) was achieved under the highest amount of initial total sugars (i.e., 311 g·L−1 total sugar). Likewise, they found that there was a proportional increase of the ethanol concentration regarding sugar concentration. Alvira et al. [15] showed similar results. They found that there was also a proportional increase in the ethanol concentration, when the amount of steam-exploded wheat straw concentration increased during fermentation.
However, increasing solid content in the fermentation culture should be done carefully to not over-increase the osmotic pressure and it is not enough to achieve a proper fermentation performance. Hence, other nutrients such as peptone and yeast extract must be added to improve bioethanol production [16,17]. For instance, Hu et al. [18] optimized a glucose culture to improve ethanol production under high amount of glucose content (i.e., 300 g·L−1). They added peptone, yeast extract, Mg2+, and Ca2+ and produced 17.1 vol % ethanol. However, aliphatic components such as organic acids, aldehydes, ketones, and higher, branched alcohols such as 2-methyl-1-propanol (2M1P) and 3-methyl-1-butanol (3M1B) can be enhanced and they are undesirable for further bioethanol steam reforming when acid catalysts are employed [19,20,21,22]. Among those components, Le Valant et al. [20] reported that those branched alcohols caused an important effect on Rh/MgAl2O4 catalyst deactivation. Conversely, we reported that those alcohols can increase H2 production but in the presence of a very active, resistant RhPt/CeO2 catalyst [3]. Other authors have assessed the bioethanol steam reforming to produce H2 by employing bioethanol obtained from different agroindustrial matrices, such as wheat [21], wood [23], and sugarcane [24]. However, to the best of our knowledge, there are no studies focused on the bioethanol production with suitable characteristics (i.e., low branched alcohols) for its further conversion into H2 by catalytic steam reforming. Therefore, it is relevant to assess some strategies to control the formation of those branched alcohols during fermentation. Nitrogen addition could be a possible strategy to control their formation.
Nitrogen is an essential nutrient during fermentation because it influences both yeast growth and metabolism. In addition, nitrogen deficiency is the main cause of sluggish fermentation [25]. The fermentation rate, ethanol tolerance, yeast cell growth [26], and by-product formation are affected by variations in the amount and the source of nitrogen in the culture media. Saccharomyces cerevisiae (S. cerevisiae) cannot assimilate certain nitrogen sources such as nitrate, nitrites, proteins, and polypeptides because it is a non-diazotrophic and non-proteolytic organism [27]. Thus, other nitrogen sources such as ammonia and amino acids should be employed as nitrogen sources in fermentation [26]. The addition of ammonium salts to the culture media can induce a decrease in the production of higher alcohols. Vidal et al. [28] found that the addition of (NH4)2SO4 influenced the gene expression related to the Ehrlich Metabolic Pathway (EMP), producing an exhausting higher alcohol generation during the production of industrial Cachaça (i.e., Brazilian white spirit beverage). Hernadez-Orte et al. [29] suggested that the presence of ammonia during the fermentation of a synthetic media, which simulates a standard grape juice, decreased the amount of higher alcohol formation. Beltran et al. [30] stated that higher alcohols could also be produced by the biosynthetic pathway of amino acids during synthetic grape must fermentation. Both pathways, Ehrlich and de novo amino acids, produce α-keto-acids, which are mainly responsible for the formation of higher alcohols, as demonstrated by Nördstrom using brewer’s yeast [31]. (NH4)2SO4 has been widely employed to control the formation of aliphatic compounds for beer and wine production [28,29,32]. However, there are no reports of the use of (NH4)2SO4 to control those components in bioethanol for energy applications.
Accordingly, the aim of this work was to assess the fermentation under different (NH4)2SO4 loadings for bioethanol production from Cachaza, employing a S. cerevisiae strain. The kinetic parameters for the production of ethanol and aliphatic compounds were estimated to determine the conditions that increased ethanol and reduced aliphatic compounds [33]. Those parameters were fit to the modified Gompertz model for ethanol, 2M1P, 3M1B, and 1-propanol production. As there are no reports of bioethanol production from Cachaza, this study is pertinent for providing new added value to this waste for energy applications.

2. Results and Discussion

Bioethanol production is a rate-determining step for electricity production in a FC from biomass by the catalytic transformation of bioethanol into H2. Therefore, a glucose culture optimized by Hu et al. [18] was selected as the reference because the highest ethanol concentration was achieved in that study. However, the formation of branched alcohols such as 2M1P and 3M1B was not followed in that study, but their control is desirable for the further catalytic conversion. In this study, the assessment of the production of ethanol, 2M1P, and 3M1B as well as ethyl acetate, 1-propanol, and 1-butanol was related to the addition of different (NH4)2SO4 loadings. The study was first performed using glucose as the control culture and then Cachaza as a new bioethanol source. In the following section, the effect of the (NH4)2SO4 loadings on the glucose culture is discussed.

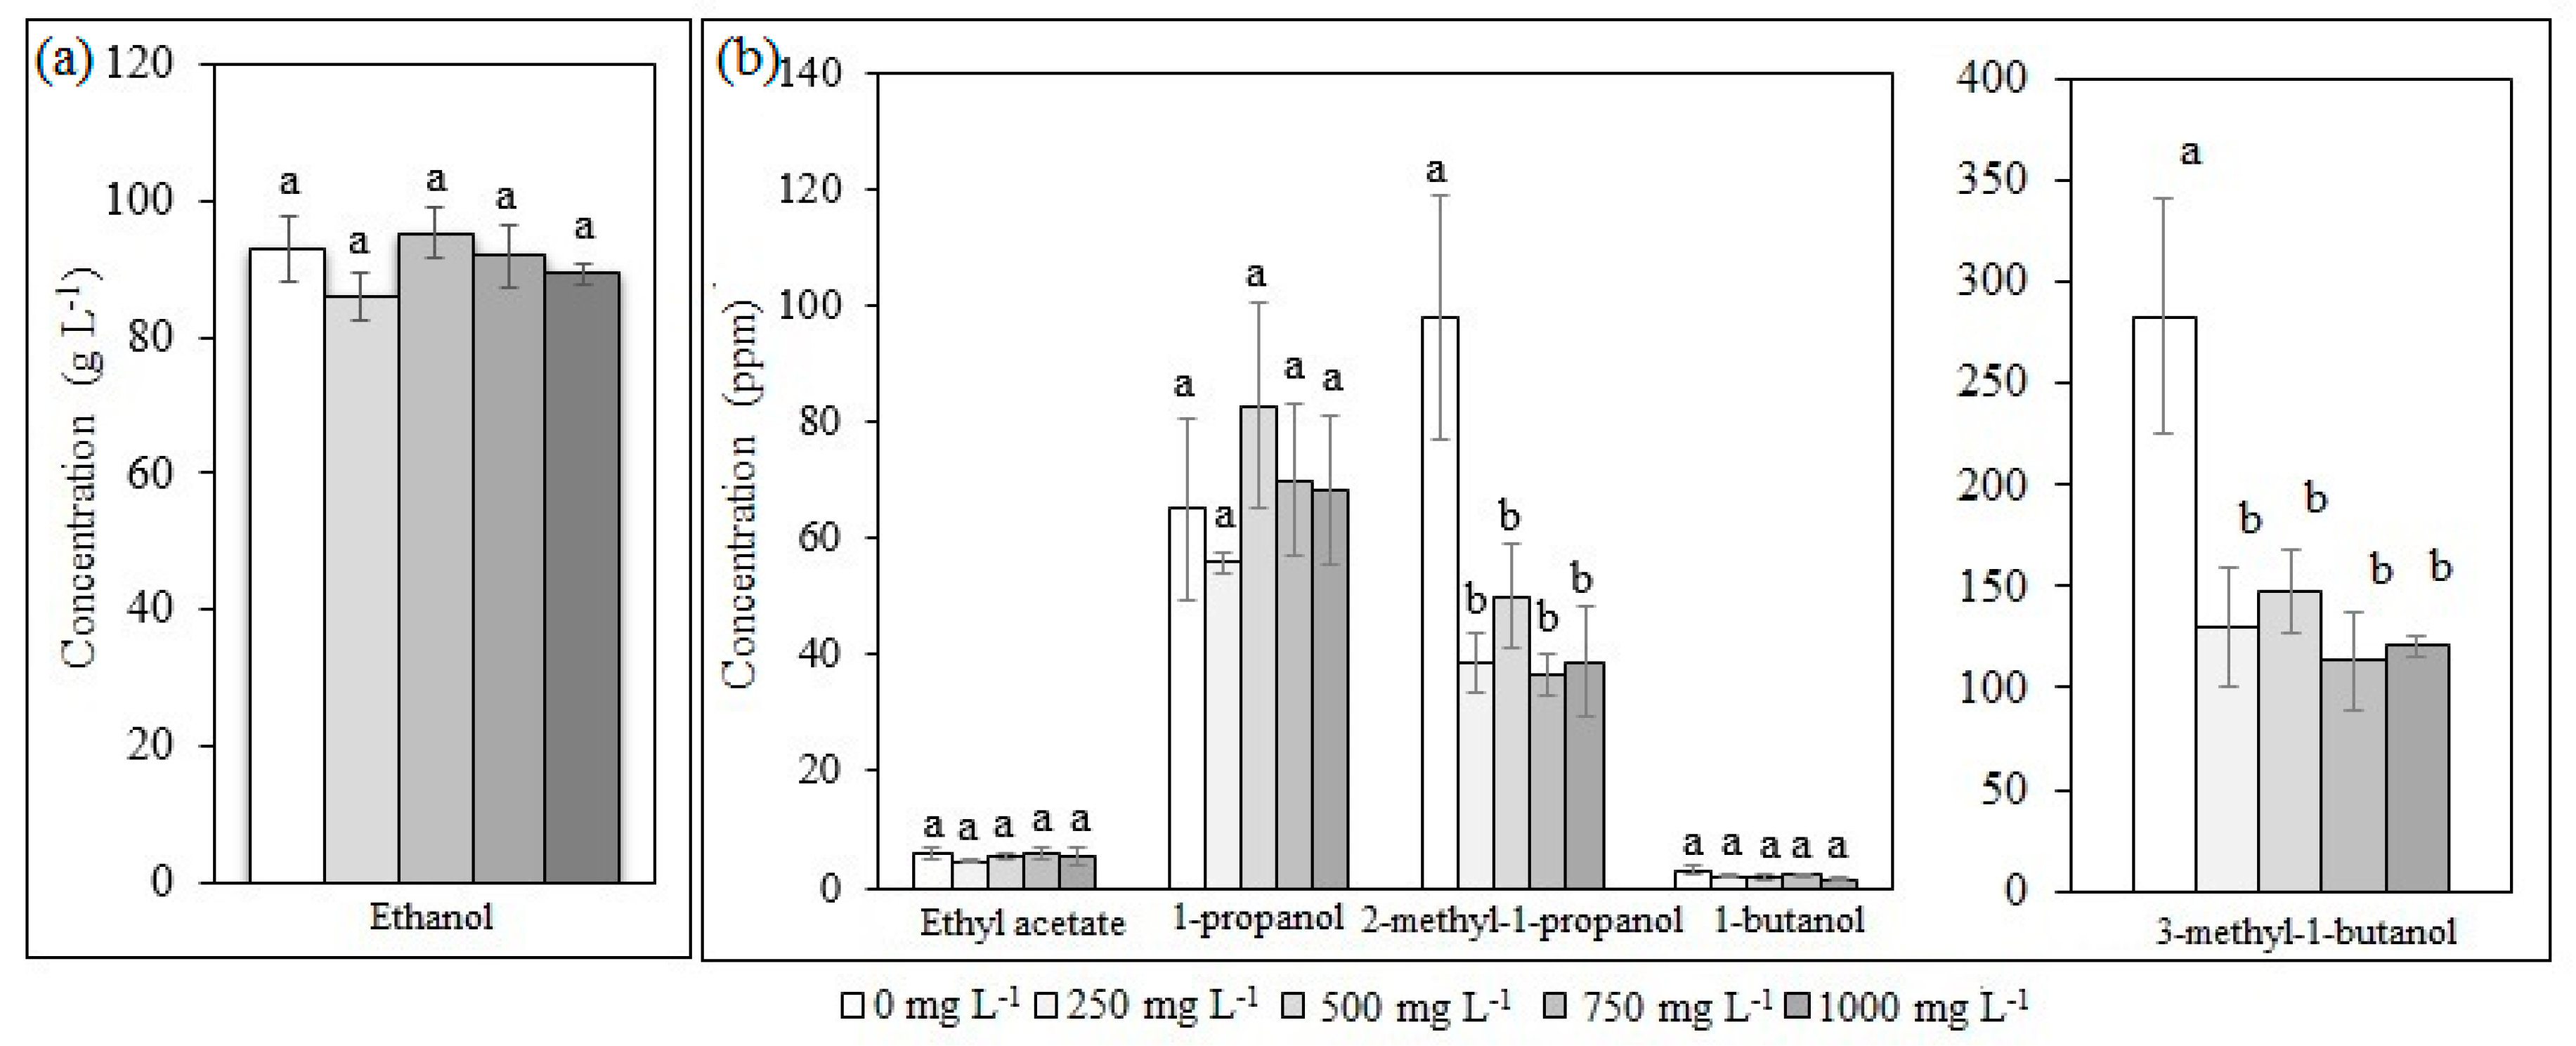
2.1. Ethanol and Aliphatic Production during Fermentation of Glucose

Synthetic glucose media (SGM) were prepared with various (NH4)2SO4 concentrations at pH 5.50 with the following composition: glucose 300 g·L−1, peptone 15 g·L−1, yeast extract 21.5 g·L−1, MgSO4·7H2O 1.5 g·L−1, and Ca3PO4 0.5 g·L−1 [18]. Figure 1a shows the ethanol concentration after a 24-h fermentation in which the effect of the (NH4)2SO4 loading on the final ethanol concentration was not statistically significant (p < 0.05) during glucose fermentation. However, the highest ethanol concentration (95.23 g·L−1) was recorded when 500 mg·L−1 (NH4)2SO4 was added, with an average productivity of 3.8 g·L−1·h−1. Ethanol production was not affected by the addition of (NH4)2SO4, likely because other substances such as peptone and yeast act as additional nitrogen sources in the absence of (NH4)2SO4 [16].
Conversely, significant differences were recorded for branched alcohols (i.e., 2M1P and 3M1B), as shown in Figure 1b. 3M1B had the highest production after a 24-h fermentation (282.9 ppm), followed by 2M1P (97.74 ppm), 1-propanol (65.09 ppm), ethyl acetate (5.89 ppm), and 1-butanol (2.86 ppm) when (NH4)2SO4 was not added. Several studies reported that 3M1B was obtained in higher concentrations than the other components assessed in this study [3,30]. However, there was a statistically significant reduction of this alcohol (p < 0.05) when 250 mg·L−1 (NH4)2SO4 was added to the medium, as shown in Figure 1b. In a similar manner, 2M1P was significantly higher (p < 0.05) in the absence of (NH4)2SO4 (97.74 ppm) than in its presence (<50.13 ppm). Nevertheless, as little as 250 mg·L−1 of (NH4)2SO4 was sufficient for achieving their reduction. Higher loadings did not significantly affect reduction.
Other studies reported a similar effect of the addition of (NH4)2SO4 on aliphatic components. For instance, Vidal et al. [28] assessed the effect of the nitrogen supply on the production of higher alcohols and esters in Cachaça fermentation (120 g sucrose L−1), using an industrial Brazilian strain of S. cerevisiae. They asserted that there was a measurable decrease in the higher alcohols content ascribed to (NH4)2SO4 supplementation. They suggested that (NH4)2SO4 addition downregulates the genes encoding decarboxylases and alcohol dehydrogenases of the EMP, which is a primary mechanism employed by yeast to produce higher alcohols. In addition, Clement el al. [32] reported a decrease in the content of 3M1B and 2M1P in the presence of ammonium pulses during the third stage of a four-stage fermentation device, probably attributed to amino acid synthesis pathways.
Regarding other metabolites such as ethyl acetate, 1-propanol, and 1-butanol, there was not a statistically significant difference (p < 0.05) in their concentration with different (NH4)2SO4 loadings. Thus, their formation could be associated with other fermentation parameters. Hence, a Pearson Correlation Coefficient (PCC) analysis was employed to determine whether fermentation parameters such as glucose conversion and biomass production were correlated with the formation of those metabolites. This analysis measures the strength of the linearity between two variables [34]. Table 1 shows the PCC for the tested parameters (i.e., ethanol, ethyl acetate, 1-propanol, 3M1B, 2M1P, 1-butanol, glucose conversion, biomass production, and colony unit formation).
According to these results, the formation of 3M1B and 2M1P is negatively correlated with the (NH4)2SO4 concentration, as expected. This negative correlation was also reported by Beltran et al. [30] during synthetic grape must fermentation. Production of these components is related to different metabolic pathways, especially to EMP, in which amino acids are degraded to the corresponding alcohols. Amino acids represent a source of assimilable nitrogen in worth fermentation [35]. For instance, leucine and valine are precursors of the formation of 3M1B and 2M1P, respectively. In this study, 3M1B and 2M1P formation could be associated with the EMP pathway because a transamination reaction is thermodynamically favored at a low nitrogen content [35]. Therefore, the 2M1P and 3M1B contents were higher in the absence of (NH4)2SO4 than if it was supplemented, as described in Figure 1b. The addition of ammonium affects the amino acid uptake and represses the catabolic pathways such as EMP [30,36], thus leading to lower concentrations of 3M1B and 2M1P. This process is associated with nitrogen catabolic repression (NCR). NCR is linked to the pattern of nitrogen uptake, due to the addition of proper nitrogen sources such as ammonium [30]. During NCR, yeast will avoid the uptake of the poorest nitrogen source, if a better source is available [37].
In contrast, the ethanol, ethyl acetate, and 1-propanol content are positively correlated (p < 0.05) with glucose conversion (Table 1). Ethanol is related to glucose consumption by the glycolysis pathway. In this pathway, glucose is converted to pyruvate, which is decarboxylated to acetaldehyde. This acetaldehyde is reduced to ethanol by alcohol dehydrogenase [26]. In addition, 1-propanol production is associated with 2-ketobutyrate [38,39,40], which is obtained from the decomposition of threonine [39,41]. Threonine synthesis is linked to glucose decomposition [32]. Higher threonine synthesis promotes higher 1-propanol production [41]. However, this effect was not statistically significant (p < 0.05) (Figure 1b), suggesting yeast did not synthetize that amino acid in large amounts. Because threonine is a poor nitrogen source and rich nitrogen sources were employed during the fermentation, threonine synthesis could be reduced by the NCR. Conversely, ethyl acetate is associated with Acetyl-CoA, which is formed by the oxidative decarboxylation of pyruvate [39,42]. It is well known that pyruvate is an intermediate product of the glycolysis pathway in yeast, so the positive correlation between ethyl acetate and glucose conversion could be associated with this mechanism.
Therefore, the fermentation of glucose in the presence of controlled amounts of (NH4)2SO4 is appropriate for ethanol production and the reduction of branched alcohols for its further transformation into H2. Ethanol was not significantly affected, but branched alcohols decreased considerably. This system was then employed for the fermentation of Cachaza in the absence and presence of (NH4)2SO4. Those results are discussed in the following section.

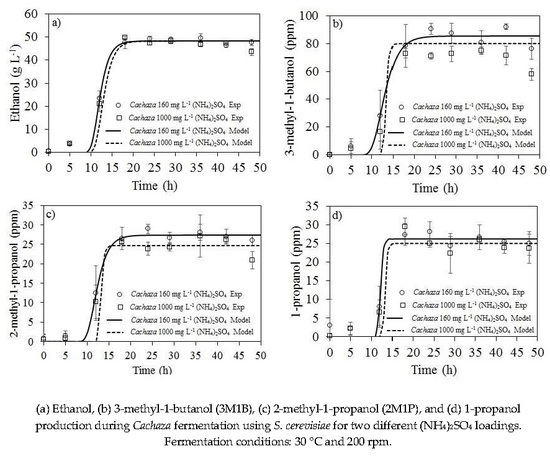
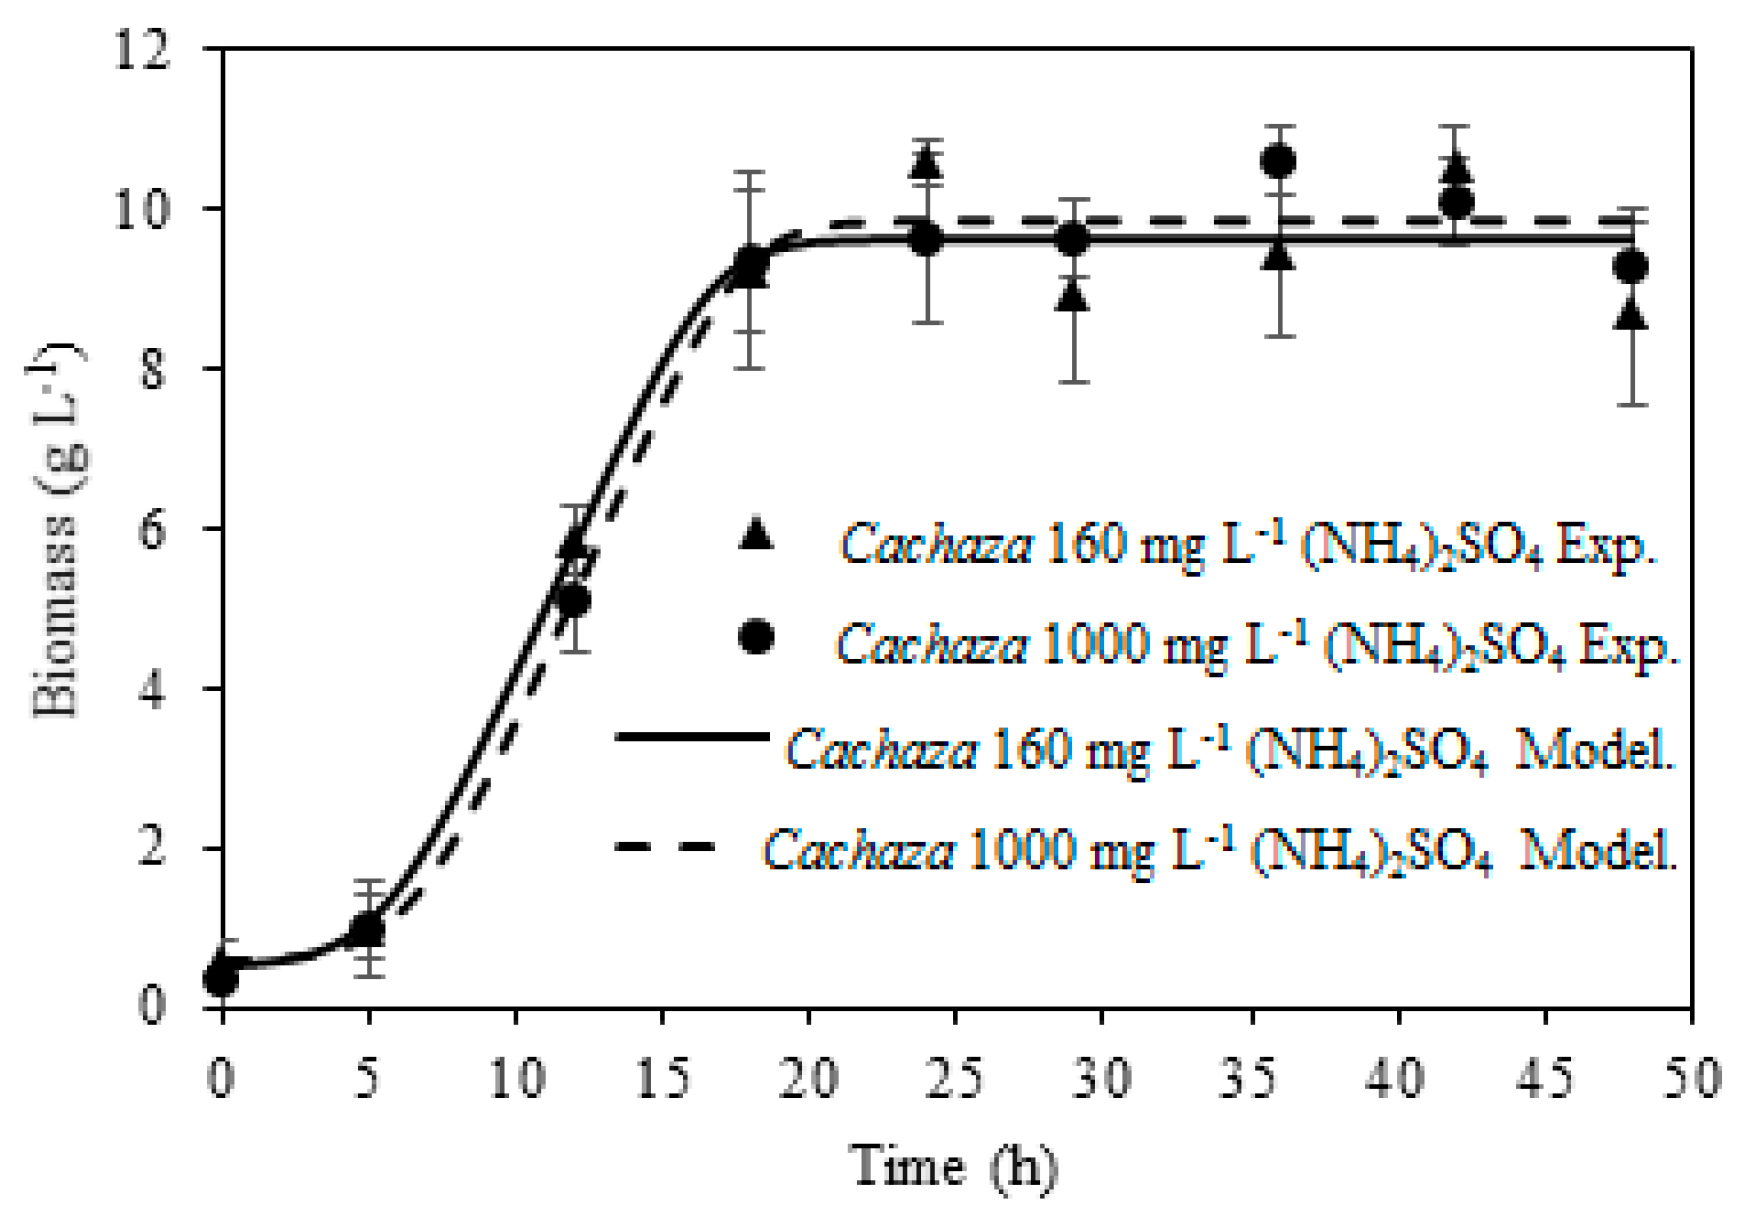
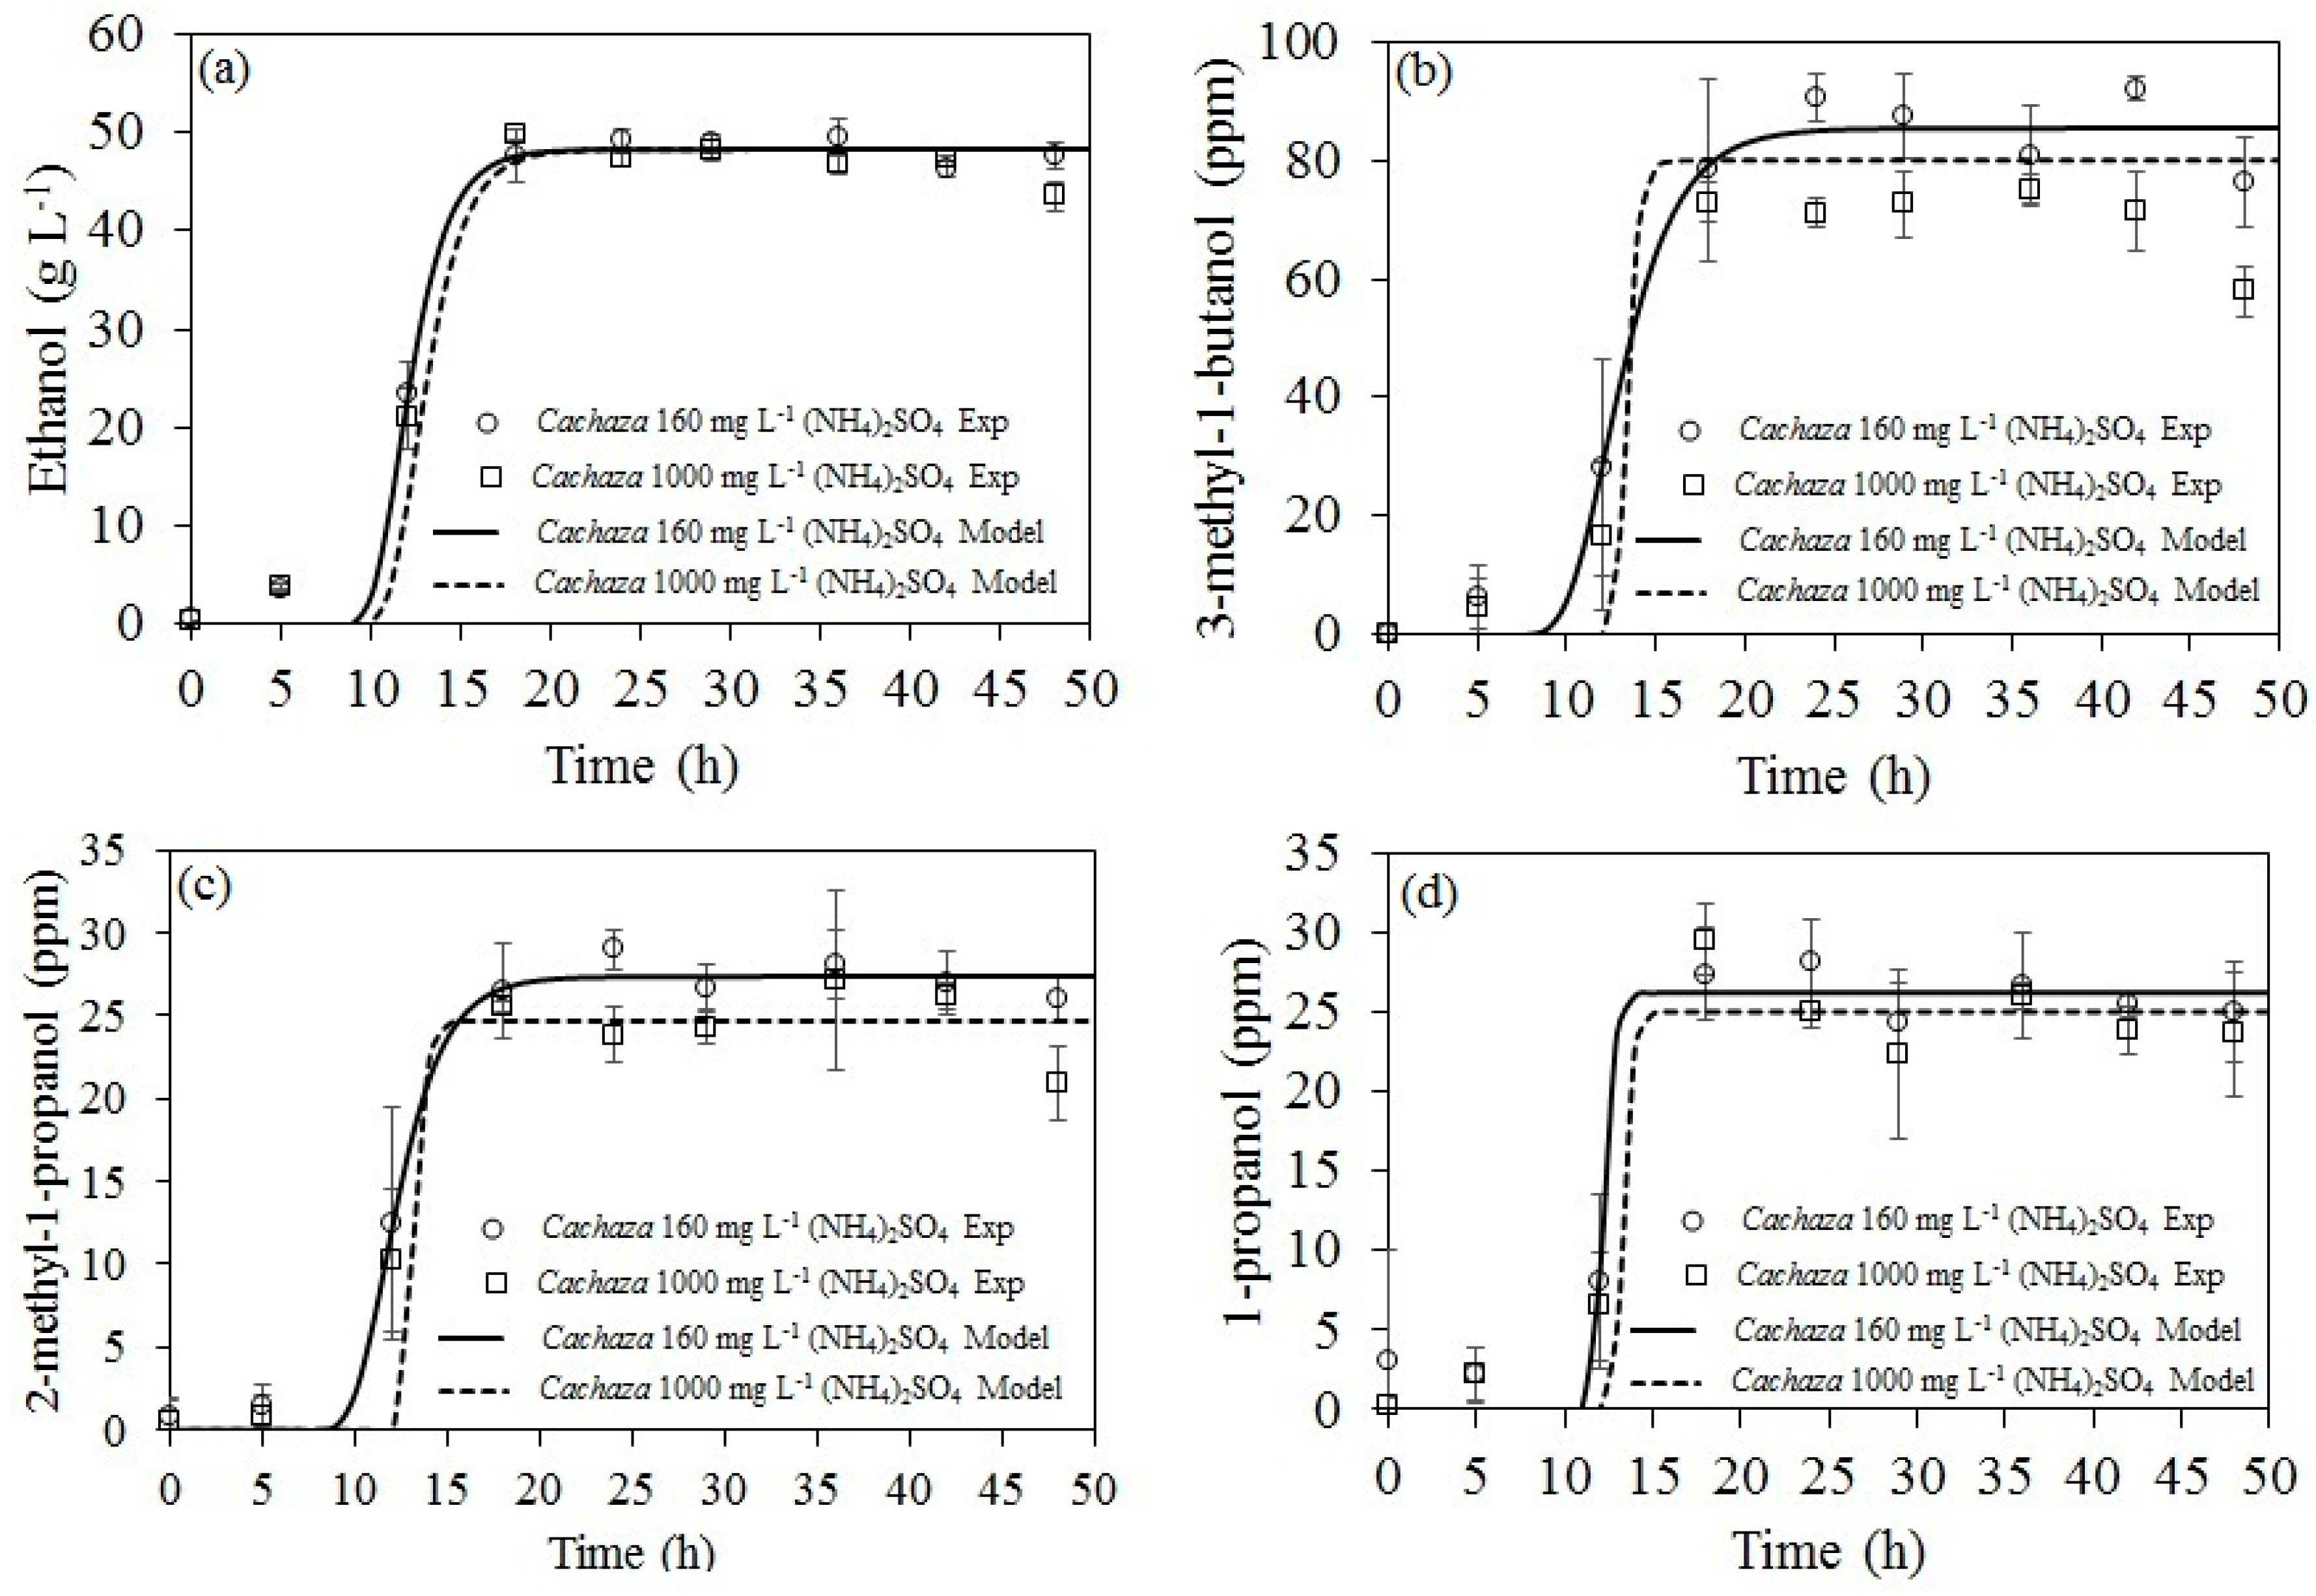
2.2. Ethanol and Aliphatic Production during Fermentation of Cachaza

Cachaza is an agroindustrial waste obtained from sugarcane juice clarification and has high moisture (i.e., 51.7 wt %) and carbohydrates (i.e., 41.1 wt %), of which 28.5 wt % are reducing sugars (Table 2) [43]. Hence, its use in fermentation could be appropriate for bioethanol production. A concentration of 300 g·L−1 of previously hydrolyzed Cachaza samples was supplemented with peptone 15 g·L−1, yeast extract 21.5 g·L−1, MgSO4·7H2O 1.5 g·L−1, Ca3PO4 0.5 g·L−1 [18], and (NH4)2SO4 loadings of 0, 160, and 1000 mg·L−1. Initially, Cachaza reducing sugar content was 85.5 g·L−1. However, when Cachaza was pretreated under acidic conditions, its reducing sugar content increased to 122.2 ± 4.8 g·L−1, due to the breakdown of higher sugar chains into reducing sugars by the catalytic effect of the H+ ions [44].
According to glucose fermentation results (Section 2.1), the sugar to (NH4)2SO4 ratio that allows for a reduction of the branched alcohols is 300 g·L−1 sugar/250 mg·L−1 (NH4)2SO4 = 1.2 g sugar/mg (NH4)2SO4. Therefore, the proper amount of (NH4)2SO4 added to Cachaza should be 1.2 × 122.2 g·L−1 sugar = 146 mg·L−1. Hence, 160 mg·L−1 was considered for Cachaza fermentation, to balance possible changes (±10%) of the more complex feedstock when using Cachaza. Pietruszka et al. [40] suggested that different feedstock could lead to a different by-products profile. Furthermore, an extreme 1000 mg·L−1 (NH4)2SO4 loading was tested to explore the effect of an excess of (NH4)2SO4.
Table 3 shows the effect of the (NH4)2SO4 loadings after 24-h Cachaza fermentation on the production of ethanol, 1-propanol, and branched alcohols (i.e., 2M1P and 3M1B). 1-butanol and ethyl acetate were not detected during Cachaza fermentation because their concentrations were lower than the limit of detection. According to Table 3, the addition of (NH4)2SO4 did not have a significant effect on the ethanol concentration (p < 0.05). Moreover, this ethanol concentration corresponds to the 50% of the ethanol production during glucose fermentation (Figure 1a). The same amount of substrate (300 g·L−1) was used in both cases, but Cachaza had 122.2 g·L−1 reducing sugar. Therefore, changing glucose by Cachaza as fermentation substrate is not having a negative effect on the ethanol production, because the ethanol production seems to be directly related to the reducing sugar content in the substrate, as mentioned before [13,14,15]. In this manner, an increase in Cachaza concentration in the fermentation medium would probably lead to an increase in the ethanol yield. However, fermentation parameters such as mixing conditions and solid content would change when increasing Cachaza and could become critical during fermentation, resulting in lower ethanol production [13,45]. For instance, Lu et al. [13] showed that higher solid content was able to increase ethanol production when corn-stover was pretreated by the steam-explosion method, followed by a washing process to remove fermentation inhibitors such as furfural and acetic acid. The inhibitors production increased after a pretreatment process and they were closely related to solid content. Modenbach et al. [45] suggested that the highest solid content indicated the lowest water availability and the higher the viscosity, thus affecting mixing conditions.
Branched alcohols production during Cachaza fermentation (Table 3) was also a fraction of that obtained during glucose fermentation (Figure 1b). 2M1P and 3M1P reduced their concentration in the presence of (NH4)2SO4 and 1-propanol increased it, as observed during glucose fermentation. As mentioned in Section 2.1, the addition of ammonium affects the amino acid uptake and represses catabolic pathways such as EMP, which are responsible for the formation of branched alcohols [46]. On the other hand, 1-propanol production could be associated with 2-ketobutyrate [38,39,40] obtained from the decomposition of threonine (and glucose) [39,41], as mentioned in Section 2.1.
In summary, the addition of 160 mg·L−1 (NH4)2SO4 to the Cachaza fermentation culture did not significantly affect ethanol production and suppressed 2M1P formation, but 1000 mg·L−1 (NH4)2SO4 would be necessary to significantly reduce 3M1B production. Moreover, an ethanol and total aliphatic production of 49.1 g·L−1 and 147.8 ppm, respectively, can be obtained with 160 mg·L−1 (NH4)2SO4 loading after 24-h fermentation. The kinetic parameters of the Cachaza fermentation were addressed to potentially explain the impact of (NH4)2SO4 on the biomass, ethanol, 1-propanol, and branched alcohol production. To the best of our knowledge, there are no studies reporting on the kinetic parameters of those branched alcohols. The kinetic parameters modelling were accomplished in order to predict fermentation products, so the decision on the (NH4)2SO4 loading could be carried out easily depending on the required bioethanol purity, and to move to an industrial scale [47]. In the next section, the kinetic parameters of a Cachaza culture supplemented with 160 and 1000 mg·L−1 (NH4)2SO4 are analyzed.

2.3. Kinetic Parameters Estimation for Biomass, Ethanol, 1-Propanol, and Branched Alcohol Production during Fermentation of Cachaza

The biomass kinetics were modeled according to the Baranyi & Roberts model. This model represents the microorganism growth behavior in terms of the maximum specific growth rate (μmax) and the lag phase time [48]. This model has been applied to estimate the growth parameters of different yeast strains such as Z. rouxii [49] and S. cerevisiae [50]. Figure 2 shows the biomass behavior for both (NH4)2SO4 loadings during Cachaza fermentation at 30 °C. The (NH4)2SO4 did not affect the biomass production. Table 4 lists all of the estimated kinetic parameters for this fermentation. Again, they did not show significant differences with the (NH4)2SO4 loadings (p < 0.05). The presence of other nitrogen sources such as peptone and yeast extract likely provided essential nutrients such as peptides, amino acids, vitamins, and other micronutrients that enhanced the growth of the yeast [16].
Differently, ethanol, 1-propanol, and branched alcohols were modeled according to a modified Gompertz model (Equation (2) in Section 3.5). The modified Gompertz model has been employed to model ethanol production from different biomass feedstocks such as sweet sorghum stalks [51], sweet sorghum juice [33], synthetic grape must [36], and sugar beet [47]. Such a kinetics model allows us to define specific parameters that may help to scale up the bioprocess [47]. Figure 3 shows the production of (a) ethanol, (b) 3M1B, (c) 2M1P, and (d) 1-propanol under the two different (NH4)2SO4 loadings, with Cachaza as the substrate. Ethanol production was similar for both (NH4)2SO4 loadings. The production of 1-propanol and branched alcohols started at approximately 8 h, which suggests that their production is closely related to the exponential growth phase of the yeast, which is shown in Figure 2. Those components are produced by the decomposition of certain amino acids, which is tied to the exponential growth phase [52]. Additionally, maximum growth and alcohol production were reached at approximately 15 h. A similar result was obtained by Landaud et al. [53] for beer fermentation at 16 °C.
Table 5 displays the parameters of the modified Gompertz model for the different analyzed aliphatic compounds. The data fitted the model well for ethanol (R2 > 0.969), 3M1B ((R2 > 0.926), 2M1P (R2 > 0.924), and 1-propanol (R2 > 0.881) production. Until now, no previous reports about the use of the modified Gompertz to model 3M1B, 2M1P, and 1-propanol existed. To validate the model, an AF (accuracy factor) and a BF (Bias factor) were employed. Values for these parameters were between 0.977 and 1.618, showing that a deviation existed between observed and predicted data. For instance, the AF was 1.618 and 1.257 for ethanol production in cultures supplemented with 160 mg·L−1 and 1000 mg·L−1 (NH4)2SO4, respectively, which means that there was a discrepancy of 61.8% and 25.7% for the ethanol concentration in those cultures due to an overestimate of ethanol production. In contrast, lower discrepancy values were achieved for the Gompertz model if only the exponential and stationary phases were analyzed. Indeed, the discrepancies under this assumption were 12.3% and 13.1% for cultures supplemented with 160 mg·L−1 and 1000 mg·L−1 (NH4)2SO4, respectively. The stationary phase was the most relevant phase for the downstream process. Therefore, a proper prediction for this phase could provide an accurate estimate of the data for the further downstream process.
For the alcohols 2M1P, 3M1B, and 1-propanol, the discrepancy of the accuracy factor was lower than for ethanol production. The values were less than 10% for a Cachaza culture supplemented with 160 mg·L−1 (NH4)2SO4. Only the exponential and stationary phases were considered in the analysis, and the bias factor was close to 1. This means that the modified Gompertz model could predict these metabolites during Cachaza fermentation at the tested conditions (i.e., 30 °C, 6 mL, 200 rpm).
On the other hand, these models allow an estimate of the kinetic parameters in terms of the maximum production, maximum product rate, and lag phase. As mentioned in Section 2.2, the maximum ethanol production during Cachaza fermentation was approximately 49 g·L−1, independent of the (NH4)2SO4 loading. The production of ethanol from Cachaza is acceptable if compared to other biomass matrices such as soybean molasses (34–60 g·L−1) [14], sugar beet (73.31 g·L−1) [47], and sugarcane (11–43 g·L−1) [54]. However, its production is lower compared to the 300 g·L−1 glucose culture, whose ethanol production was 87.5 g·L−1 under (NH4)2SO4 supplementation. Differences could be attributed to the initial reducing sugar content, which was 122.2 g·L−1 for Cachaza after hydrolysis. Hence, a higher Cachaza concentration in the fermentation culture would increase the reducing sugars and, hopefully, the ethanol yield until a certain point. Those results suggest that Cachaza could be employed as an alternate source for bioethanol production, thus expanding the biomass sources to produce renewable energies, which is desired for a sustainable world.
For branched alcohols, higher production rates (rpm) were achieved at higher (NH4)2SO4 loadings, as shown in Table 5. This could be related to the NCR because permeases for the branched-amino acids (BAP1 and BAP2) are induced in a nitrogen-rich medium [30]. Permeases allow for the transport of substances into the yeast cell [38]. In this case, BAP1 and BAP2 are associated with the transport of branched amino acids such as valine and leucine, precursors of the production of 3M1B and 2M1P, respectively, by EMP. Conversely, the 1-propanol production rate seems to not be affected by (NH4)2SO4. A possible hypothesis is that threonine synthesis occurs due to the presence of other parameters such as reducing sugar [55].
The employment of models with the appropriate kinetic parameters will allow estimates of the mass and energy balances of the fermentation process at larger scales, so further technical and environmental assessments can be carried out. Therefore, this study was focused on the analysis of an alternate use of Cachaza, which is not employed properly in the NCS facilities. The new alternative involves its conversion into bioethanol, which could be further converted into H2 by catalytic steam reforming. The new added value to this waste could help to boost the social and economic development of rural areas, through the upgrading of their biomass-based economy [56]. Further works must be focused on the transition of those laboratory tests into a pilot level to assess the feasibility of producing electricity in H2-FC.

3. Materials and Methods

3.1. Cachaza Collection

Cachaza was provided by a non-centrifugal sugar facility in Mogotes, Colombia (6°28′35″ N, 72°58′13″ W), in 2015; the samples were transported to the Universidad de La Sabana (Bogotá, Colombia) and immediately used for experiments. Cachaza was characterized by an external laboratory (General Society of Surveillance, SGS), which is accredited under ISO/IEC 17025:2005 for those parameters and the composition is shown in Table 2.

3.2. Yeast Activation and Inoculum Preparation

Yeast activation and inoculum preparation were performed according to Sanchez et al. [3]. Dry commercial, industrial S. cerevisiae yeast cells (Fermentis, Ethanol Red®, Marcq-en-Baroeul, France) were rehydrated in distilled water (1:2 w/v) and activated for 30 min at 30 °C. The yeast was kept in Potato Dextrose Agar (PDA, Merck, Darmstadt, Germany) until needed for experiments. Activated yeast was incubated in a YPD slant (yeast extract 10 g·L−1, peptone 20 g·L−1, glucose 20 g·L−1, pH = 5.50) on a shaker (Innova 42®, Eppendorf, Hamburg, Germany) at 30 °C and 200 rpm to give an initial yeast cell concentration of 107 colony forming units (CFU) per mL. This medium was used as the initial inoculum.

3.3. Ammonium Sulfate Screening

An initial screening of the (NH4)2SO4 concentration was developed. Five synthetic glucose media (SGM) were prepared with various nitrogen concentrations at a pH of 5.50, using (NH4)2SO4 (Scharlau, Spain) as an additional nitrogen source. (NH4)2SO4 were varied from 0 to 1000 mg·L−1. A SGM was used as the nutrient solution (glucose 300 g·L−1, peptone 15 g·L−1, yeast extract 21.5 g·L−1, MgSO4.7H2O 1.5 g·L−1, Ca3PO4 0.5 g·L−1). This culture has been previously optimized by Hu et al. [18] to produce an elevated ethanol concentration (i.e., 17 vol %). All media were sterilized at 120 °C for 20 min. Batch fermentation was performed in 100-mL flasks plugged with a cotton cap. The flasks were loaded with 40 mL of SGM and 10 vol % of the inoculum solution. The fermentation was carried out at 30 °C for 24 h under continous agitation (200 rpm) on a shaker (Innova 48®, Hamburg, Germany).

3.4. Cachaza Fermentation

300 g of Cachaza (wet basis) were hydrolyzed in an Erlenmeyer flask under the conditions described in Table 6. The amount of solid presented in Cachaza was 145.02 g·L−1, which is equivalent to 14.5 wt %. The amount of solid was calculated according to Equation (1), where Ci is the concentration (g·L−1) of the parameters described in Table 2, CCachaza is the initial loading of Cachaza (i.e., 300 g·L−1), and xi (i.e., 48.34 wt %) is the weight fraction of the parameter i shown in Table 2. Hydrolysis was performed to breakdown the non-reducing sugars into reducing sugars that the yeast could easily metabolize [44]. Prior hydrolysis, reducing sugar content was calculated according to Equation (1) (i.e., 28.5 wt %). Thus, the initial reducing sugar content was 85.5 g·L−1, which increased until 122.2 g·L−1 (43%) after hydrolysis. This value was determined by the 3,5-dinitrosalicylic method (DNS) method, as described in Section 3.5.
C i ( g L 1 ) = C C a c h a z a ( g L 1 ) × x i
A concentration of 300 g·L−1 Cachaza was supplemented as described in Section 3.3. Moreover, different (NH4)2SO4 loadings were added to the culture and the biomass, ethanol, and aliphatic production were followed. The media were sterilized at 120 °C for 20 min. Fermentations were performed in independent 15-mL falcon tubes for each fermentation time, with a total fermentation volume of 6 mL. Falcon tubes were loaded with 90 vol % of medium and 10 vol % of the inoculum solution. The fermentation was carried out at 30 °C for 48 h under continuous agitation (200 rpm) on a shaker (Innova 48®, Hamburg, Germany). During fermentation, independent samples (i.e., one falcon tube each time) were taken every 6 h to determine the biomass concentration (g·L−1), ethanol content (g·L−1), and aliphatic content (mg·L−1).

3.5. Analytical Methods

The biomass was quantified using the dry weight method. An aliquot of 1 mL of each sample was centrifuged at 12,000 rpm for 6 min at 4 °C (Z216 MK, Hermle, Germany). This procedure was repeated twice. Between each centrifugation, the pellets were washed twice with distilled water. Finally, all pellets were dried at 80 °C for 36 h [3]. Glucose was quantified using the DNS in a microtiter plate reader (IMarkTM, Bio-Rad, Hercules, CA, USA). All measurements were recorded at 595 nm, as described by Goncalves et al. [57]. Ethanol and aliphatic compounds were quantified by a gas chromatograph (Clarus 580 GC, Perkin Elmer, Waltham, MA, USA) equipped with an Elite Wax ETR column (60 m, 0.25 mm ID, Perkin Elmer, Waltham, MA, USA) connected to a Flame Ionization Detector (FID, Perkin Elmer, Waltham, MA, USA). Both the detector and injector temperatures were adjusted to 200 °C. The oven temperature was adjusted to 80 °C over 15 min [3].

3.6. Kinetic Parameter Estimation

Glucose conversion was estimated according to Equation (2). Biomass concentration data were fitted to the Baranyi & Roberts model using the DMFIT modeling tool (http://browser.combase.vv/DMFIT.aspx) to obtain the kinetic parameters μmax, lag phase time, and final biomass content, where μmax is the maximum specific growth rate (h−1) of the yeast. Ethanol and selected aliphatic components were modeled by the modified Gompertz (Equation (3)) model using Matlab® (R2016a, The Math Works Inc., Natick, MA, USA), where Pmax is the potential maximum concentration of the metabolite, rp,m is the maximum component production rate, TL is the lag phase time, and t is the fermentation time [33].
G l u c o s e   c o n v e r s i o n ( X G ) = I n i t i a l   G l u c o s e - F i n a l   G l u c o s e I n i t i a l   G l u c o s e
P = P max exp [ exp ( r p , m exp ( 1 ) P max ) ( T L t ) + 1 ]

3.7. Experimental Design and Statistical Analysis

For the (NH4)2SO4 screening, a one factor experiment with five levels was performed. The levels were equally spaced as 0, 250, 500, 750, and 1000 mg·L−1, and the nitrogen amount reported by Vidal et al. [28] (i.e., 1317.2 mg·L−1) was used as a reference. Three independent replicates of all experiments were done. The data were analyzed with SPSS software V24 (IBM, Armonk, NY, USA). A Duncan test (p < 0.05) was performed to determine significant differences among the treatments.
To validate the kinetic data for ethanol production, both an accuracy and bias factor were employed. Those indexes were proposed by Ross et al. [58] and modified by Baranyi et al. [59] as measurements of the deviation between the observed and predicted data. The accuracy and bias factors are described by Equations (4) and (5), respectively, where m represents the number of observations, ln (f(x)) represents the fitted values, and ln (f(µ)) are the observed values.
The ‘percent discrepancy’ between the model and the observations was also calculated for the Accuracy and Bias factors and is described in Equations (6) and (7), respectively, as proposed by Baranyi et al. [56]. The term sgn refers to the sign function. For instance, Bf < 0, sgn = −1; Bf = 0, sgn = 0; Bf > 0, sgn = +1.
Accuracy factor ( A F ) = exp ( ( ln f ( x ) ln f ( μ ) ) 2 m )
Bias factor ( B F ) = exp ( ( ln f ( x ) ln f ( μ ) ) m )
% D f = ( A F 1 ) × 100
% B f = s g n ( ln B f ) × exp ( | ln B f | 1 ) × 100

4. Conclusions

The use of Cachaza as a feedstock for bioethanol production could be a promising alternative to address environmental issues associated with its improper disposal. Specifically, it could be employed as a raw material for H2 production by a steam reforming process. To produce bioethanol that is desirable for H2 production (i.e., a high ethanol concentration with low aliphatic components), Cachaza could be fermented using Saccharomyces cerevisiae at 30 °C and 200 rpm with an (NH4)2SO4 loading of 160 mg·L−1 to achieve an ethanol and aliphatic component production of 49.1 g·L−1 and 147.8 ppm, respectively. (NH4)2SO4 loading reduced the formation of aliphatic components such as 2-methyl-1-propanol and 3-methyl-1-butanol during fermentation. The Gompertz model predicted the behavior of the aliphatic components, such as ethanol, 3-methyl-1-butanol, 2-methyl-1-propanol, and 1-propanol (R2 > 0.881). These parameters will allow us to facilitate the transition to larger scales to estimate the mass and energy balances and to assess the technical and environmental performance of electricity production from Cachaza. Further studies should be focused on ethanol production from Cachaza at larger scales and its transformation into H2.

Acknowledgments

The authors are grateful to Colciencias (Francisco Jose de Caldas Fund) and Universidad de La Sabana for the financial support of this work through the Project ING-163 (Colciencias contract 174-2016). Nestor Sanchez acknowledges Colciencias for the doctoral scholarship (grant number 725-2015).

Author Contributions

Nestor Sanchez, Ruth Ruiz, and Martha Cobo contributed equally to this work. Nicolas Infante contributed to the experimental process for Cachaza fermentation. All of the authors contributed to the writing and review of this document.

Conflicts of Interest

The authors declare no conflict of interest.

References

  1. Kirubakaran, A.; Jain, S.; Nema, R.K. A review on fuel cell technologies and power electronic interface. Renew. Sustain. Energy Rev. 2009, 13, 2430–2440. [Google Scholar] [CrossRef]
  2. Mekhilef, S.; Saidur, R.; Safari, A. Comparative study of different fuel cell technologies. Renew. Sustain. Energy Rev. 2012, 16, 981–989. [Google Scholar] [CrossRef]
  3. Sanchez, N.; Ruiz, R.Y.; Cifuentes, B.; Cobo, M. Hydrogen from glucose: A combined study of glucose fermentation, bioethanol purification, and catalytic steam reforming. Int. J. Hydrogen Energy 2016, 41, 5640–5651. [Google Scholar] [CrossRef]
  4. Cifuentes, B.; Figueredo, M.; Cobo, M. Response Surface Methodology and Aspen Plus Integration for the Simulation of the Catalytic Steam Reforming of Ethanol. Catalysts 2017, 7, 15. [Google Scholar] [CrossRef]
  5. Ansari, K.B.; Gaikar, V.G. Pressmud as an Alternate Resource for Hydrocarbons and Chemicals by Thermal Pyrolysis. Ind. Eng. Chem. Res. 2014, 53, 1878–1889. [Google Scholar] [CrossRef]
  6. López-González, L.M.; Pereda Reyes, I.; Dewulf, J.; Budde, J.; Heiermann, M.; Vervaeren, H. Effect of liquid hot water pre-treatment on sugarcane press mud methane yield. Bioresour. Technol. 2014, 169, 284–290. [Google Scholar] [CrossRef] [PubMed]
  7. Janke, L.; Leite, A.F.; Nikolausz, M.; Radetski, C.M.; Nelles, M.; Stinner, W. Comparison of start-up strategies and process performance during semi-continuous anaerobic digestion of sugarcane filter cake co-digested with bagasse. Waste Manag. 2016, 48, 199–208. [Google Scholar] [CrossRef] [PubMed]
  8. Janke, L.; Leite, A.; Batista, K.; Weinrich, S.; Sträuber, H.; Nikolausz, M. Optimization of hydrolysis and volatile fatty acids production from sugarcane filter cake: Effects of urea supplementation and sodium hydroxide pretreatment. Bioresour. Technol. 2016, 199, 235–244. [Google Scholar] [CrossRef] [PubMed]
  9. George, P.A.O.; Eras, J.J.C.; Gutierrez, A.S.; Hens, L.; Vandecasteele, C. Residue from Sugarcane Juice Filtration (Filter Cake): Energy Use at the Sugar Factory. Waste Biomass Valoriz. 2010, 1, 407–413. [Google Scholar] [CrossRef]
  10. Kuruti, K.; Rao, A.G.; Gandu, B.; Kiran, G.; Mohammad, S.; Sailaja, S.; Swamy, Y.V. Generation of bioethanol and VFA through anaerobic acidogenic fermentation route with press mud obtained from sugar mill as a feedstock. Bioresour. Technol. 2015, 192, 646–653. [Google Scholar] [CrossRef] [PubMed]
  11. Radjaram, B.; Saravanane, R. Start up study of UASB reactor treating press mud for biohydrogen production. Biomass Bioenergy 2011, 35, 2721–2728. [Google Scholar] [CrossRef]
  12. Puligundla, P.; Smogrovicova, D.; Obulam, V.S.R.; Ko, S. Very high gravity (VHG) ethanolic brewing and fermentation: A research update. J. Ind. Microbiol. Biotechnol. 2011, 38, 1133–1144. [Google Scholar] [CrossRef] [PubMed]
  13. Lu, Y.; Wang, Y.; Xu, G.; Chu, J.; Zhuang, Y.; Zhang, S. Influence of high solid concentration on enzymatic hydrolysis and fermentation of steam-exploded corn stover biomass. Appl. Biochem. Biotechnol. 2010, 160, 360–369. [Google Scholar] [CrossRef] [PubMed]
  14. Siqueira, P.F.; Karp, S.G.; Carvalho, J.C.; Sturm, W.; Rodríguez-León, J.A.; Tholozan, J.L.; Singhania, R.R.; Pandey, A.; Soccol, C.R. Production of bio-ethanol from soybean molasses by Saccharomyces cerevisiae at laboratory, pilot and industrial scales. Bioresour. Technol. 2008, 99, 8156–8163. [Google Scholar] [CrossRef] [PubMed]
  15. Alvira, P.; Moreno, A.D.; Ibarra, D.; Sáez, F.; Ballesteros, M. Improving the fermentation performance of Saccharomyces cerevisiae by laccase during ethanol production from steam-exploded wheat straw at high-substrate loadings. Biotechnol. Prog. 2013, 29, 74–82. [Google Scholar] [CrossRef] [PubMed]
  16. Li, Z.; Wang, D.; Shi, Y. Effects of nitrogen source on ethanol production in very high gravity fermentation of corn starch. J. Taiwan Inst. Chem. Eng. 2017, 70, 229–235. [Google Scholar] [CrossRef]
  17. Betite, V.C.; Júnior, M.M.; de Oliveira, J.E.; Ernandes, J.R. Very high gravity sucrose fermentation by brazilian industrial yeast strains: Effect of nitroge supplementation. J. Inst. Brew. 2012, 118, 174–178. [Google Scholar] [CrossRef]
  18. Hu, C.; Qin, Q.; Gao, P. Medium optimization for improved ethanol production in very high gravity fermentation. Chin. J. Chem. Eng. 2011, 19, 1017–1022. [Google Scholar] [CrossRef]
  19. Le Valant, A.; Garron, A.; Bion, N.; Epron, F.; Duprez, D. Hydrogen production from raw bioethanol over Rh/MgAl2O4 catalyst. Catal. Today 2008, 138, 169–174. [Google Scholar] [CrossRef]
  20. Le Valant, A.; Can, F.; Bion, N.; Duprez, D.; Epron, F. Hydrogen production from raw bioethanol steam reforming: Optimization of catalyst composition with improved stability against various impurities. Int. J. Hydrogen Energy 2010, 35, 5015–5020. [Google Scholar] [CrossRef]
  21. Rass-Hansen, J.; Johansson, R.; Møller, M.; Christensen, C.H. Steam reforming of technical bioethanol for hydrogen production. Int. J. Hydrogen Energy 2008, 33, 4547–4554. [Google Scholar] [CrossRef]
  22. Devianto, H.; Han, J.; Yoon, S.P.; Nam, S.W.; Lim, T.H.; Oh, I.H.; Hong, S.A.; Lee, H.I. The effect of impurities on the performance of bioethanol-used internal reforming molten carbonate fuel cell. Int. J. Hydrogen Energy 2011, 36, 10346–10354. [Google Scholar] [CrossRef]
  23. Dan, M.; Senila, L.; Roman, M.; Mihet, M.; Lazar, M.D. From wood wastes to hydrogen—Preparation and catalytic steam reforming of crude bio-ethanol obtained from fir wood. Renew. Energy 2015, 74, 27–36. [Google Scholar] [CrossRef]
  24. Vargas, J.C.; Libs, S.; Roger, A.-C.; Kiennemann, A. Study of Ce-Zr-Co fluorite-type oxide as catalysts for hydrogen production by steam reforming of bioethanol. Catal. Today 2005, 107–108, 417–425. [Google Scholar] [CrossRef]
  25. Deed, N.K.; Van Vuuren, H.J.J.; Gardner, R.C. Effects of nitrogen catabolite repression and di-ammonium phosphate addition during wine fermentation by a commercial strain of S. cerevisiae. Appl. Microbiol. Biotechnol. 2011, 89, 1537–1549. [Google Scholar] [CrossRef] [PubMed]
  26. Aranda, A.; Matallana, E.; Del Olmo, M. Saccharomyces Yeasts I: Primary Fermentation; Elsevier: Oxford, UK, 2011. [Google Scholar]
  27. Comelli, N.; Seluy, L.G.; Isla, M.A. Optimization of a low-cost defined medium for alcoholic fermentation—A case study for potential application in bioethanol production from industrial wastewaters. New Biotechnol. 2016, 33, 107–115. [Google Scholar] [CrossRef] [PubMed]
  28. Vidal, E.E.; De Billerbeck, G.M.; Simões, D.A.; Schuler, A.; François, J.M.; De Morais, M.A. Influence of nitrogen supply on the production of higher alcohols/esters and expression of flavour-related genes in cachaça fermentation. Food Chem. 2013, 138, 701–708. [Google Scholar] [CrossRef] [PubMed]
  29. Hernandez-Orte, P.; Bely, M.; Cacho, J.; Ferreira, V. Impact of ammonium additions on volatile acidity, ethanol, and aromatic compound production by different Saccharomyces cerevisiae strains during fermentation in controlled synthetic media. Aust. J. Grape Wine Res. 2006, 12, 150–160. [Google Scholar] [CrossRef]
  30. Beltran, G.; Esteve-Zarzoso, B.; Rozès, N.; Mas, A.; Guillamón, J.M. Influence of the timing of nitrogen additions during synthetic grape must fermentations on fermentation kinetics and nitrogen consumption. J. Agric. Food Chem. 2005, 53, 996–1002. [Google Scholar] [CrossRef] [PubMed]
  31. Nordström, K. Formation of esters, acids and alcohol from a-keto acids by brewer’s yeast. J. Inst. Brew. 1963, 69, 483–495. [Google Scholar] [CrossRef]
  32. Clement, T.; Perez, M.; Mouret, J.R.; Sanchez, I.; Sablayrolles, J.M.; Camarasa, C. Metabolic responses of Saccharomyces cerevisiae to valine and ammonium pulses during four-stage continuous wine fermentations. Appl. Environ. Microbiol. 2013, 79, 2749–2758. [Google Scholar] [CrossRef] [PubMed]
  33. Phukoetphim, N.; Salakkam, A.; Laopaiboon, P. Kinetic models for batch ethanol production from sweet sorghum juice under normal and high gravity fermentations: Logistic and modified Gompertz models. J. Biotechnol. 2017, 243, 69–75. [Google Scholar] [CrossRef] [PubMed]
  34. Jin, B.; Wang, S.; Xing, L.; Li, B.; Peng, Y. The effect of salinity on waste activated sludge alkaline fermentation and kinetic analysis. J. Environ. Sci. 2015, 3, 80–90. [Google Scholar] [CrossRef] [PubMed]
  35. Hazelwood, L.A.; Daran, J.M.; van Maris, A.J.A.; Pronk, J.T.; Dickinson, J.R. The ehrlich pathway for fusel alcohol production: A century of research on Saccharomyces cerevisiae metabolism. Appl. Environ. Microbiol. 2008, 74, 2259–2266. [Google Scholar] [CrossRef] [PubMed]
  36. Gutiérrez, A.; Chiva, R.; Sancho, M.; Beltran, G.; Arroyo-López, F.N.; Guillamon, J.M. Nitrogen requirements of commercial wine yeast strains during fermentation of a synthetic grape must. Food Microbiol. 2012, 31, 25–32. [Google Scholar] [CrossRef] [PubMed]
  37. Crépin, L.; Nidelet, T.; Sanchez, I.; Dequin, S.; Camarasa, C. Sequential Use of Nitrogen Compounds by Saccharomyces cerevisiae during Wine Fermentation: A Model Based on Kinetic and Regulation Characteristics of Nitrogen Permeases. Appl. Environ. Microbiol. 2012, 78, 8102–8111. [Google Scholar] [CrossRef] [PubMed]
  38. Pires, E.J.; Teixeira, J.A.; Brányik, T.; Vicente, A.A. Yeast: The soul of beer’s aroma—A review of flavour-active esters and higher alcohols produced by the brewing yeast. Appl. Microbiol. Biotechnol. 2014, 98, 1937–1949. [Google Scholar] [CrossRef] [PubMed] [Green Version]
  39. Atsumi, S.; Hanai, T.; Liao, J.C. Non-fermentative pathways for synthesis of branched-chain higher alcohols as biofuels. Nature 2008, 451, 86–89. [Google Scholar] [CrossRef] [PubMed]
  40. Pietruszka, M.; Katarzyna, P.-P.; Józef, S.S. Synthesis of higher alcohols during alcoholic fermentation of rye mashes. Food Chem. Biotechnol. 2010, 74, 51–63. [Google Scholar]
  41. Reazin, G.; Scales, H.; Andreasen, A. Production of higher alcohols from threonine and isoleucine in alcoholic fermentations of different types of grain mash. J. Agric. Food Chem. 1973, 21, 50–54. [Google Scholar] [CrossRef]
  42. Renger, R.S.; Van Hateren, S.H.; Luyben, K.C.A.M. The formation of esters and higher alcohols during brewery fermentation: The effect of carbon dioxide pressure. J. Inst. Brew. 1992, 98, 509–513. [Google Scholar] [CrossRef]
  43. Sanchez, N.; Gomez, M.; Ruíz, R.; Plazas, A.; Vásquez, J.; Cobo, M. Effect of the hydrolysis Pretreatment of Cachaza for Bioethanol Production. In Proceedings of the 25th European Biomass Conference and Exhibition, Stockholm, Sweden, 12–15 June 2017. [Google Scholar]
  44. Tanksale, A.; Beltramini, J.N.; Lu, G.M. A review of catalytic hydrogen production processes from biomass. Renew. Sustain. Energy Rev. 2010, 14, 166–182. [Google Scholar] [CrossRef]
  45. Modenbach, A.A.; Nokes, S.E. Enzymatic hydrolysis of biomass at high-solids loadings—A review. Biomass Bioenergy 2013, 56, 526–544. [Google Scholar] [CrossRef]
  46. Godard, P.; Urrestarazu, A.; Vissers, S.; Kontos, K.; Bontempi, G.; van Helden, J.; Andre, B. Effect of 21 Different Nitrogen Sources on Global Gene Expression in the Yeast Saccharomyces cerevisiae. Mol. Cell. Biol. 2007, 27, 3065–3086. [Google Scholar] [CrossRef] [PubMed]
  47. Dodic, J.M.; Vucurovic, D.G.; Dodic, S.N.; Grahovac, J.A.; Popov, S.D.; Nedeljkovic, N.M. Kinetic modelling of batch ethanol production from sugar beet raw juice. Appl. Energy 2012, 99, 192–197. [Google Scholar] [CrossRef]
  48. Baranyi, J.; Roberts, T.A. A dynamic approach to predicting bacterial growth in food. Int. J. Food Microbiol. 1994, 23, 277–294. [Google Scholar] [CrossRef]
  49. Membré, J.M.; Kubaczka, M.; Chéné, C. Combined effects of pH and sugar on growth rate of Zygosaccharomyces rouxii, a bakery product spoilage yeast. Appl. Environ. Microbiol. 1999, 65, 4921–4925. [Google Scholar] [PubMed]
  50. Boons, K.; Noriega, E.; Verherstraeten, N.; David, C.C.; Hofkens, J.; Van Impe, J.F. The effect of medium structure complexity on the growth of Saccharomyces cerevisiae in gelatin–dextran systems. Int. J. Food Microbiol. 2015, 199, 8–14. [Google Scholar] [CrossRef] [PubMed]
  51. Ariyajaroenwong, P.; Laopaiboon, P.; Salakkam, A. Kinetic models for batch and continuous ethanol fermentation from sweet sorghum juice by yeast immobilized on sweet sorghum stalks. J. Taiwan Inst. Chem. Eng. 2016, 66, 210–216. [Google Scholar] [CrossRef]
  52. Lambrechts, M.G.; Pretorius, I.S. Yeast and its Importance to Wine Aroma—A Review. S. Afr. J. Enol. Vitic. 2000, 21, 97–129. [Google Scholar]
  53. Landaud, S.; Latrille, E.; Corrieu, G. Top pressure and temperature control the fusel alcohol/ester ratio through yeast growth in beer fermentation. J. Inst. Brew. 2001, 107, 107–117. [Google Scholar] [CrossRef]
  54. Zabed, H.; Faruq, G.; Sahu, J.N.; Azirun, M.S.; Hashim, R.; Nasrulhaq Boyce, A. Bioethanol production from fermentable sugar juice. Sci. World J. 2014, 2014, 957102. [Google Scholar] [CrossRef] [PubMed]
  55. Marks, V.D.; Van Der Merwe, G.K.; Van Vuuren, H.J.J. Transcriptional profiling of wine yeast in fermenting grape juice: Regulatory effect of diammonium phosphate. FEMS Yeast Res. 2003, 3, 269–287. [Google Scholar] [CrossRef]
  56. De Jong, E.; Higson, A.; Walsh, P.; Wellisch, M. Bio-Based Chemicals, Value Added Products from Biorefineries; IEA Bioenergy: Amsterdam, The Netherlands, 2012. [Google Scholar]
  57. Goncalves, C.; Rodriguez-Jasso, R.M.; Gomes, N.; Teixeira, J.A.; Belo, I. Adaptation of dinitrosalicylic acid method to microtiter plates. Anal. Methods 2010, 2, 2046–2048. [Google Scholar] [CrossRef] [Green Version]
  58. Ross, T. Indices for performance evaluation of predictive models in food microbiology. J. Appl. Bacteriol. 1996, 81, 501–508. [Google Scholar] [CrossRef] [PubMed]
  59. Baranyi, J.; Pin, C.; Ross, T. Validating and comparing predictive models. Int. J. Food Microbiol. 1999, 48, 159–166. [Google Scholar] [CrossRef]
Figure 1. (a) Ethanol concentration (g·L−1) and (b) aliphatic concentration (ppm) after a 24-h fermentation at 30 °C and 200 rpm using S. cerevisiae as yeast and different (NH4)2SO4 loadings. The same letter in the figure represents non-significant difference among the treatments.
Energies 10 02112 g001
Figure 2. Biomass production during the fermentation of Cachaza for two different (NH4)2SO4 loadings. Fermentation conditions: 30 °C and 200 rpm.
Energies 10 02112 g002
Figure 3. (a) Ethanol; (b) 3-methyl-1-butanol (3M1B); (c) 2-methyl-1-propanol (2M1P); and (d) 1-propanol production from Cachaza using S. cerevisiae for two different (NH4)2SO4 loadings. Fermentation conditions: 30 °C and 200 rpm.
Energies 10 02112 g003
Table 1. Pearson Correlation Coefficient (PCC) matrix among all the tested fermentation products and parameters after a 24-h fermentation at 30 °C and 200 rpm using S. cerevisiae as yeast.
ParametersNEEA1P2M1P1B3M1BDWCFUXG
N 000-0-000
E0 ++00000+
EA0+ +00000+
1P0++ 00000+
2M1B-000 0+000
1B00000 +000
3M1B-000++ 000
DW0000000 00
CFU00000000 0
XG0+++00000
(+) Represent positive linear correlations (p < 0.05), (-) represent negative linear correlations (p < 0.05), and (0) represent no correlation (p < 0.05). N = nitrogen; E = Ethanol; EA = Ethyl acetate; 1P = 1-propanol; 2M1P = 2-methyl-1-propanol; 1B = 1-butanol; 3M1B = 3-methyl-1-butanol; DW = Dry weight; CFU = Colony unit formation; XG = Glucose conversion.
Table 2. Cachaza composition obtained from Mogotes (Bogota, Colombia) [43].
ParameterAnalytical MethodMethodwt % (Wet Basis)
MoistureGravimetricAOAC * 925.45 Method B51.66
Solid contentCalculusCalculus48.34
Total carbohydrates (including reducing sugar)CalculusCalculus41.10
Reducing sugarVolumetricAOAC 923.0928.50
WaxGravimetricAOAC 989.053.05
ProteinVolumetricAOAC 2001.112.35
AshGravimetricAOAC 900.02 Method A1.84
NitrogenVolumetricAOAC 2001.110.38
* AOAC: Association of Official Agricultural Chemists.
Table 3. Ethanol, 1-propanol, 2-methyl-1-propanol (2M1P), and 3-methyl-1-butanol (3M1B) concentrations after 24-h of Cachaza fermentation at 30 °C and 200 rpm using S. cerevisiae as yeast.
(NH4)2SO4 (mg·L−1)Ethanol (g·L−1)2M1P (ppm)3M1B (ppm)1-Propanol (ppm)
050.3 ± 1.8 (a)49.0 ± 4.0 (a)96.9 ± 7.5 (a)13.8 ± 0.4 (a)
16049.1 ± 1.1 (a)29.0 ± 1.1 (b)90.6 ± 3.9 (a)28.2 ± 2.5 (b)
100047.3 ± 0.6 (a)23.8 ± 1.7 (c)71.1 ± 2.5 (b)25.1 ± 1.1 (b)
a, b and c: The same letter in the table represents non-significant differences between the treatments (p < 0.05).
Table 4. Kinetic parameters for biomass production of Cachaza fermentation at 30 °C and 200 rpm using S. cerevisiae as yeast.
(NH4)2SO4 (mg·L−1)μmax (h−1)Lag Phase Time (h)Final Value (g·L−1)
Glucose
1600.60 ± 0.08 (aA)6.01 ± 1.81 (aA)11.80 ± 0.23 (aA)
10000.49 ± 0.01 (aA)4.92 ± 1.03 (aA)10.62 ± 0.68 (aA)
Cachaza
1600.75 ± 0.23 (aA)5.04 ± 1.69 (aA)10.00 ± 0.31 (aB)
10000.75 ± 0.08 (aA)5.01 ± 0.83 (aA)10.13 ± 0.17 (aA)
a, A, B: The same lowercase letter in the table represents non-significant differences between the (NH4)2SO4 treatments for the same substrate (p < 0.05). Different uppercase letter in the table represents significant differences between substrate for the same (NH4)2SO4 loading (p < 0.05).
Table 5. Ethanol, 1-propanol, 2-methyl-1-propanol (2M1P), and 3-methyl-1-butanol (3M1B) concentration after 48 h of Cachaza fermentation at 30 °C and 200 rpm using S. cerevisiae as yeast.
(NH4)2SO4 Loading (mg·L−1)ProductPmax (g·L−1 (*) or ppm)rp.m (g·L−1·h−1 (**) or ppm·h−1)TL (h)R2AFBF%Df%Bf
160Ethanol49.10 *3.93 **3.360.9691.6180.97761.80.88
3M1B85.4214.1410.030.9261.0621.0016.2−0.05
2M1P27.315.729.820.9391.0331.0003.34−0.02
1P26.2023.3511.660.8811.0481.0014.85−0.06
1000Ethanol50.24 *3.53 **4.270.9361.2571.01125.70.41
3M1B80.1165.7911.750.9461.1621.12716.24.96
2M1P24.6620.6711.510.9241.0801.0038.00.11
1P25.1025.9611.800.9091.1140.97711.4−0.86
* Maximum ethanol production (g·L−1); ** Maximum ethanol production rate (g·L−1·h−1).
Table 6. Hydrolysis conditions for Cachaza.
ParameterValue
Liquid to solid ratio (w/w)1:1
Temperature (°C)90
Time (h)3
Acid content13.5 g H2SO4 per kg Cachaza (4.5 wt %)

