1. Introduction
A power generation system based on solid oxide fuel cells (SOFCs), is highly efficient, although in most cases the fuel cell stacks do not completely utilize the fuel. Several SOFCs-based combined heat and power plant (CHP) designs have been considered [
1,
2]. Solutions proposed in the literature assume higher fuel utilization level through recirculation of depleted anodic fuel [
3,
4,
5,
6] or a serial connection of two identical cell stacks [
7,
8]. The main advantages of anode-off gas recirculation in SOFC-based systems are the elimination of external steam production as well as the reduction of the number of cells in the stack due to lower in-cell fuel utilization [
9]. An additional advantage of anode gas recirculation is that the demineralized and deionized water used to produce steam can be reused instead of being added by an external operator [
10]. A further advantage is a lower steam concentration in the exhausted gases, which improves the system thermal efficiency. Consequently, higher electrical system efficiency is achieved with heat management in SOFC power systems. However, it should be noted that the recirculation of depleted anodic fuel of up to 70–80% is required to ensure proper steam to carbon ratio for the pre-reforming process [
7]. Typically, this condition is achieved by using a blower or ejector. The application of the ejector requires elevated pressure at the feed side, which means an increase of the system cost. On the other hand, Vincenzo et al. [
10] showed that when anode gas recirculation is applied the system capital cost decreases due to the size reduction of the auxiliary components. A negative effect of the anodic fuel recycling on the cell voltage was found by Colpan et al. [
11].
To overcome the disadvantages of systems with anode gas recirculation, a second concept of maximization of the electrical efficiency of the SOFC-based power system was proposed assuming the use of segmented in series SOFC stacks [
1,
12,
13]. One of the first proposals was a cone shaped anode supported segmented-in-series (SIS) solid oxide fuel cell described in Liu’s patent [
5]. The patent presented the unit characteristics in the stack. The feasibility of this design was firstly demonstrated by Sui and Liu [
14] based on an electrolyte-supported three-cell stack. Large Ohmic resistance from the thick electrolyte caused a lower density limitation.
Further improvements were performed by Yuan et al. [
15], who reduced the Yttria Stabilized Zirconia (YSZ) thickness by a colloidal spray coating method. The use of a thinner YSZ layer allows one to lower the Ohmic resistance and to increase the single cell performance. Moreover, Ding and Liu [
16] fabricated a cone shaped tubular anode by a slip casting technique where YSZ electrolyte films were deposited onto the anode tubes by a dip coating method. A two cell stack was fabricated and tested with respect to the thermal cycling test. The open circuit voltage (OCV) of each cell in the stack was lower than that of a single cell. The maximum power density of the first cell at 800 °C was 0.22 W/cm
2, while that of the second cell was 0.33 W/cm
2, much lower than that of the single cell, which equaled 1.78 W/cm
2 at the same operating temperature. Two reasons were given to explain this situation. The preparation technique of each cell was inconsistent, which caused the OCV and electrochemical performance of the cell units in the stack to not be identical. The low OCV and maximum power density of the cell units in the stack was attributed to gas leakage across the Ag paste sealing at the connection. Ding and Liu [
16] were aware that Ag can react with hydrogen fuel to induce fuel tightness, which results in sealing failure. In addition, the electrochemical behavior of an SOFC after twelve periods of thermal cycle tests was studied. The stack OCV did not change significantly and the overall stability was good after the twelve thermal cycling test periods. Stability of the stack OCV proved the feasibility of the cone-shaped segmented-in-series design. Further investigation on the stack was conducted by Bai et al. [
13], who developed a cone-shaped anode-supported SOFC. The authors in [
13] designed an eleven cell segmented-in-series SOFC system. The maximum power output of 8 W at 800 °C (421.4 W/cm
2) and 6 W at 700 °C (310.8 W/cm
2) was achieved, when the stack was fueled with humidified methane. The maximum stack power density was equal to 0.9 W/cm
3 at 800 °C. To lower the operation temperature and reduce the SOFC cost a new concept of a flat tubular segmented-in-series SIS-SOFC was developed by Mushtaq et al. [
17]. Increasing the thickness of the cathode and modification of a current collector improved the SIS-SOFC performance. A power density of 0.401 W/cm
2 for LSCF 57 um was increased to 0.522 W/cm
2 for composite cathode LSCF 57 um/LSCo 20 um at 750 °C. The efficiency of the flat tubular SIS-SOFC increased by 30% after using LSCo as the cathode current collector. An et al. [
18] attempted to increase the active area per flattened tubular SIS-SOFC cell. For this purpose, each unit cell layer was laminated by a decalcomania method. This treatment allowed for an increase of the active area per cell by 2.6-fold in comparison to the primary area.
Apart from the concept of cone-shaped anode/cathode supported segmented-in-series SOFC stacks discussed above, two stages of SOFCs placed in series are also known in literature [
1,
8,
19]. Araki et al. [
19] considered two stages of low and high temperature SOFCs with a gas turbine system. The simulation results showed that the SOFC power generation efficiency was equal to 50.3% and the combined cycle power generation efficiency was 56.1% at the low SOFC cell temperature of 750 °C, mean current density of 0.3 A/cm
2, cell pressure of 1 MPa at total fuel utilization rate of 85%, total air utilization rate of 30% and external reforming rate of 100% as well as fuel and air recirculation rates of 30% and 10%, respectively. The results for the two-stage SOFCs and combined cycle were compared with a single cycle of high temperature SOFC. It was found that the SOFC power generation efficiency for the simple system was equal to 45.1%, while for the two-stage SOFC system it was 54.7%. It was found that power generation efficiency and combined cycle efficiency were higher for the two-stage SOFC system. Another attempt to increase the power generation efficiency in the serially connected fuel cells-based system has been made by Musa and De Paepe [
8]. The connection of two stacks in series was compared. The first system contained a two-stage Intermediate Temperature (IT), SOFC and High Temperature (HT), SOFC. The second system was based on two stage IT-SOFCs. In both proposed solutions, anode gas streams from the first and second stacks were connected in parallel, while the cathode flow was connected serially. The simulation results obtained using Aspen Plus
TM showed that a single stage HT-SOFC and IT-SOFC had an efficiency of 57.6% and 62.3%, respectively, while a combined cycle of two-stage IT-SOFCs gave 65.5% under standard operational conditions. In addition, it was shown that due to optimization of the heat recovery and the gas turbine use, the efficiency increased to 68.3% [
8]. The connection of two stacks in series increases the output power of the system due to utilization of lean fuel from the first stack in the second one. This solution has been proposed recently by Kupecki et al. [
1]. A micro-Combined Heat and Power, CHP, unit with two 30 SOFC cells serially connected integrated in stack modules was investigated experimentally and numerically. Kupecki et al. [
1] enclosed the steam reformer and post combustor in a well-insulated high temperature box to achieve high thermal integration of the fuel process and post-combustor assuring heat delivery for the endothermic process of steam fuel reforming. Instantaneous evaporation inside the fuel processor resolved the problem of stand-alone steam generation. It was noticed that maximum efficiency of the stacks was achieved, where the first stack operated at a moderate current density and the second one at very low electrical load. After the first stack, the useful fuel containing hydrogen was very small in comparison to the total anodic molar fraction. The highest electrical efficiency of 46.4% was achieved at current densities of 0.275 and 0.07 A/cm
2, respectively. Moreover, the electrical efficiency of the system with two in-series SOFC stacks was 3–7% points higher than in systems based on the parallel connection of two stacks, when recirculation of the anodic gases was involved. According to Kupecki et al. [
1] optimization of the system performance was associated with defining parameters, which allowed them to maximize the performance of the SOFC stacks. Rapid changes in performance was observed when the first stack operated at constant current density and the current density of the second stack was gradually increased. The changes were associated with deviation from the optimal working conditions of the blower. It was noticed that further increase of the current density of the second stack allowed the system to achieve higher efficiency. However, it should be underlined that it did not result in an increase in power output. Kupecki et al. [
1] also examined a scenario where a high current density was maintained in the first stack, while a current density increase in the second stack from 0.20 to 0.28 A/cm
2 caused a reduction in the power output.
A dynamic anode supported intermediate temperature direct internal reforming planar 1DF SOFC stack model was also developed by Aguiar et al. [
20]. The defined model consists of mass, energy and electrochemical components. In their subsequent paper, the authors [
21] designed a characteristic feedback Proportional-Integral-Derivative (PID), controller for temperature, which works by changing the air/fuel ratio. The results of open loop dynamic simulations demonstrated that a positive load step change led to an increase in overall SOFC temperature and vice versa [
21]. Experimental results were used by Bhattacharyya et al. [
22] to validate a dynamic model of a tubular SOFC. The results showed large differences in settlement time, time constants and gain in transient behavior of the system. The authors of [
22] also reported that the directionality of the steps affected the transient response. Therefore, an application of a non-linear controller system due to non-linearity of the process itself was proposed [
22]. The dynamic behavior of a SOFC stack in a hybrid SOFC-gas turbine system was studied by Whiston et al. [
23]. The response of the system temperature, fuel utilization and power to inlet air and fuel rates on different timescales were reported. The results indicated that the fastest and most efficient way to control the system power was by manipulating the system drawn current density. Meanwhile, the most efficient way to change the fuel utilization is to change the fuel flow rate [
23]. Wang et al. [
24] developed a 1D mathematical model of direct internal reforming solid oxide fuel cells. Their results showed that the
V–
R characteristic modelling method can be used in the fast dynamic and real-time simulation [
24].
The main conclusion arising from the considerations is that the anode off gas leaving the first SOFC stack can be supplied to the second fuel cell stack. It was demonstrated that the connections of SOFC stacks can operate feasibly and increase the output power of the system. However, it should be noted that the tested experimentally and numerically units consist of the same number of fuel cells in the SOFC modules.
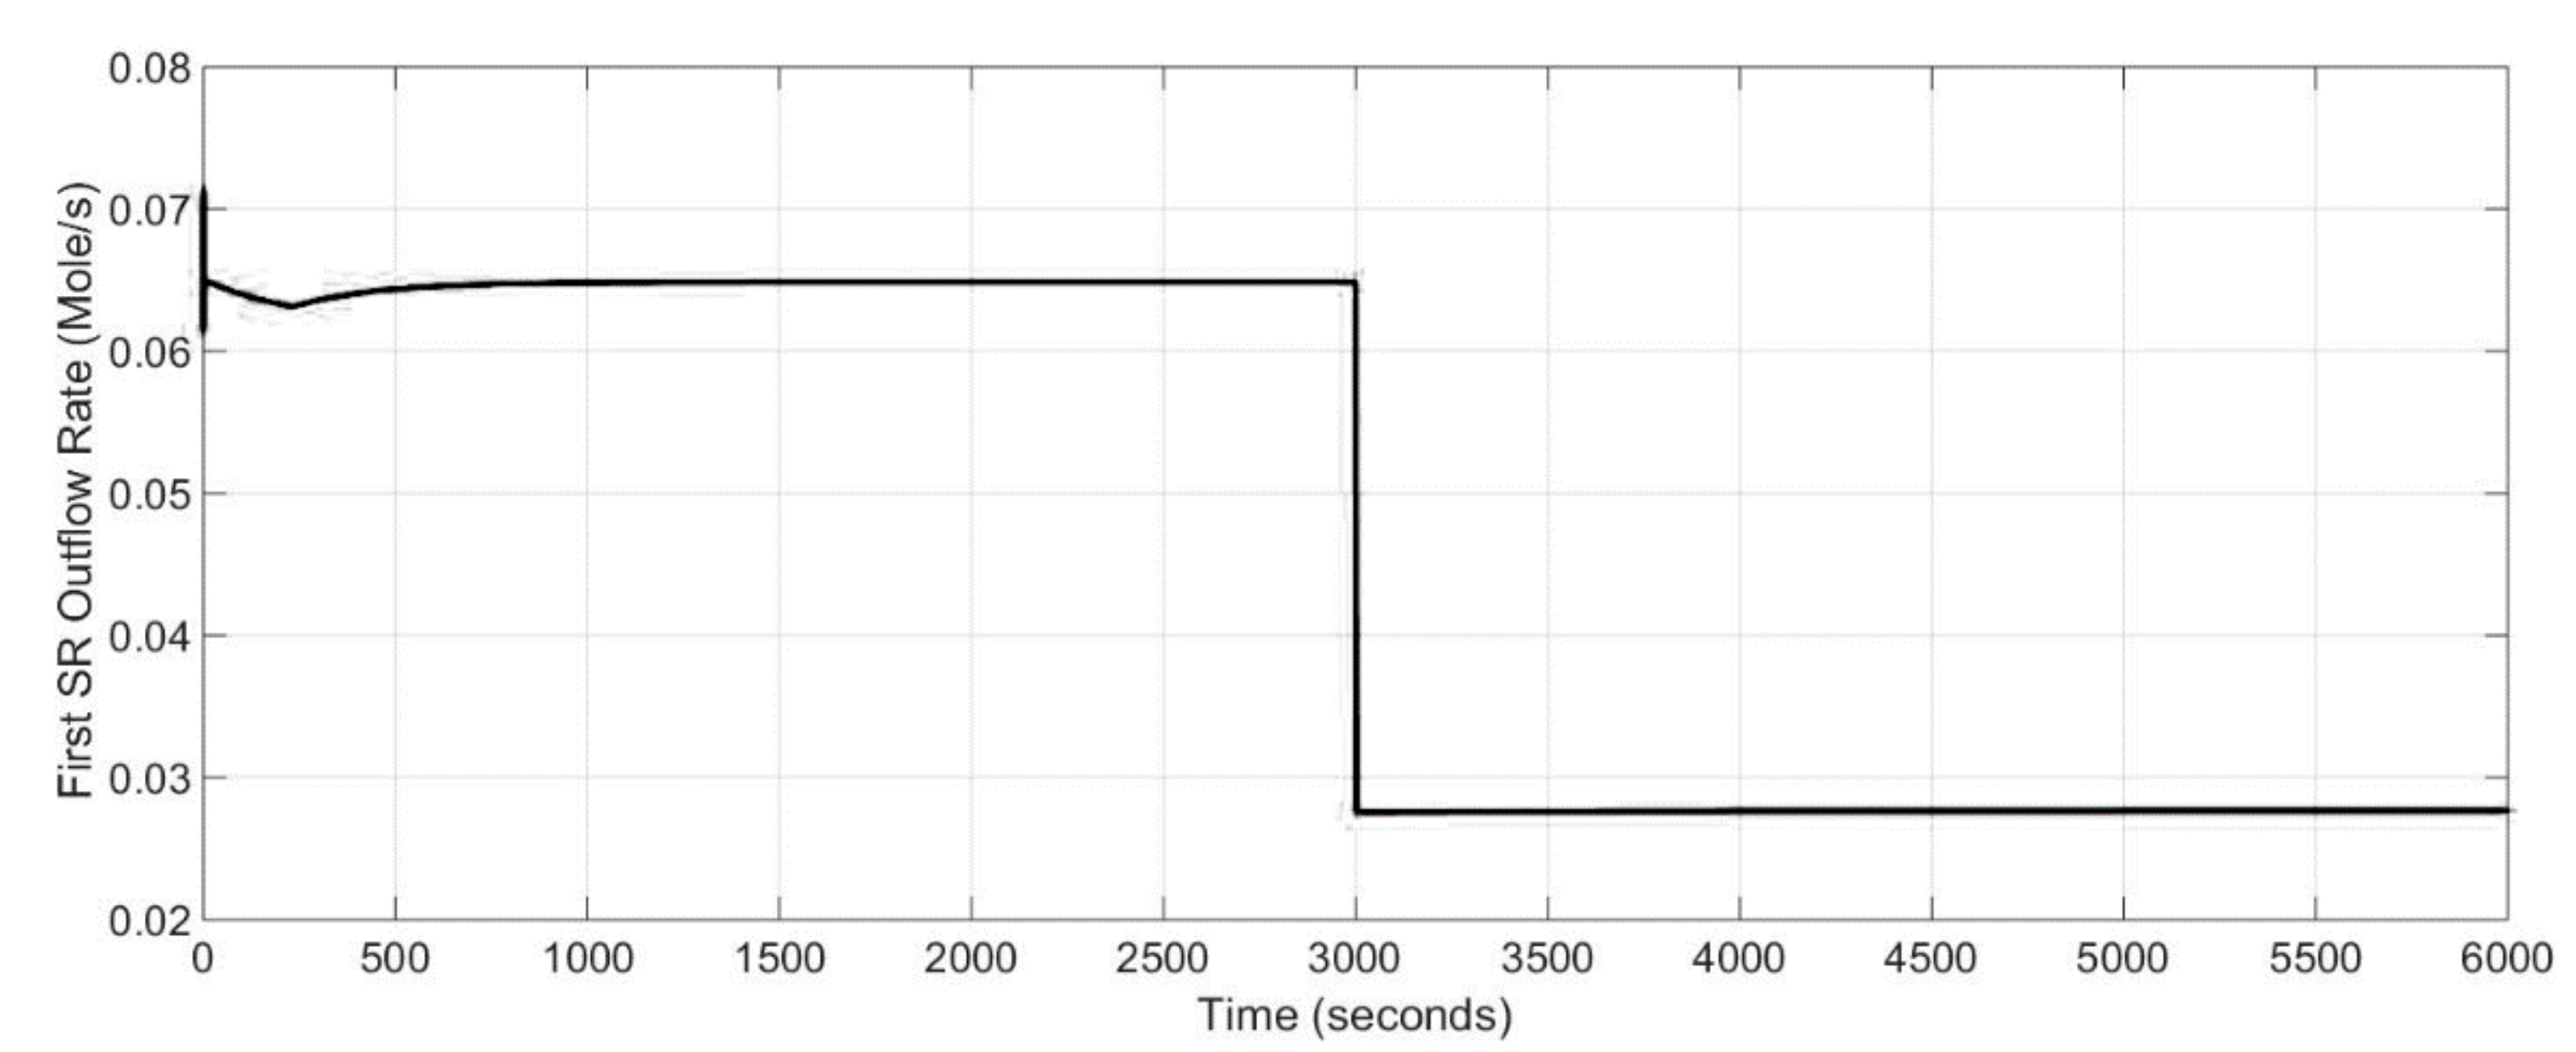
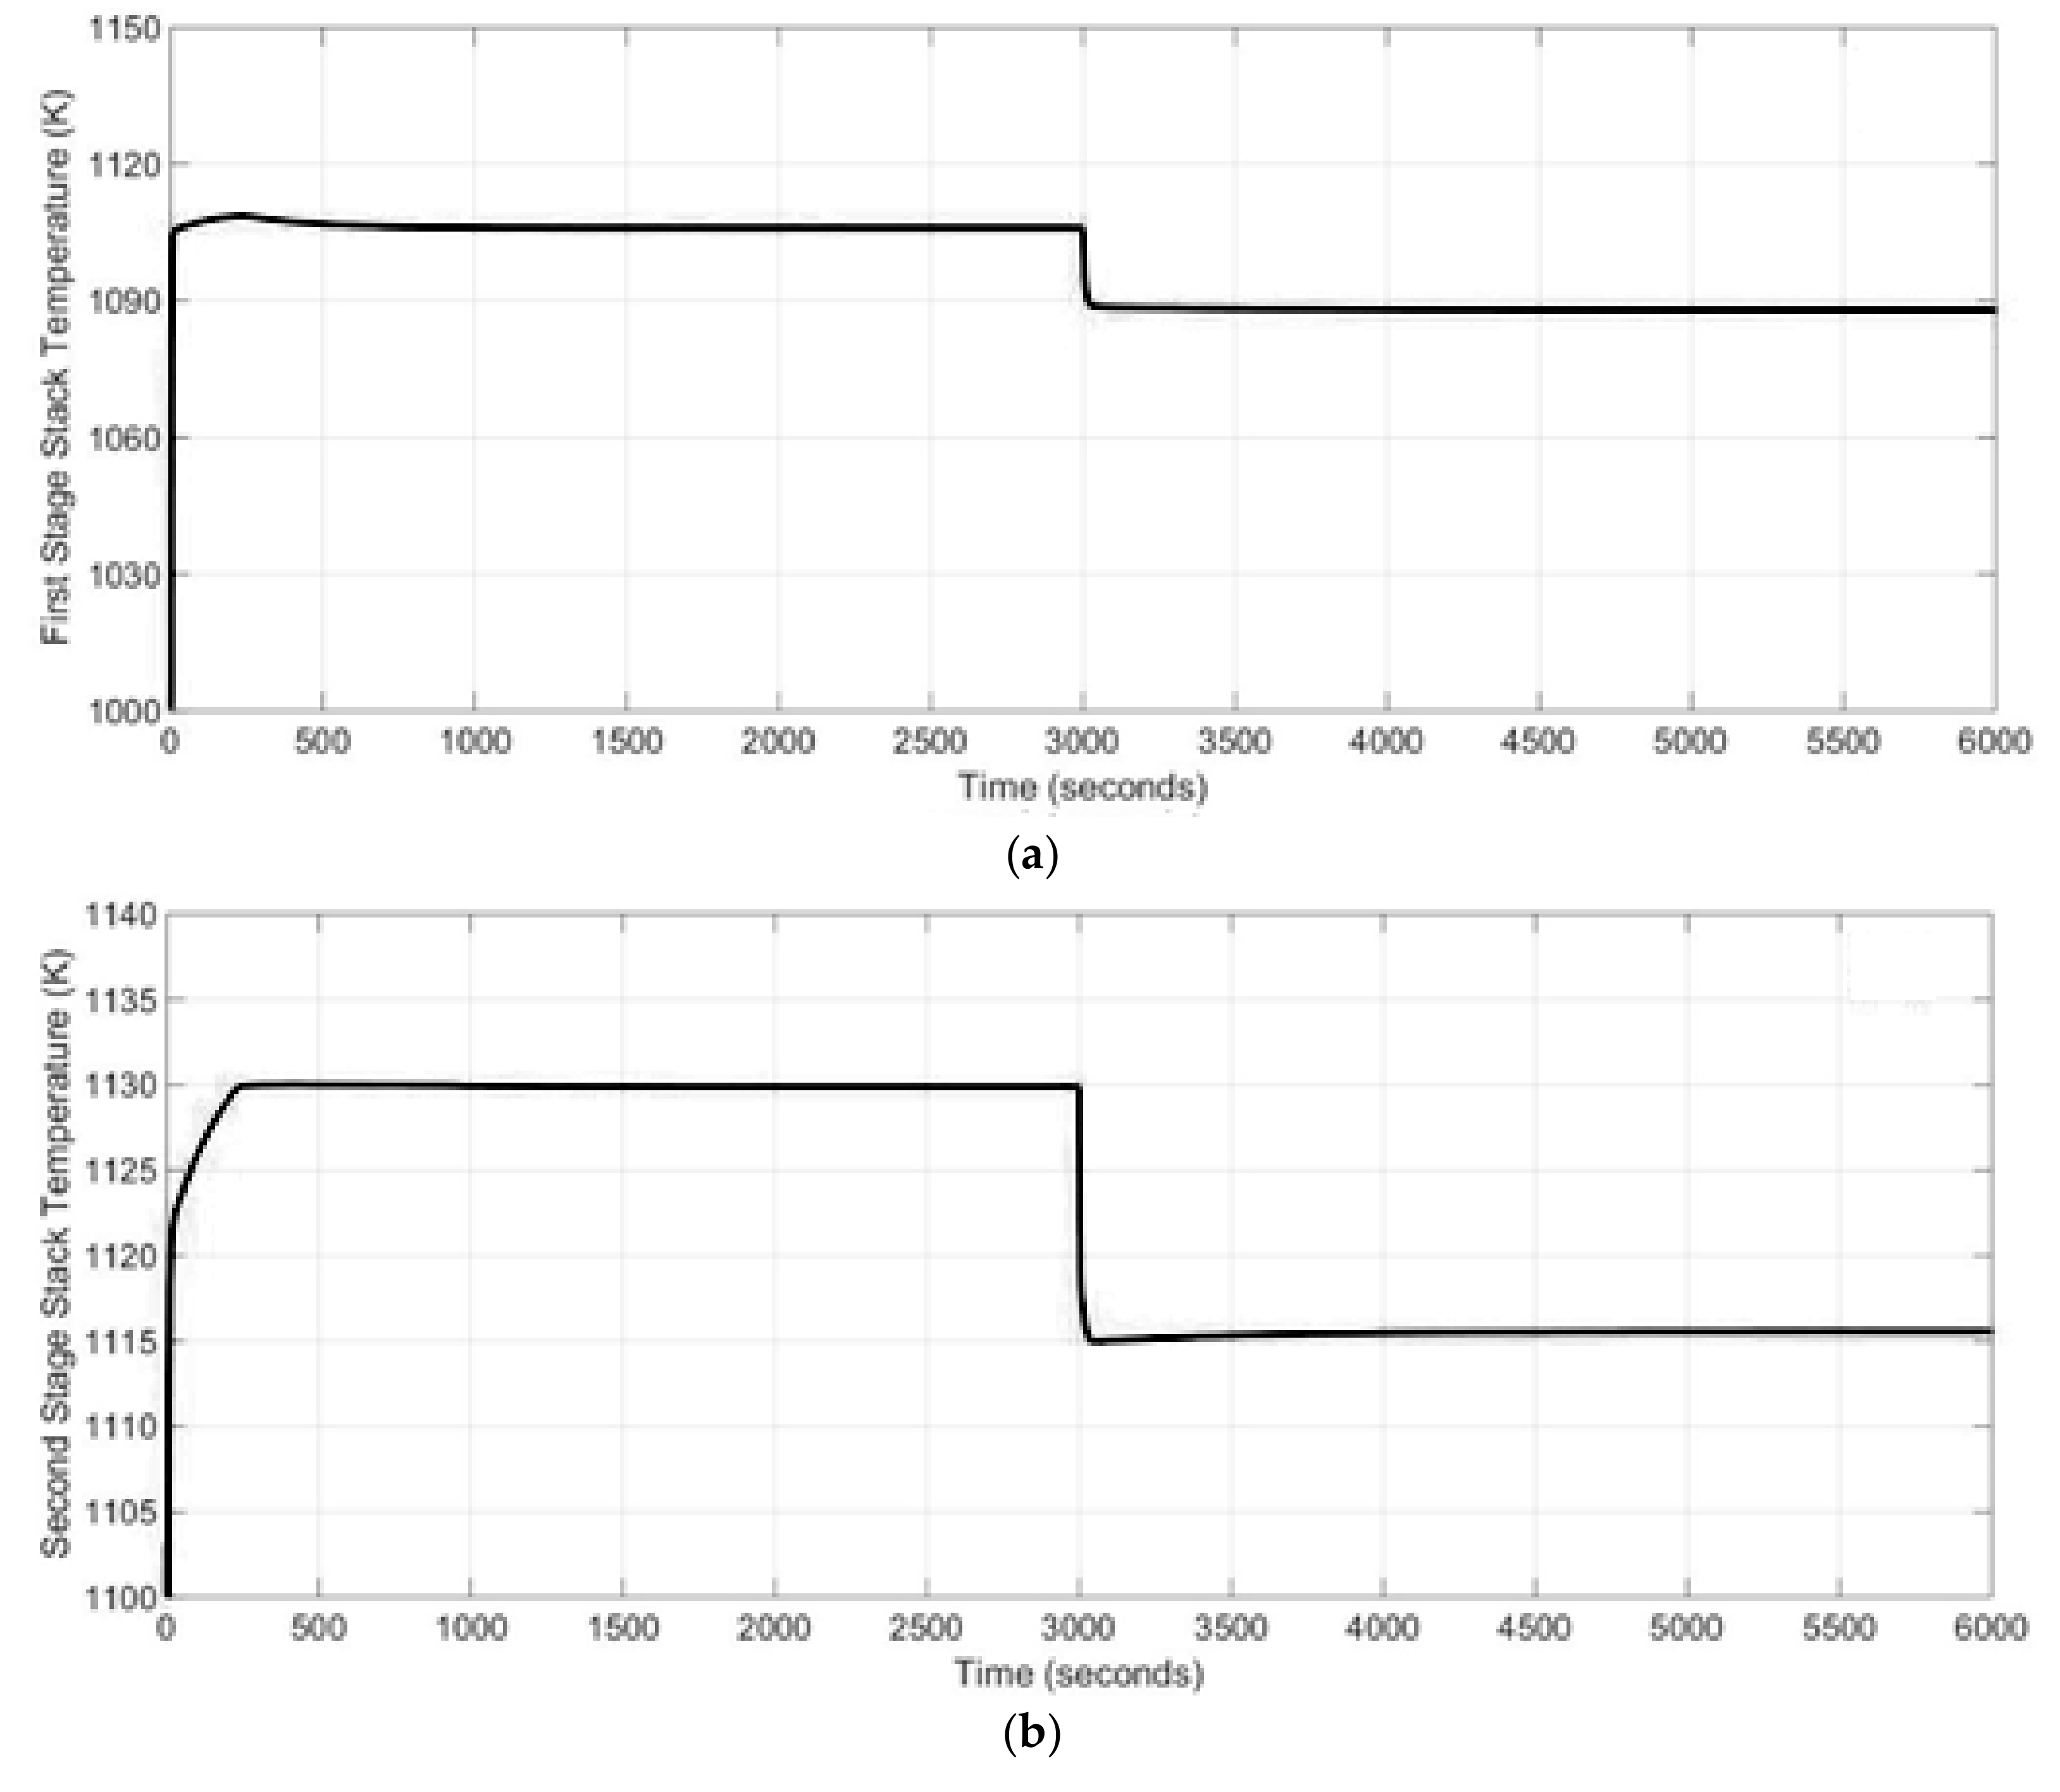
Therefore, in this study an evaluation of a power generation system design with two serially connected SOFC stacks with different number of cells will be presented. The first SOFC stack contains 90 cells, while the second one has 240 fuel cells. Our numerical analysis includes simulations of the complete system assuming the use of anode off gas from the first stack in the steam reformer preceding the second stack. Special attention is given to two different fuel processor units that generate hydrogen through reforming of methane. Moreover, the developed model allows us to investigate the interaction between the system components during transient state.
2. Modelling Methodology
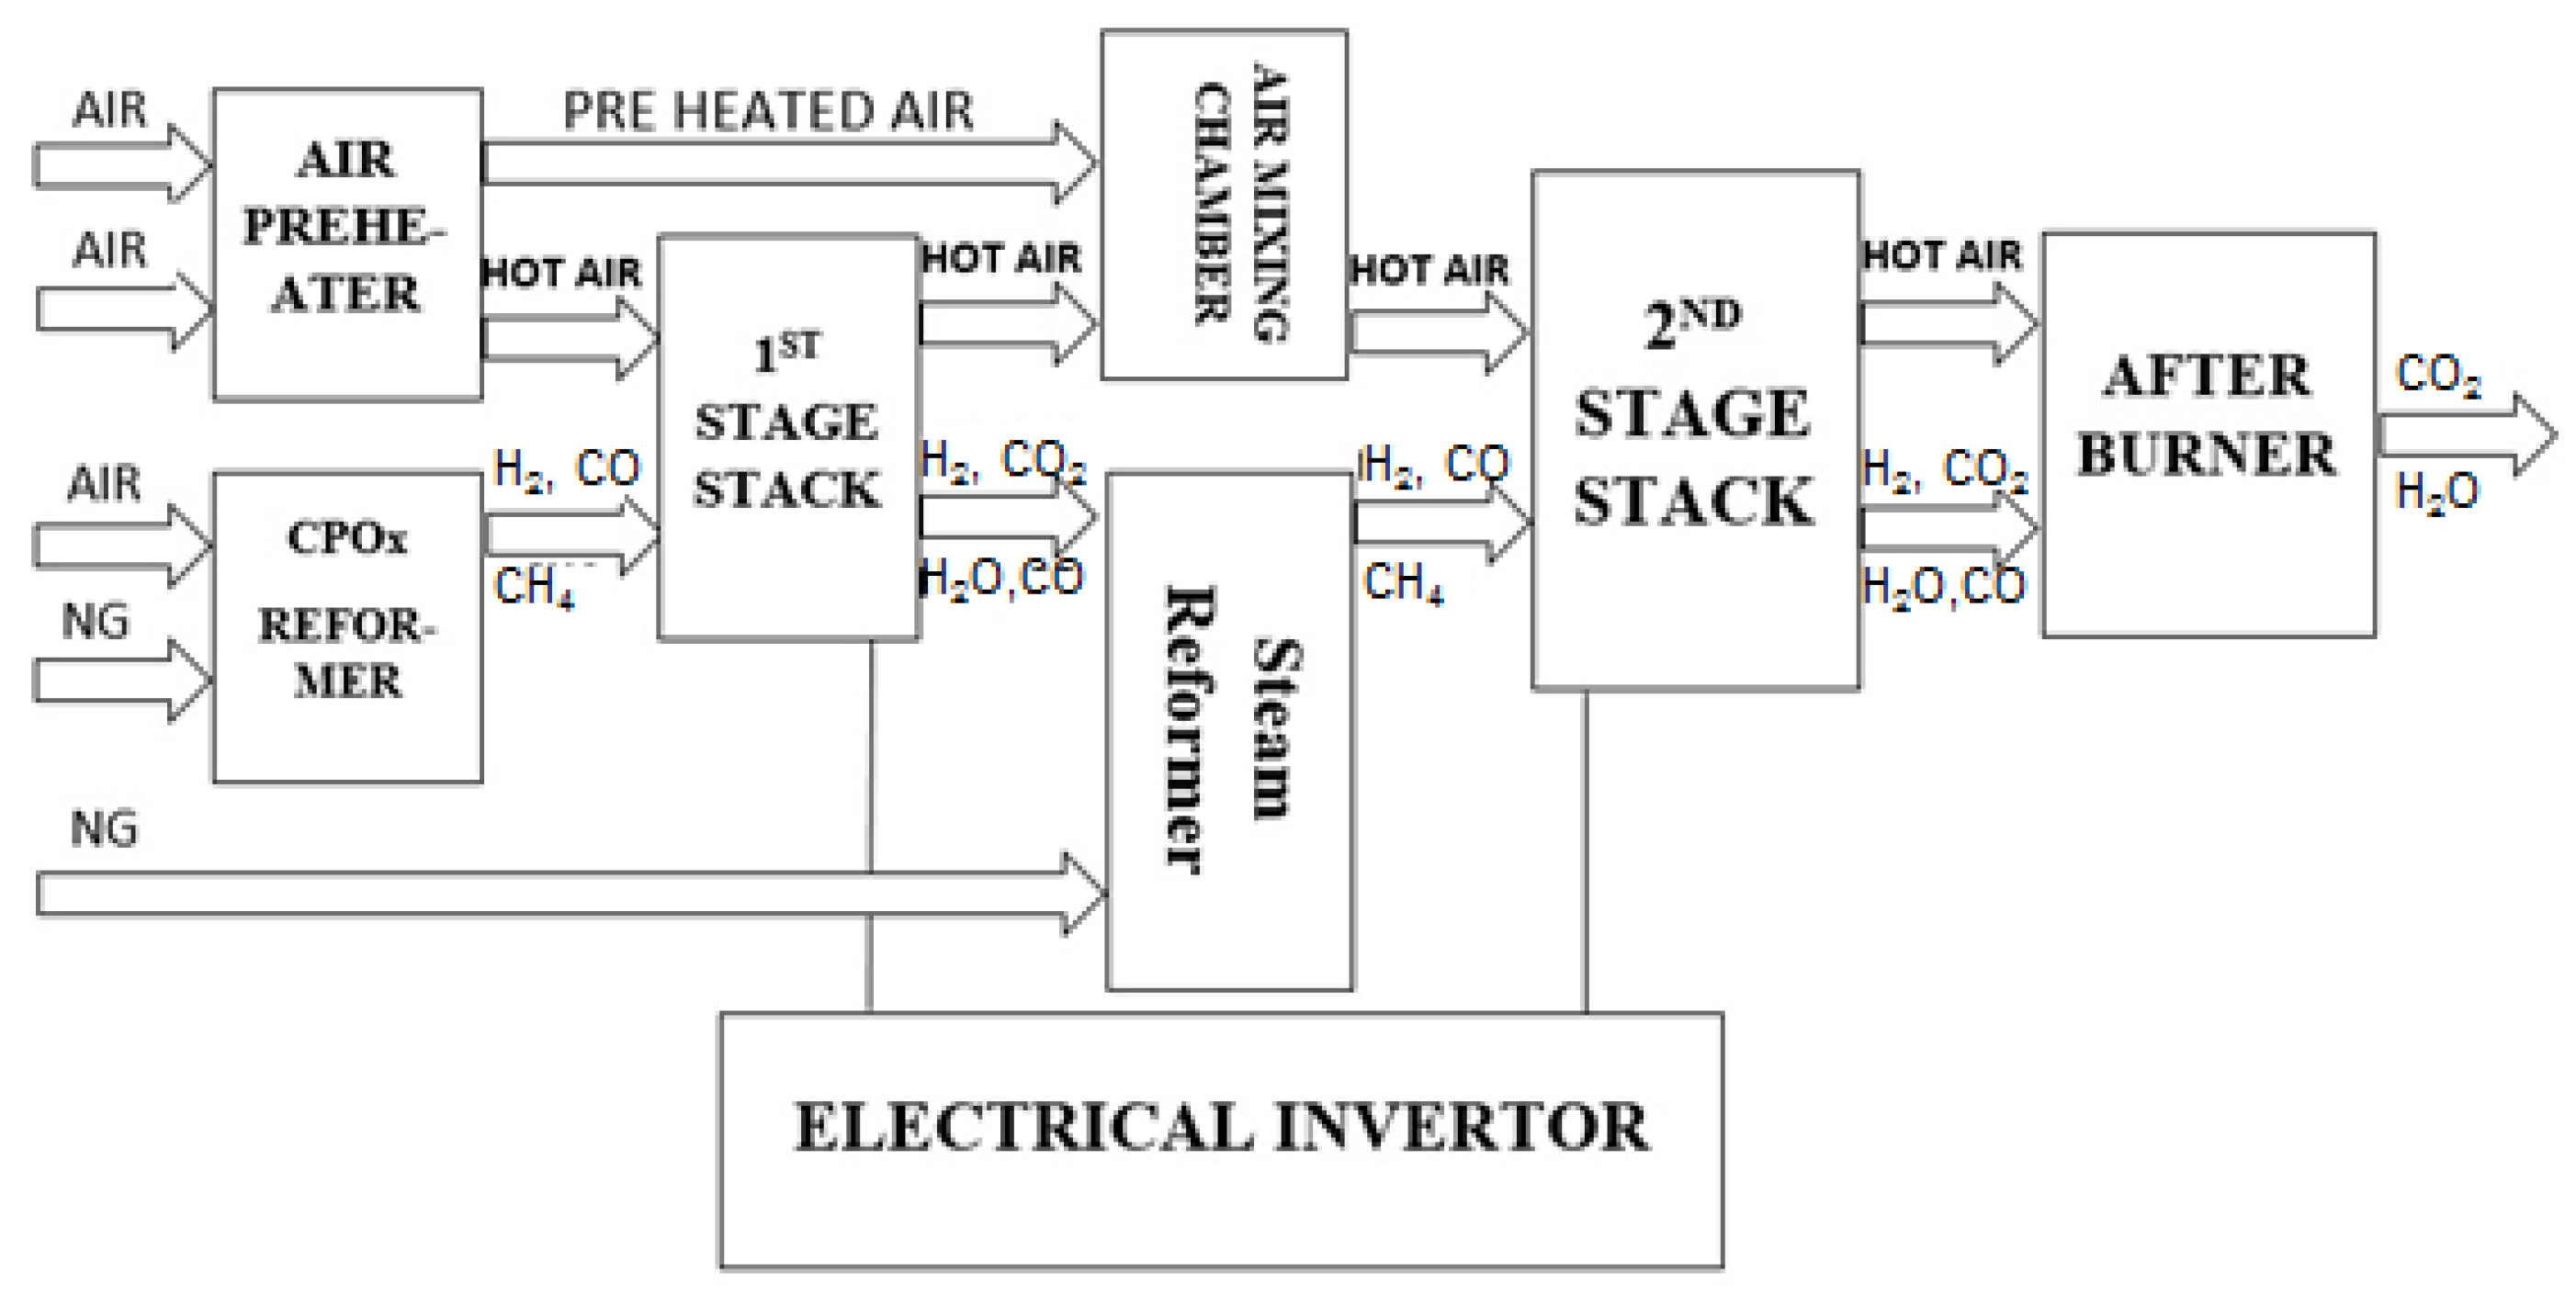
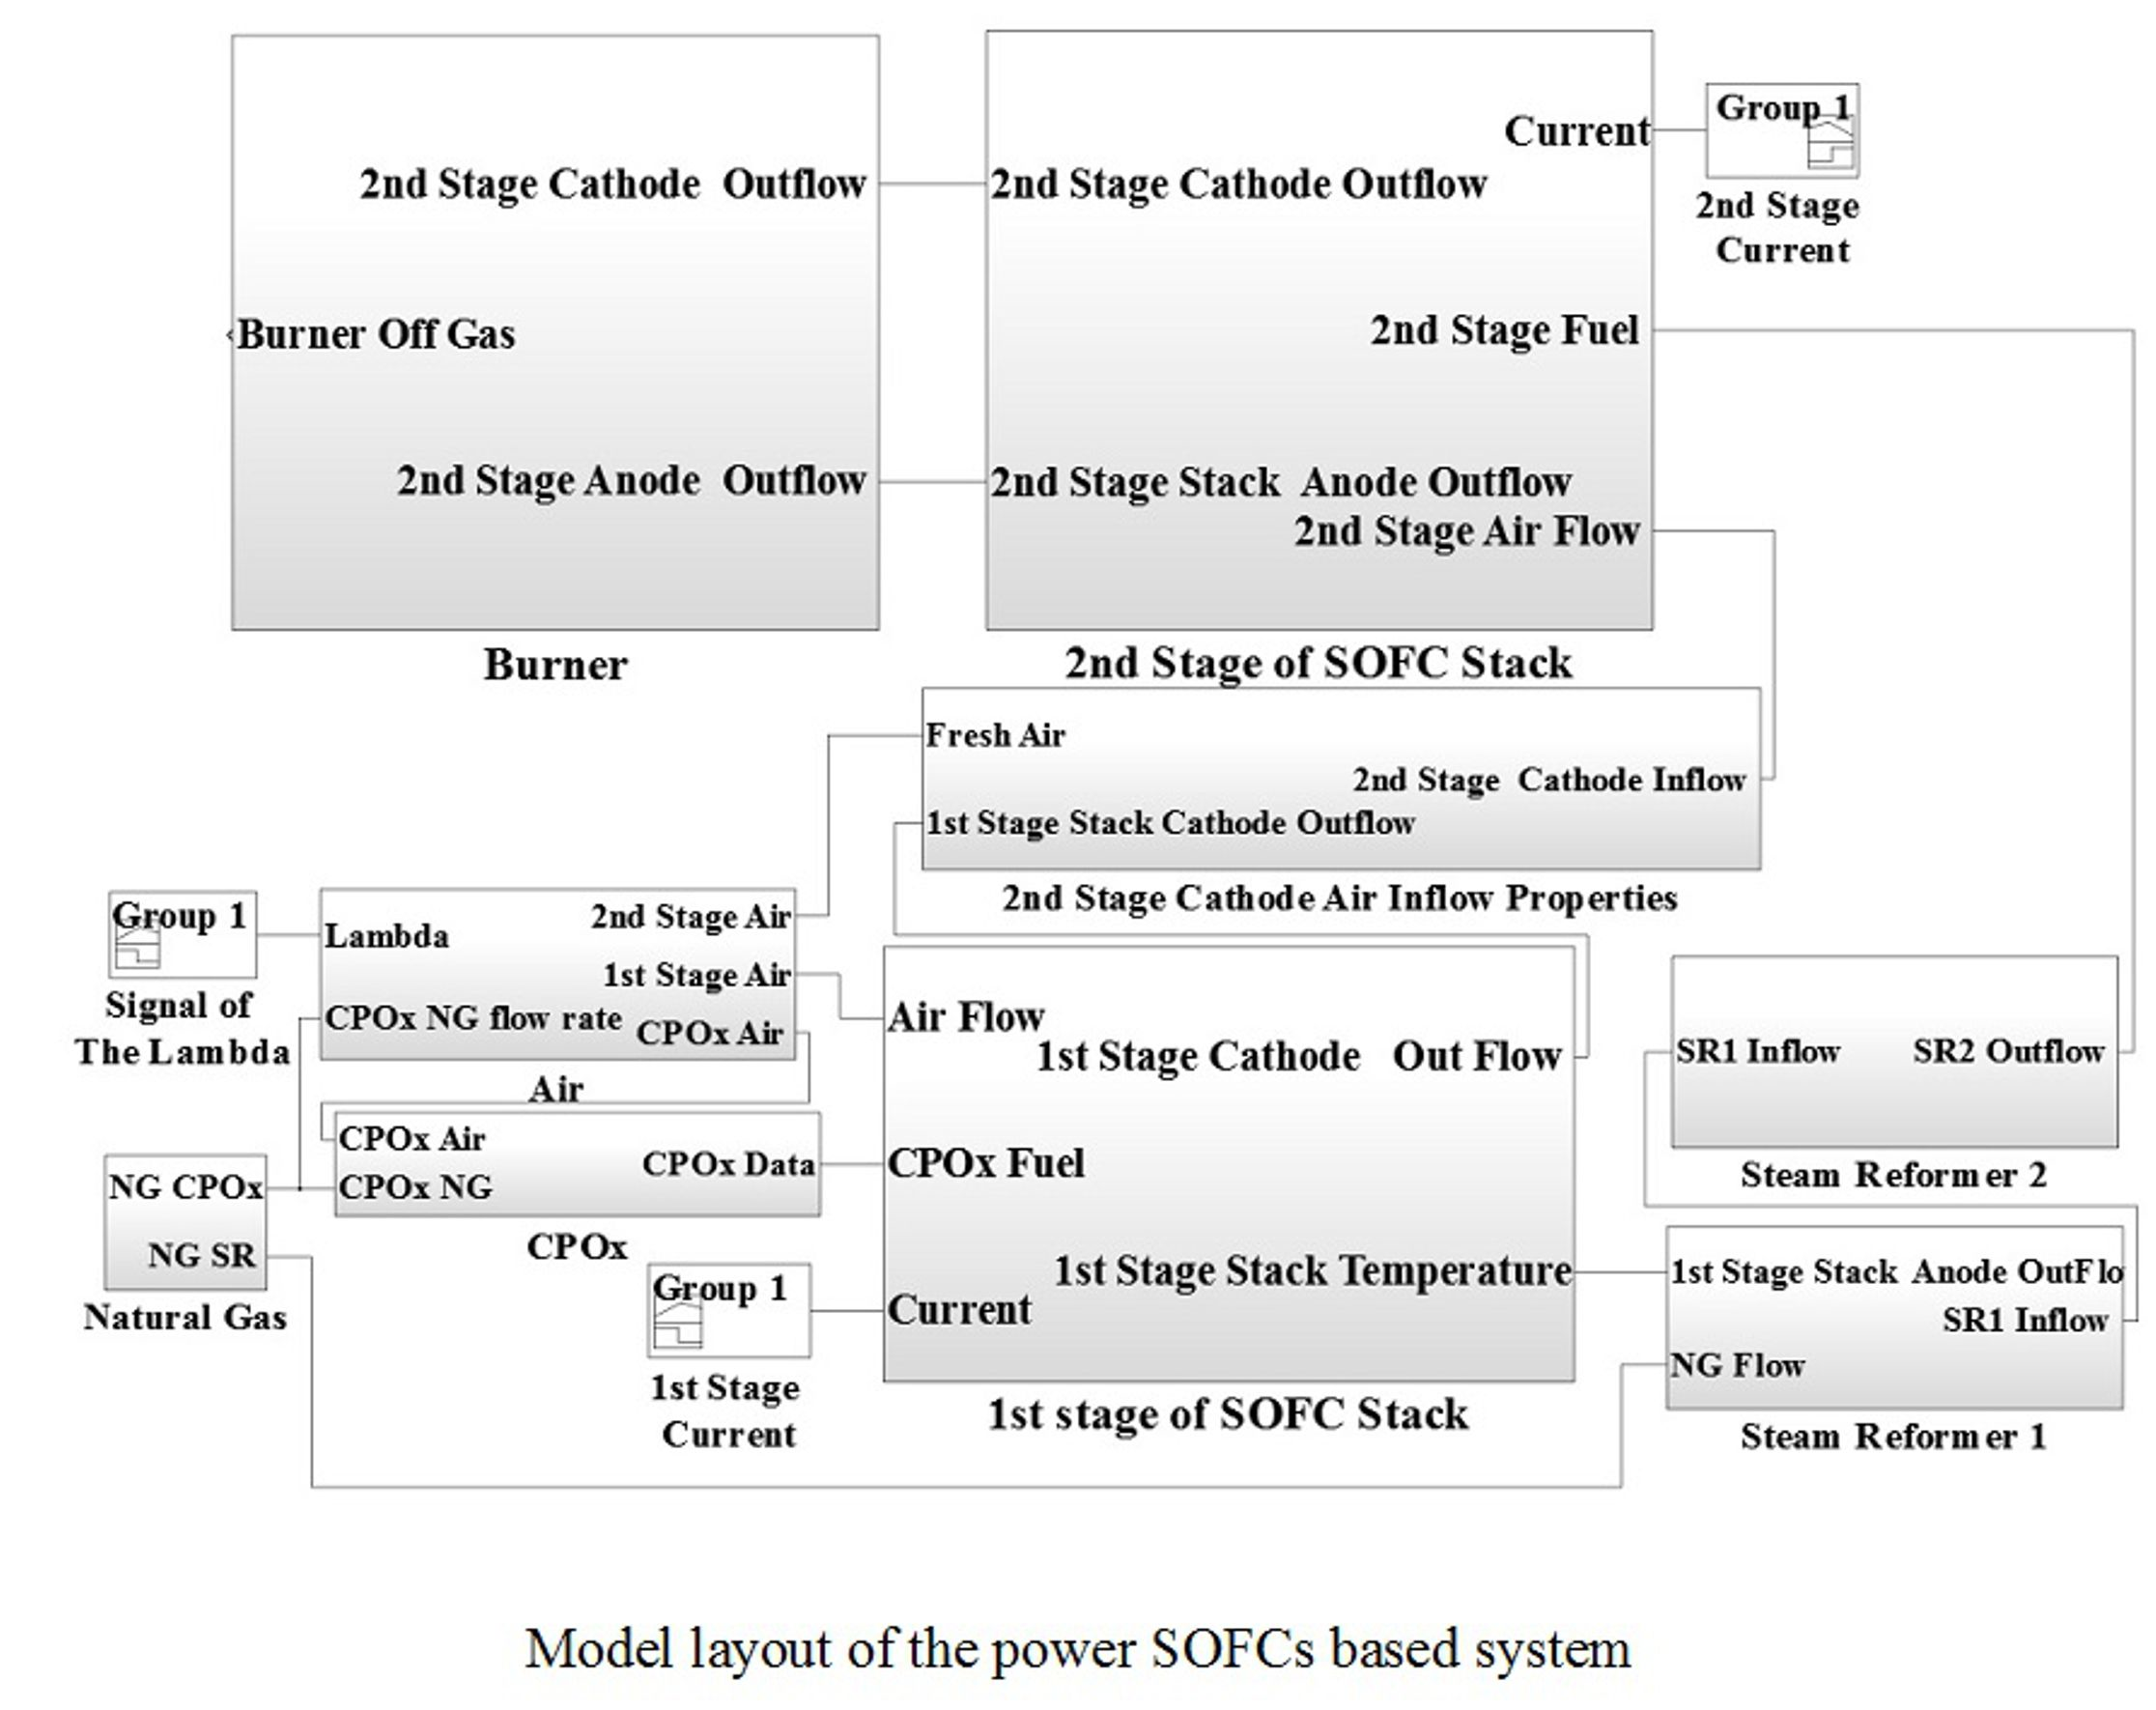
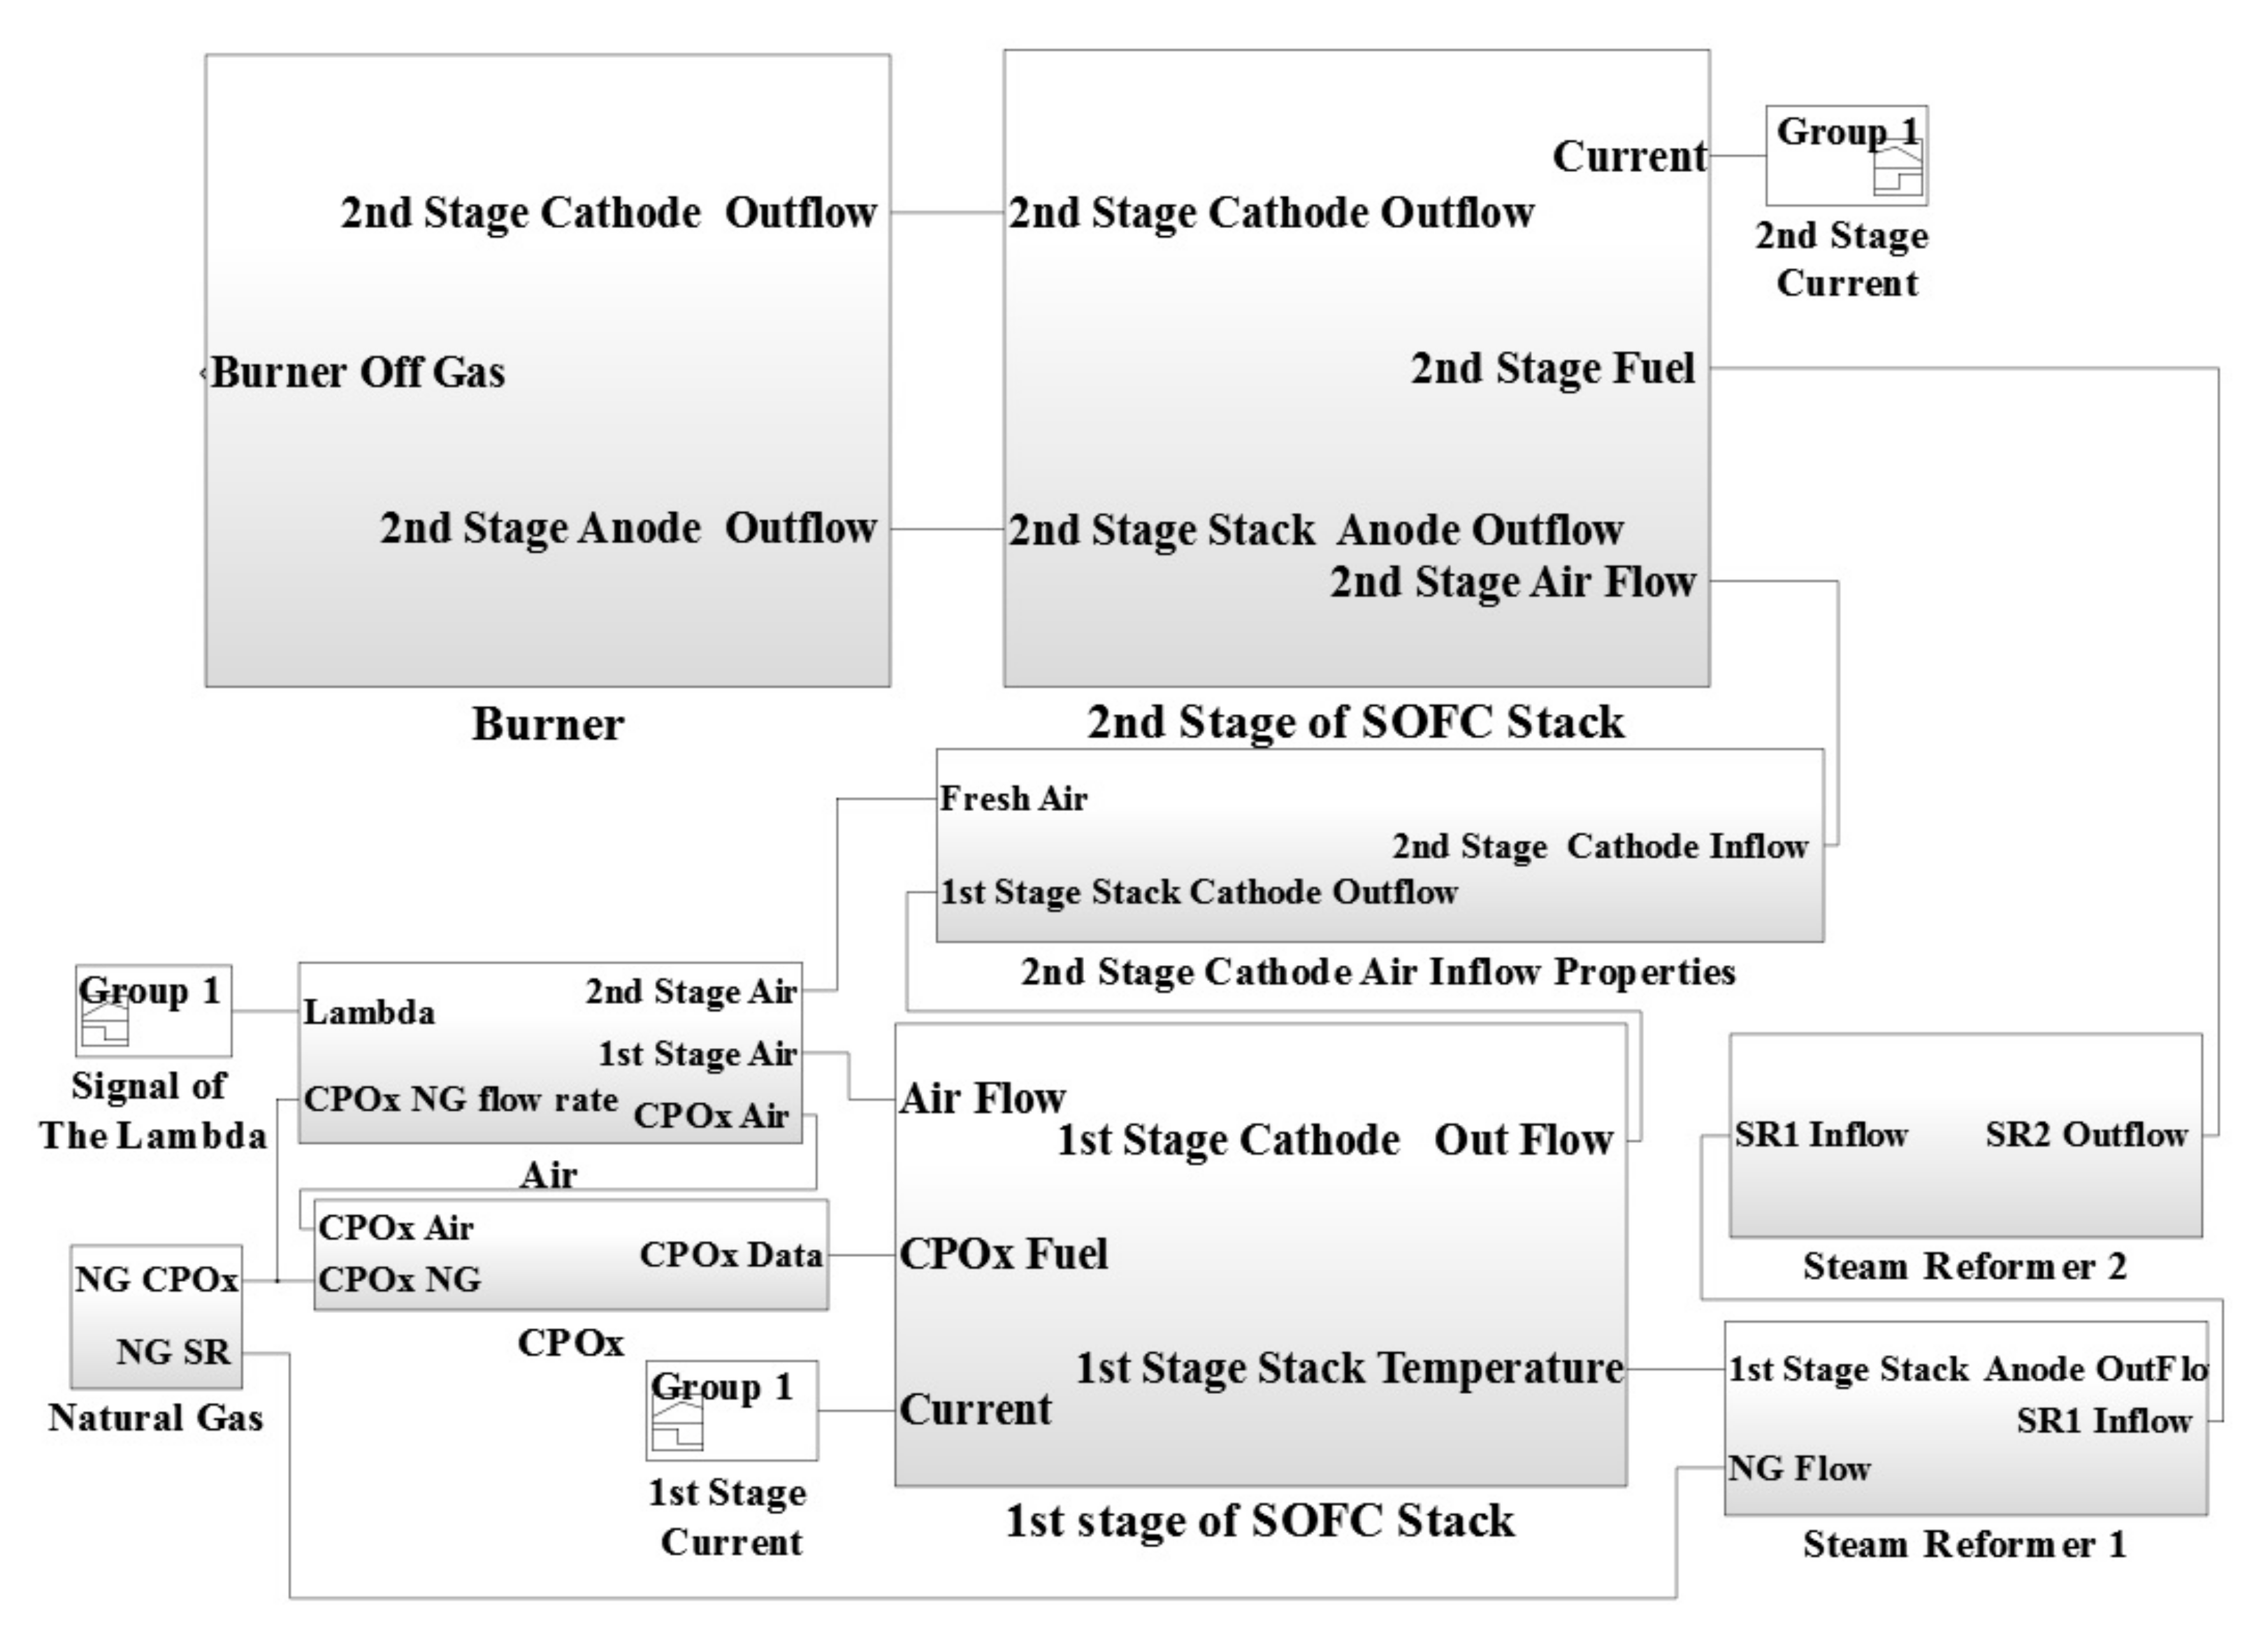
The system considered in this study is presented in
Figure 1. The following components are shown: (a) air preheater, (b) CPO
x reformer, (c) 1st stage SOFC stack, (d) air mixing chamber, (e) steam reformer, (f) 2nd stage SOFC stack, (g) burner, (h) DC/AC inverter as well as additional components such as valves, pipes not specified here. Two SOFC stacks were connected in series.
Dedicated models of the components were developed and implemented in a Matlab SIMULINK environment. The complete model of the system was based upon a set of fundamental equations accounting for fluid dynamics, thermal dynamics and kinetic behavior of feed streams. The assumptions and conditions of the models used in the simulations are as follows:
fuel and oxidant are considered as ideal gases;
the density and heat capacity of the solid components are temperature independent;
nitrogen is not used in the reactions;
In the following sections the various parts of the model, shown in the global diagram in
Figure 1, have been presented with details for each component of the power SOFC-based system used in this study including the implemented equations and design parameters.
2.1. CPOx Reformer
The dynamic model of the CPO
x reformer has to estimate the molar flow rate of the reactant outflowing the reformer and its temperature. For this purpose, a mathematical model for the CPO
x reformer applied in this study is based on a well-tested approach developed by Pukrushpan et al. [
25], where four main chemical reactions are considered. Zhu et al. [
26] discussed in details the first two reactions of partial oxidation (POX) and total oxidation (TOX) taking place in the CPO
x reformer and shown in Equations (1) and (2), respectively:
The other two reactions of hydrogen oxidation (HOX) and carbon monoxide oxidation (COX) were discussed by Larentis et al. [
27] and are shown in Equations (3) and (4), respectively:
All reactions inside the CPOx reformer are exothermic and occur simultaneously. The methane was fed to the CPOx reformer for conversion to syngas consisting of H2, H2O, CO, CO2, O2 and unreacted CH4. The hydrogen and carbon monoxide from the reformer were fed to the 1st stage SOFC stack to generate electric power and heat. The following assumptions were used to simplify the study of the CPOx reformer:
gas compositions and temperature of the flow entering the reformer were constant;
ideal gas laws were applied to flows;
gas mixtures were treated as perfect mixtures;
impact of temperature variations on the partial pressure dynamics was assumed negligible;
the volume of the CPOx reformer was relatively small and therefore it was ignored;
the gas volume in the CPOx catalyst bed is relatively small as well, so the gas inertia was ignored too;
CPOx reactions have rapid kinetics and reach equilibrium conditions before the flow exits the reactor control volume.
The reforming efficiency and the amount of hydrogen produced in the CPO
x reformer depended on the initial oxygen to carbon ratio (λ
O2C) as well as catalyst bed material and temperature. The most important parameter is the lambda number, λ
O2C, which represents the molar ratio of the oxygen to carbon entering the CPO
x reformer and it was defined by Equation (5):
where
and
are the inlet molar flow rates of the oxygen and methane.
The lambda number was assumed to be higher than 0.5 to avoid wasting fuel. Acceptance of the lambda number lower than 0.5 resulted in the amount of produced hydrogen being limited by the amount of supplied oxygen [
26]. On the other hand, too high a lambda number causes an increasing temperature of the CPO
x reformer, which could lead to the catalyst bed being damaged. Therefore, it was important to estimate the amount of heat released from reaction (6):
where the molar flow rate
is calculated from Equation (7):
The variables α, β and S are the CPO
x reaction rates. Their definitions are as follows [
25]:
In order to increase the amount of hydrogen formed it is desirable to provide a higher POX reaction rate than the TOX reaction rate, which can be achieved for values of S close to one. Since there were two moles of hydrogen produced per one mole of carbon monoxide produced in the POX reaction, more oxygen reacted with hydrogen than with carbon monoxide and therefore the ratio λ
O2C was kept constant and equal to 0.66 [
26].
The set of equations to calculate the molar flow rates of each reactant outflowing the CPO
x reformer is given by the following Equations (12)–(17):
Finally, the CPO
x reformer dynamic thermal behavior was modelled by applying the energy balance Equation (18) assuming that the only dynamic quantity considered in the CPO
x reformer was the catalyst temperature, T
CPOx:
where
(kg) and
(J/kg·K) are mass and specific heat capacity of the catalyst bed, respectively. The term i represents four species in the inlet flow and j represents the species at the outlet flow.
and
are the reference temperature (298 K) and inflow temperature.
and
(J/kg·K) are the specific heat of the reactants.
and
are the molar mass of the reactants and their molar flow rate, respectively.
2.2. Steam Reformer
Conversion of methane and steam into a mixture of hydrogen, carbon monoxide and carbon dioxide was considered as a combination of the two reactions taking place in the steam reformer (Equations (19) and (20)):
Both reactions are reversible and due to the high temperature of the reforming process, the reactions reach equilibrium conditions over an active catalyst very fast. Thus, the actual composition of the outflow leaving the steam reformer is a factor of the reactor temperature and operating pressure as well as the composition of the feed gas [
28]. In order to produce more amount of hydrogen, carbon monoxide and steam take part in the reversible exothermic water gas shift reaction. The implemented thermal energy balance for the steam reformer was calculated as follows (Equation (21)):
where: M
SR (kg) and
(J/kg·K) are the mass and specific heat capacity of the catalyst bed, respectively. T
SR is steam reformer temperature.
2.3. SOFC Stack
One of the biggest challenge in dynamic modelling of the SOFC stack is consideration of the complex composition and reactions in the bulk flow inside the fuel channel as well as on the anode side. In the proposed approach, carbon monoxide is considered as the fuel used to produce hydrogen through the water gas shift (WGS) reaction. Due to the presence of the catalyst layer and high stack operating temperature, direct internal reforming (DIR), is taking place and leads to the reforming process of methane directly inside the fuel channel. Equations (22) and (23) describe the DIR reactions and WGS for the fuel channel:
While the electrochemical reactions for the cathode and anode were given as follows (Equations (24) and (25)):
Thus, in the SOFC model, two electrochemical reactions (24) and (25) were considered and it was assumed that the reactions occurred at the electrolyte-electrode boundaries. The chemical reactions (22) and (23) were assumed to be at equilibrium. The partial pressure of the reactants was assumed to be the average of the internal and external partial pressure of each reactant. The parameters of a single cell were lumped together to represent a fuel cell stack. In order to study transient behavior of the SOFC stack at various operating conditions, the physical parameters of the stack were considered by neglecting three-dimensional distribution of variables, such as current density, reactant composition, pressure and temperature along the flow channel. These variables were assumed homogeneous in the fuel cell. The electrochemical, energy and mass balance equations were applied in the model and are presented in detail below.
2.3.1. Electrochemical Model
The operation voltage of the fuel cell, U
c, was calculated from Equation (26) [
29]:
The open circuit voltage, U
OCV, was defined in Equation (27):
where
is the standard cell potential;
and
are the partial pressure of hydrogen, oxygen and steam, respectively; R is the universal gas constant; F is the Faraday number; N is the number of the cells in the stack and T
e is the stack temperature [
29].
The standard fuel cell potential,
, was calculated from Equation (28) [
29]:
The fuel cell voltage losses, U
o, was calculated from the following Equation (29) [
29]:
where i is the stack drawn current. The influence of pressure and reactant ratio was neglected in this approach. The constants A, B, C and T
ref have to be determined for each cell type. To estimate these constants, the ASR function is used to match the experimental data or by determining their values based on the fuel cell specific parameters.
2.3.2. Mass Balance Sub-Model
The mass balance sub-model was determined the species partial pressure of the bulk flows in the fuel and air channels as follows [
29]:
where
is the partial pressure of i-th reactant, V is the volume of the anode or cathode,
is the molar reaction rate of each reactant inside the channels,
is the molar flow rate of species entering the stack determined by the fuel and air inlet condition, while
is the molar flow rate of the outflows from the anode and cathode.
The following Equations (31)–(35) were used for the reactions rates of the reactants inside the anode:
while the reaction rate of the oxygen inside the cathode channel was calculated from Equation (36):
where R
SR is the rate of the internal steam reforming inside the SOFC stack; R
WGS is the rate of the water gas shift reaction; R
r is the rates of oxidation or redox reactions.
The rate of the internal steam reforming, R
SR, was calculated based on the approach developed by Achenbach [
30]:
where k
SR = 0.04274 (mol/cm
2Pa) and E
SR = 82 (kJ/mol). The water gas shift reaction was considered to be very fast at temperatures higher than 600 (K) and in this case was assumed that it reached its equilibrium condition [
20].
A constant value of the reaction rate k
WGS = 0.0000125 (mol/cm
2Pa) was applied.
was calculated from Equation (39) [
20]:
The rates of oxidation and redox reactions were defined as a function of the current density as follows [
20]:
The molar flow rate of the outflows,
, was defined by the relation of the fuel and air flow stability (Equation (41)) [
20]:
where P
o is the total pressure of the downstream flow; y
i is the molar fraction of the reactant in the flow, α(m
2·s/Kg) is the orifice constant of the fuel channel.
2.3.3. Energy Balance Sub-Model
The energy balance sub-model is based on the assumption that the temperature is constant along the flow direction. Therefore, the dynamics of the electrode temperature, T
e, can be expressed as a function of diffusive, convective and reactive heat transfer terms. However, due to small distance between the layers inside the stack, the radiative heat transfer inside the stack was neglected in this approach. Consequently, the energy balance sub-model for the electrolyte boundary contained the heat (Equation (42)) and work (Equation (43)) conservation equations, respectively, as follows:
where: m
Se (kg) is the mass,
(J/kg·K) is the fuel cell materials average specific heat, R
j is the reaction rate,
is the specific heat of reactions, C
p,i is the specific heat of the reactants entering the anode or cathode,
and
are the molar flow rate of the reactants entering and exiting the SOFC stack.
To simplify the dynamic study of two serially connected SOFC stacks, the following assumptions used and tested for the power generation system based on the single SOFC stack by Pianko-Oprych et al. [
31] were applied in this approach:
gases were treated as perfect mixtures,
electrochemical reactions occurred at the electrode-electrolyte boundaries,
density and heat capacity of the solid components were temperature independent,
parameters for individual cells can be lumped together to represent a fuel cell stack,
adiabatic boundaries for the fuel cell were used.
2.4. Burner
To increase the thermal efficiency of the power generation system a non-premixed catalytic burner was applied. The mathematical model describes an ideal burner, which mixes the streams of the 2nd stage anode and cathode and turns all entering methane, hydrogen and carbon monoxide to carbon dioxide and steam according to the following three reactions (44)–(46) considered inside the burner:
The burner was assumed to be adiabatic and frictionless. It operates at constant pressure. The outlet temperature of the burner was the same at the inside temperature. Energy balance equation around the burner boundary was described based on Equation (47):
where
, V and
are the density, volume of the burner chamber and specific heat of gases inside the burner volume, respectively.
are molar flow rates of the hydrogen, carbon monoxide and methane entering the burner, while
are the specific heats of reaction.
is the specific heat of the reactants entering the burner,
and
are the molar flow rate of the reactants entering and exiting the burner.
2.5. Simulations
An independent analysis of single equipment such as reformer, SOFC stack or burner is not enough to understand the behavior of the whole system, because the system elements affect the others. Thus, the information given by the dynamic model developed here for two stage SOFC stacks power generation system can be helpful for a better understanding of which operating conditions are conducive to increasing system performance and which are harmful and should be avoided.
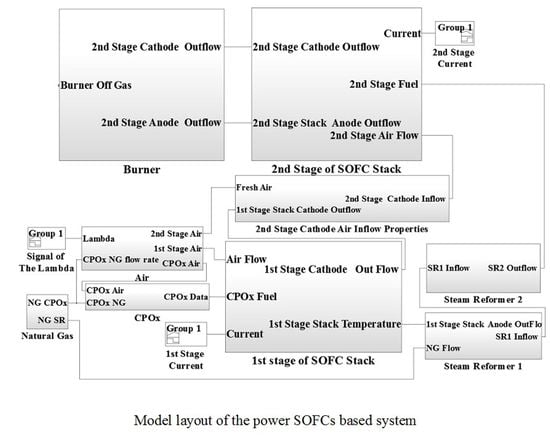
A complete concept of the designed model of two stage SOFC stacks power generation system is represented as a block diagram in
Figure 2. The air block defines the molar flow rates of the air entering the CPO
x reformer, the first stage cathode and the second stage cathode. The amount of air entering the CPO
x reformer was calculated based on the lambda number and the CPO
x natural gas inflow rate. The physical parameters of the 1st stage fed fuel was calculated by the CPO
x reformer block. The inputs were the CPO
x inflow rate, inflow molar fraction, temperature of the flow and pressure. The fuel and air flows were mixed before the CPO
x reformer inlet.
The inputs of the system are the first stage current, the second stage current, CPO
x inflow rate and lambda number as well as the first stage fuel and air molar flow rates and the second stage air and fuel molar flow rates given in (mol s
−1). The main parameters describing the SOFC system are presented in
Table 1.
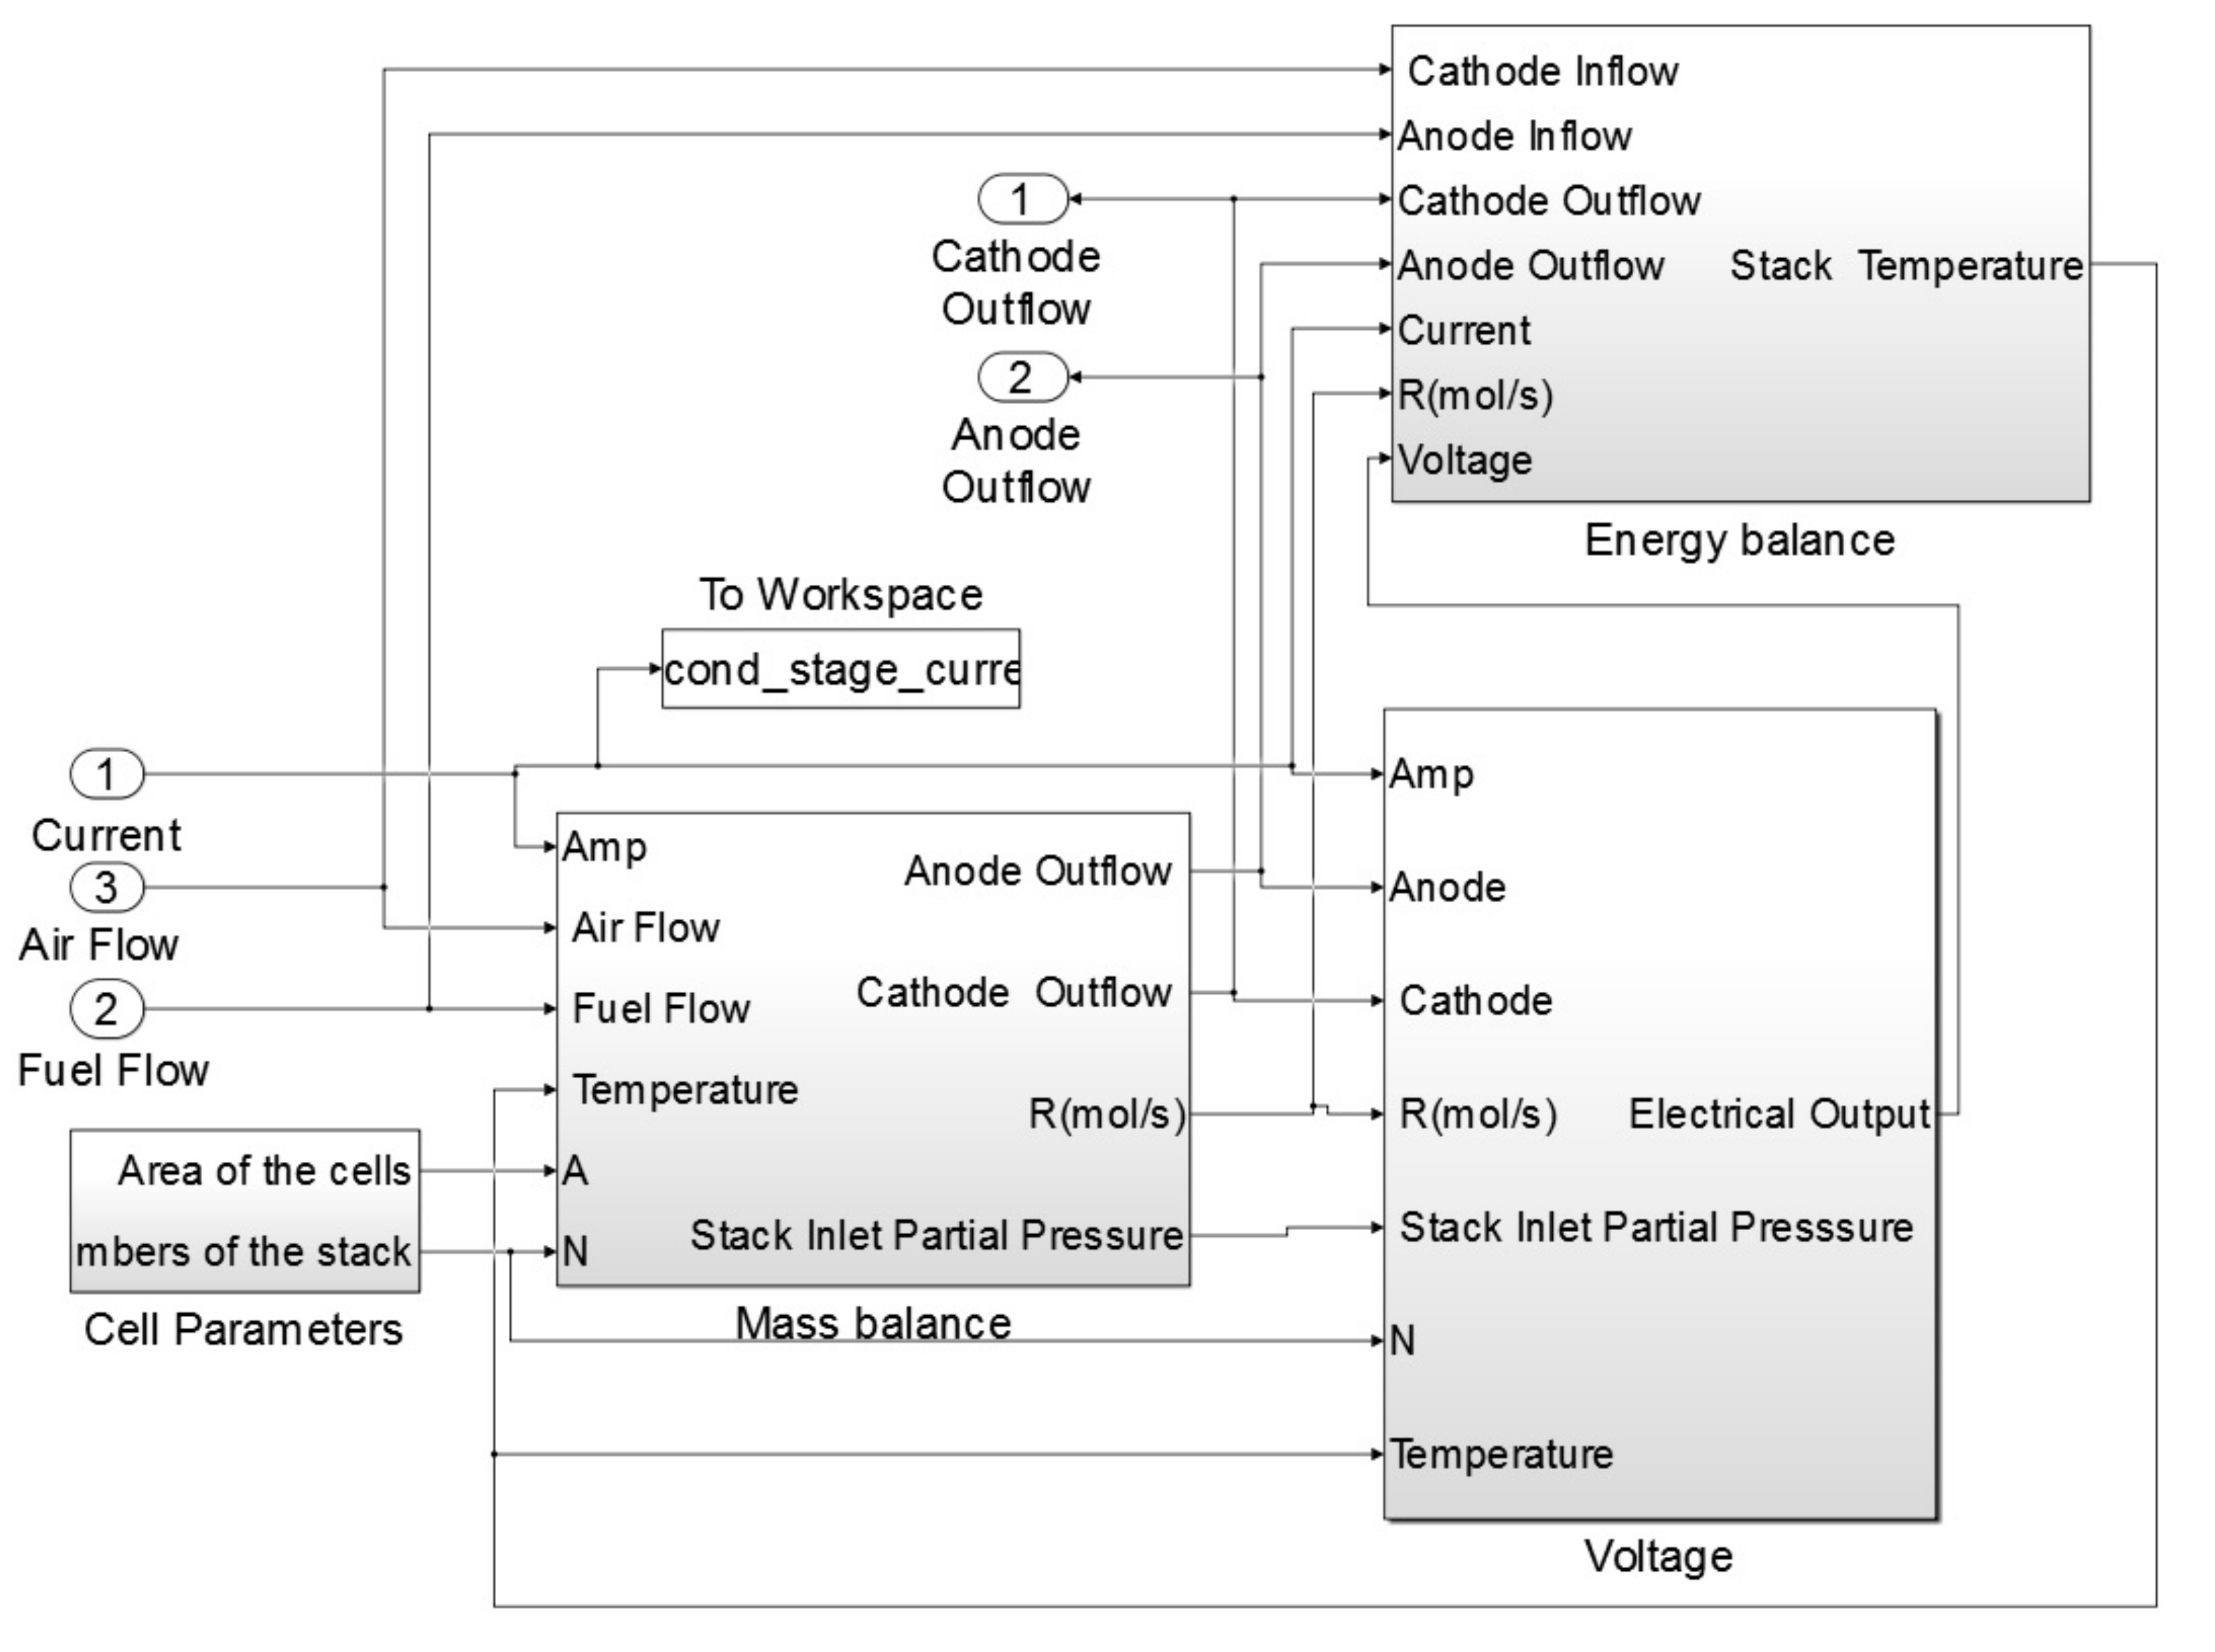
The block diagram of the 1st and 2nd stage SOFCs consisted of three main sub-systems: mass balance, energy balance and voltage. The 1st stage SOFC stack model block example is shown in
Figure 3.
The most important sub-system of the SOFC stack model was the mass balance. The mass balance sub-system calculates the reaction rates inside the stack as well as the molar flow rate of the outflows of the anode and cathode. The voltage sub-system calculates the open circuit voltage of the system and the losses. In addition, the following parameters were calculated within this block: the cell voltage, stack terminal voltage, gross power as well as efficiency of the SOFC stack. The last important sub-system in this block was the energy balance. Temperature of the SOFC stack during the simulation was calculated based on this sub-system.
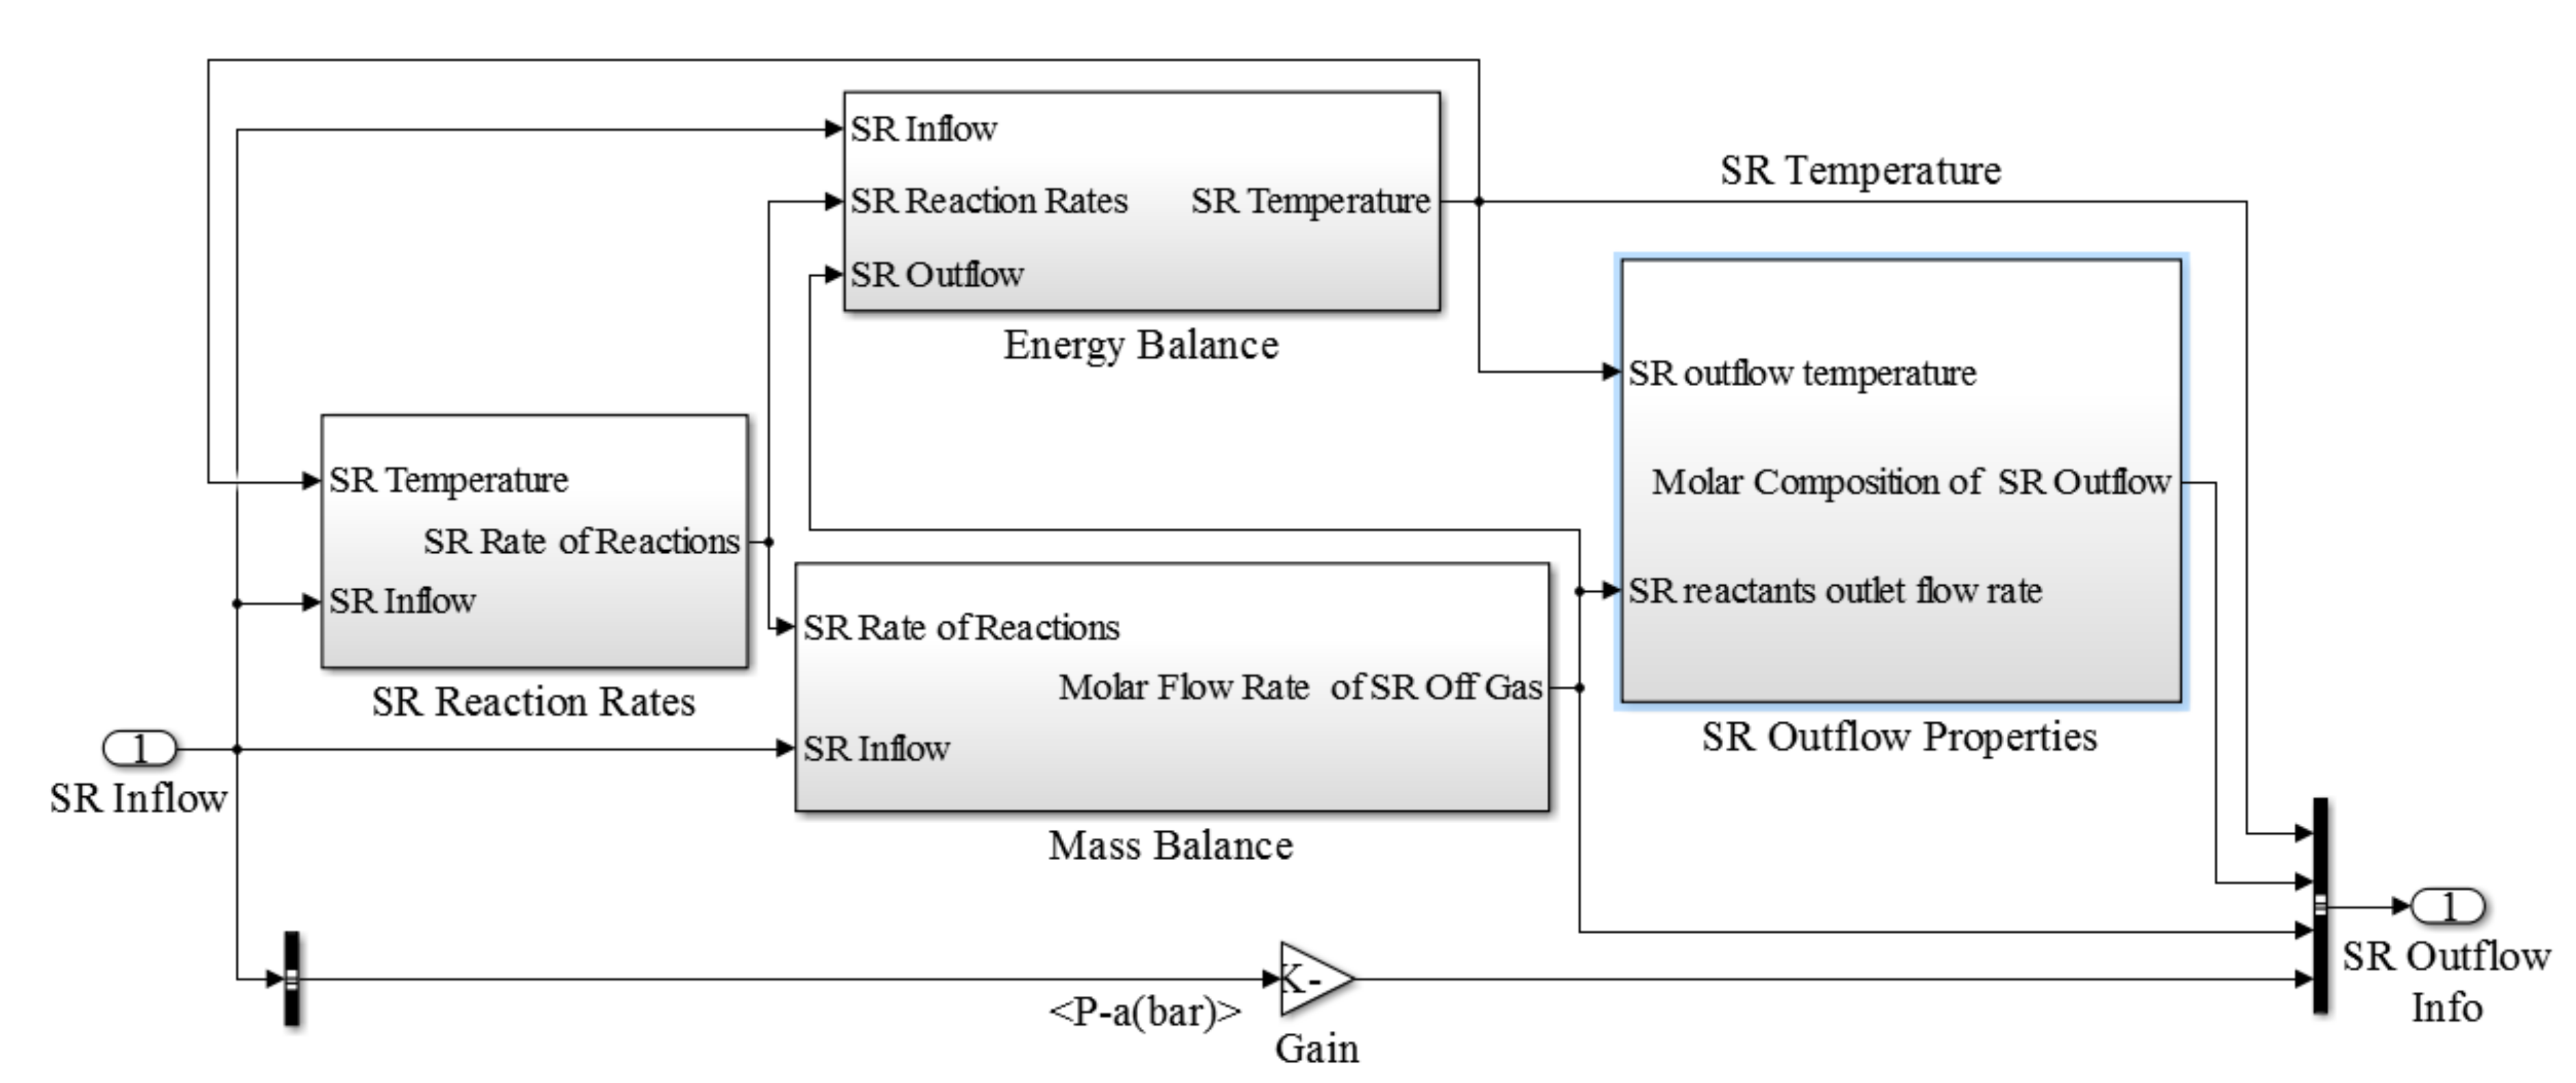
The steam reforming block consisted of three main components as steam reforming reaction rates, energy balance and mass balance (
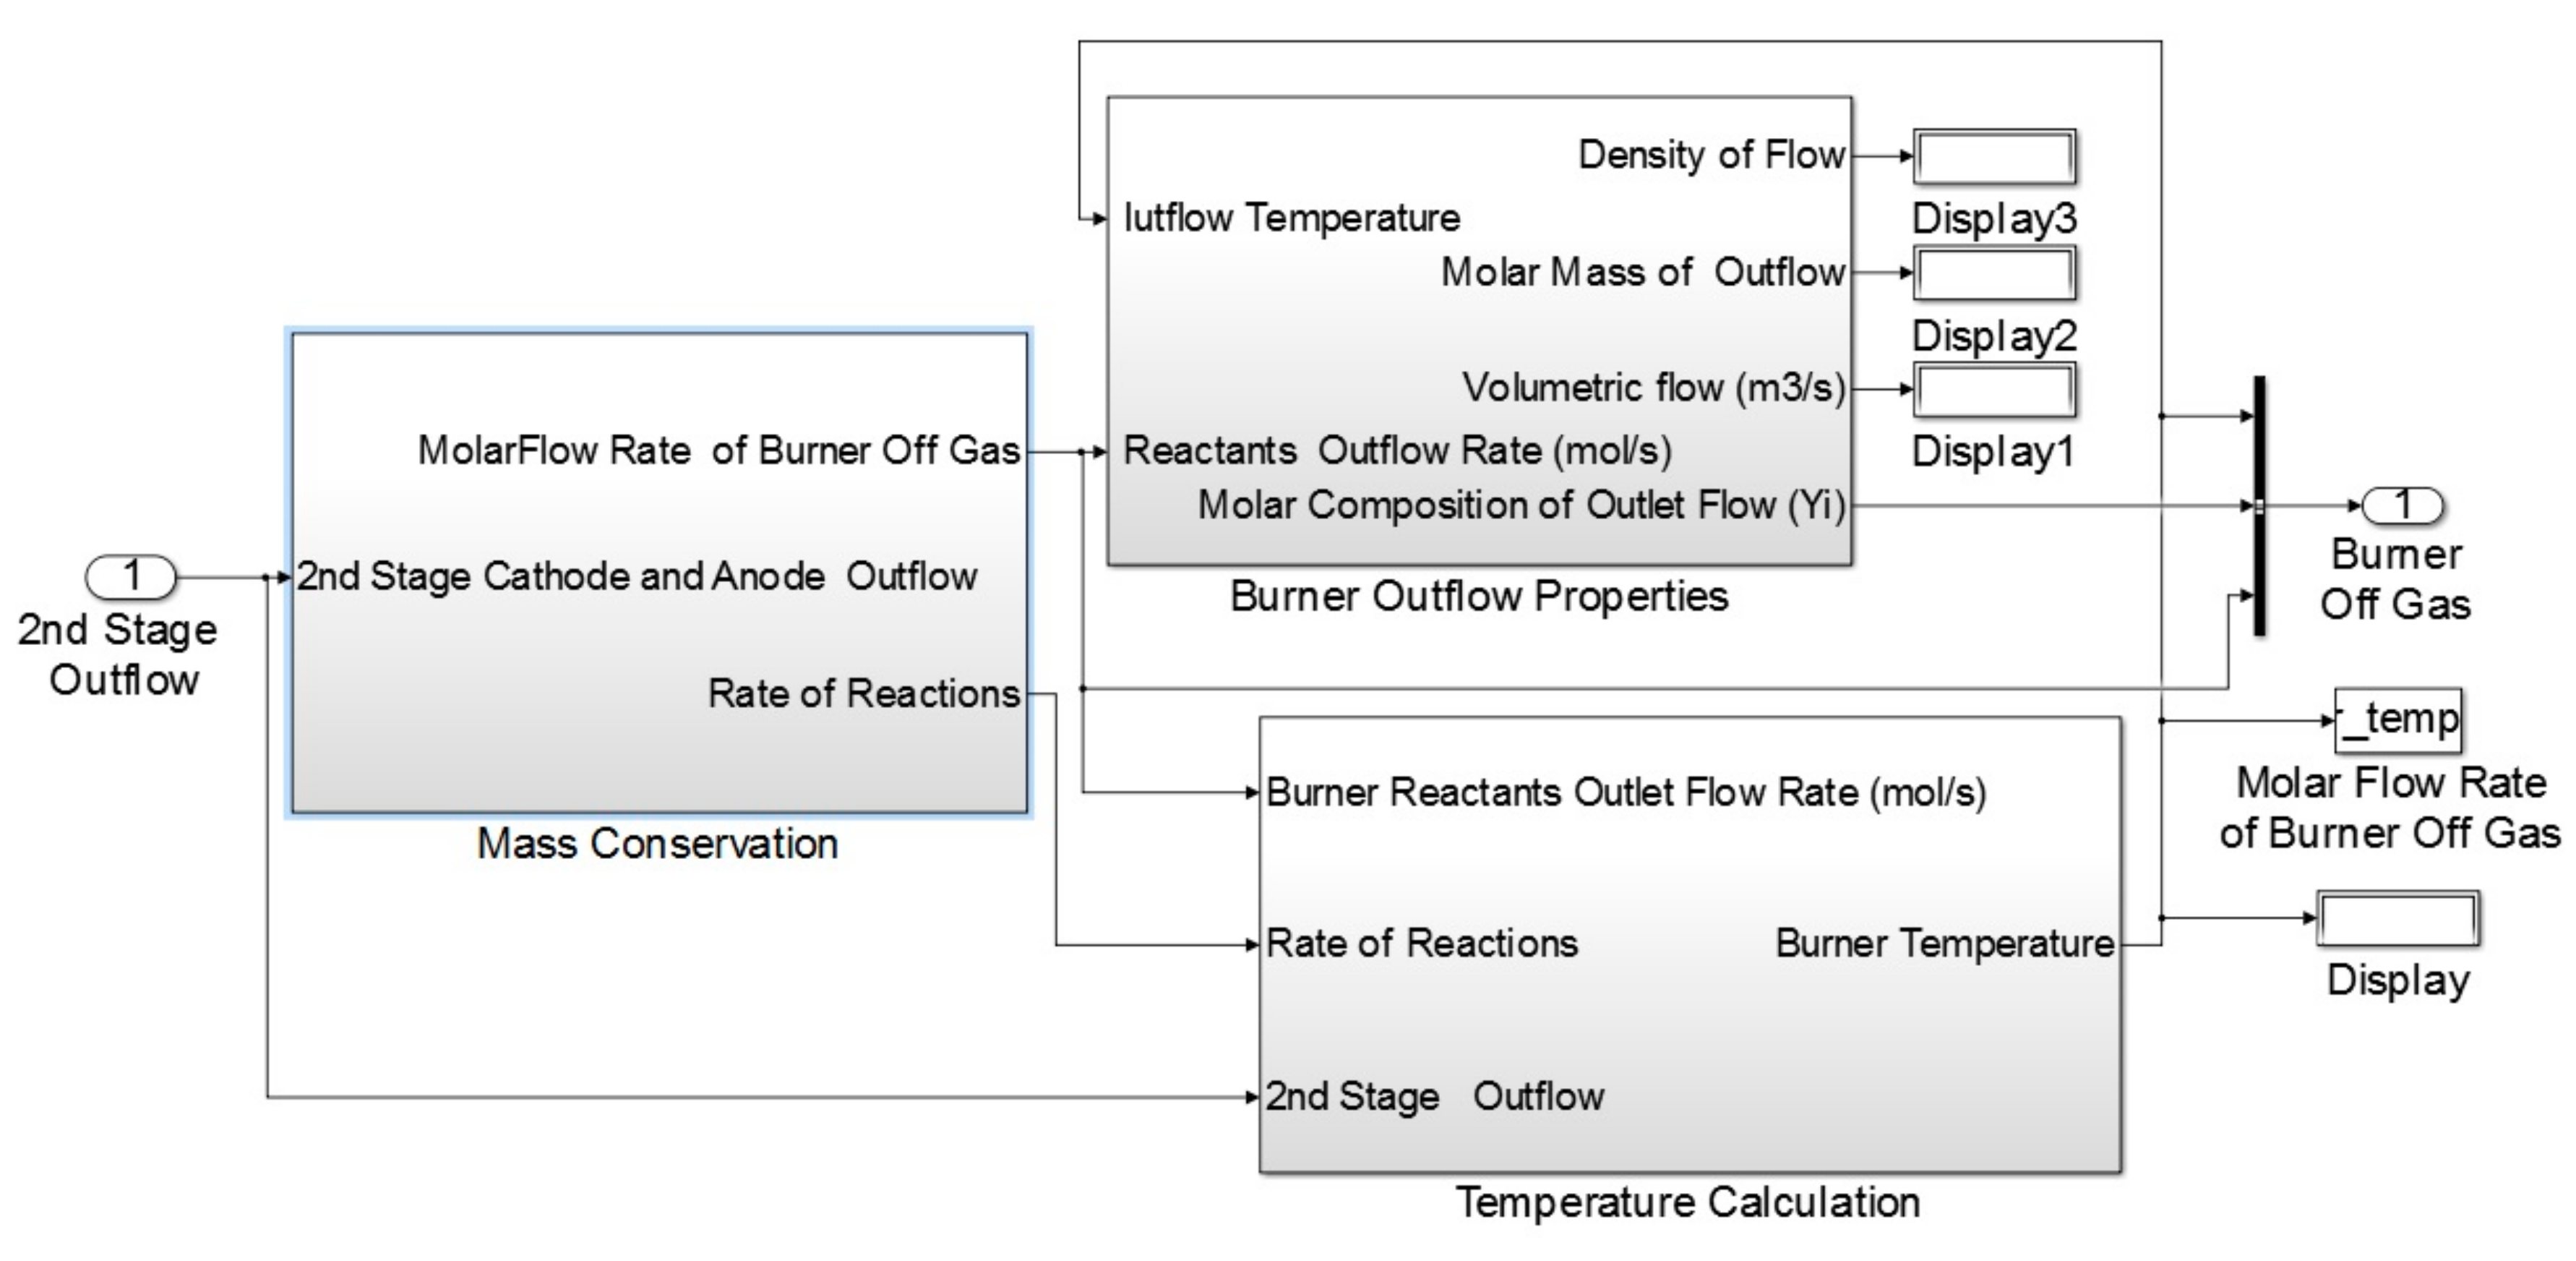
Figure 4). Similar to the previously discussed sub-model for the SOFC stack, sub-models defined for the steam reforming block allows us to calculate the steam reforming outflow properties. The burner sub-model which is illustrated in
Figure 5, consisted of two main blocks including the mass conservation and temperature calculation.


