Article

Experimental Analysis and Evaluation of the Numerical Prediction of Wake Characteristics of Tidal Stream Turbine

1
College of Energy and Electrical Engineering, Hohai University, Nanjing 210098, China
2
College of Harbor, Coastal and Offshore Engineering, Hohai University, Nanjing 210098, China
3
College of Water Conservancy and Hydropower Engineering, Hohai University, Nanjing 210098, China
4
Technological Institute of Merida, Technological Avenue, Merida 97118, Mexico
*
Authors to whom correspondence should be addressed.
Energies 2017, 10(12), 2057; https://doi.org/10.3390/en10122057
Submission received: 14 November 2017 / Revised: 29 November 2017 / Accepted: 1 December 2017 / Published: 5 December 2017

Abstract

:
It is important to understand tidal stream turbine performance and flow field, if tidal energy is to advance. The operating condition of a tidal stream turbine with a supporting structure has a significant impact on its performance and wake recovery. The aim of this work is to provide an understanding of turbine submerged depth that governs the downstream wake structure and its recovery to the free-stream velocity profile. An experimentally validated numerical model, based on a computational fluid dynamics (CFD) tool, was present to obtain longitudinal, transverse and vertical velocity profiles. Wake characteristics measurements have been carried out in an open channel at Hohai University. The results indicate that varying the turbine proximity to the water surface introduces differential mass flow rate around the rotor that could make the wake persist differently downstream. CFD shows the same predicted wake recovery tendency with the experiments, and an agreement from CFD and experiments is good in the far-wake region. The results presented demonstrate that CFD is a good tool to simulate the performance of tidal turbines particularly in the far-wake region and that the turbine proximity to the water surface has an effect on the wake recovery.

1. Introduction

Ever-increasing pollution emissions from energy supplies derived from fossil fuels are considered as one of the most critical threats for society, and the release of greenhouse gases is responsible for the change of climate [1]. Meanwhile, with the continuous depleting of non-renewable energy such as petroleum and coal, the energy crisis is increasingly becoming a restriction for the development of the world [2]. As a consequence, it is paramount to exploit sustainable resources to satisfy our needs [3].
The ocean covers almost 71% of our earth and has a huge amount of energy resources of more than 2 × 10³ TW [4]. Among various forms of ocean energy, tidal energy is much more stable and predictable compared with wave energy and others. One of the categories to extract tidal energy is the tidal stream generator, in which water flow is interrupted by the tidal stream turbine (TST) to drive a generator, which minimises the impact on the marine environment. Additionally, the TST has no visual impact as it is usually fully submerged.
It is expected that tidal stream devices would be employed in constrained areas where the water depth changes from 1.5 to 3 times the turbine diameters (D) [5,6]. Therefore, it is important to understand the turbine performance and characterise the power output because of the bounding surface by the bed and the free surface, which is different from that in an unbounded flow, as waves and the velocity profile are likely to affect the resource [7,8]. Additionally, as turbines are likely to be placed in arrays, in order to determine the position of downstream turbines that could be affected by those upstream, gaining an insight into the extent of wake recovery and wake expansion of upstream turbines is a significant research area.
A range of research approaches have been taken to consider the hydrodynamics of the extraction of tidal stream energy. Scaled physical experiments have been conducted in the flumes [9] and tanks [10] with the turbines represented by porous disks [11] and scaled rotors [12]. Turbine performance and wake recovery have been measured in turbulent and uniform flows [13]. Computational fluid dynamics (CFD) numerical simulations contain several scales of implementation for the turbines. Actuator methods apply a representative force to the rotor area, including an actuator disk method whose force is constant; the Reynolds-Averaged Navier–Stokes Blade Element Momentum (RANS-BEM) method, for which the force is radial with steady state; and an actuator line whose force is radial with unsteady state [14,15]. Another method to represent the turbine is blade-resolved simulation, which solves the fully geometrically accurate rotors and the flow around [16]. Blade-resolved simulations represent the turbine by fully geometrically accurate rotors and resolve the flow around the blade. Actuator methods implement the rotor by the application of a representative force, which can be constant (actuator disk), steady-state and radially varying for RANS-BEM and unsteady and radially varying for the actuator line.
Various experimental research has been carried out on the blade performance and flow downstream of a single turbine and arrays. Wake characteristics of small-scale mesh disk rotor simulators, which represent the turbines, have been measured in a flume at the University of Southampton by Myers and Bahaj [11]. An experimental investigation of the flow field around the disc rotor aimed to identify the parameters that govern the wake structure, and its recovery was achieved by Bahaj et al. [17]. The research above was conducted using an absorption disc instead of the real blades. A laboratory experiment was investigated to study the effect of upstream turbulence on turbine performance and wake recovery by Chamorro et al. [18]. Spectral analysis was utilised to indicate the dominant effect of the tip vortices in the near-wake region of the energy distribution. Characteristics of the wake flow field were measured in a water channel facility with a 1:20th scale horizontal axis turbine by acoustic Doppler velocimetry (ADV) [19]. Maganga et al. [9] obtained the thrust and hydrodynamic power of a turbine with a diameter of 0.7 m and its wake measured by laser Doppler velocimetry technics. Studies have shown that far-wake recovery with a self-similar Gaussian profile is caused by the turbulence generated by the shear layer and turbulence in the ambient flow. The near wake is strongly affected by the momentum drop of the rotor, and the high magnitude of rotational velocity dissipates with 6D downstream. However, little attention was paid to the presence of a free surface and rigid bed that could cause asymmetry of the vertical profiles. Little research has been conducted on the vertical constraints imposed by the boundaries and velocity deficit caused by the hub and support structures.
Numerical simulations of blade performances and wake characteristics were discretised with particles carrying vorticity by Maganga et al. [9]. An absorption disk model was conducted by using CFD software of FLUENT (ANSYS, Inc., Canonsburg, PA, USA) to predict the wake of the flow field by Sun et al. [20]. Batten et al. [21] proposed an approach of actuator disc–RANS, in which the turbine forces are derived using a blade-element approach to predict the performance and wake of tidal turbines. The methods of using a momentum sink to simulate tidal turbines in CFD were presented by Harrison et al. [10]; the characteristics of the wakes were compared with numerical simulations. It was found that the CFD showed a reasonable agreement in the far wake, and the RANS-BEM method showed a good prediction of the average flow field. More recently, Ferrer et al. [22] have analysed the stability and control of wakes issued from momentum sink approaches simulating wind turbines. However, these momentum sink methods, such as actuator discs and the fence, are not accurate enough for the prediction of the wake, particularly the near-wake region with tip vortices.
The objective of this paper is to investigate the effect of the proximity of the rotor to the water surface on the turbine wake and indicate an experimentally compared blade-resolved CFD model that can be used to predict the blade performance and wake profile in the stable turbulent channel flow.

2. Experimental Investigation

As indicated in Figure 1, the mean and fluctuating components of velocity were measured in the Hohai University circulating water flume both with a three-bladed tidal stream turbine and without it. A rotor with a diameter of 0.27 m was equipped in the channel with a length of 57 m, a width of 1.2 m and a depth of 0.55 m. The wake expansion was constrained by the bed and free surface as the depth was only 2 times the diameter. The blockage ratio was about 8.7% on the basis of the swept area of the turbine rotor and the cross-section of the channel. The water depth and flow velocity can be adjusted according to the experimental requirements, and a flow field with a constant flow rate can be generated. At present, the field tidal stream turbine is usually operated at the depth range of 30 to 50 m [6], indicating that the experiment conducted here was able to predict the field test with a velocity between 2.25 and 3.3 m/s, according to the theory of Froude number similarity from Equation (1):
v p g p l p = v m g m l m
where vp, gp and lp are the flow velocity, gravity acceleration and water depth of the prototype turbine respectively, and vm, gm and lm are the flow velocity, gravity acceleration and water depth of the model turbine, respectively.
The rotor was made with stainless steel and was fixed by a supporting structure from the bed of the flume. The tidal turbine was operated with the tip speed ratio (TSR = /U0) of 2.2, where ω represents the rotation speed (rad/s), R is the radius of turbine and U0 is the inlet velocity. The mean longitudinal flow velocity Ux at the rotor plane was U0 = 0.35 m/s, as indicated in Figure 2. It was found that a log-law profile gives a reasonable agreement throughout the water column in the case of this study. The turbine was installed with three different positions of 0.8D, 1D and 1.2D from the bottom of the flume. Measurements of velocity were conducted both in the near wake and far wake with a vertical Y–Z plane at a downstream distance from 0.5D to 8D; profiles of velocity deficit in the transverse and vertical were obtained. NORTEK ADV Vectrino+ probes (Nortek AS, Vangkroken 2, 1351 Rud, Norway) were used to measure the time-varying velocity components with a sample frequency of 100 Hz. X in the coordinate system indicates the flow direction (longitudinal axis), while Y represents the horizontal across the width (transverse axis) and Z denotes the depth (vertical axis).

3. Numerical Model

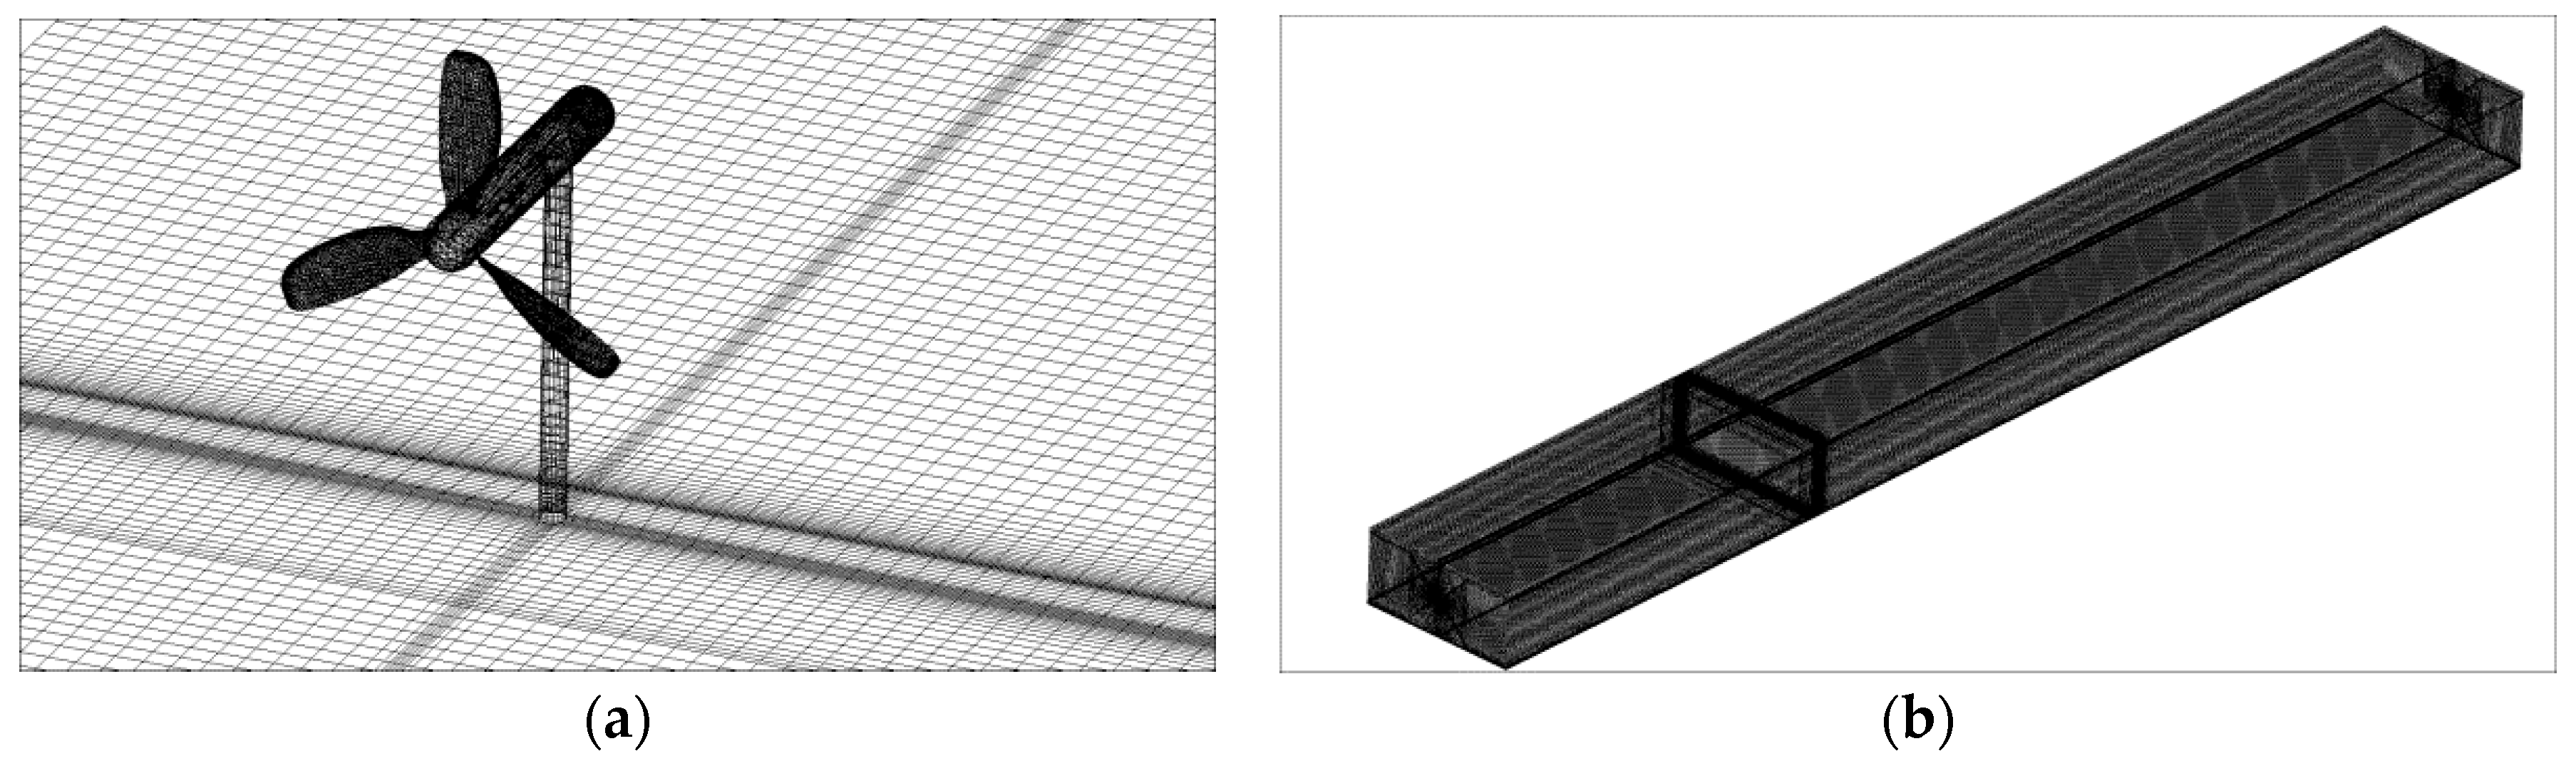
3.1. Mesh and Boundary Conditions

After creating the same geometry of the turbine and flume as the experiments, the turbine blades were resolved using a body-fitted, tetrahedral grid. A sliding mesh interface between the flume and the rotor enabled rotor motion. Hexahedral meshes of channel flow and a supporting structure were applied as indicated in Figure 3. The mesh in the critical areas was finer, such as around the blades and flume walls.
The velocity at the inlet was defined by a curve fitting model to the experimental inlet velocity data, as shown in Figure 2. Turbulence at the inlet boundary was defined by the turbulence intensity and turbulence length scale, which were equal to the measured experimental data. The free-slip wall boundary condition was placed at the water surface as the elevation of the water surface changed slightly during the simulation.

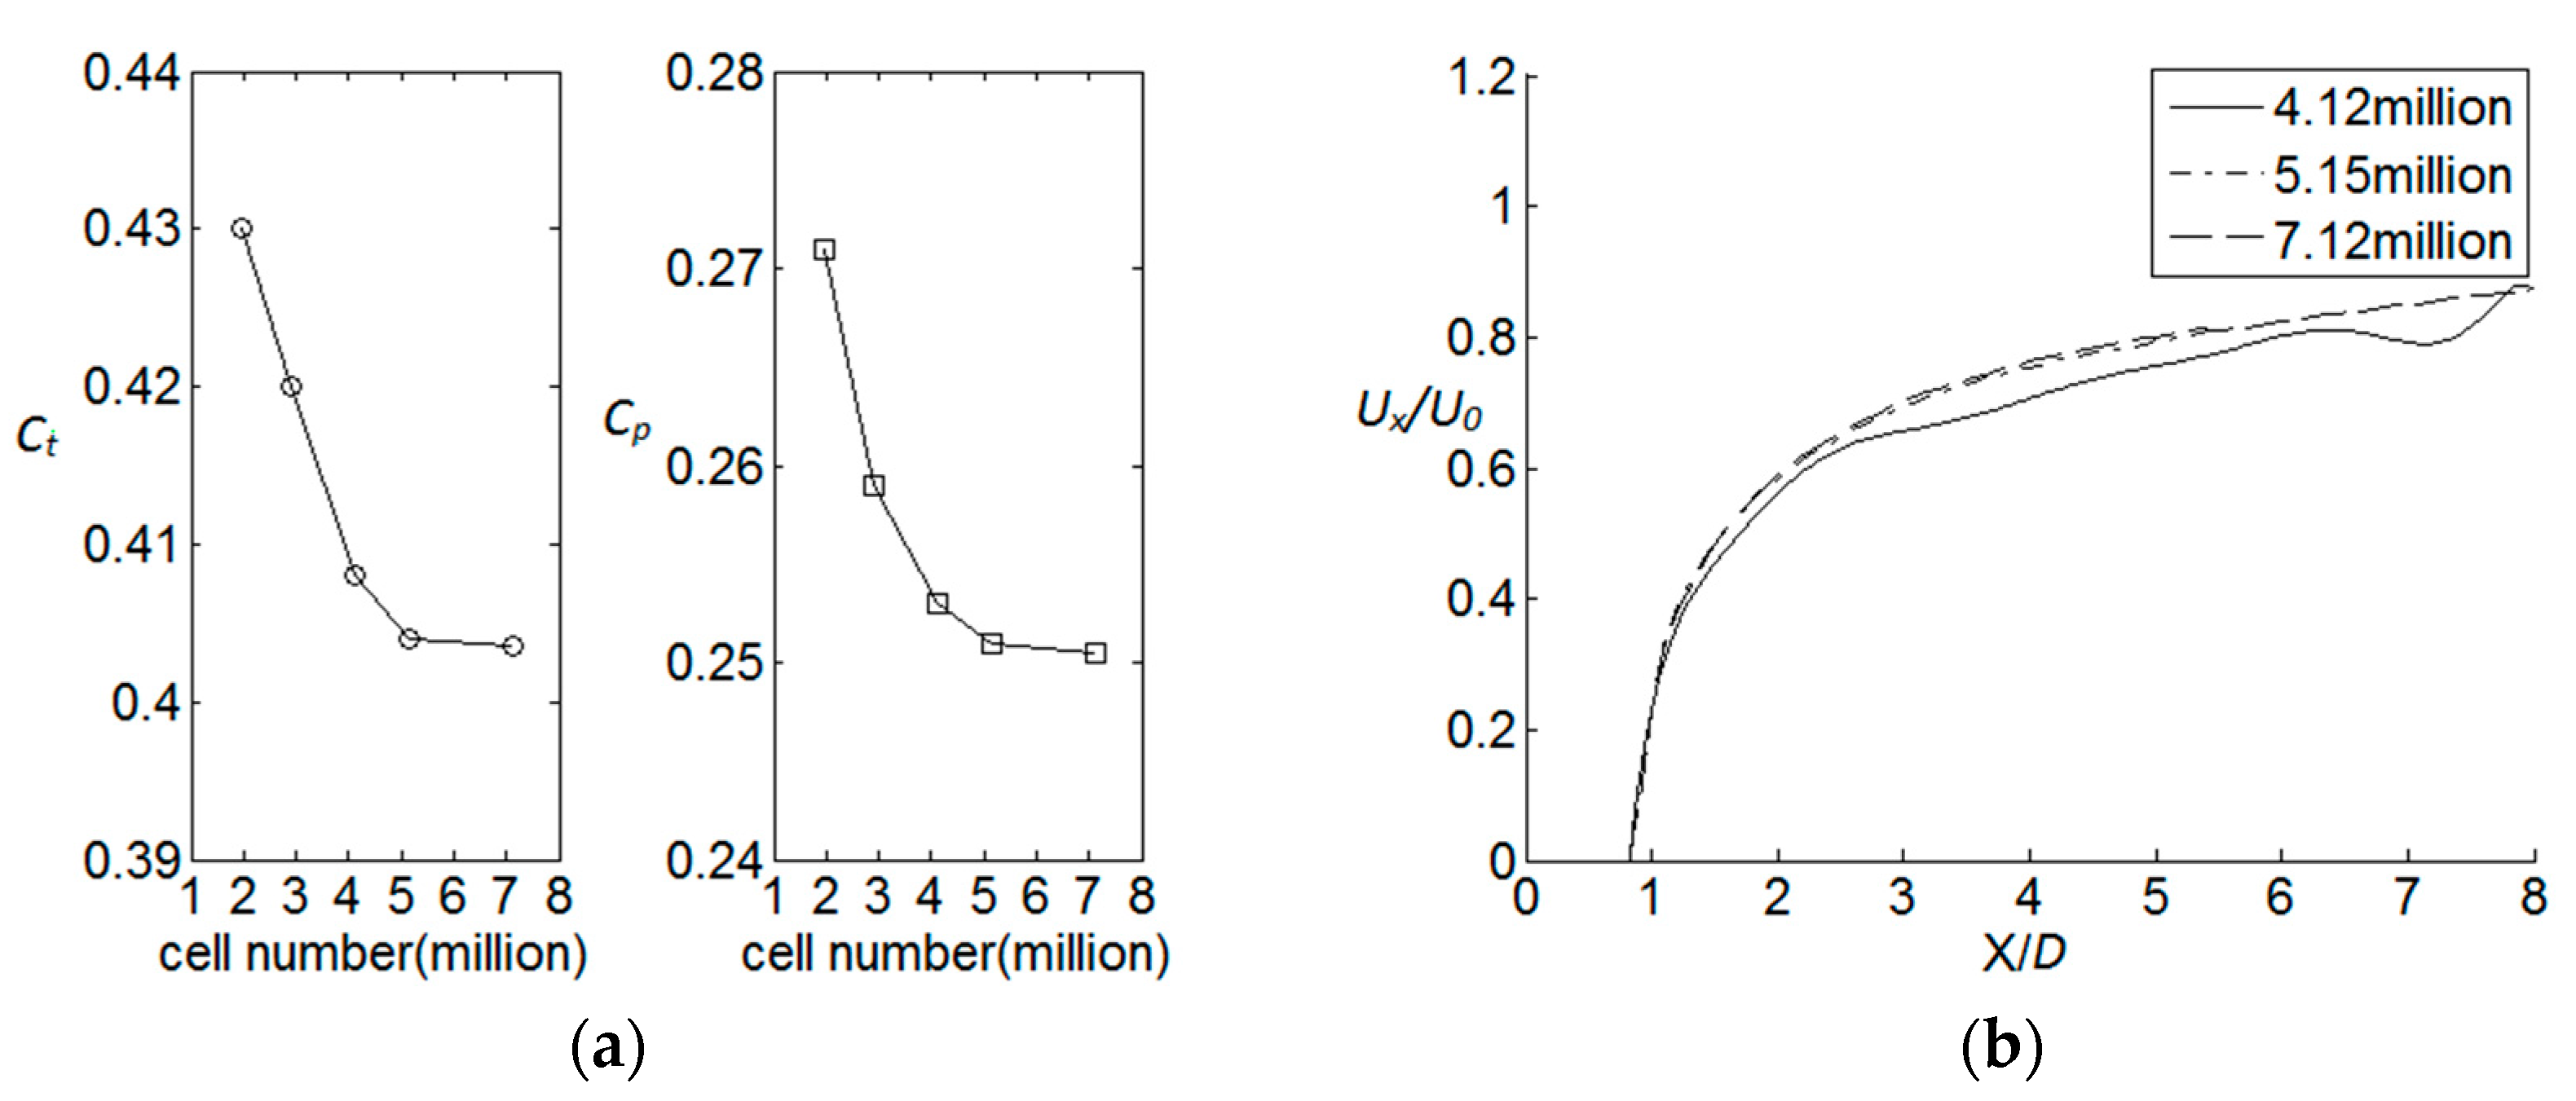
3.2. Turbulence Model and Mesh Independence

The flows for the tidal stream turbine are highly turbulent, and the most common tool to model them is through solving the RANS equations, which can save the computational resources significantly. RANS equations are yielded by applying the Reynolds decomposition to the velocity and pressure.
The turbine was discretised using a second-order finite-volume method provided by the ANSYS FLUENT 18.0 software (ANSYS, Inc., Canonsburg, PA, USA), as this is widely used in commercial applications and experimental verification [20]. At each time-step, the turbine rotated an amount of ωΔt, which is less than 1o, where Δt is the time step.
The k-ω shear stress transport (SST) model combines the best of both the standard k-ω and k-ε turbulence models proposed by Menter [23]. The SST model applies a k-ω formulation in the boundary layer of the flow, and in the freestream, it switches to k-ε behaviour to alleviate sensitivity in the k-ω model. The SST model performs better for applications in which adverse pressure gradients occur; thus it is suitable to simulate a flume with the development of boundary layers around the walls.
Different mesh strategies were adapted in studying the mesh independence considering the effects of total cell numbers on the wake recovery and coefficients of thrust (Ct = Fx/0.5ρADU02) and power (Cp = P/0.5ρADU03) using the k-ω SST model with a TSR of 2.2, where Fx is the thrust of the turbine, ρ is the density of water, AD is the sweeping area of the turbine and P is the power of the turbine. It can be seen from Figure 4 that the finest mesh with 7.12 million elements of mesh changed the thrust and power coefficients by less than 1%; thus refining the mesh with 5.15 million elements had a negligible effect on the coefficients, implying that this level of 5.15 million elements could produce a convergent result of the numerical simulation. A similar convergence effect of the refining mesh could be observed with the prediction of the wake recovery in the centreline (Figure 4b).

4. Results and Discussion

4.1. Effect of Turbine Submerged Depth

Most of the tidal stream turbines undergoing testing at offshore environments are of the horizontal-axis type, which extract energy from the flowing past fluid, as this could create a lift force and cause the blade to rotate. The means of the turbine supporting structure vary, which gives rise to the rotor operating at a different position through the water column.

4.1.1. Longitudinal Variation

Figure 5 shows the effect of variation of the vertical turbine depth submerged in the channel on the centreline velocity deficit. The rotor was placed at a depth of 0.8D (diameter of the turbine), 1D and 1.2D above the bottom of the flume. It was found that the wake velocity recovers rapidly in the near-wake region within 2D downstream; the results of the velocity deficit (1 − Ux/U0) reached around 20% at 2D downstream for all three conditions. However, there was a considerable increase in the wake velocity recovery with the increase in the clearance distance from the turbine to the channel bed. A greater centerline velocity deficit for the lowest turbine position to the channel bed (0.8D) was observed in the far wake downstream until 6D. This was likely due to less flow acceleration beneath the turbine and a higher mass flow rate above it for the deep immersion of the turbine. The increasing distance between the bed and turbine could aid mixing of the turbine wake with ambient flow and primarily serve to accelerate the wake velocity recovery downstream. Experimental porous disc studies in the tilting flume at the University of Southampton report a similar finding of the effect of the proximity to bounding surfaces on the wake velocity deficit [11].

4.1.2. Transverse Variation

Cross-sections in the wake region were set up at different depths; Figure 6 shows the variation in the transverse velocity deficit due to three different turbine submerged depths. It was found that the lateral wake profile of the longitudinal velocity approached a symmetric distribution within 8D downstream, which is close to Gaussian distribution, approximately. It was evident that a small bypass flow with a velocity greater than the ambient velocity was observed outside the rotor-swept area within the near wake downstream. The wake velocity recovery grew significantly in the near wake within 2D downstream, and afterwards the increase tendency became smooth. The wake velocity from the turbine with the nearest space to the channel bottom had a slow recovery rate compared with the other two conditions from 1.5D to 6D downstream. This was perhaps due to less mixing of the downstream wake, ultimately reducing the recovery. Additionally, the turbine with a 0.8D distance from the bed had a wider wake width than the others in the downstream wake. Within 1D downstream, the width of the turbine with a 0.8D space to the bottom surface was about 1.2D, while for both of the other two cases, this was about 1D.

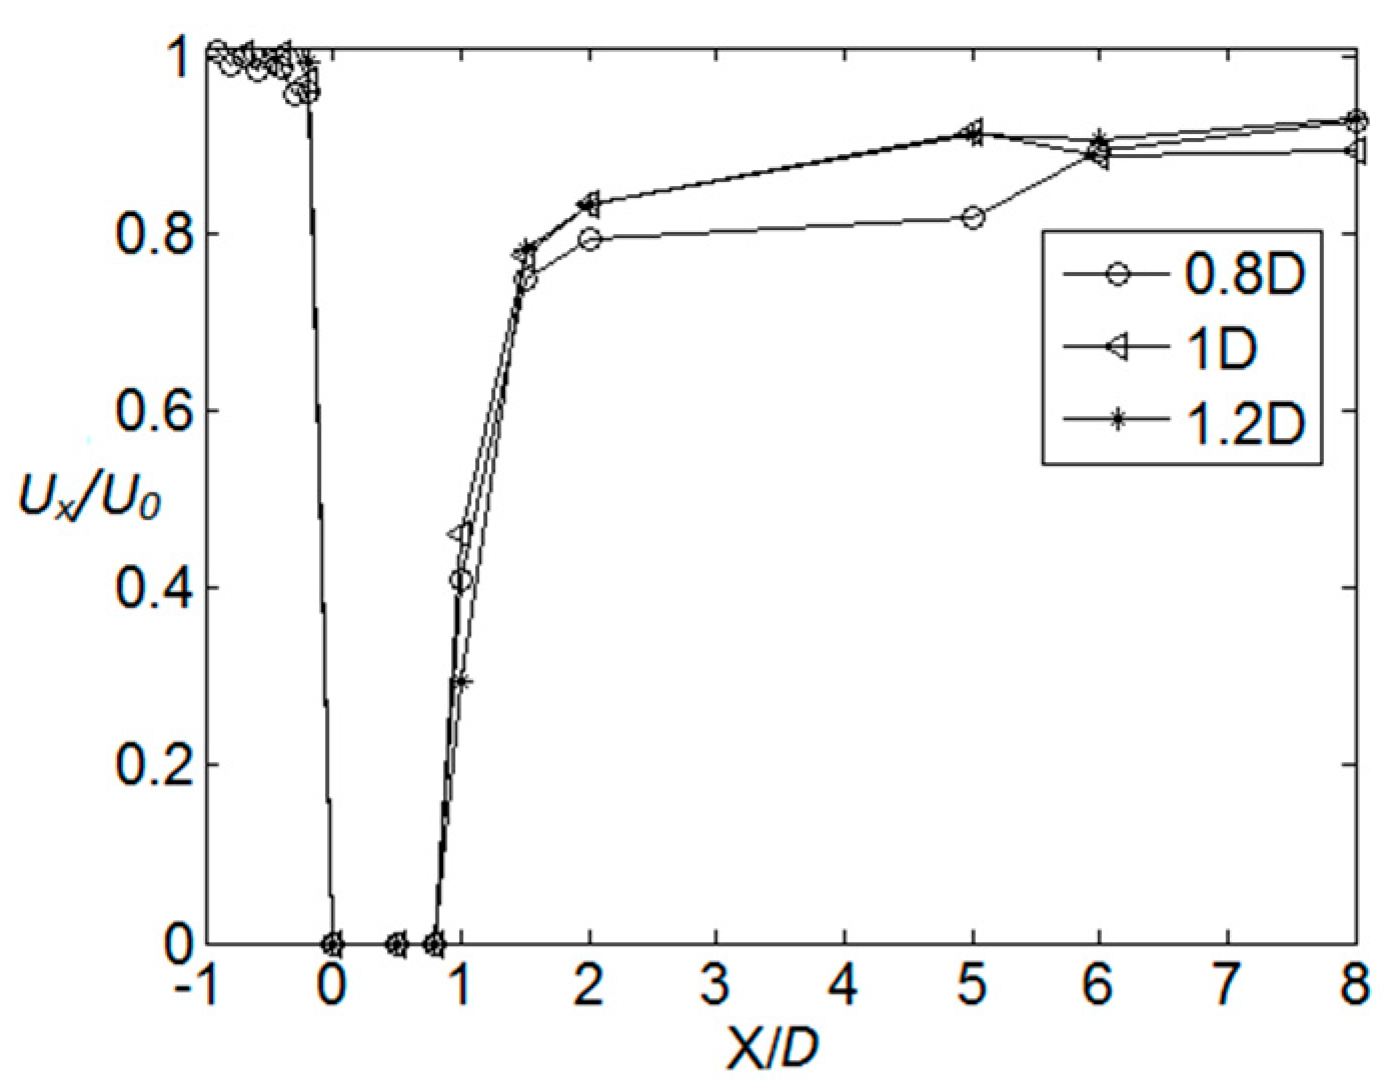
4.1.3. Vertical Variation

Figure 7 shows the variation in the vertical velocity recovery caused by the three different turbine submerged depths; it can be observed that a fast-moving fluid occurred in the upper part of the wake. The wakes had the same tendency for the velocity deficit in the near wake and far wake; however, the recovery rate varied by the turbine proximity to the surfaces. As seen from Figure 7, the maximum velocity deficits all occurred close to the turbine axis (0.8D, 1D and 1.2D from the bottom, respectively) within 1D downstream. The vertical velocity beyond 6D downstream showed a similar profile to the channel flow velocity profile.

4.2. Wake Prediction by CFD and Comparison to Experiments

4.2.1. Longitudinal Profile

Figure 8 shows the experimental and modelled centreline velocity profile of the turbine with the submerged depth of 1D. As indicated in Figure 8, the results of CFD showed the same tendency with the experiments in the profiles of the mean velocity deficit along the centreline of the wake. Both the wake conducted by CFD and by experiments showed a rapid recovery within 2D downstream before they experienced a smooth growth between 2D and 8D. However, the experimental far-wake values were higher than the numerical values simulated. This was perhaps due to the lower turbulence intensity predicted by the numerical simulation, which led to less mixing of the turbine wake with the ambient flow; see also simulations in [22].

4.2.2. Transverse Profile

Figure 9 shows the transverse profiles simulated by CFD and a comparison with experiments at a number of locations behind the turbine. The shear layers at the wake-edge region can be observed where velocity gradients are the highest; these occurred above and below the centreline. A small bypass flow was observed by both CFD and experiments outside the rotor-swept area. The transverse wake profile of the velocity approaches a symmetric distribution from the view of experiments, which is slightly different from the results of CFD within the near wake. The disagreement is mainly due to the limitation of the CFD steady simulations. The transverse wake velocity within the far wake from 5D to 8D downstream showed good agreement with experimental measurements as shown in Figure 9. Over the same distance from 1D to 6D downstream for the results of CFD and the experiments, the wake width increased from approximately 0.4D to 0.8D.

4.2.3. Vertical Profile

Figure 10 shows the vertical profiles at a number of locations behind the turbine and the curves simulated by CFD. In contrast to transverse profiles, it can be seen from both CFD and experiments that the vertical profile in the wake region was asymmetric about the centreline. The rotor wake was effectively constrained in the vertical direction because of the free surface and channel bed. The far-wake depth-wise velocity profiles shown in Figure 10 indicate that the agreement from CFD and the experiments was good from 5D up to 8D downstream, while within the near wake from 1D to 2D, the numerical simulations indicated a higher velocity deficit.

5. Conclusions

The results of studies investigating the experimental analysis and evaluation of wake prediction by numerical simulations have highlighted some interesting results, which could serve to shape on-going research in this area.
The flow field is constrained by the free surface and bed of the channel, which leads to significant differences from wind turbines. Reducing the distance between the turbine and the bottom surface would serve to keep the persistence of the wake. It is postulated that this is caused by less flow acceleration beneath the turbine and a higher mass flow rate above it for the deep immersion of the turbine. The increasing distance between the bed and turbine could aid the mixing of the turbine wake with the ambient flow and primarily serve to accelerate the wake velocity recovery downstream.
This study examines the validity of the steady RANS blade-resolved approach for the numerical simulation of the flow field by comparison with experimental measurements. A small bypass flow is both observed by CFD and experiments outside the rotor-swept area. CFD shows the same predicted wake recovery tendency with the experiments, and the agreement from CFD and experiments is good in the far-wake region. The results of the comparison indicate that simulation data deviate from experimental measurements within the near-wake region because of the limitation of the RANS model.
The paper provides preliminary experimental research on a single turbine and the evaluation of the RANS blade-resolved approach for numerical simulations. Further assessments will be carried out for more advanced turbulence models, and work for understanding the influence of the wake interaction between multi-turbines will be conducted in the future.

Acknowledgments

The research work was supported by the following funding: Fundamental Research Funds for the Central Universities (No. 2017B06914), and a project funded by the Priority Academic Program Development of Jiangsu Higher Education Institutions, Chinese National Foundation of Natural Science Key Projects (No. 51339005).

Author Contributions

Yuquan Zhang designed the geometrical model, performed the numerical simulations, carried out the experiments, analysed the results and wrote the paper draft. Jisheng Zhang contributed in the results’ analyses and in writing the final version of the paper. Yuan Zheng supervised the work of numerical simulations; Chunxia Yang suggested the methodology. Wei Zang helped to perform the experiments. E. Fernandez-Rodriguez gave some advice on conducting experiments and paper writing.

Conflicts of Interest

The authors declare no conflict of interest.

References

  1. Liu, H.W.; Ma, S.; Li, W.; Gu, H.G.; Lin, Y.G.; Sun, X.J. A review on the development of tidal current energy in China. Renew. Sustain. Energy Rev. 2011, 15, 1141–1146. [Google Scholar] [CrossRef]
  2. Antonio, F.O. Wave energy utilization: A review of the technologies. Renew. Sustain. Energy Rev. 2010, 14, 899–918. [Google Scholar]
  3. Bahaj, A.S. Marine current energy conversion: The dawn of a new era in electricity production. Philos. Trans. R. Soc. A 2013, 371, 20120500. [Google Scholar] [CrossRef] [PubMed]
  4. Kanemoto, T. Dream of marine-topia: New technologies to utilize effectively renewable energies at offshore. Curr. Appl. Phys. 2010, 10, S4–S8. [Google Scholar] [CrossRef]
  5. Lewis, M.; Neill, S.P.; Robins, P.E.; Hashemi, M.R. Resource assessment for future generations of tidal-stream energy arrays. Energy 2015, 83, 403–415. [Google Scholar] [CrossRef] [Green Version]
  6. Stallard, T.; Collings, R.; Feng, T.; Whelan, J. Interactions between tidal turbine wakes: Experimental study of a group of three-bladed rotors. Philos. Trans. R. Soc. A 2013, 371, 20120159. [Google Scholar] [CrossRef] [PubMed]
  7. Lewis, M.J.; Neill, S.P.; Hashemi, M.R.; Reza, M. Realistic wave conditions and their influence on quantifying the tidal stream energy resource. Appl. Energy 2014, 136, 495–508. [Google Scholar] [CrossRef]
  8. Lewis, M.; Neill, S.P.; Robins, P.; Hashemi, M.R.; Ward, S. Characteristics of the velocity profile at tidal-stream energy sites. Renew. Energy 2017, 114, 258–272. [Google Scholar] [CrossRef]
  9. Maganga, F.; Pinon, G.; Germain, G.; Rivoalen, E. Wake properties characterisation of marine current turbines. In Proceedings of the 3rd International Conference on Ocean Energy, Bilbao, Spain, 6–8 October 2010. [Google Scholar]
  10. Harrison, M.E.; Batten, W.M.J.; Myers, L.E.; Bahaj, A.S. Comparison between CFD simulations and experiments for predicting the far wake of horizontal axis tidal turbines. IET Renew. Power Gener. 2009, 4, 613–627. [Google Scholar] [CrossRef]
  11. Myers, L.E.; Bahaj, A.S. Experimental analysis of the flow field around horizontal axis tidal turbines by use of scale mesh disk rotor simulators. Ocean Eng. 2010, 37, 218–227. [Google Scholar] [CrossRef]
  12. Tedds, S.C.; Poole, R.J.; Owen, I. Wake characteristics of Horizontal Axis Tidal Stream Turbines in uniform and non-uniform steady flows. In Proceedings of the 4th International Conference on Ocean Energy, Dublin, Ireland, 17–19 October 2012. [Google Scholar]
  13. Galloway, P.W.; Myers, L.E.; Bahaj, A.S. Quantifying wave and yaw effects on a scale tidal stream turbine. Renew. Energy 2014, 63, 297–307. [Google Scholar] [CrossRef]
  14. Harrison, M.E.; Batten, W.M.J.; Bahaj, A.S. A blade element actuator disc approach applied to tidal stream turbines. In Proceedings of the Oceans, Seattle, WA, USA, 20–23 September 2010; pp. 1–8. [Google Scholar]
  15. Churchfield, M.J.; Li, Y.; Moriarty, P.J. A large-eddy simulation study of wake propagation and power production in an array of tidal-current turbines. Philos. Trans. R. Soc. A 2011, 371, 20120421. [Google Scholar] [CrossRef] [PubMed]
  16. Afgan, I.; Mcnaughton, J.; Rolfo, S.; Apsley, D.D.; Stallard, T.; Stansby, P. Turbulent flow and loading on a tidal stream turbine by LES and RANS. Int. J. Heat Fluid Flow 2013, 43, 96–108. [Google Scholar] [CrossRef]
  17. Bahaj, A.S.; Molland, A.F.; Chaplin, J.R.; Batten, W.M.J. Power and thrust measurements of marine current turbines under various hydrodynamic flow conditions in a cavitation tunnel and a towing tank. Renew. Energy 2007, 32, 407–426. [Google Scholar] [CrossRef]
  18. Chamorro, L.P.; Hill, C.; Morton, S.; Ellis, C.; Arndt, R.E.A.; Sotiropoulos, F. On the interaction between a turbulent open channel flow and an axial-flow turbine. J. Fluid Mech. 2013, 716, 658–670. [Google Scholar] [CrossRef]
  19. Myers, L.E.; Bahaj, A.S. Near wake properties of horizontal axis marine current turbines. In Proceedings of the 8th European Wave and Tidal Energy Conference, Uppsala, Sweden, 7–10 September 2009; pp. 558–565. [Google Scholar]
  20. Sun, X.; Chick, J.P.; Bryden, I.G. Laboratory-scale simulation of energy extraction from tidal currents. Renew. Energy 2008, 33, 1267–1274. [Google Scholar] [CrossRef]
  21. Batten, W.M.J.; Harrison, M.E.; Bahaj, A.S. Accuracy of the actuator disc-RANS approach for predicting the performance and wake of tidal turbines. Philos. Trans. R. Soc. A 2013, 371, 20120293. [Google Scholar] [CrossRef] [PubMed]
  22. Ferrer, E.; Browne, O.; Valero, E. Sensitivity Analysis to Control the Far-Wake Unsteadiness Behind Turbines. Energies 2017, 10, 1599. [Google Scholar] [CrossRef]
  23. Menter, F.R. Review of the shear-stress transport turbulence model experience from an industrial perspective. Int. J. Comput. Fluid D 2009, 23, 305–316. [Google Scholar] [CrossRef]
Figure 1. (a) Tidal stream turbine; (b) measurement device.
Energies 10 02057 g001
Figure 2. Longitudinal velocity profile in vertical direction.
Energies 10 02057 g002
Figure 3. (a) Mesh of turbine; (b) mesh of channel flume.
Energies 10 02057 g003
Figure 4. (a) Ct, Cp and (b) longitudinal wake velocity of centreline varying with the number of elements.
Energies 10 02057 g004
Figure 5. Longitudinal centreline velocity of different turbine depth.
Energies 10 02057 g005
Figure 6. Transverse profile of velocity at different turbine depths.
Energies 10 02057 g006
Figure 7. Vertical profile of velocity at different turbine depths.
Energies 10 02057 g007
Figure 8. Longitudinal profile of velocity.
Energies 10 02057 g008
Figure 9. Transverse profile of velocity.
Energies 10 02057 g009
Figure 10. Vertical profile of velocity.
Energies 10 02057 g010

