Article

Solid-Liquid Interfacial Effects on Residual Oil Distribution Utilizing Three-Dimensional Micro Network Models

1
School of Civil and Resources Engineering, University of Science and Technology Beijing, Beijing 100083, China
2
Research Institute of Yanchang Petroleum (Group) Co. Ltd., Shanxi 716000, China
*
Author to whom correspondence should be addressed.
Energies 2017, 10(12), 2059; https://doi.org/10.3390/en10122059
Submission received: 6 September 2017 / Revised: 14 November 2017 / Accepted: 24 November 2017 / Published: 5 December 2017

Abstract

:
A number of experiments on fluid flow at the micro/nano-scale have demonstrated that flow velocity obviously deviates from the classical Poiseuille’s law due to the micro forces between the wall and the fluid. Based on an oil–water two-phase network simulation model, a three-dimensional pore-scale micro network model with solid–liquid interfacial effects was established. The influences of solid–liquid interface effects including van der Waals force and wettability on the residual oil distribution and relative permeability were investigated through microscopic simulation. The effects of pore radius, pore–throat size ratio, shaping factor, and coordination number on the residual oil distribution were analyzed at the same time. The results showed that the oil recovery would be overestimated by about 4% without van der Waals force in a water-wet reservoir. The impact of van der Waals force on water-wet reservoirs was significantly obvious in contrast with oil-wet reservoirs. In addition, the residual oil distribution was significantly influenced by pore radius in water-wet reservoir, comparatively influenced by pore–throat size ratio in oil-wet reservoir. The present study illustrates the successful application of three-dimensional micro network models considering solid–liquid interfacial effects, and provides new insights for oil recovery enhancement.

1. Introduction

The structure of a porous reservoir is irregular and complicated; therefore, it is difficult to describe the fluid flow with several macroscopic reservoir parameters. To investigate the microscopic flow characteristics and mechanisms, digital core technology (DCT)—which has the characters of low cost, fast testing, and comprehensiveness—is becoming a widely used means. Compared with physical simulation experiments, it has more advantages for solving microscopic problems. Percolation network modeling is one of the most important methods presently being used, especially microscopic mechanism in porous media [1]. Pore-scale network modeling has recently been widely utilized to study the flow mechanism at the micro scale. First of all, a network model was pioneered by Fatt [2]. By distributing the whole pore and throat on a routine 2D lattice and thus filling them in sequence of inscribed circle radius utilizing the Young–Laplace equation, both dynamic and static properties were studied in porous media. Based on the percolation theory, the network model was utilized to probe into the channeling rule of fluid in pore space [3,4]. In order to predict petrophysical parameters, some two-dimensional network models were further developed and improved [5,6,7,8,9,10]. Most recently, many three-dimensional network models have been applied in the fields of capillary pressure and relative permeability by using digital rocks, and three-dimensional pore-scale network models for an oil–water two-phase system were proposed to discuss the effect of wettability on relative permeability and the residual oil distribution [11,12,13,14,15,16]. Based on the Mesaverde tight formation, the flow properties of one-phase and miscible two-phase systems were predicted by Bashtani et al. [17] utilizing a random network model in tight porous media, compared with laboratory data. Some regular 3D three-phase network models were conducted for different wettability systems [18,19,20,21,22,23,24].
In the previous literature, the fluid flow basically obeys Poiseuille’s law. However, it obviously deviates from Poiseuille’s law when the pore throat size belongs to the micro level or even the nano level. The causes of this deviation can be mainly divided into two categories. The first one is the micro force effect. A number of experiments were conducted to show that the fluid velocity was lower than that of the classical Poiseuille’s law, mostly because of the microscopic forces between the fluid and the internal surface [25,26,27,28,29]. The second one is the micro scale effect. The fluid flow was affected by pore throat size in porous media [30]. In addition, the nonlinear characteristics of the fluid were prominent as the pore throat size decreased. Pfahler et al. [31] and Gad el Hak [32] showed that there was a significant divergence of the Navier–Stokes forecasts in the smallest of the channels. In other words, it was no longer suitable for the original linear percolation theory [33,34]. Therefore, the interfacial effects between fluid and pore throat wall cannot be ignored in reservoirs at the micro/nano-scale.
With the development of interfacial science and physical chemistry, an increasing number of researchers are paying attention to the interaction between liquids and solids—particularly on the effects of the solid–liquid interface. On the one hand, some scholars have carried out extensive research into fluid flow in nano/micro-size tubes with interfacial effects. Mattia and Calabrò [35] and Frolov et al. [36] divided fluid flow in a nanotube into two regions with both interfacial wetting mechanism and surface diffusion mechanism in the internal surface of nanotube. Li et al. [37] provided an analytical approach for simulation and analyzed gas–water two-phase permeability with interfacial effects on the part of Hagen Poiseuille formula and capillary pressure curves in nanoscale media. Zhang et al. [38] established a mathematical model for weakly compressible fluid flow in nano/micro-size circular tubes with solid wall forces. Wang et al. [39] alleged that van der Waals force between solid and liquid should not be ignored in the tiny pore flow. On the other hand, the solid–liquid interfacial effect has been considered in the network model. A two-dimensional dynamic network model of water flooding with solid–liquid molecule interaction was established in porous media [40]. Ma et al. [41] proposed the pore-network flow model (PNFM) method to reconstruct a realistic three-dimensional micro model by extracting 2D shale sample sections, where each coefficient was usually indicative of a decrease in temperature and pressure within the space of van der Waals. So far, the interfacial effects have only been considered into one- or two-dimensional models, but in this paper the research addressing three-dimensional micro-network models with solid–liquid interfacial effects is emphasized.
This paper aims to stand out the three-dimensional micro-network models with solid–liquid interface effects. First, the existence condition and range of van der Walls forces were described in Section 2, and van der Waals forces were dominant among these micro forces [39]. In Section 3, the influence of van der Waals forces on the fluid flow in nano-micron tube was studied and the corresponding mathematical model was established. Then, the oil–water two-phase network model was introduced. In addition, a three-dimensional micro network model with solid–liquid interfacial effects [12] was established. In Section 4, the effect of van der Waals forces on the relative permeability and residual oil distribution in water-wet and oil-wet reservoirs was analyzed. Moreover, the effects of pore radius, pore-throat, shaping factor and coordination number on residual oil were also discussed. Finally, we presented the conclusions in Section 5.

2. Existence Condition and Range of the Solid–Liquid Interfacial Effects

In general, the pore is small in size. However, it has a large specific surface area. At the molecular scale, the relative increment of micro force and solid–liquid interfacial effects become notable, which has a tremendous influence on the rule of fluid flow. These microscopic forces are mainly van der Waals forces [39].

2.1. Van der Waals Force

The first fundamental forces between the molecules are van der Waals forces. The intermolecular force is mainly composed of three sections; namely, the orientation force, induced force, and the dispersion force [42]. Interaction between two types of molecules, as seen in Figure 1, can be listed respectively:
V = V k + V D + V L = 2 3 μ 4 k T + 2 α μ 2 + 3 H 2 ν α 2 1 x 6
V = V k + V D + V L = 2 3 μ 1 2 μ 2 2 k T + α 1 μ 2 2 + α 2 μ 1 2 + + 3 H 2 ν 1 ν 2 ν 1 + ν 2 α 1 α 2 1 x 6
Van der Waals force between individual molecules belongs to the aforementioned short-range force. The superposition of van der Waals force between molecule aggregates is known as the long-range force. For instance, van der Waals force between a solid surface and a molecular aggregation with a radius of R, as seen in Figure 2, can be expressed as:
V = A R D
β = 2 3 μ 4 k T + 2 α μ 2 + 3 H 2 ν α 2
Here A is the Hamaker constant of the substance, J; D is the distance between particles in the body, m; μ 1 , μ 2 is the intermolecular dipole distance, C · m ; α 1 , α 2 is the intermolecular polarizability, C · m 2 / ν ; ν 1 , ν 2 are the intermolecular independent characteristics vibration frequency; k is the Boltzmann constant, 1.38 × 10 23 J/K; T is the absolute temperature, K; H is Planck’s constant, 6.62 × 10 34 J·s.

2.2. The Form and Scope of Action

In general, fluid flow basically obeys Poiseuille’s law in microchannels. However, the experimental results depart obviously from conventional theory predictions, which is mainly attributed to long-range van der Waals force between solid surface and fluid molecules. The long-range van der Waals force results in additional viscosity, indicating a decrease in the fluid velocity. The cumulative effect range of van der Waals tends to be 0.1 microns, perhaps up to a few microns. Accordingly, van der Waals forces should be considered under nano-micron conditions.

3. Mathematical Model

3.1. Establishment of the 3D Network Model

A 3D network model can be used to reflect the space of a real reservoir. The true pore space has complicated and changeable sections. First of all, it was abstracted as the network space formed by cylinder capillary [2]. Then, the rest pores were presented to confirm the impact of the water wet layer on the seepage process. Kovscek et al. [43] used a capillary tube with star-shaped cross-sections to describe the porosity and confirm the influences of the water-wet layer. The square and triangular cross-sections were presented to represent the pore geometry [44]. Here, shape factor is used to describe the pore cross-section and throat geometry, which was proposed by Mason and Morrow [45]. The shape factor is expressed as:
G = A P 2
where A is the cross-sectional area and P is the perimeter.
The network model is composed of pore bodies and throats, which are treated as large and narrow sections. The size of the pore and throat generally satisfies several distributions of mathematical statistics, such as Rayleigh distribution, Weibull distribution, and lognormal distribution. In this paper, the distribution of pore throat size satisfies the Weibull distribution in a network model.
P w ( x ) = m α ( x γ ) ( m 1 ) e ( ( x γ ) m α ) x γ 0 x < γ
where γ is the position parameter.
Most of the pore shapes are triangular in the microscopic network model. For subsequent computational simulations, the concept of equivalent radius is adopted for non-circular pore shapes. The equivalent radius is used in the characterization of the conductance of the pore or throat. This method is identical to the one employed by Valvatne et al. [46]. The equivalent radius is given analytically by Poiseuille’s law,
Q = π 8 R e q u 4 Δ P μ 0 = g μ 0 Δ P
The equivalent radius of the non-circular pore shape is:
R e q u = ( 8 g π ) 1 / 4
where g is the conductivity of pore and throat; μ is the fluid viscosity; R e q u is the equivalent radius; and Δ P is the pressure difference.

3.2. A Mathematical Model with Van der Waals Force

At the beginning of displacement in a microtube, van der Waals force increases molecular attraction, resulting in incensement of fluid viscosity. Suppose the viscosity consists of two sections, where the first one is the original fluid viscosity, and the other part is the viscosity variation. The fluid viscosity can be expressed as [40]:
μ = μ 0 + b A S A W A W d
Substituting Formula (9) into the Navier-Stokes (N-S) equation, the average flow equation of the fluid in the microtube is obtained:
Q = π 8 ( 1 ε ) R e q u 4 μ 0 d p d x
ε = 4 b 4 ( A S A W A W ) 4 μ 0 4 R e q u 4 l n μ 0 R e q u + b ( A S A W A W ) b ( A S A W A W ) + 12 b 2 ( A S A W A W ) 2 μ 0 2 R e q u 4 l n μ 0 R e q u + ( A S A W A W ) ( A S A W A W ) 4 b 3 μ 0 3 R e q u 3 ( A S A W A W ) 3 10 b 2 μ 0 2 R e q u 2 ( A S A W A W ) 2 + b ( A S A W A W ) μ 0 R e q u l n μ 0 R e q u + b ( A S A W A W ) b ( A S A W A W ) + 12 b 3 ( A S A W A W ) 3 μ 0 3 R e q u 3 l n μ 0 R e q u + b ( A S A W A W ) b ( A S A W A W ) 22 b 3 μ 0 R e q u ( A S A W A W )
Formula (10) will be simplified to Poiseuille’s law expression without van der Waals force between the solid surface and fluid when A W = A S .
In the above formula, μ 0 is the water viscosity without van der Waals force between the fluid and solid suface, mPa·s; b is the viscosity increment coefficient, which is related to long-range van der Waals force between the liquid and solid, and its value is 5 × 10 13 , Pa·s·m; A W and A S are defined as the water and solid surface Hamaker constants, respectively, J; d is the distance from the center of tube to the solid surface, m; ε is the molecular interaction coefficient; R e q u is the equivalent radius, m; g is the conductance between adjacent pores; d p d x is the pressure gradient of the tube, Pa/m; Q is the flow section, m 3 / s .

3.3. Microscopic Simulation Model of Oil–Water Two-Phase System

Assuming that the fluid is incompressible and immiscible in a pore space. To eliminate a terminal effect in the simulation, the inlet of the network is linked with a reservoir saturated with driving fluid, and the outlet saturated with driven fluid. The intermediate section is utilized to simulate a microscopic seepage process and obtain macroscopic parameters. In the initial state, the network is water-wet and strongly water-wet [12]. A primary oil flooding process is utilized to form a reservoir. The partial wettability of the networks will be changed when the crude oil invades the network. We simulate secondary water flooding after primary oil flooding.

3.3.1. Primary Oil Flooding

Originally, the whole element (pores and throats) is fully saturated with water in the network model. The flooding process can only be piston displacement; that is, the center of an element varies when the adjacent element is saturated with oil.
In the oil–water meniscus, the capillary pressure can be obtained by the Young–Laplace equation:
P c o w = P o P w = σ o w ( 1 R 1 + 1 R 2 )
where σ o w is the oil–water interfacial tension; R 1 , R 2 are the principal radii of curvature of the interface.
With regard to a circular pore, it can be expressed as:
P c o w = 2 σ o w c o s θ o w r r
where θ o w r is the receding oil–water contact angle; r is the inscribed radius. More detailed descriptions are found in Mason and Morrow [45].
In fact, circular cross-sections are seldom. For polygonal-shaped elements, the expressions of capillary entry pressure are complicated when the wetting fluid resorts in the corners. Øren et al. [47] summarized the formula as follows:
P c = σ c o s θ r ( 1 + 2 π G ) r F d ( θ r , G , β )
F d is a dimensionless correction factor for the wetting fluid which might be retained in the corners; β is the corner half angles of the polygon.

3.3.2. Secondary Water Flooding

The primary oil flooding is followed by secondary water flooding. Because the wettability of some pores changed, some water left around the corners. The mechanism of the imbibition process becomes more complex than a primary drainage process. Lenormand et al. [48] described the mechanics of pore-scale water flooding in water-wet and partial water-wet systems. There are three main processes in displacement: piston-like, pore body filling, and snap-off displacement.

3.4. Calculation of Macroscopic Parameters

3.4.1. Water Saturation

In the network model, a simple cross-section geometry can represent the pore space. Thus, the specific distribution of an oil–water two-phase system can be solved by a simple geometry method. To get water saturation, water content can be calculated in each pore and throat by this method, which determines the entirety of the model:
S w = i = 1 N w V i w i = 1 N V i
where S w is water saturation; N w is the total number of pores and throats with water (including film water) in the network model; N is the total number of pores and throats in the network model; V i w is the water content of the ith pore and throat; V i is the volume of the ith pore and throat.

3.4.2. Relative Permeability

Suppose that the viscous force is negligibly small, and each pore flows through all the throats in the network model. If each pore body obeys mass conservation, then:
j = 1 Z i q i j = 0
Considering the interfacial effect between rock wall and fluid, we introduce the mathematical model of the micro-tube flow, the flow between two adjacent pores i and j:
q i j = j = 1 Z i g i j ( P i P j )
The conductivity between two pores can be equivalent to the harmonic mean of the conductivities between two pores and a throat [12].
l i j g i j = l i g i + l t g t + l j g j
where Z i is the coordination number of pore i; g i j is the conductivity of the z-phase fluid as it flows between pores i and j with solid–liquid interfacial effect; ( P i P j ) is the pressure drop between two pores; l i j is the distance between the centers of two pores i and j; l i and l j are the length of two pore bodies (i.e., the distance from the interface of pore and throat to the center of the pore); l t is the net length of throat; g i , g j , and g t are the conductivity of any two pores and the throat that connects with them.
Each pore can be expressed by similar equations in the network, and then large linear algebraic equations can be established. When the inlet and outlet pressure are known, the conjugate gradient method based on the iterative process can be used to solve this equation and achieve the pressure distribution of each point in the interior, so the flow between every two pores can be calculated. Finally, the total flow can be obtained.
Suppose that there are several different phases in the network, each one has only part of the channels and the interaction between each phase. Thus, the flow of a phase will be below the single-phase flow. According to the definition of relative permeability, the relative permeability of phase d is:
k r d = q t m d q t s d
where q t m d is the total flow of phase d in the multiphase flow with the same imposed pressure drop; q t s d is the flow of phase d in single-phase flow.

4. Simulation Results and Discussion

A network model that was obtained from the reconstructed Berea sandstone was established [49]. The network model size was 3 mm × 3 mm × 3 mm, as shown in Figure 3. The sphere and rod represent pore and throat, respectively. The size of the ball and rod reflect the different spatial dimensions of the whole pore and throat. It is composed of 12,349 pores and 26,146 throats. The porosity and absolute permeability are 24% and 2.5 Darcy, respectively. The basic parameters of the network simulation are listed in Table 1.
To analyze the simulation results, quantitative comparison of influences of van der Waals force under wet conditions on residual oil was performed. Here, the impact of van der Waals force on residual oil was determined by efficiency variation. The oil recovery is calculated from the following relation:
E = ( S o i S o r ) / ( S o i )
where E is displacement efficiency; S o i and S o r are initial and residual oil saturation, respectively.

4.1. Water-Wet Reservoir

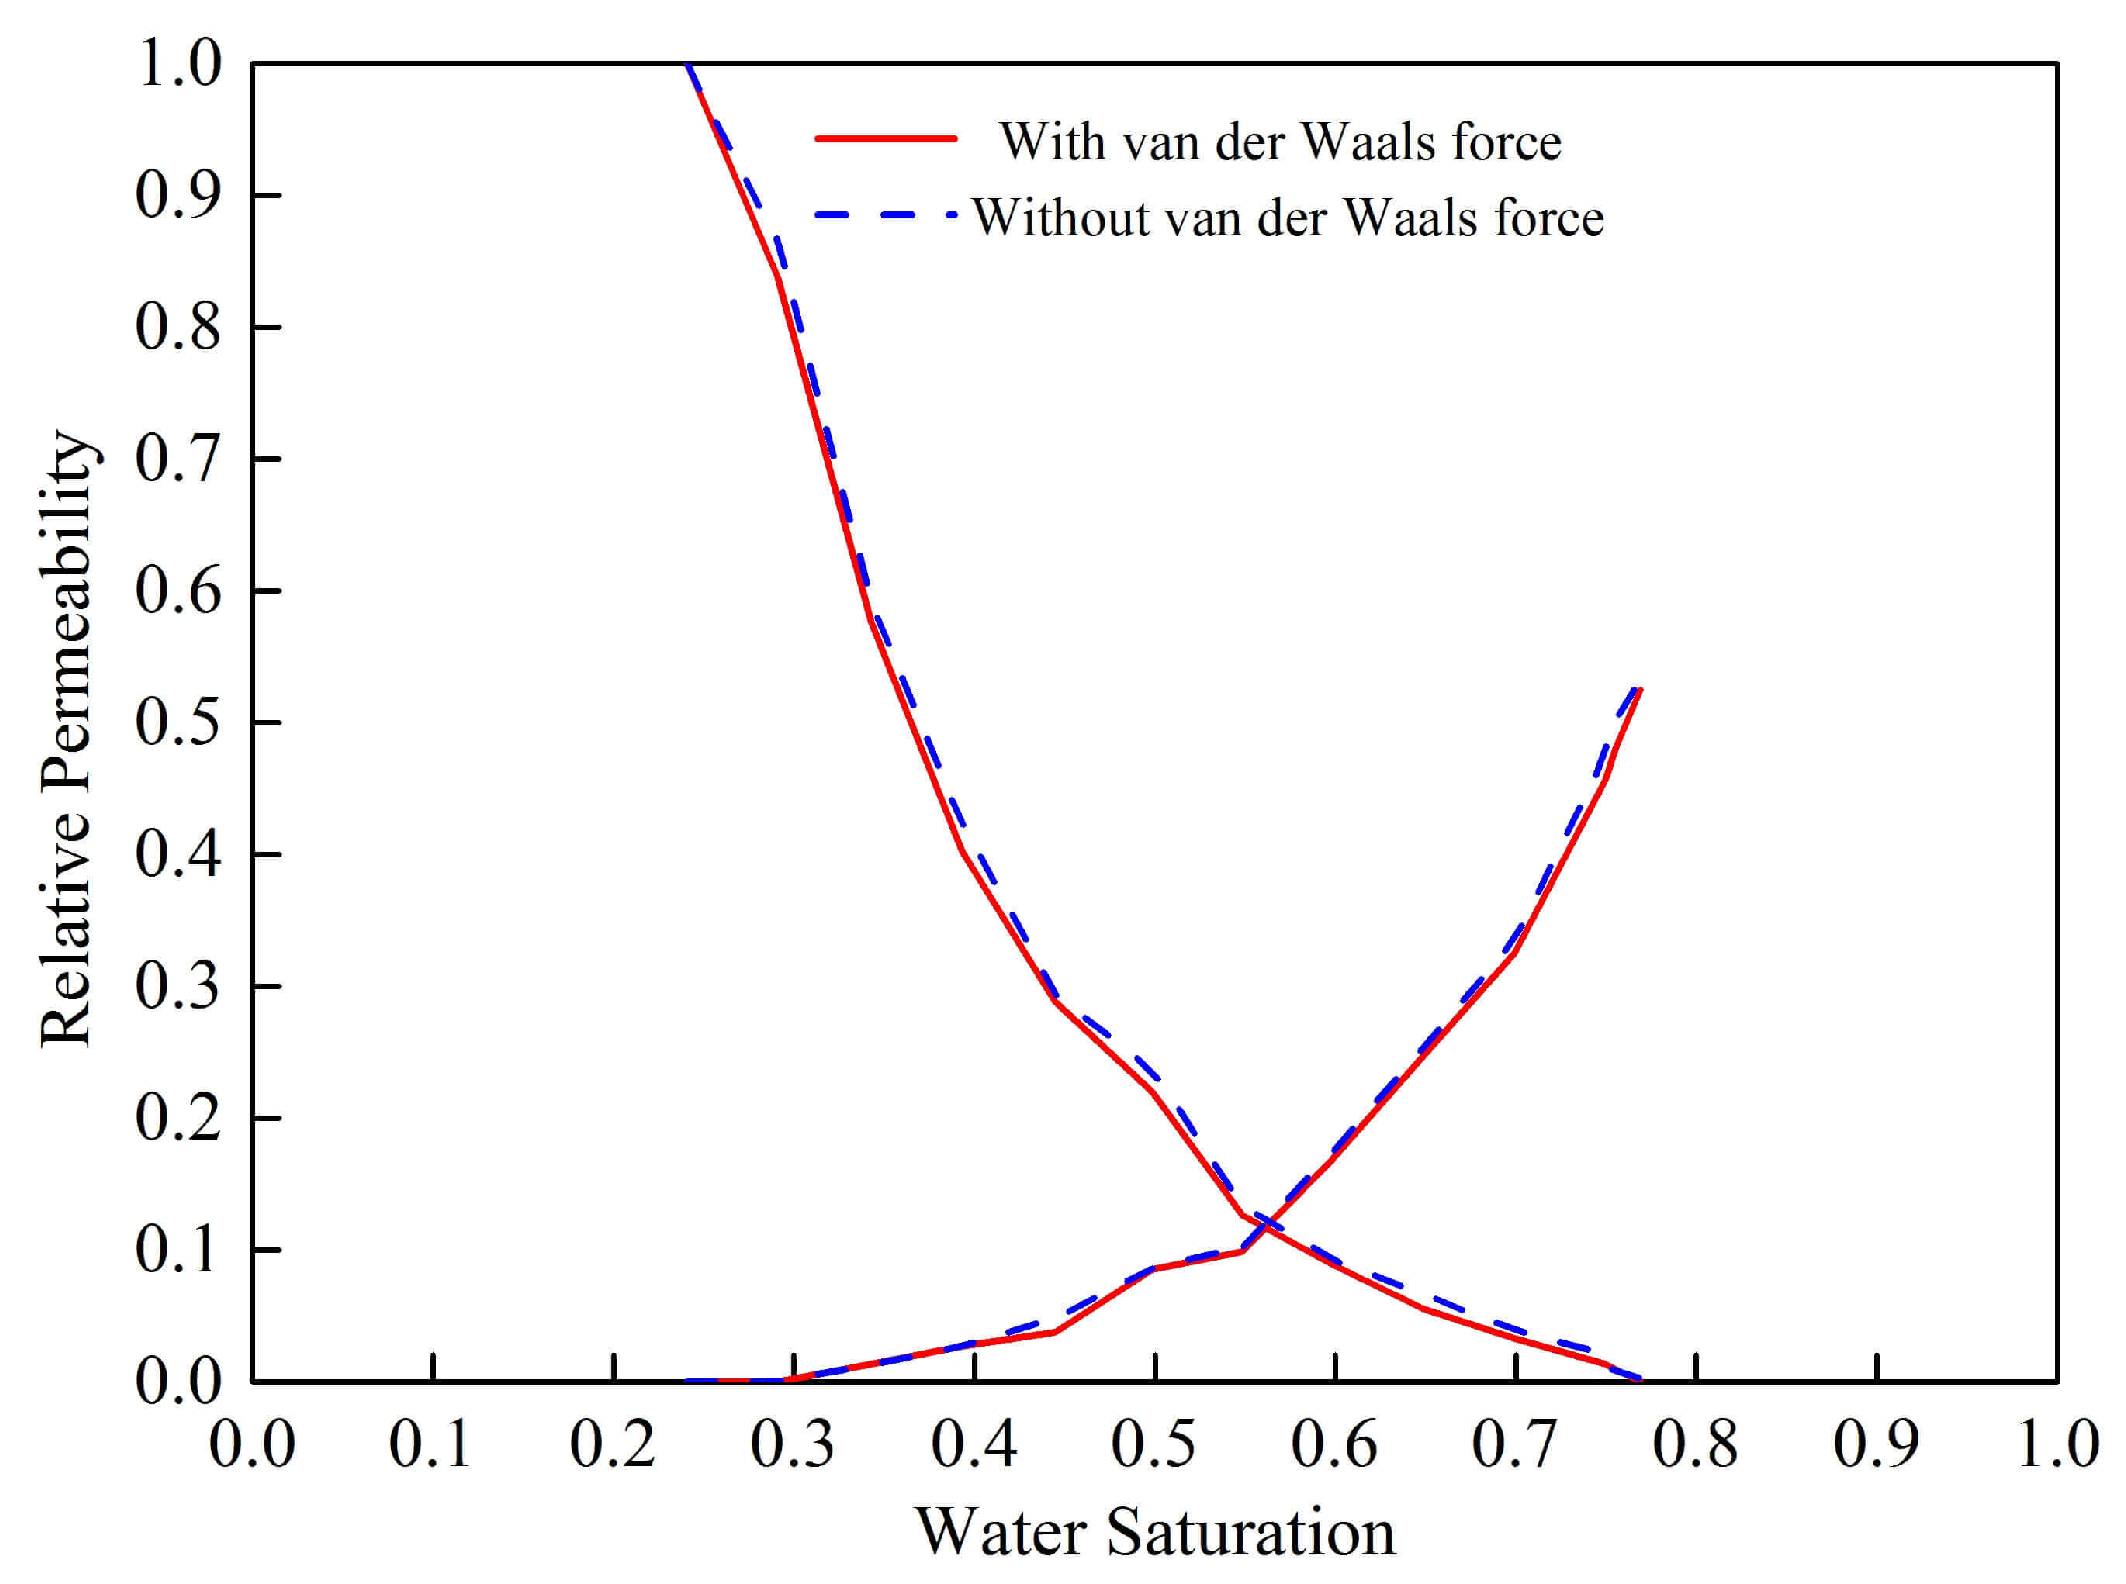
4.1.1. Relative Permeability

The impacts of van der Waals force on the relative permeability curve are shown in Figure 4. The isotonic point moved to the left, the oil–water simultaneous flow region decreased, and the residual oil saturation increased with van der Waals force. During the imbibition process, capillary force acted as the driving force. Van der Waals force increased the binding force of the fluid, which meant that the flow resistance between the pores increased. Oil recovery with and without van der Waals force were 57.07% and 59.48%, respectively. To be precise, the efficiency variation influenced by van der Waals force was 4.05%.

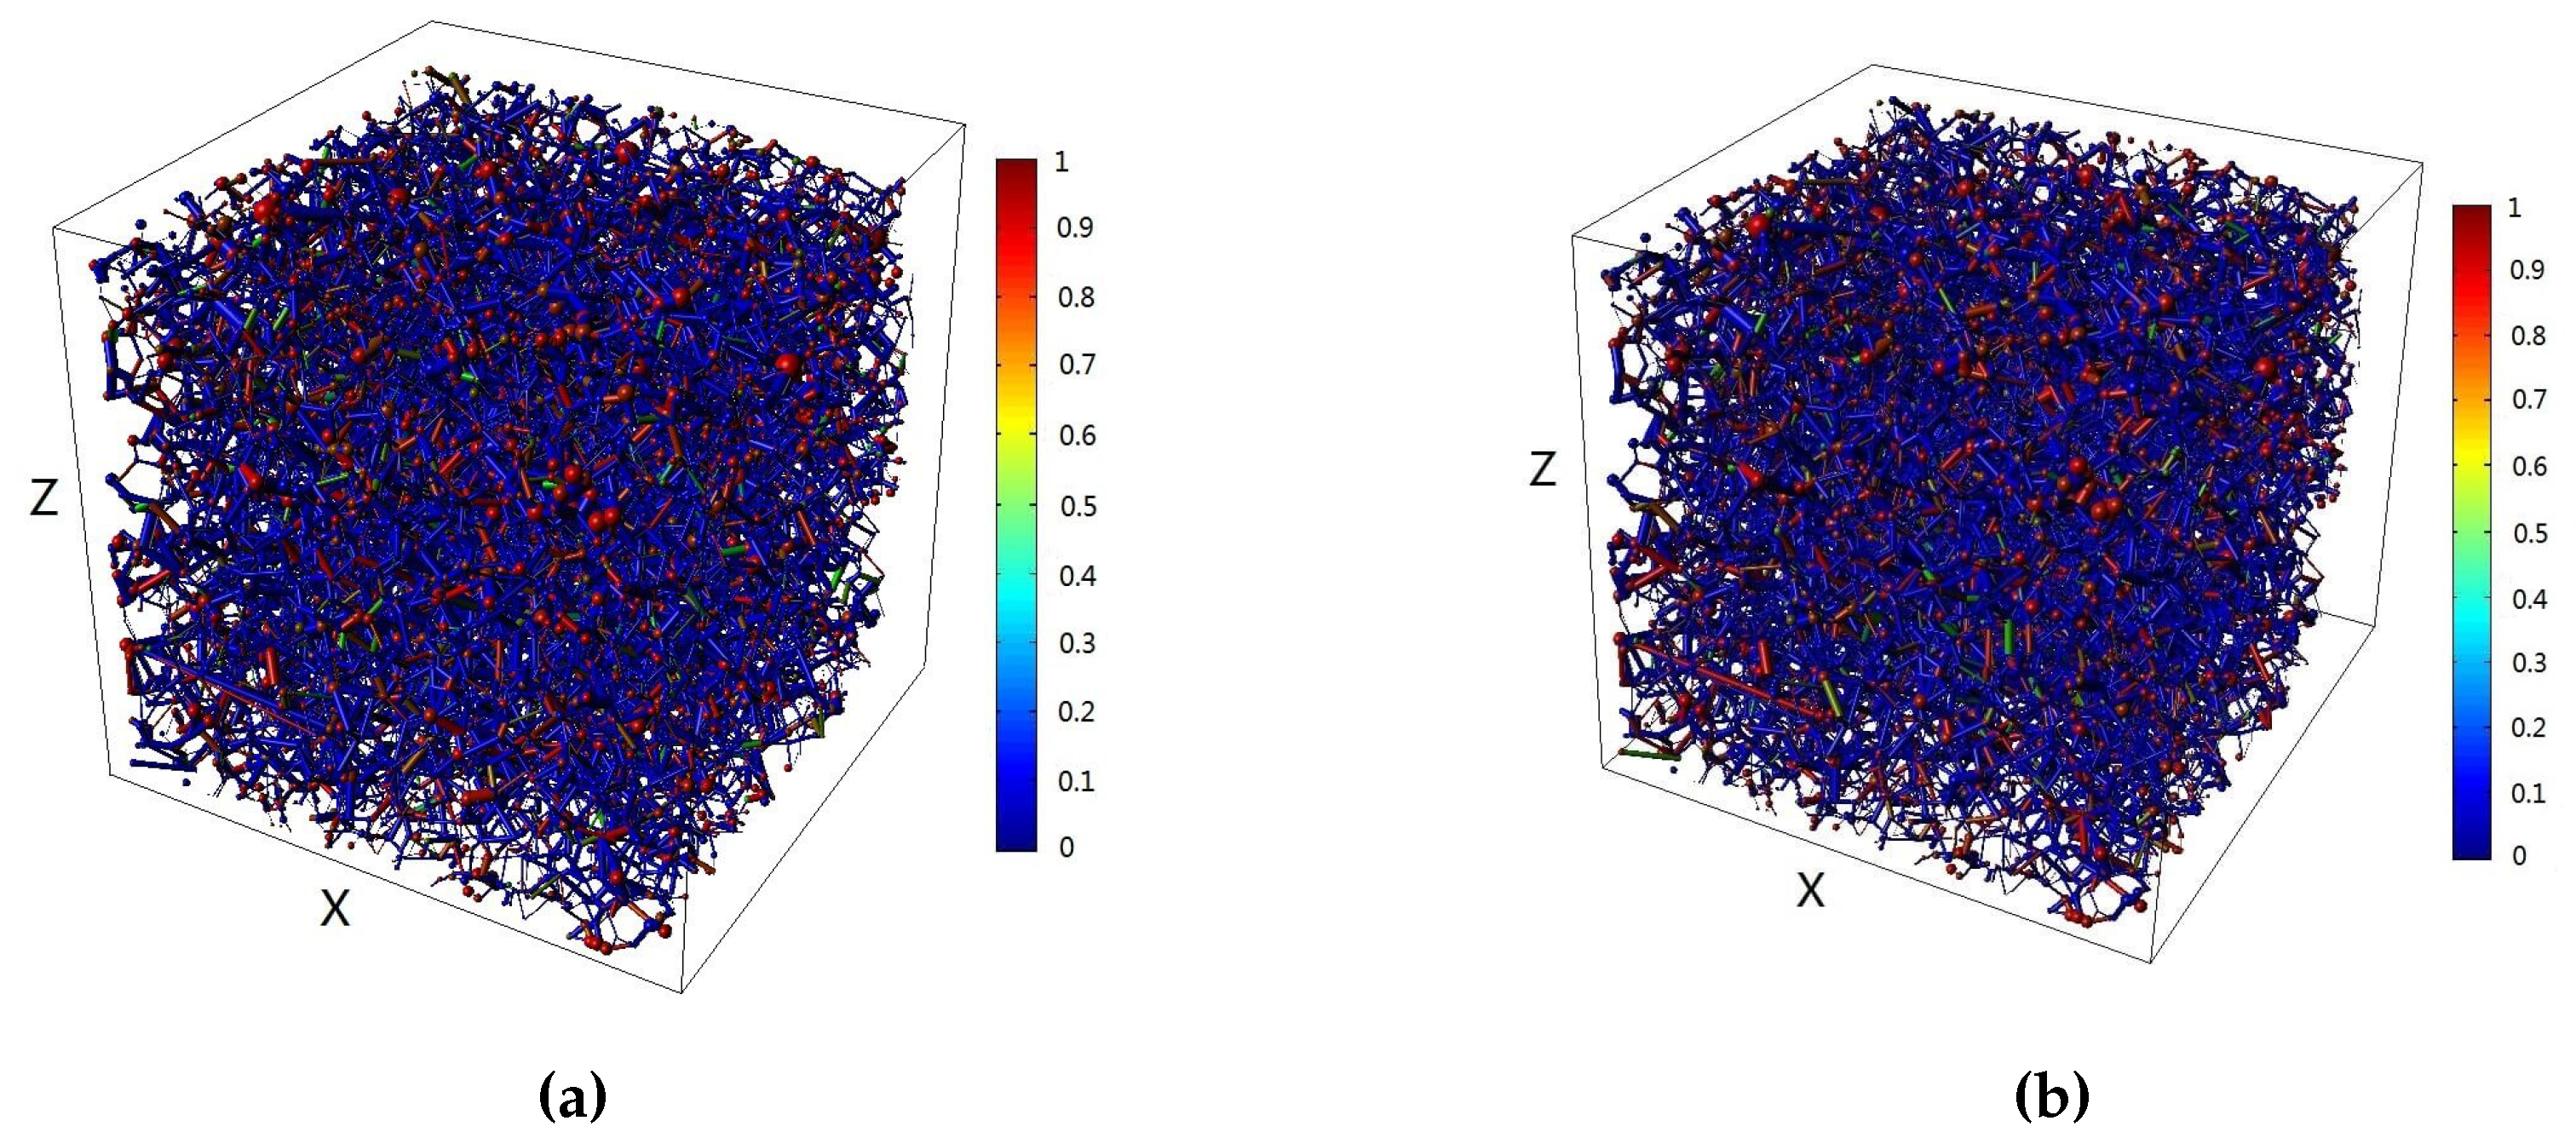
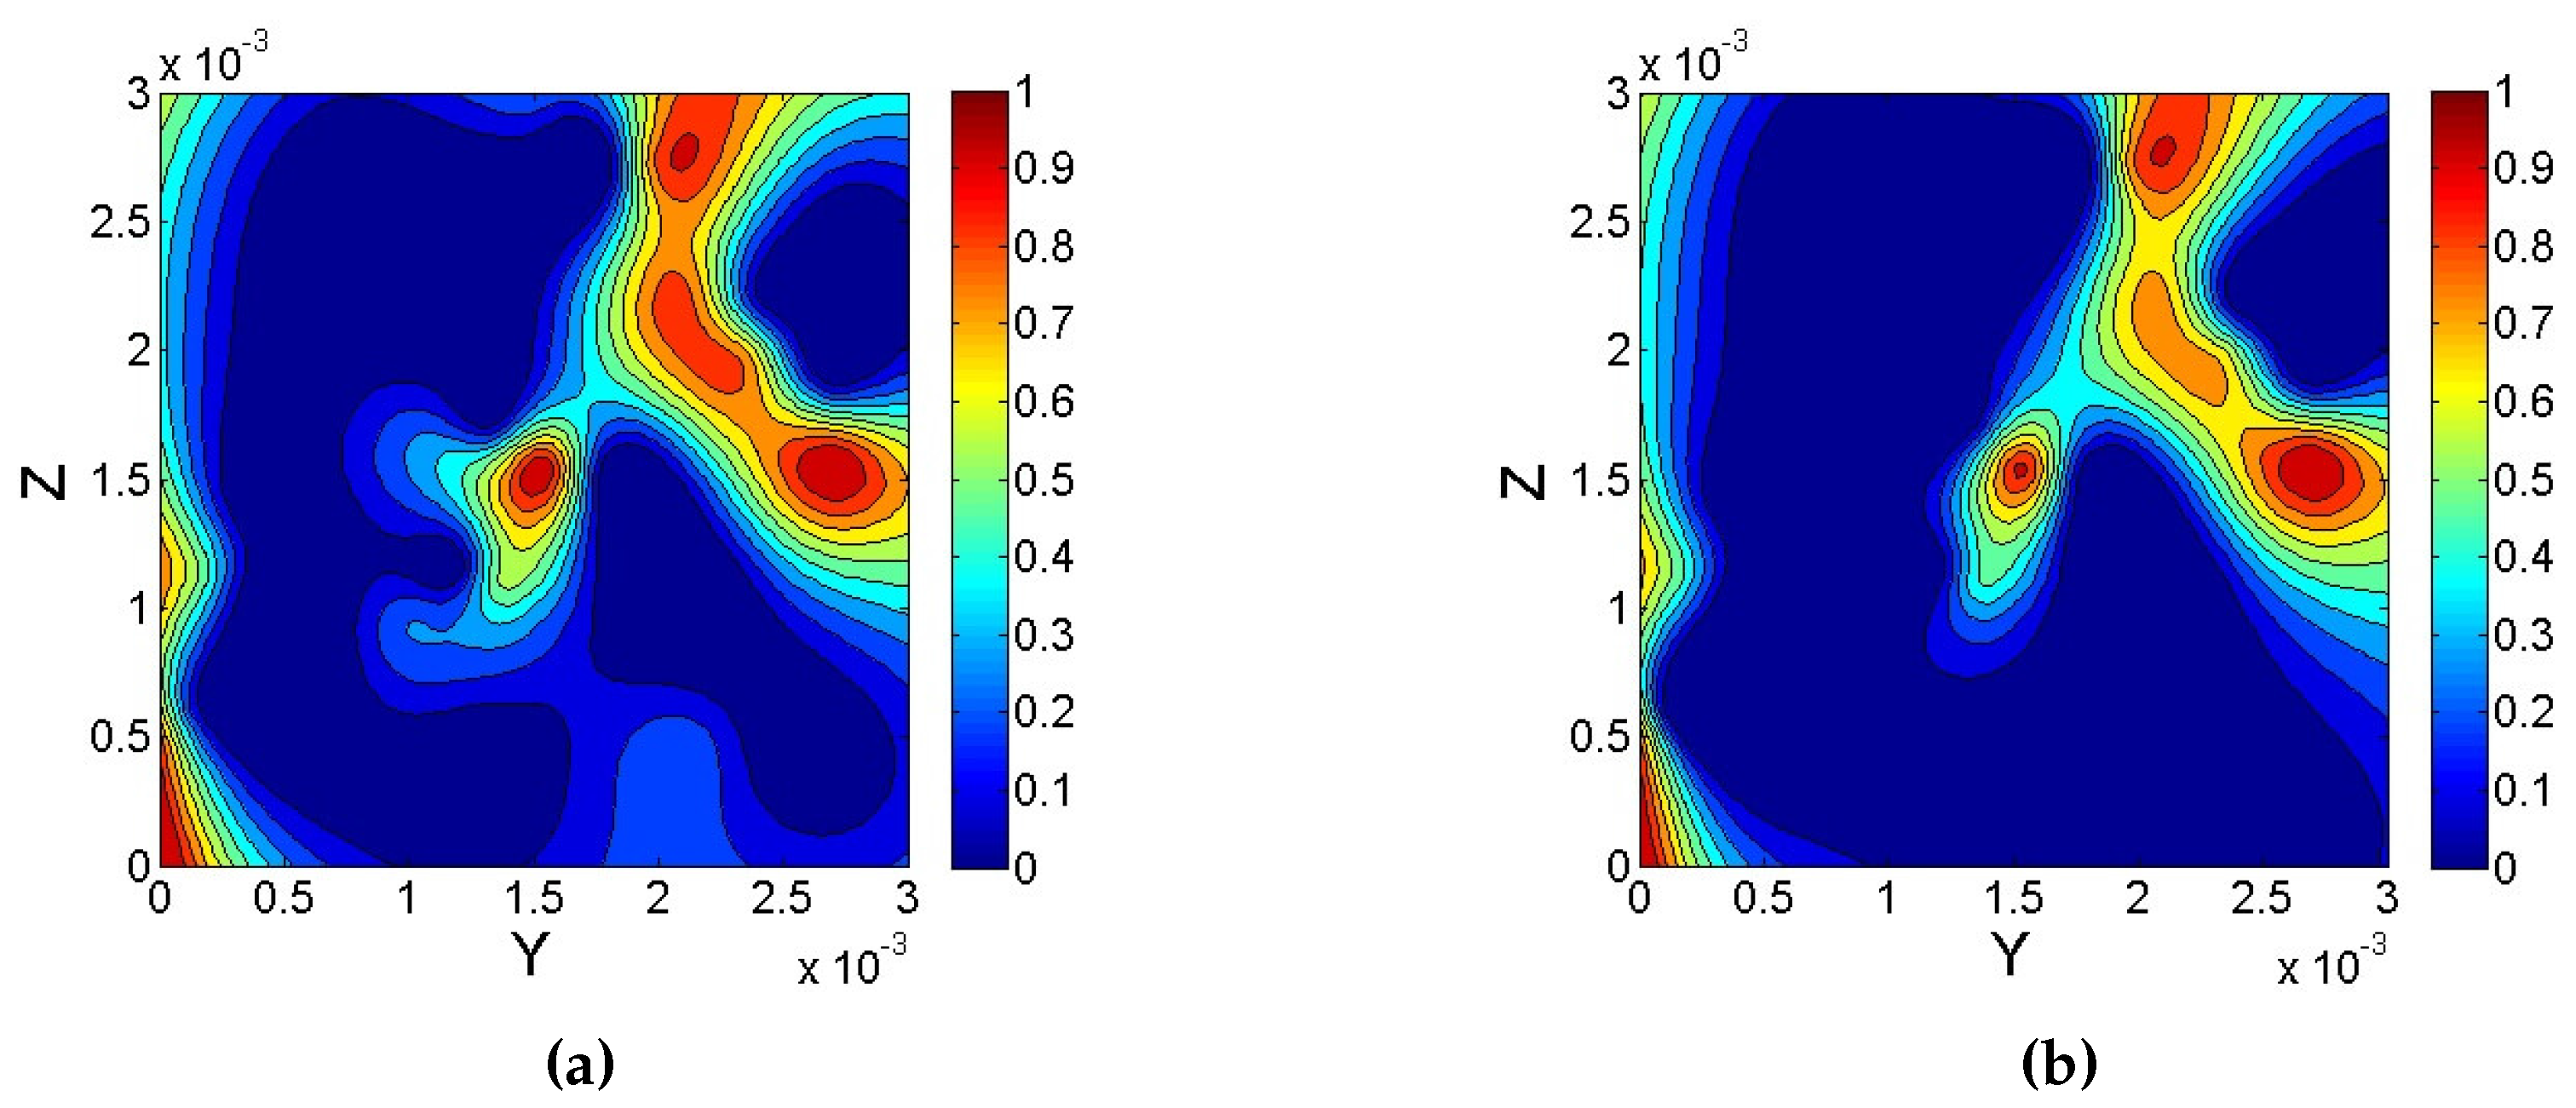
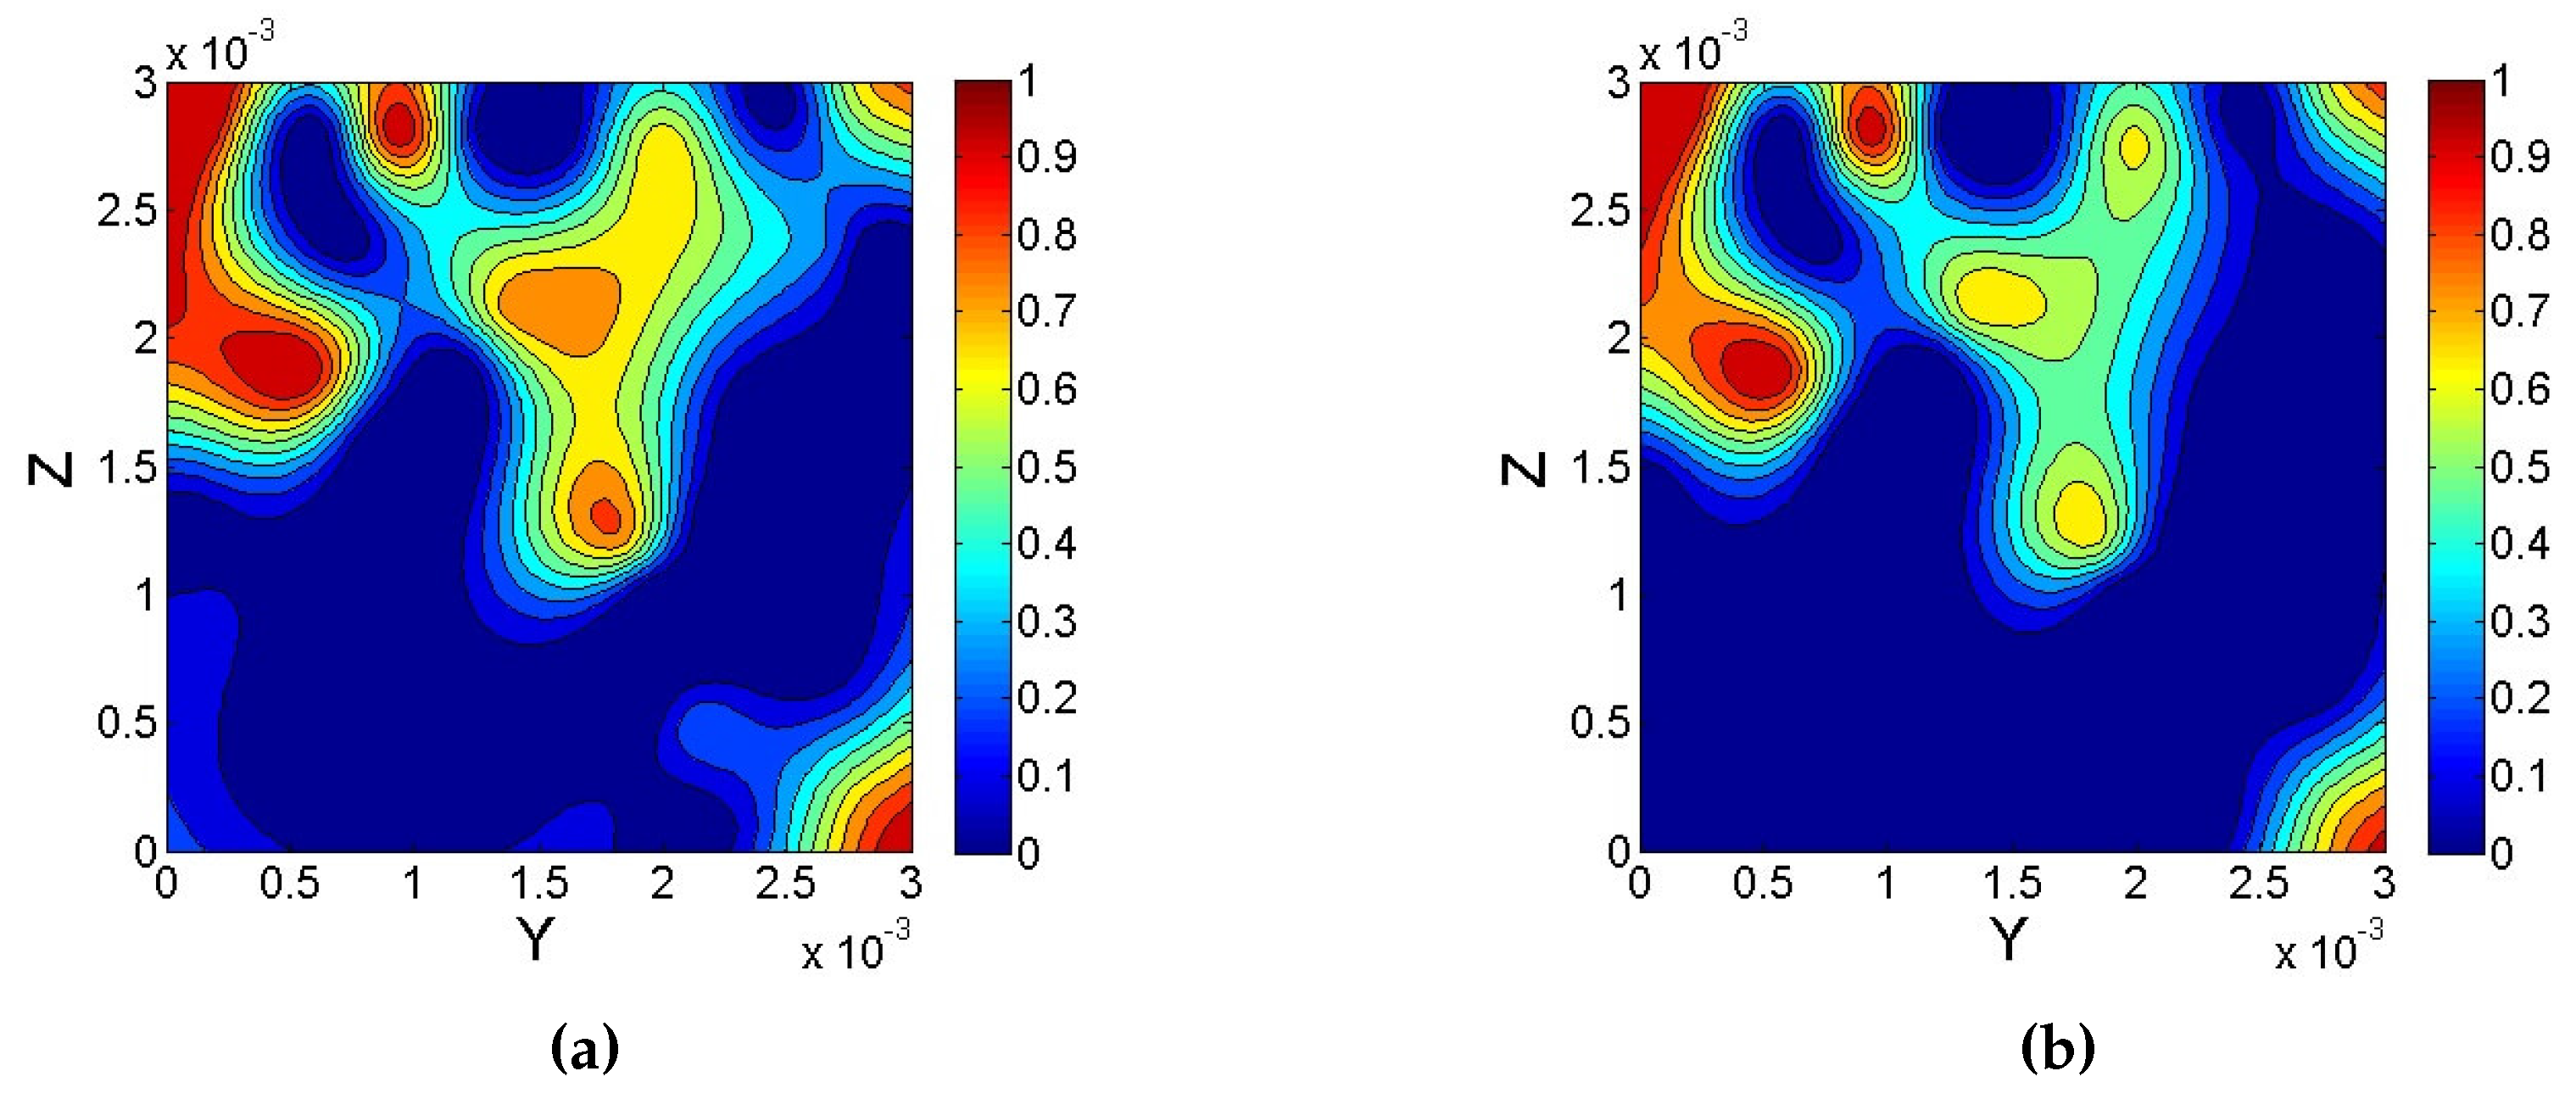
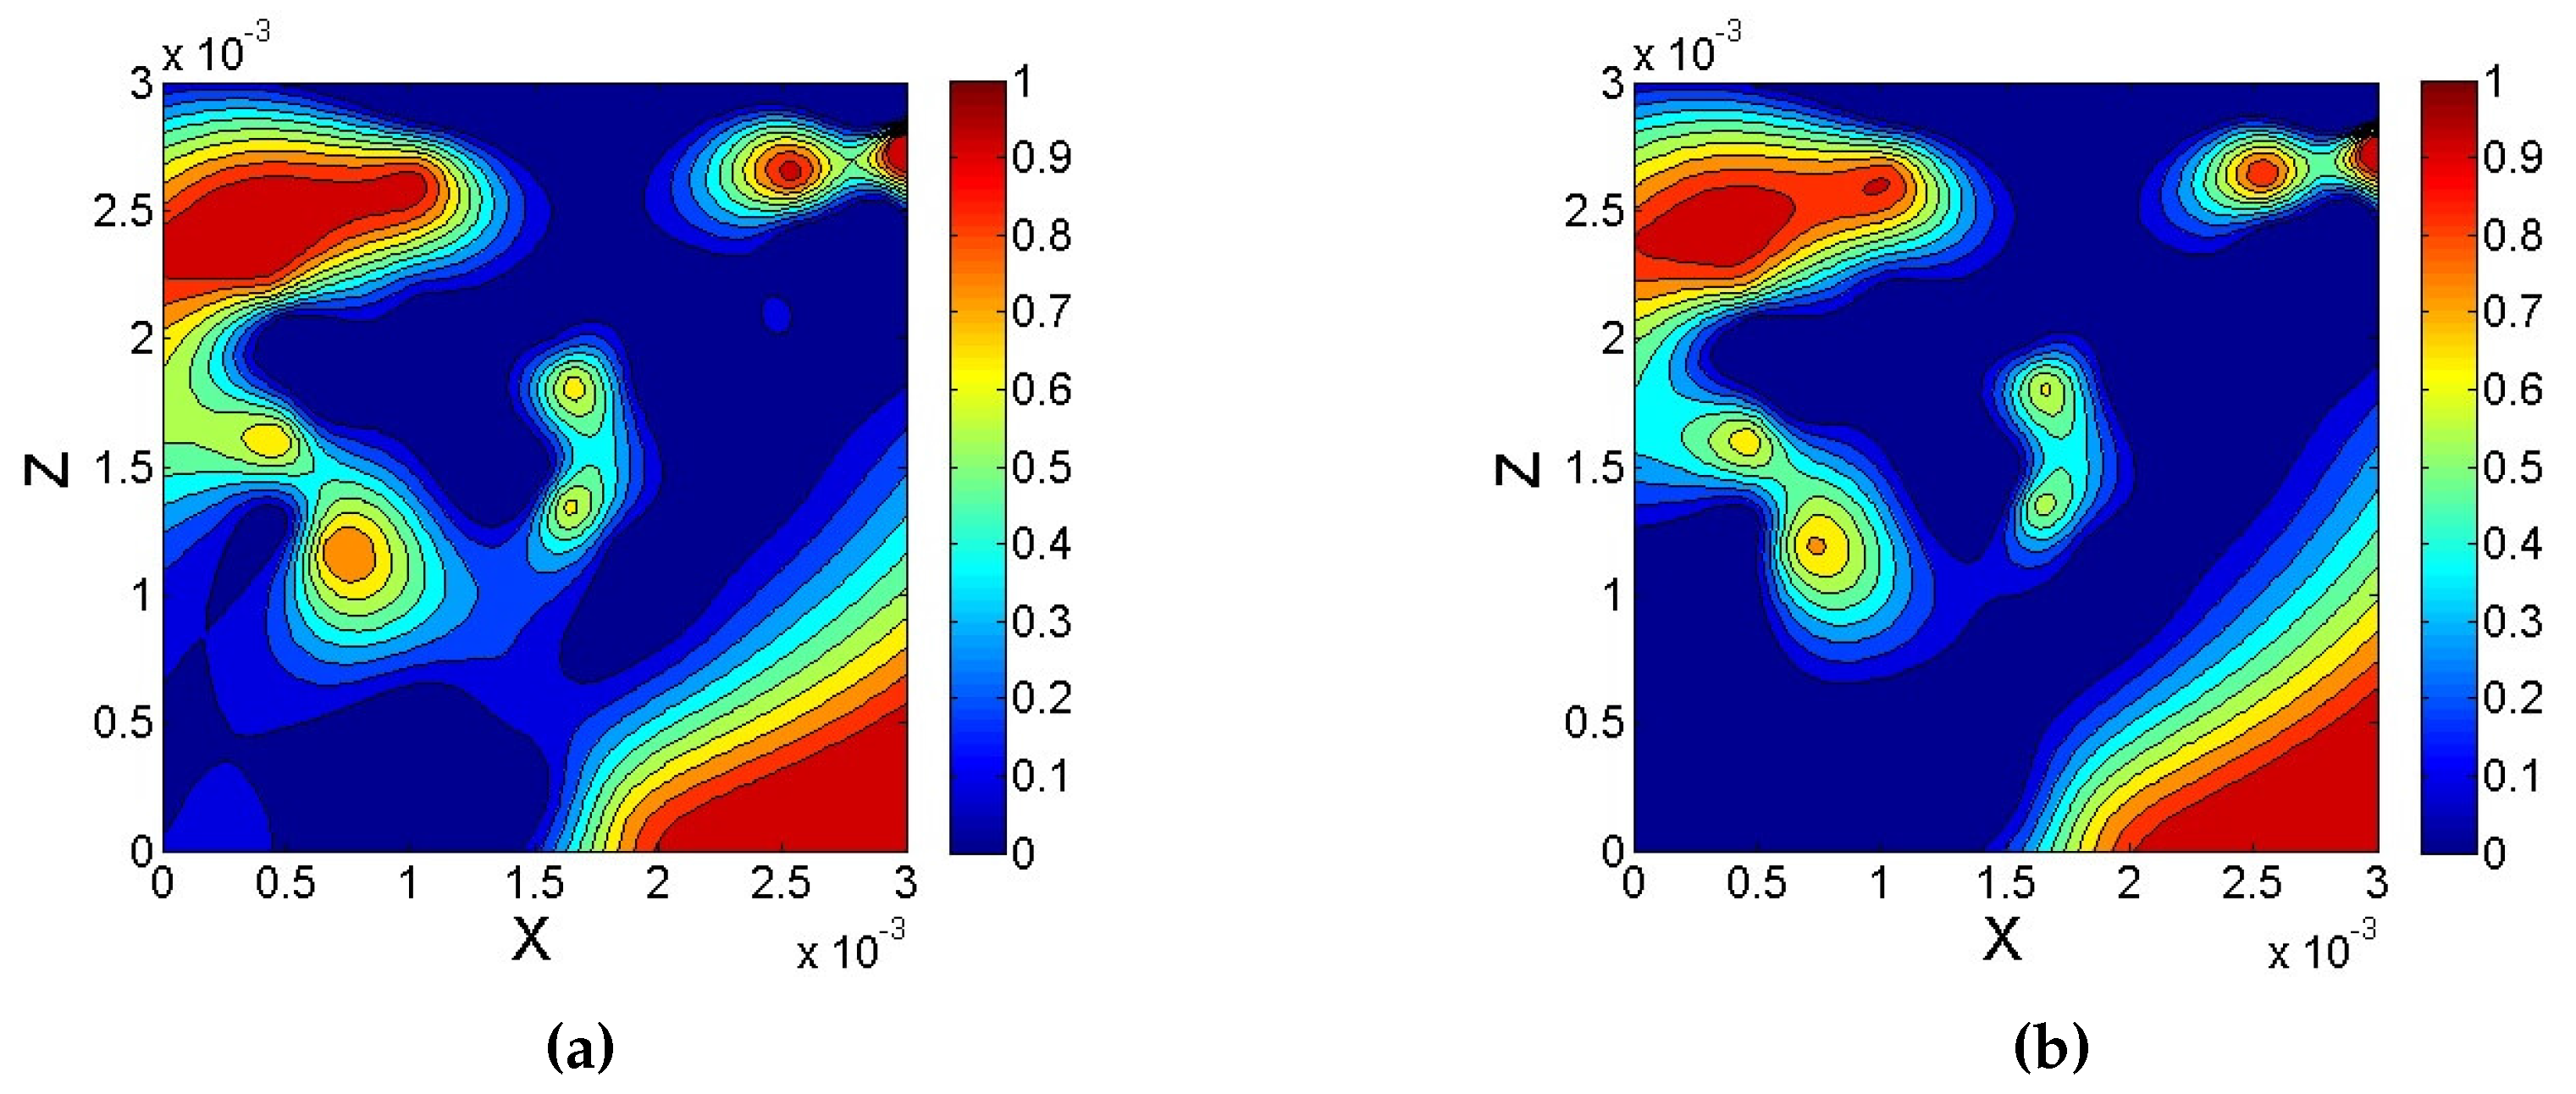
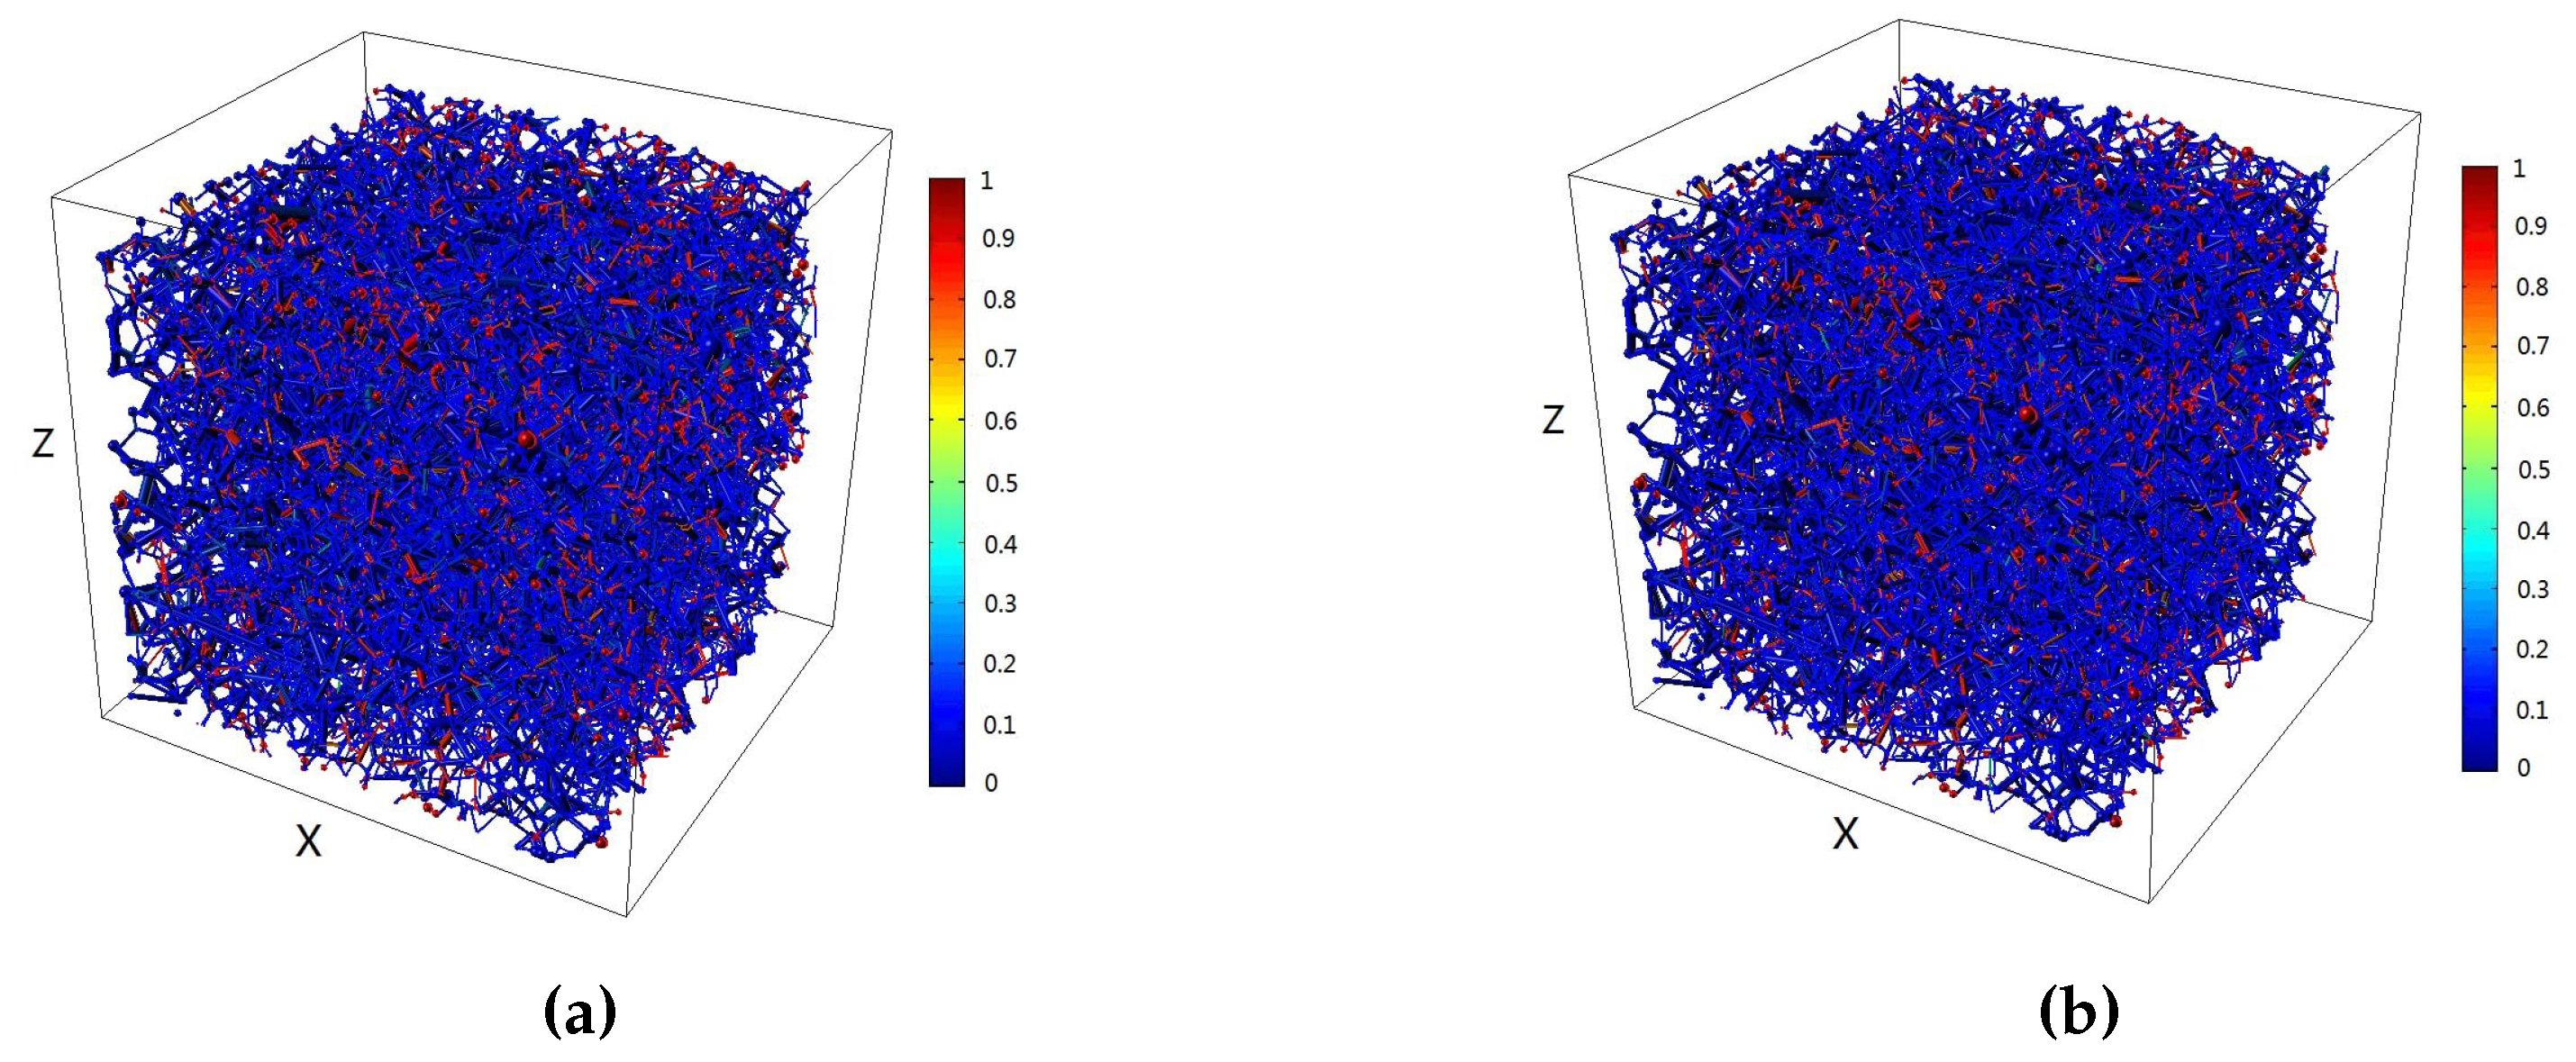
4.1.2. Residual Oil Distribution

The distribution of residual oil in the network model with and without van der Waals force is shown in Figure 5. Figure 6, Figure 7 and Figure 8 show the contour maps of the residual oil saturation at different cross-sections of the X-axis and Y-axis directions with and without van der Waals forces. Due to van der Waals force, the flow resistance increased, and resulted in boosting the proportion of residual oil in the network model. Thus, the microcosmic residual oil was significantly influenced by van der Waals force; namely, van der Waals force cannot be ignored in a water-wet reservoir. These results were consistent with those obtained by Geim et al. [50], who mentioned van der Waals was no longer negligible and can compete with the capillary force in the case of hydrophilic materials.

4.2. Oil-Wet Reservoir

4.2.1. Relative Permeability

The influence of van der Waals force on the relative permeability curve is shown in Figure 9 . Compared with the water-wet reservoir, capillary force acted as resistance. This indicated that the flow resistance of van der Waals force can be negligibly small. Oil recovery with and without van der Waals force were 69.59% and 70.27%, respectively. Here, the efficiency variation influenced by van der Waals force was only 0.97%. Compared to water-wet reservoir, van der Waals force had little impact on the relative permeability curve.

4.2.2. Residual Oil Distribution

The residual oil distribution in the network model with and without van der Waals force is shown in Figure 10. It is indicated that the low residual oil saturation was an indication of an oil-wet system, as a result of oil getting through layers. The microcosmic residual oil was not affected by van der Waals force.

4.3. Effects of Micro-Structure on Residual Oil
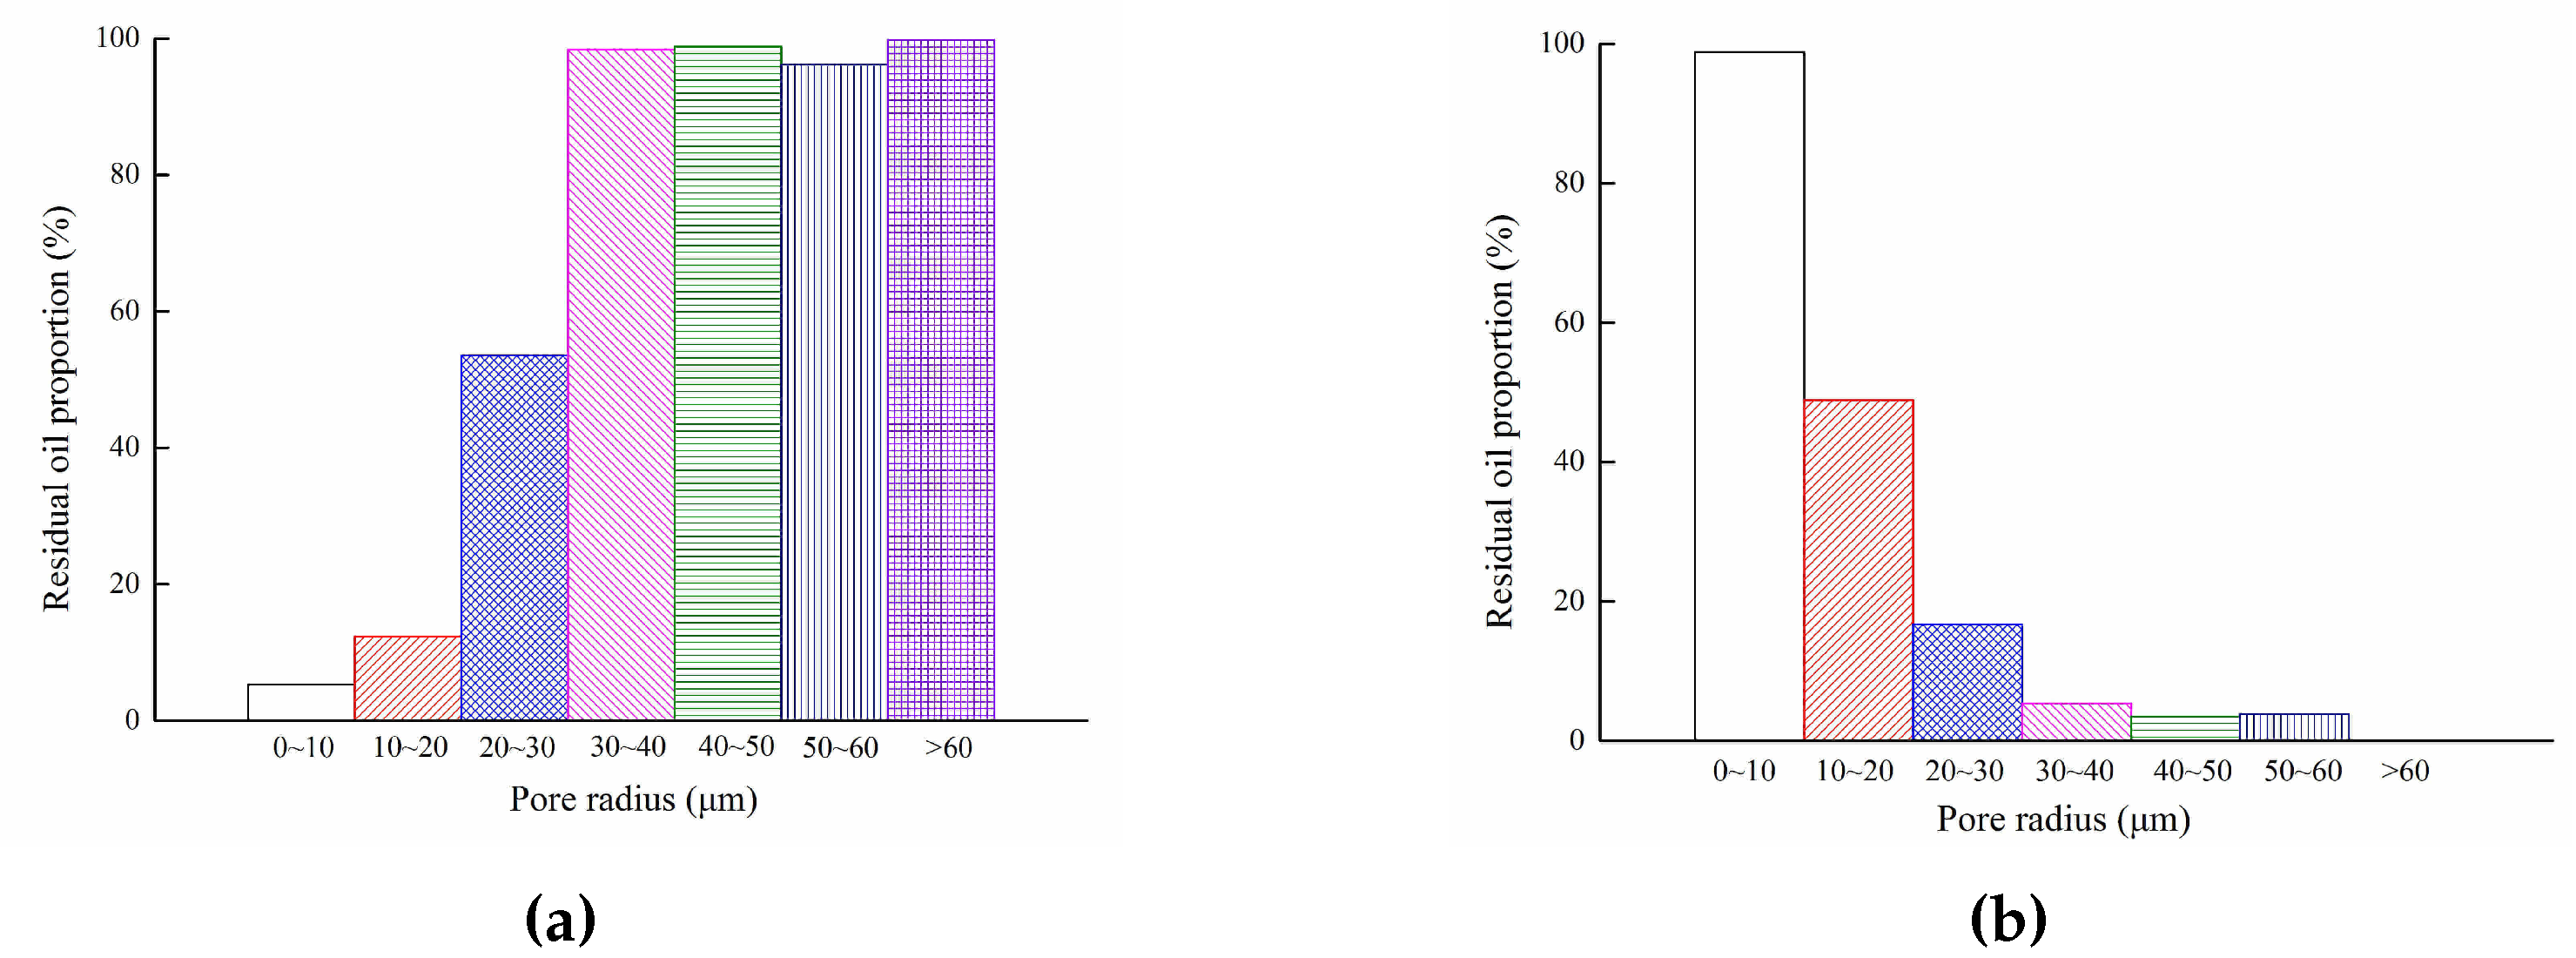
To study and discuss the influence of microscopic reservoir parameters on residual oil distribution, the distribution of microscopic reservoir parameters in a network model and the proportion of residual oil in pores were statistically analyzed under the conditions of water-wet and oil-wet, respectively. First, the water saturation of a pore was less than 85%; it was defined as the presence of residual oil [51]. Then, calculating the proportion of residual oil to the whole pore was employed by conventional statistical methods. This essentially reflected the residual oil which was influenced by the single factor of microscopic parameters in a certain pore.

4.3.1. Pore Radius

The pore radius—which is the microscopic parameter—indicates pore size in the reservoir. The distribution of pore radius ranges from 3.6 μ m to 73.5 μ m in the network model, and mostly concentrates in the range of 3.6–30 μ m. As shown in the statistical results (Figure 11), the proportion of residual oil increased with the pore radius in the water-wet reservoir. It was known that the capillary force acted as the driving force during the imbibition process. That is, the capillary force increased with the decreasing of pore radius, and the residual oil difficultly remained in small pores. On the contrary, the capillary force acted as resistance, and the proportion of residual oil increased with the decreasing of pore radius in the oil-wet reservoir.

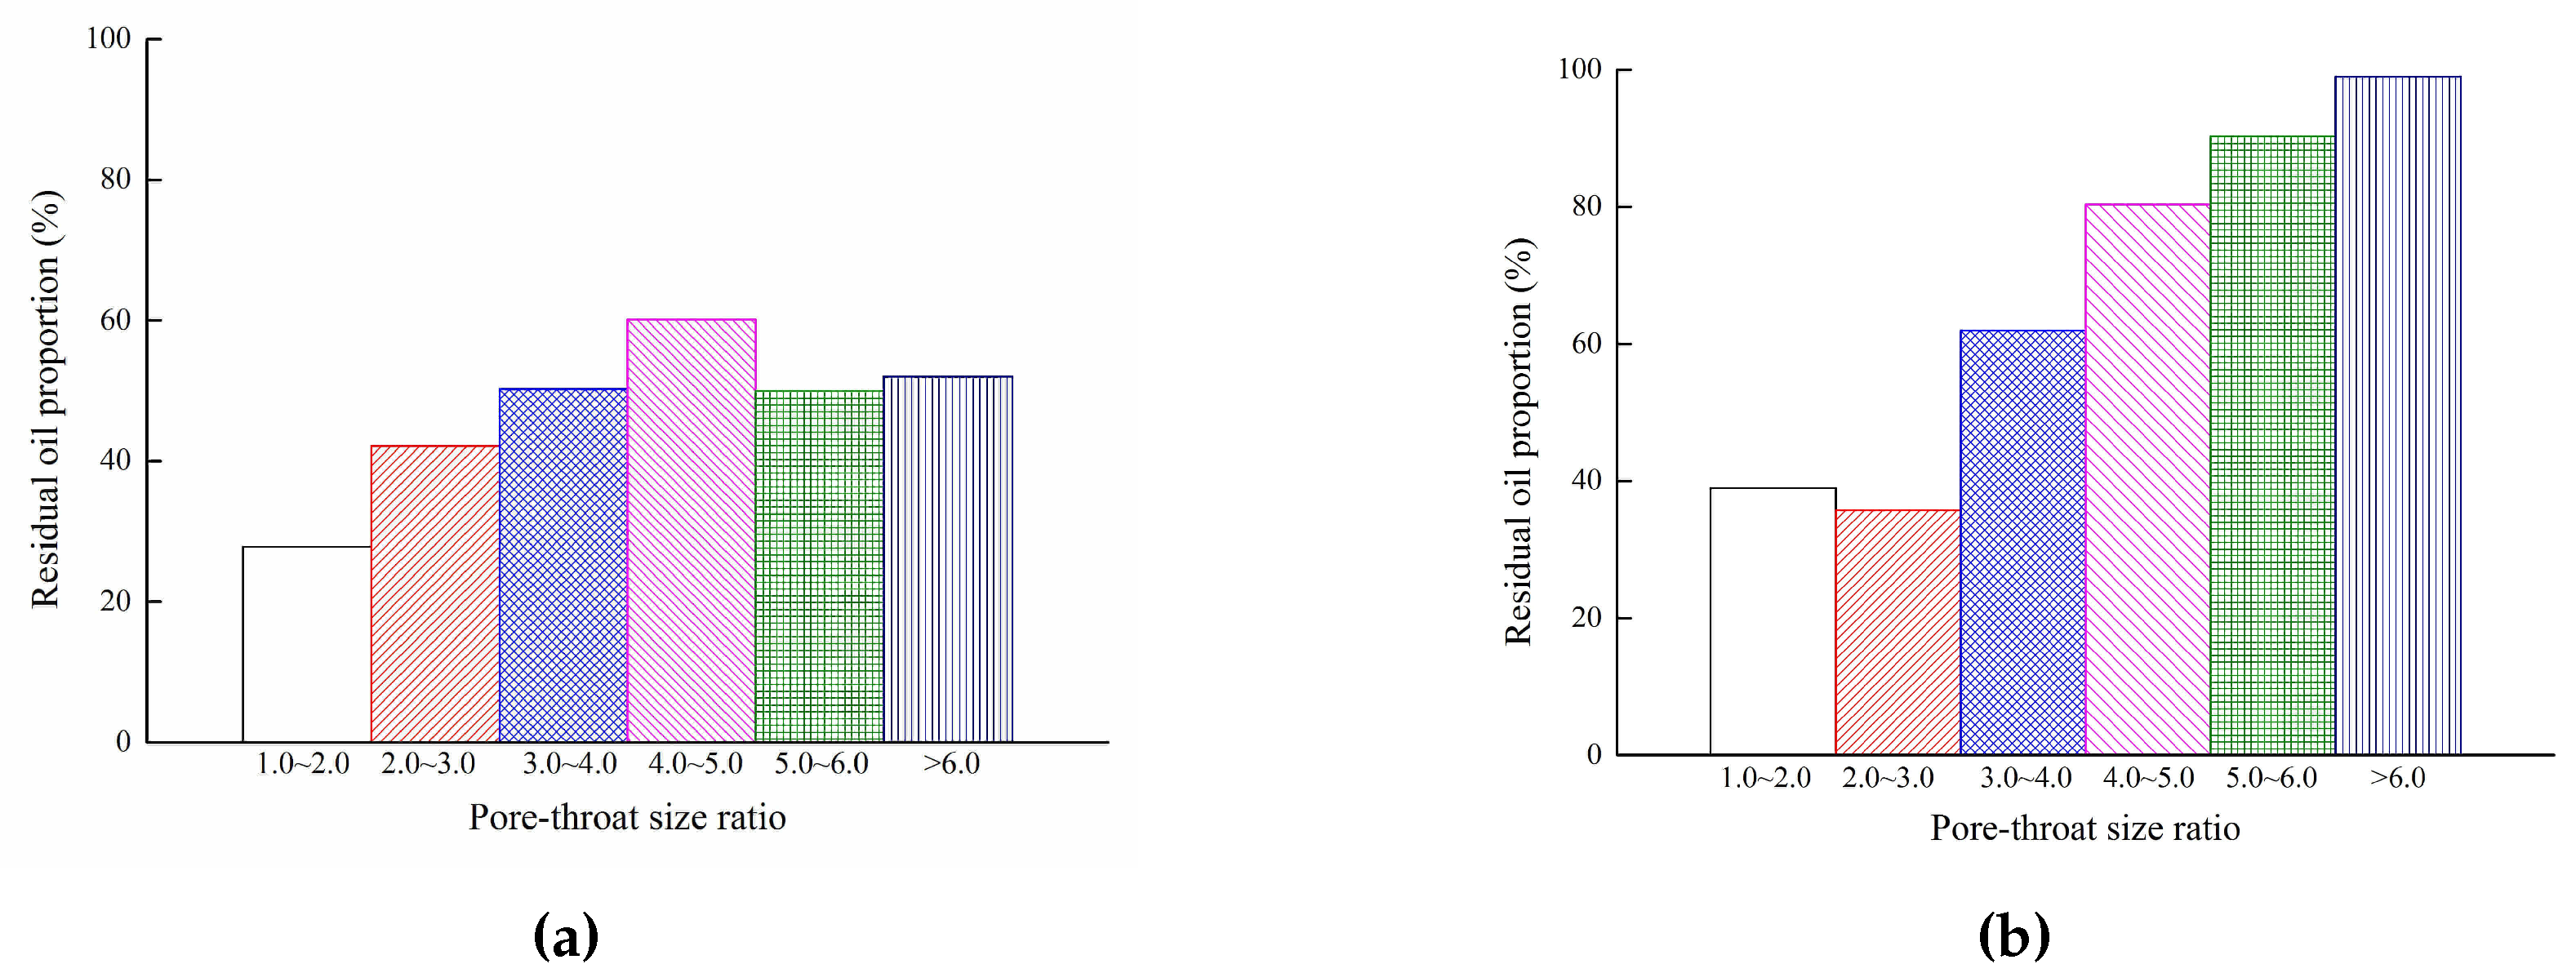
4.3.2. Pore–Throat Size Ratio

The pore-throat size ratio represents the degree of pore connectivity. It is also an important factor in controlling the oil displacement process. The calculation formula is:
R p t = R p i = 1 Z R t i n 1
where R p is pore radius; R t i is the radius of the ith throat communicating with the pore; Z is the coordination number.
The pore–throat size ratio ranged from 1.0 to 3.0 in the network model. As seen from Figure 12, both in water-wet and oil-wet reservoirs, the probability of residual oil increased with the pore–throat ratio, which meant that the proportion of residual oil increased in the pores. The proportion of residual oil with pore–throat size ratio of 4.0–5.0 was the largest. According to Equation (20), the increasing of pore-throat size ratio meant that the mean radius of throats decreased. The throat was the main seepage channel of oil and water. Therefore, residual oil can be easily detained in the pores with a small throat. A similar result was observed by Gao et al. [52].

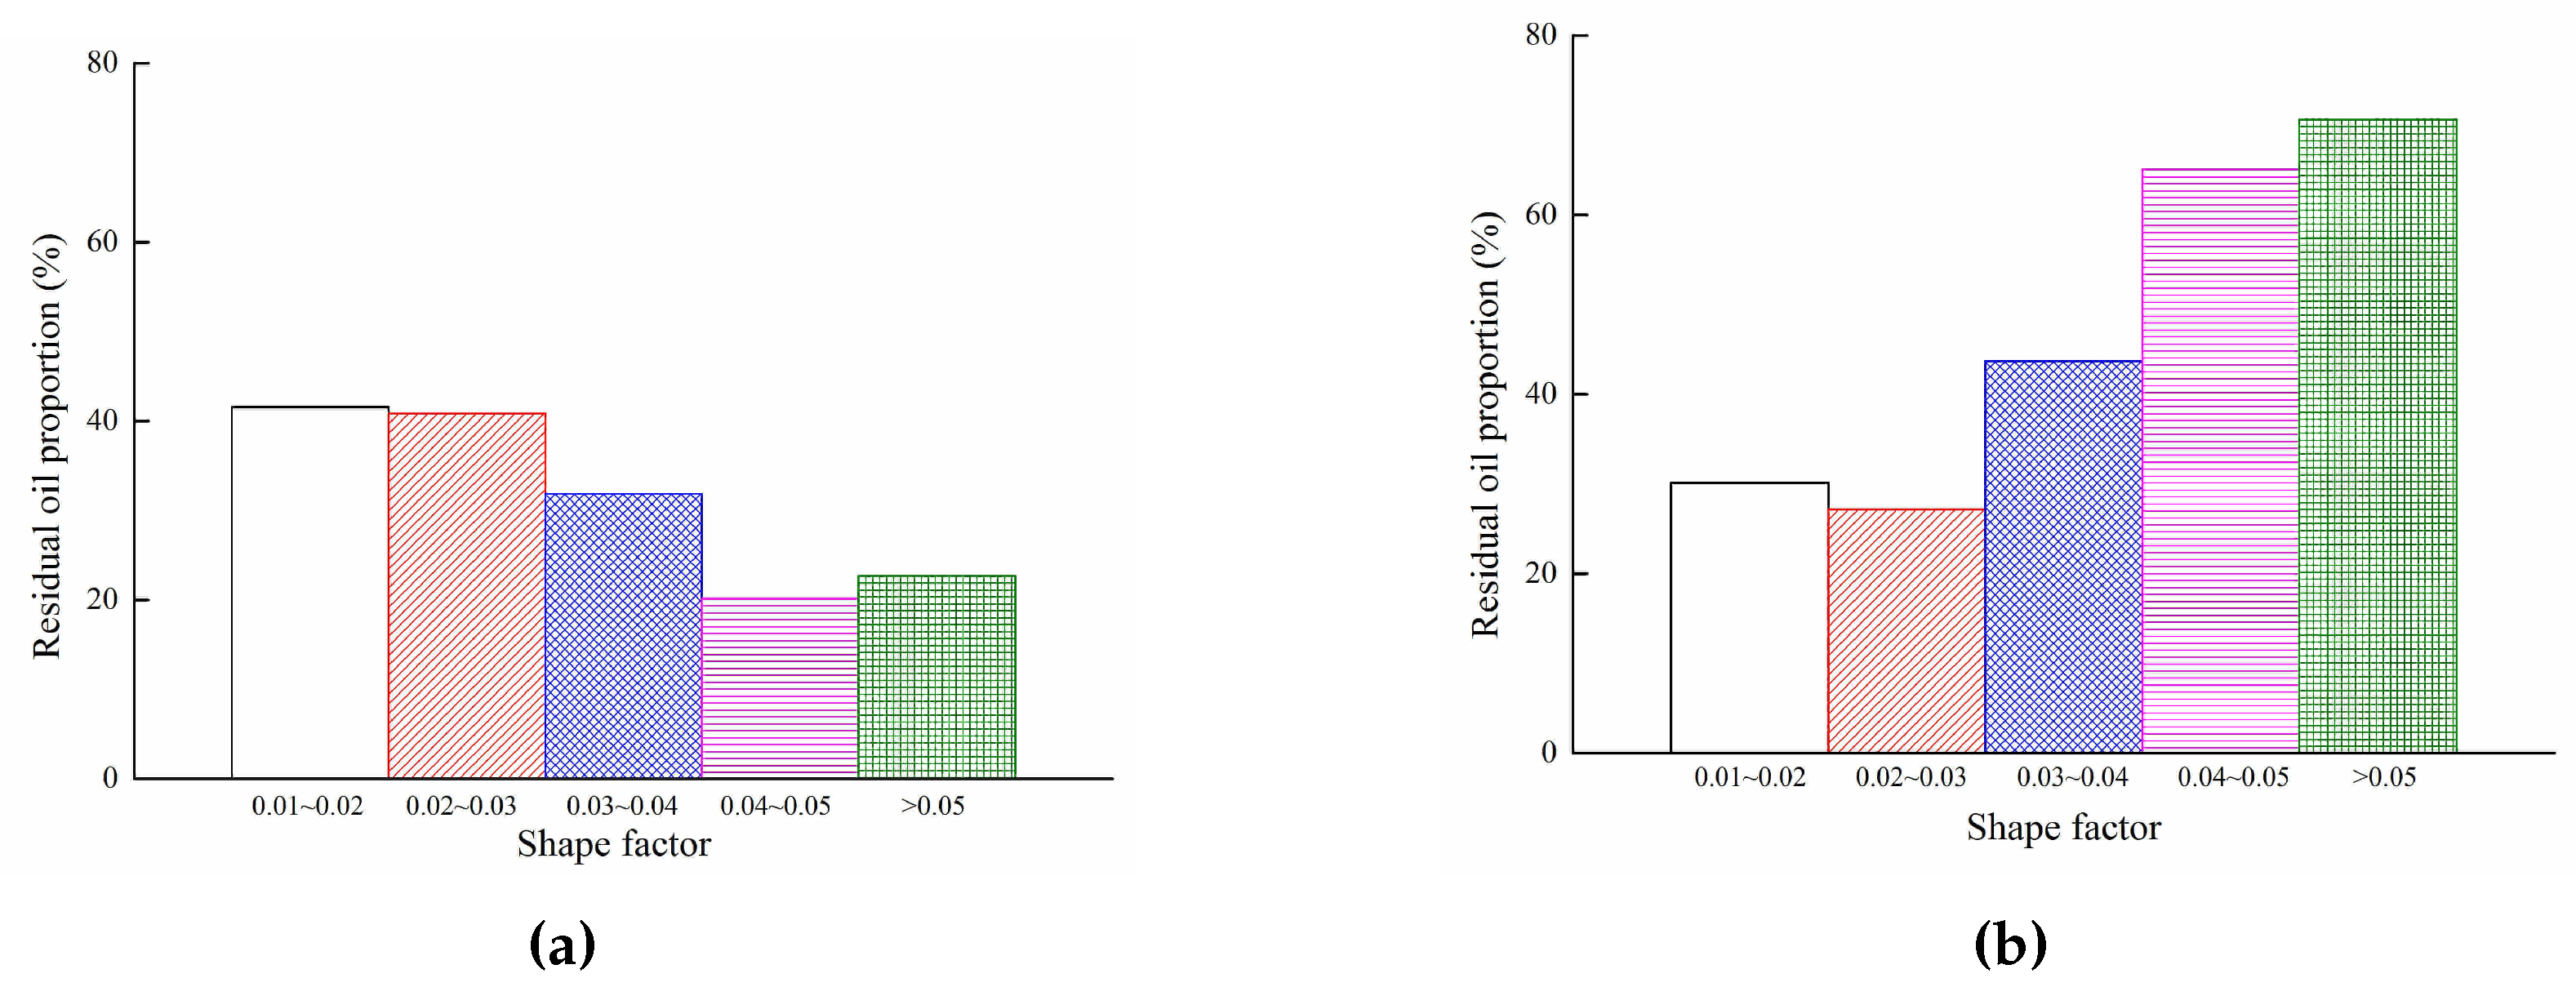
4.3.3. Shaping Factor

The shaping factor is another microscopic parameter, used to characterize the pore shape. It seems that the pore shape is more irregular with the decreasing of shape factor. It mainly ranges from 0.02 to 0.04. If a shape factor exceeds 0.05, it means pores with a square or circular cross-section. As seen from the statistical results Figure 13, the probability of residual oil decreased as the shape factor increased in the water-wet reservoir. The proportion of residual oil with a shape factor of 0.04 to 0.05 was the smallest. Compared to the water-wet reservoir, the proportion of residual oil increased with the shape factor in the oil-wet reservoir, and 0.02 to 0.03 was the smallest. This is attributed to the complexity of pore shape in porous media.

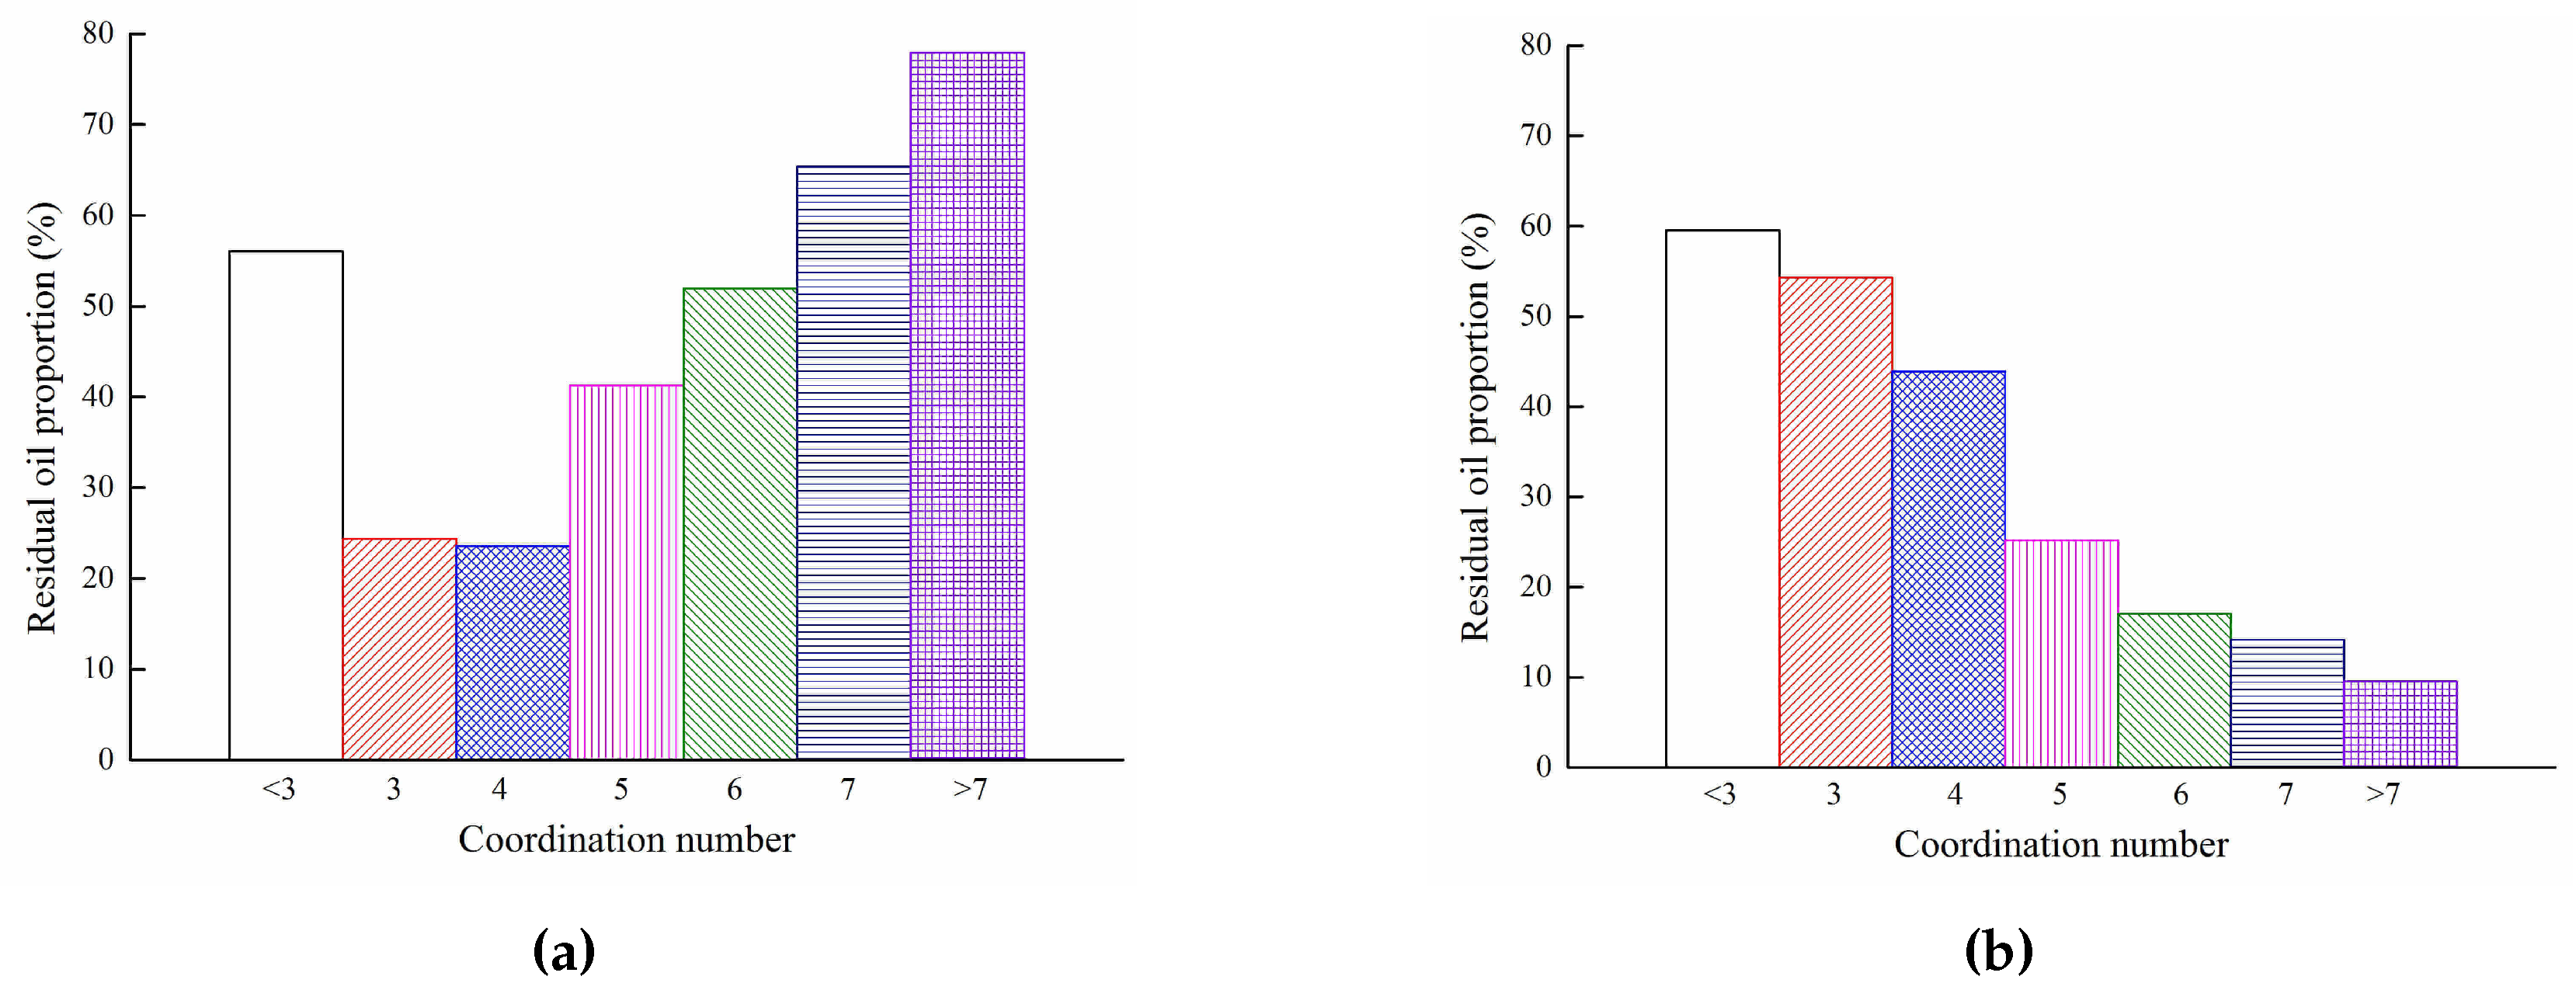
4.3.4. Coordination Number

The coordination number describes the degree of pore–throat connectivity. As seen from the statistical results Figure 14, the displacement efficiency—which had appropriate coordination numbers (this network model is 3–4)—was the highest in the water-wet reservoir. Water linked with the large coordination number easily had a “trap” effect on the oil. This result agreed with data from Zhao et al. [15], which reported large coordination number treated as fluid storage capacity rather than effective transport paths. However, in the case of small coordination number (the number of coordination numbers is less than 3), some pores which became dead-ends increase the probability of residual oil. In terms of oil-wet reservoir, with the increasing of coordination number, the probability of residual oil decreased.

5. Conclusions

In this paper, a new three-dimensional micro network model of an oil–water two-phase system with the solid–liquid interfacial effect was established. The network model can calculate the permeability and simulate an oil–water two-phase system in terms of real core structure. The characteristics of residual oil saturation in pores and throats can be quantitatively determined after simulation.
The relative permeability and residual oil distribution with and without van der Waals force in water-wet and oil-wet reservoirs were compared. On the one hand, oil recovery with and without van der Waals force were 57.07% and 59.48%, respectively, for water-wet reservoir, and the efficiency variation influenced by van der Waals force was 4.05%. Therefore, van der Waals force could not be ignored in the water-wet reservoir. For water-wet reservoirs, the residual oil distribution was significantly influenced by pore radius. On the other hand, oil recovery with and without van der Waals force was 69.59% and 70.27% for the oil-wet reservoir, and the efficiency variation influenced by van der Waals force was only 0.97%. Compared with the water-wet reservoir, the influence of van der Waals force was negligibly small in the oil-wet reservoir. Comparatively, the residual oil distribution was influenced by pore–throat size ratio in the oil-wet reservoir.

Acknowledgments

We sincerely thank for the financial support of the National Nature Science Foundation of China under Grant 11372033 add the Beijing Nova Program under Grant Z171100001117081.

Author Contributions

Weiyao Zhu proposed the topic and designed the methods; Bingbing Li, Yajing Liu and Hongqing song contributed collectively to the theoretical analysis, modeling, simulation; Xiaofeng Wang edited the manuscript. The whole author accepted and approved the final manuscript.

Conflicts of Interest

The authors declare no conflict of interest.

References

  1. Blunt, M.J. Flow in porous media-pore-network models and multiphase flow. Curr. Opin. Colloid Interface Sci. 2001, 6, 197–207. [Google Scholar] [CrossRef]
  2. Fatt, I. The network model of porous media. Pet. Trans. AIME 1956, 207, 144–159. [Google Scholar]
  3. Dullien, F.A.L.; Lai, F.S.Y.; Macdonald, I.F. Hydraulic continuity of residual wetting phase in porous media. J. Colloid Interface Sci. 1986, 109, 201–218. [Google Scholar] [CrossRef]
  4. Dullien, F.A.L.; Zarcone, C.; Macdonald, I.F.; Collins, A.; Bochard, R.D.E. The effects of surface roughness on the capillary pressure curves and the heights of capillary rise in glass bead packs. J. Colloid Interface Sci. 1989, 127, 362–372. [Google Scholar] [CrossRef]
  5. Aker, E.; MålØy, K.J.; Hansen, A.; Batrouni, G.G. A two-dimensional network simulator for two-phase flow in porous media. Transp. Porous Media 1989, 32, 163–186. [Google Scholar] [CrossRef]
  6. Ochi, J.; Vernoux, J.F. A two-dimensional network model to simulate permeability decrease under hydrodynamic effect of particle release and capture. Transp. Porous Media 1999, 37, 303–325. [Google Scholar] [CrossRef]
  7. Markicevic, B.; Bazylak, A.; Djilali, N. Determination of transport parameters for multiphase flow in porous gas diffusion electrodes using a capillary network model. J. Power Sources 2007, 171, 706–717. [Google Scholar] [CrossRef]
  8. Hu, X.T.; Yun, L. Study of microcosmic distribution of residual oil with stochastic simulation in networks. Acta Pet. Sin. 2000, 21, 46–51. [Google Scholar]
  9. Wang, J.X.; Wu, X.D.; PAN, X.W. The influence of aqueous phase trapping on gas flow by pore scale network model. Pet. Explor. Dev. 2003, 30, 113–115. [Google Scholar]
  10. Blunt, M.; King, P. Relative permeabilities from two-and three-dimensional pore-scale network modelling. Transp. Porous Media 1991, 6, 407–433. [Google Scholar] [CrossRef]
  11. Øren, P.E.; Bakke, S. Reconstruction of Berea sandstone and pore-scale modelling of wettability effects. J. Pet. Sci. Eng. 2003, 39, 177–199. [Google Scholar]
  12. Valvatne, P.H.; Blunt, M.J. Predictive pore-scale modeling of two-phase flow in mixed wet media. Water Resour. Res. 2004, 40, W07406. [Google Scholar] [CrossRef]
  13. Hou, J.; Li, Z.Q.; Guan, J.T.; Wang, K.W.; Chen, Y.M. Water flooding microscopic seepage mechanism research based on three-dimension network model. Chin. J. Theor. Appl. Mech. 2005, 37, 783–787. [Google Scholar]
  14. Yao, J.; Tao, J.; Aifen, L. Research on oil-water two-phase flow using 3D random network model. Acta Pet. Sin. 2007, 28, 94–101. [Google Scholar]
  15. Zhao, X.; Blunt, M.J.; Yao, J. Pore-scale modeling: Effects of wettability on waterflood oil recovery. J. Pet. Sci. Eng. 2010, 71, 169–178. [Google Scholar] [CrossRef]
  16. Ryazanov, A.V.; van Dijke, M.I.J.; Sorbie, K.S. Two-phase pore-network modelling: Existence of oil layers during water invasion. Transp. Porous Media 2009, 80, 79–99. [Google Scholar] [CrossRef]
  17. Bashtani, F.; Maini, B.; Kantzas, A. Single-phase and two-phase flow properties of mesaverde tight sandstone formation; random-network modeling approach. Adv. Water Resour. 2016, 94, 174–184. [Google Scholar] [CrossRef]
  18. Al-Dhahli, A.R.S.; Geiger, S.; van Dijke, M.I.J. Three-phase pore-network modeling for reservoirs with arbitrary wettability. SPE J. 2012, 18, 285–295. [Google Scholar] [CrossRef]
  19. Al-Dhahli, A.; van Dijke, M.I.J.; Geiger, S. Accurate modelling of pore-scale films and layers for three-phase flow processes in clastic and carbonate rocks with arbitrary wettability. Transp. Porous Media 2013, 98, 259–286. [Google Scholar] [CrossRef]
  20. Blunt, M.J.; Jackson, M.D.; Piri, M.; Valvatne, P.H. Detailed physics, predictive capabilities and macroscopic consequences for pore-network models of multiphase flow. Adv. Water Resour. 2002, 25, 1069–1089. [Google Scholar] [CrossRef]
  21. Piri, M.; Blunt, M.J. Three-dimensional mixed-wet random pore-scale network modeling of two-and three-phase flow in porous media. I. Model description. Phys. Rev. E 2005, 71, 026–301. [Google Scholar] [CrossRef] [PubMed]
  22. Sinha, P.K.; Wang, C.Y. Pore-network modeling of liquid water transport in gas diffusion layer of a polymer electrolyte fuel cell. Electrochim. Acta 2007, 52, 7936–7945. [Google Scholar] [CrossRef]
  23. Al-Kharusi, A.S.; Blunt, M.J. Multiphase flow predictions from carbonate pore space images using extracted network models. Water Resour. Res. 2008, 44, W06S01. [Google Scholar] [CrossRef]
  24. Raman, A.; van Dijke, M.I.J. Study of the Effects of Wettability Changes on Three-Phase Flow in Porous Media through Pore Network Modelling. In Proceedings of the Offshore Technology Conference Asia, Kuala Lumpur, Malaysia, 22–25 March 2016. [Google Scholar]
  25. Ren, L.; Qu, W.; Li, D. Interfacial electrokinetic effects on liquid flow in microchannels. Int. J. Heat Mass Transf. 2001, 44, 3125–3134. [Google Scholar] [CrossRef]
  26. Ren, C.L.; Li, D. Improved understanding of the effect of electrical double layer on pressure-driven flow in microchannels. Anal. Chim. Acta 2005, 531, 15–23. [Google Scholar] [CrossRef]
  27. Hsieh, S.S.; Lin, C.Y. Convective heat transfer in liquid microchannels with hydrophobic and hydrophilic surfaces. Int. J. Heat Mass Transf. 2009, 52, 260–270. [Google Scholar] [CrossRef]
  28. Jain, A.; Jensen, M.K. Analytical modeling of electrokinetic effects on flow and heat transfer in microchannels. Int. J. Heat Mass Transf. 2007, 50, 5161–5167. [Google Scholar] [CrossRef]
  29. Hwang, P.W.; Soong, C.Y. Investigation of variable-property microchannel flows with electro-thermo-hydrodynamic interactions at constant pressure gradient or constant flow rate. Int. J. Heat Mass Transf. 2008, 51, 210–223. [Google Scholar] [CrossRef]
  30. Li, Y.; Lei, Q.; Liu, X.G.; Xiao, H.M. Characteristics of micro scale nonlinear filtration. Pet. Explor. Dev. 2011, 38, 336–340. [Google Scholar]
  31. Pfahler, J.; Harley, J.; Bau, H.; Zemel, J. Liquid transport in micron and submicron channels. Sens. Actuators A Phys. 1990, 22, 431–434. [Google Scholar] [CrossRef]
  32. Gad-el-Hak, M. The fluid mechanics of microdevices-the Freeman scholar lecture. J. Fluids Eng. 1999, 121, 5–33. [Google Scholar] [CrossRef]
  33. Oliveira, R.S.; Andrade, J.S., Jr.; Andrade, R.F. Fluid flow through Apollonian packings. Phys. Rev. E 2010, 81, 047302. [Google Scholar] [CrossRef] [PubMed]
  34. Zeng, B.; Cheng, L.; Li, C. Low velocity non-linear flow in ultra-low permeability reservoir. J. Pet. Sci. Eng. 2011, 80, 1–6. [Google Scholar] [CrossRef]
  35. Mattia, D.; Calabrò, F. Explaining high flow rate of water in carbon nanotubes via solid-liquid molecular interactions. Microfluid. Nanofluid. 2012, 13, 125–130. [Google Scholar] [CrossRef] [Green Version]
  36. Frolov, A.I.; Kirchner, K.; Kirchner, T.; Fedorov, M.V. Molecular-scale insights into the mechanisms of ionic liquids interactions with carbon nanotubes. Faraday Discuss. 2012, 154, 235–247. [Google Scholar] [CrossRef] [PubMed]
  37. Li, T.; Song, H.; Wang, J.; Wang, Y.; Killough, J. An analytical method for modeling and analysis gas-water relative permeability in nanoscale pores with interfacial effects. Int. J. Coal Geol. 2016, 159, 71–81. [Google Scholar] [CrossRef]
  38. Zhang, X.L.; Zhu, W.Y.; Cai, Q.; Liu, Q.P.; Wang, X.F.; Lou, Y. Analysis of weakly compressible fluid flow in nano/micro-size circular tubes considering solid wall force. J. Univ. Sci. Technol. B 2014, 36, 569–575. [Google Scholar]
  39. Wang, X.F.; Zhu, W.Y.; Deng, Q.J.; Zhang, X.L.; Lou, Y.; Gao, Y. Micro Circular Tube Flow Mathematical Model with the Effect of Van der Waals Force; Trans Tech Publications: Zürich, Switzerland, 2014; Volume 448, pp. 3975–3981. [Google Scholar]
  40. Wang, X.F.; Zhu, W.Y.; Deng, Q.J.; Liu, Q.P.; Sui, X.G.; Lou, Y.; Gao, Y.; Zhang, X.L. Dynamic network model considering solid-liquid molecule interaction in porous media. J. Univ. Sci . Technol. B 2014, 36, 145–152. [Google Scholar]
  41. Ma, J.; Sanchez, J.P.; Wu, K.; Couples, G.D.; Jiang, Z. A pore network model for simulating non-ideal gas flow in micro-and nano-porous materials. Fuel 2014, 116, 498–508. [Google Scholar] [CrossRef]
  42. Deng, Q.J.; Zhu, W.Y.; Wang, X.F.; Sui, X.G.; Wang, X.J. Seepage model considering micro forces in porous media. J. Univ. Sci. Technol. B 2014, 36, 415–423. [Google Scholar]
  43. Kovscek, A.R.; Wong, H.; Radke, C.J. A pore-level scenario for the development of mixed wettability in oil reservoirs. AlChE J. 1993, 39, 1072–1085. [Google Scholar] [CrossRef]
  44. Fenwick, D.H.; Blunt, M.J. Network modeling of three-phase flow in porous media. SPE J. 1998, 3, 86–96. [Google Scholar] [CrossRef]
  45. Mason, G.; Morrow, N.R. Capillary behavior of a perfectly wetting liquid in irregular triangular tubes. J. Colloid Interface Sci. 1991, 141, 262–274. [Google Scholar] [CrossRef]
  46. Valvatne, P.H.; Piri, M.; Lopez, X.; Blunt, M.J. Predictive pore-scale modeling of single and multiphase flow. Transp. Porous Media 2005, 58, 23–41. [Google Scholar] [CrossRef]
  47. Øren, P.E.; Bakke, S.; Arntzen, O.J. Extending predictive capabilities to network models. SPE J. 1998, 3, 324–336. [Google Scholar]
  48. Lenormand, R.; Zarcone, C.; Sarr, A. Mechanisms of the displacement of one fluid by another in a network of capillary ducts. J. Fluid Mech. 1983, 135, 337–353. [Google Scholar] [CrossRef]
  49. Lerdahl, T.R.; Øren, P.E.; Bakke, S. A predictive network model for three-phase flow in porous media. In Proceedings of the 2000 SPE/DOE Improved Oil Recovery Symposium, Tulsa, Oklahoma, 3–5 April 2000. Paper SPE 59311. [Google Scholar]
  50. Geim, A.K.; Dubonos, S.V.; Grigorieva, I.V.; Novoselov, K.S.; Zhukov, A.A.; Shapoval, S.Y. Microfabricated adhesive mimicking gecko foot-hair. Nat. Mater. 2003, 2, 461–463. [Google Scholar] [CrossRef] [PubMed]
  51. Hou, J. Network modeling of residual oil displacement after polymer flooding. J. Petrol. Sci. Eng. 2007, 59, 321–332. [Google Scholar] [CrossRef]
  52. Gao, H.; Li, T.; Yang, L. Quantitative determination of pore and throat parameters in tight oil reservoir using constant rate mercury intrusion technique. J. Pet. Explor. Prod. Technol. 2016, 6, 309–318. [Google Scholar] [CrossRef]
Figure 1. Interaction between two types of molecules. (a) The same types; (b) Different types.
Energies 10 02059 g001
Figure 2. Long-range van der Waals force.
Energies 10 02059 g002
Figure 3. Three-dimensional pore network model.
Energies 10 02059 g003
Figure 4. Relative permeability curves in water-wet reservoir.
Energies 10 02059 g004
Figure 5. Comparison of residual oil distribution in water-wet reservoir. (a) With van der Waals force; (b) Without van der Waals force.
Energies 10 02059 g005
Figure 6. Contour maps of residual oil saturation in pores at X = 1 mm. (a) With van der Waals force; (b) Without van der Waals force.
Energies 10 02059 g006
Figure 7. Contour maps of residual oil saturation in pores at X = 2 mm. (a) With van der Waals force; (b) Without van der Waals force.
Energies 10 02059 g007
Figure 8. Contour maps of residual oil saturation in pores at Y = 1.5 mm. (a) With van der Waals force; (b) Without van der Waals force.
Energies 10 02059 g008
Figure 9. Relative permeability curves in oil-wet reservoir.
Energies 10 02059 g009
Figure 10. Comparison of residual oil distribution in an oil-wet reservoir. (a) With van der Waals force; (b) Without van der Waals force.
Energies 10 02059 g010
Figure 11. Effect of pore radius on residual oil distribution. (a) Water-wet reservoir; (b) Oil-wet reservoir.
Energies 10 02059 g011
Figure 12. Effect of pore–throat size ratio on residual oil distribution. (a) Water-wet reservoir; (b) Oil-wet reservoir.
Energies 10 02059 g012
Figure 13. Effect of shaping factor on residual oil distribution. (a) Water-wet reservoir; (b) Oil-wet reservoir.
Energies 10 02059 g013
Figure 14. Effect of coordination number on residual oil distribution. (a) Water-wet reservoir; (b) Oil-wet reservoir.
Energies 10 02059 g014
Table 1. Basic parameters for network simulation.
ParameterUnitValueParameterUnitValue
Network sizemm3 × 3 × 3Initial contact angle 0
Pore radius μ m3.6–73.5Water-wet contact angle 40–50
Throat radius μ m0.9–56.9Oil-wet contact angle 130–140
Throat length μ m0–78.94Oil–water interfacial tensionmN/m30
Average pore–throat ratio 2.06Oil densityg/cm30.88
Average coordination number 4.19Water densityg/cm31
Porosity%24Oil viscositymPa·s10
Absolute permeabilityD2.5Water viscositymPa·s1
Solid wall Hamaker constantJ3–50 × 10 20 Water Hamaker constantJ2 × 10 20

