1. Introduction
Lower energy use and reduced emissions of carbon dioxide are included in circular economy strategies (CES), as is re-use of raw materials currently handled as waste [
1]. Anaerobic digestion is a waste-to-energy (WTE) technology supporting CES, where biological waste is converted to bioenergy and biofertilizer [
2]. Nutrient recycling through organic fertilizers represents one step towards a circular economy as it turns waste management problems into economic opportunities. This also reduces dependence on imported phosphates [
1]. Natural phosphorous and nitrogen cycles are identified in the planetary boundary framework, with thresholds society needs to manage in a global sustainable approach [
3].
Environmental impact, and energy and nutrient recovery from horse manure, depends on collection practices, use of bedding material, manure storage and present manure usage [
4].
Horses are to a great extent kept in peri-urban areas, the transition zone between urban and rural areas, where horse activities, like riding schools, are accessible to users situated in urban areas. In these areas horse activities are perceived as being in conflict with existing agriculture and new residential areas [
5,
6]. High horse density (a large number of horses per hectare), in combination with horse manure stored and left in paddocks, increases the risk for contaminated surface run-off water [
7], and dung removal practices are recommended but reported to be lacking in some studies [
8,
9].
Horse manure is a mixture consisting of horse dung, used bedding and urine soaked in the bedding. In Sweden horse keepers mainly use softwood shavings as bedding material [
10]. Other studies mention straw, peat, hemp, and wood and straw pellets among bedding materials [
11,
12,
13]. Added bedding material can increase the amount of nutrients in collected and treated horse manure, indicated for both composted horse manure, where peat increased nitrogen and straw increased potassium [
12,
14], and in anaerobic digestion simulations [
15].
In general horse keepers in Sweden store horse manure on concrete slabs but approximately 25% of the horse keepers store horse manure on ground other than arable land [
10]. Storing of horse manure with softwood bedding involves minor leakage of nitrogen to water in a managed, fast-composting process [
16], while phosphorous has been found in run-off water to a greater extent from turned and static uncovered horse manure piles than from covered piles [
14].
In Sweden horse manure is used as a soil improver or fertilizer to a great extent [
10], but it is not commonly used for energy recovery, even if incineration and anaerobic digestion are mentioned in some studies [
17,
18,
19]. Anaerobic digestion can potentially reduce the net environmental impact of horse manure management if the produced biogas replaces fossil fuels in vehicles [
20]. Even if fossil fuels are used for transport and in the production process, a decrease of about 75% of greenhouse gases can be reached [
21,
22].
To enable energy recovery from horse manure by anaerobic digestion, transport of feedstock to a biogas plant is necessary. Transport is generally increasing and the EU aims to increase energy efficiency and use of renewables, and decarbonize the sector [
23]. How environmental impact from transport could be reduced is presented in a White Paper [
24] focusing on sustainable fuels and propulsion systems, and multimodal logistics using energy-efficient modes and systems. The expected net effect in the present case is that a limited use of transport can help achieve such goals through the production of renewable vehicle fuel from horse manure. Operational decisions like the type of truck used for transport, use of fuel, energy-efficient engines and strategic decisions about size and amount of shipments are among the logistical decisions linked to environmental impact [
25].
Potential factors of importance for horse manure as a biogas feedstock are feeding, indoor housing, outdoor keeping, manure storage, fertilization and transport. These factors, identified in a previous study, influence horse manure amounts and characteristics [
4]. Horse manure’s methane potential is lower than that of food waste, for example, especially when softwood is used as bedding material [
13]. A literature review by Hadin and Eriksson [
15] indicates a wide range for horse manure methane potential: 56 L CH
4/kg VS for pure horse manure with no bedding material and 277 L CH
4/kg VS for horse manure and straw bedding [
11,
26]. Many digesters use food waste as a substrate, where the methane potential can range between 178 and 531 m
3 CH
4/tonne VS [
27,
28]. Concerns about the moderate methane potential motivate this case study of anaerobic digestion, including the environmental and economic aspects of transport of horse manure. This study is based on site-specific data and adds a systems perspective on environmental and economic impact from collection of horse manure at horse keepers’ sites, not previously studied [
20]. This is also complementary to previously published research that discusses parts of the system, e.g., horse manure management, or biogas from horse manure, or transport systems [
13,
26,
29,
30,
31]. In a systems perspective it is important that the benefits of anaerobic digestion are greater than the additional burden related to collection and transport.
The aim of the present case study was to describe a specific case of horse manure management practices and compare unmanaged composting with anaerobic digestion from an environmental and economic perspective. The objectives were to:
Describe horse keepers’ current horse manure management practices (on site collection, storage and utilization) in a Swedish municipality and provide quantitative and qualitative data for a combined assessment.
Calculate the potential environmental impact of combined energy recovery and nutrient recycling through anaerobic digestion in a centralized plant, replacing unmanaged composting.
Explore economic consequences for horse keepers from a changed treatment.
Discuss how current manure management practice influence an altered treatment in relation to environmental impact and associated costs.
3. Results
The case consists of information from 81 horse-keeping sites (also referred to as horse facilities) located in the Swedish case municipality. These represent 623 horses in total, where 84% of keepers were in possession of ≤10 horses (
Table 4). Statistics for Sweden (with high standard errors) estimate the number of horses in the actual county of 10 municipalities to be 11,700, with 51% located in urban areas and adjoining rural areas. In Sweden the average number of horses per site is 4.6 [
44]. The total number of horses in the case municipality is hard to estimate based on available statistics, but is probably several times larger than the number covered in this study.
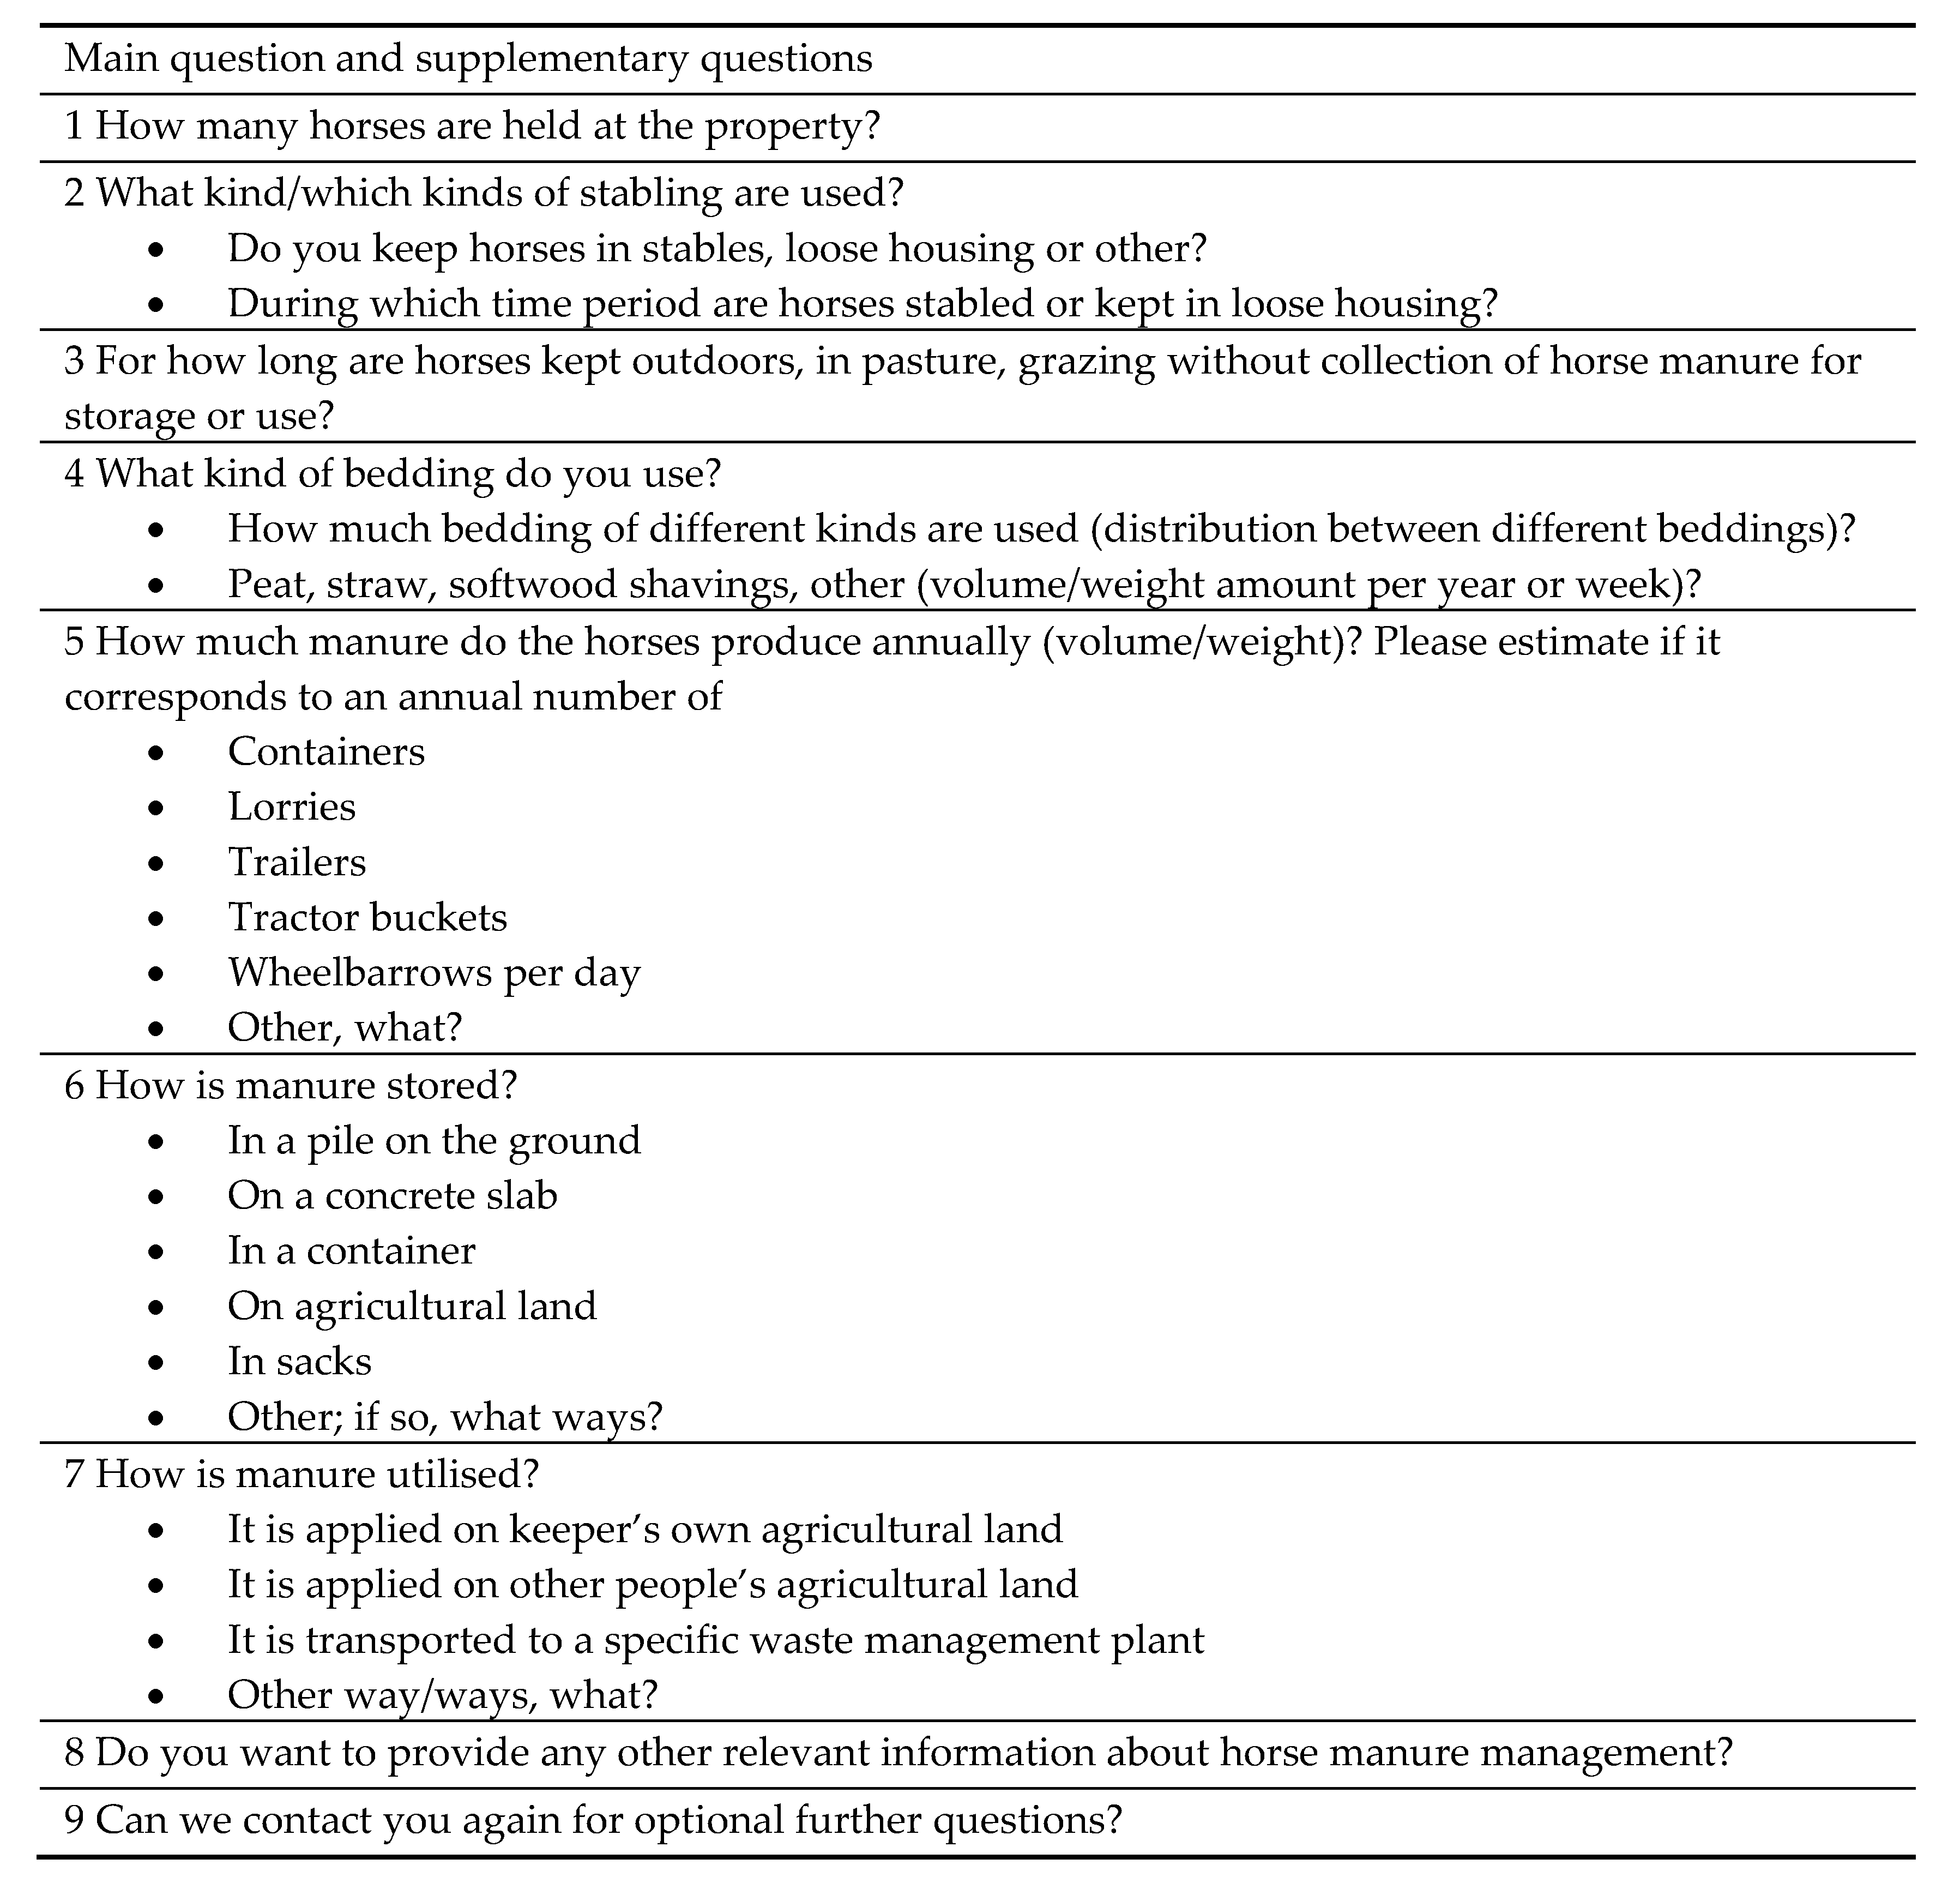
Data from the questionnaire, related to manure management practices, were compiled in four groups based on the number of horses per respondent (1–2, 3–5, 6–10, and 11–90 horses). The groups’ setup, i.e., the intervals for the number of horses kept at the sites, show similarities with the Swedish legislation about manure storage—Swedish Ordinance (1998:915) on environmental considerations in agriculture [
45]—estimated statistics in Sweden [
10] and groups in a case study performed in New Jersey [
46].
3.1. Horse Manure Management Practices
3.1.1. On-Site Manure Collection
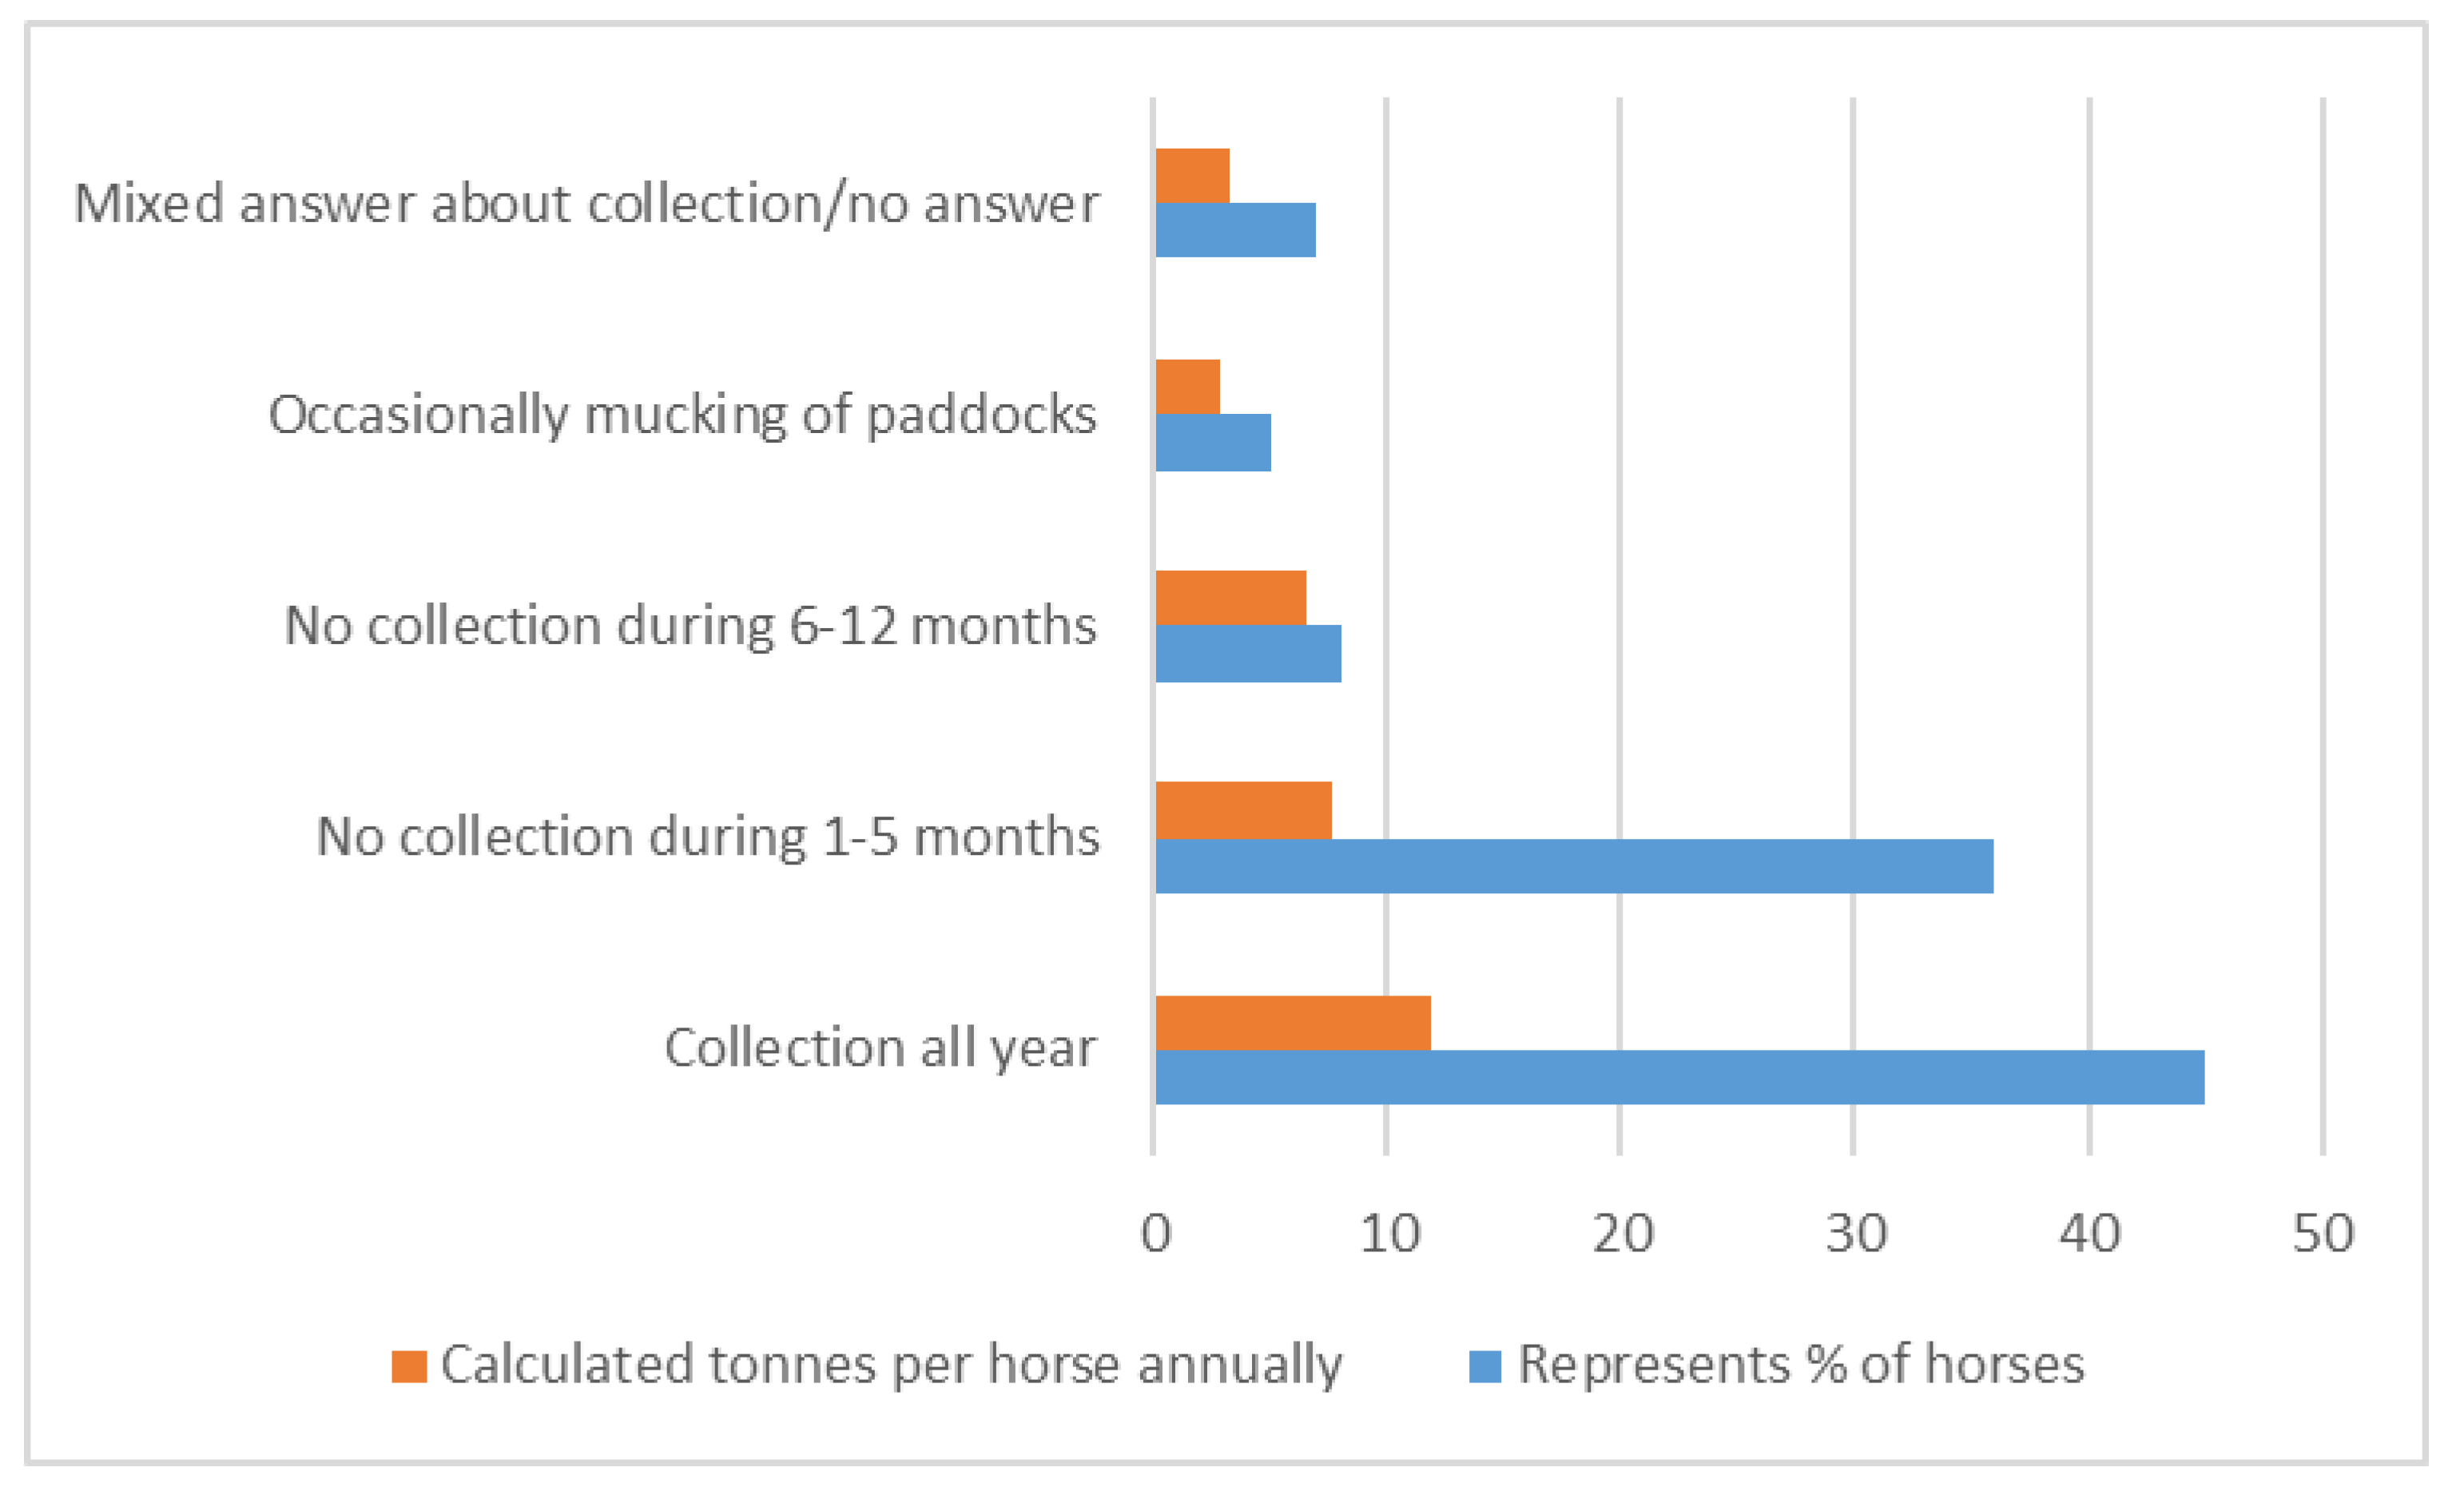
The type of housing affects the possibility of collecting horse manure and the amount of bedding. Most horse keepers in this study (69%) keep horses in stables, 15% use loose housing in combination with stables, and 15% use loose housing exclusively. One horse keeper (1%) uses paddocks to a great extent. The amount of manure collected was derived from the estimated (by the horse keepers) amount and calculated (by the authors); the range was between 2 tonnes per horse and year for loose housing, while for horses held in stables the estimated output is an average of 11 tonnes per horse and year. This difference is explained by (1) interpretation of horse keepers’ information on collected manure amount and (2) the fact that manure collection is easier and more often performed when horses are kept stabled. Results on mucking regime are displayed in
Figure 2.
Figure 2 shows the percentage of horses in the case grouped into various time periods where horses are kept outside grazing/in pastures without collection of horse manure and calculations of corresponding total horse manure amount per horse and year. The results are compiled from 67 horse keepers with 502 horses. The annual amount of collected horse manure from the respondents was calculated to 3–12 tonnes per horse and year. Results indicate that most horse manure is collected year-round or most of the year, representing 74% of the total horse manure amount (
Figure 2). Occasional mucking outdoors is performed for 6% of the horses, while 7% of the horses are kept by horse keepers that do not muck outdoors for 6–12 months. A mix of collection/no answer represent four of these horse keepers and 51 horses.
3.1.2. Bedding Material
Table 5 depicts the use of different bedding materials in the case study. Calculated amounts of bedding indicate softwood to be the most common bedding, closely followed by peat and mixed bedding types. Different types of pellets are rarely used (called “other” in
Table 5).
Horse manure with softwood bedding adds up to 11 tonnes per horse and year, in comparison to 3 tonnes for a bedding mix (
Table 5). The results should be interpreted to reflect the collected amount of horse manure (manure and used bedding), as opposed to the generated amount. The difference is related to the mucking regime and the separation ability of used bedding, fresh bedding and manure.
3.1.3. Manure Storage
Horse manure storage is characterized by facility designs for stockpiling on impervious surfaces like concrete storage slabs, containers or, for one respondent, storage in sacks. These storing facilities represent 78% of the horses and 73% of the horse keepers in the case (
Table 6). There are 13 horse keepers in the case assigning manure stockpiling on site on ground, representing 16% of the horse keepers. Horse keepers with few horses most frequently use stockpiling on the ground, while only one horse keeper with 25 horses stores manure directly on the ground (
Table 6).
3.1.4. Disposal of Composted Manure
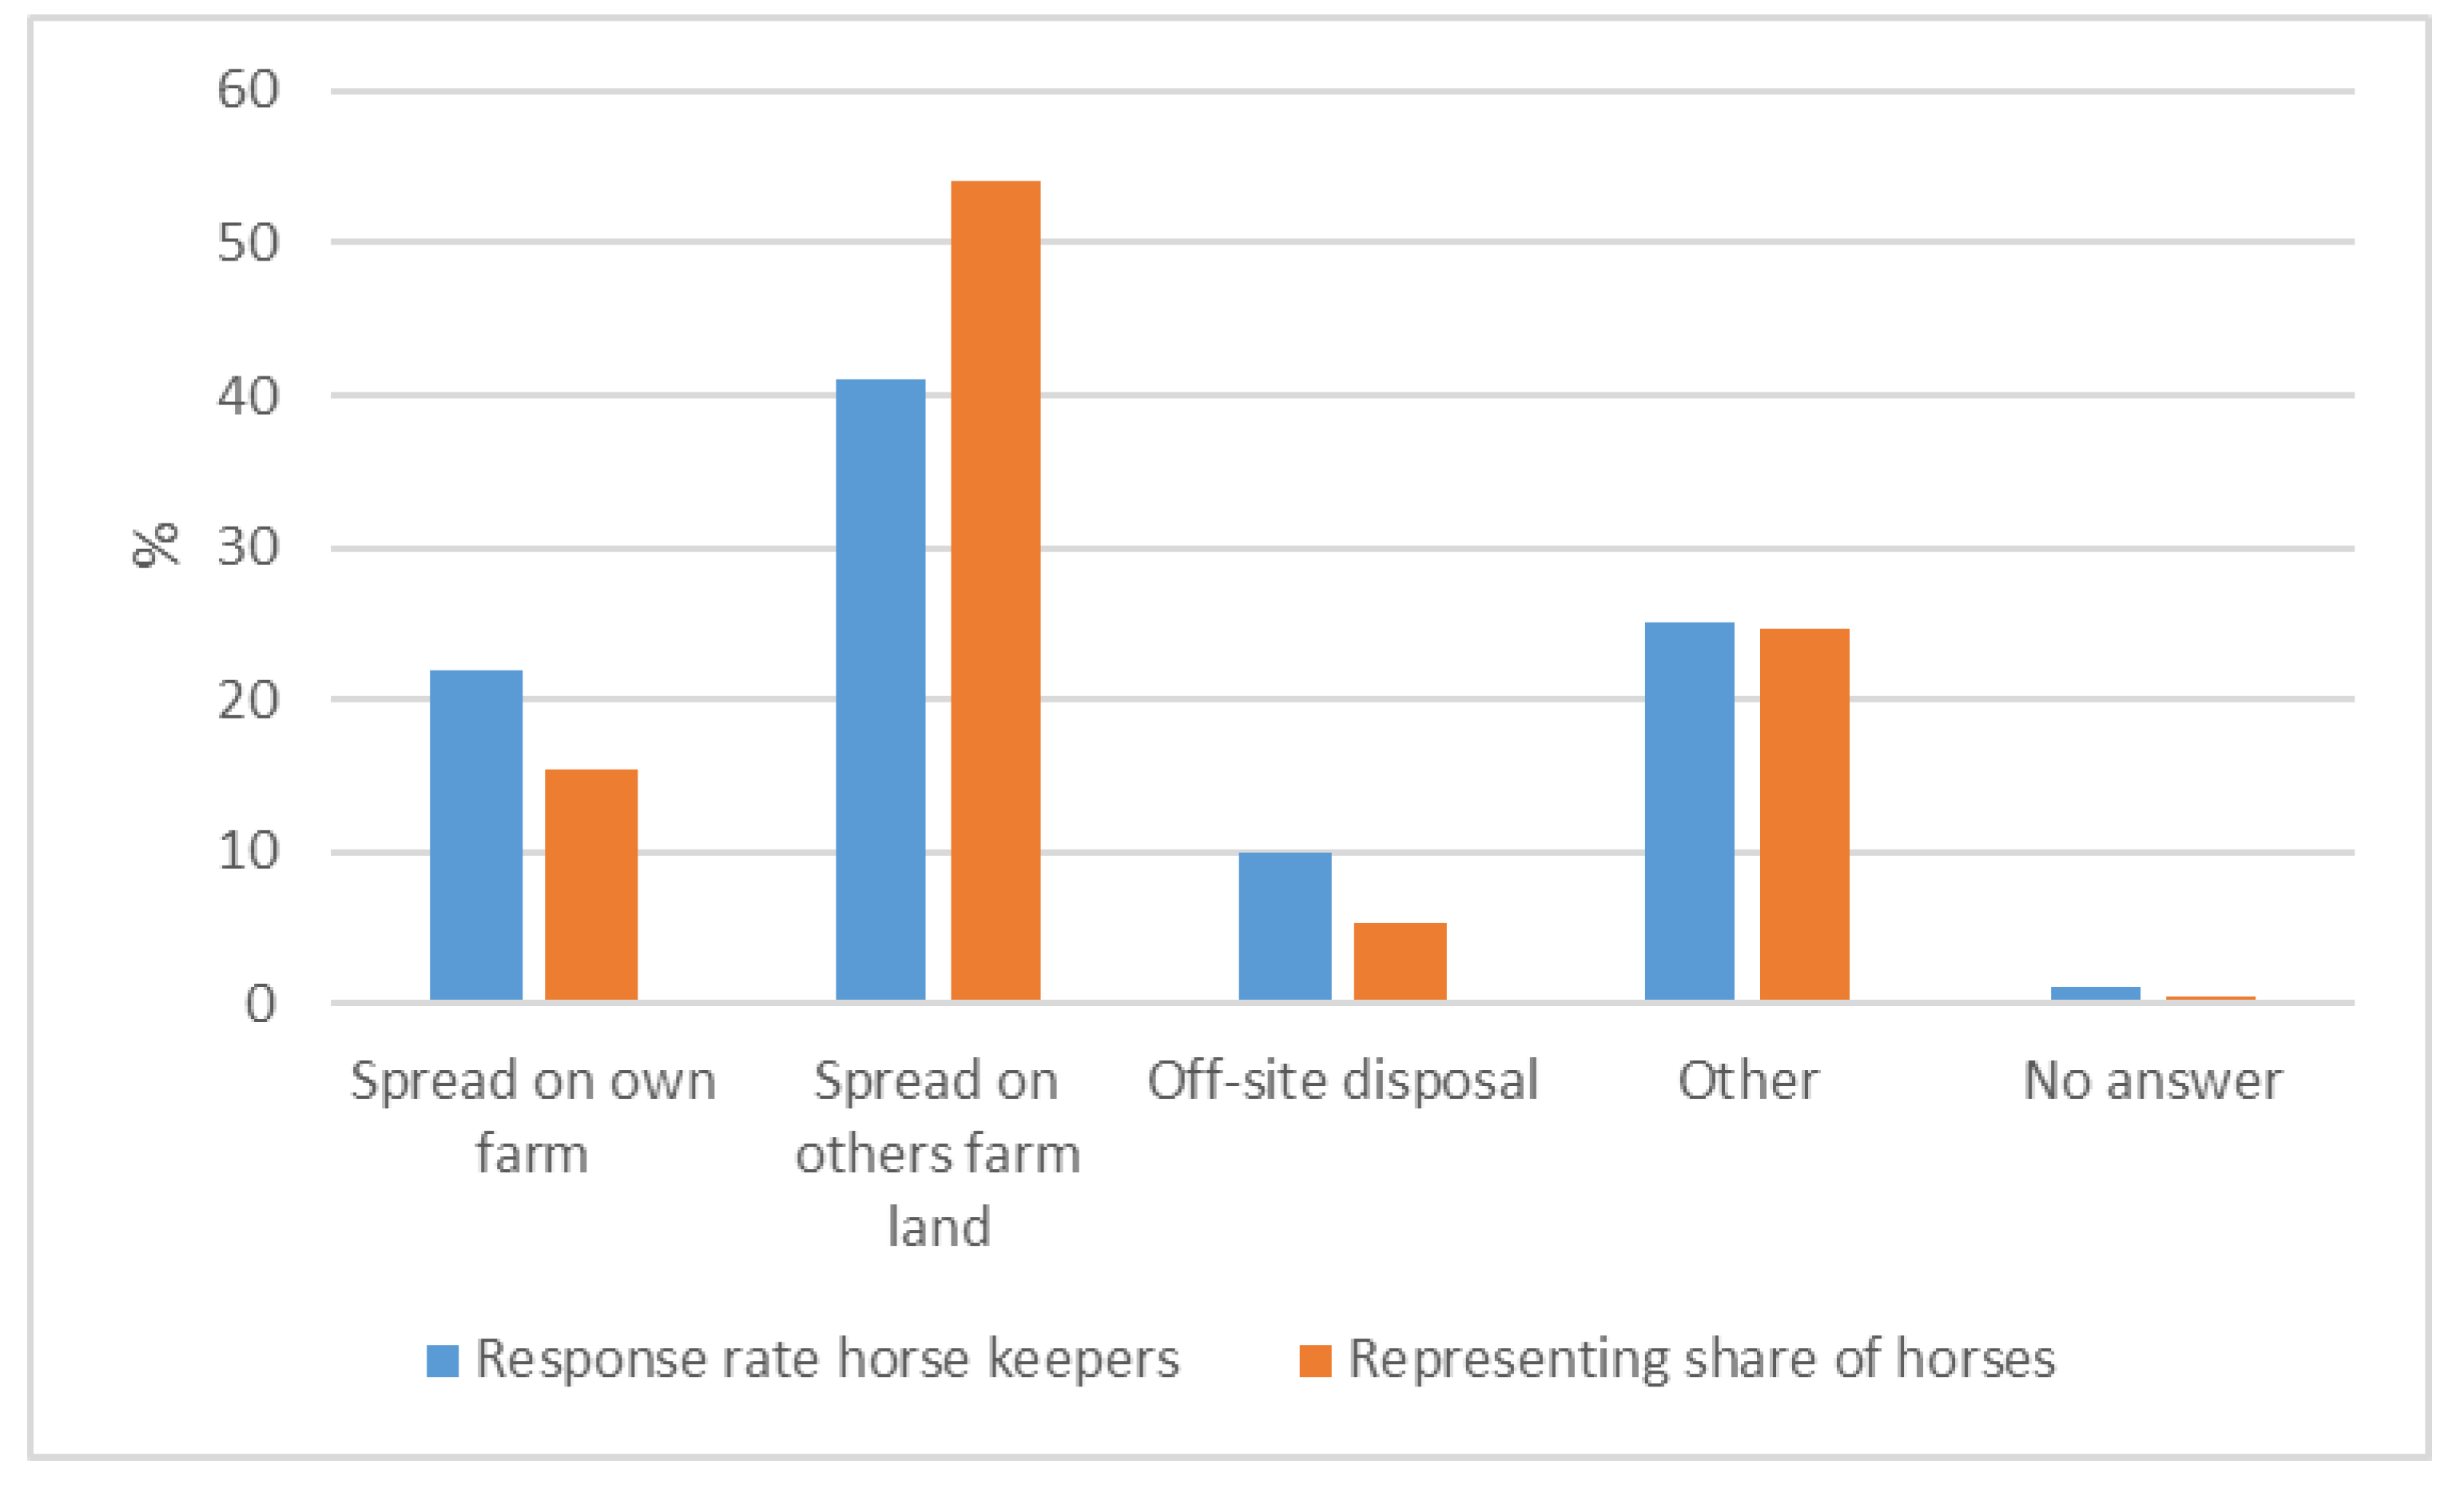
About 40% of horse keepers responded that the composted manure is subject to soil application on other people’s agricultural land (
Figure 3). Other management practices are, for example, soil production or unknown destiny. About 20% of the respondents report application on the horse keeper’s own agricultural land (
Figure 2). Manure disposal at an off-site disposal plant (hauling to a specific waste deposit plant) is reported by about 10% of the respondents. One horse keeper did not answer, representing three horses.
The results in
Figure 3 have also been analyzed in relation to the size of the horse facility, i.e., intervals of the number of horses held, cf.
Table 7. Soil application on other people’s agricultural land is frequent for all intervals (
Table 7). One exception occurs in the horse keeper group with 6–10 horses, where other use (soil production and unknown use) is more common (60%). In the group with 1–2 horses, soil application is as common on own arable land as on other people’s arable land.
3.2. Environmental Impact
3.2.1. Relative Impact from Transport
The relative impact from transport of horse manure to and biofertilizer from the biogas plant is shown in
Table 9.
Transport’s relative contribution to acidification and eutrophication potential was minor, while transport’s contribution to CED was considerable. For GWP the relative impact exceeds 100% due to the system total accounting of arable land as a sink for carbon in digestate not being degraded after a 100-year period (
Table 9).
3.2.2. Overall Results
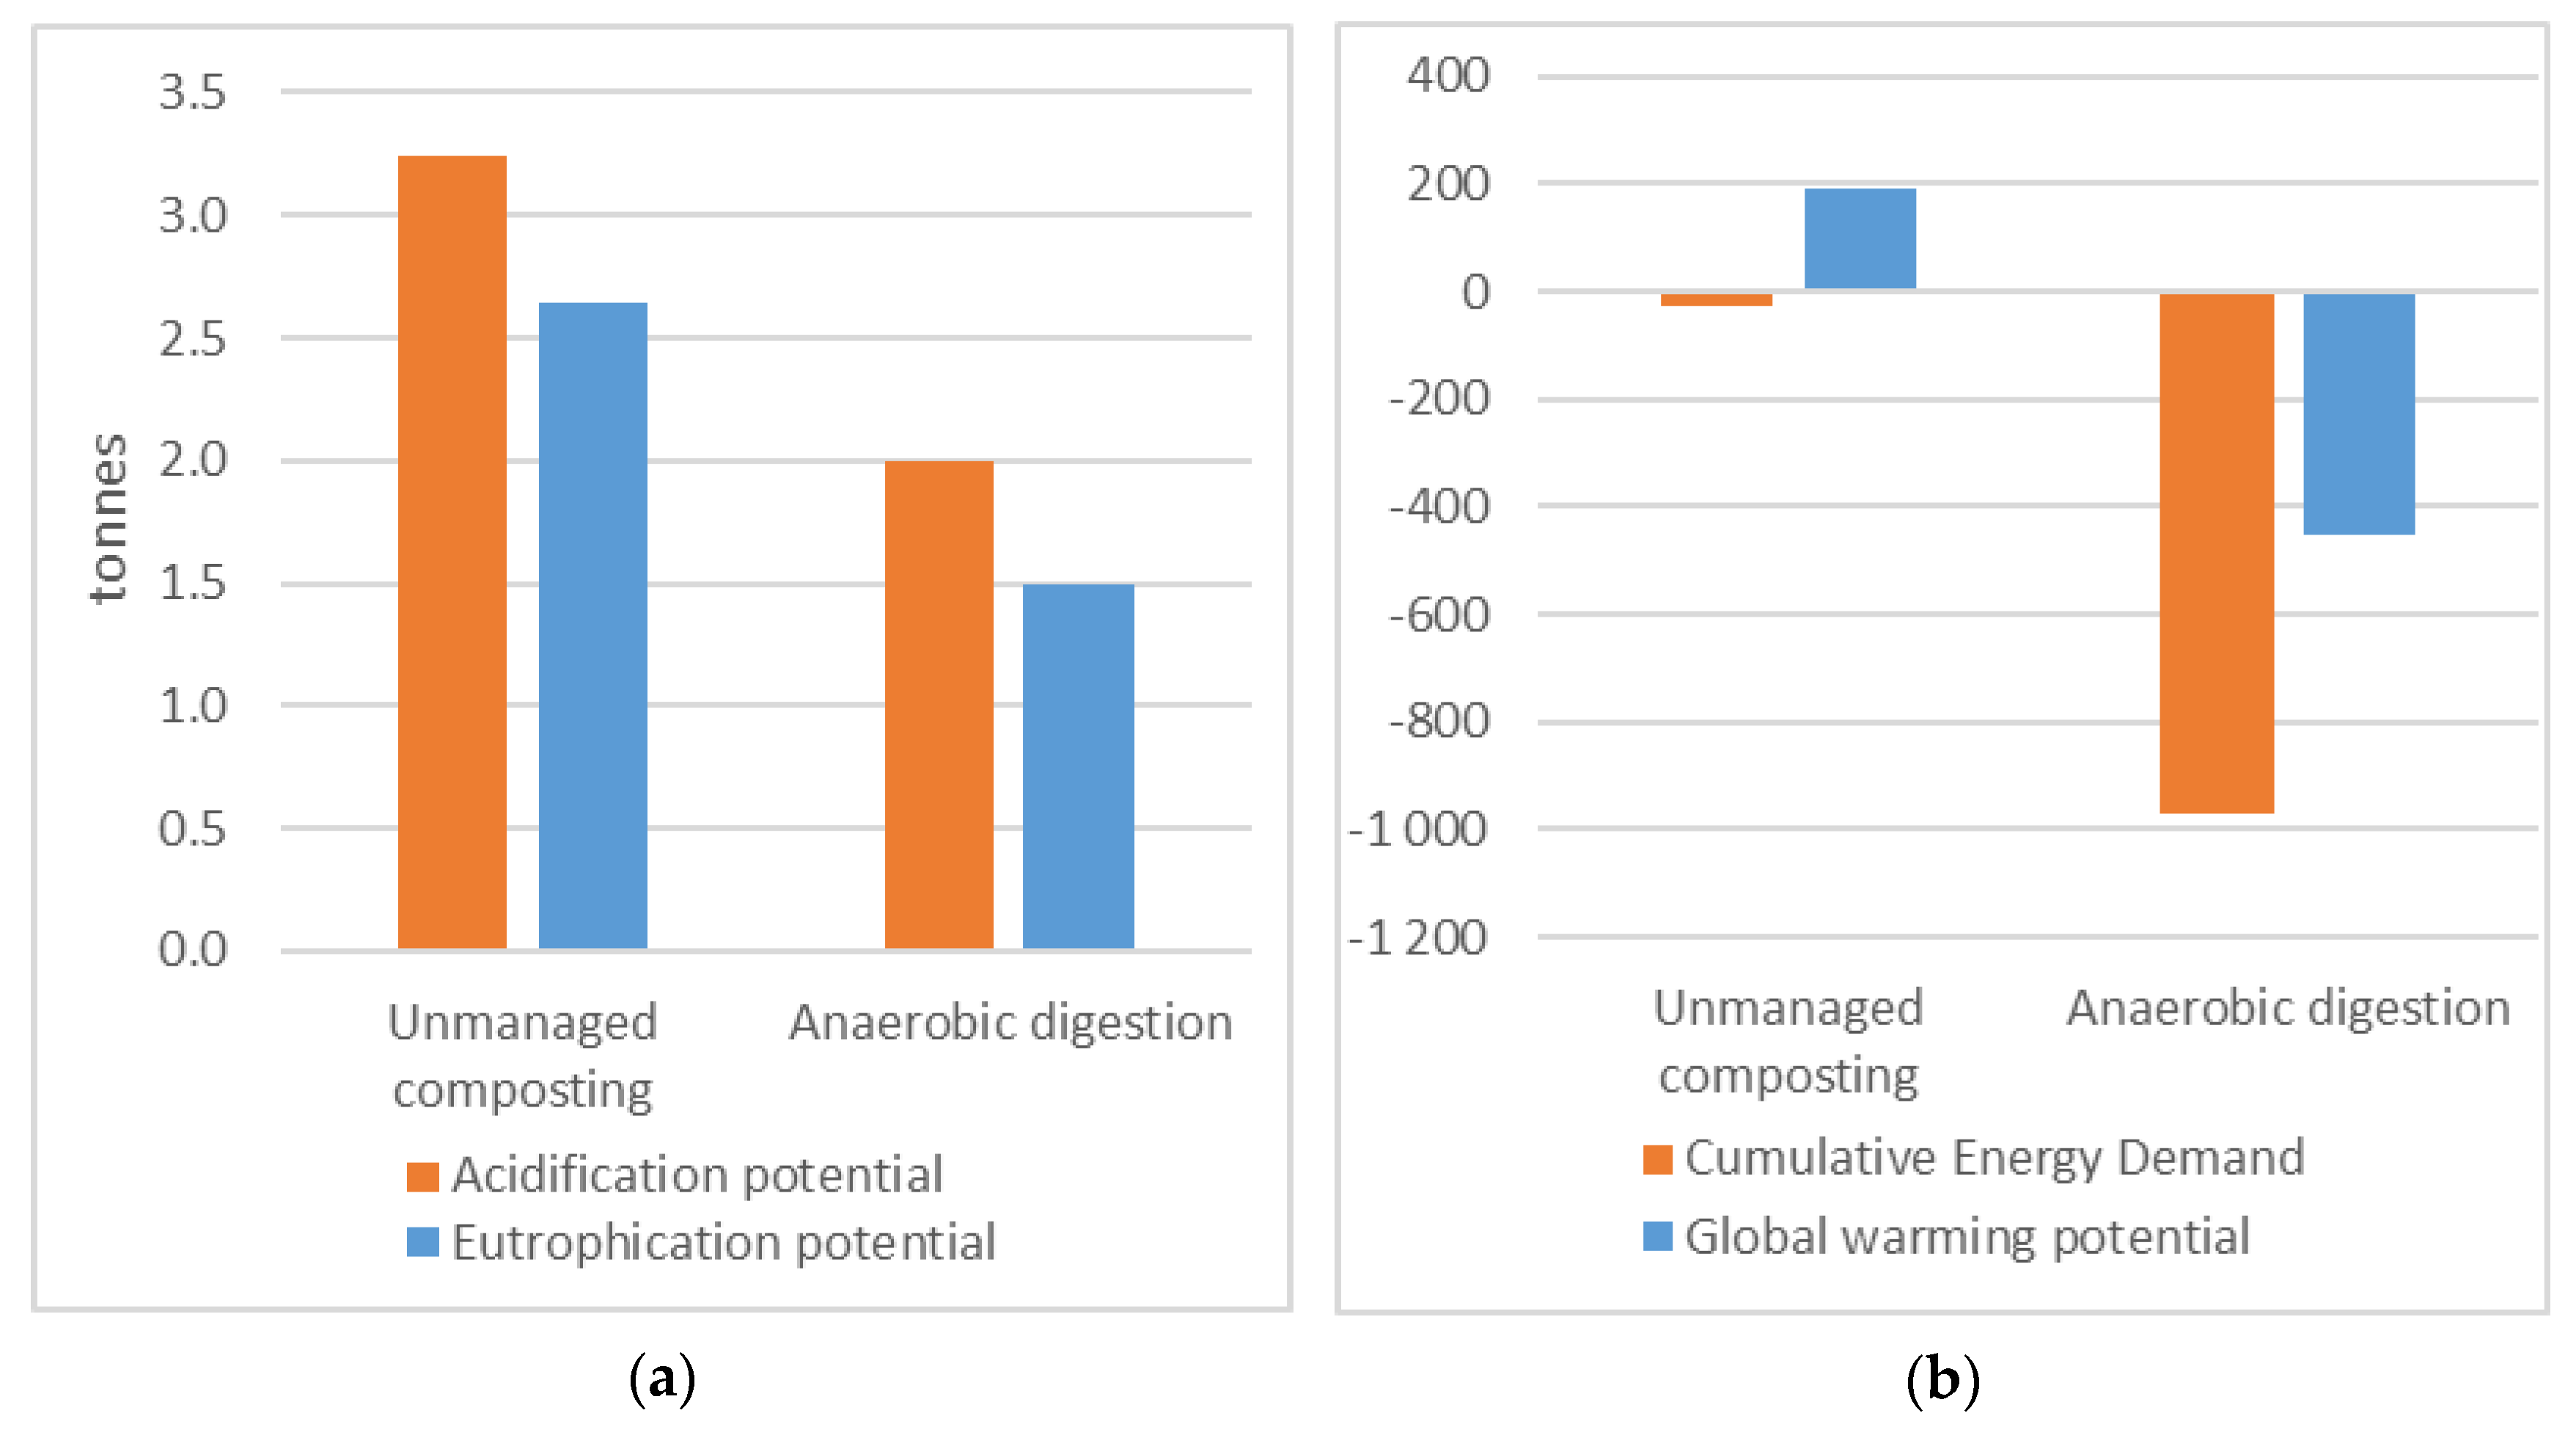
The environmental impacts for the two scenarios are summarized in
Figure 4. Compared to unmanaged composting, anaerobic digestion results in lower environmental impact for all impact categories considered. In particular, GWP and CED are significantly lower for anaerobic digestion, resulting in net negative impact mainly due to avoided emissions when biogas substitutes for diesel in buses. In unmanaged composting horse manure decomposes in piles and is partly utilized as biofertilizer, and plant nutrients can to a higher degree be lost by surface run-off and as emissions to air, indicated a higher potential environmental impact from the compost process compared to the anaerobic digestion process.
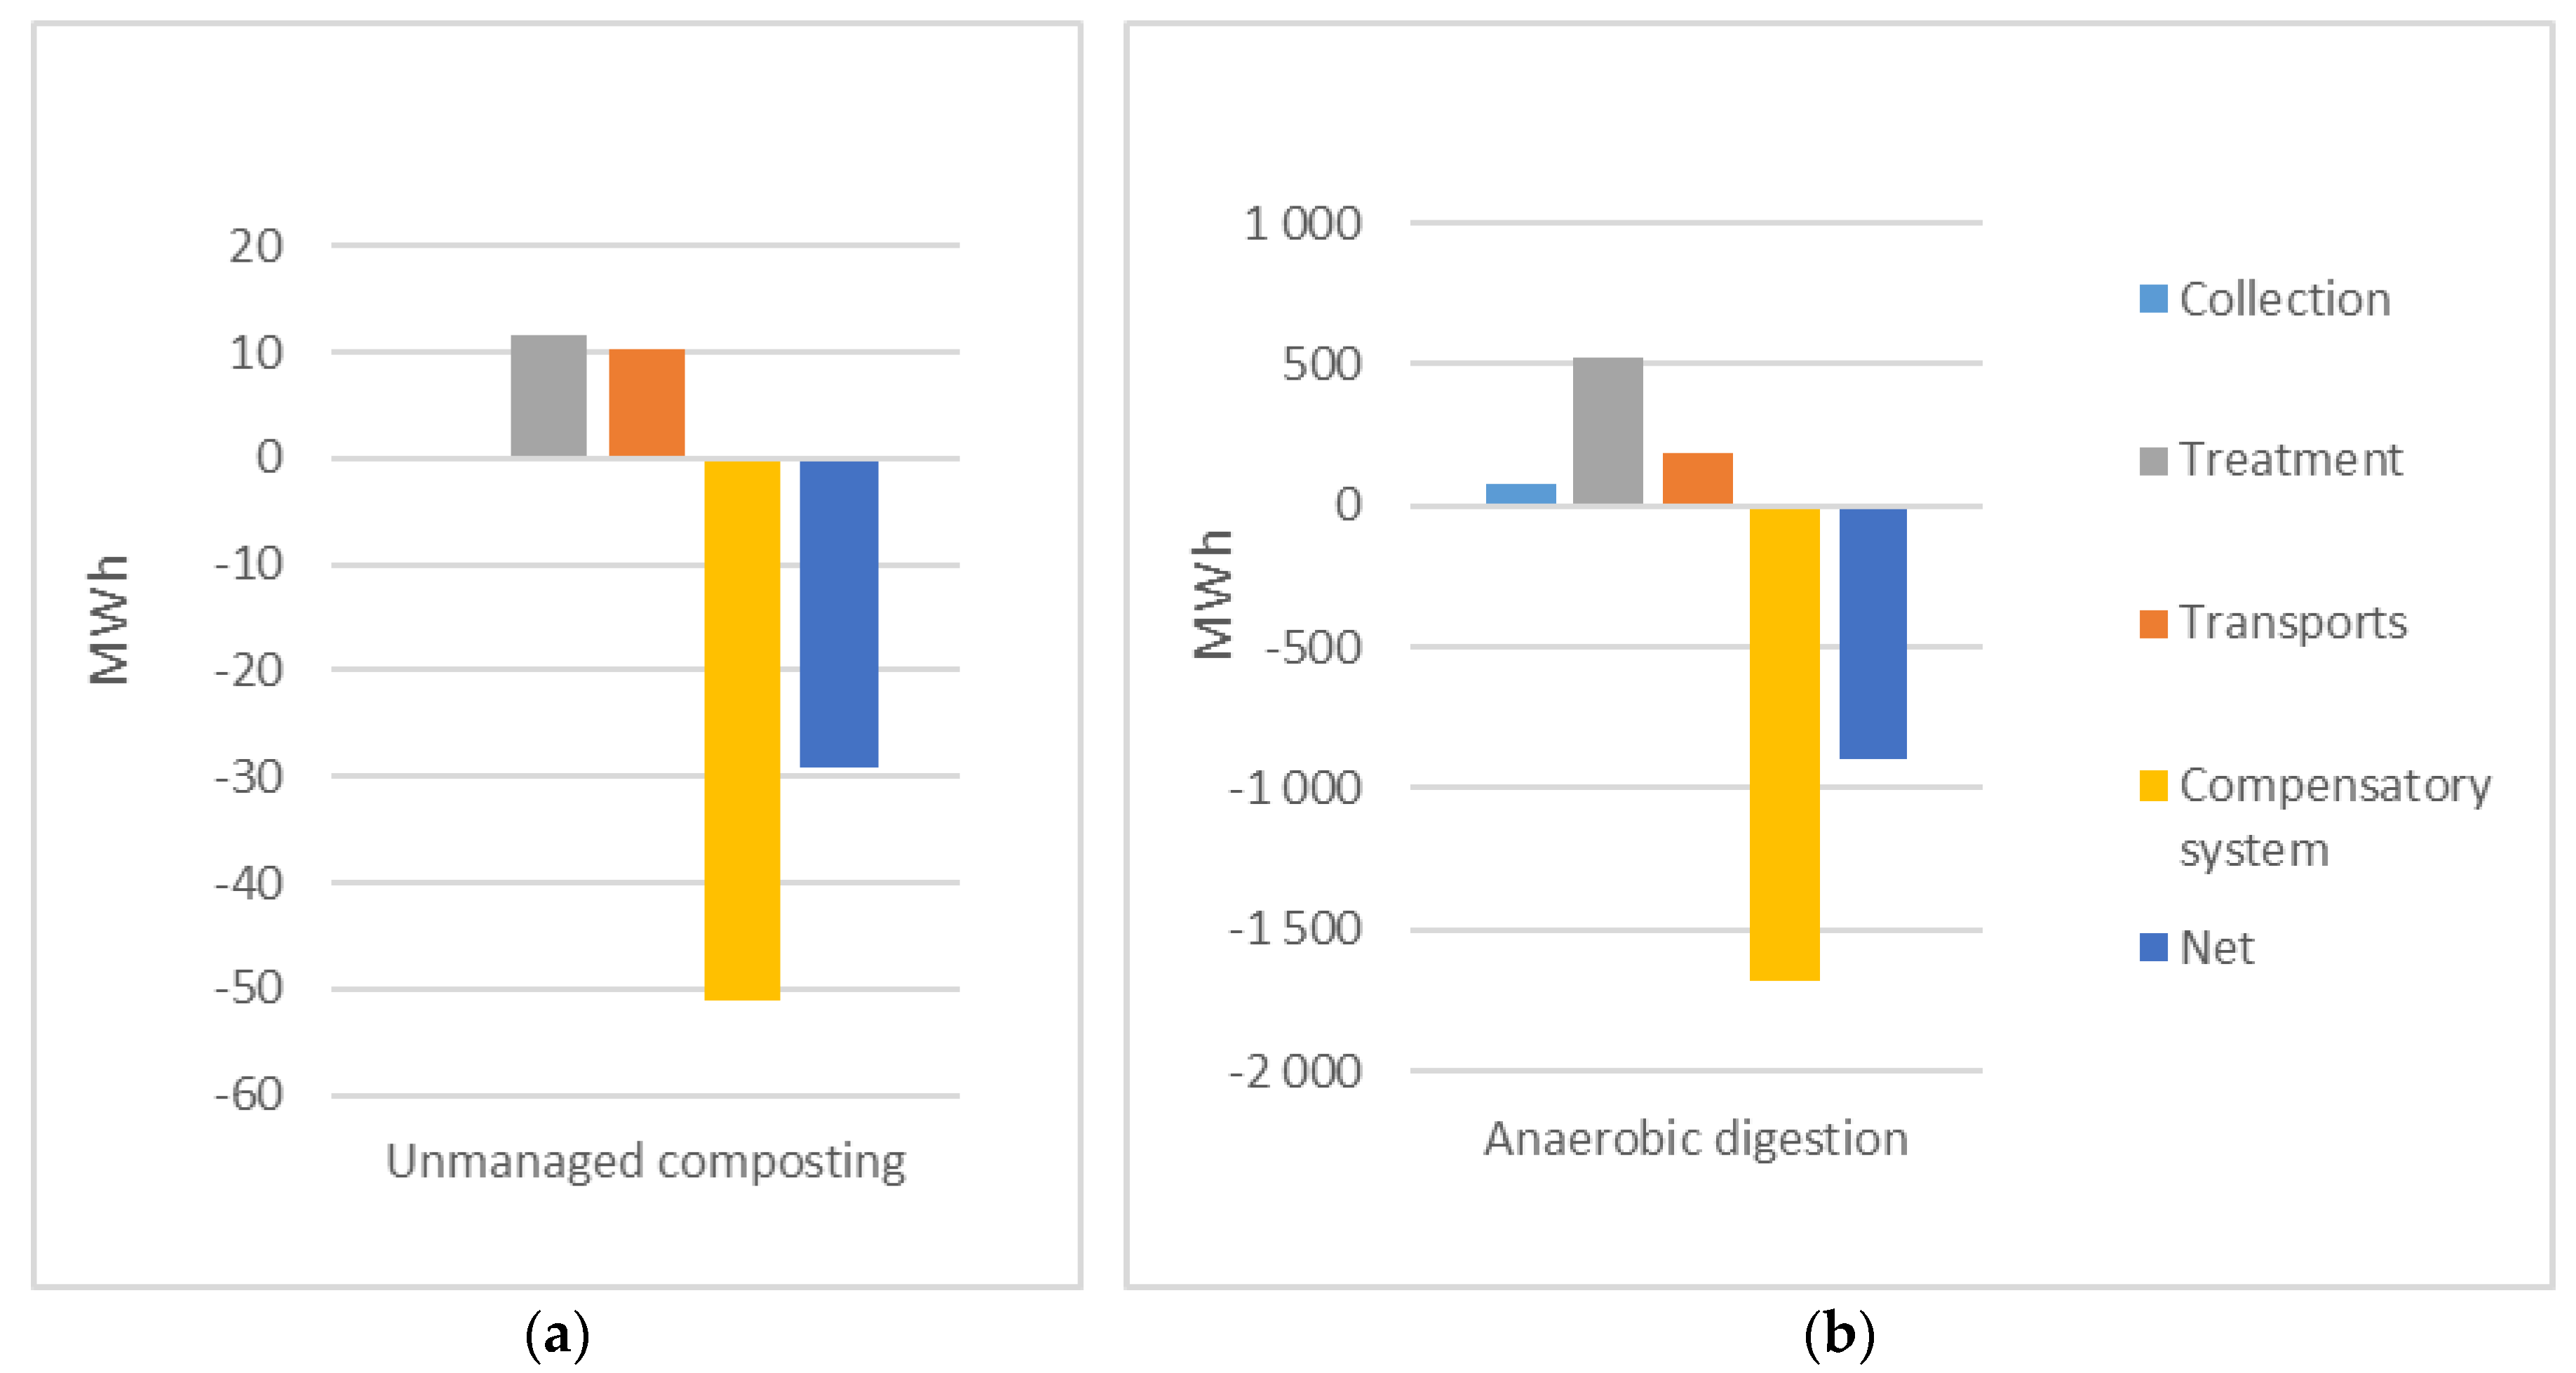
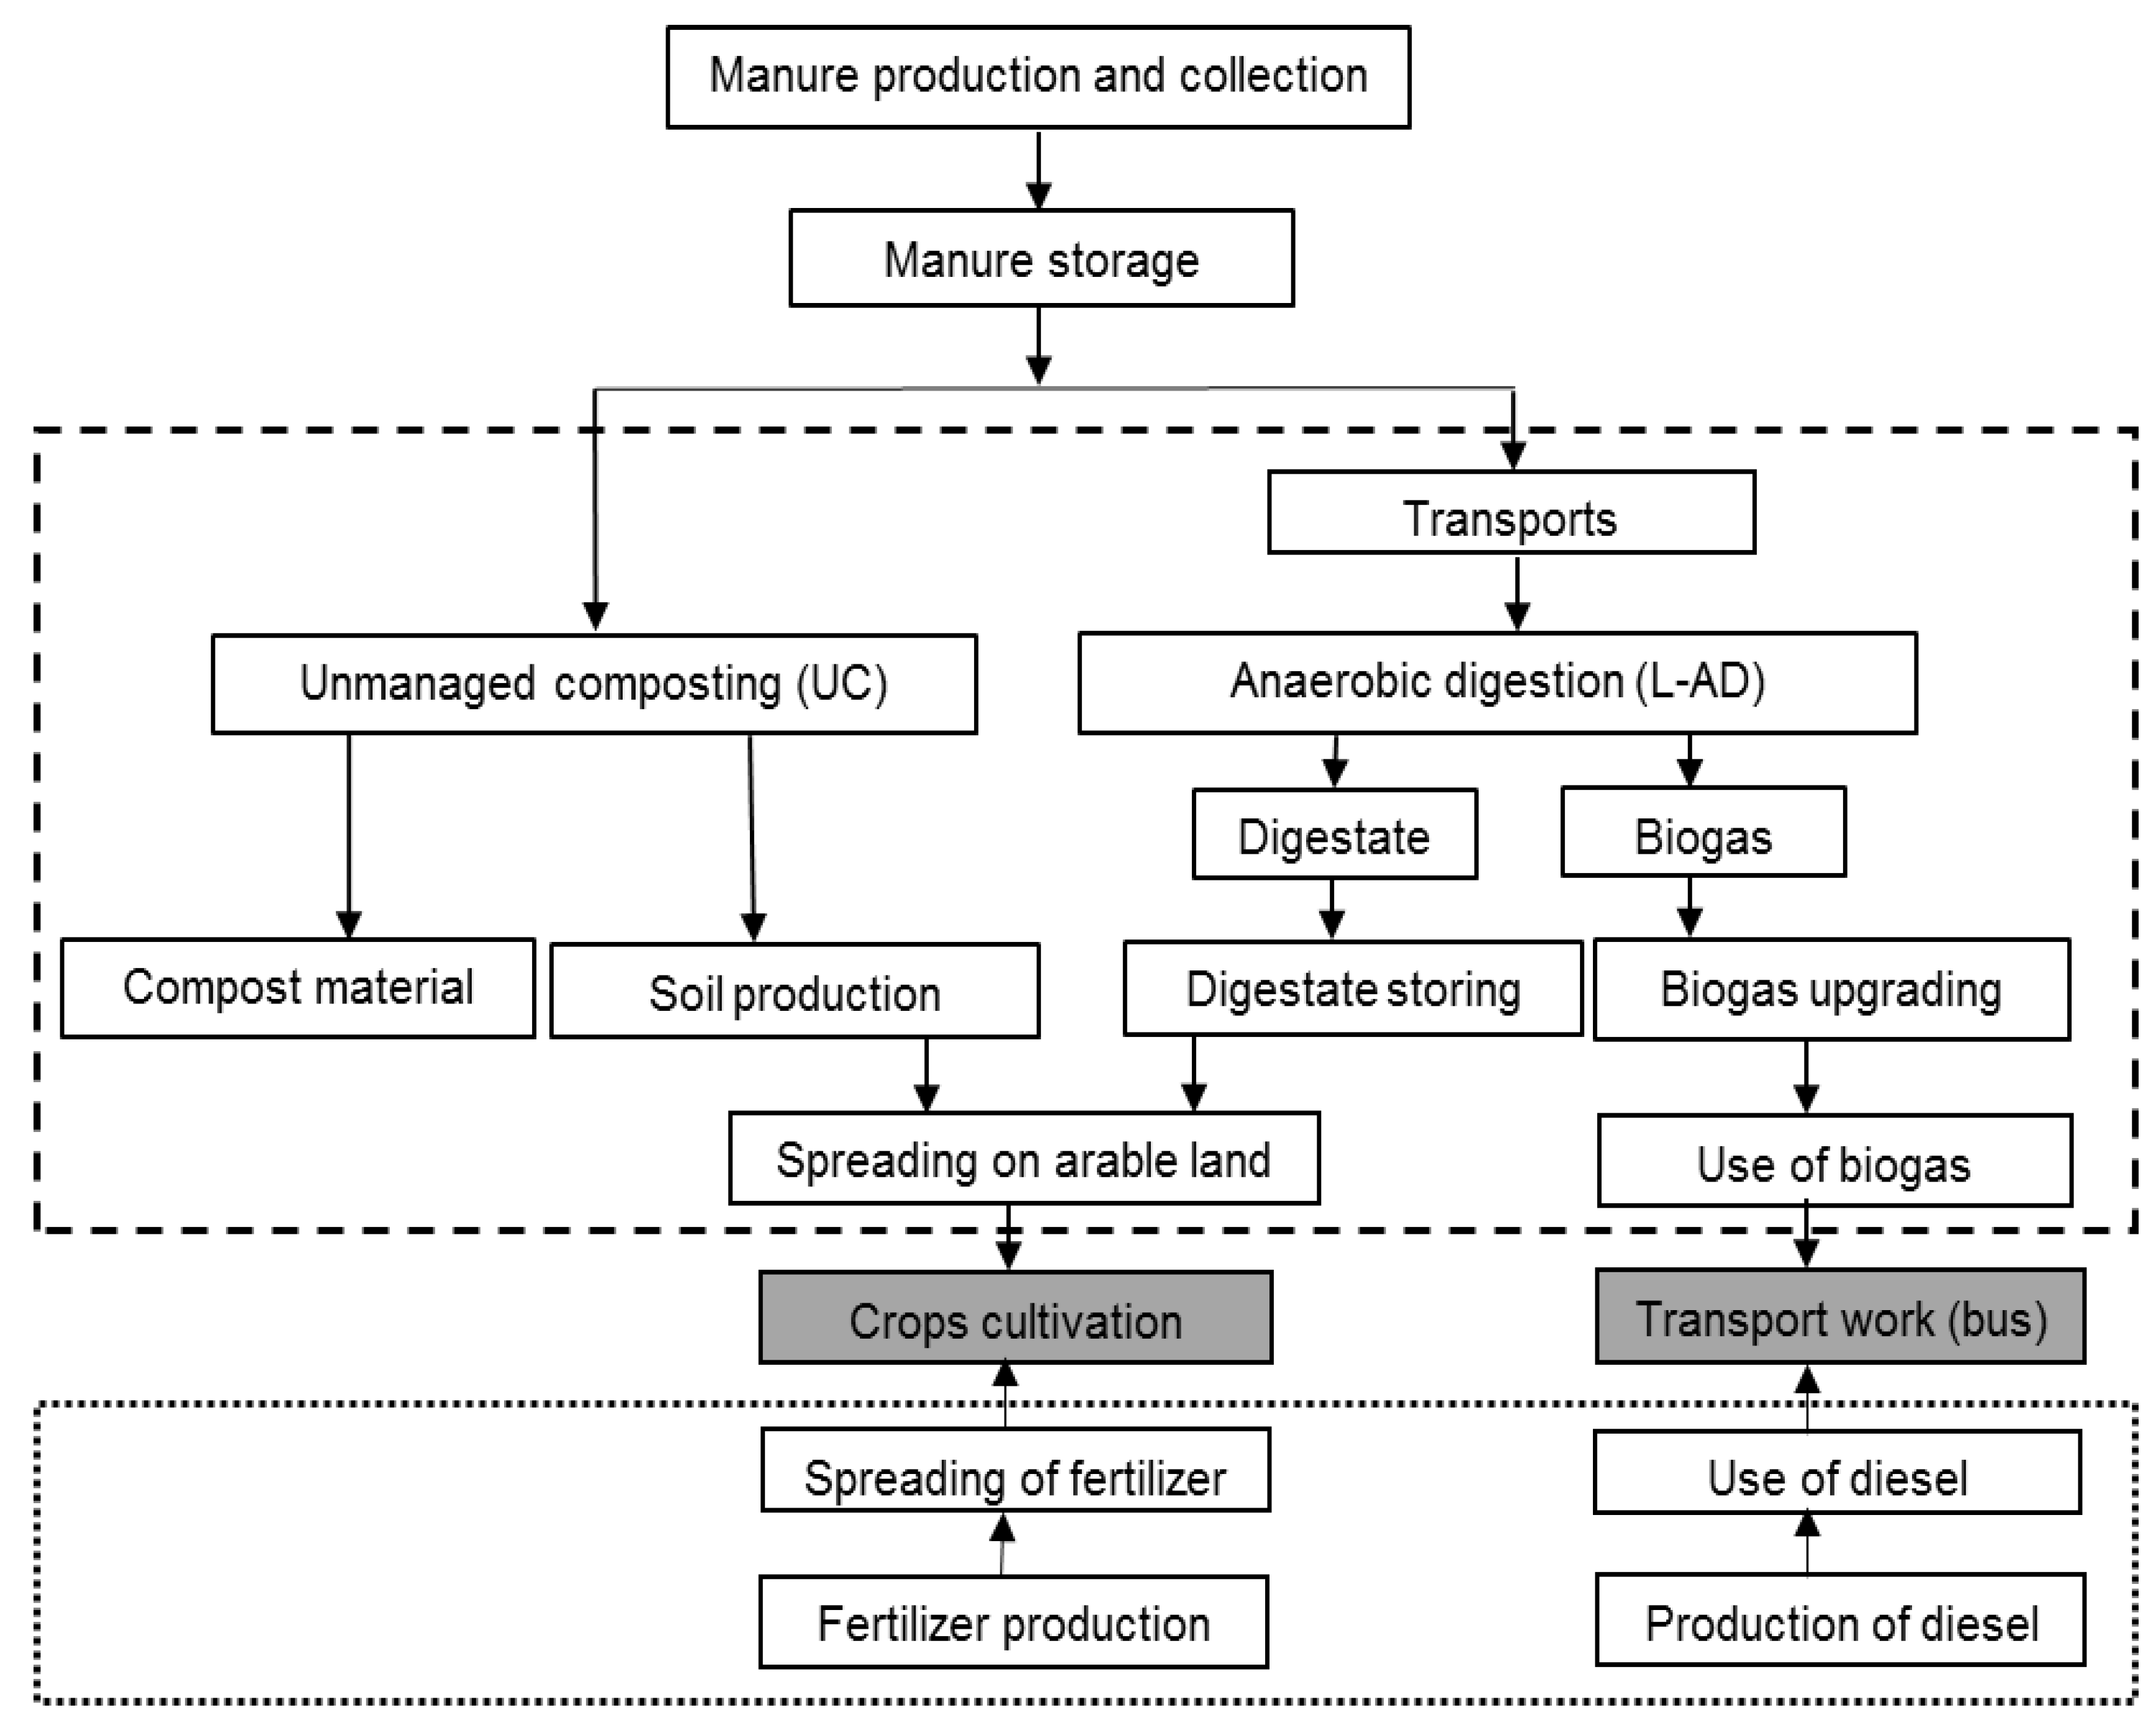
The subsequent figures have been included to understand the underlying explanations of the results. In
Figure 5,
Figure 6,
Figure 7 and
Figure 8 the core system (waste management) is comprised of manure collection (present in Scenario 2), treatment (composting or anaerobic digestion including field application of organic fertilizer) and transport (vehicle gas from upgrading facility to filling station, digestate from anaerobic digestion plant (AD) to spreading area). The compensatory system consists of the avoided conventional production of chemical fertilizer and diesel fuel.
The trend in CED (
Figure 5) is similar for the two scenarios, but the magnitudes are much higher for anaerobic digestion. The sum of collection and transport in Scenario 2 vastly exceeds the total values for the composting scenario, but as savings from using fertilizer and vehicle fuel are even higher, the anaerobic digestion scenario indicates the largest savings (a factor of 30).
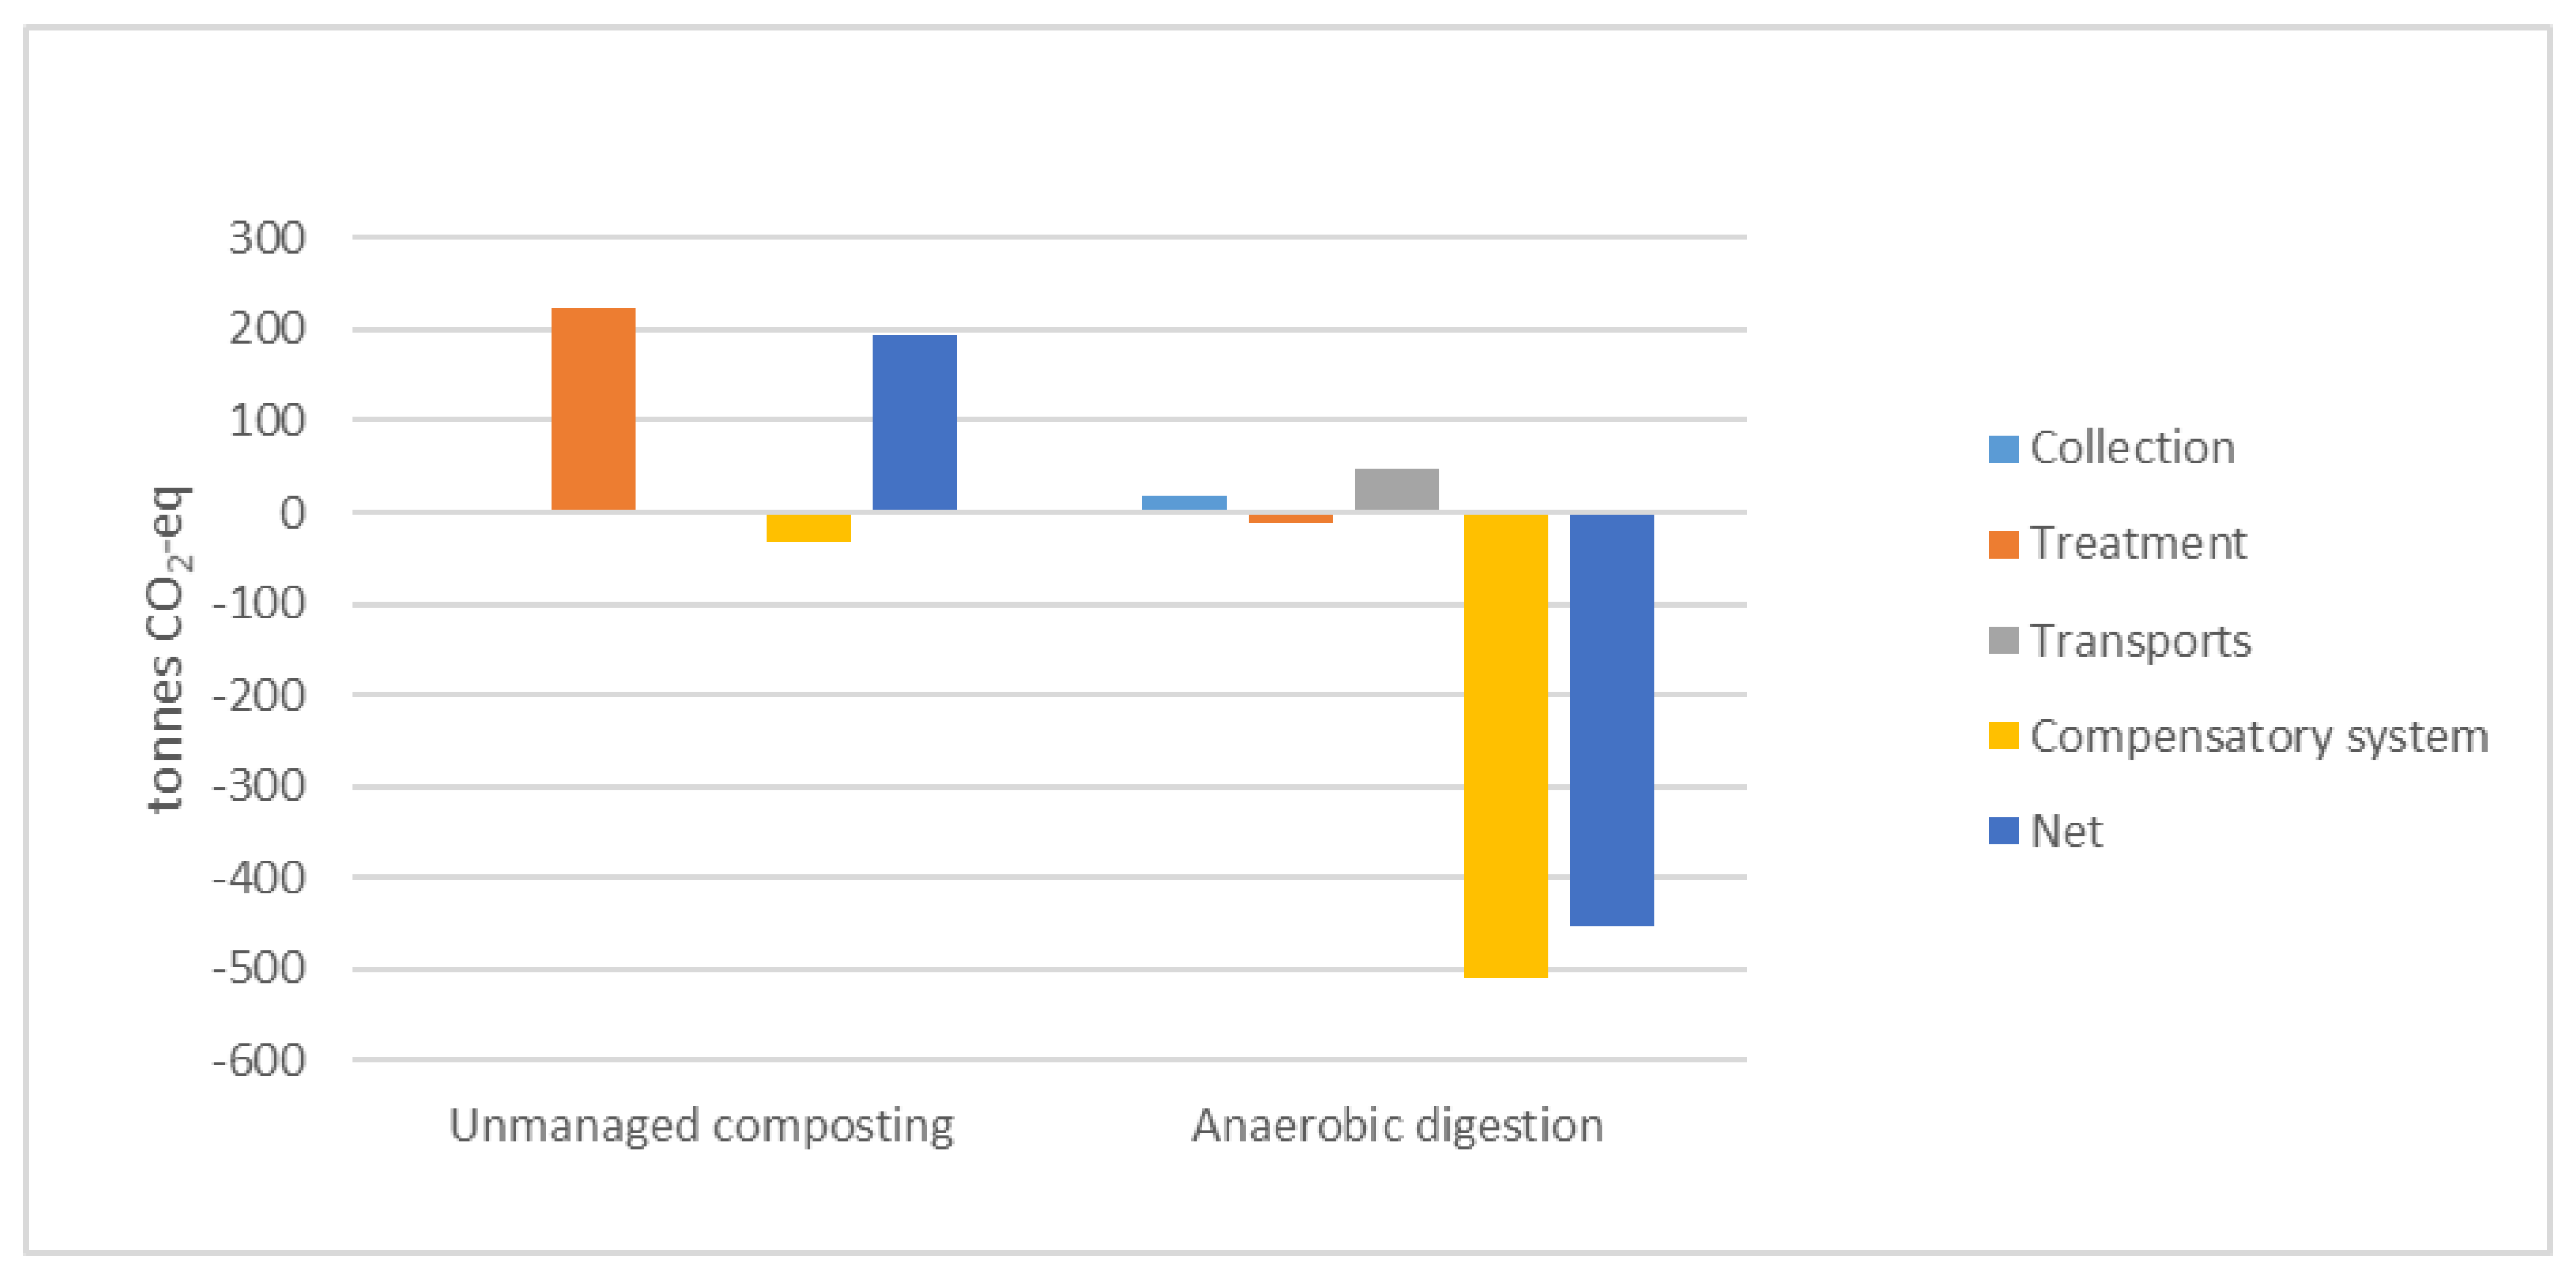
In terms of global warming potential (
Figure 6), unmanaged composting results in a net contribution to global warming potential from the composting process, mainly from methane formation in the compost process [
40]. Some minor savings are accounted for due to the carbon sink in arable land (organic/biogenic carbon is sequestered in the soil after a period of at least 100 years). For the anaerobic digestion scenario, emissions from collection and transport are minor and treatment actually adds to the negative contribution due to the carbon sink. Savings when biogas replaces diesel are extremely high, indicating AD as the best option.
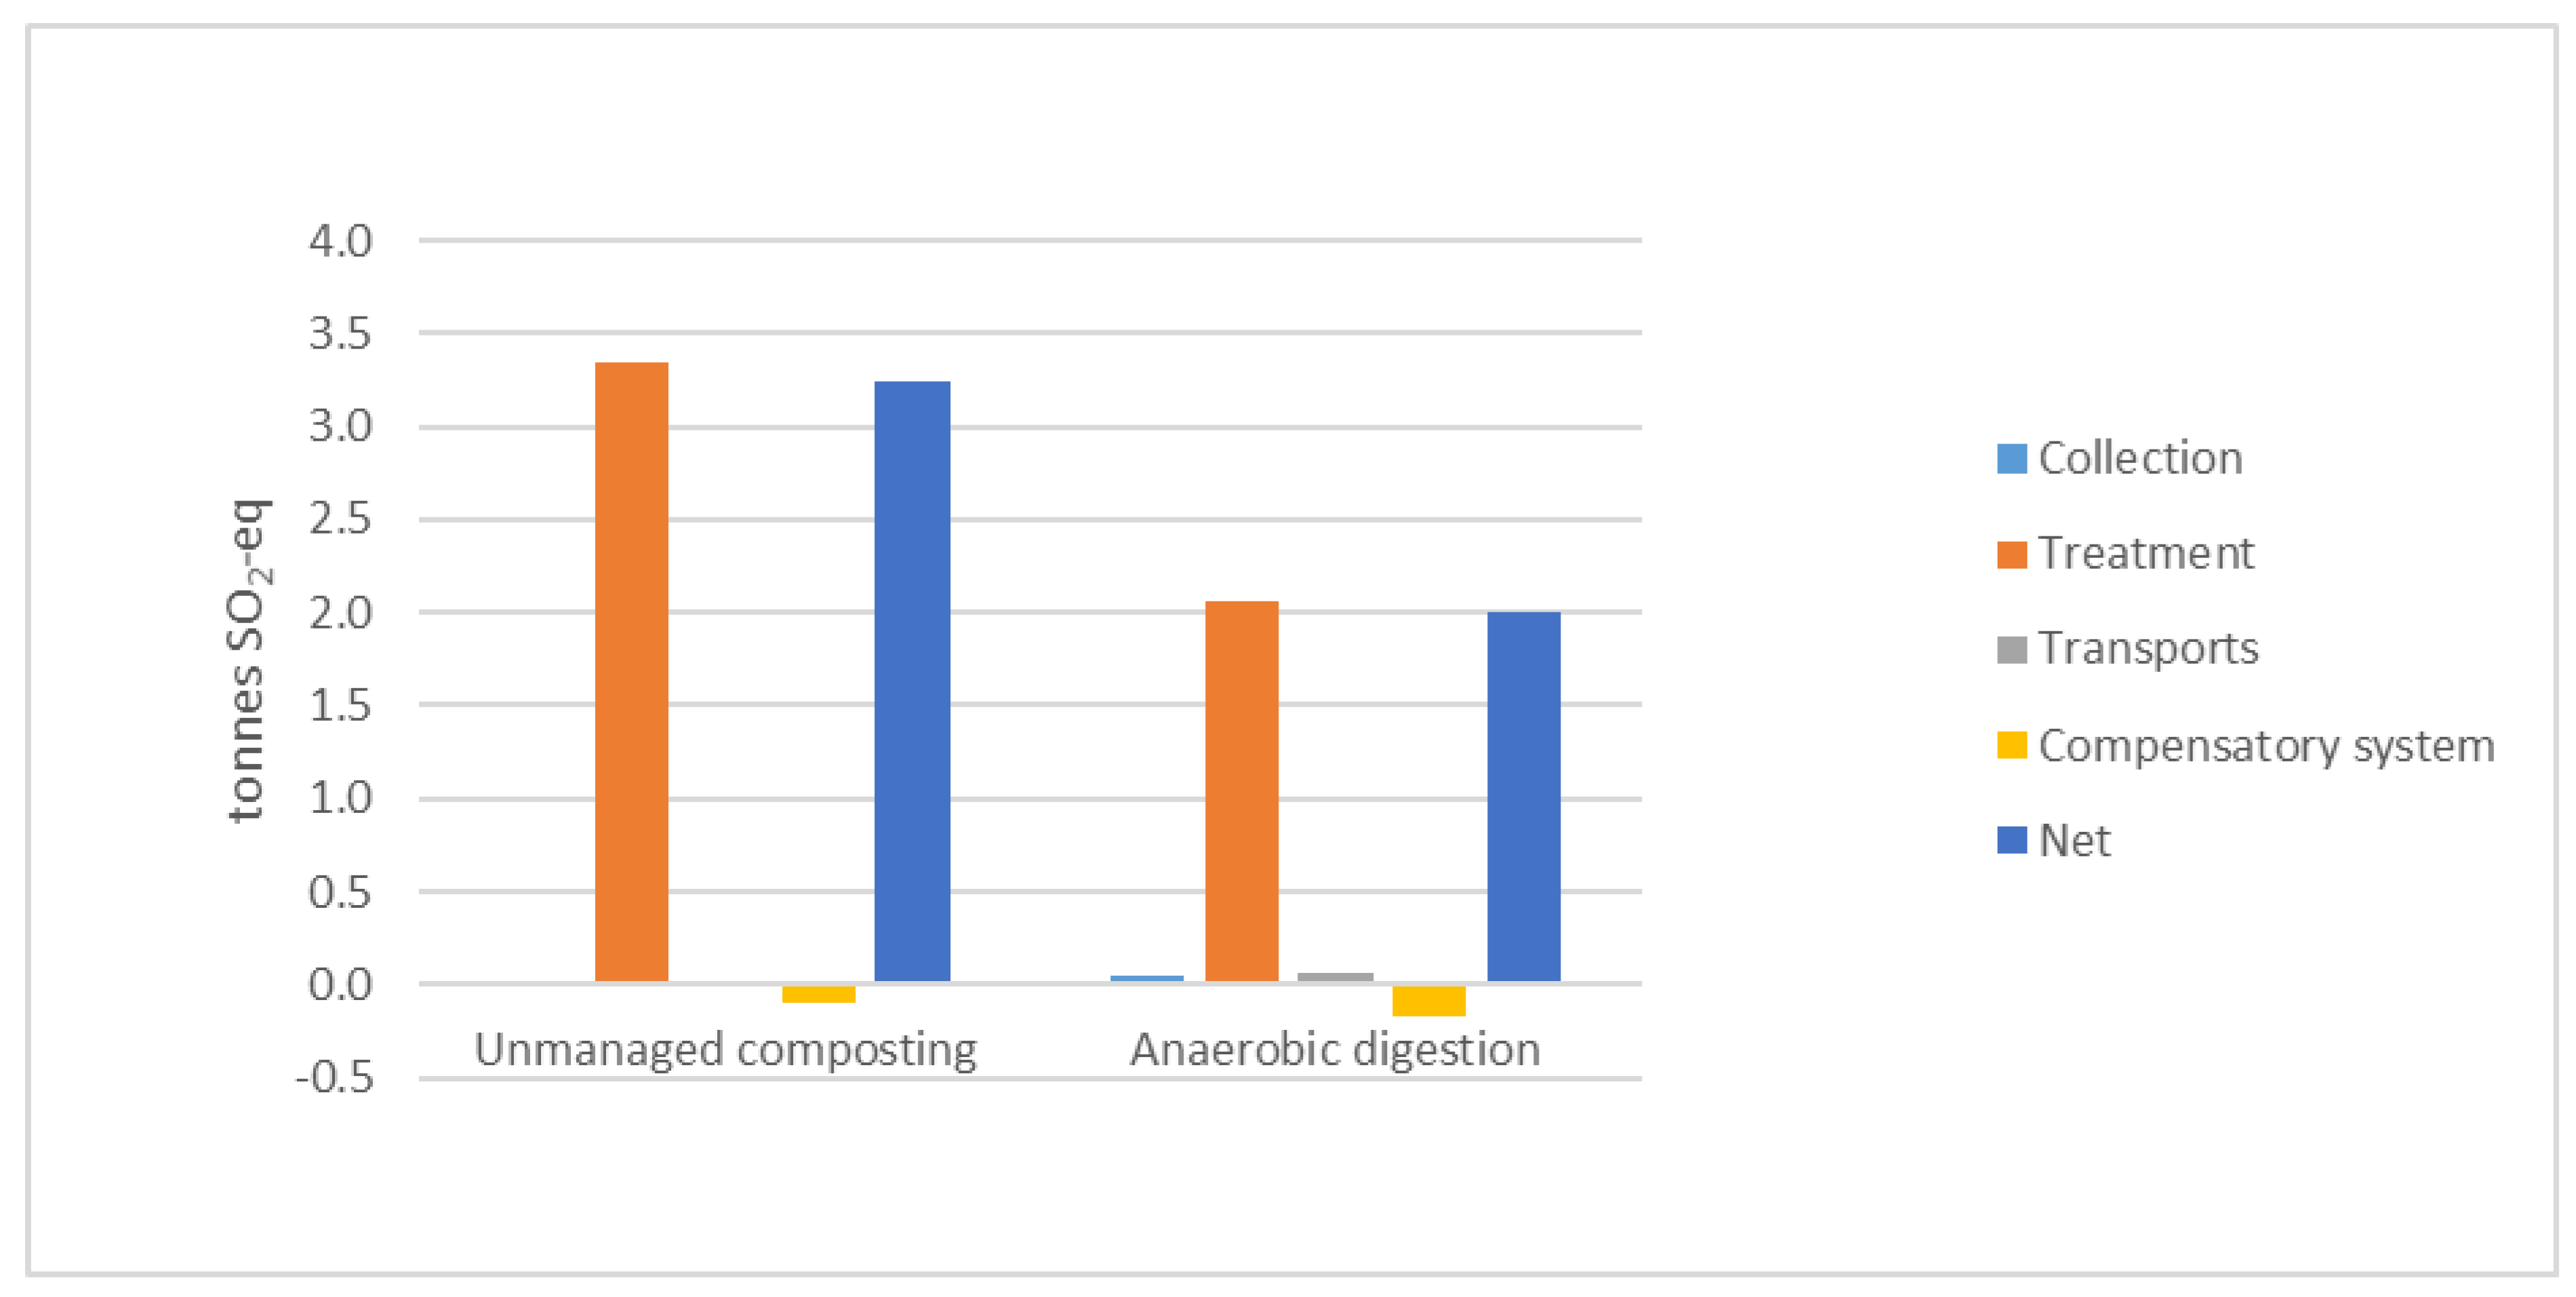
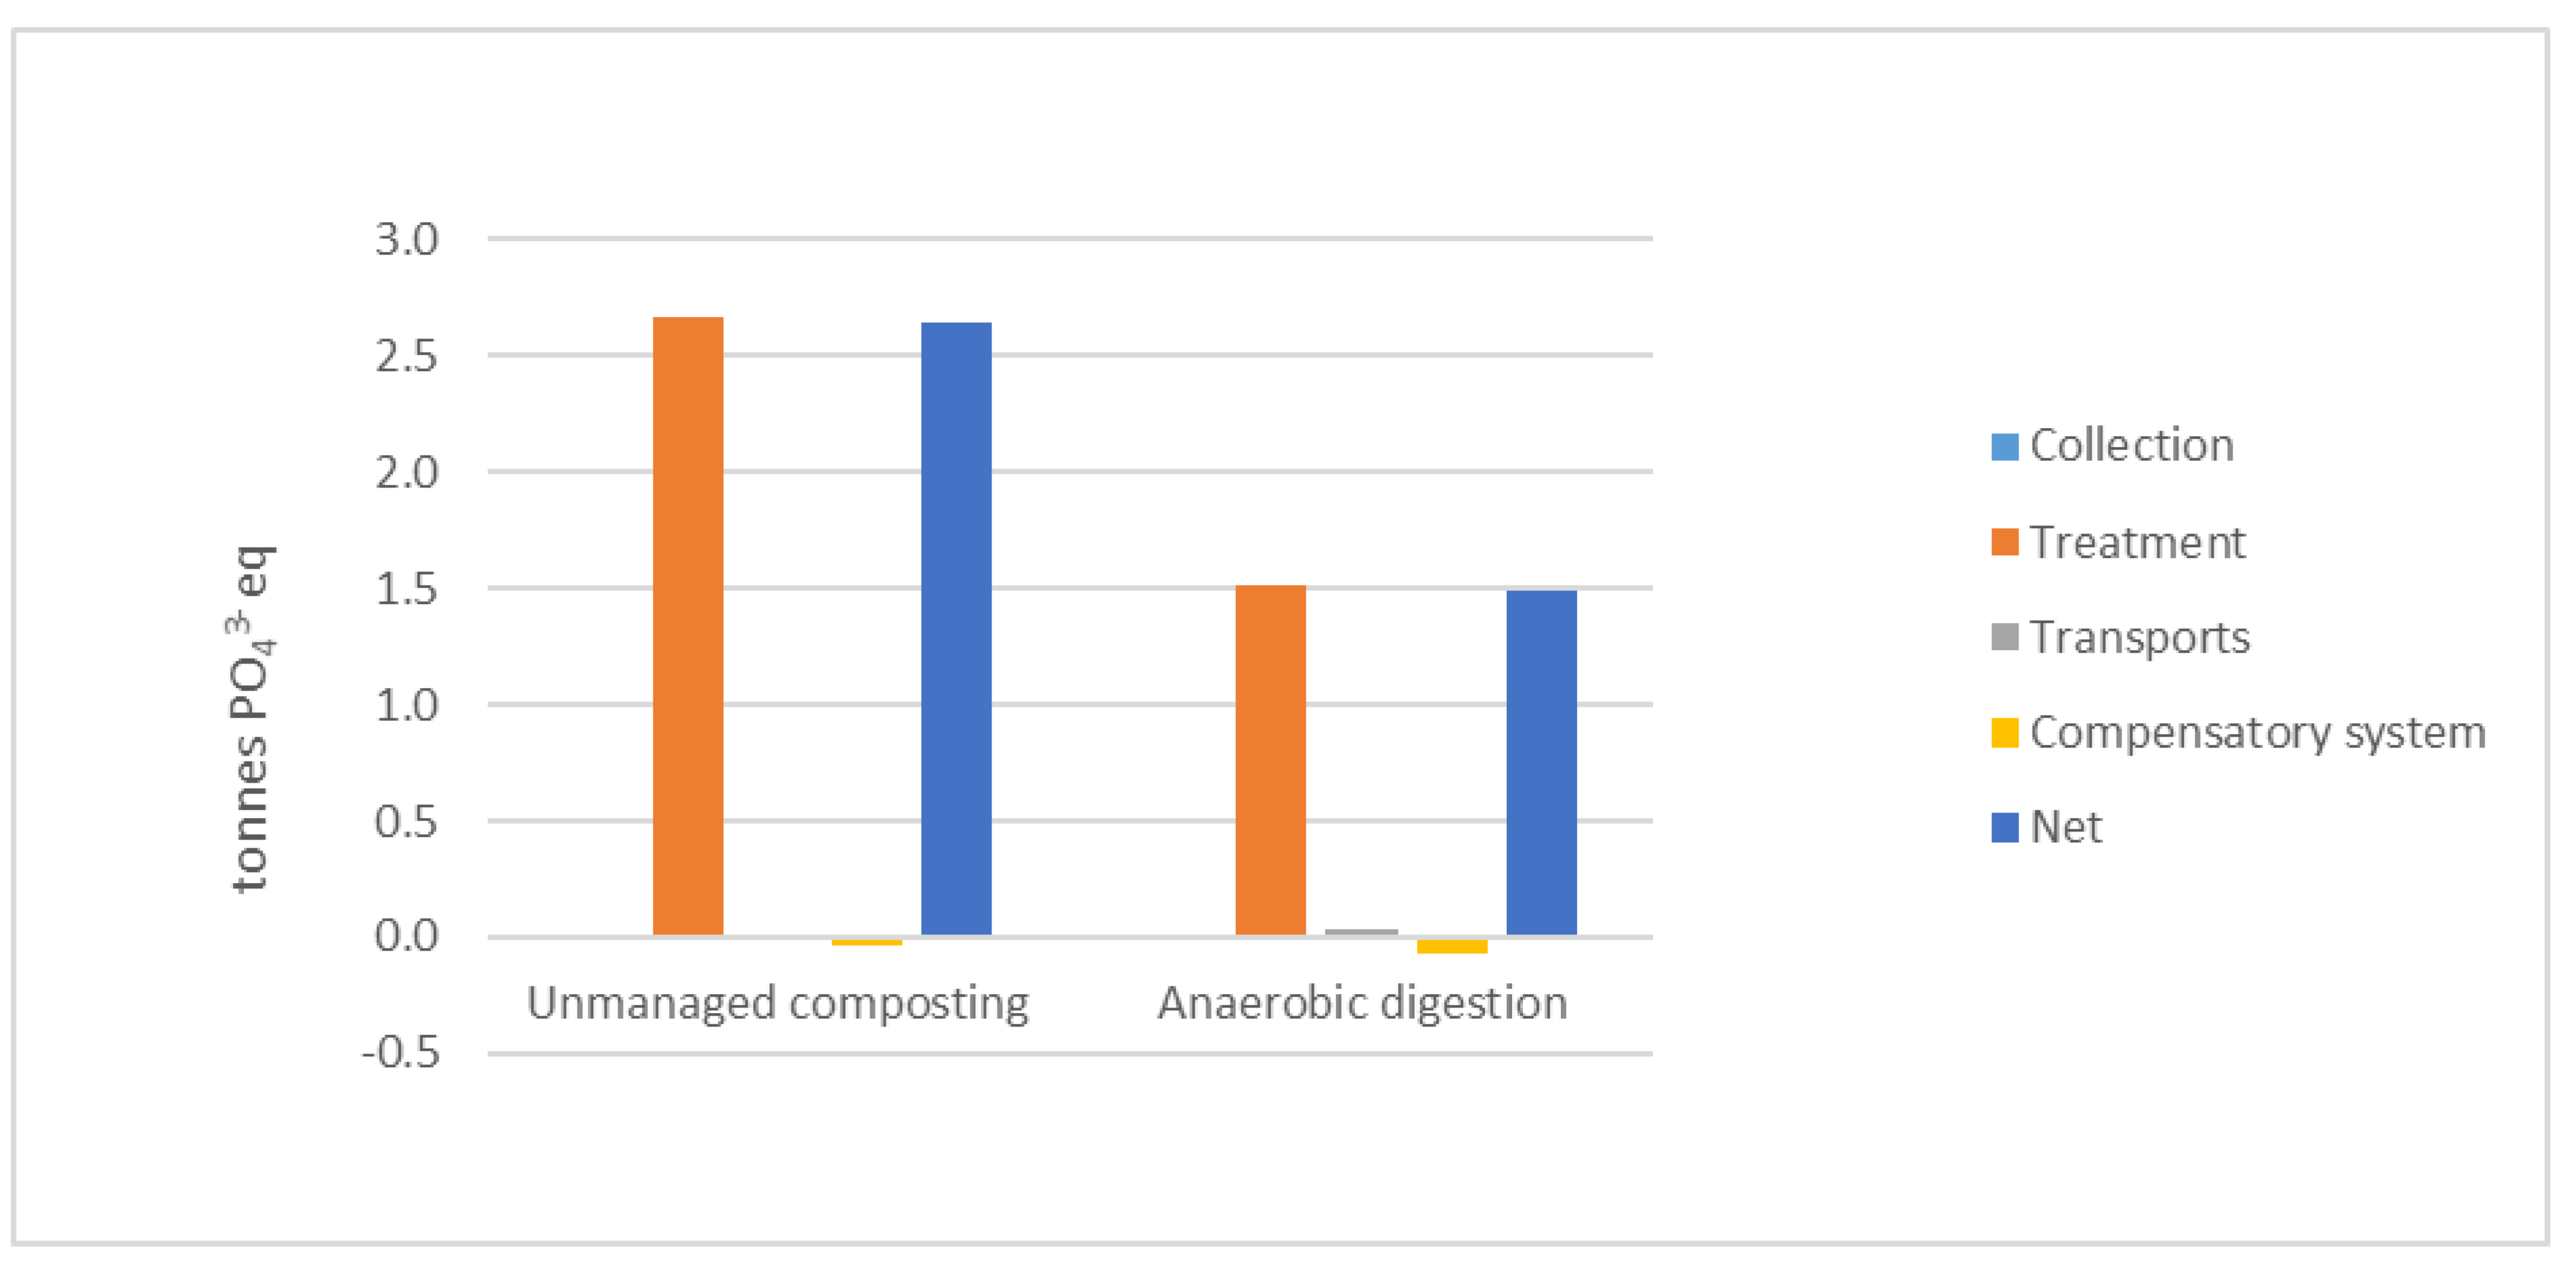
Figure 7 and
Figure 8 show AP and EP for the scenarios, where AD performs better than composting due to lower NH
3 emissions from the main treatment process. Almost all contributing emissions in the AD scenario are found for biofertilizer application, where the model calculates energy consumption and emissions from spreading residues on fields [
40].
3.3. Sensitivity Analysis
In the sensitivity analysis the importance of parameters associated with high uncertainty or variation have been investigated: manure amount, bedding type, transport distance, vehicle size and fuel type.
3.3.1. Manure Amount
Based on respondents’ estimations, the average horse manure amount was calculated as 8.6 tonnes per horse and year. In the sensitivity analysis, the amount of horse manure produced was set to 3 or 12 tonnes per horse and year, based on reported variation in collected manure amounts at the case facilities. The change corresponded to 65% (2700 tonnes) less and 40% (1700 tonnes) more collected horse manure, respectively, compared to Scenario 2. These changes caused consequences for both transport and biogas production. Considering manure transport, the environmental impact decreased with less horse manure and increased for more. However, when also including treatment and substitution of fossil fuels for a lower amount of manure, EP and AP decreased while CED and GWP increased due to the lower amount of produced biogas to replace fossil fuels. For the higher amount of 12 tonnes per horse and year the results were the opposite, with increased acidification and eutrophication and decreased global warming potential and CED.
3.3.2. Bedding Type
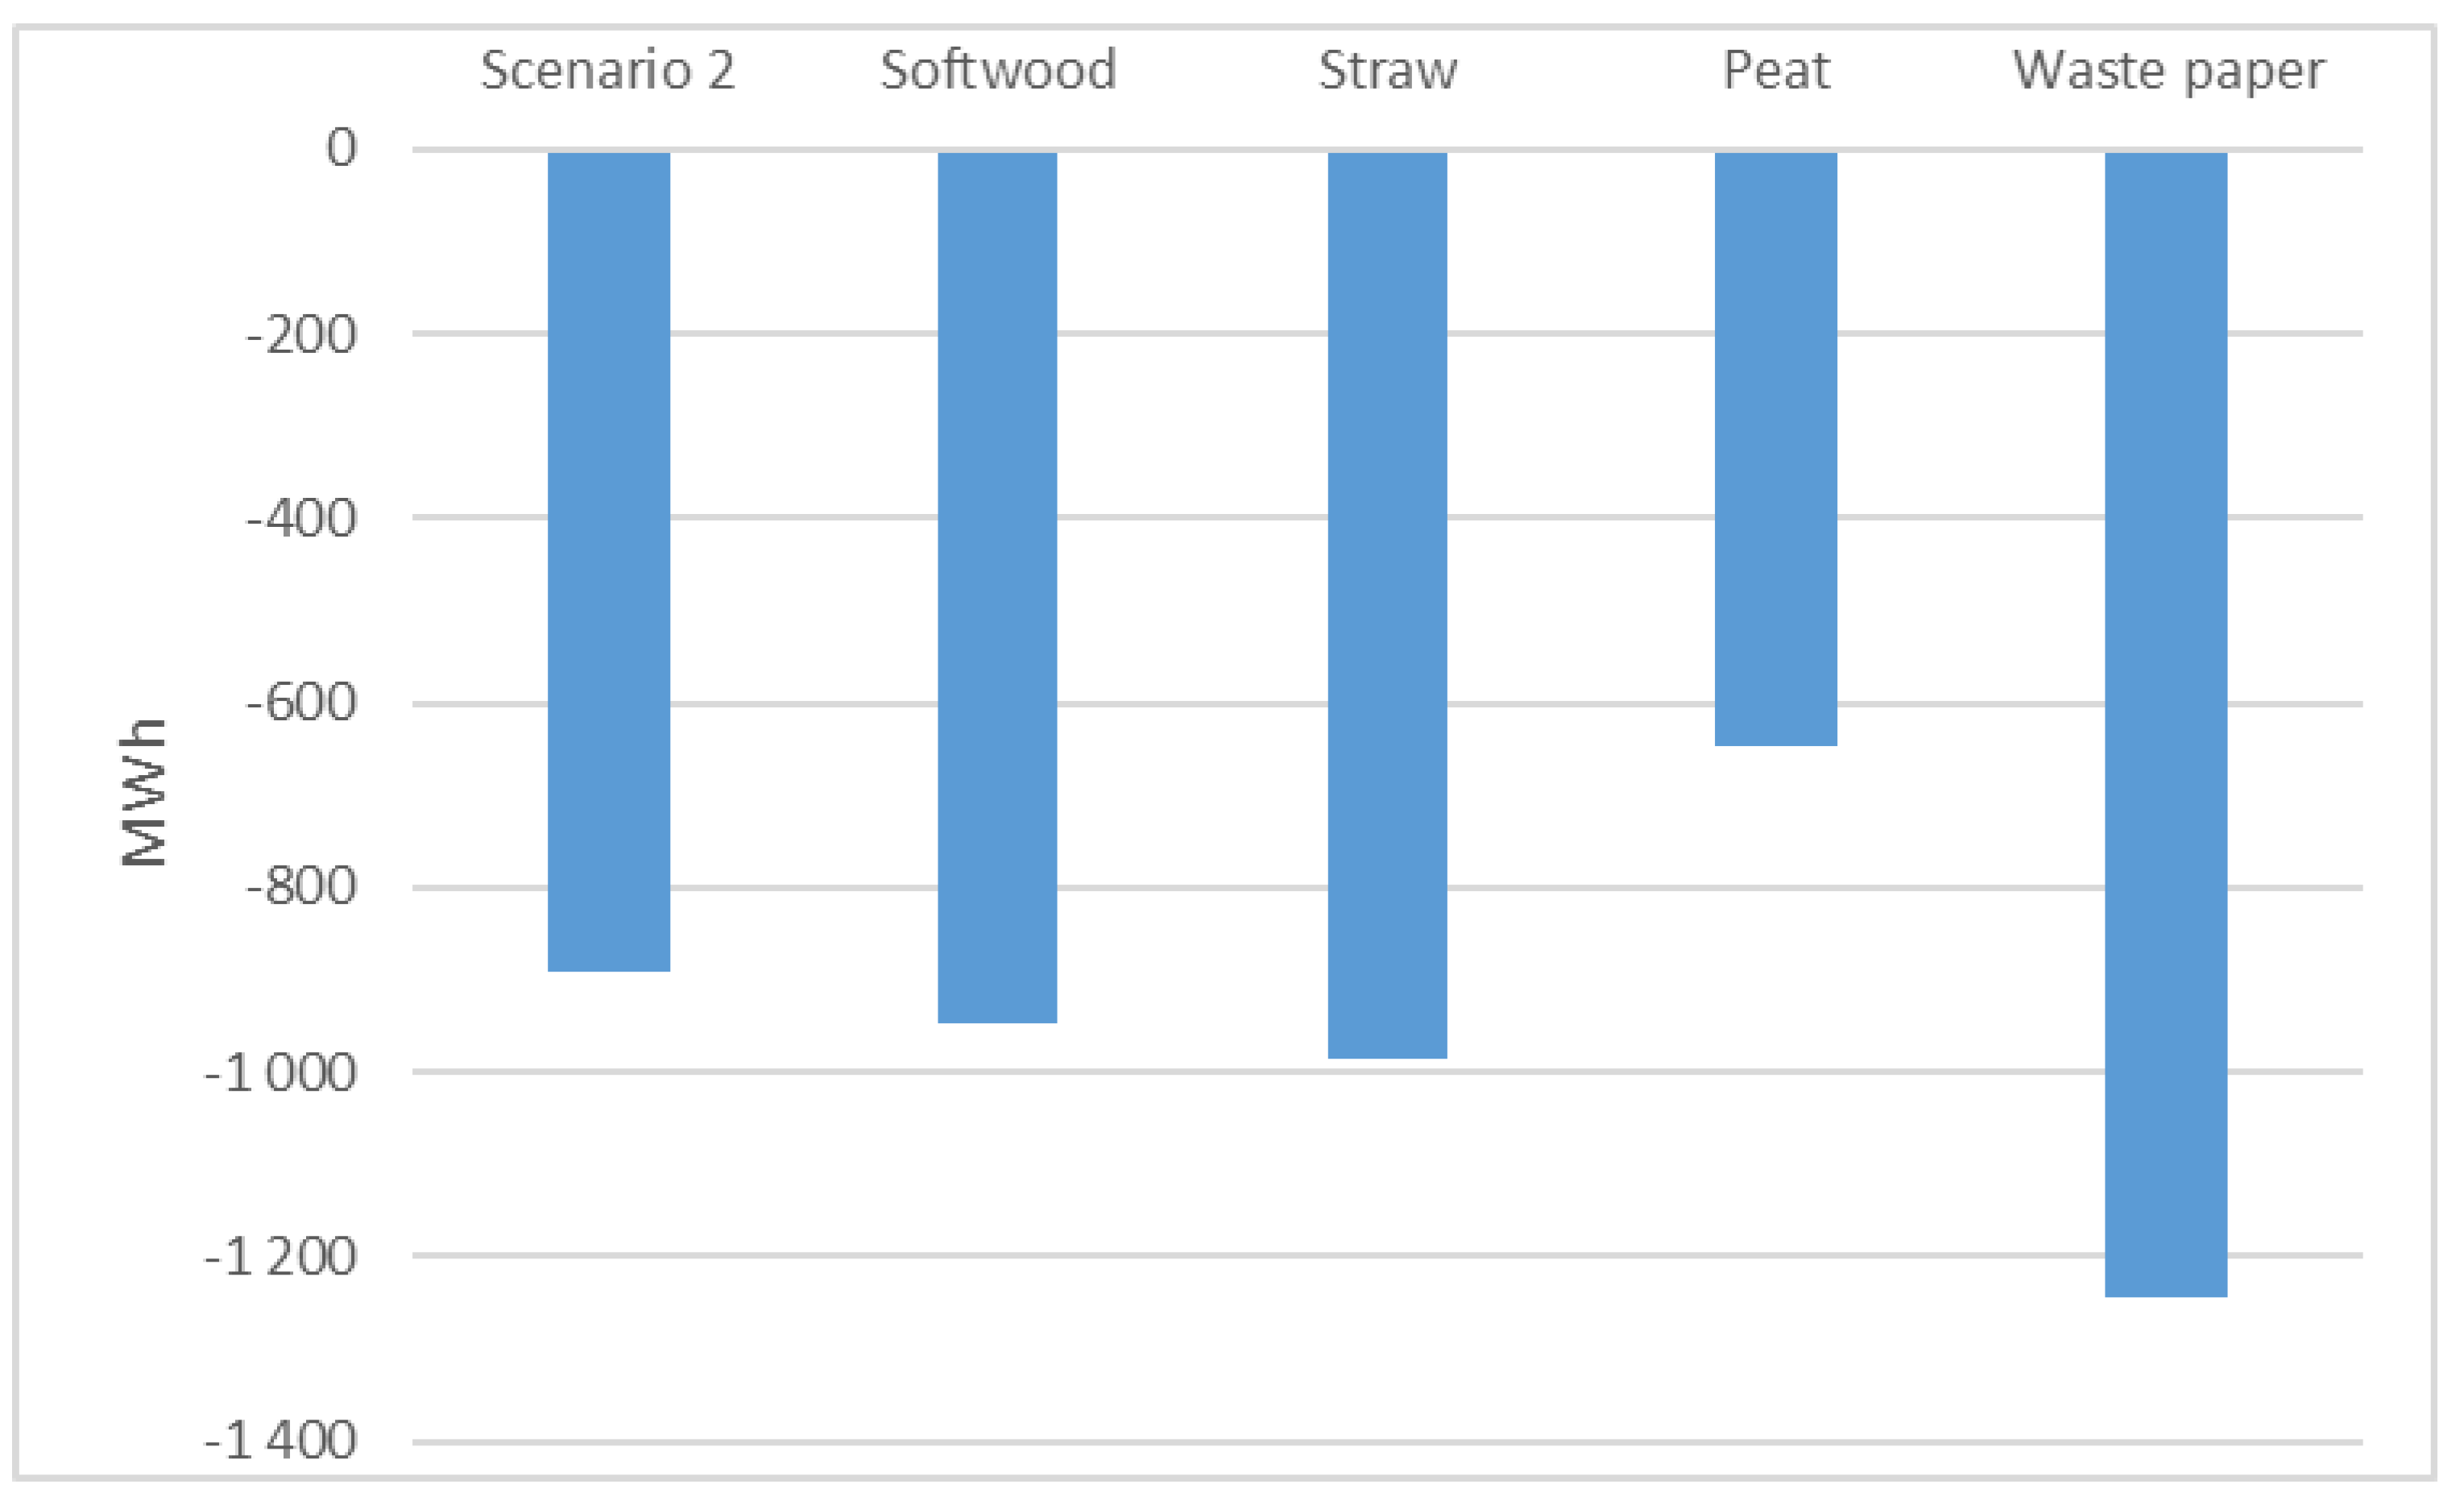
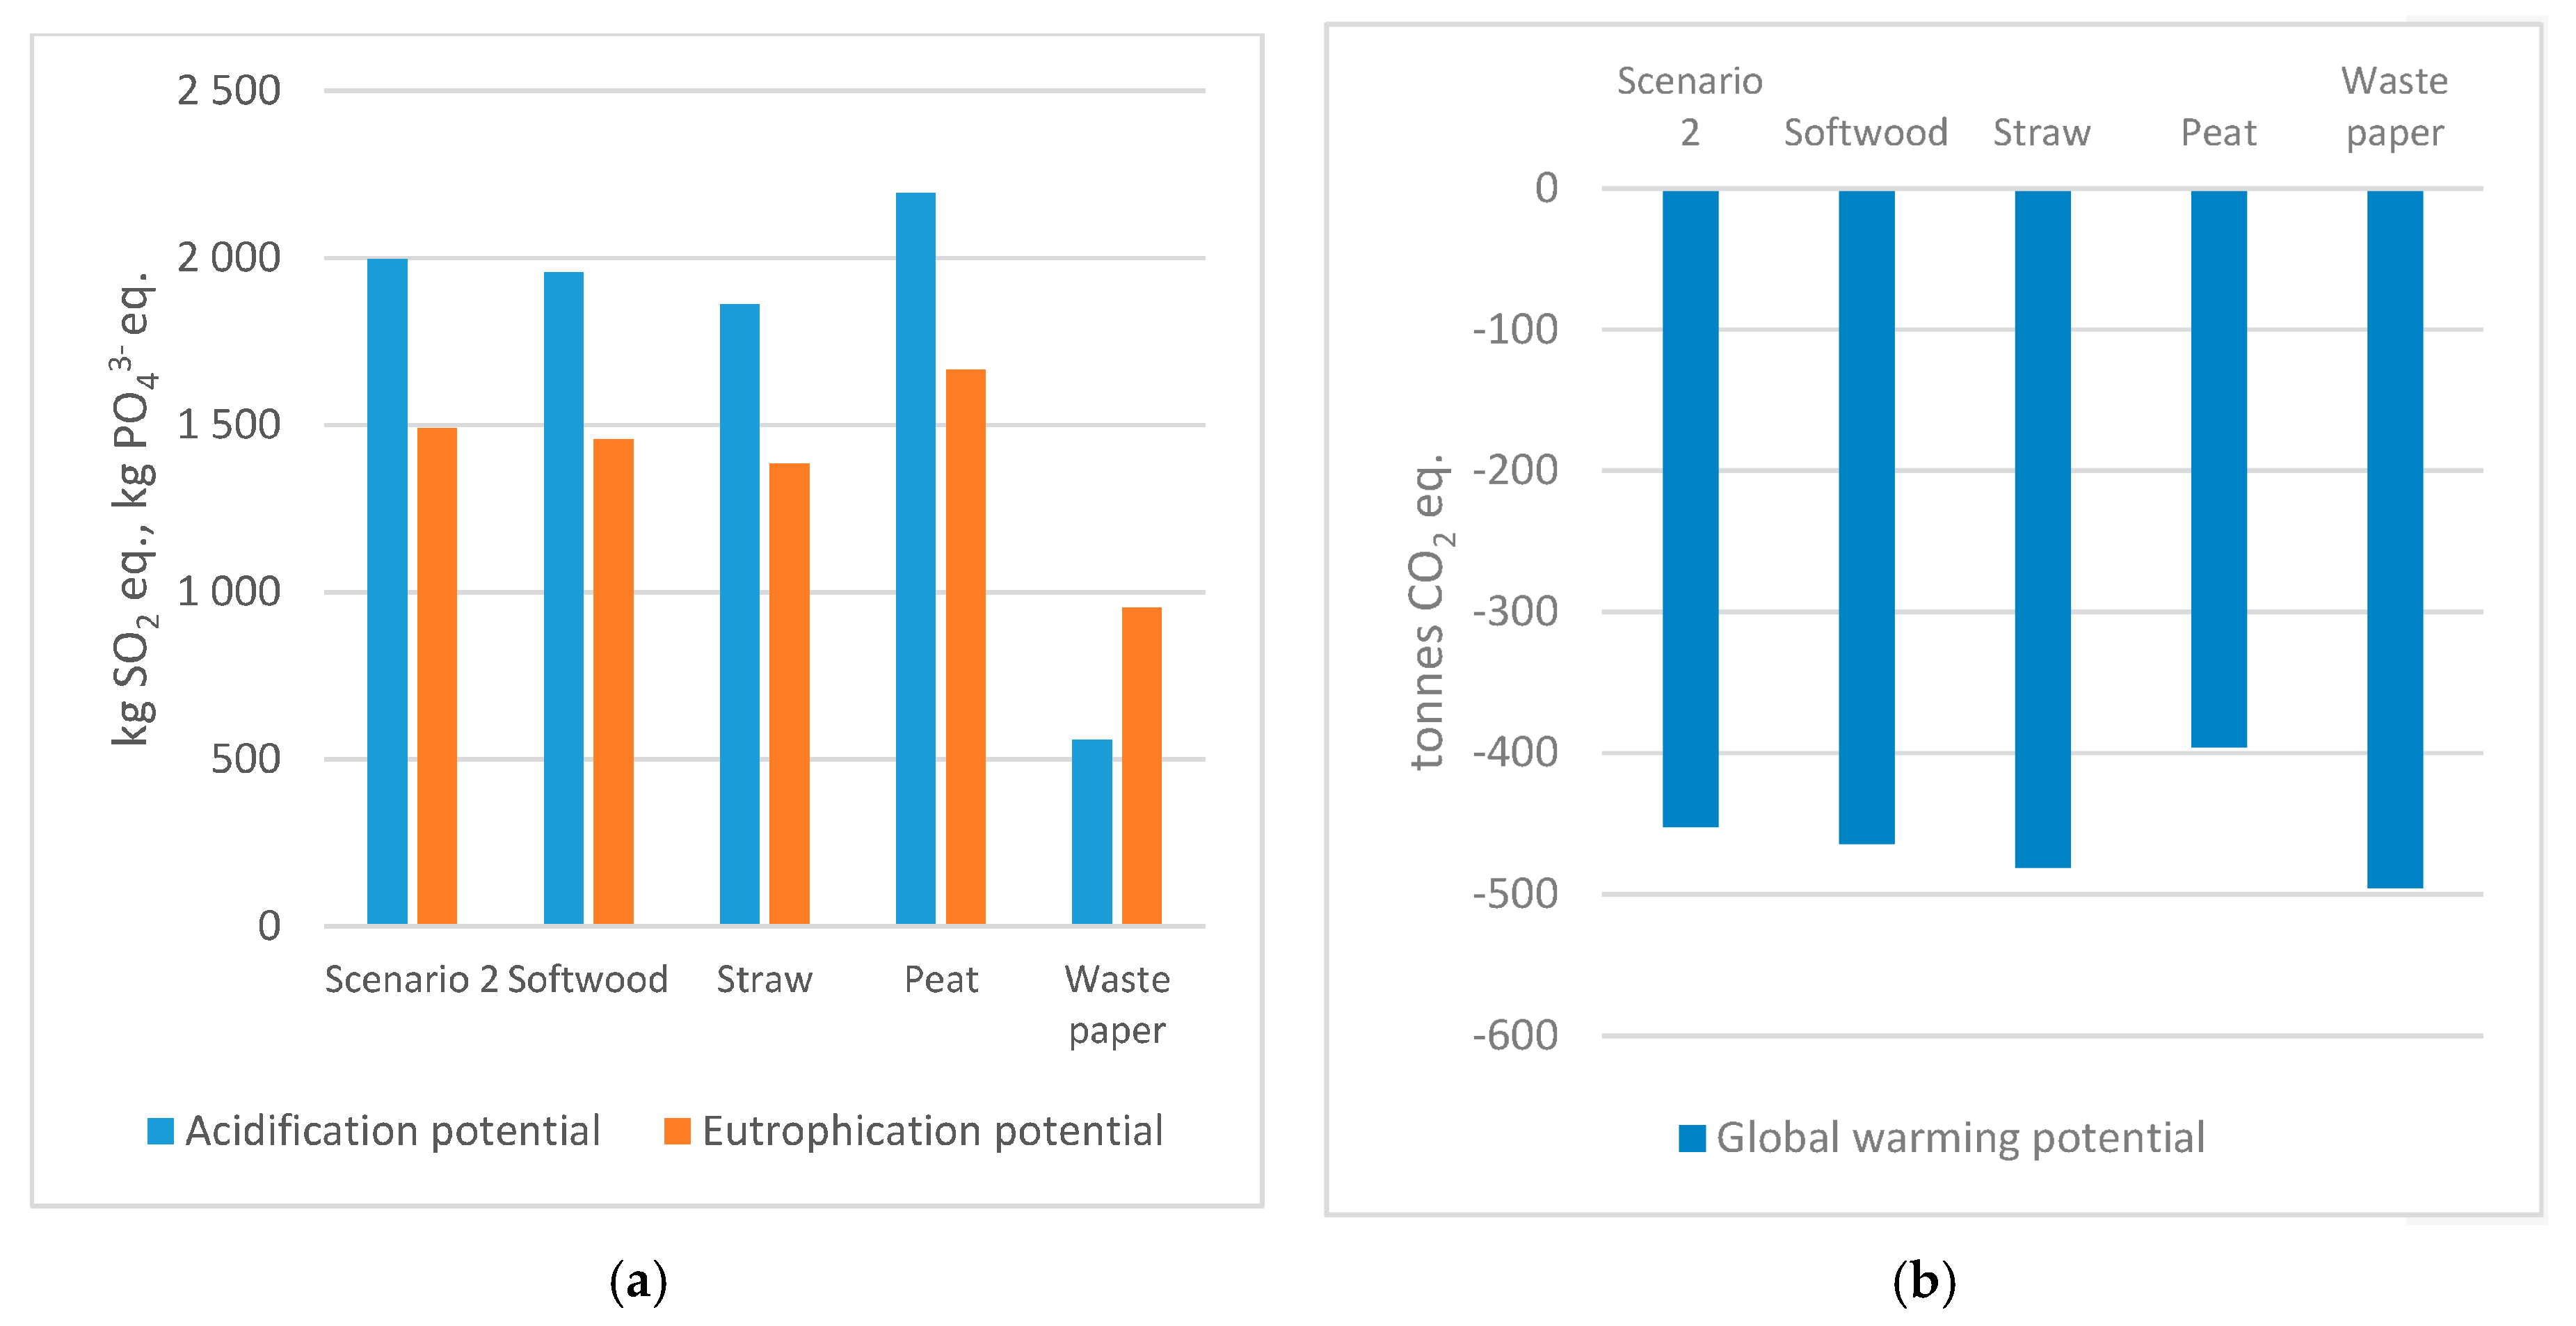
The mix of softwood, straw, peat and other, which is constructed based on respondents’ estimations, resulted in 529 tonnes of bedding material. In simulations other bedding material was defined as wood (pellets of wood), straw (pellets of straw) and waste paper (paper pellets or paper cuttings). In a sensitivity analysis, simulations were performed with softwood, straw, peat, and waste paper, one at a time. Results for cumulative energy demand are depicted in
Figure 9.
The CED is negative (i.e., savings of primary energy), independent of bedding material. Softwood bedding is just slightly better than the bedding mix in Scenario 2 due to the high share of softwood in the bedding mix. Using waste paper as bedding leads to the highest savings of energy resources, while peat has poor performance—worse than the baseline scenario but still with net savings. The results confirm the results of a previous study on methane potential [
15], where the most positive energy balance was indicated for waste paper, followed by straw, softwood and peat.
Air emissions contributing to AP and EP for various beddings are displayed in
Figure 10a. The lowest impact is found when waste paper is used as the sole bedding material, whereas a change in any of the other bedding materials does not change much compared to Scenario 2. The global warming potential (
Figure 10b) does not differ much in simulations of the different beddings, with values varying by approximately 10% compared to Scenario 2.
Simulations with single bedding materials for Scenario 1 (unmanaged composting) indicated a negative cumulative energy demand for all bedding types, ranging between −22 MWh for waste paper and −33 MWh for peat, to be compared with the bedding mix with −29. Furthermore, simulations indicated that AP and EP increased for unmanaged composting when the bedding material was 100% peat, while waste paper, straw and softwood resulted in a lower potential environmental impact than for the bedding mix. Again, using 100% softwood bedding does not alter the baseline results much as it was a high share of the bedding mix. The composting sensitivity analysis indicated the highest GWP for waste paper, almost no change for softwood and lower for straw and peat, in comparison to the case bedding mix.
3.3.3. Transport Distance, Vehicle Size, and Fuel Type
In Scenario 2, the respondents’ locations in relation to an expected anaerobic digestion plant resulted in a total distance of 1679 km. In the sensitivity analysis, the distance changed by ±10%. The results then varied by ±2 tonnes for GWP, ±1 kg for EP, ±4 kg for AP, and ±8 MWh for CED. These are all minor changes. An additional analysis of the results shows that, in the case of anaerobic digestion and adjoining transport, the total transport distance could increase by 40 times before the same level of global warming potential would be reached as for unmanaged composting. This is well beyond the level of uncertainty regarding transport distance.
In the next sensitivity analysis, manure transport was assumed to be performed by smaller trucks (rigid truck, 7.5–12 tonnes). Using smaller trucks should increase transport work and thus environmental impact. When looking just at the potential environmental impact from transport, GWP emissions and CED increased by about 90%, whereas AP and EP emissions increased by 105% compared to Scenario 2 transport. When calculations were based solely on the larger truck type (truck with trailer, 28–34 tonnes), the potential environmental impact instead decreased by 10% for GWP and cumulative energy demand, and 16% and 18% for AP and EP, respectively.
In Scenario 2 European diesel B5 was used as the vehicle fuel for transporting manure to the plant (
Table 8). In a sensitivity analysis the fuel was changed to HVO made from either waste cooking oil or palm oil, using data from [
47]. The sensitivity analysis only comprised CED and GWP due to data scarcity. The analysis indicated that if waste cooking oil HVO is used, GWP from transport is reduced by 90% and CED is reduced by 86%. The use of palm oil HVO reduced GWP by 59% and CED by 4%.
3.4. Economic Assessment
The combined assessment also includes an economic assessment of horse manure treatments, based on the costs for the horse owner. The cost analysis was performed in a very simplistic way through an inventory of costs associated with (1) storage and composting on-site and (2) storage, collection and transport to an anaerobic digester. For the composting scenario, the manure is stored on a concrete plate in the vicinity of where the horses are held, and local farmers or private persons retrieve the compost. It is assumed that there are no associated costs with this baseline option, as the municipality places restrictions on the safe storage of manure and the utilization of compost means no cost for the horse owner. In a systems perspective these omitted costs are “hidden” costs but it is reasonable to exclude these if drivers and barriers for the horse owners are the focus. The biogas scenario comprises costs associated with a container solution for storage and collection/transport of the manure to the treatment facility and the reception fee at the AD plant. As container sizes of 10 or 22 m
3 seem to dominate the market, costs are presented for both these options and for the whole case where these sizes have been applied. These containers are loaded with 5 and 10 tonnes of manure, respectively, which in combination with the annual manure amount determines how often manure is being collected. The reception fee is supposed to reflect the costs (investment, running and maintenance costs) of the main process and utilization of biofertilizer and biogas. In a systems perspective, either revenues for biogas and biofertilizer or avoided costs for fossil vehicle fuel and mineral fertilizer should be included. These are excluded using the horse owner perspective but is still indicated to show the societal benefits. The cost inventory is found in
Table 10 and the costs for Scenario 2 are found in
Table 11.
Renting a 22 m
3 container is more expensive than a 10 m
3 container when calculated per volume and month or per tonne and month (maximum loads are 5 and 10 tonnes, respectively) [
48]. The rent presented in [
49] probably refers to a 10 m
3 container. Costs for collection vary vastly between different references. This may be due to the fact that container services to minor customers/private persons can be considered minor isolated markets with few stakeholders. This also holds for treatment where reception fees vary a lot; in one study the gate fee is calculated to vary from −100 SEK/ton to 500 SEK/ton depending on financial support and sanitation requirements [
52].
In
Table 11 two examples are shown, 18 and 64 annual metric tonnes, respectively, which—using 8.6 tonnes manure/horse, year (found in the case study)—correspond to two or seven horses. The lower figure reflects the median amount in the case, whereas the higher figure is the average value. Calculations are made based on data from
Table 10 following references in
Table 11.
Choosing the 10 m3 alternative means a moderate cost for storing, but with a smaller container the manure has to be collected more often, leading to a higher collection cost. The 22 m3 alternative is the other way round. For small horse facilities with two horses, the total cost varies considerably between the two container solutions. For the seven-horse case, the total cost is independent of container size.
From a horse owner’s perspective the cost per horse and year could be seen in relation to the cost for fodder, which is roughly 7000–10,000 SEK/year (own calculations). From a societal perspective, this cost should be seen in relation to the benefit created, i.e., vehicle fuel and plant nutrients. With a vehicle gas price of 19 SEK/kg, the market value of biogas is approximately 2 MSEK. The value of the biofertilizer is somewhat more complicated to determine as some is mixed into plant soil, some is used by farmers for soil improvement where the market value is hard to determine, and some may be sold to private persons. One way to assess the value of biofertilizer is to account for the content of NPK and the avoided cost for mineral fertilizer. According to our estimations, the market value of the nitrogen and phosphorous content is approximately 0.1 MSEK.
Supply chain costs for horse manure in Sweden have been calculated by Svanberg et al. [
31]. The case study results in
Table 11 have been translated into euros, and compared to Svanberg et al. in
Table 12. The costs in the case study are much higher than in Svanberg et al., mainly due to higher costs for container rent.
4. Discussion
4.1. On Site Manure Management
Methane production is different depending on the type of bedding material. Methane potential is crucial as the more methane that is produced, the more fossil fuels can be replaced by biogas. The best material to digest according to the simulations is waste paper, which has the lowest environmental impact; straw is also competitive, having the lowest CED.
Treatment of horse manure away from horse keeping sites requires manure collection both outdoors and indoors and storage in containers, or on concrete slabs followed by loading in containers. In this exploratory case study, most horse keepers collect horse manure left outside all year or for parts of the year, which could coincide with a grazing period or time in paddocks. This mucking regime creates a good opportunity for energy utilization as it already involves collection before transportation to a biogas plant. It should, however, be noted that outdoor collection increases the amount of collected manure without bedding material but also increases the risk of solid impurities. Sensitivity analysis summarizing environmental impact from transport and AD process indicates a reduction of GWP and CED with increased amount of horse manure, while other environmental impact categories (AP and EP) increase with a higher amount of horse manure.
Despite storage on the ground being indicated, mostly by horse keepers with few horses, horse manure was mostly stored on impervious surfaces. Storage in containers and concrete slabs was apparent to a greater extent in the case municipality than in Swedish statistics [
10].
4.2. Manure Transport
Treatment of horse manure in a central anaerobic digestion plant requires manure transport, which is facilitated by a container system. The proposed transport system was already familiar to several horse keepers in the case as manure is either directly collected in containers, or temporarily stored on concrete slabs and then removed. Transport is a prerequisite for anaerobic digestion of manure, which adds environmental impact to the AD system, but also increases the amount of substrate available for biogas production and fertilizer production. In terms of GWP, the emissions avoided when biogas replaces diesel and biofertilizer replaces fertilizer are about 10 times greater than the emissions from transporting the manure to the plant. The AD process, including biofertilizer application on arable land, makes a negative contribution to GWP as it works as a carbon sink. The GWP impact from digestate application is larger than that of spreading composted horse manure due to (1) the higher content of water in the digestate, causing higher emissions from digestate transport and (2) less carbon left in the residue as most of the carbon has been converted to biogas. The sensitivity analyses of manure transport show that the impact from transport can increase significantly before the total impact equals the impact from unmanaged composting. A sensitivity analysis of transport also reflects logistical strategic decisions like use of fuel and what trucks to use for transport [
25]. The sensitivity analysis indicated a large decrease of environmental impact from transport if HVO replaced diesel, pointing at improvement potential in choice of fuel for the necessary transport for energy recovery. Furthermore, s lower environmental impact is obtained for transport with larger trucks, due to the higher cargo capacity. A positive effect on environmental impact from less frequent and larger transport is also presented by Aronsson and Brodin [
25]. Choice of fuel and type of vehicle are aspects of the efficient collection of horse manure, and decisions about this are part of the planning that would have to take place if a transport system for horse manure was implemented. Choice of trucks comprises not only the loading capacity but also assessment of road viability for heavy trucks and loads, and therefore a mix of lighter and heavier trucks is more probable than sole use of the largest trucks.
4.3. Environmental Impact
Simulations indicated horse manure treatment in AD with associated transport to reduce environmental impact for all categories; while CED and GWP are decreased (net savings) in the anaerobic system, AP and EP still have a net contribution. In simulations, environmental impact from unmanaged composting was 70% higher for EP and 50% higher for AP. Unmanaged composting is resource-efficient as it only reaches 3% of the CED for AD. For GWP unmanaged composting has a net contribution, while AD leads to double the savings. Anaerobic digestion uses energy in the processes (for example upgrading, heating, and stirring), but contributes to the change from fossil fuels to renewable fuels for transport, thereby reducing the total potential environmental impact from the system according to simulations and calculations.
4.4. Biofertilizer Application and Nutrient Recycling
A change from compost to digestate in terms of application on arable land has some implications as solely solid manure is converted to a liquid digestate when using a liquid anaerobic digestion plant. This may affect where plant nutrients are being spread, depending on machinery and the need for plant nutrients in the area of an expected biogas plant. Most horse keepers use softwood for bedding, which corresponds to estimated Swedish statistics [
10]. The use of softwood is also positive for low nitrogen leakage and run-off, which are also affected by turning and cover of compost [
14,
16]. Whether or not horse keepers turn or cover their manure piles was not investigated in this case, but it was noticed that turning of compost to facilitate degradability was mentioned by a couple of horse keepers. There seems to be a high level of nutrient recycling in the BAU scenario as most horse keepers in the case spread horse manure on others’ or their own arable land. There is a strengthened need for cooperation between farmers and horse keepers to close natural cycles of plant nutrients based on the findings in the case. Other recycling systems described in the case were horse manure turned into soil, composted, and collected by households for gardening. Nutrient recycling is beneficial for the business-as-usual scenario as scarce plant nutrients are currently recycled, but also for a future system where horse manure is subject to energy recovery before the biofertilizer is spread on arable land.
4.5. Cost Assessment
The major benefit of the cost assessment is that it puts expected manure management costs for the horse keeper in perspective against the other costs associated with horse keeping, and also in relation to the benefits for society. The major drawback of the present assessment is that it is incomplete; it does not sum up all costs for the life cycle of either unmanaged composting or anaerobic digestion, and it does not include environmental costs. Furthermore, it does not point to cash flow for different stakeholders in the value chain and thus cannot be used to make any predictions on effective policy instruments. Most horse keepers are private people with few horses, and their willingness to pay is uncertain. However, some of the horse facilities with many horses exist on a commercial basis and may have the ability to take on increased costs. Such differences in raw material supply must be addressed when improving the cost assessment. By expansion of the cost assessment, comprising a higher level of detail, different policy measures such as tighter regulations on environmental permits for horse keeping, subsidy for reduction of methane leakage, or producer responsibility on horse manure could be evaluated. Also, other measures would be of interest in order to affect the pricing of horse manure as a renewable resource. For example, increasing the demand for (and the price of) biogas could lead to lower reception fees at the biogas plant, and horse manure can also be made more attractive as a substrate by different measures in horse keeping, such as enhanced medicine control and optimization of bedding practices.
4.6. Uncertainties
Answers in the questionnaire have been the basis for calculations of total amounts of horse manure and collected amounts of horse manure. Interpretations of horse keeper answers were necessary and sometimes assumptions about amounts of bedding and horse manure were made. Even accounting for such uncertainty, the case illustrates horse manure characteristics and aspects of horse manure management of importance for energy recovery.
In a previous paper [
4], potential factors of importance in horse manure management were identified. Examples of factors not included in the questionnaire were feeding practices, soil conditions, spreading method, and time of storage. Horse keeper estimations of horse manure amount are assumed to cover the fact that feeding affects the amount and content of produced horse manure. The aspects of spreading method and time of storage are taken into account in the ORWARE simulations as emissions to air and water from unmanaged composting and anaerobic digestion and emissions from application of compost and digestate on arable land.
In Scenario 1 (unmanaged composting) no transport of manure was included, as composting is assumed to be located at the horse keeping site, representing one of the differences between treatment methods identified in earlier studies and visualized in this study. A liquid anaerobic digestion process was used in simulations due to a lack of reliable data on a dry anaerobic process, thus a possible difference in processes is not investigated in this study.


