Article

Characteristics of Pore Structure and Fractal Dimension of Isometamorphic Anthracite

1
State Key Laboratory of Coal and Coalbed Methane Co-mining, Jincheng 048006, China
2
School of Resources and Environment, Henan Polytechnic University, Jiaozuo 454000, China
3
Collaborative Innovation Center of Coalbed Methane (Shale Gas) for Central Plains Economic Region, Jiaozuo 454000, China
*
Authors to whom correspondence should be addressed.
Energies 2017, 10(11), 1881; https://doi.org/10.3390/en10111881
Submission received: 28 September 2017 / Revised: 8 November 2017 / Accepted: 14 November 2017 / Published: 16 November 2017
(This article belongs to the Section L: Energy Sources)

Abstract

:
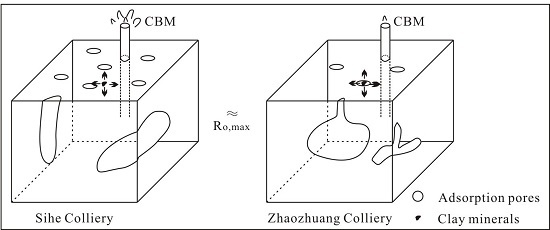
The geologic conditions of No. 3 coal seams are similar to Sihe and Zhaozhuang Collieries, however, the gas production is significantly different. To better understand the effect of pores, by means of experimental measurements and quantitative analysis, the pore properties of high-rank isometamorphic anthracite were thoroughly studied. Our study showed that the pore structures were predominantly adsorptive, accounting for more than 88% of the specific surface area. The coal pores showed typical three-stage fractal characteristics at boundary points of 1 nm and 9 nm (7 nm of coal samples from Zhaozhuang Colliery), and the fractal dimension with 1–9 nm (or 1–7 nm), as being significantly larger than those measured outside the given ranges. Pores in samples from Sihe Colliery were mainly open spherical or ellipsoidal pores in shape; conversely, those from Zhaozhuang Colliery were mainly Y-shaped, V-shaped, or ‘ink-bottle’ type.

Graphical Abstract

1. Introduction

Coal is a porous medium. In coal reservoirs, these pores are the main accumulation areas and migration pathways of coalbed methane (CBM). Pore structure affects not only the state, desorption, diffusion, percolation, and gas content of CBM, but also limits its recoverability [1,2,3]. Therefore, studying the characteristics of coal pore structures provides an important basis for analyzing the adsorption–diffusion–percolation processes in coal reservoirs and the recoverability of CBM [4]. Previously, techniques such as atomic force microscopy, scanning electron microscopy (SEM), mercury porosimetry (MP), low-temperature nitrogen adsorption (LTNA), magnetic resonance imaging (MRI), computerized axial tomography (CT), laboratory and numerical simulation have been used to extensively study pore properties, adsorption/desorption, molecular structures, the recoverability of CBM, and the seepage capability of coal reservoirs with different deformation and metamorphism histories. Previous studies have concluded that with increasing coal rank, the average width of micro-fractures changes regularly [5] and it is possible to characterize a relatively large coal sample at a relatively low spatial resolution by using data-constrained modeling [6], the permeability depends on the complex pore structures and the upstream pressure [7,8,9,10], permeability had a more significant influence on stable production time [11]. In some of these studies, the pore properties were quantitatively evaluated by using fractal theory, research suggests that coal has obvious fractal features at different scales [12,13,14,15], and fractal analysis is beneficial for better understanding the pore structure, methane adsorbability, and seepage ability of coal [16,17]. Although the effect of coal metamorphism on pore structure has been previously documented [18,19], no further research has been performed to investigate the variations in pore properties under isometamorphic conditions. Furthermore, it has been estimated in previous studies that the gas in place (GIP) in Qinshui Basin is approximately 3.28 × 10¹² m3. The maximum CBM production is approximately 1.85 × 10⁻² m3/s per well, and the average is 1.7 × 10⁻²–3.5 × 10⁻² m3/s per well. In addition, Qinshui Basin contains the earliest explored and recovered CBM and is the first commercial CBM gas field in China [20,21,22]. The well production rates of the sample wells around Sihe Colliery in southern Qinshui Basin are 1.6 × 10⁻²–5.3 × 10⁻² m3/s per well; however, the average well production rate of Zhaozhuang Colliery is 3.5 × 10⁻⁴ m3/s per well (Figure 1). Therefore, when conducting this type of research, it is important to consider the complex evolution and tectonic deformation history of coal-bearing basins [23] and it is necessary to target selection and exploitation of CBM.

2. Samples and Methods

2.1. Samples

Eleven coal samples were used from Sihe and Zhaozhuang Collieries in the southern Qinshui Basin to investigate the relationship between the pore properties of isometamorphic anthracite and the recoverability of CBM by focusing on the characteristics of the coal pores. The coal samples analyzed were obtained from the early Permian Shanxi formation (P11) No. 3 coal seam, which are typical collieries of the south Qinshui Basin in northern China. The selection of these two collieries was based on the following two considerations: (1) The region has been the research hot of China’s CBM, which is the first to be exploited for coal and has undergone the most successful commercialization. In addition, this high-rank anthracite coal reservoir has been considered to be a ‘forbidden zone’ by many CBM theories and anthracite CBM extraction methods; (2) The distance between Sihe Colliery and Zhaozhuang Colliery is approximately 45 km. Although the metamorphic grade, depth, seam thickness, cap, and other conditions are similar; however, the gas production is significantly different.
The No. 3 coal seam thickness of Sihe Colliery is approximately 6 m. Six coal samples were collected at 1 m intervals from the top to the bottom (SH-1–SH-6). That Zhaozhuang Colliery is approximately 5 m. Similarly, five coal samples were collected at 1 m intervals from the top to the bottom (ZZ-1–ZZ-5). To avoid the effect of different coal compositions and degree of deformation, coal samples were taken far away from the area effected by geological conformation, directly from the working faces of underground mines and with a weight about 10.0 kg each, and then were sent to the experimental institutions immediately after classification and packing. The maximum reflectance values of vitrinite—as well as the percentage composition of vitrinite, inertinite, exinite, and the mineral content—were measured. We conducted vitrinite reflectance tests, quantitative maceral and mineral statistical analysis, proximate analysis, and isothermal adsorption, LTNA, and MP measurements as well as field emission scanning by electron microscope (FESEM) on samples. General information regarding the coal samples is listed in Table 1.

2.2. Experimental Methods

Coal maceral analyses and vitrinite reflectance were performed on the same polished slabs using a MSP UV-VIS2000 Microspectrophotometer (3-Y International Co., Ltd. & American Greenville, Seattle, WA, USA), following International Standard ISO 7404.5-1994 [24] and ISO 7404.3: 2009 [25], respectively. Proximate analysis was performed using the Automatic Proximate Analysis Instrument SDLA-618 (Hunan Sundy technology Co., Ltd., Changsha, China), following ISO 17246-2010 test method [26]. Isothermal adsorption analysis was performed using the Automated Isothermal Gas Adsorption/Desorption Experiment System ISO-300 (Terra Tek, Inc., Salt Lake City, UT, USA), following China National Standards GB/T 19560-2008 [27]. The low-temperature nitrogen adsorption/desorption analysis was performed using a Micromeritics ASAP-2020 automated surface area analyzer (Micromeritics Instrument Co., Ltd., Norcross, GA, USA), following the ISO 15901.2-2006 test method [28]. MP measurements were performed using a Micromeritics Autopore IV 9500 Instrument (Micromeritics Instrument Co., Ltd.), following the ISO 15901-1-2005 test method [29]. The pore characteristics of coal were observed under Quanta 250FEG FESEM (FEI Company, Hillsboro, OR, USA) field emission scanning electron microscopy (FESEM, 10 KV) according to Chinese Petroleum Industry Standard SY/T 5162-1997 [30].

3. Results and Discussion

3.1. Pore Properties

In this study, the following Hotot criteria of the former USSR were adopted for coal porosity classification: large pores = diameter > 1000 nm, medium pores = diameter between 100 and 1000 nm, transition pores or minor pores = diameter between 10 and 100 nm, and micro pores = diameter < 10 nm. Transition and micro pores are also referred to as absorptive pores.
The experimental results of the coal samples are listed in Table 1. Our results showed that the average vitrinite reflectance values at Sihe and Zhaozhuang Collieries are 2.54% and 2.79%, respectively. The degree of metamorphism in the two collieries is similar, with both classified as high-rank anthracite coal. To conduct an in-depth study on the pore properties of the collieries while considering the space limits of this paper, SH-2 and ZZ-2 were selected for a comparison study.
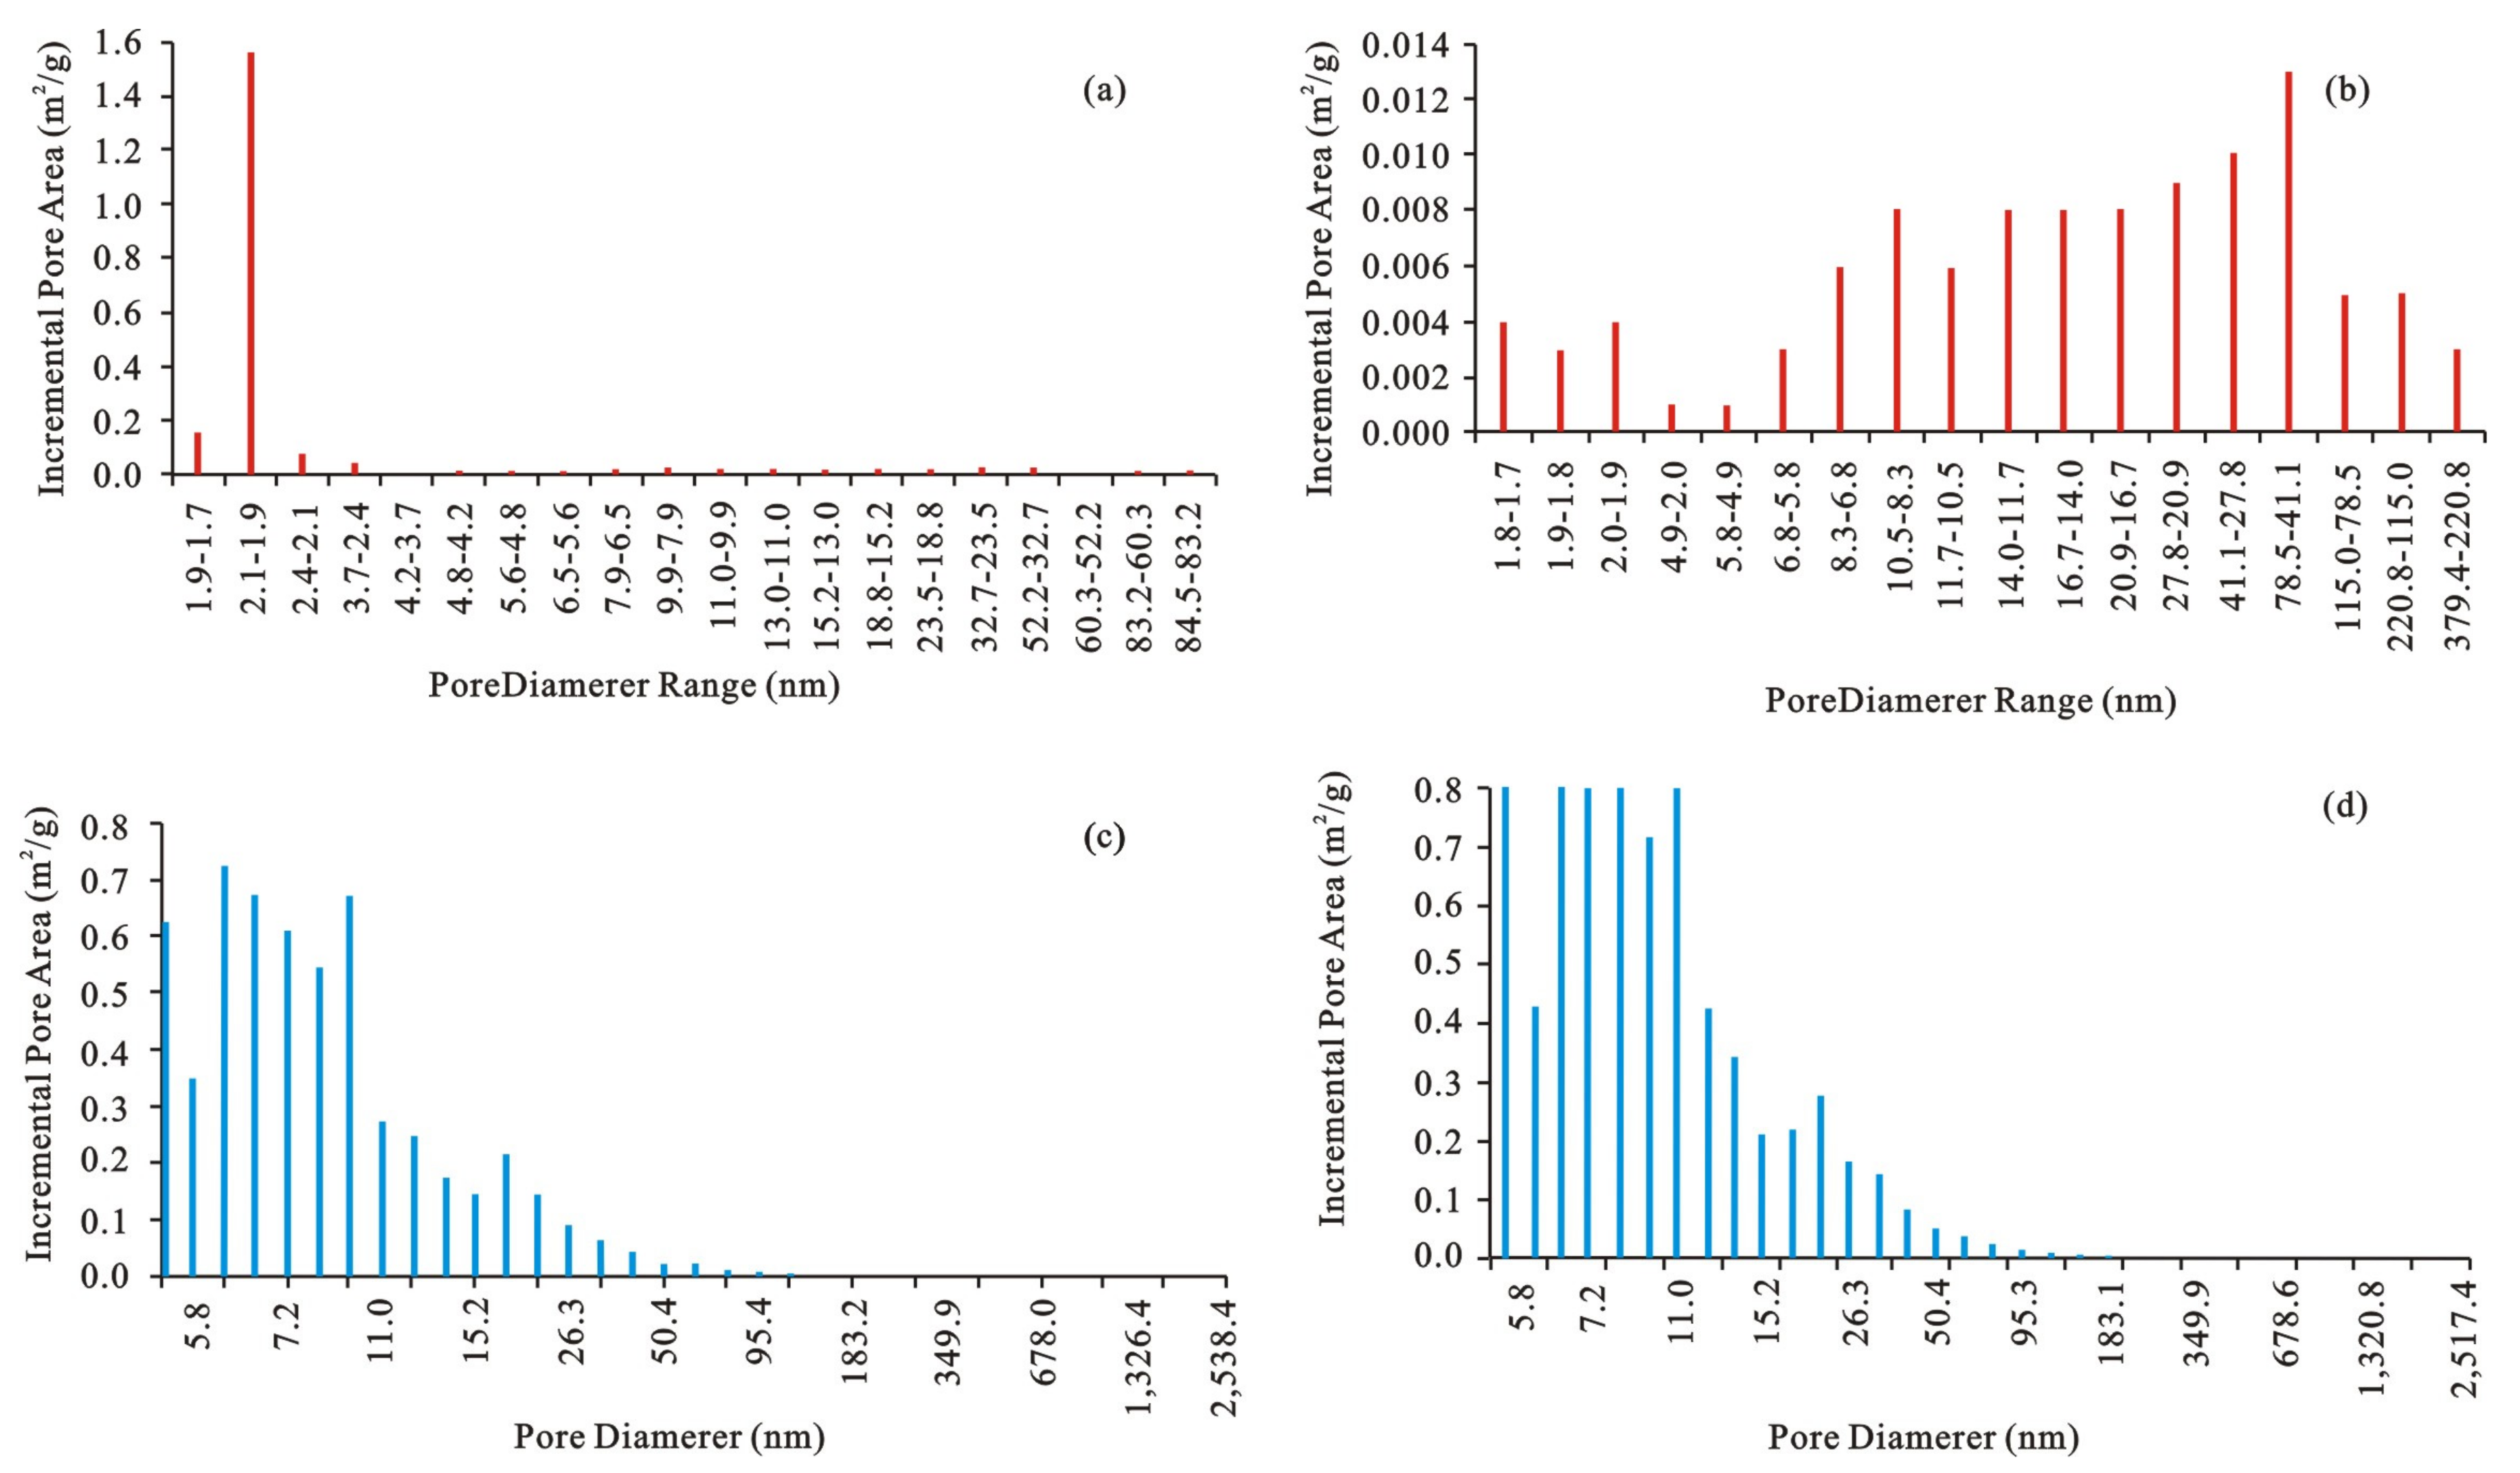
In terms of the pore size distribution, the samples from two collieries are both have predominantly micro and minor pores (Figure 2). In particular, the LTNA measurements showed no large- or medium-sized pores. In sample SH-2, the pore size is mainly 10 nm or less with a concentration of pores at less than 5 nm. In sample ZZ-2, the pore sizes are distributed mainly between 6.5 nm and 50 nm, and micro pores are more developed in SH-2 than in ZZ-2. Thus, the coal reservoir in Sihe Colliery has more gas adsorption, which was further confirmed by isothermal adsorption experiments (Table 1).
In terms of specific surface area and pore volume, the specific surface area measured by LTNA of SH-2 (ZZ-2) was 16.95 m2/g (0.39 m2/g). Although the specific surface area of samples from Sihe Colliery in general was significantly larger than that from Zhaozhuang Colliery, the pore volumes were similar. Under mercury porosimetry, the average specific surface area of samples from Zhaozhuang Colliery was 6.97 m2/g, which is slightly larger than that of 6.26 m2/g for those from Sihe Colliery. However, the difference in pore volume between the two collieries was negligible.
The difference in specific surface area between the two methods occurred mainly because MP predominantly measures large pores, whereas LTNA is more effective for measuring adsorptive pores and medium pores. Our results confirmed that the main contribution to the specific surface area was from adsorptive pores. To further illustrate this observation, the specific surface area ratio and pore volume ratio of pores at different size intervals are plotted in Figure 3. The adsorptive pores accounted for more than 88% of the specific surface area and constitute the main sites for gas adsorption. The contributions toward the pore volume differed among test methods. For LTNA (MP), the main contribution was from small (large) pores, accounting for 49.4–72.1% (35.7–62.2%) of the pore volume.
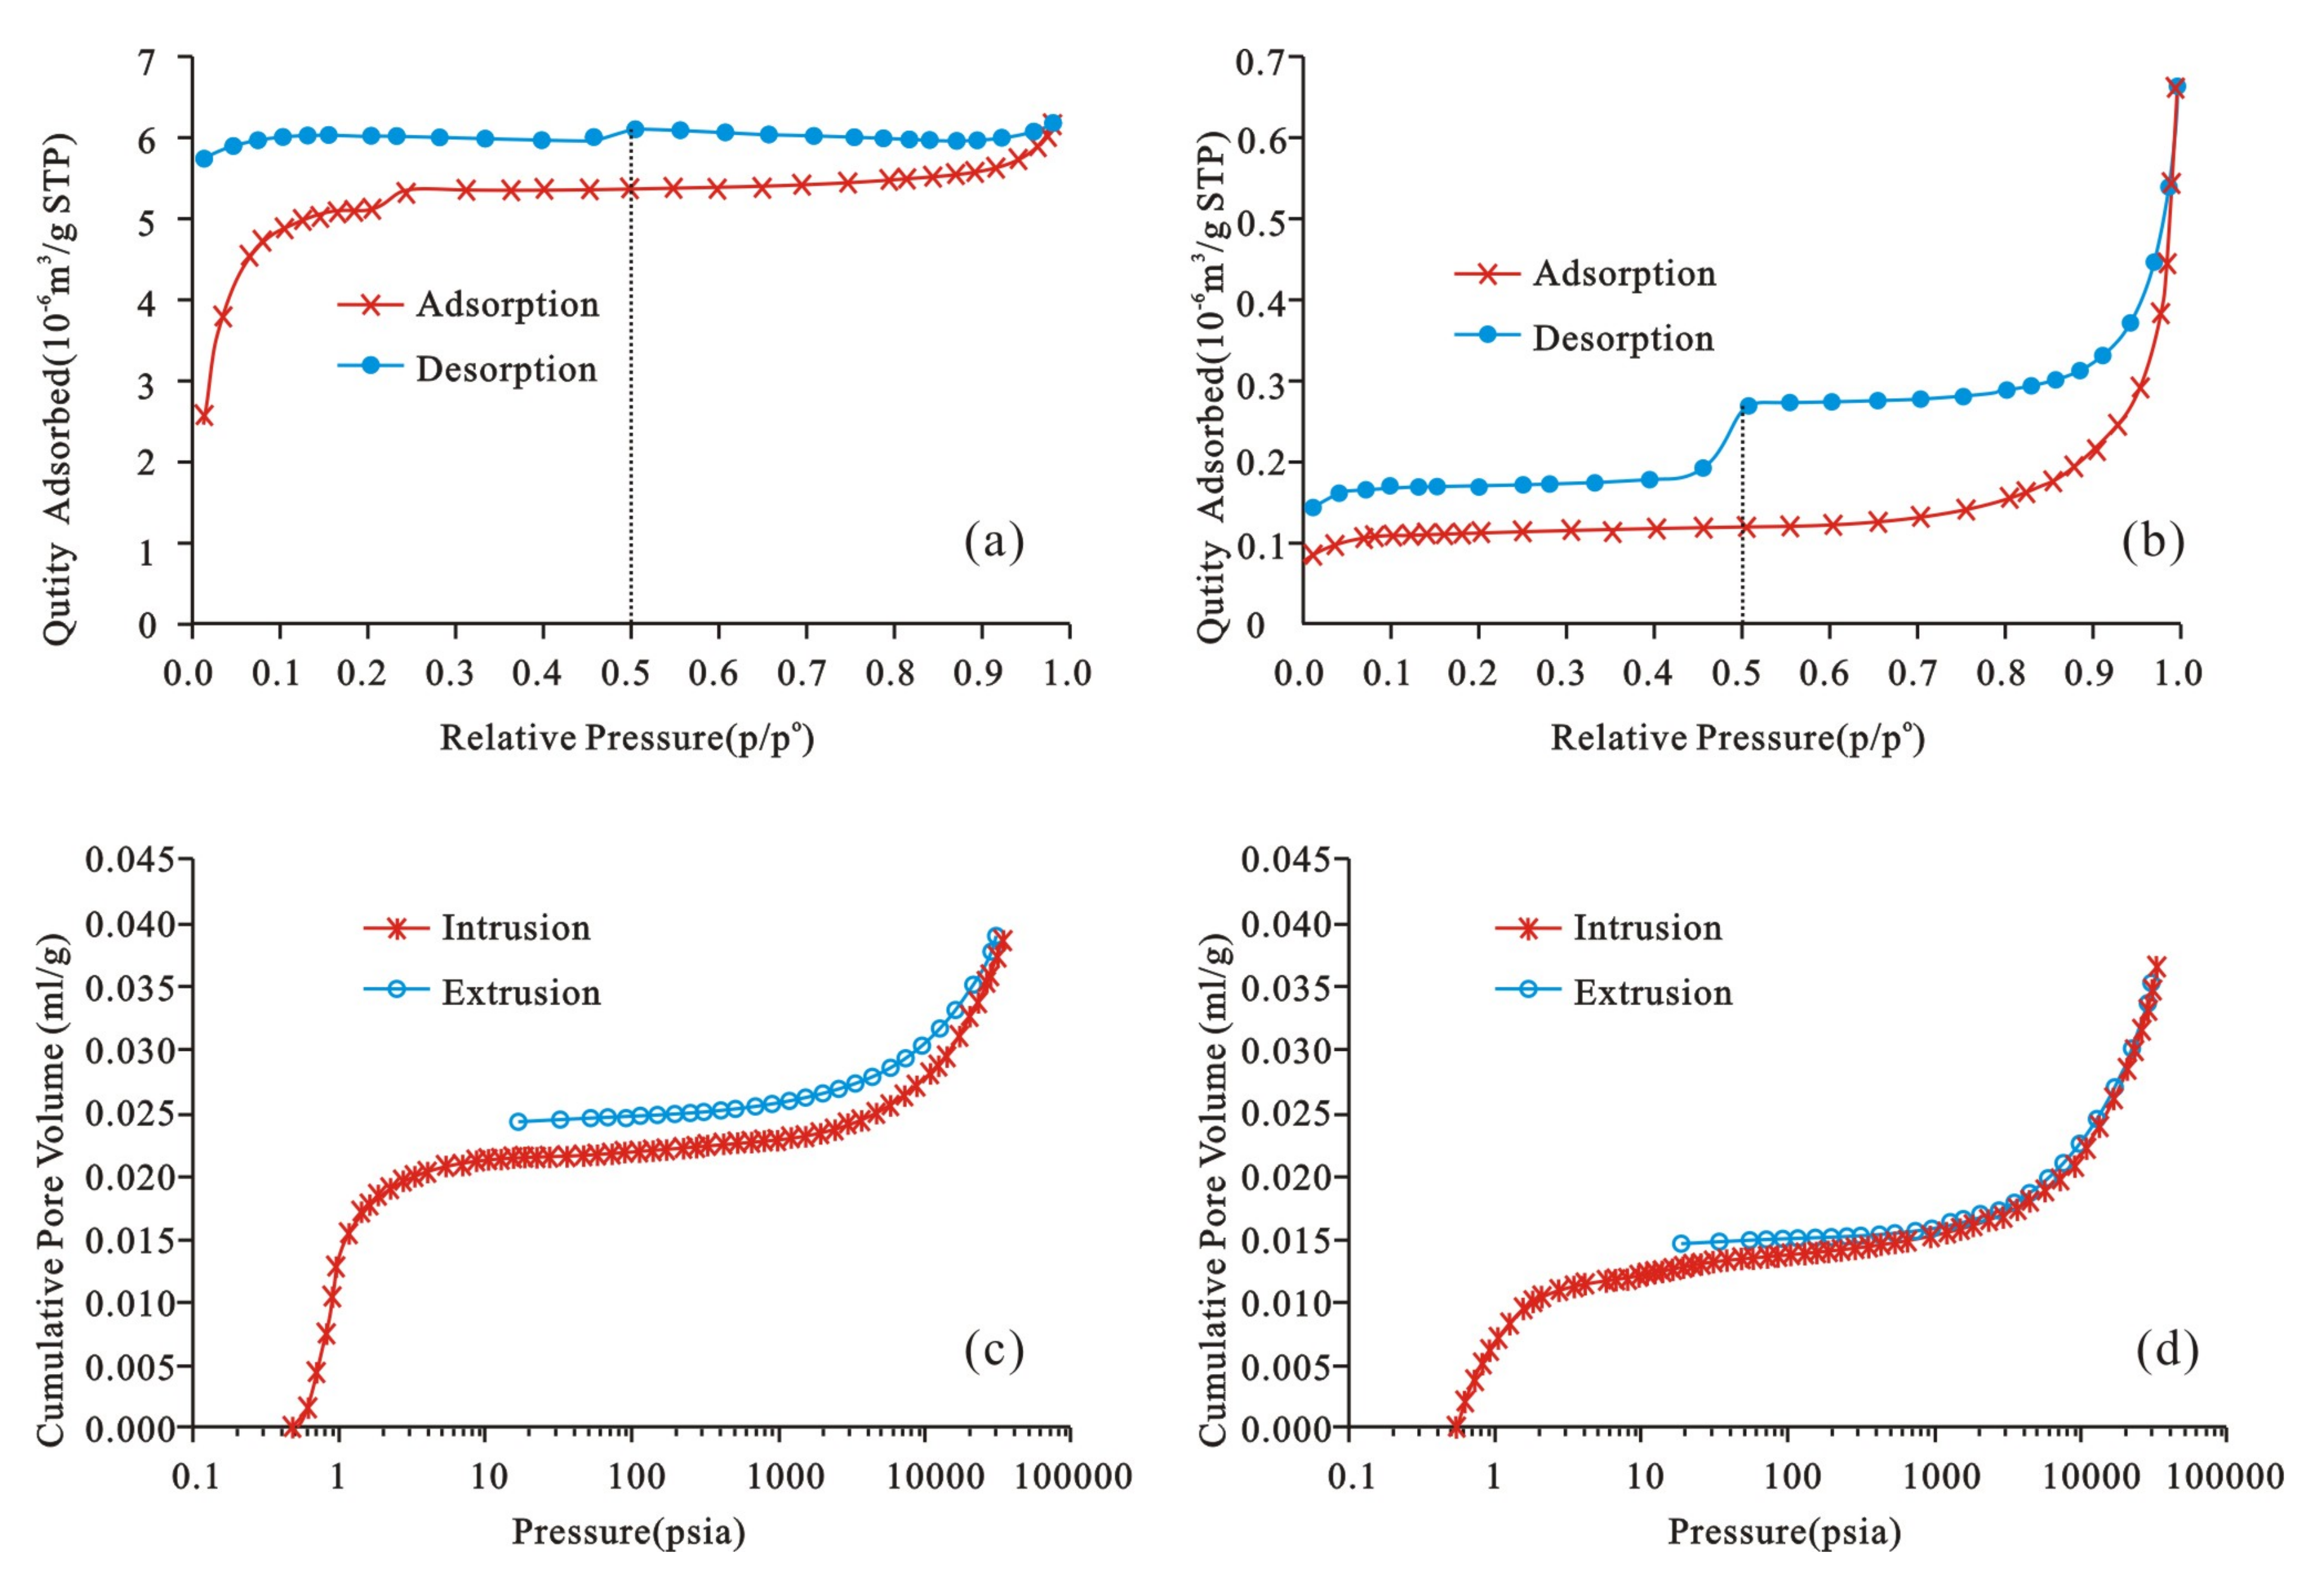
The shapes of adsorption and MP curves reflect the geometrical features of the pores. In fact, coal pores have various shapes that rarely match a typical geometrical shape. For the convenience of further discussion, we simplify pore shapes into several geometric models so that pore shape and distribution can be analyzed on the basis of the shape of the adsorption and MP curves. A sharp increase in adsorption in the SH-2 adsorption curve (Figure 4a) was noted when the relative pressure (P0/P) (P0 represents the gas saturation pressure, P represents equilibrium pressure)was between 0–0.1. This value is significantly larger than that for ZZ-2 samples (Figure 4b), which indicates that SH-2 coal samples contain a large number of micro pores. However, when the P0/P was close to 1, the adsorption increased dramatically in the ZZ-2 coal samples. This phenomenon was not apparent in SH-2, which indicates the development of larger pores in ZZ-2 than in SH-2. The results of MP are consistent with those from LTNA.
In addition, a clear inflection point in the ZZ-2 coal sample curve was noted at P0/P = 0.5. According to the Kelvin equation, the pore size at this point corresponds to a pore diameter of 4 nm, suggesting the existence of gas impermeable pores closed at one end, or narrow-neck (inkpot) pores at a pore size of 4 nm in coal samples from Zhaozhuang Colliery. Compared with ZZ-2, the mercury ejection curve of SH-2 deviated significantly from the mercury intrusion curve (Figure 4c,d), whereas the ejection and intrusion curves of ZZ-2 were almost superimposed on each other without obvious curve hysteresis. This result reflects the fact that the majority of pores in the Sihe Colliery are open pores and that those in Zhaozhuang Colliery are closed and semi-enclosed pores.

3.2. Fractal Characteristics of Coal Pores

The fractal geometry method has become an important method for quantitative description of irregular shapes. Many calculation methods in use are based on the fractal dimensions of coal adsorption pores; however, the Frenkel–Halsey–Hill (FHH) fractal method has been proven to be the most effective [14,19,31,32,33,34]. The classical FHH equation is
ln ( V / V 0 ) = constant + A [ ln ( ln ( P 0 / P ) ) ]
Either
A = ( D 3 ) / 3
Or
A = D 3
where V represents the volume of the adsorbing molecule at the equilibrium pressure P; V0 represents the monolayer volume calculated by using the BET equation; A represents the power law exponent, which is dependent on the fractal dimension, D, and the mechanism of adsorption; and P0 represents the gas saturation pressure.
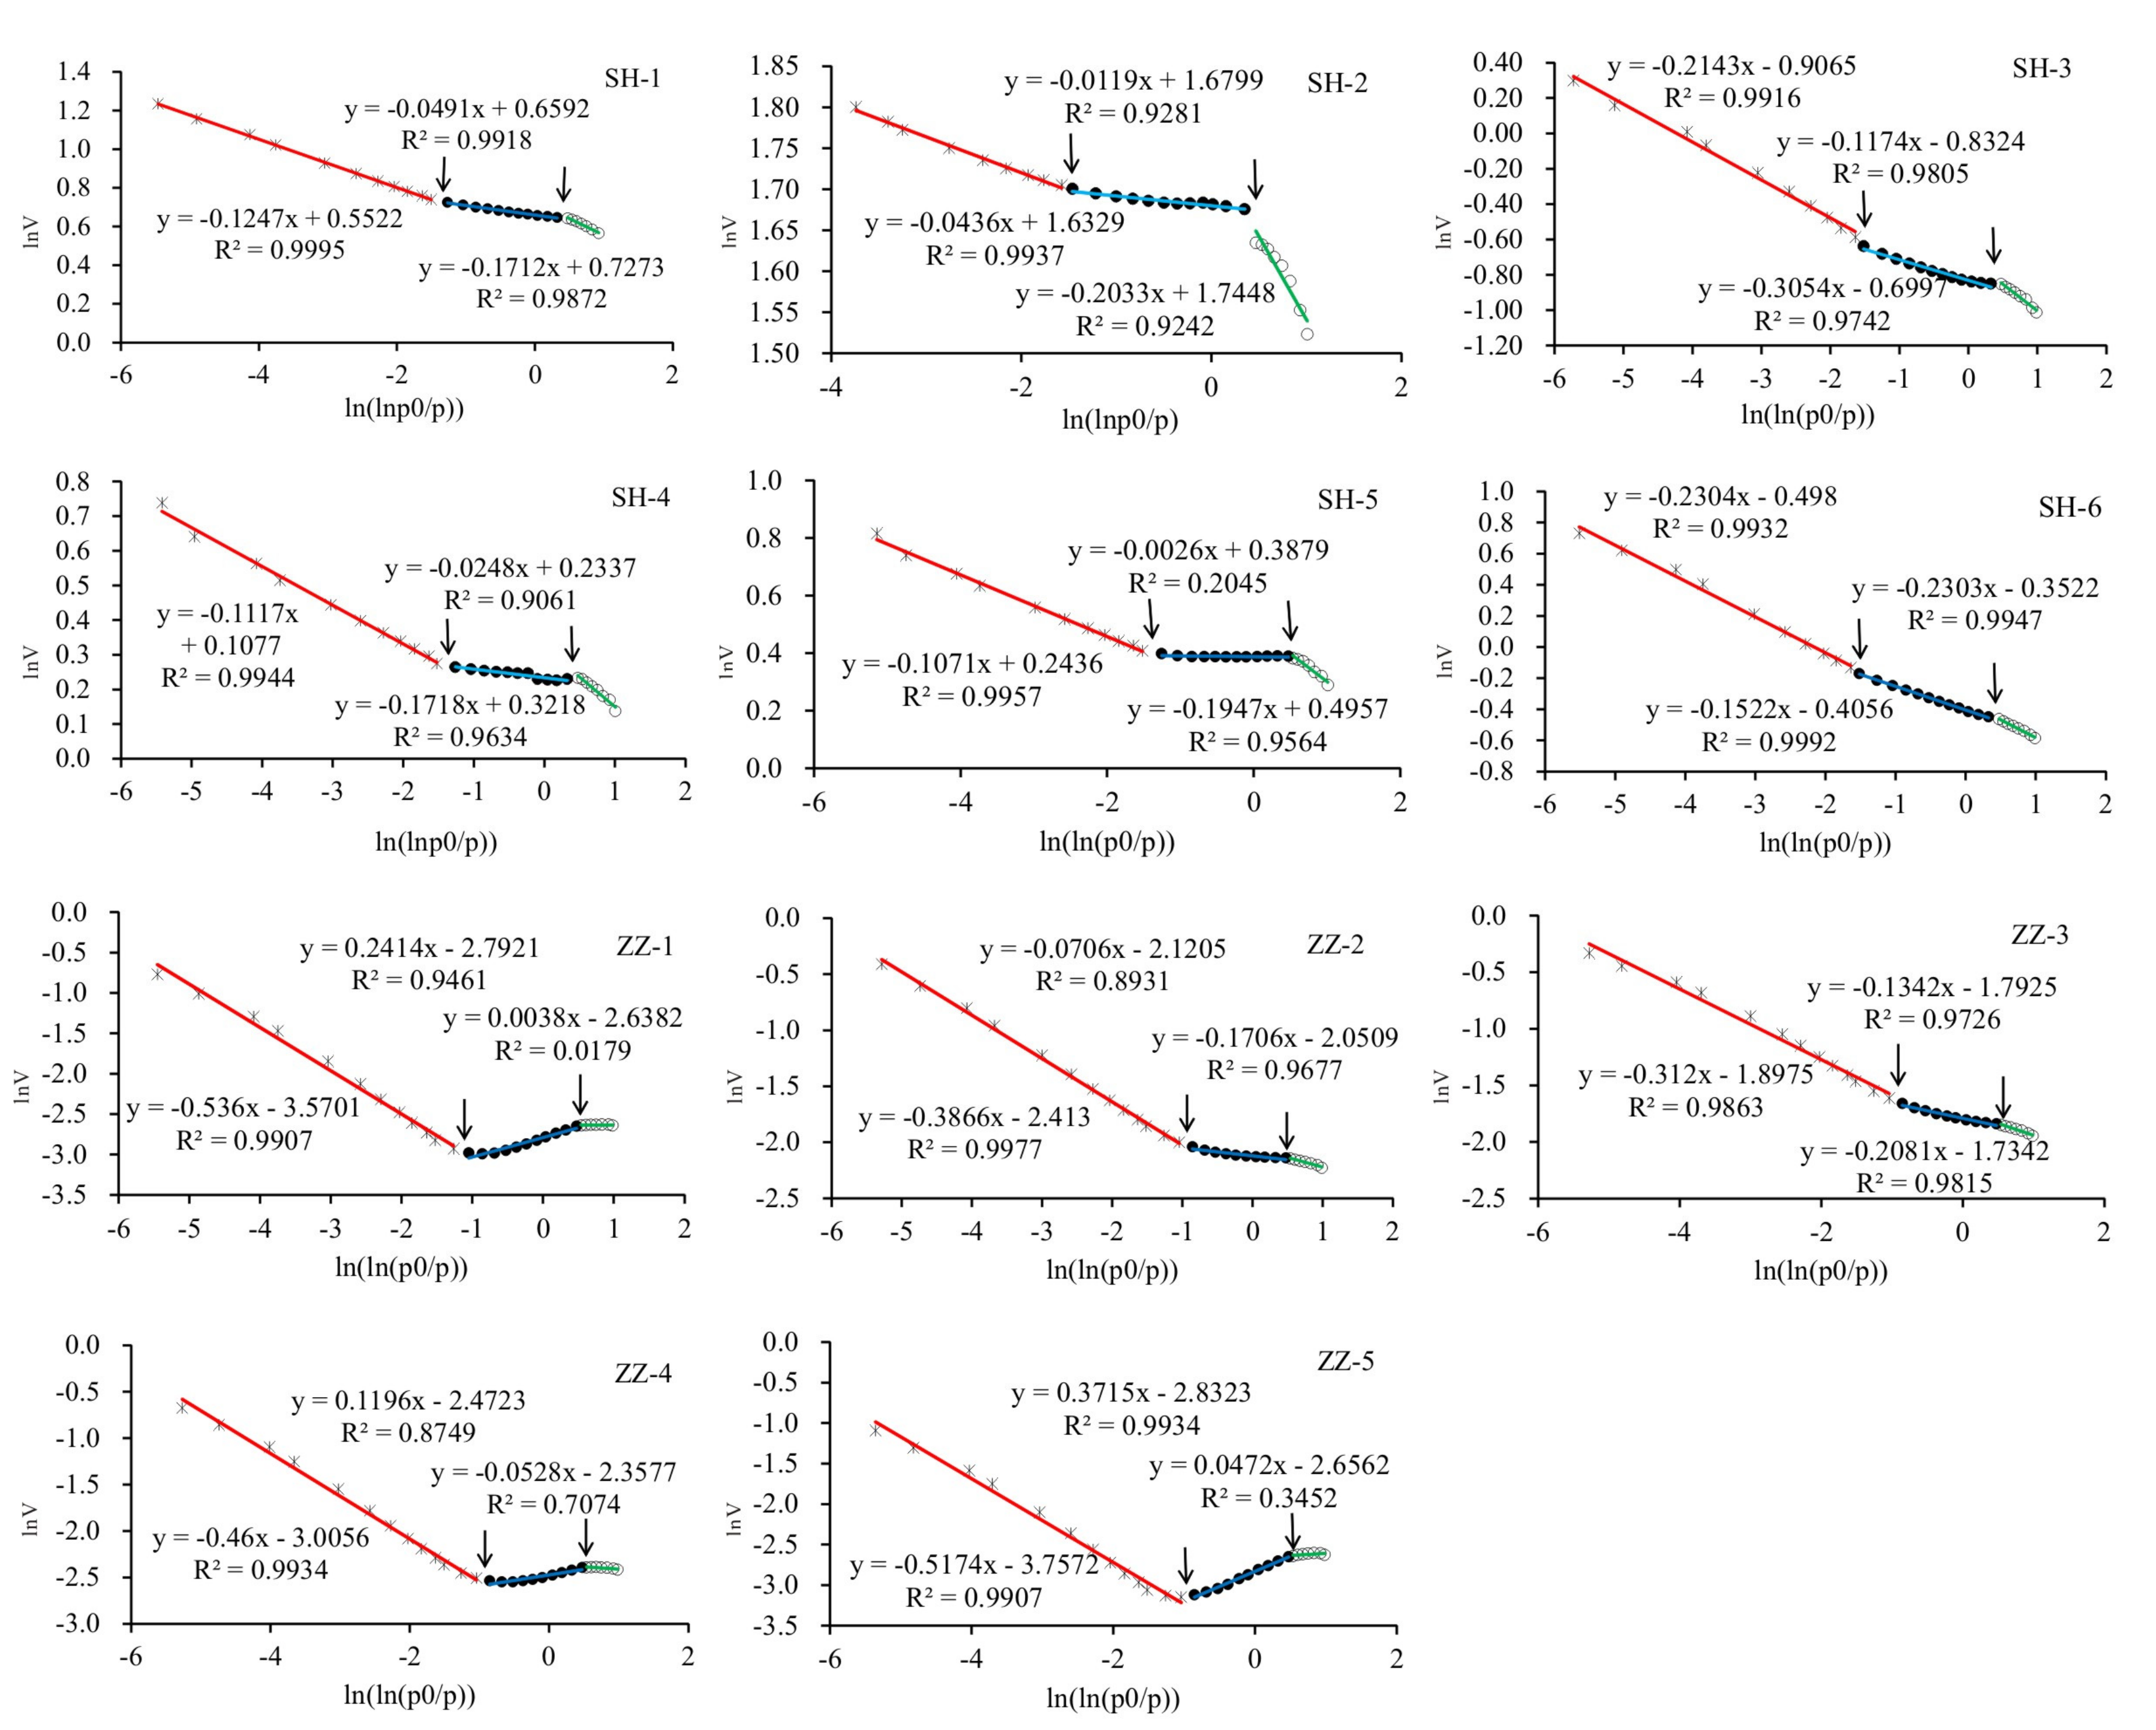
According to Equation (1), if fractal features are present in pores, lnV must have a linear relationship with ln(ln(P0/P)). The scatter plot of lnV versus ln(ln(P0/P)) can then be plotted on the basis of data from LTNA and linear fitting can be performed. The slope of the straight line should be equal to A, and D can be calculated from A. It should be noted that two different formulas are used for calculating D from A: Equations (2) and (3). These two equations correspond to different situations. Equation (2) is valid for a membrane/gas interface controlled by van der Waals force, and Equation (3) is suitable for an interface controlled by liquid–gas tension [35]. However, the specific choice of equation is determined by the fitted curve and the actual situation of the coal.
According to Figure 5 and Table 2, the following findings are noted:
(1)
The lnV values of coal samples from Sihe Colliery were mostly greater than 0, whereas the lnV values of coal samples from Zhaozhuang Colliery were mostly less than 0. This suggests that the specific surface area of Sihe coal samples is generally larger than that of Zhaozhuang coal samples.
(2)
The curve simulation showed three curve sections, indicating that the fractal features of the pores differ among these three sections. Therefore, we performed separate linear fitting. The fractal boundary points of samples from Sihe Colliery were at ln(ln(P0/P)) = −1.52 and ln(ln(P0/P)) = 0.54, respectively. The Kelvin equation describes the change in vapor pressure due to a curved liquid–vapor interface. The vapor pressure at a convex curved surface is higher than that at a flat surface. It can be used for determination of pore size distribution of a porous medium using adsorption porosimetry. According to the Kelvin equation, the two boundary points correspond to pore diameters of approximately 1 nm and 9 nm, respectively. For samples from Zhaozhuang Colliery, the boundary points were located at pore diameters of 7 nm and 1 nm, respectively. Moreover, when ln(ln(P0/P)) > 1, i.e., the pore diameter is less than 0.7 nm, the pores did not exhibit fractal features.
(3)
When D was calculated by using equations A = ( D 3 ) / 3 and A = D 3 , the D values calculated from formula A = ( D 3 ) / 3 were small. Many of these values were less than 2, which is not realistic. Therefore, in this study, the D value was calculated by using formula A = D 3 ; the results are listed in Table 2. Pores with diameters greater than 9 nm and 7 nm for samples from Sihe and Zhaozhuang Collieries, respectively, exhibited obvious fractal features and a correlation coefficient is approximately equal to 1; pores of less than 1 nm showed no obvious fractal features. Second, the fractal dimensions for samples from Sihe and Zhaozhuang Collieries are between 2.5 and 3.4. The fractal dimensions of pores with diameters of 1–9 nm (7 nm) were significantly larger than those of pores larger than 9 nm (less than 1 nm) in diameter for Sihe (Zhaozhuang) Colliery. This indicates that micro pores contribute more to the specific surface area. Furthermore, the overall fractal dimension of samples from Sihe Colliery was greater than that of samples from Zhaozhuang Colliery, suggesting that the roughness of coal pores in Sihe Colliery is greater than that in Zhaozhuang Colliery. This also indirectly explains why the coal in Sihe Colliery has a larger specific surface area.

3.3. Pore Characteristics and CBM Recoverability

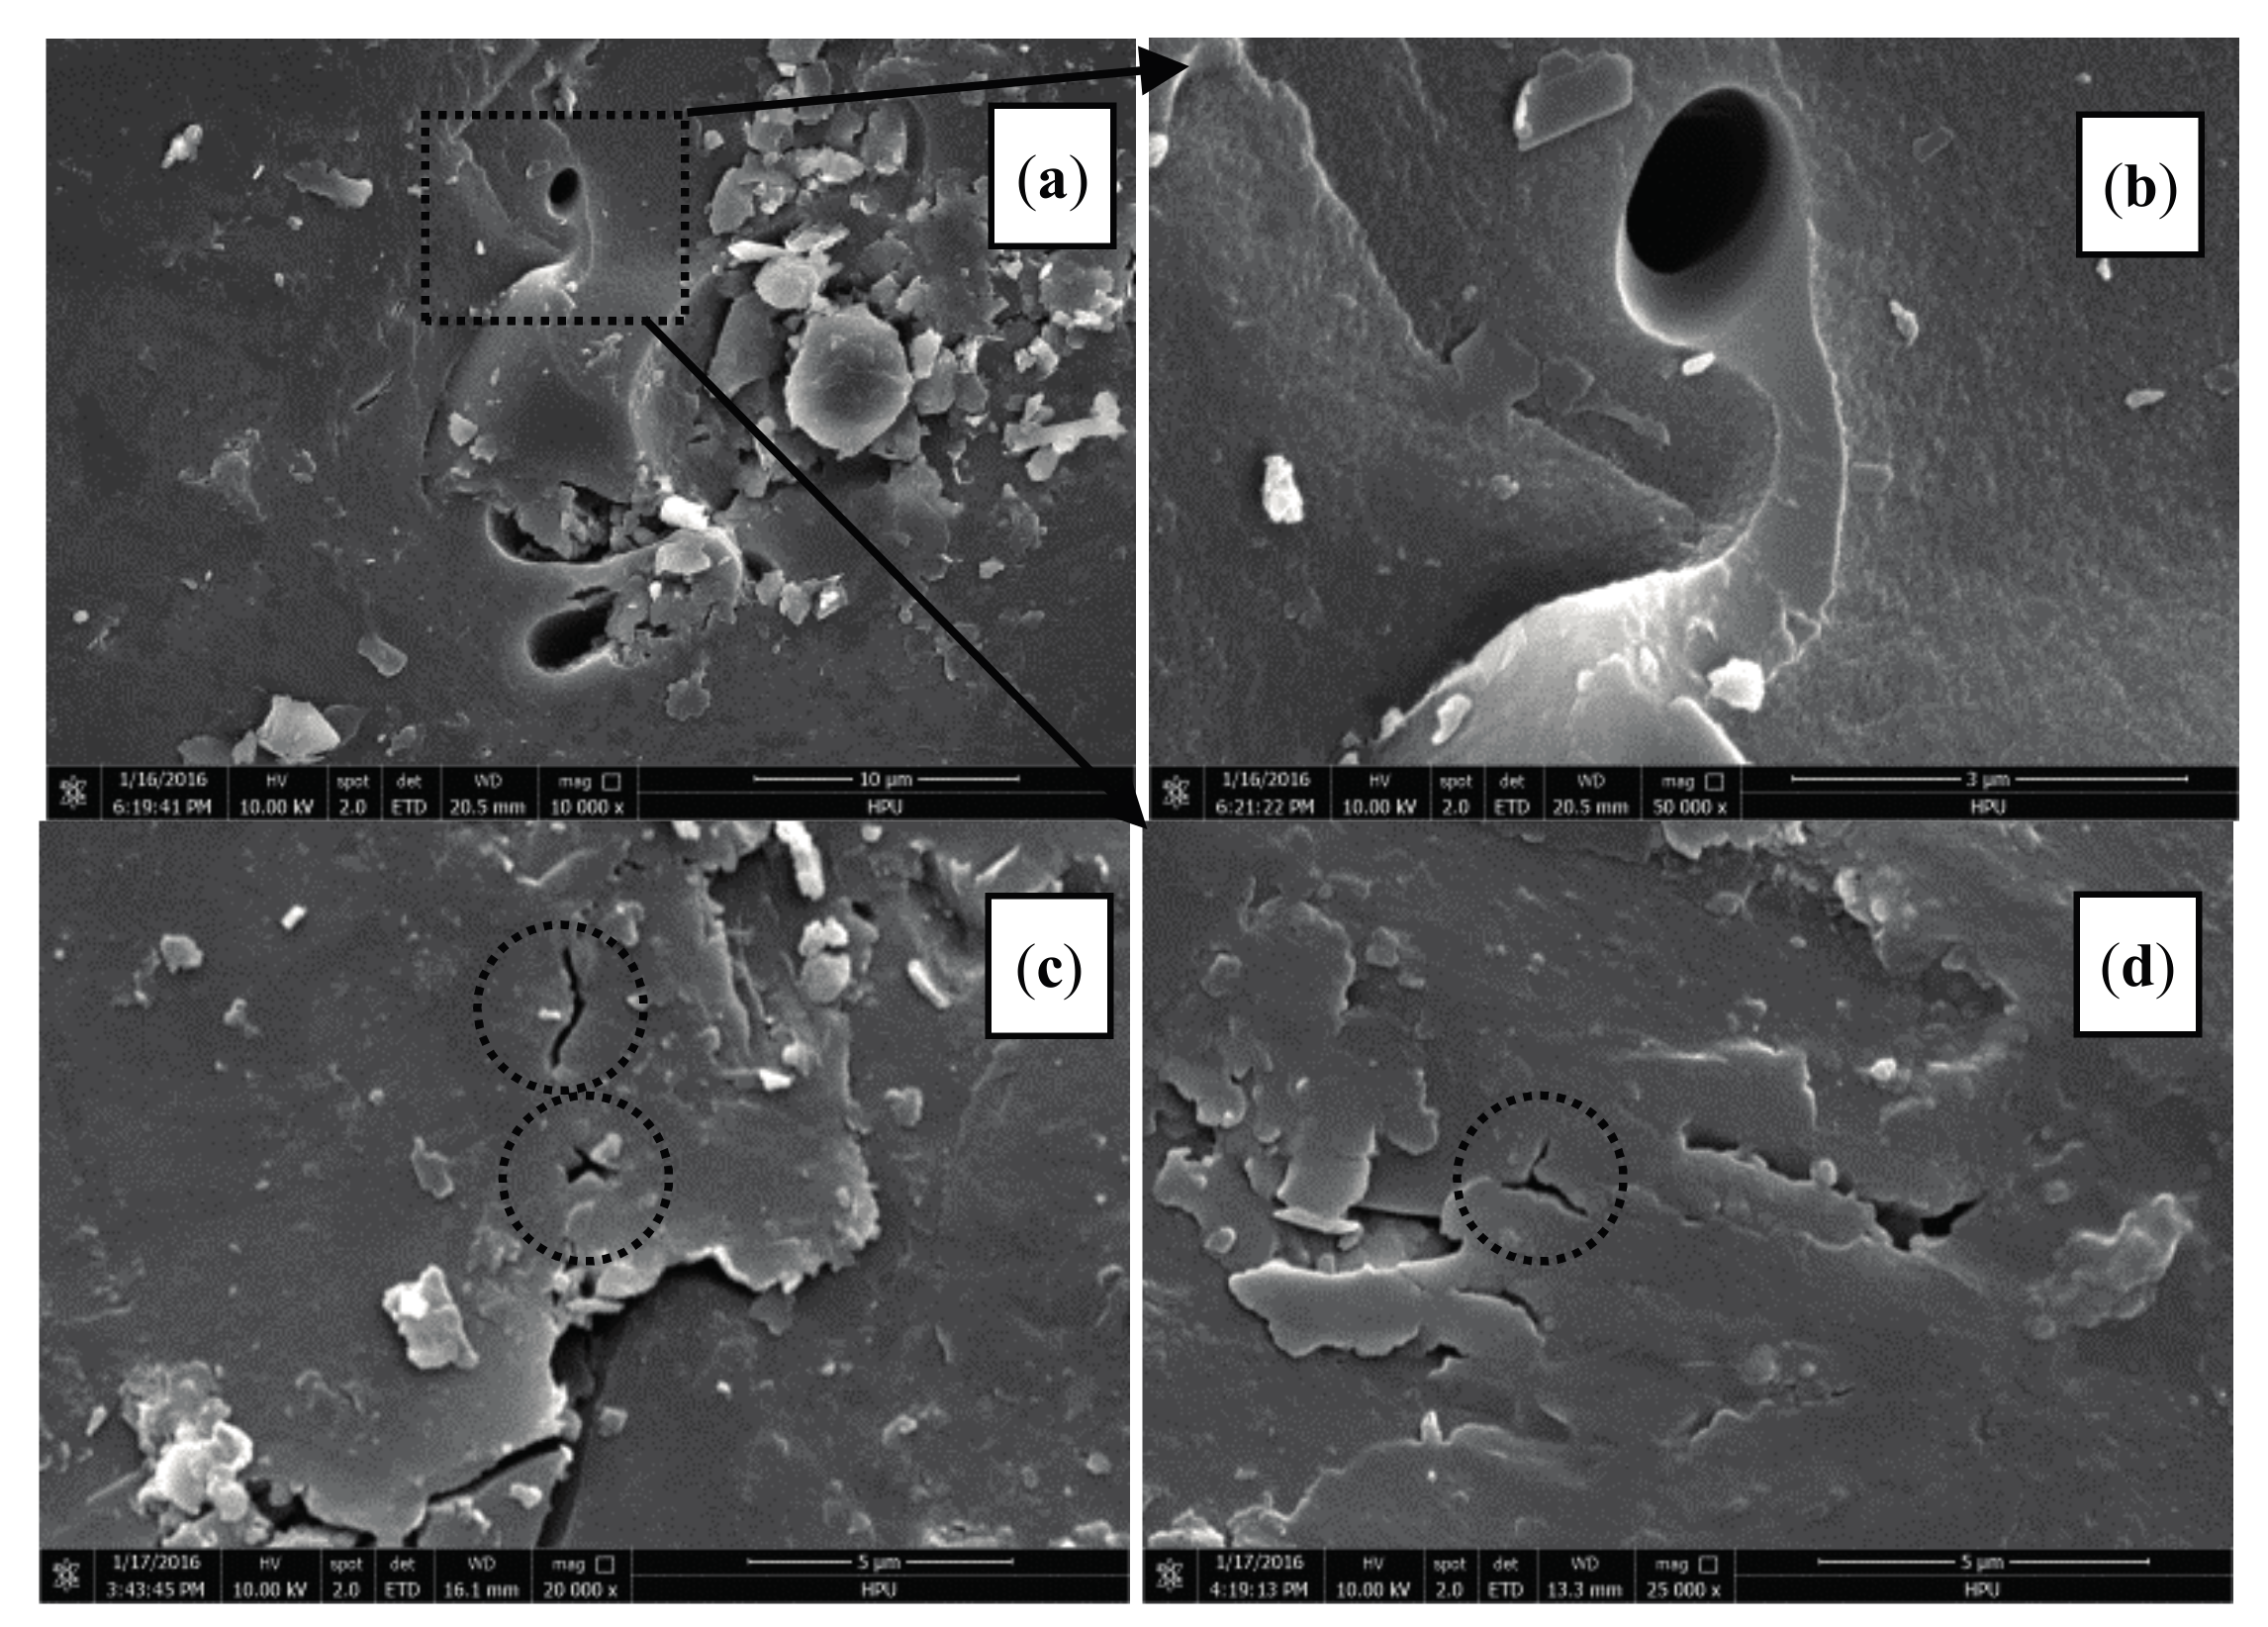
Owing to the influence of coalification, maceral content, mineral content, tectonic stress, differential compaction, and other parameters, the pore characteristics of different coals show significant differences [32]. Moreover, pore characteristics are important factors that affect the recoverability of CBM [3,36,37,38]. The geological background, including metamorphic grade, geologic age, and depth of Sihe and Zhaozhuang Collieries No. 3 coals were similar in this study; however, the pore characteristics of these two collieries differed significantly. The analytical results of the pore characteristics determined by using LTNA, MP, and FESEM all demonstrated that the pores in Sihe Colliery are mainly opened spherical or ellipsoidal in shape. Moreover, these pores are interconnected and appear in groups with clear signs of flow (Figure 6a,b). These types of pores are conducive to the migration and accumulation of CBM. In Zhaozhuang Colliery, the pores are mainly Y-shaped, V-shaped, neck shaped (Figure 6c,d), and ink bottle shaped with poor connectivity. Thus, these pores are not conducive to gas seepage.

4. Conclusions

In this study, a variety of tests was performed to analyze the detailed pore characteristics of isometamorphic anthracite. The results are summarized as follows:
(1)
The majority of pores in Sihe and Zhaozhuang Collieries are adsorption type. The pore size of samples from Sihe (Zhaozhuang) Colliery was predominantly less than 5 nm (6.5–50 nm). The micro pores of samples from Sihe Colliery were significantly more developed than those from Zhaozhuang Colliery, and the specific surface area in Sihe Colliery was significantly larger than that in Zhaozhuang Colliery, which further confirmed that adsorption pores contributed the most to the specific surface area, at more than 88%. However, for different experimental methods, pores of different sizes showed different contributions to pore volume. Low-temperature nitrogen adsorption analysis revealed that small pores accounted for 49.4–72.1% of the pore volume, whereas mercury porosimetry revealed that large pores accounted for 35.7–62.2% of the pore volume.
(2)
On the basis of FHH fractal theory, the lnV versus ln(ln(P0/P)) scatter plot revealed that pore features had two clear boundaries corresponding to 1 nm and either 9 nm Sihe Colliery samples or 7 nm for Zhaozhuang Colliery samples. The dimension calculation formula, A = D − 3, was shown to be more suitable for the analysis. The calculation results showed that the fractal dimensions in Sihe and Zhaozhuang Collieries were between 2.5 and 3.4. The fractal dimensions of pores with sizes between 1 nm and 9 nm (or 7 nm) were significantly larger than those of pores with sizes greater than 9 nm or less than 1 nm. The overall fractal dimension was larger in Sihe Colliery than that in the Zhaozhuang Colliery.
(3)
The pores of samples from Sihe Colliery were mainly open with spherical or ellipsoidal shapes and were highly connected, making them conducive to the migration and accumulation of CBM. For samples from Zhaozhuang Colliery, the pores were mainly Y-shaped, V-shaped, neck shaped, and ink bottle shaped with poor connectivity.

Acknowledgments

This work was supported by the National Natural Science Foundation of China (Grant No. 41402094; 41502108), the Key Scientific and Technological Project of Coal Fund of Shanxi Province (Grant No. MQ2014-03), CBM Union Foundation of Shanxi Province (Grant No. 2015012010), the Program for Innovative Research Team (in Science and Technology) in University of Henan Province (Grant No. 17IRTSTHN025), and the Doctoral Fund Project of Henan Polytechnic University (Grant No. B2011-013). Special thanks are given to the reviewers for their valuable advice and comments on the manuscript.

Author Contributions

All authors contributed to the research in the paper. Bin Hu and Baoyu Wang put forward the research direction; Di Gao searched the literature; Di Gao and Meng Li analyzed the data and wrote the paper; Jianguo Liu treated samples and performed one part of the experiments.

Conflicts of Interest

The authors declare no conflict of interest.

References

  1. Hotot, B.B. Coal and Gas Outburst; China Coal Industry Publishing House: Beijing, China, 1961; pp. 23–35. [Google Scholar]
  2. Clarkson, C.R.; Rahmanian, M.; Kantzas, A.; Morad, K. Relative permeability of CBM reservoirs: Controls on curve shape. Int. J. Coal Geol. 2011, 88, 204–217. [Google Scholar] [CrossRef]
  3. Moore, T.A. Coalbed methane: A review. Int. J. Coal Geol. 2012, 101, 36–81. [Google Scholar] [CrossRef]
  4. Zhai, C.; Qin, L.; Liu, S.M.; Xu, J.Z.; Tang, Z.Q.; Wu, S.L. Pore structure in coal: Pore evolution after cryogenic freezing with cyclic liquid nitrogen injection and its implication on coalbed methane extraction. Energy Fuels 2016, 30, 6009–6020. [Google Scholar] [CrossRef]
  5. Pan, J.N.; Zhu, H.T.; Hou, Q.L.; Wang, H.C.; Wang, S. Macromolecular and pore structures of Chinese tectonically deformed coal studied by atomic force microscopy. Fuel 2015, 139, 94–101. [Google Scholar] [CrossRef]
  6. Wang, H.P.; Yang, Y.S.; Yang, J.L.; Nie, Y.H.; Jia, J.; Wang, Y.D. Evaluation of Multiple-Scale 3D Characterization for Coal Physical Structure with DCM Method and Synchrotron X-ray CT. Sci. World J. 2015, 2015, 414262. [Google Scholar] [CrossRef] [PubMed]
  7. Amooie, M.A.; Soltanian, M.R.; Xiong, F.; Dai, Z.; Moortgat, J. Mixing and spreading of multiphase fluids in heterogeneous bimodal porous media. Geomechan. Geophys. Geo-Energy Geo-Resour. 2017, 3, 225–244. [Google Scholar] [CrossRef]
  8. Ranathunga, A.S.; Perera, M.S.A.; Ranjith, P.G.; Silva, G.P.D.D. A macro-scale view of the influence of effective stress on carbon dioxide flow behaviour in coal: An experimental study. Geomechan. Geophys. Geo-Energy Geo-Resour. 2017, 3, 13–28. [Google Scholar] [CrossRef]
  9. Xue, Y.; Ranjith, P.G.; Gao, F.; Zhang, D.; Cheng, H.; Chong, Z.; Hou, P. Mechanical behaviour and permeability evolution of gas-containing coal from unloading confining pressure tests. J. Nat. Gas Sci. Eng. 2017, 40, 336–346. [Google Scholar] [CrossRef]
  10. Wei, C.T.; Zou, M.J.; Sun, Y.M.; Cai, Z.X.; Qi, Y. Experimental and applied analyses of particle migration in fractures of coalbed methane reservoirs. J. Nat. Gas Sci. Eng. 2015, 23, 399–406. [Google Scholar] [CrossRef]
  11. Lai, F.P.; Li, Z.P.; Meng, Y.; Yang, Z.H.; Guo, Z.Z.; Li, H. Dynamic prediction of coalbed methane well considering pseudo-steady state diffusion. Int. J. Oil Gas Coal Technol. 2016, 11, 264. [Google Scholar] [CrossRef]
  12. Yao, Y.B.; Liu, D.M.; Tang, D.Z.; Tang, S.H.; Huang, W.H. Fractal characterization of adsorption-pores of coals from North China: An investigation on CH4 adsorption capacity of coals. Int. J. Coal Geol. 2008, 73, 27–42. [Google Scholar] [CrossRef]
  13. Zhang, S.H.; Tang, S.H.; Tang, D.Z.; Huang, W.H.; Pan, Z.J. Determining fractal dimensions of coal pores by FHH model: Problems and effects. J. Nat. Gas Sci. Eng. 2014, 21, 929–939. [Google Scholar] [CrossRef]
  14. Sun, W.J.; Feng, Y.Y.; Jiang, C.F.; Chu, W. Fractal characterization and methane adsorption features of coal particles taken from shallow and deep coalmine layers. Fuel 2015, 155, 7–13. [Google Scholar] [CrossRef]
  15. Pan, J.N.; Wang, K.; Hou, Q.L.; Niu, Q.H.; Wang, H.C.; Ji, Z.M. Micro-pores and fractures of coals analysed by field emission scanning electron microscopy and fractal theory. Fuel 2016, 164, 277–285. [Google Scholar] [CrossRef]
  16. Fu, H.J.; Tang, D.Z.; Xu, T.; Xu, H.; Tao, S.; Li, S.; Yin, Z.Y.; Chen, B.L.; Zhang, C.; Wang, L.L. Characteristics of pore structure and fractal dimension of low-rank coal: A case study of lower Jurassic Xishanyao coal in the southern Junggar basin, NW China. Fuel 2017, 193, 254–264. [Google Scholar] [CrossRef]
  17. Vinod, A.M.; Mollika, B.; Atul, K.V.; Alka, D.K.; Subhashree, M.; Bhagwan, D.S. Fractal and pore dispositions of coal seams with significance to coalbed methane plays of east bokaro, Jharkhand, India. J. Nat. Gas Sci. Eng. 2017, 38, 412–433. [Google Scholar] [CrossRef]
  18. Crosdale, P.J.; Beamish, B.B.; Valix, M. Coalbed methane sorption related to coal composition. Int. J. Coal Geol. 1998, 35, 147–158. [Google Scholar] [CrossRef]
  19. Fan, J.J.; Ju, Y.W.; Hou, Q.L.; Tan, J.Q.; Wei, M.M. Pore structure characteristics of different metamorphic-deformed coal reservoirs and its restriction on recovery of coalbed methane. Earth Sci. Front. 2010, 17, 325–335. [Google Scholar]
  20. Su, X.B.; Lin, X.Y.; Liu, S.B.; Zhao, M.J.; Song, Y. Geology of coalbed methane reservoirs in the Southeast Qinshui Basin of China. Int. J. Coal Geol. 2005, 62, 197–210. [Google Scholar] [CrossRef]
  21. Cai, Y.D.; Liu, D.M.; Yao, Y.B.; Li, J.Q.; Qiu, Y.K. Geological controls on prediction of coalbed methane of No. 3 coal seam in Southern Qinshui Basin, North China. Int. J. Coal Geol. 2011, 88, 101–112. [Google Scholar] [CrossRef]
  22. Fu, H.J.; Tang, D.Z.; Xu, H.; Xu, T.; Chen, B.L.; Hu, P.; Zheng, Y.Y.; Wu, P.; He, G.J. Geological characteristics and CBM exploration potential evaluation: A case study in the middle of the southern Junggar basin, NW China. J. Nat. Gas Sci. Eng. 2016, 30, 557–570. [Google Scholar] [CrossRef]
  23. Bao, Y.; Wei, C.T.; Neupane, B. Generation and accumulation characteristics of mixed coalbed methane controlled by tectonic evolution in Liulin CBM field, eastern Ordos basin, China. J. Nat. Gas Sci. Eng. 2015, 28, 262–270. [Google Scholar] [CrossRef]
  24. International Organization for Standardization. Methods for the Petrographic Analysis of Bituminous Coal and Anthracite-Part 5: Method of Determining Microscopically the Reflectance of Vitrinite; ISO 7404.5-1994; ISO: Geneva, Switzerland, 1994. [Google Scholar]
  25. International Organization for Standardization. Methods for the Petrographic Analysis of Coals—Part 3: Method of Determining Maceral Group Composition; ISO 7404.3:2009; ISO: Geneva, Switzerland, 2009. [Google Scholar]
  26. International Organization for Standardization. Coal—Proximate Analysis; ISO 17246:2010; ISO: Geneva, Switzerland, 2009. [Google Scholar]
  27. Gigabyte. Experimental Method of High-Pressure Isothermal Adsorption to Coal; GB/T 19560-2008; China National Standards: Beijing, China, 2008. [Google Scholar]
  28. International Organization for Standardization. Pore Size Distribution and Porosity of Solid Materials by Mercury Porosimetry and Gas Adsorption—Part 2: Analysis of Mesopores and Macropores by Gas Adsorption; ISO 15901.2-2006; ISO: Geneva, Switzerland, 2006. [Google Scholar]
  29. International Organization for Standardization. Evaluation of Pore Size Distribution and Porosity of Solid Materials by Mercury Porosimetry and Gas Adsorption—Part 1: Mercury Porosimetry; ISO 15901-1-2005; ISO: Geneva, Switzerland, 2005. [Google Scholar]
  30. SY. Analytical Method of Rock Sample by Scanning Electron Microscope; SY/T 5162-1997; China Petrolem & Natural Gas Standards: Beijing, China, 1997. [Google Scholar]
  31. Friesen, W.I.; Mikule, R.J. Fractal dimensions of coal particles. J. Colloid Interface Sci. 1987, 120, 263–271. [Google Scholar] [CrossRef]
  32. Fu, X.H.; Qin, Y.; Zhang, W.H.; Wei, C.T.; Zhou, R.F. Research of coal pore fractal classification and natural classification based on the coalbed methane migration. China Sci. Bull. 2005, 50, 51–55. [Google Scholar] [CrossRef]
  33. Wang, C.Y.; Hao, S.X.; Sun, W.J.; Chu, W. Fractal dimension of coal particles and their CH4 adsorption. Int. J. Min. Sci. Technol. 2012, 22, 855–858. [Google Scholar] [CrossRef]
  34. Bu, H.L.; Ju, Y.W.; Tan, J.Q.; Wang, G.C.; Li, X.S. Fractal characteristics of pores in non-marine shales from the Huainan coalfield, Eastern China. J. Nat. Gas Sci. Eng. 2015, 24, 166–177. [Google Scholar] [CrossRef]
  35. Pfeifer, P.; Avnir, D. Chemistry in noninteger dimensions between two and three (I): Fractal theory of heterogeneous surfaces. J. Chem. Phys. 1984, 80, 3558–3565. [Google Scholar] [CrossRef]
  36. Bae, J.S.; Bhatia, S.K.; Rudolph, V.; Massarotto, P. Pore accessibility of methane and carbon dioxide in coals. Energy Fuels 2009, 23, 3319–3327. [Google Scholar] [CrossRef]
  37. Melnichenko, Y.B.; He, L.L.; Sakurovs, R.; Kholodenko, A.L.; Blach, T.; Mastalerz, M.; Radlinski, A.P.; Cheng, G.; Mildner, D.F.R. Accessibility of pores in coal to methane and carbon dioxide. Fuel 2012, 91, 200–208. [Google Scholar] [CrossRef]
  38. Yao, Y.B.; Liu, D.M. Effects of igneous intrusions on coal petrology, pore-fracture and coalbed methane characteristics in Hongyang, Handan and Huaibei coalfields, North China. Int. J. Coal Geol. 2012, s96–s97, 72–81. [Google Scholar] [CrossRef]
Figure 1. Location map of study area and experimental site and schematics of boreholes. (a) Qinshui Basin in China; (b) simplified geological model of Qinshui Basin. The basin is a syncline elongated in an NNE direction, and its total area is approximately 30,000 km2, which is part of the North China Basin. The coal-bearing series include the early Permian Taiyuan Formation and Shanxi Formation. The Shanxi Formation consists of sandstone, siltstone, and mudstone, and mineable coal seams, the coal seam numbers from the top down is No. 1, No. 2, No. 3. The No. 3 coal seam is the focus of this study, has relatively stable structure and is also the main minable coal seam. Coal thickness of the No. 3 ranges from 2.3 to 7.37 m, with an average of 6.11 m [21], which has the regularly of gradually thinned from south to north.
Energies 10 01881 g001
Figure 2. Pore size distribution characteristics showing the relationship between pore distribution and specific surface area according to LTNA measurements for samples (a) SH-2 and (b) ZZ-2 and the relationship between pore distribution and specific surface area from MP measurements for samples (c) SH-2 and (d) ZZ-2.
Energies 10 01881 g002
Figure 3. Percentage of pore volume and specific surface area in each pore size interval (left panel: LTNA; right panel: MP). V1–V4 and S1–S4 are the pore volume ratios and specific surface area ratios of micro pores, small pores, medium pores, and large pores, respectively.
Energies 10 01881 g003
Figure 4. Low temperature nitrogen adsorption/desorption curves for samples (a) SH-2 and (b) ZZ-2 and MP curves for samples (c) SH-2 and (d) ZZ-2.
Energies 10 01881 g004
Figure 5. Relationship between lnV and ln(ln(P0/P)) based on low-temperature nitrogen adsorption.
Energies 10 01881 g005
Figure 6. Field emission scanning electron microscopy (FESEM) images of coal samples. (a) scanning image of Sihe samples, spherical pore; (b) image of a part in (a); (c) scanning image of Zhaozhuang samples, Y-shaped and V-shaped pores; (d) scanning image of Zhaozhuang samples, Y-shaped pore.
Energies 10 01881 g006
Table 1. Coal sample data.
Sample IDRo, max (%)Ad (%)Clay Minerals (%)Carbonates (%)BET Surface Area (m2/g, LTNA)Pore Volume (10−6 m3/g, LTNA)Total Pore Area (m2/g, MP)Total Intrusion Volume (10−6 m3/g, MP)Langmuir Volume VL/(10−6m3/g)Langmuirpressure PL/MPa
SH-12.7610.997.86006.330.00536.4460.035636.233.12
SH-22.6810.512.646016.950.00955.7030.038734.482.99
SH-33.079.542.5241.2621.450.00216.1160.035436.502.68
SH-42.9647.451.1500.6604.200.00325.8730.035128.572.90
SH-52.738.513.24004.890.00356.5220.049235.842.97
SH-62.5312.835.56002.130.00326.9160.038035.712.77
ZZ-12.429.622.9400.3200.220.000716.1500.027631.062.68
ZZ-22.658.404.65100.3320.390.00107.4680.036230.672.06
ZZ-32.7211.085.93800.530.00117.5550.035228.172.01
ZZ-42.459.171.8290.3050.290.000797.8500.037332.892.45
ZZ-52.4413.497.1640.3000.220.000525.8360.027726.392.17
Note: Ro: vitrinite reflectance; Ad: ash yield, dry basis; BET: Brunauer–Emmett–Teller multi-molecular adsorption formula; LTNA: low-temperature nitrogen adsorption; MP: Mercury porosimetry.
Table 2. Fractal dimension calculations based on the FHH model.
Sample ID0.54 ≤ ln(ln(P0/P))−1.52(−1.04) < ln(ln(P0/P)) < 0.54ln(ln(P0/P)) ≤ −1.52(−1.04)
ADR2ADR2ADR2
SH-1−0.17122.82880.99−0.04912.95090.99−0.12742.87261.0
SH-2−0.20332.79670.92−0.01192.98810.93−0.04362.95640.99
SH-3−0.30542.69460.97−0.11742.88260.98−0.21432.78570.99
SH-4−0.17182.82820.96−0.02482.97520.91−0.11172.88830.99
SH-5−0.19472.80530.96−0.00262.99740.20−0.10712.89291.0
SH-6−0.23032.76970.99−0.15222.84781.0−0.23042.76960.99
ZZ-10.00383.00380.020.24143.24140.95−0.53602.46400.99
ZZ-2−0.17062.82940.97−0.07062.92940.89−0.38662.61341.0
ZZ-3−0.20812.79190.98−0.13422.86580.97−0.31202.68800.99
ZZ-4−0.05282.94720.710.11963.11960.87−0.46002.54000.99
ZZ-50.04723.04720.340.37153.37150.99−0.51742.48260.99