Comparative Research on Solar Phase Change Material Storage Wall Systems under Different Summer Working Conditions


Abstract
:1. Introduction
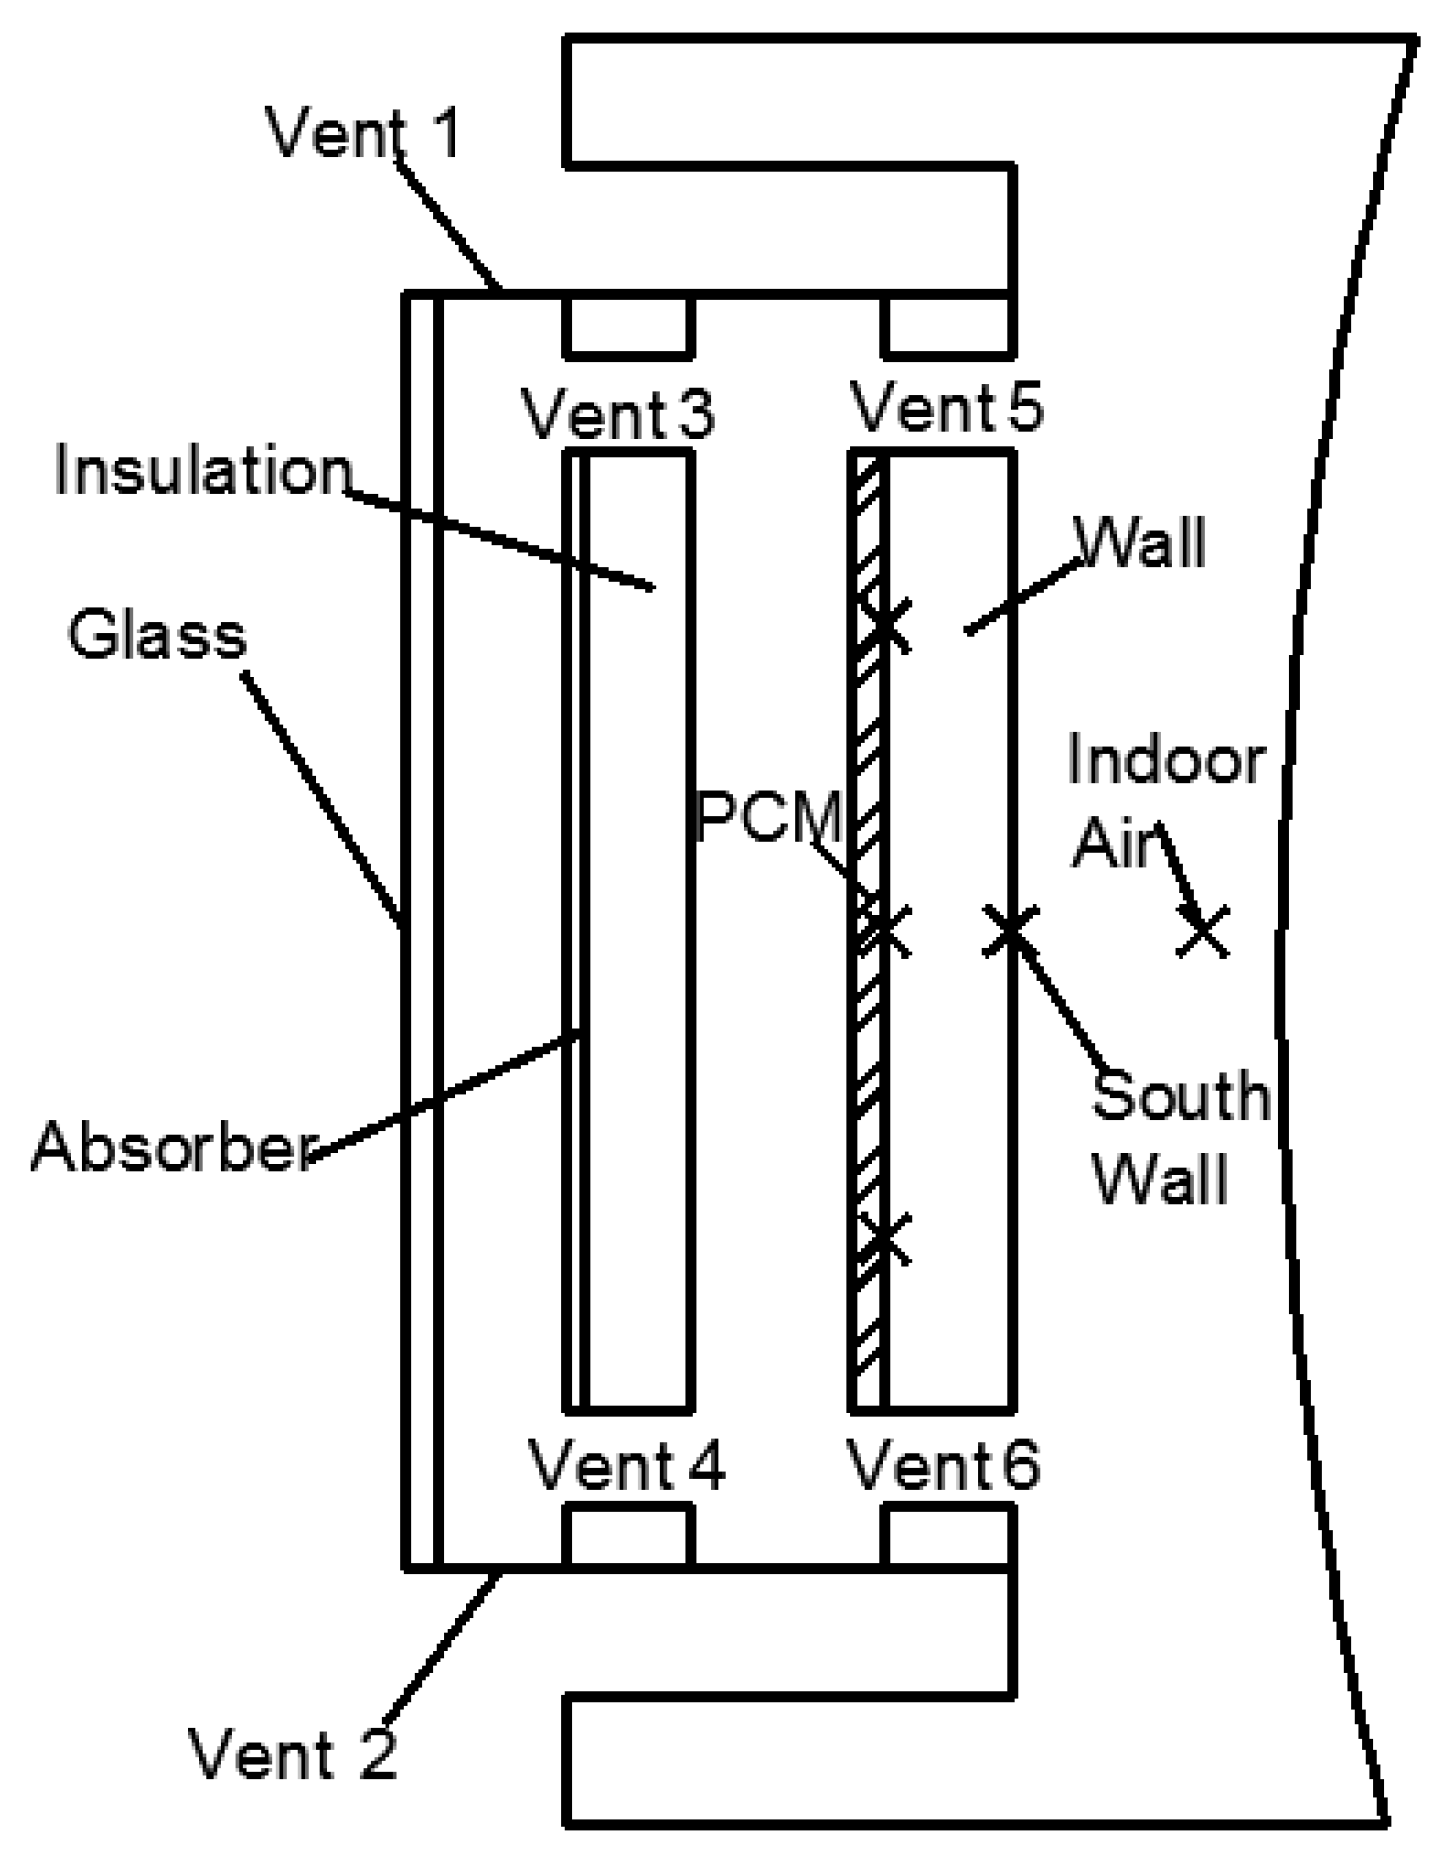
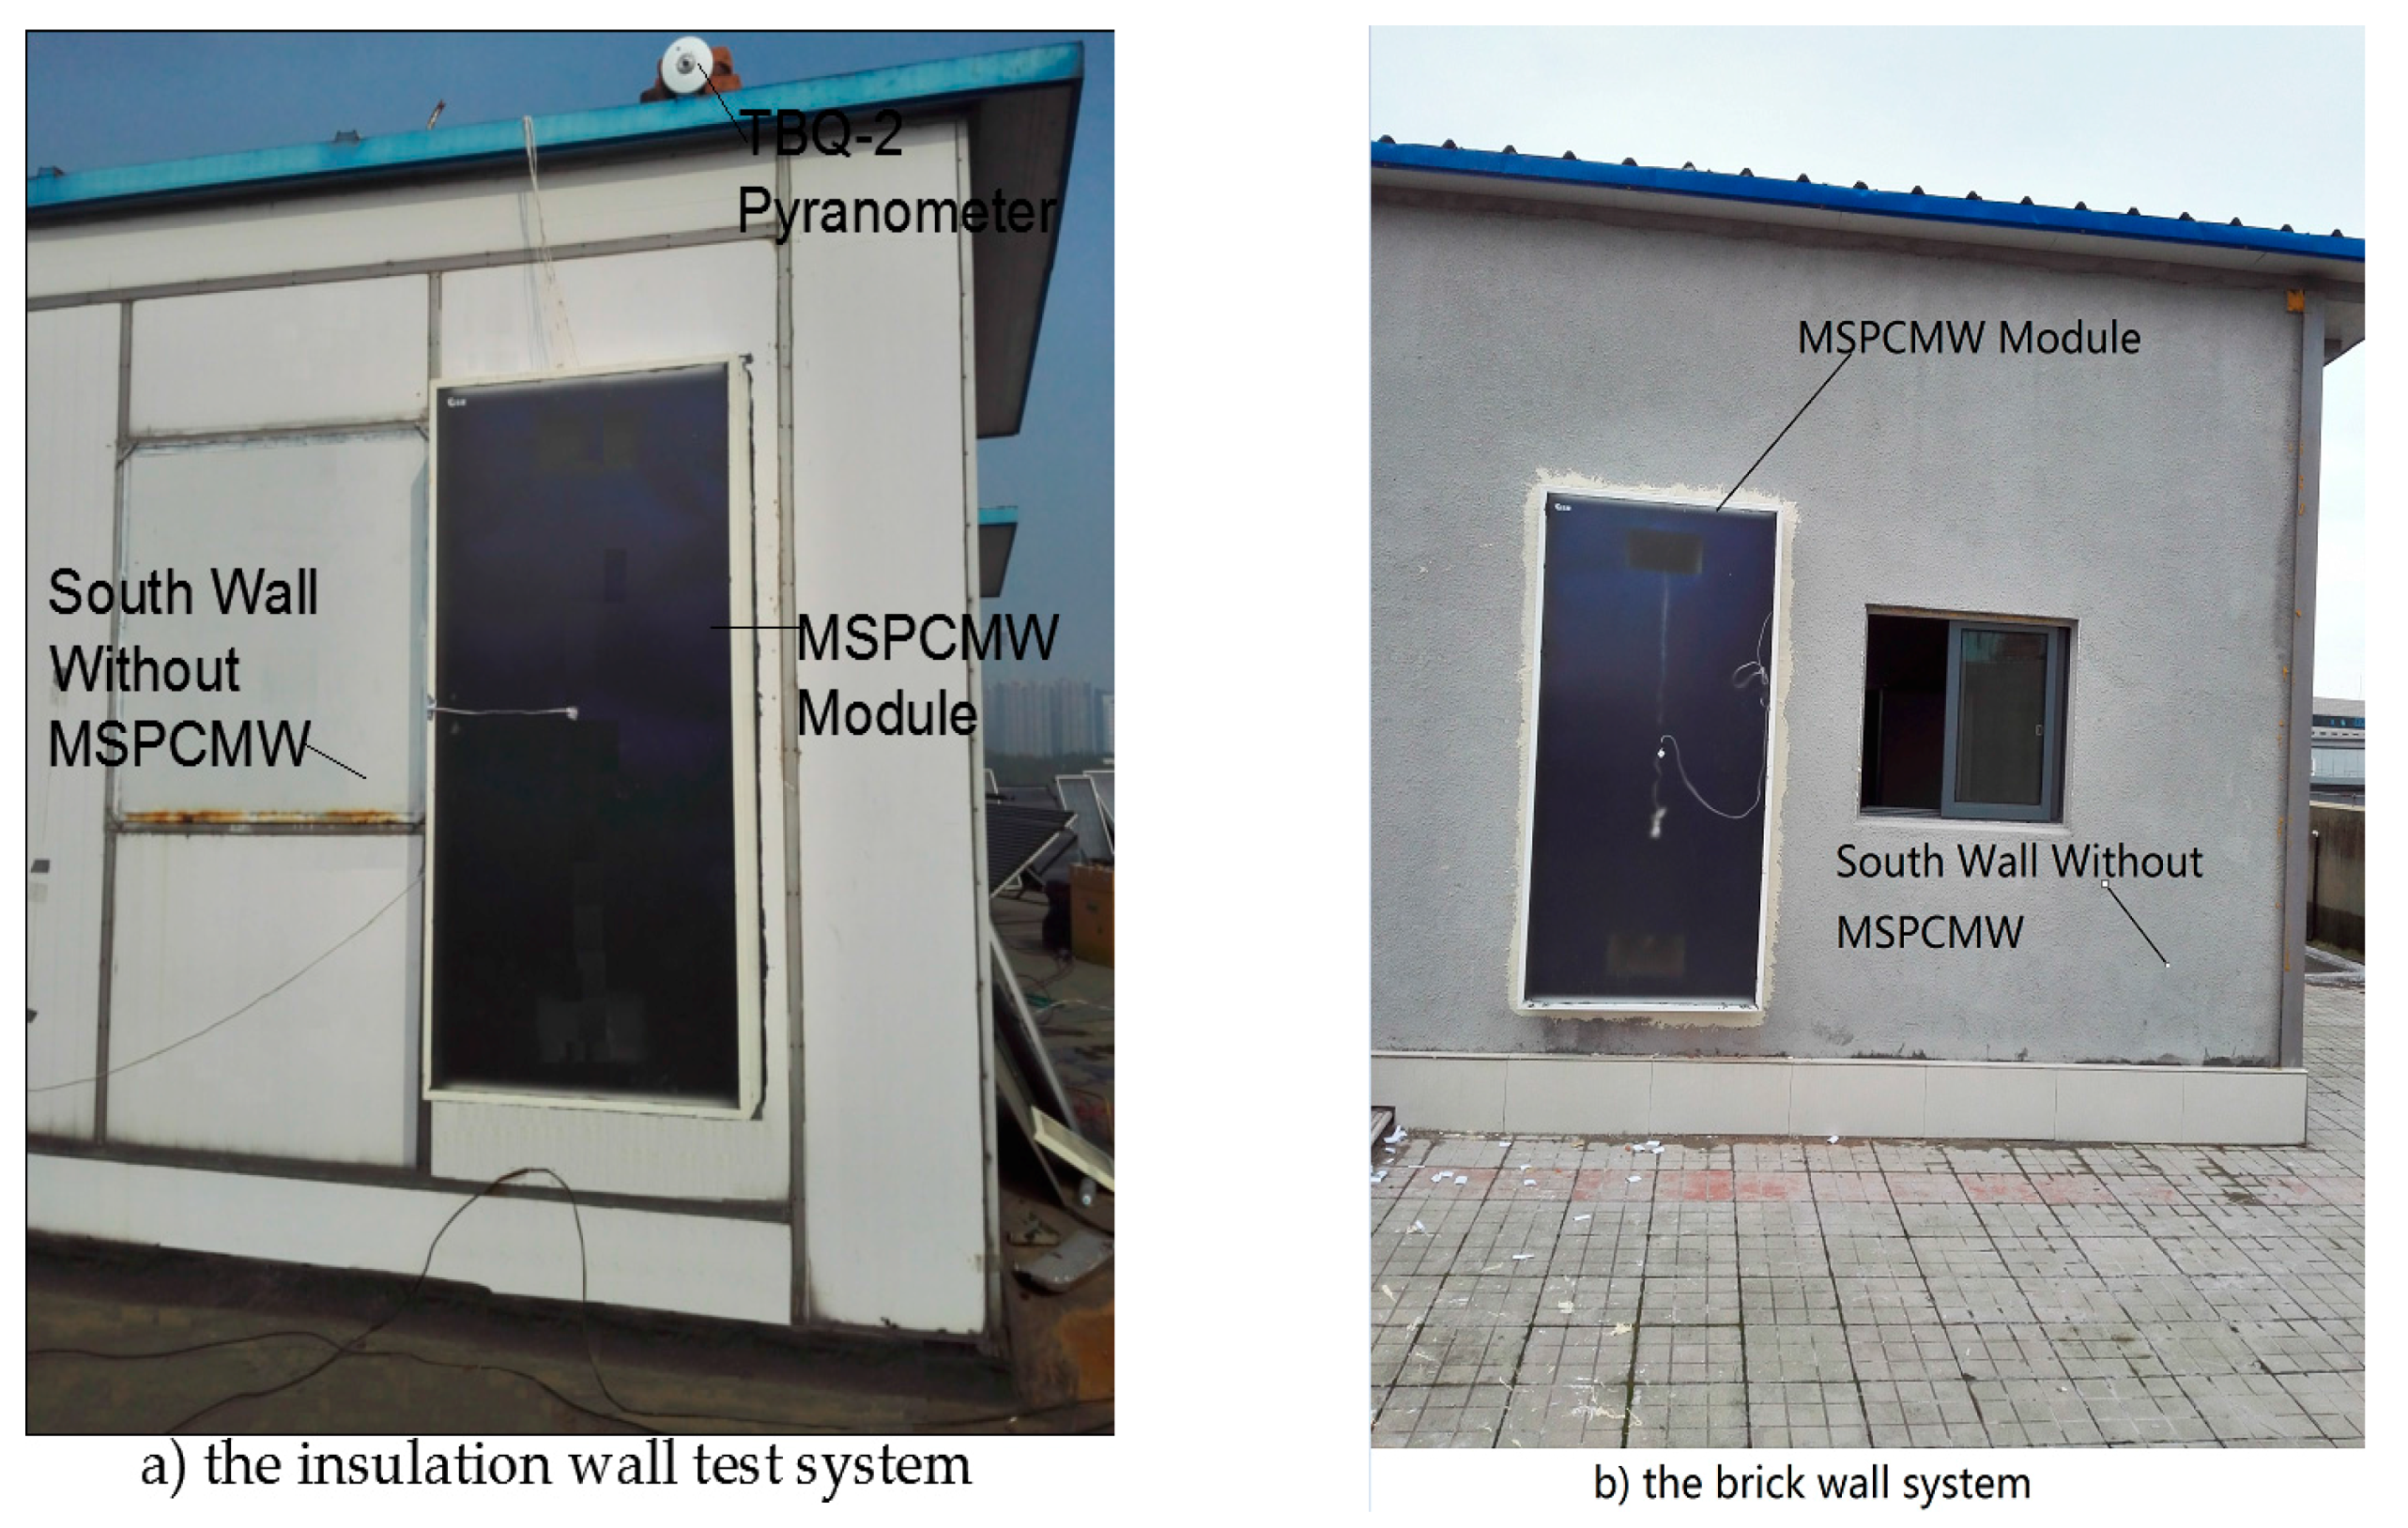
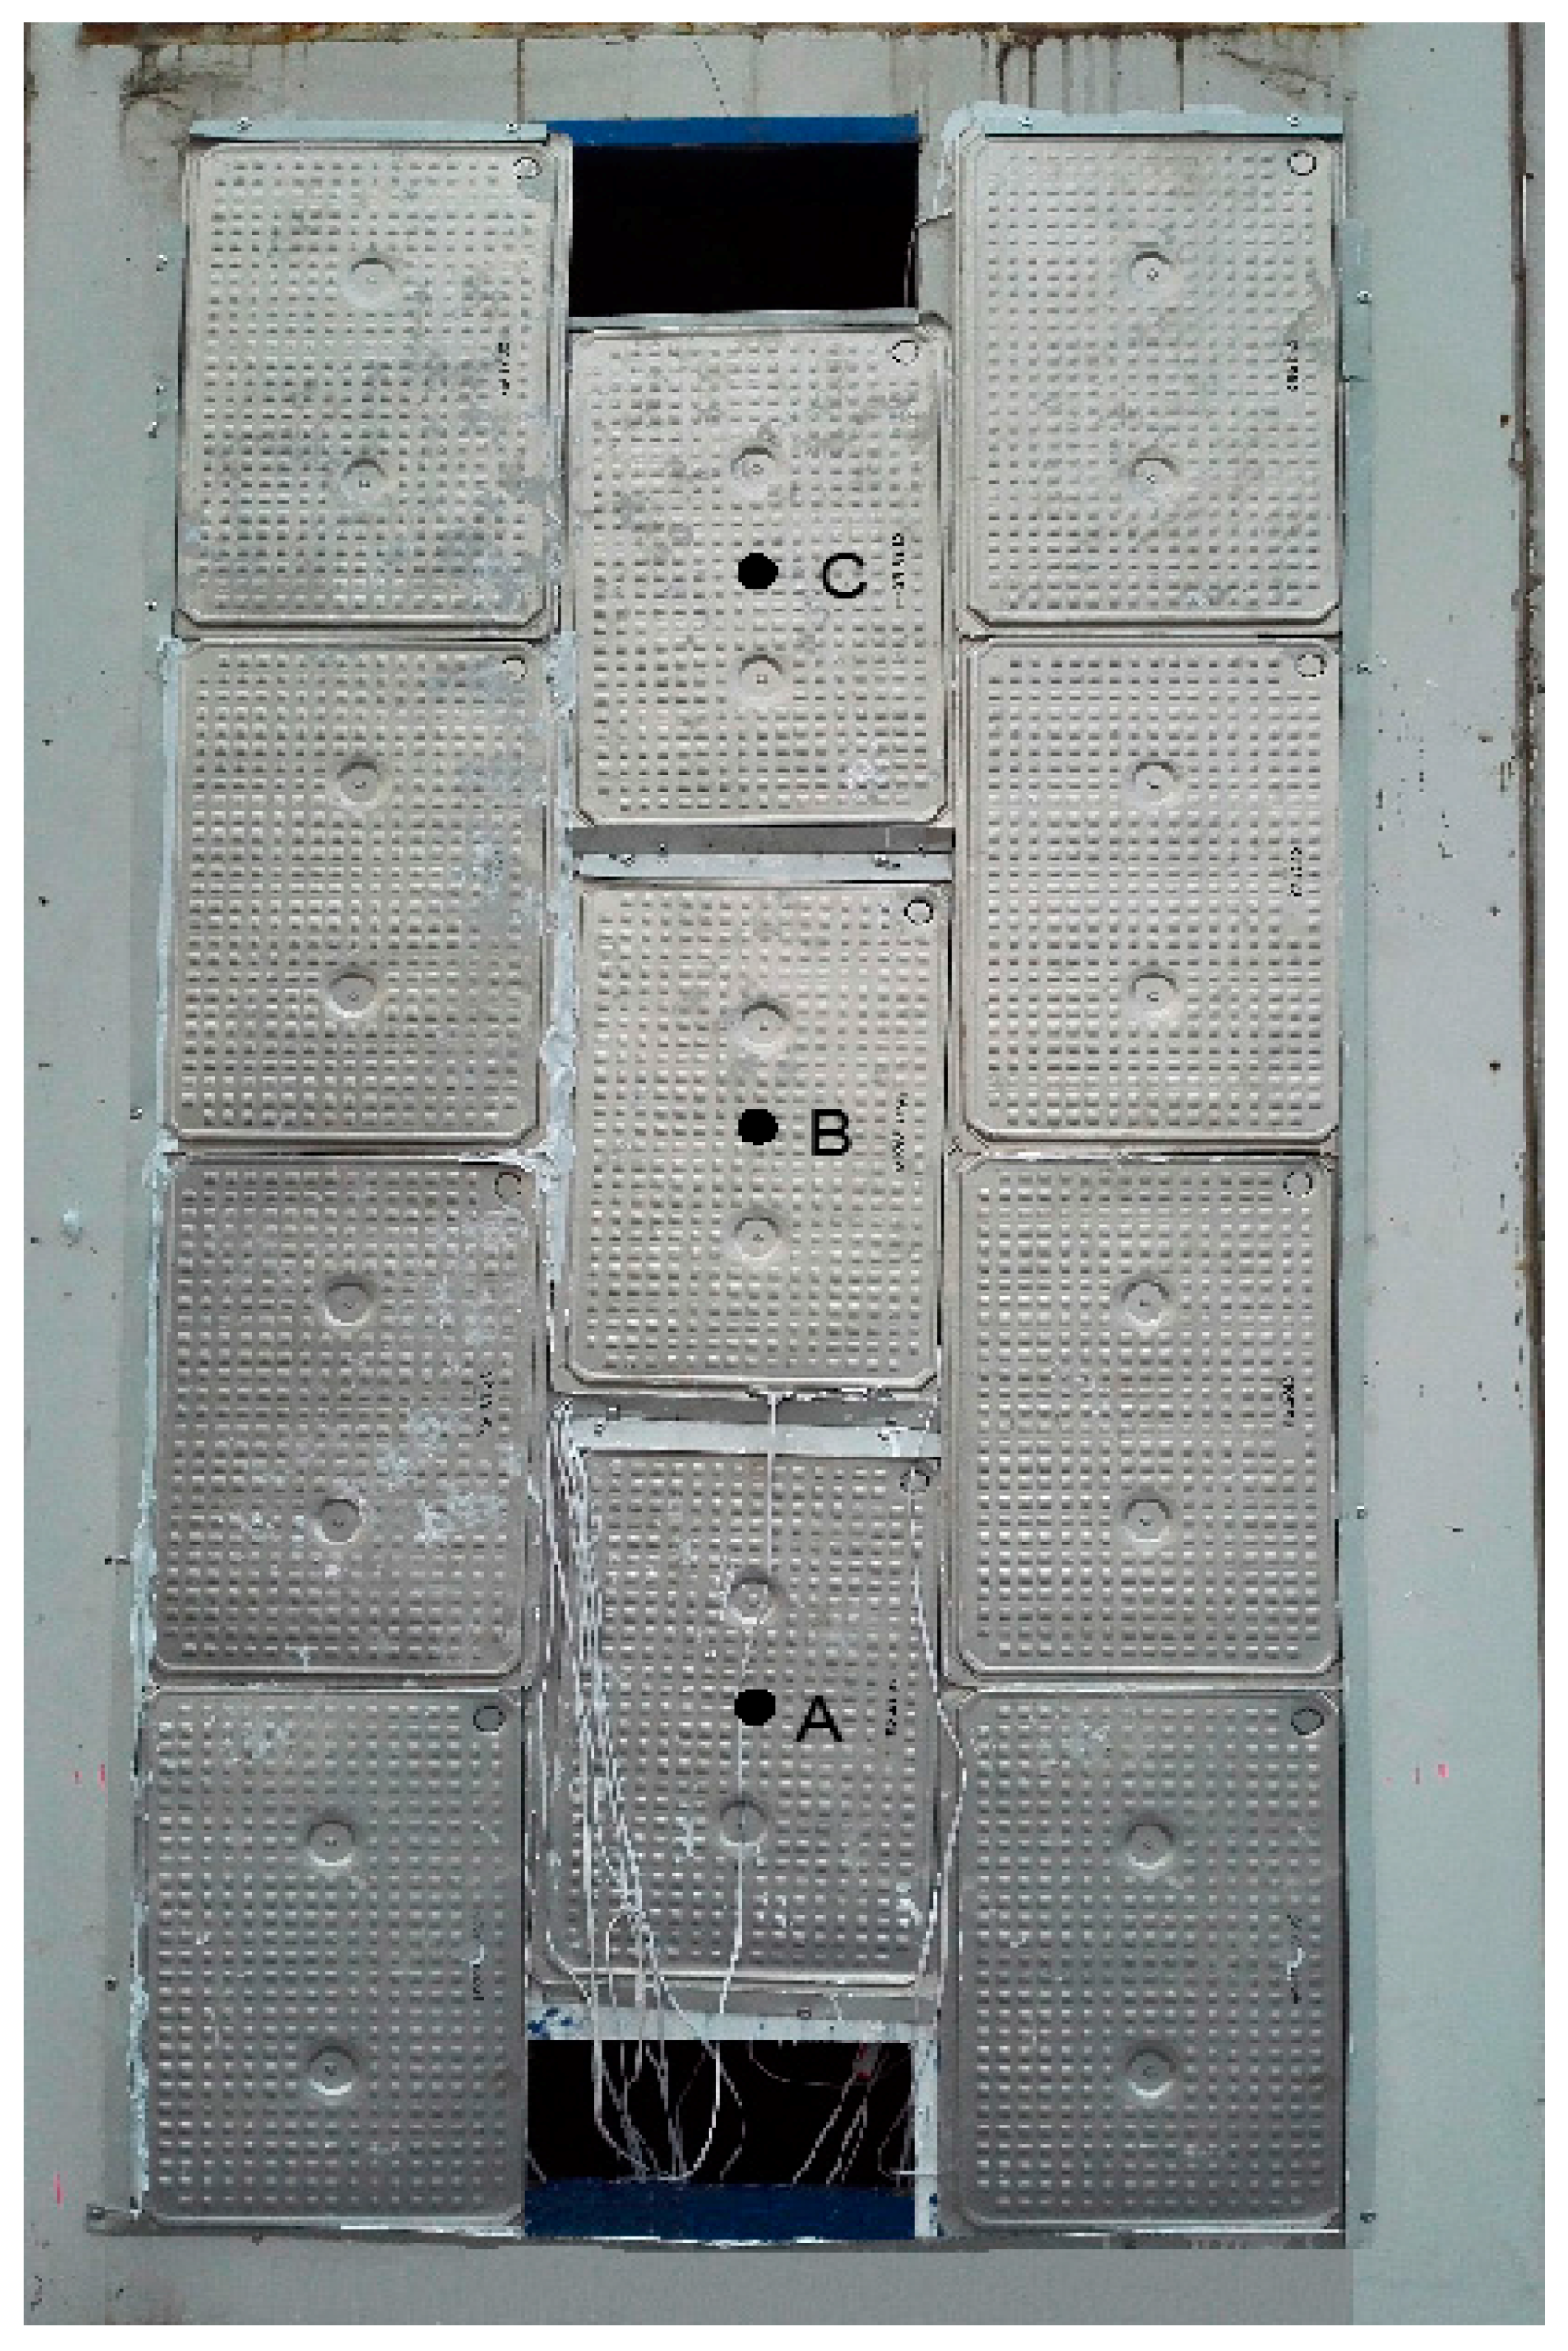
2. Test Setup and Introduction of Test Approach
- (1)
- winter operation mode, passive solar heating during daytime and heat preservation in nighttime;
- (2)
- summer operation mode, thermal insulation in daytime and passive cooling in nighttime. The working condition of summer operation mode is introduced as follows:
3. Experimental Results and Discussions
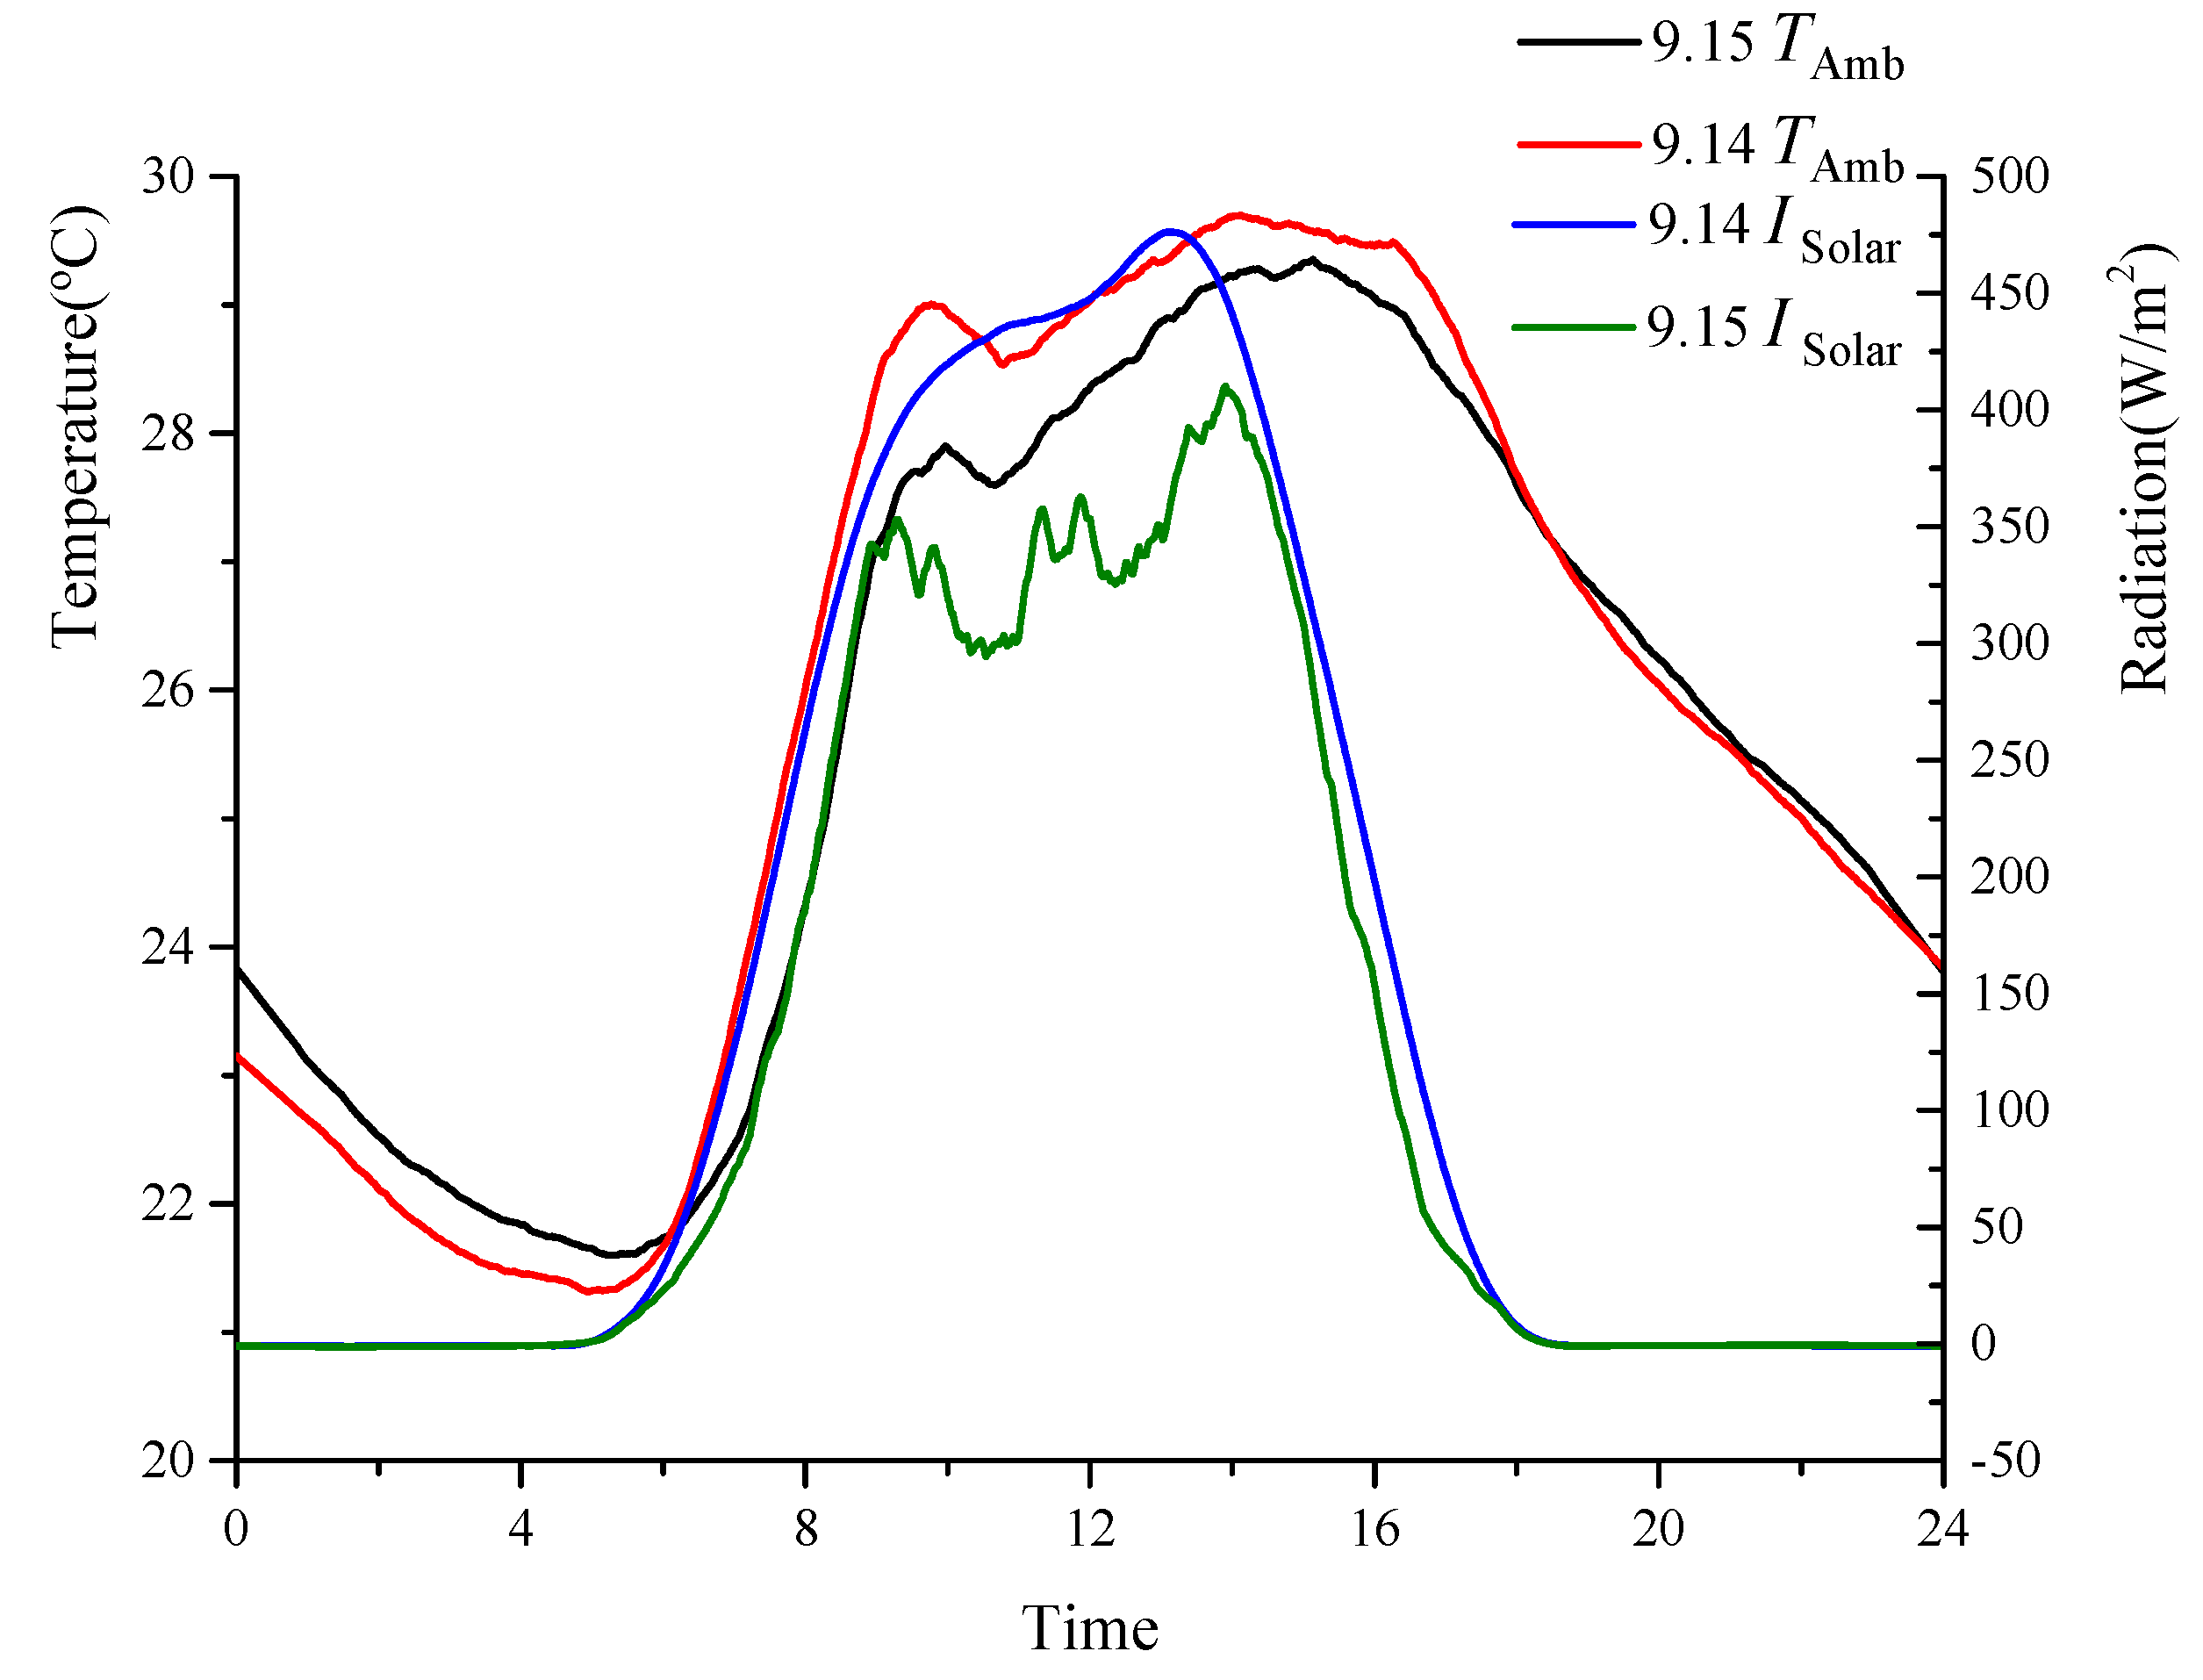
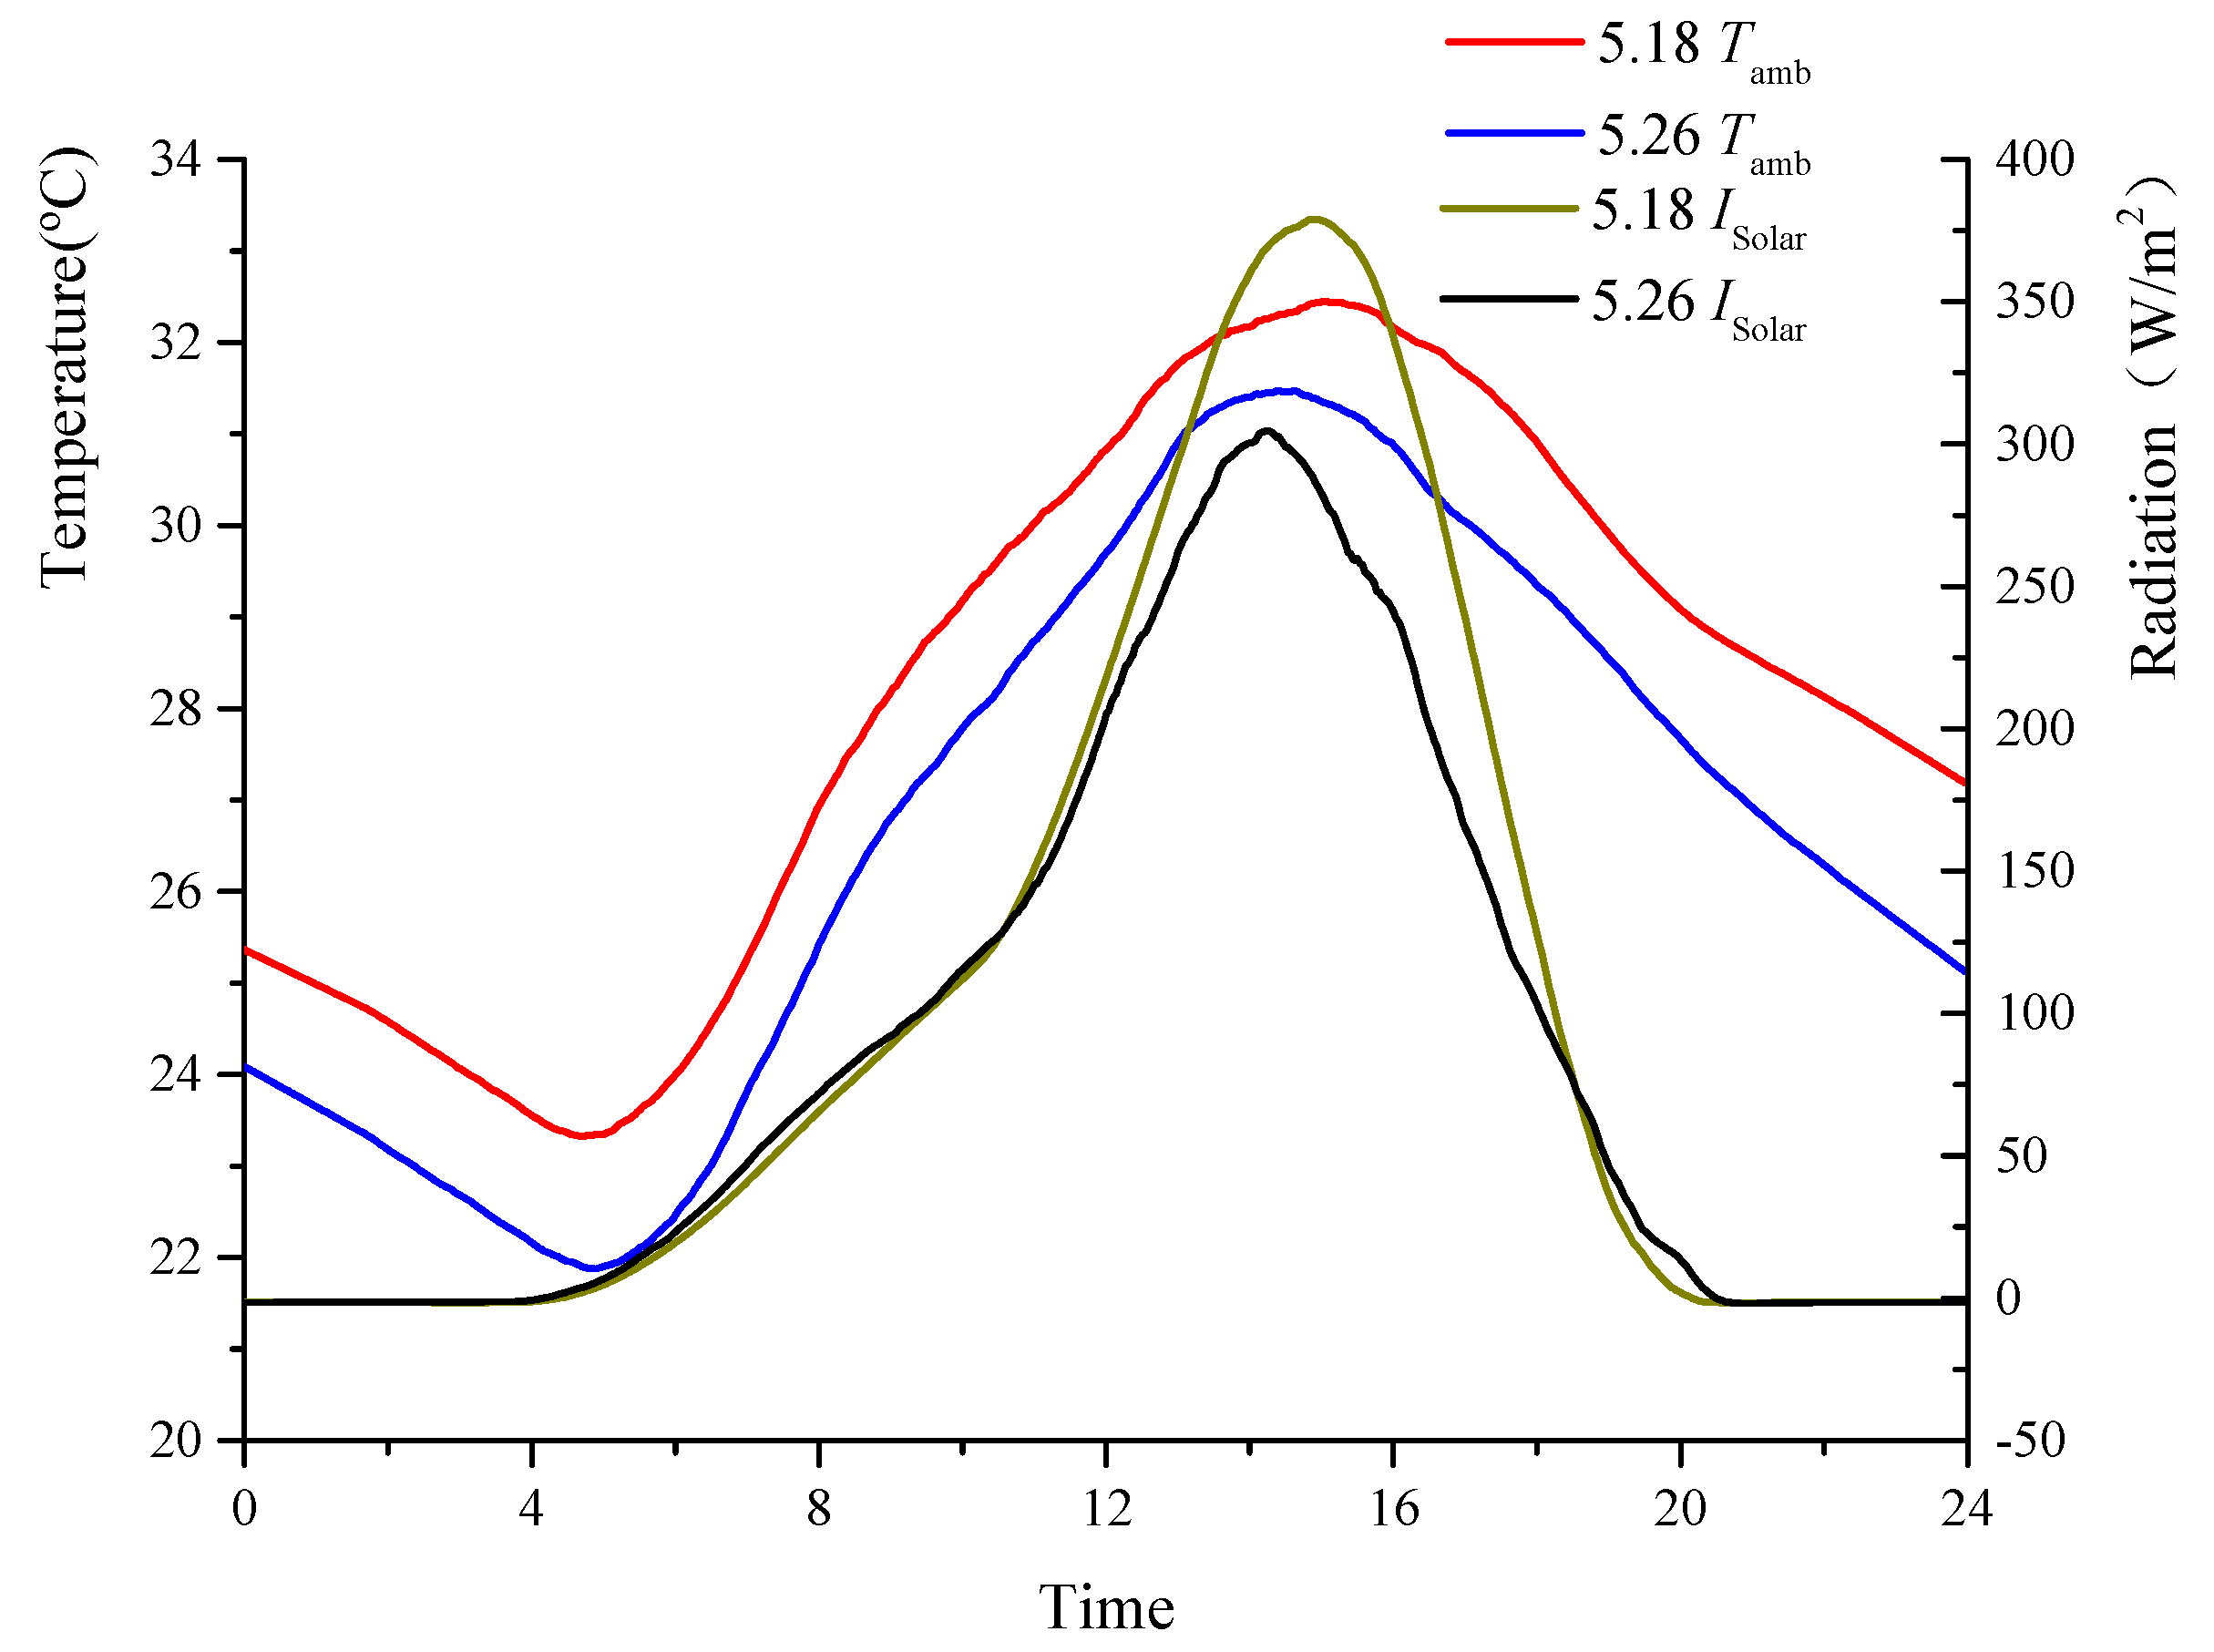
3.1. Test Conditions
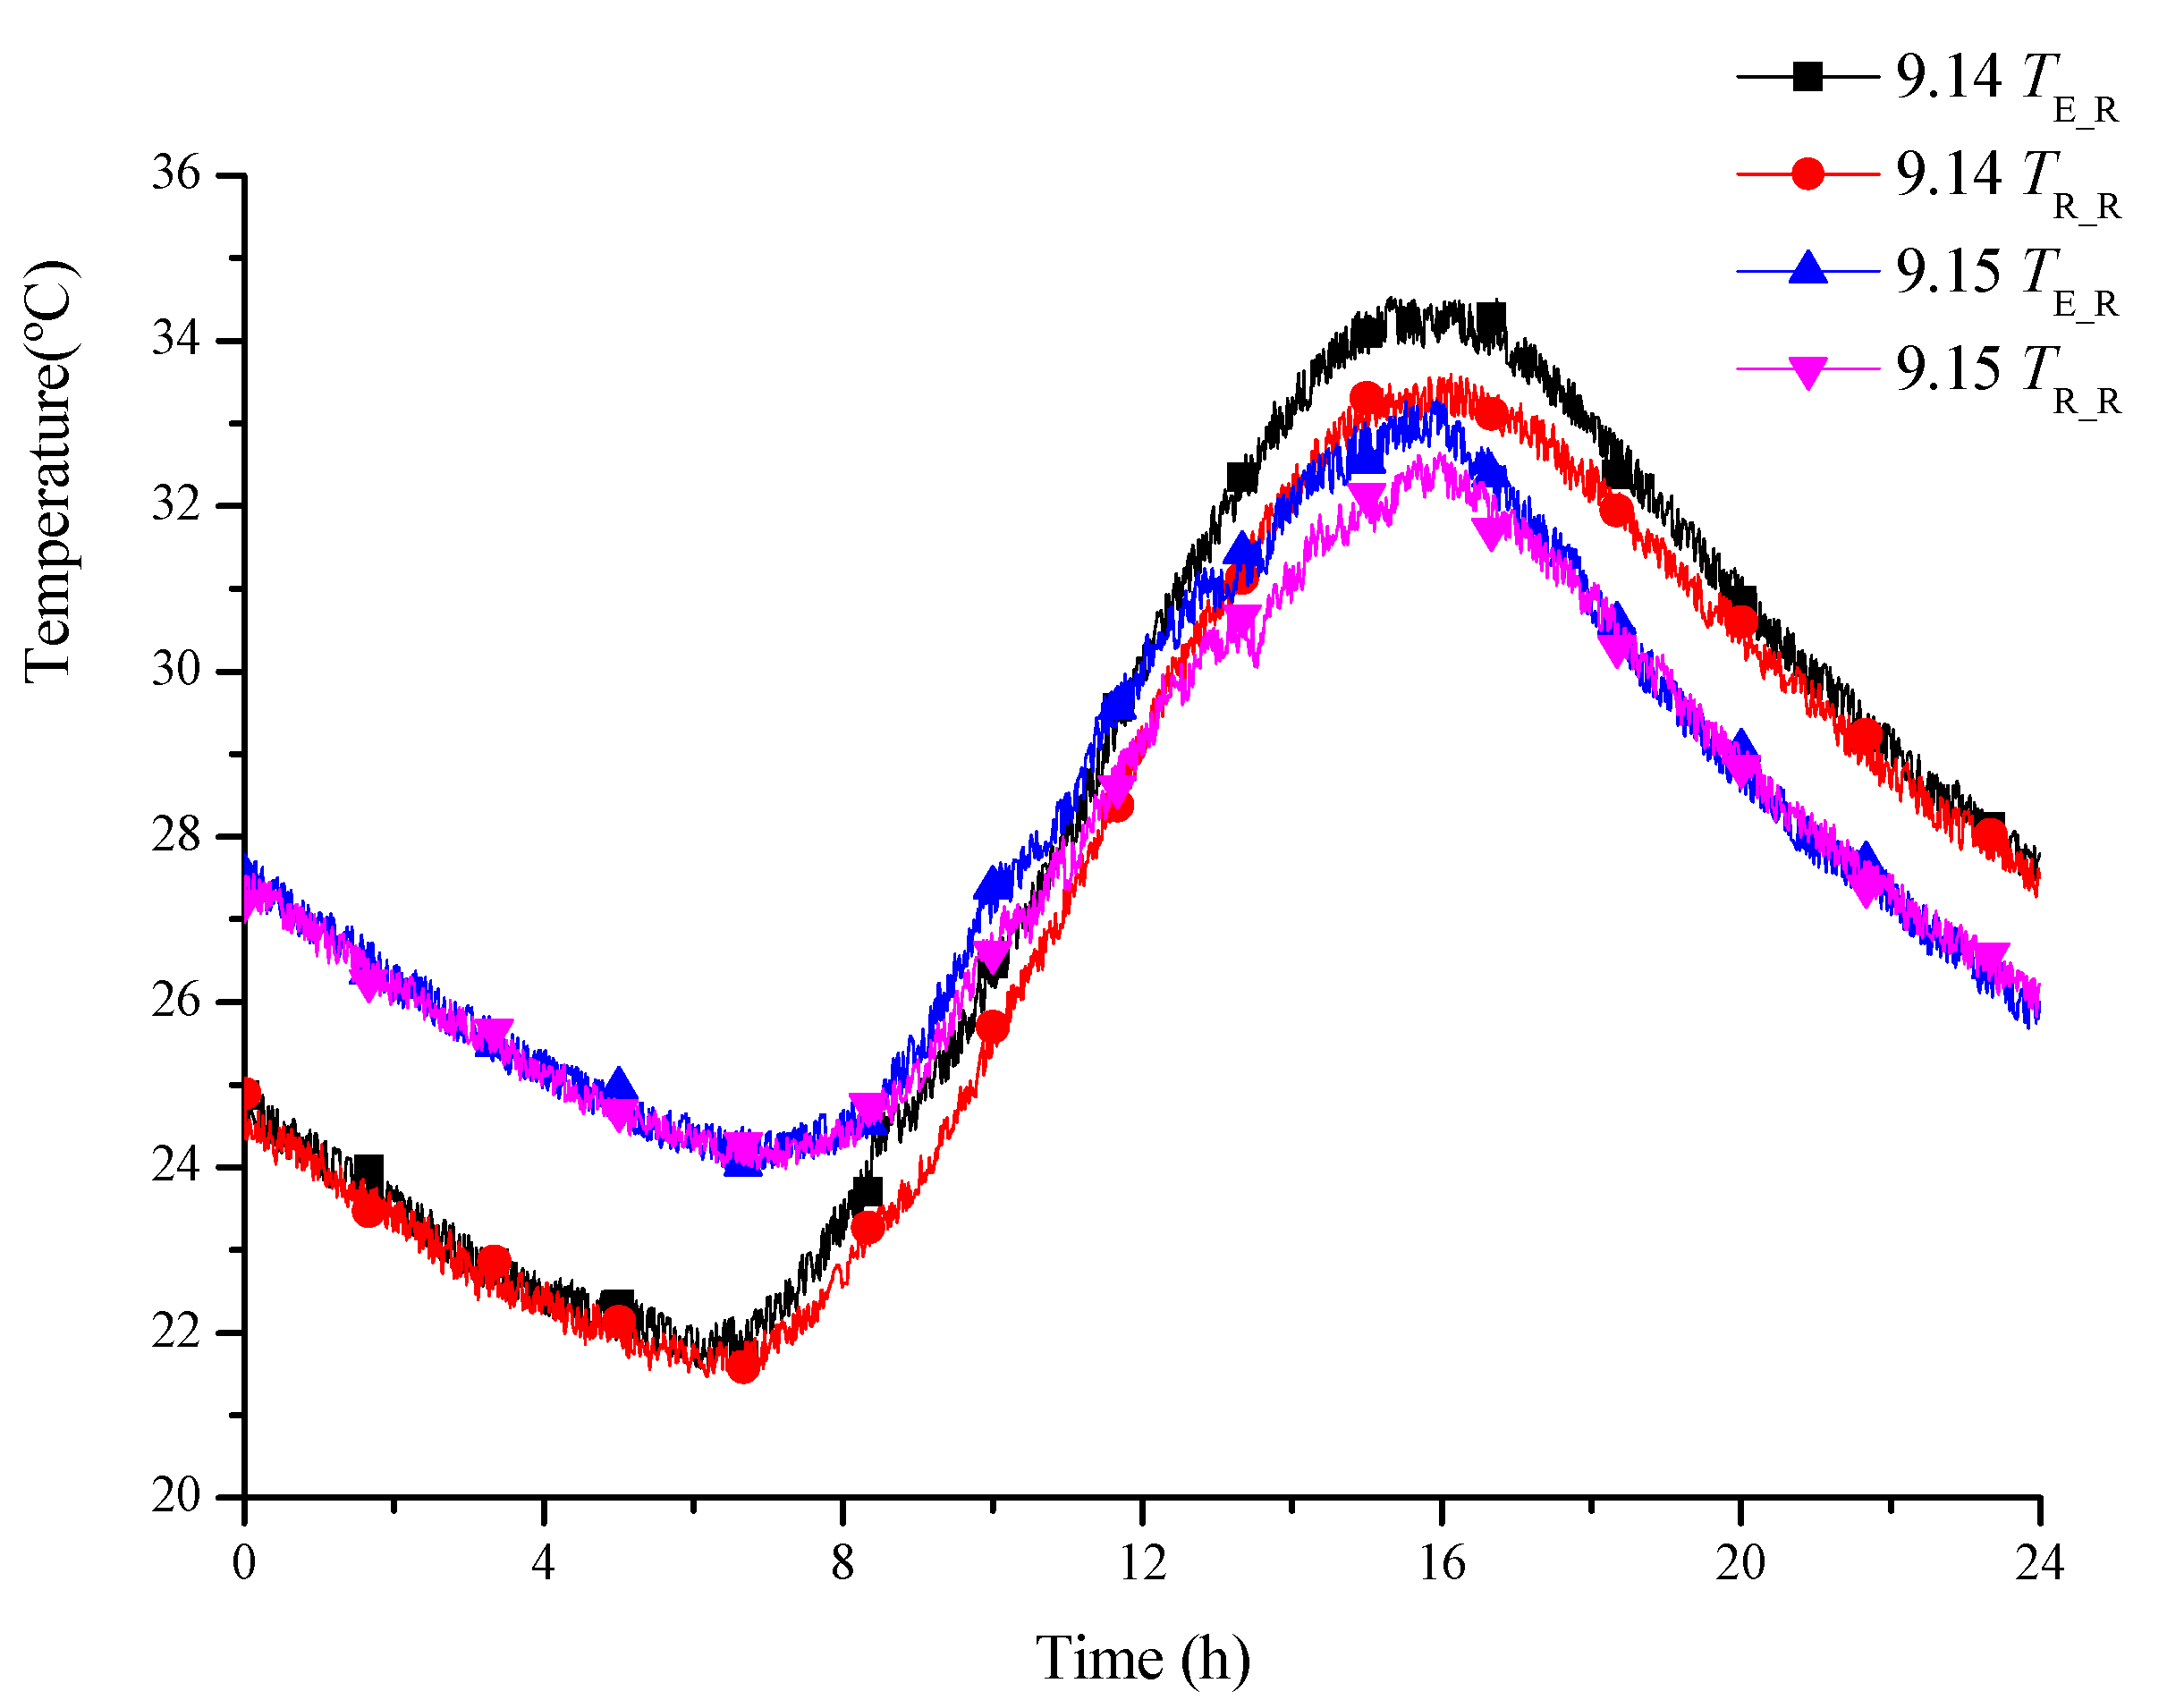
3.2. Comparison between Two Working Conditions of Insulation Wall Test System
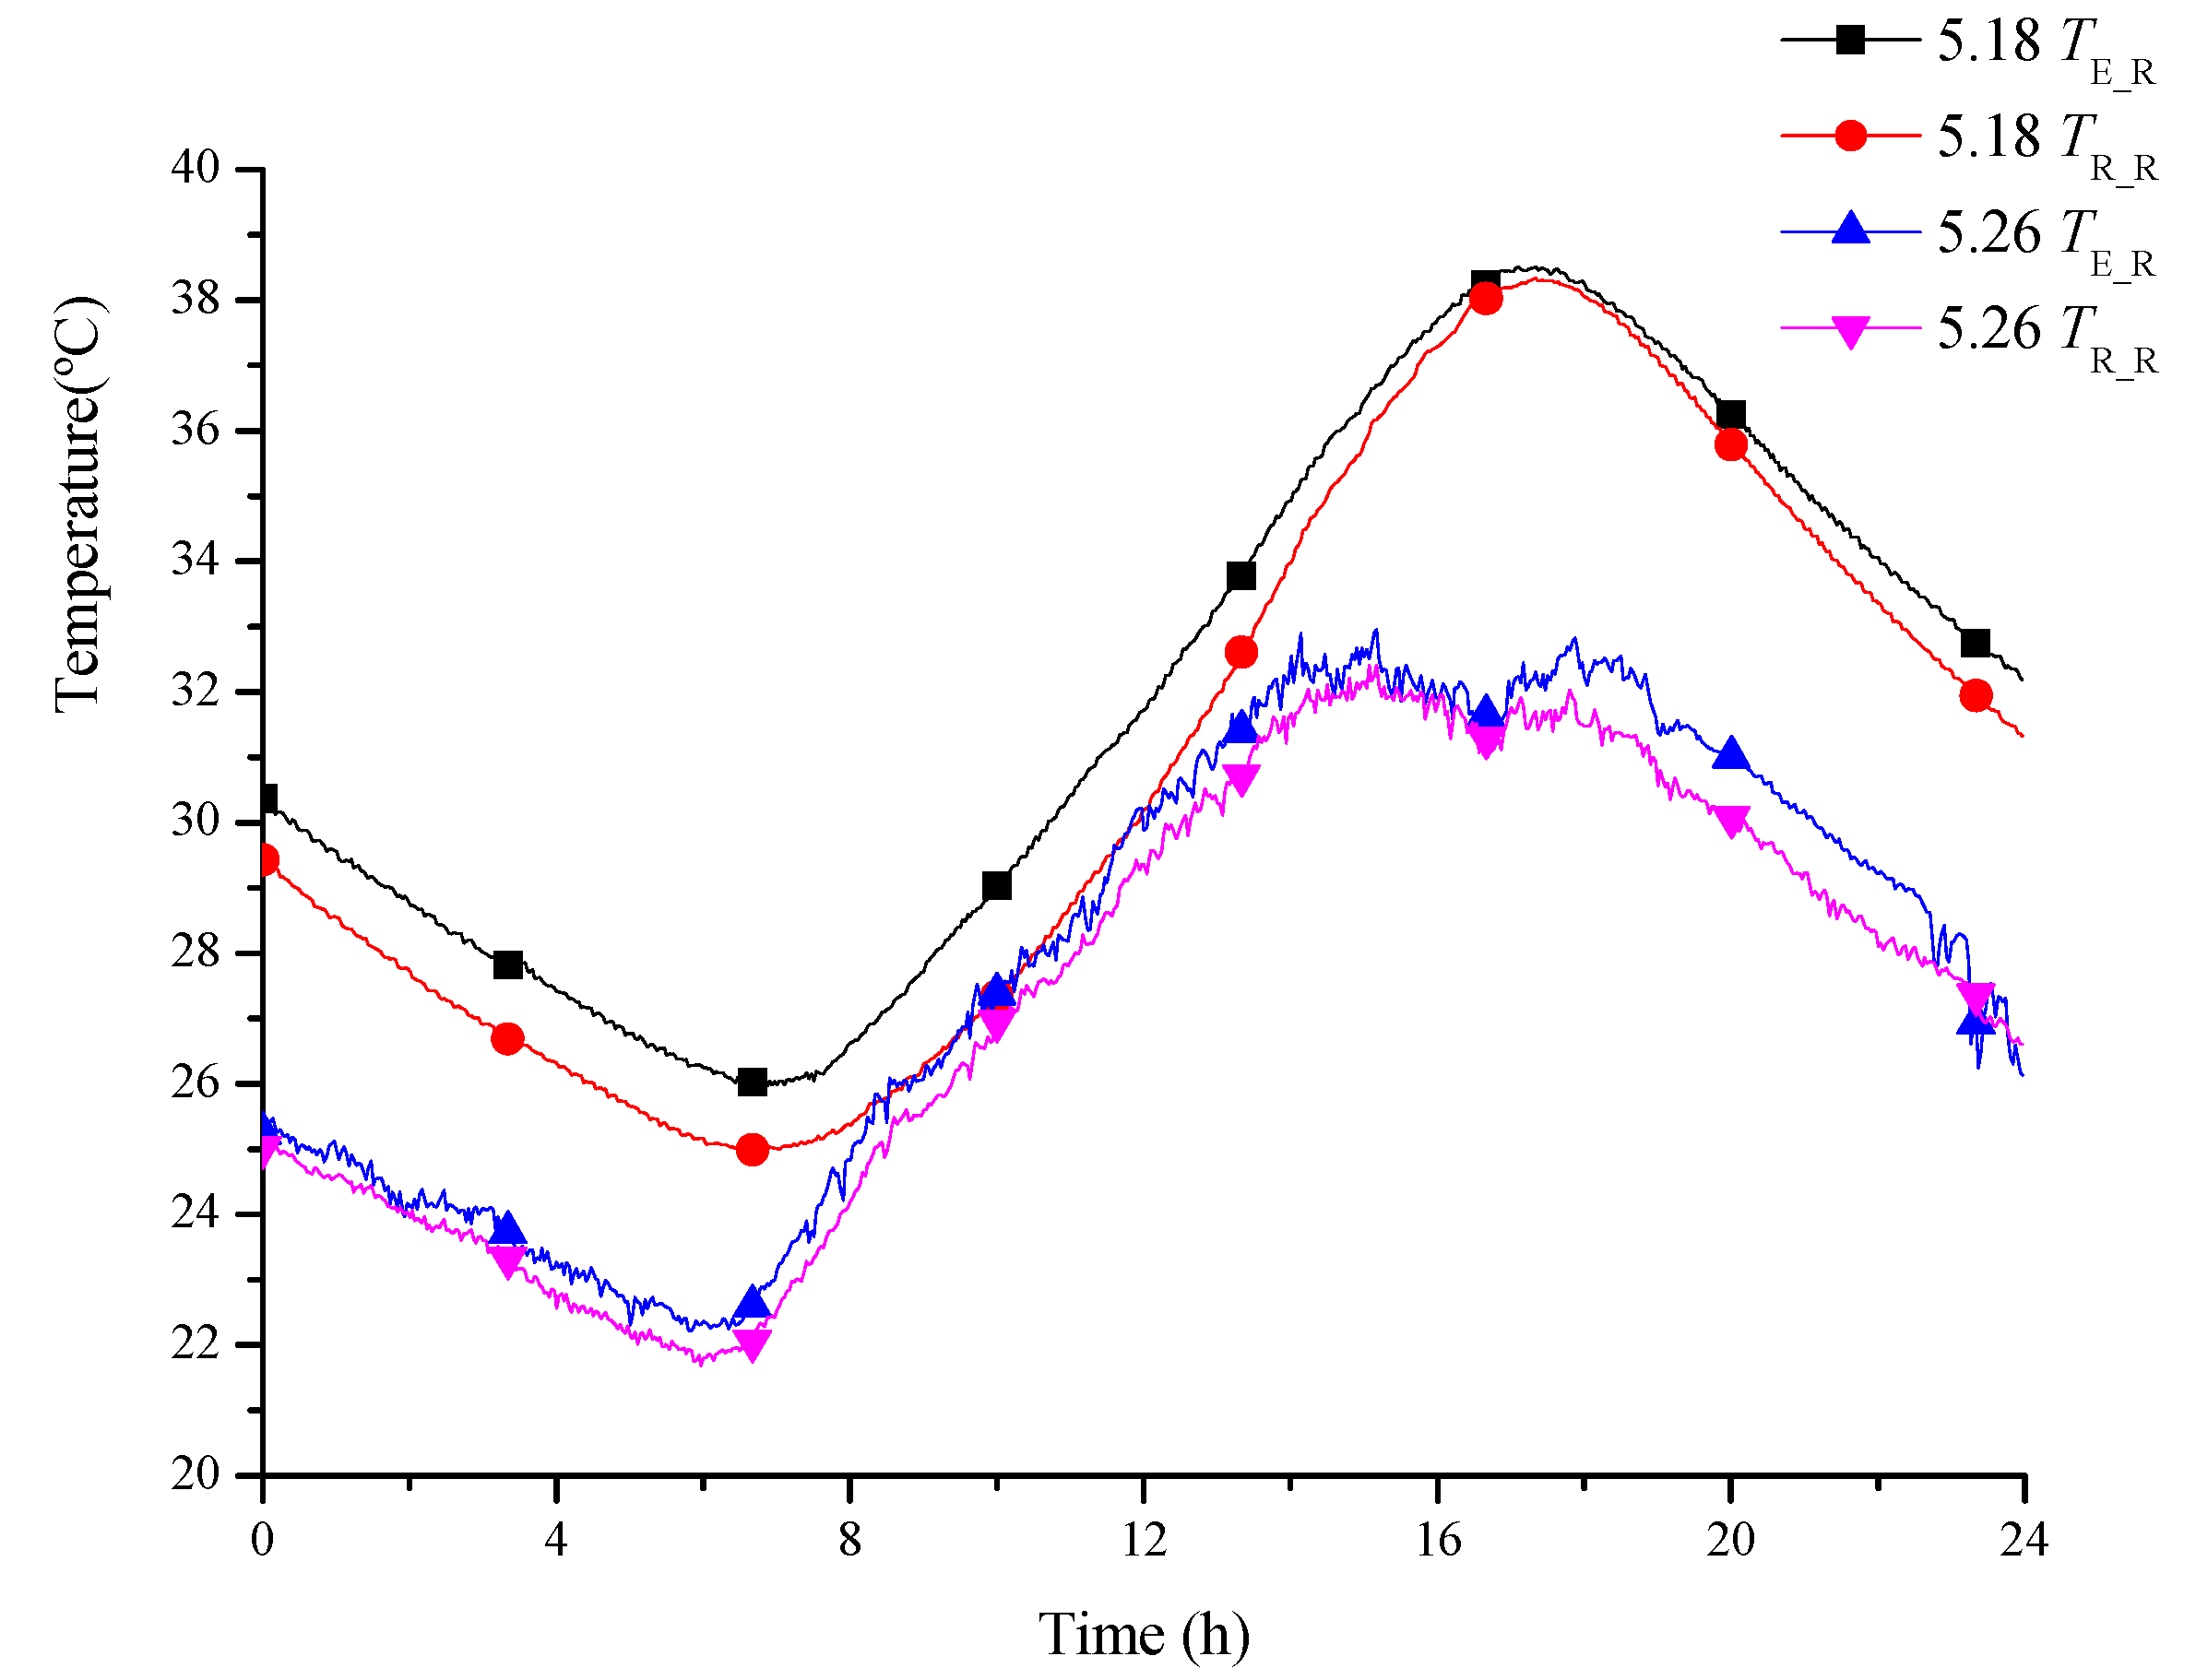
3.3. Comparison between Two Working Conditions of Solid Wall Test System
4. Conclusions
- (1)
- Test system installed on insulation wall: vented working conditions impacts little on temperature of the exterior surface of south-facing wall of experimental room without the present experimental facility and temperature of the exterior surface of south-facing wall of control room, but a small reduction in peak value and delay in occurrence time of the peak of temperature of the exterior surface of south-facing wall of experimental room with the present experimental facility was observed with respect to unvented working condition. Under both unvented and vented working conditions, temperature difference between exterior and interior surfaces of south-facing wall of the experimental room installed with experimental facility is relatively large, and the PCM plate temperature in daytime shows significant thermal stratification phenomenon along the height direction.
- (2)
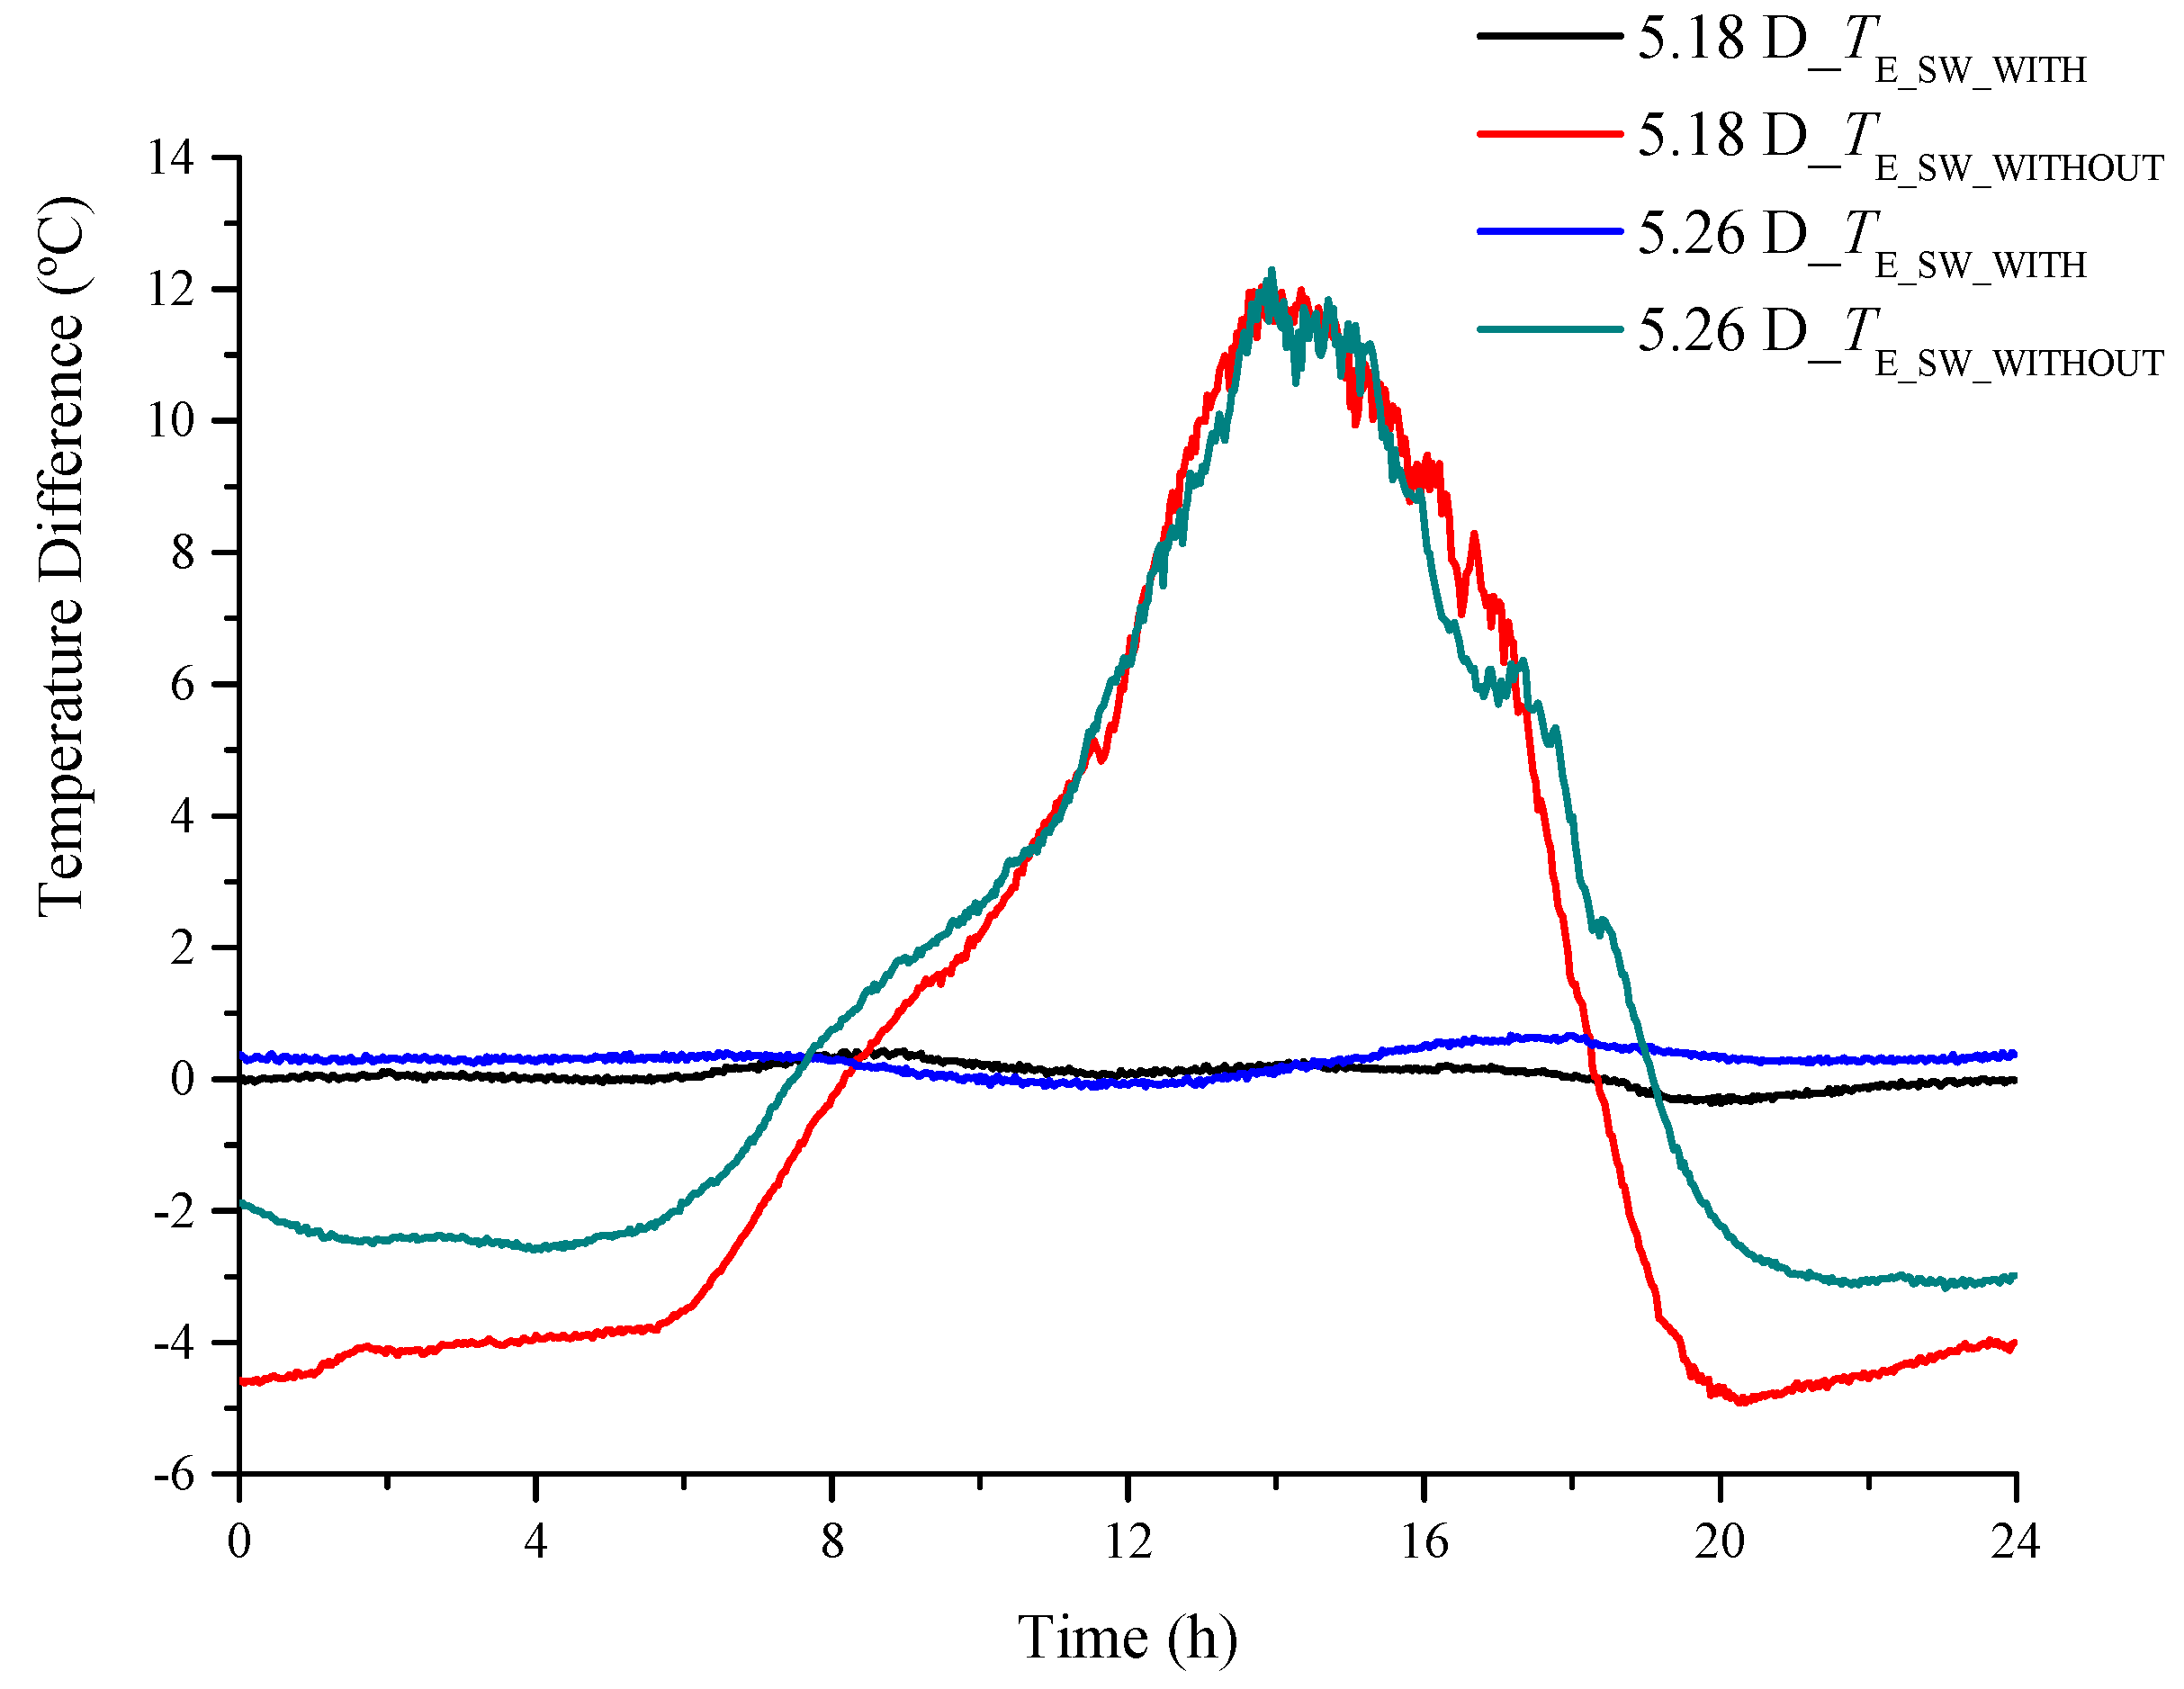
- Test system installed on solid wall: under both unvented and vented working conditions, temperature of the exterior surface of south-facing wall of experimental room with the present experimental facility reduced greater than temperature of the exterior surface of south-facing wall of experimental room without the present experimental facility and temperature of the exterior surface of south-facing wall of control room, and temperature difference between exterior and interior surfaces of south-facing wall of the experimental room installed with experimental facility was close to 0 °C. In addition, PCM temperature reduced significantly in vented working condition compared to unvented working condition; meanwhile, PCM temperature in vented working condition showed less significant thermal stratification along the height direction, different from the significant thermal stratification phenomenon in insulation wall test system.
- (3)
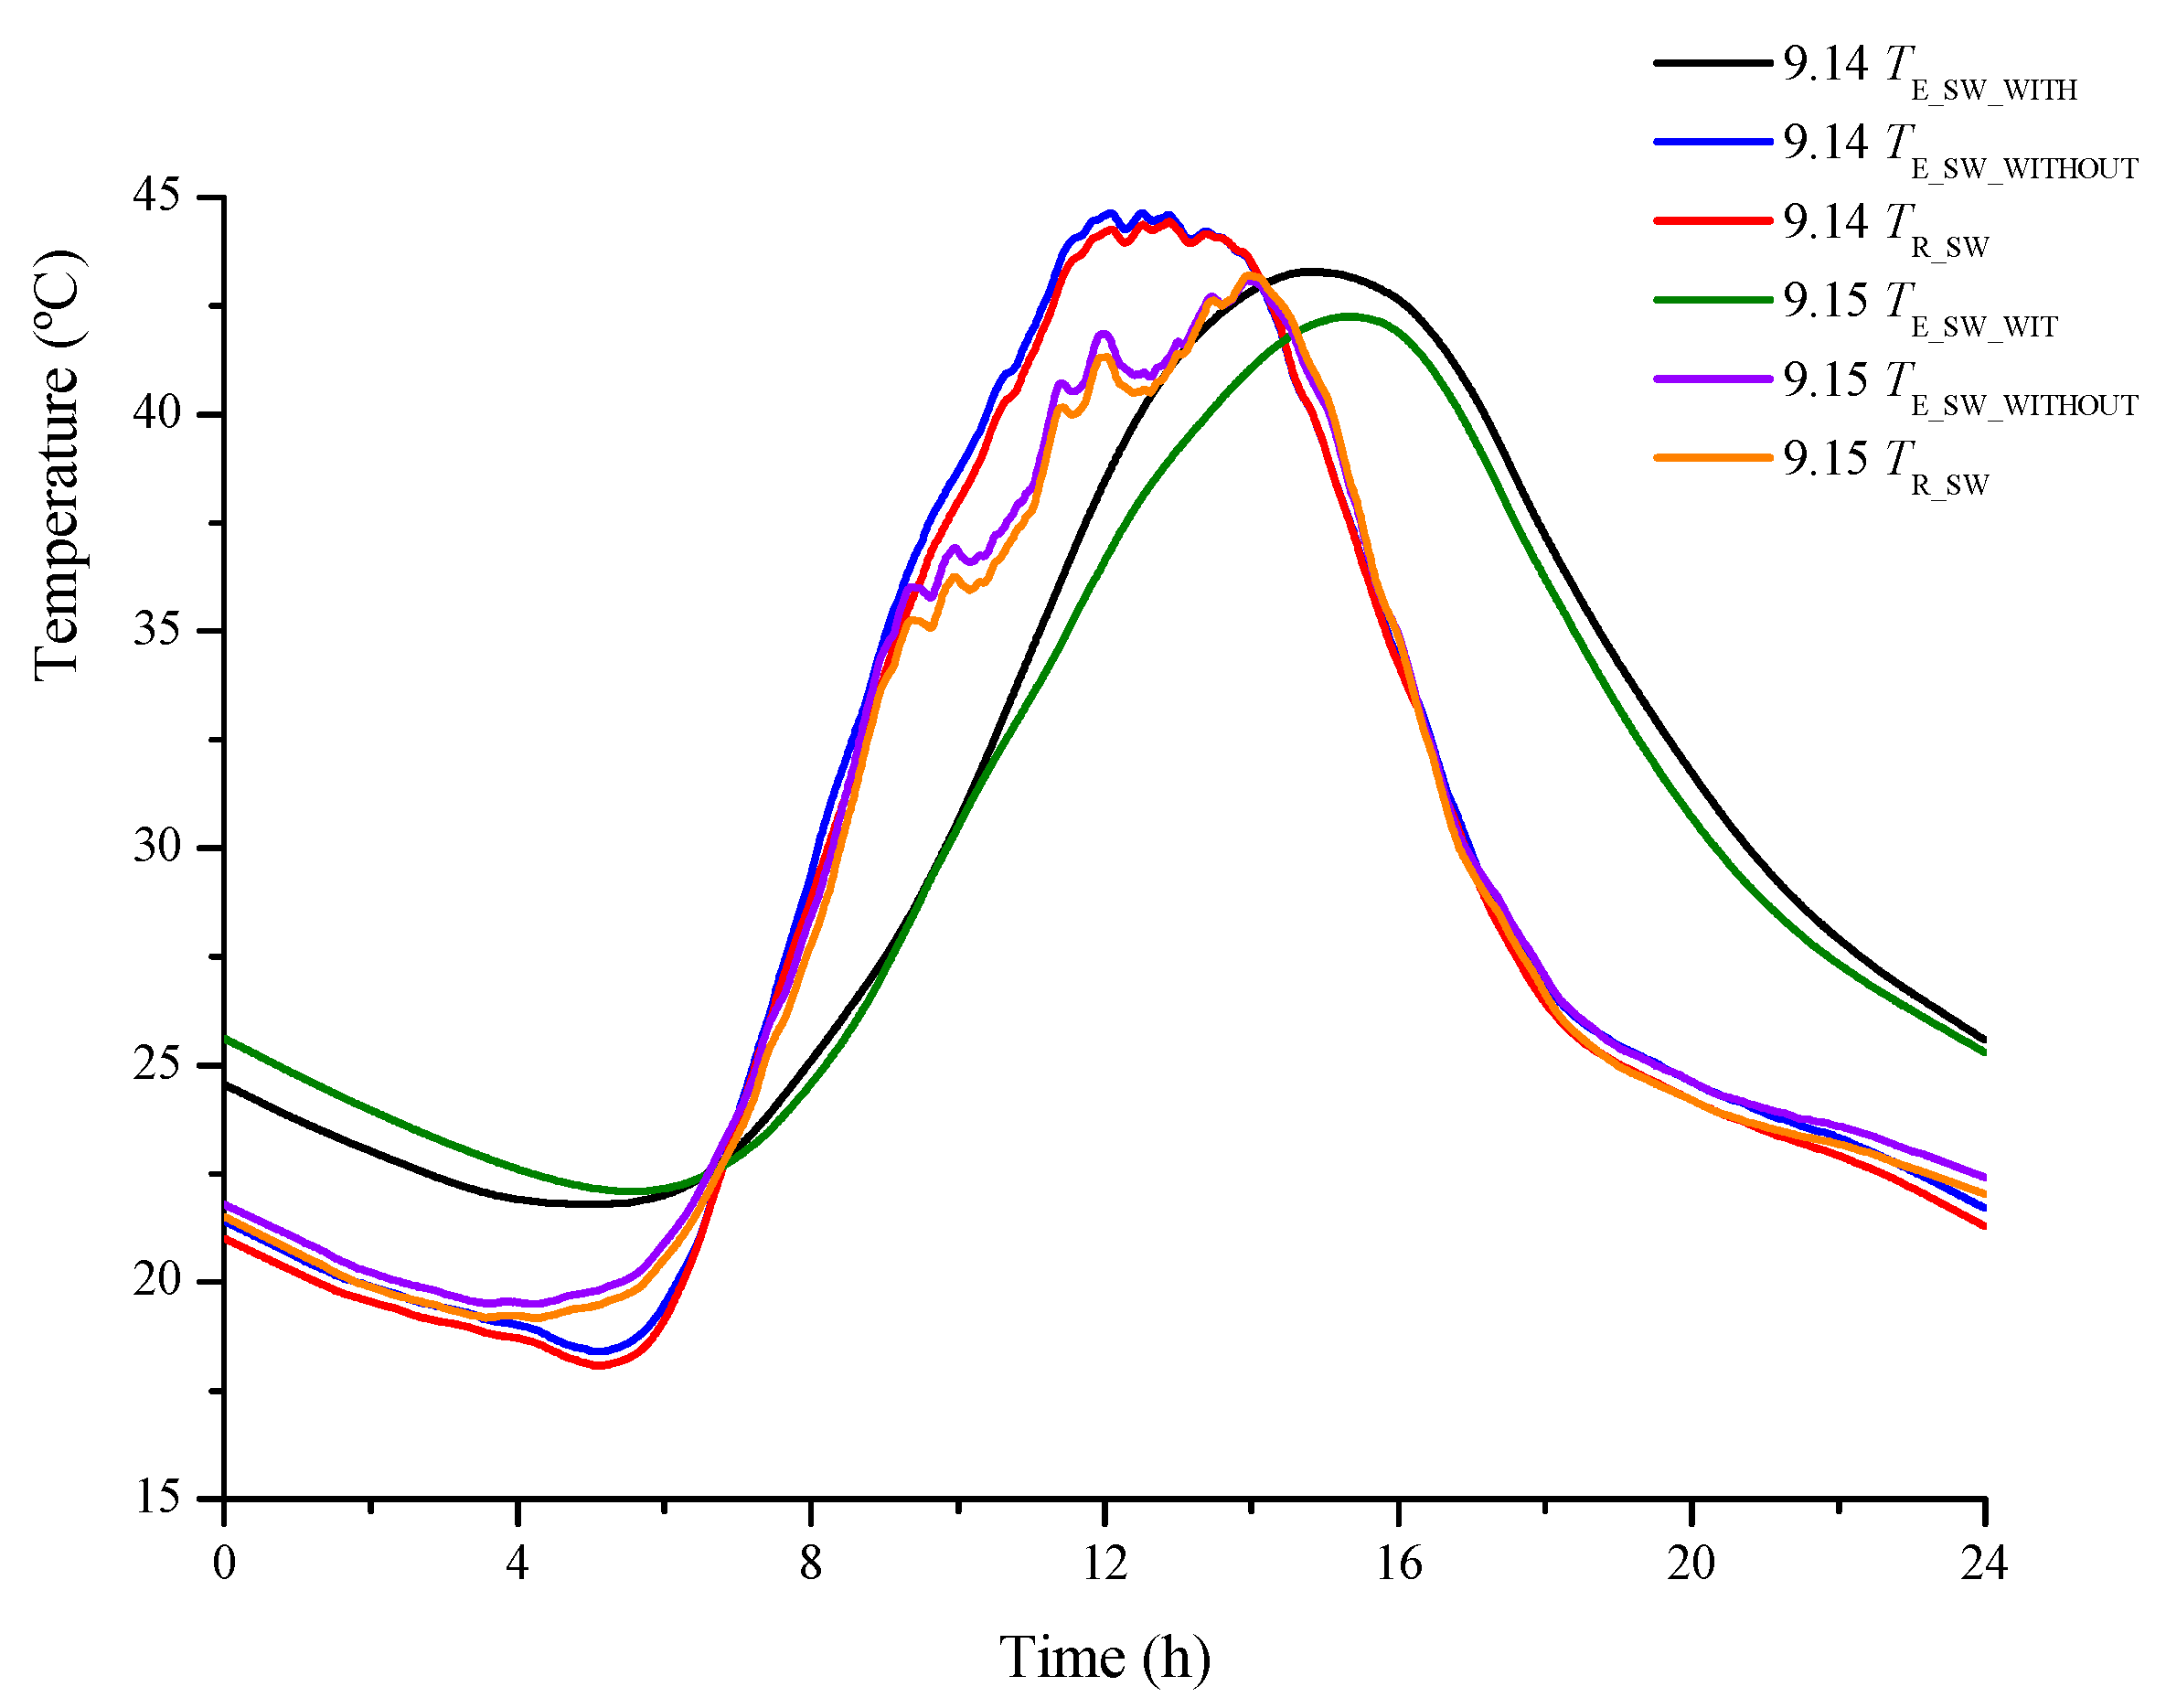
- Other comparisons between insulation wall test system and solid wall test system under vented working condition: temperature of the exterior surface of south-facing wall of experimental room with the present experimental facility in solid wall system was lower than in insulation system, demonstrating that applying the present technology in practical building scenarios can better show its performance of preventing from overheating issue of heating wall in summer.
Acknowledgments
Author Contributions
Conflicts of Interest
References
- International Energy Agency (IEA). IEA Statistics: CO2 Emissions from Fuel Combustion; International Energy Agency (IEA): Paris, France, 2014. [Google Scholar]
- Omer, A.M. Energy, environment and sustainable development. Renew. Sustain. Energy Rev. 2008, 12, 2265–2300. [Google Scholar] [CrossRef]
- Cabeza, L.F.; Castell, A.; Barreneche, C.; de Gracia, A.; Fernández, A.I. Materials used as PCM in thermal energy storage in buildings: A review. Renew. Sustain. Energy Rev. 2011, 15, 1675–1695. [Google Scholar] [CrossRef]
- Neeper, D.A. Thermal dynamics of wallboard with latent heat storage. Sol. Energy 2000, 68, 393–403. [Google Scholar] [CrossRef]
- Zhou, G.; Zhang, Y.; Lin, K.; Xiao, W. Thermal analysis of a direct-gain room with shape-stabilized PCM plates. Renew. Energy 2008, 33, 1228–1236. [Google Scholar] [CrossRef]
- Zhang, Y.; Cui, H.; Tang, W.; Sang, G.; Wu, H. Effect of Summer Ventilation on the Thermal Performance and Energy Efficiency of Buildings Utilizing Phase Change Materials. Energies 2017, 10, 1214. [Google Scholar] [CrossRef]
- Soares, N.; Costa, J.J.; Gaspar, A.R.; Santos, P. Review of passive PCM latent heat thermal energy storage systems towards buildings’ energy efficiency. Energy Build. 2013, 59, 82–103. [Google Scholar] [CrossRef]
- Sun, X.; Zhang, Q.; Medina, M.A.; Lee, K. Energy and economic analysis of a building enclosure outfitted with a phase change material board (PCMB). Energy Convers. Manag. 2014, 83, 73–78. [Google Scholar] [CrossRef]
- Reddy, K.S.; Mudgal, V.; Mallick, T.K. Thermal Performance Analysis of Multi-Phase Change Material Layer-Integrated Building Roofs for Energy Efficiency in Built-Environment. Energies 2017, 10, 1367. [Google Scholar] [CrossRef]
- Ahmad, M.; Bontemps, A.; Sallée, H.; Quenard, D. Thermal testing and numerical simulation of a prototype cell using light wallboards coupling vacuum isolation panels and phase change material. Energy Build. 2006, 38, 673–681. [Google Scholar] [CrossRef]
- Gu, Z.; Liu, H.; Li, Y. Thermal energy recovery of air conditioning system—Heat recovery system calculation and phase change materials development. Appl. Therm. Eng. 2004, 24, 2511–2526. [Google Scholar] [CrossRef]
- Saman, W.; Bruno, F.; Halawa, E. Thermal performance of PCM thermal storage unit for a roof integrated solar heating system. Sol. Energy 2005, 78, 341–349. [Google Scholar] [CrossRef]
- Ismail, K.A.R.; Henríquez, J.R. Thermally effective windows with moving phase change material curtains. Appl. Therm. Eng. 2001, 21, 1909–1923. [Google Scholar] [CrossRef]
- Li, B.; Du, C.; Yao, R.; Yu, W.; Costanzo, V. Indoor thermal environments in Chinese residential buildings responding to the diversity of climates. Appl. Therm. Eng. 2017, 129, 693–708. [Google Scholar] [CrossRef]
- Lin, B.; Wang, Z.; Liu, Y.; Zhu, Y.; Ouyang, Q. Investigation of winter indoor thermal environment and heating demand of urban residential buildings in China’s hot summer—Cold winter climate region. Build. Environ. 2016, 101, 9–18. [Google Scholar] [CrossRef]
- Luo, C.; Xu, L.; Ji, J.; Liao, M.; Sun, D. Experimental study of a modified solar phase change material storage wall system. Energy 2017, 128, 224–231. [Google Scholar] [CrossRef]


| Structural | Layer | Material | Thickness (m) | Thermal Conductivity (W/m·K) | Density (kg/m3) | Heat Capacity (J/kg·K) |
|---|---|---|---|---|---|---|
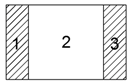 The insulation wall | 1 | Steel Plate | 0.004 | 60.5 | 7854 | 434 |
| 2 | Polystyrene | 0.1 (South Wall)/0.05 (other) | 0.04 | 15 | 1210 | |
| 3 | Steel Plate | 0.004 | 60.5 | 7854 | 434 | |
 The brick wall | 1 | Brick | 0.120 | 0.72 | 1920 | 835 |
| Properties | Unit | Number |
|---|---|---|
| Melt Point | °C | 25–27 |
| Solid Point | °C | 22–24 |
| Heat storage Capacity (From 17–32 °C) | kJ/kg | 180 |
| Thermal Conductivity | W/(m·K) | 0.6 |
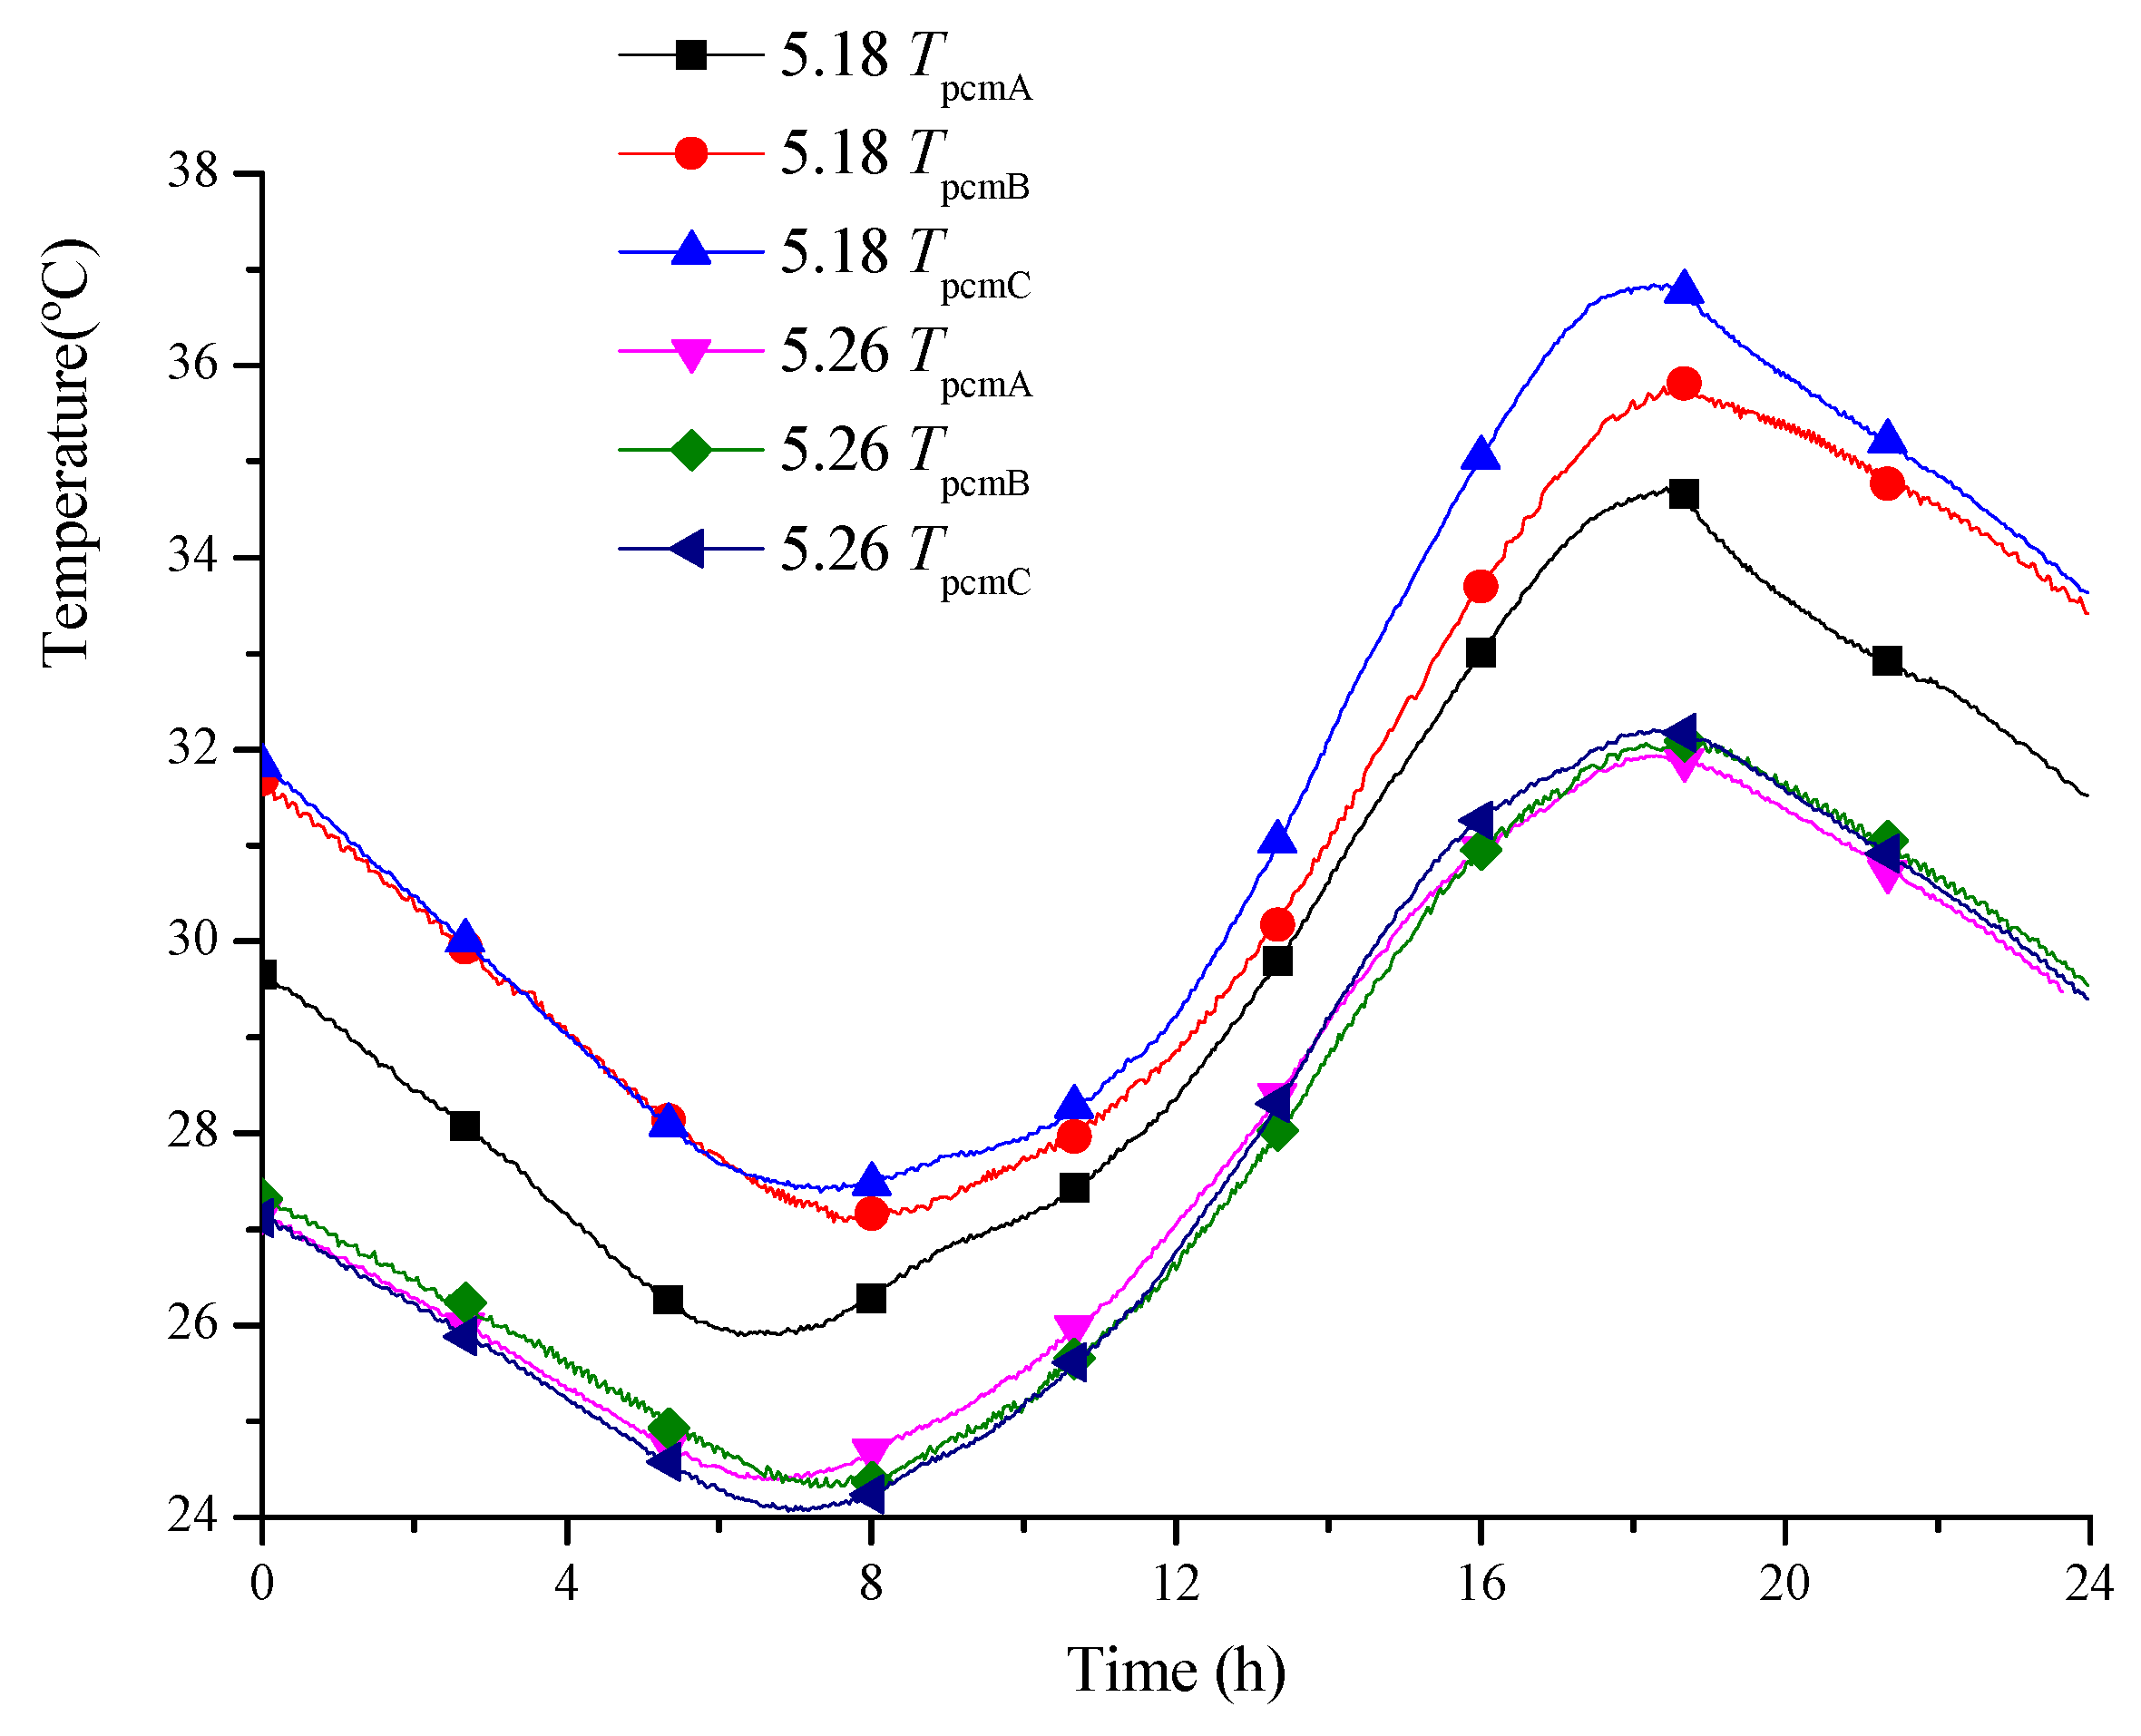
| Temperature | Tmax (°C) | Time to Reach | Tmin (°C) | Time to Reach | TAverage (°C) |
|---|---|---|---|---|---|
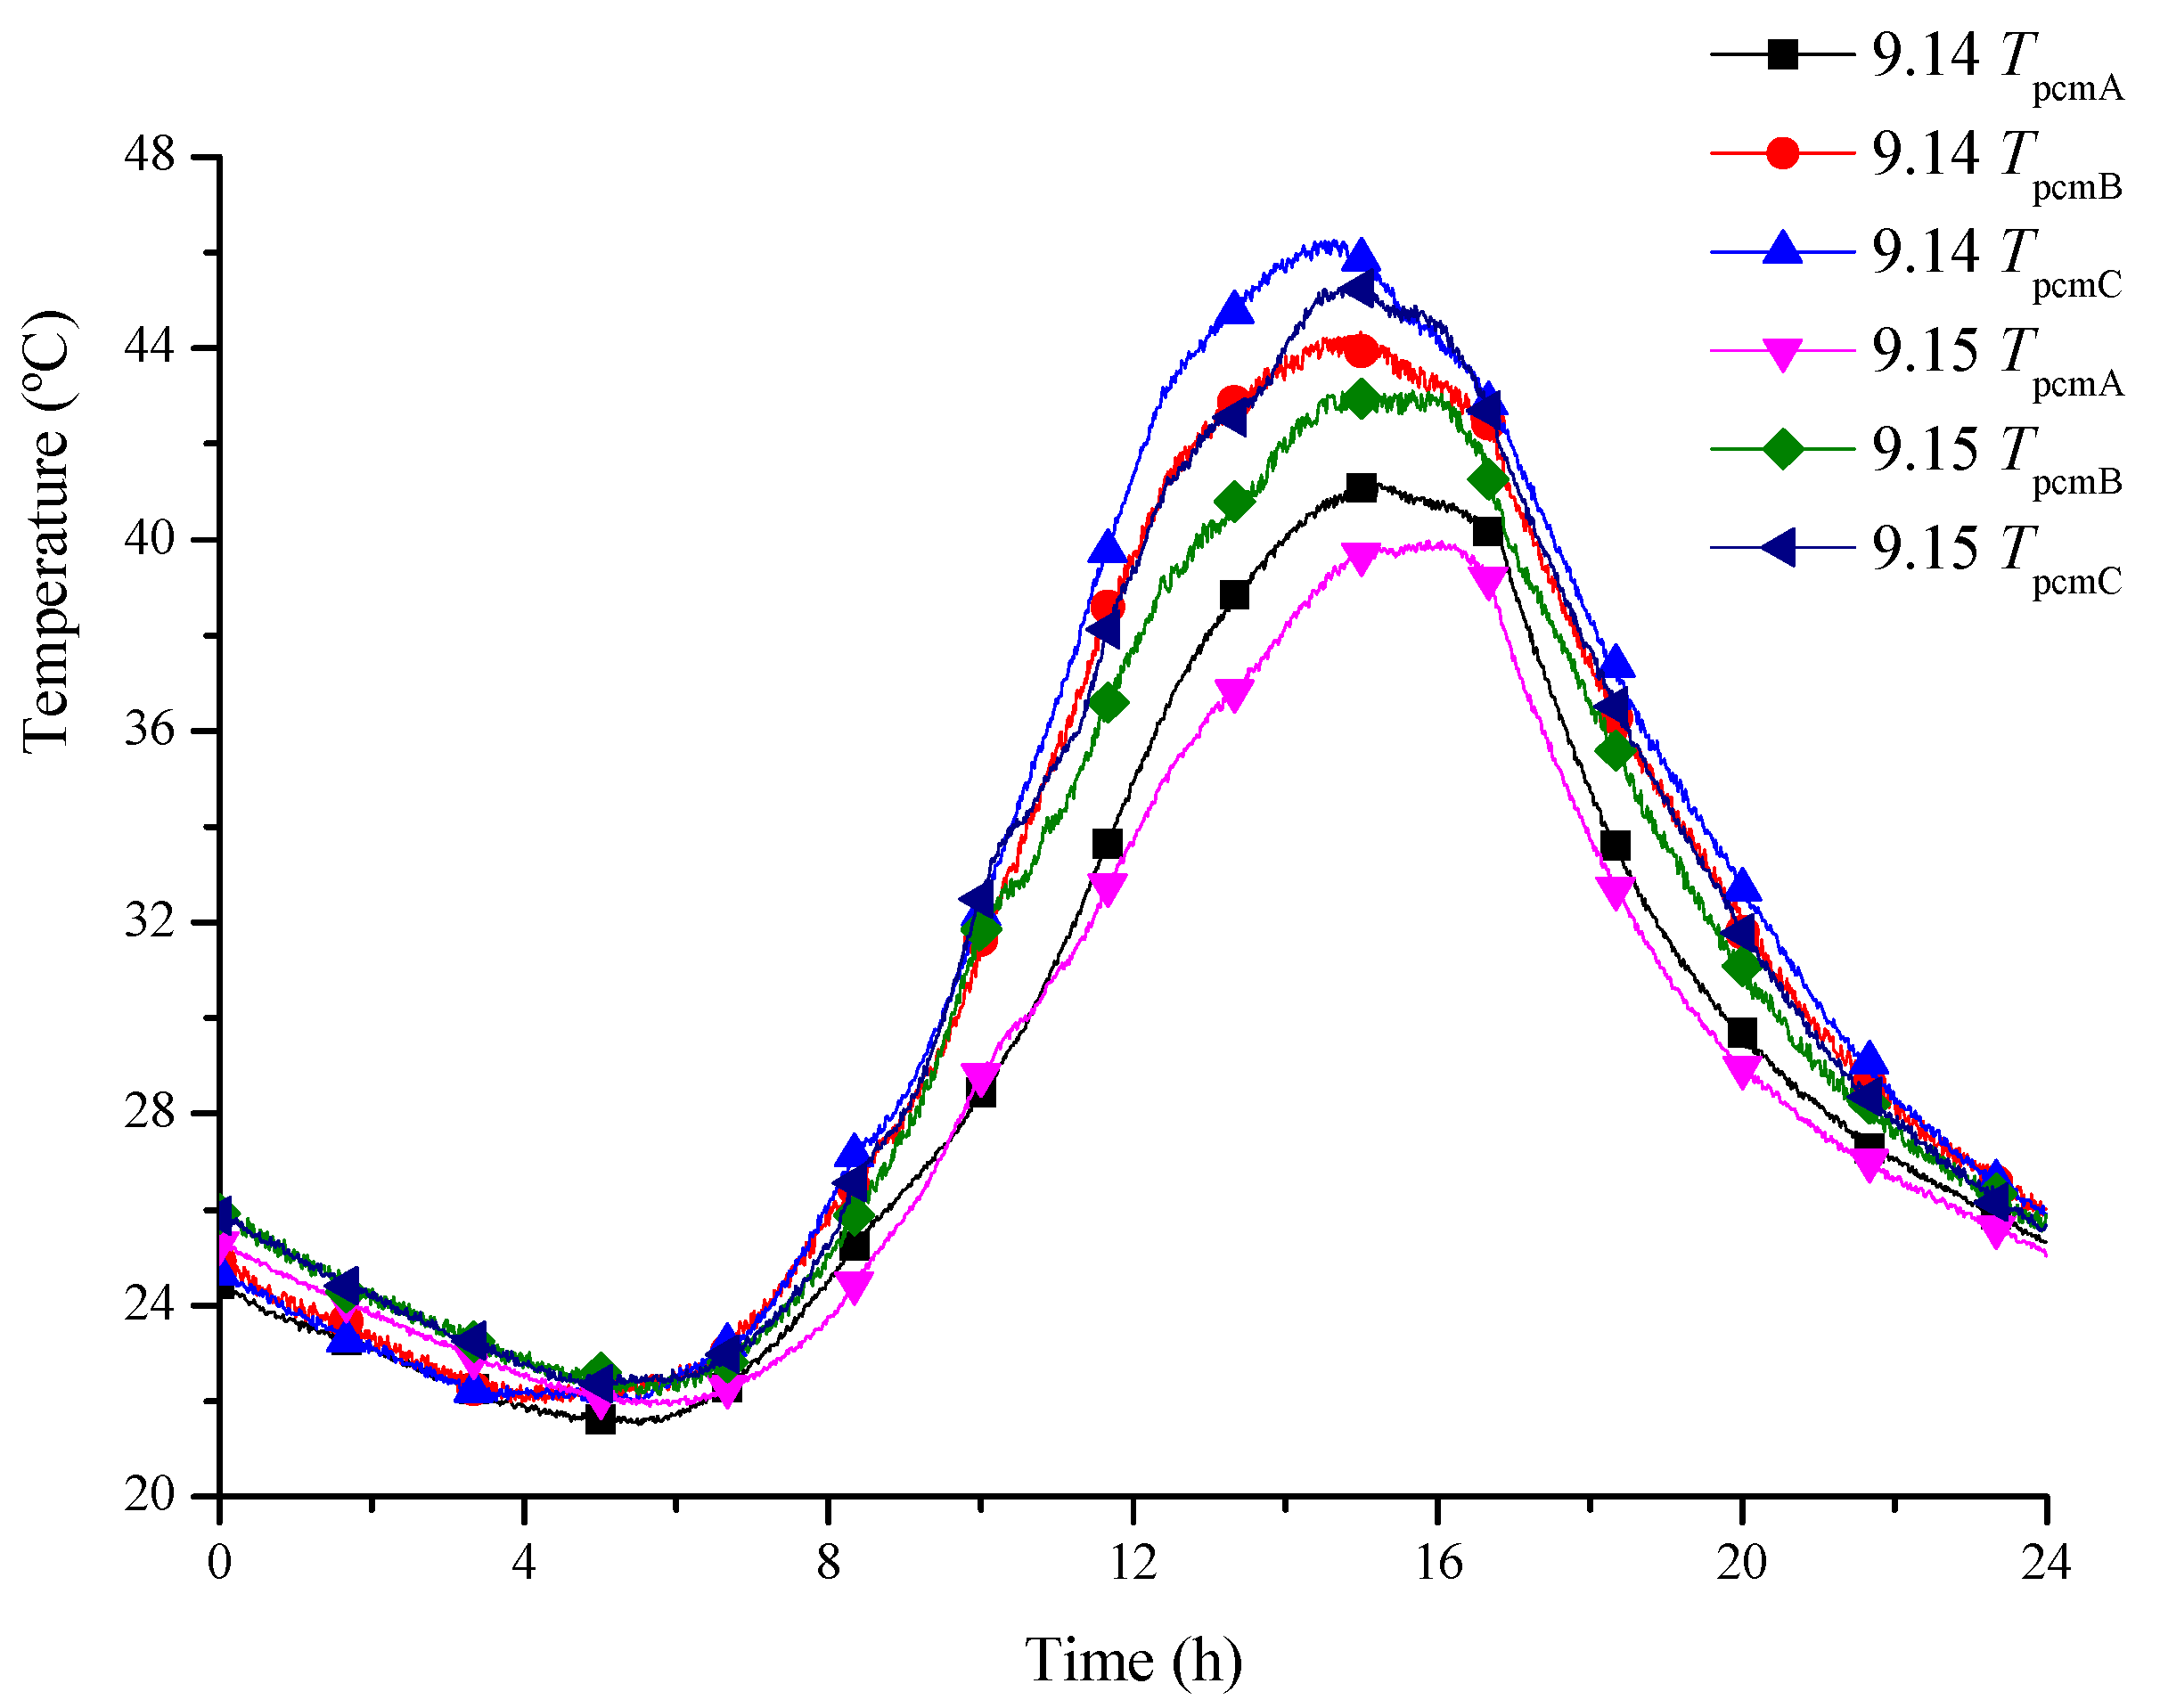
| 9.14 TpcmA | 41.2 | 15:12 | 21.5 | 5:30 | 29.3 |
| 9.14 TpcmB | 44.3 | 15:00 | 20.0 | 4:18 | 31.2 |
| 9.14 TpcmC | 46.3 | 14:40 | 22.4 | 5:24 | 31.8 |
| 9.15 TpcmA | 40.0 | 15:54 | 21.9 | 5:40 | 28.9 |
| 9.15 TpcmB | 43.1 | 15:00 | 22.1 | 5:30 | 30.7 |
| 9.15 TpcmC | 45.3 | 15:03 | 22.3 | 5:06 | 31.5 |
| Temperature | Tmax (°C) | Time to Reach | Tmin (°C) | Time to Reach | TAverage (°C) |
|---|---|---|---|---|---|
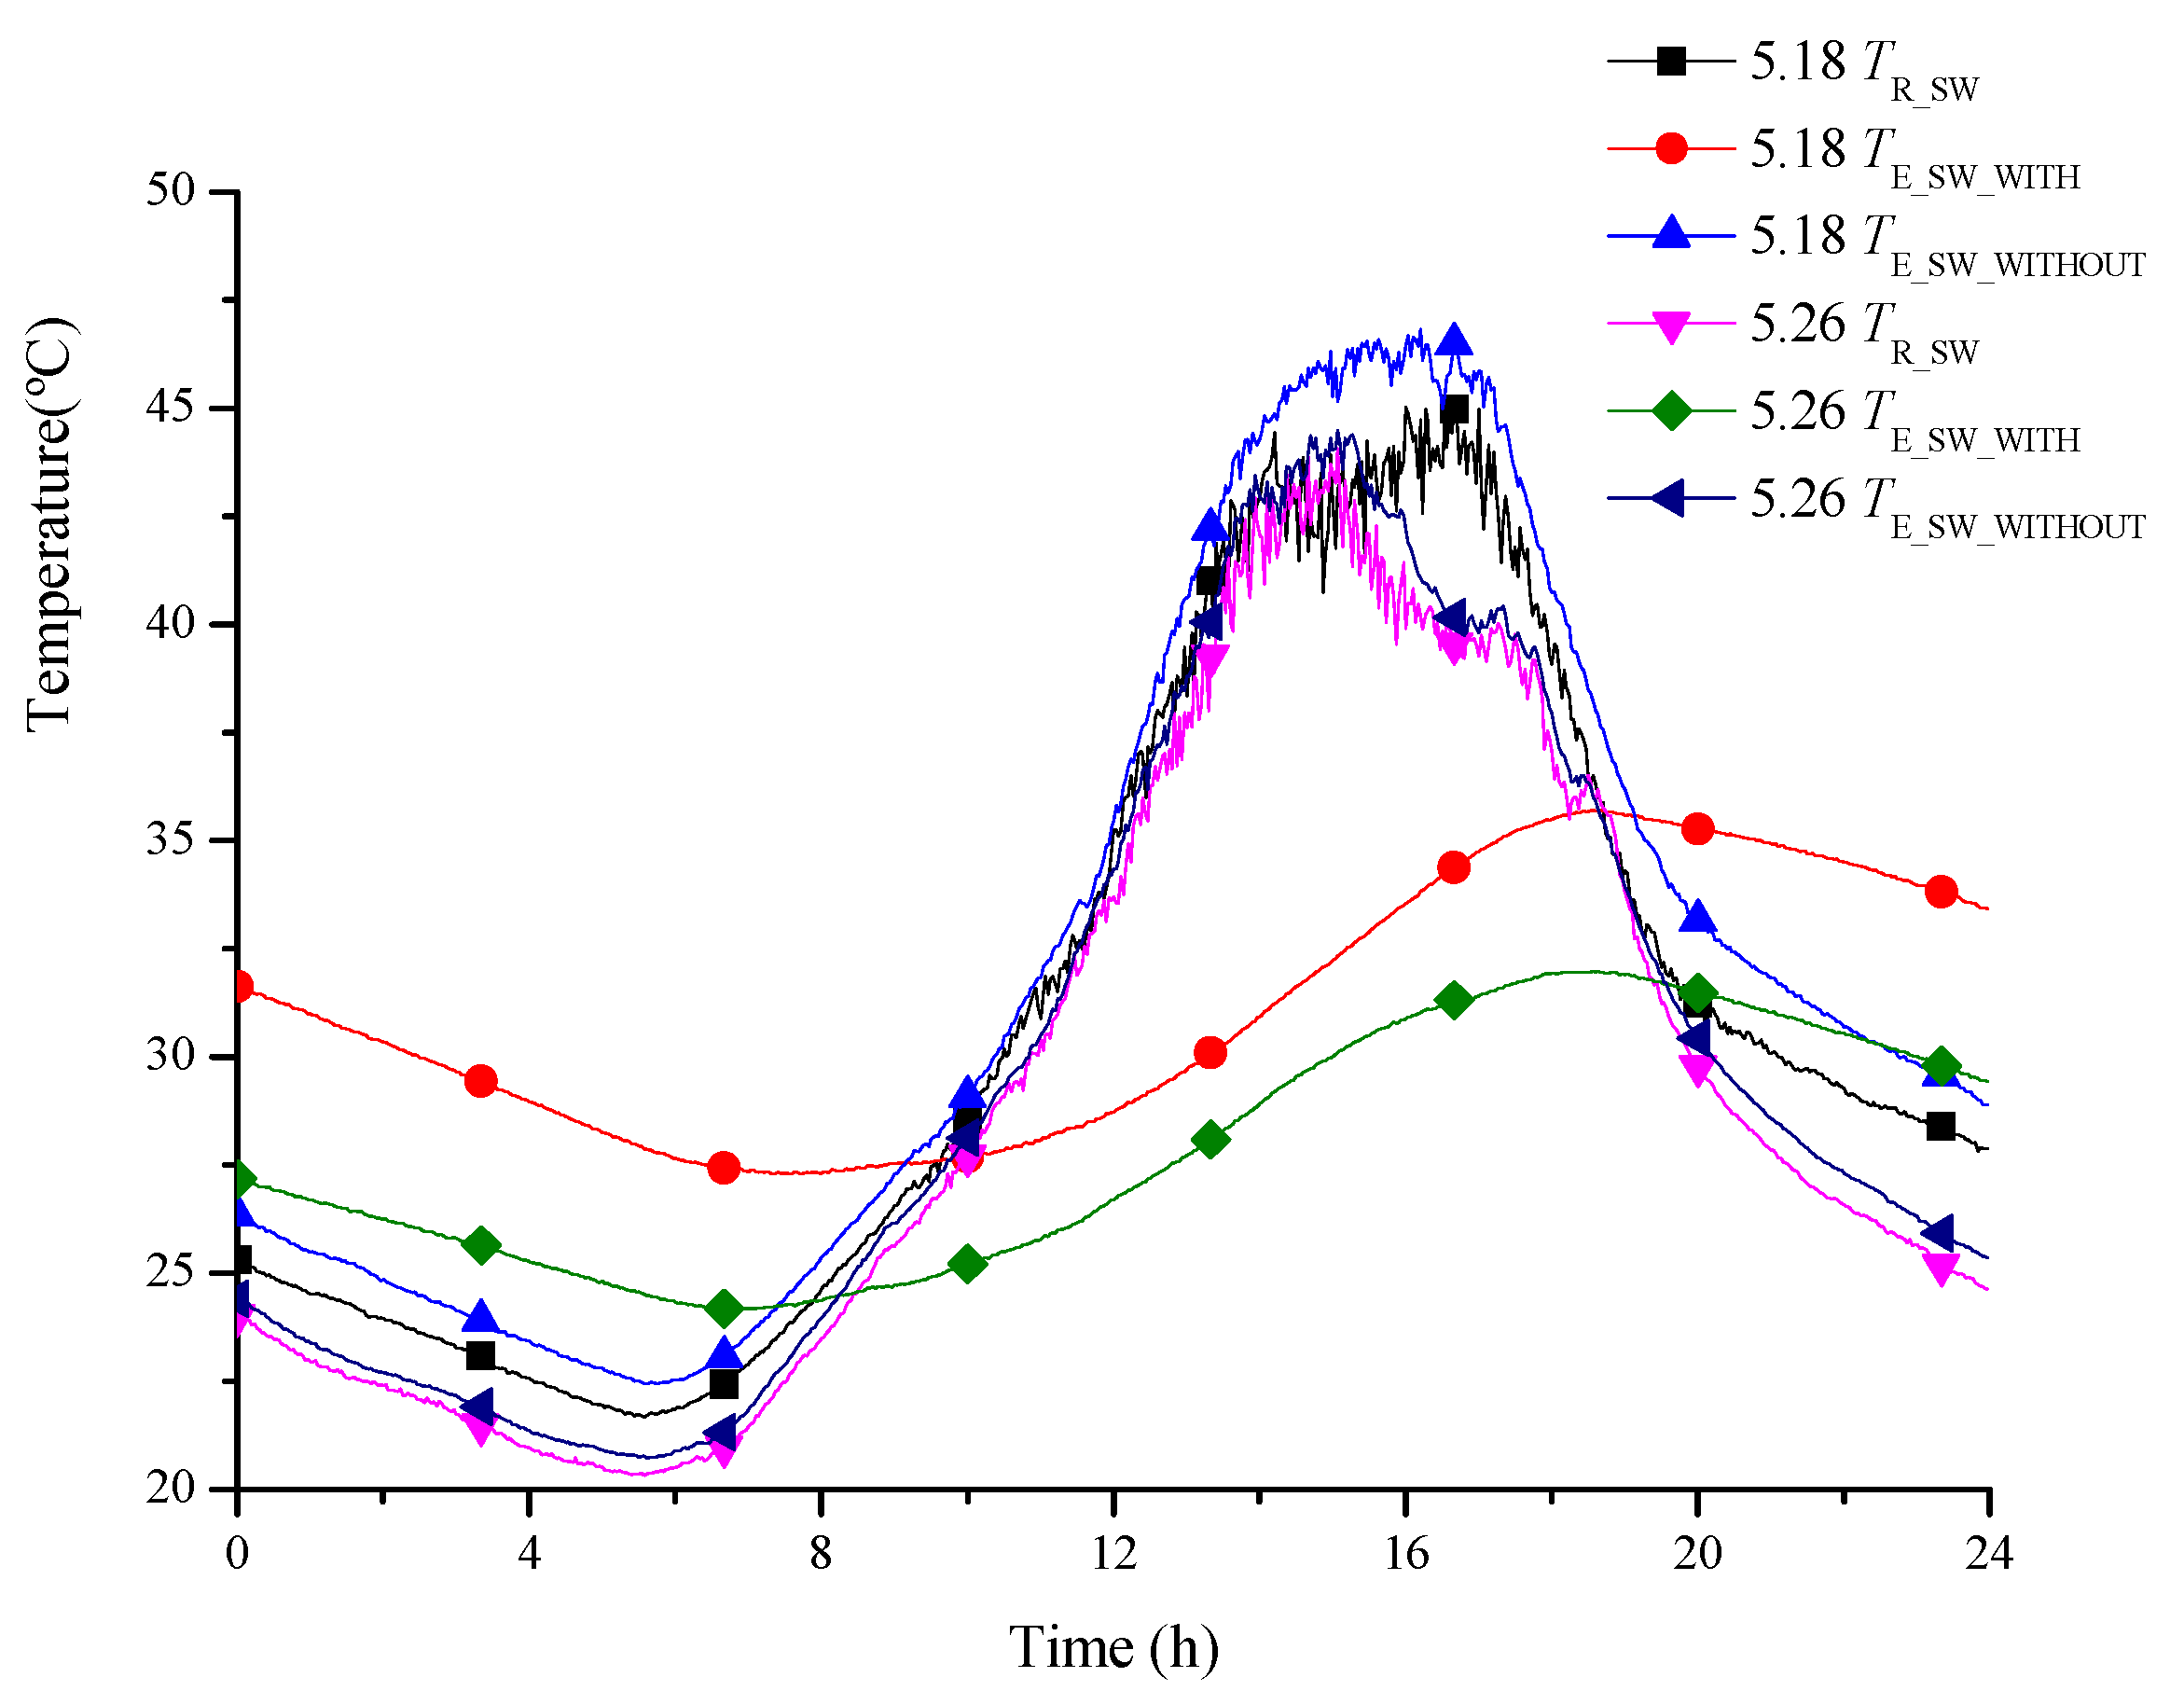
| 5.18 TE_SW_WITH | 35.7 | 18:42 | 27.3 | 7:36 | 31.1 |
| 5.18 TE_SW_WITHOUT | 46.8 | 16:12 | 22.4 | 5:38 | 32.0 |
| 5.18 TR_SW | 45.0 | 16:00 | 21.7 | 5:34 | 30.8 |
| 5.26 TE_SW_WITH | 32.0 | 18:36 | 24.1 | 6:45 | 27.8 |
| 5.26 TE_SW_WITHOUT | 44.5 | 15:05 | 20.7 | 5:36 | 29.7 |
| 5.26 TR_SW | 44.1 | 15:04 | 20.3 | 5:36 | 29.2 |
| Temperature | Tmax (°C) | Time to Reach | Tmin (°C) | Time to Reach | TAverage (°C) |
|---|---|---|---|---|---|
| 5.16 TpcmA | 34.7 | 18:25 | 25.9 | 6:14 | 29.9 |
| 5.16 TpcmB | 35.5 | 18:42 | 27.0 | 7:30 | 31.3 |
| 5.16 TpcmC | 36.8 | 18:27 | 27.4 | 7:14 | 31.6 |
| 5.26 TpcmA | 31.9 | 18:10 | 24.4 | 6:36 | 27.9 |
| 5.26 TpcmB | 32.1 | 18:36 | 24.3 | 7:18 | 27.9 |
| 5.26 TpcmC | 32.2 | 18:30 | 24.0 | 6:54 | 27.9 |
© 2017 by the authors. Licensee MDPI, Basel, Switzerland. This article is an open access article distributed under the terms and conditions of the Creative Commons Attribution (CC BY) license (http://creativecommons.org/licenses/by/4.0/).
Share and Cite
Xu, L.; Ji, J.; Luo, C.; Sun, D.; Xiong, J.; Liao, M. Comparative Research on Solar Phase Change Material Storage Wall Systems under Different Summer Working Conditions. Energies 2017, 10, 1878. https://doi.org/10.3390/en10111878
Xu L, Ji J, Luo C, Sun D, Xiong J, Liao M. Comparative Research on Solar Phase Change Material Storage Wall Systems under Different Summer Working Conditions. Energies. 2017; 10(11):1878. https://doi.org/10.3390/en10111878
Chicago/Turabian StyleXu, Lijie, Jie Ji, Chenglong Luo, Dan Sun, Jihai Xiong, and Mengyin Liao. 2017. "Comparative Research on Solar Phase Change Material Storage Wall Systems under Different Summer Working Conditions" Energies 10, no. 11: 1878. https://doi.org/10.3390/en10111878
APA StyleXu, L., Ji, J., Luo, C., Sun, D., Xiong, J., & Liao, M. (2017). Comparative Research on Solar Phase Change Material Storage Wall Systems under Different Summer Working Conditions. Energies, 10(11), 1878. https://doi.org/10.3390/en10111878