Article

Joint Evaluation of the Wave and Offshore Wind Energy Resources in the Developing Countries

Department of Mechanical Engineering, Faculty of Engineering, “Dunărea de Jos” University of Galati, 47 Domneasca Street, 800008 Galati, Romania
*
Author to whom correspondence should be addressed.
Energies 2017, 10(11), 1866; https://doi.org/10.3390/en10111866
Submission received: 8 October 2017 / Revised: 10 November 2017 / Accepted: 12 November 2017 / Published: 15 November 2017
(This article belongs to the Section L: Energy Sources)

Abstract

:
The objective of the present work is to assess the global wind and wave resources in the vicinity of some developing countries by evaluating 16-year of data (2001–2016), coming from the European Centre for Medium range Weather Forecast (ECMWF). Until now, not much work has been done to evaluate and use the renewable energy sources from these marine environments. This is because most of the attention was focused on more promising areas, such as the European coasts, which are more advanced in terms of technical and economical aspects. A general perspective of the current energy market from the selected target areas is first presented, indicating at the same time the progresses that have been reported in the field of the renewable energy. Besides the spatial and seasonal variations of the marine resources considered, the results also indicate the energy potential of these coastal environments as well as the performances of some offshore wind turbines, which may operate in these regions.

Graphical Abstract

1. Introduction

The energy demand and the quality of life are closely related; in the sense that a developed country can manage the energy needs to support development at an acceptable cost [1]. The coastlines cover a total length of 1,634,701 km, being shared by almost 84% of the world countries, with the mention that most of the people live and work within about a 100 km strip [2] from the coast (ex: Australia—89.8%; Brazil—48.6%; Somali—54.8% or Vietna—82.8%). It is important to highlight that the energy supply remains a constant challenge since the power outages represent common events, especially in developing countries [3,4]. The coastal areas are defined by unique features. They are dominated by the action of the natural forces, such as wind and waves, which significantly vary in intensity from one site to another. A proper understanding of these forces is essential for any coastal project, regardless if we discuss beach stability, shoreline protection, harbor design, or renewable energy projects [5]. Regarding the renewable sources, there are increasing voices that consider that the mixed wind-wave projects represent a viable solution for the near future [6,7,8], taking into account that a similar approach was already used for other energy sources [9,10,11,12,13,14].
From this perspective, the aim of present work is to provide a complete picture of the wind and wave resources distribution from the coastal environments of some developing countries, from a meteorological point of view, and also by assessing the local energy potential from the perspective of a renewable project. A significant amount of the research reported on a global scale are carried out only for a single marine parameter (wind or wave) and in general the main concerns are related to the long-term environmental studies (ex: climate change) or to the validation of some numerical models [15,16,17]. If we discuss the renewable studies, in general the researches are focused on “hot-spot” areas, as defined by important energy resources, such as the European coasts, while the developing countries are not in general taken into account, since some other socio-economical issues are considered to be more stringent [18,19,20,21,22,23]. In order to support these comments, an extensive literature survey will be provided next. Therefore, from the knowledge of the authors, the current work represents the first study of this kind focused on a global scale, which takes into account two marine parameters reported for developed and least developed countries, which can be considered as an element of novelty.
Eurek et al. [24] carried out an assessment of the global wind resources throughout a 21-year collection of data. In this case, the considered reference sites are in areas with substantial wind resources, which are located between the latitude 30° and 60° (north and south). Although a significant time interval was analyzed, the reported results are only available until the year 2005. Another important work is presented by Lu et al. [25] where the global wind energy potential was evaluated only for the year 2006. In this case, a brief description of the U.S offshore wind potential is given by taking into account the monthly fluctuations. In Hemer and Trenham’s study [26], the global distribution of the wind wave was evaluated, but the core of this work was related to the skill of the considered wave climate model, which was forced with a high-resolution wind. The wind and wave pattern was also evaluated in Stopa and Cheung’s study [27], considering a time period from 1979 to 2009, in this case, the research being related to the evaluation of the climate cycles reported around the globe. Similar studies were carried out by Dobrynin et al. [28], Jiang and Chen [29] or Semedo et al. [30]. As for the renewable energy, most of the studies are focused on areas that are located close to developed states. This is the case of the Mediterranean Sea, where the regional wind conditions were studied in detail [31,32,33,34,35], or of the Atlantic region, where the wave energy is considered to be more consistent [36,37,38]. Another type of studies are related to remote basins, which are not so well known for their wave energy potential, such as in the case of China Sea, Mediterranean and Black seas, or Korean Peninsula [39,40,41,42]. In Pastor and Liu’s study, a methodology was presented, where the wave energy in the vicinity of the Dauphin Island, United States was indirectly evaluated by reconstructing the overall wave spectra [43]. The Gulf of Mexico was also considered for investigation, and although hourly in situ data were used, the investigation is restricted to a time interval from 2010 to 2012 [44]. Due to the tropical storms, which frequently occur in this region, in the present work, this coastal environment was not considered for evaluation since the extreme conditions may represent a threat for the integrity of the wind and wave generators. A complete description of the studies that is focused on the assessment of the global wind and wave resources will be difficult to carry out since the literature is quite diverse and complex, being focused on: statistical analysis of various databases; numerical simulations; or performance assessment of the wind and wave energy converters.
Besides a better understanding of the marine resources from the developing areas, the results that will be presented in the present work may be considered important for real life applications. For example, in the case of a renewable project it is important to accurately identify the energy profile of a particular site in order to configure a project according to the local specifications. By using a single offshore site and two energy components, it is possible to develop a sustainable project [45,46,47,48] where the wind and wave systems will share the same infrastructure. In order to check the viability of this solution, the developing countries can be selected for implementation, helping in this way the local community throughout stand-alone microgrids systems [49,50,51,52,53,54]. Beach erosion and coastal storm protection represent other important topics for the coastal areas, if we take into account that numerous commercial and touristic sectors are located here. By using specific reference sites, instead of a spatial energy map, it will be possible to assess in more detail the wind and wave energy characteristics from the northern and southern hemispheres. Since the current work is based on the statistical analysis of the marine database, the current approach can be easily extended to some other areas or can be used to evaluate in details a particular site.
From this perspective, the innovations presented in this study can be summarized as follows:
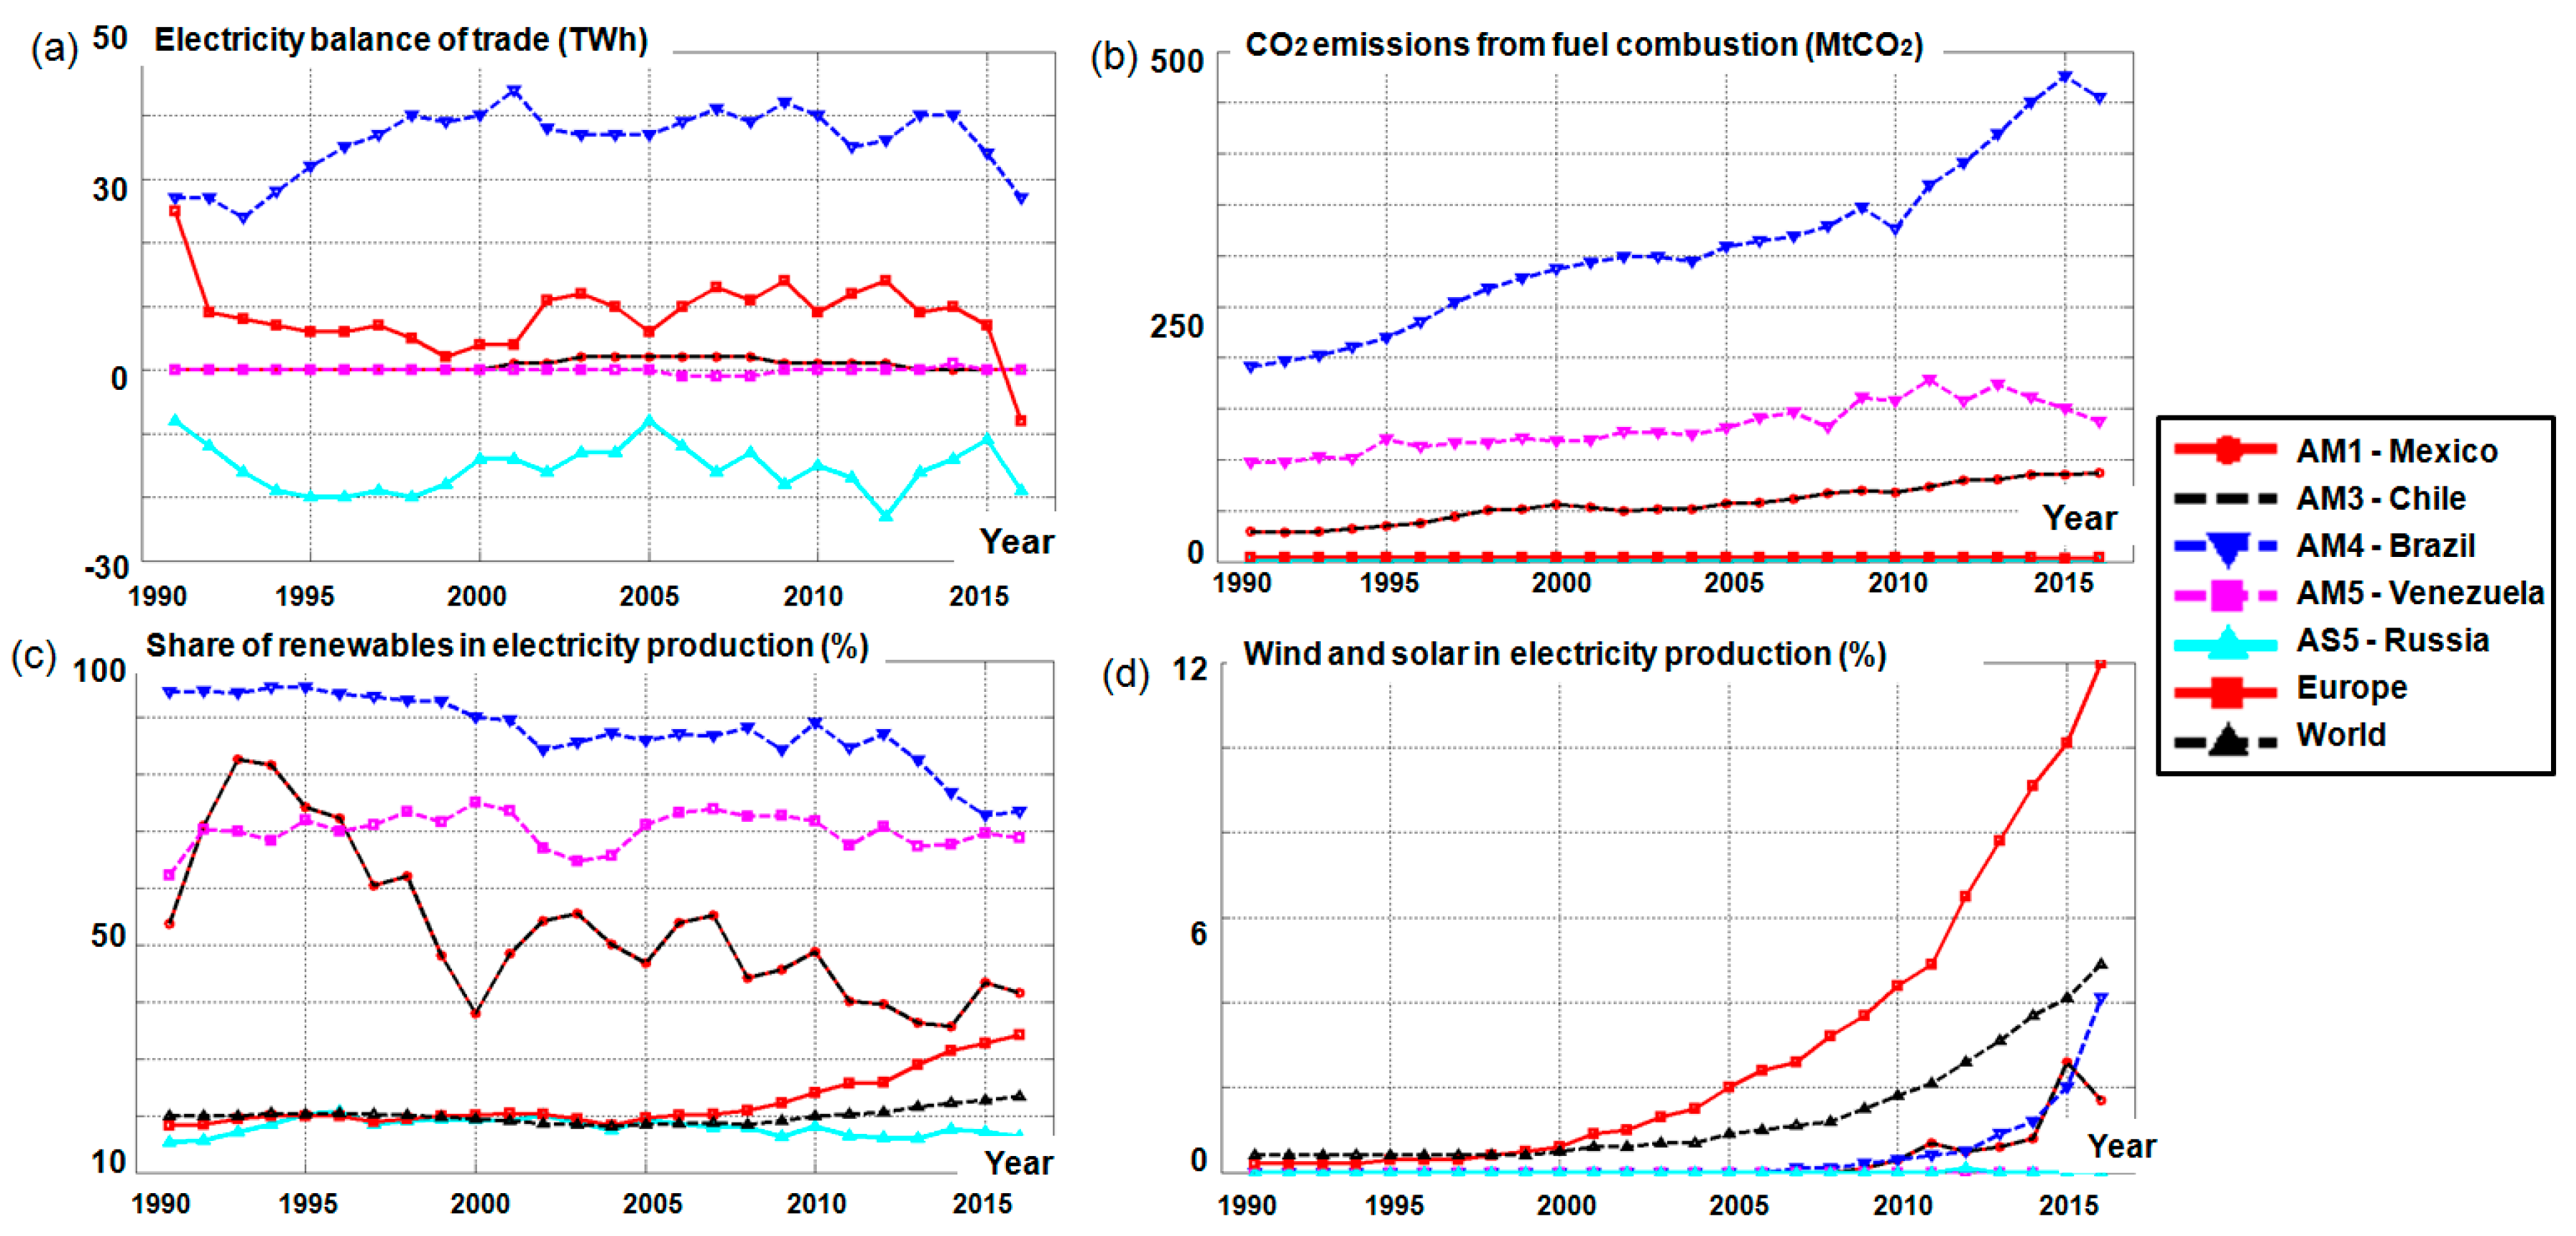
  • Assessment of the energy budget reported for several developing countries, by taking into account the processes that are related to the fossil fuel consumption and the interest of these countries for the renewable energy projects;
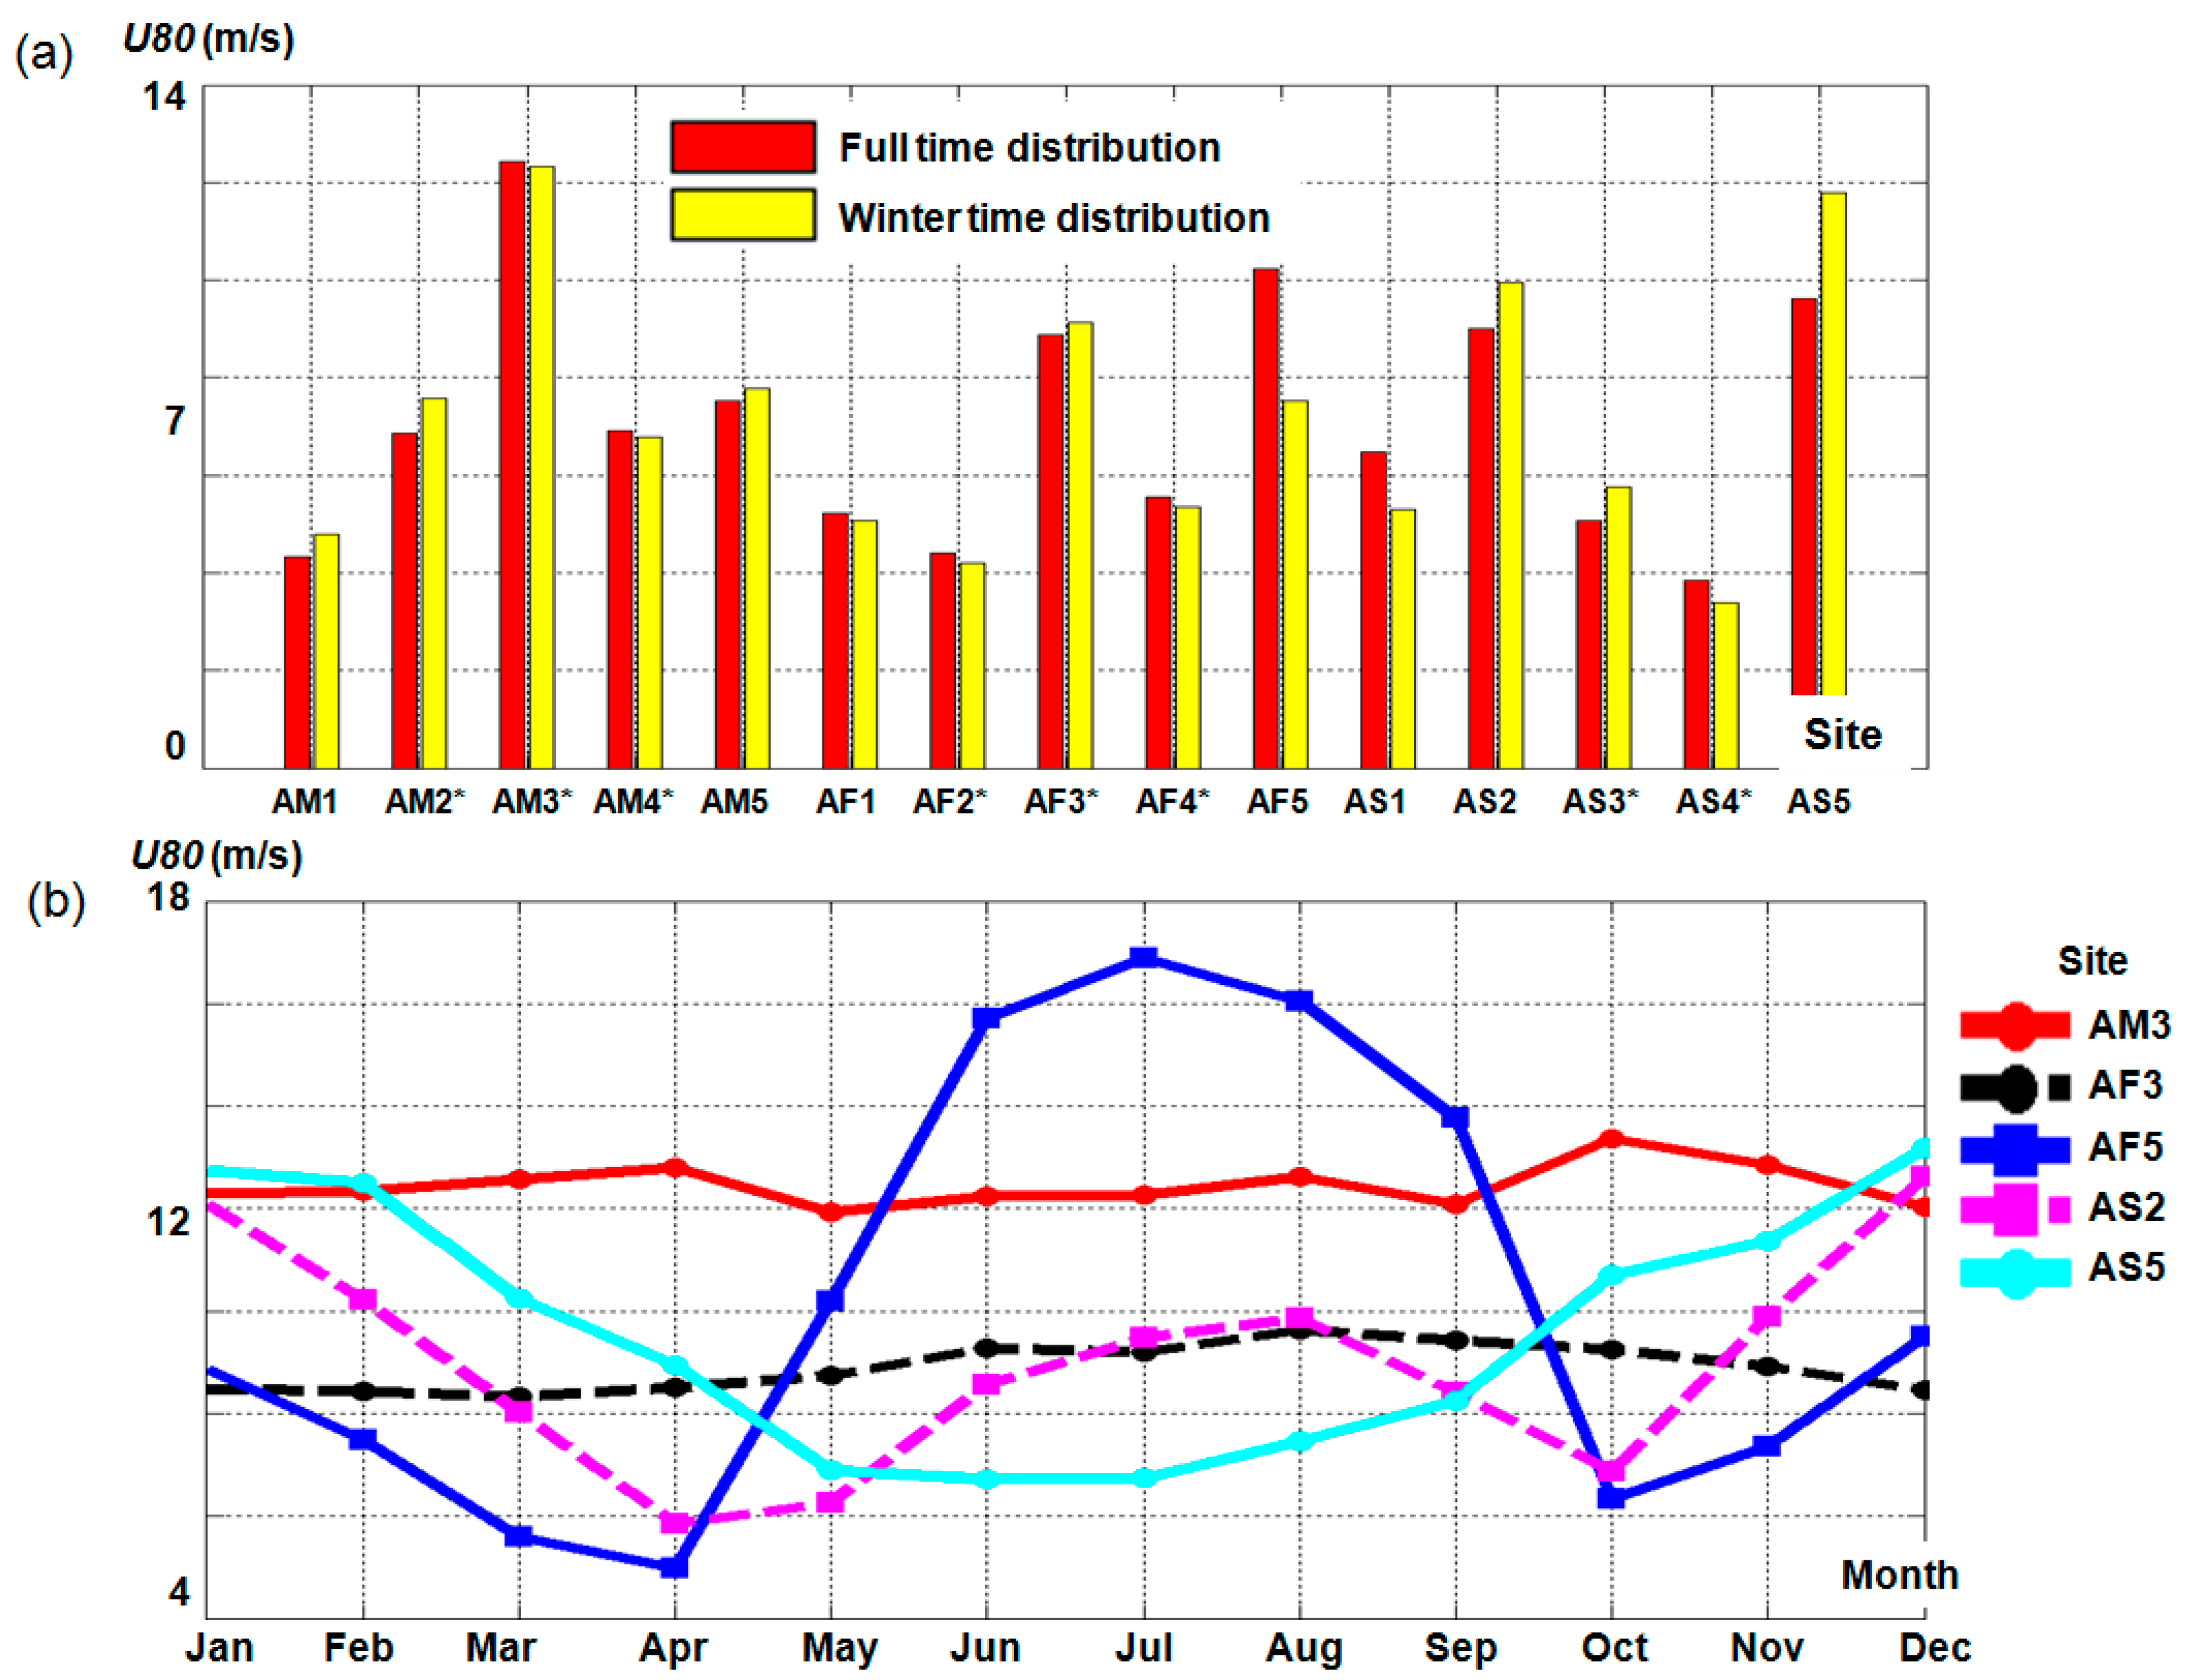
  • A better understanding of the global wind and wave conditions from a meteorological point of view by taking into account fifteen different references sites. In this case will be evaluated the monthly, seasonal and inter-annual variations;
  • Establish the energy profile of each site by using specific parameters;
  • Identify the performances of some common offshore wind turbines, which may operate in these coastal environments.

2. Methods and Materials

The methodology considered in the present work is simple but at the same time robust. After processing the NetCDF (Network Common Data Form) files from the European Centre for Medium range Weather Forecast (ECMWF) server, which contain wind and wave information, a time series for each reference site will be obtained. Then, by using statistical analysis of the specific parameters, it will be possible to identify the seasonal variations and the energy profile of each site and also to make direct comparisons between them. Since all of the sites are located close to the shoreline, the benefit of using reanalysis data from ECMWF in the detriment of satellite measurements is related to the accuracy. The ECMWF time series are defined by 100% valid data, while in the case of the altimeter measurements it is possible to register gaps in the time series, also known as NaN (Not a Number), which represents a common problem for the coastal environments [35,55,56]. As a limitation, it is important to mention that from the previous comparisons of the ECMWF wave data, with in situ measurements it was reported that these simulated values tend to underestimate the peak values, especially from the higher power class. Nevertheless, these missing peaks represent a common issue for the numerical wave models [57].

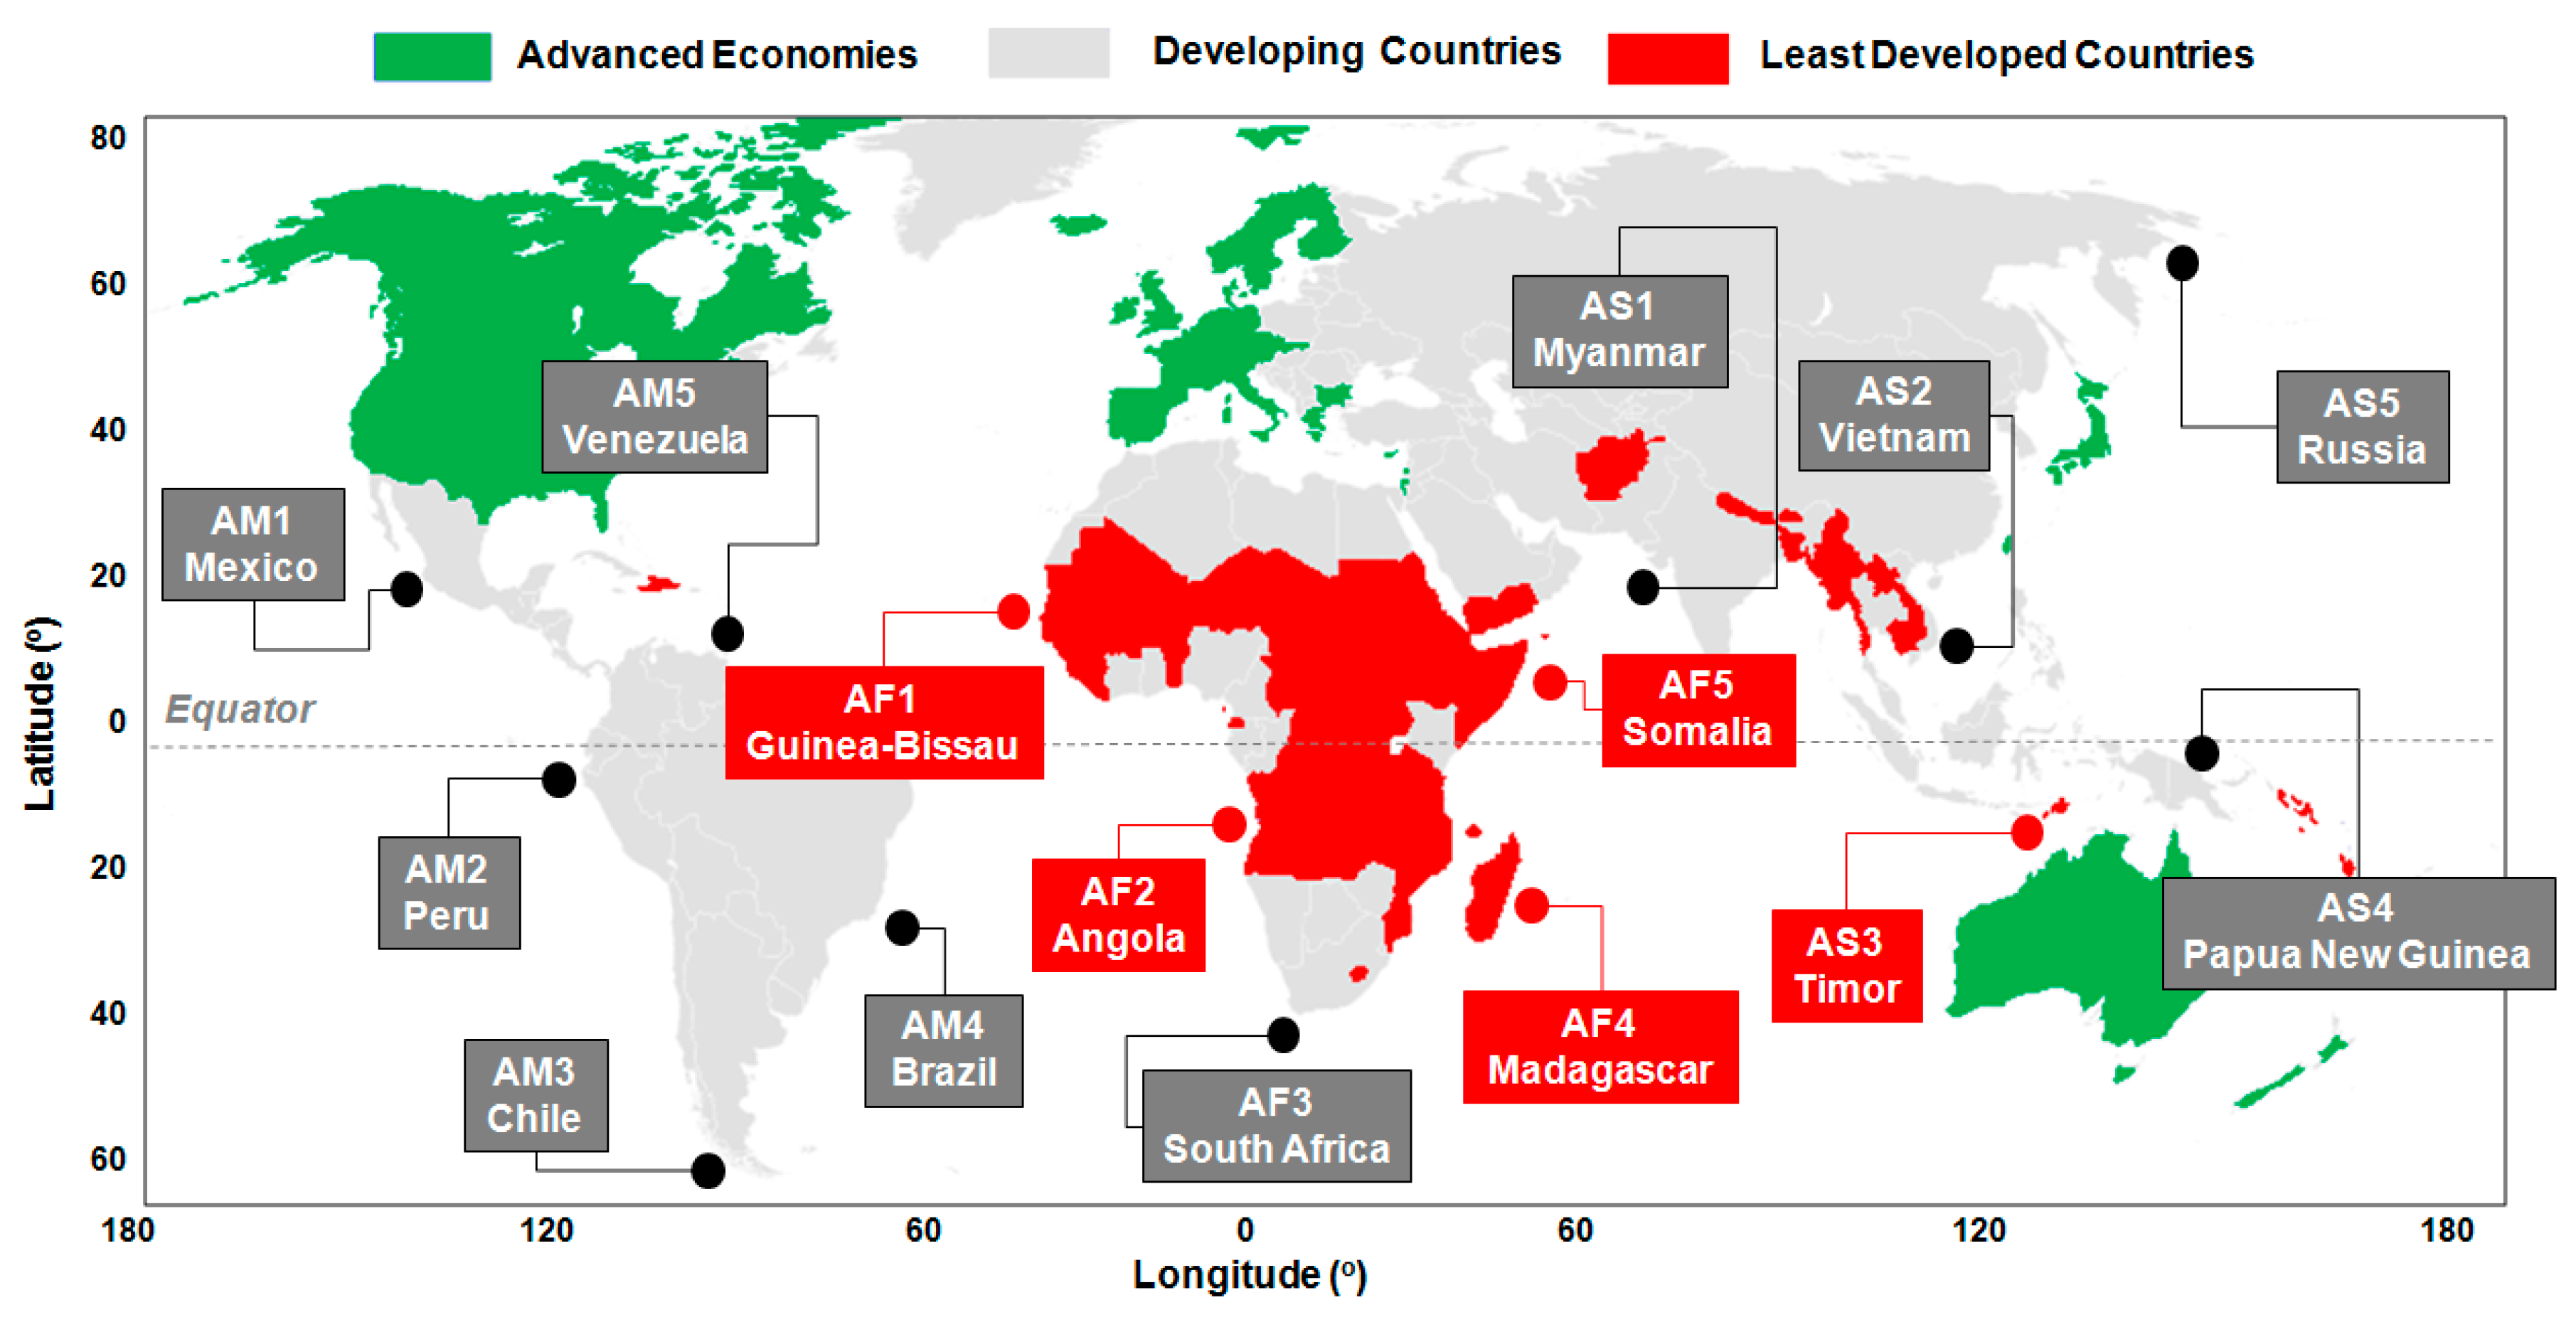
2.1. The Target Areas

Figure 1 presents the locations of the reference sites considered and also the development level corresponding to each geographical region. A total of fifteen sites was defined in the vicinity of the coastal environments of America, Africa, and Asia, from which eight sites are located in the Southern hemisphere. As can be seen from the figure, a significant percentage of the African region is included in the least developed countries category, so from this perspective the urge for energy should be more stringent in this area. By using a specific reference site, it will be easier to assess the potential of that site, compared to a spatial map where the values can be only approximated.

2.2. ERA-Interim Global Wind and Wave Data

The wind and wave data considered in the current study are provided by the ERA-Interim database, which is a global reanalysis project, which is maintained by the European Centre for Medium-Range Weather Forecasts [59]. Since this is a global database, the meteorological products are obtained and calibrated throughout a data assimilation system, which involves a four-dimensional variational system, which is capable of incorporating observations coming from multiple satellites or in-situ stations [60]. If discussing the wind data, it is important to mention that almost 98% of the assimilated values are provided by the satellites from which there can be mentioned the missions QuikScat, Geo/MODIS or European Remote Sensing (ERS). The wind parameters (speed and direction) are reported to a height of 10 m above the sea level, being processed throughout a high resolution forecast system, capable of generating values on a global scale at every 6 h [61]. Regarding the wave data, the ECMWF database is connected to the WAM (Wave Model) model, which is implemented on a global scale. The core of this model is represented by a computational grid of 0.36° × 0.36°, which computes a wave spectrum that is defined by 24 directions and 30 frequency bins, respectively. On a local scale, the model can be run at a higher resolution (0.25° × 0.25°), in order to simulate the shallow water effects, this being the case of the North Sea or of the Black Sea. It is important to mention that the hindcast values are adjusted by using satellite data [61,62].
The reanalysis database covers the entire period from 1979 till present, but for the current work, only a 16-year period (2001–2016) was taken into account for the wind and wave data. The following wave parameters were considered: (a) significant height of combined wind-waves and swell (Hs), (b) mean wave period (Te), and (c) mean wave direction (Dir). Each parameter is daily reported with a spatial resolution of 0.75° × 0.75° and a 6-h time step (00-06-12-18 UTC). A similar spatial and temporal resolution was used in the case of the wind speed and direction, with the mention that the original values reported at a height of 10 m where adjusted to a level of 80 m (U80 wind speed) throughout a logarithmic formula [63]. This is because most of the commercial wind turbines operating on land or offshore are defined by a hub height that start from this level [64,65], and one of the purpose of this work is to identify their general performances.
Several key parameters are used to assess the energy potential and the consistency of the wind and wave resources. The first one is the wind power density (WPD) index, which is frequently used to identify the energy potential of a particular site by evaluating the energy concentrated in the air flow. It can be defined by the following expression [66]:
W P D = 1 2 × ρ × U 8 0 3
where, ρ represents the air density (≈1.22 kg/m3) and U80 the wind speed reported at a height of 80 m above sea level. The WPD parameter is considered to be a comprehensive index in assessing the wind resources being possible to define a particular site by using classes of wind power density, which reveal the energy potential. As can be observed, the energy potential of a site is proportional to the cube (the third power) of the wind speed, being also influenced by the density of the air [67].
Another important index is the wave power (Pw), reported for the deep water conditions, which is obtained throughout the expression [40,68]:
P w = ρ × g 2 64 × π × T e × H s 2
where: Pw—energy flux (kW/m), ρ —density of the seawater (1025 kg/m3), g—gravitational acceleration (9.81 m/s2), Te (s)—wave energy period which represent the ratio of the first negative moment of the spectrum to the zeroth moment of the spectrum, Hs (m)—significant wave height, which represent the mean wave height of the highest third of the waves. The wave height and period represent are frequently used to describe the sea state from a meteorological point of view. By using the Pw index, we incorporate the Hs and Te parameters into a single relation, highlighting in this way the two components that define the waves, respectively: the kinetic and the potential energy [69].
Another way to assess the energy profile of a specific site is to use the total harmonic distortion (THD) index, which can identify the power smoothing of a natural resource, while taking into account that a lower value of this index is considered to be beneficial for a renewable project. The THD index is defined by the following expression [70]:
T H D = σ x ¯
where: σ —standard deviation; x ¯ —the average value of the parameter, which either can be wind power (THD WPD) or wave power (THD Pw).

3. Results

Each reference site is assigned to a particular country, and in order to understand the energy market and the renewable contribution, Table 1 presents a statistical evaluation (average values) of the main indicators that are corresponding to the time period from 1990 to 2015. It is important to mention that most of the countries considered for this work (underlined) are not included in the Global Statistical Yearbook 2016 [71], so as a reference site a nearby country was considered, for which this information was available. The following correlations were made: AM2 → Chile; AF1 → Nigeria; AF2–AF4 → South Africa; AF5 → Egypt; AS1 → Thailand; AS2 → Malaysia; AS3 → Indonesia.
The site AS4 was not taken into account, while as a reference the values provided on a Global and European scale were considered. The first indicator that was considered for evaluation is the EBT (Electricity Balance of Trade) index, which quantifies the differences between imports and exports, with the mention that a net exporter will be indicated throughout a negative value. For the time interval considered, it can be observed that the site AS5 (Russia) reports a negative value (−16) when compared to the site AM4 (Brazil), which heavily depends on imports. Equilibrium seems to be achieved by the sites AM1, AM5, AF5, AS2, and AS3, where zero values are reported. Another parameter is TBT (Total Balance of Trade) index, which includes all of the resources available. Similarly to the previous analysis, Russia is on top of the exports with 450 Mtoe, being followed by Venezuela (AM5) with 140 Mtoe, while on an opposite side Thailand (AS1) can be mentioned with an import of 40 Mtoe. The CO2 intensity represents another parameter that is capable of estimating the ratio of CO2 emissions from fuel combustion over Gross Domestic Product (GDP) measured in constant US $ at purchasing power parities. This measures the CO2 emitted to generate one unit of GDP, and in this case, the sites AS5, AF2–AF4 present more consistent values as compared to AF1, where a minimum of 0.07 kCO2/$2005p (2005 US $ exchange) is reported. Most of the sites indicate values close to 0.3 kCO2/$2005p, when compared to a 0.42 kCO2/$2005p reported on a global scale.
The renewable contribution is expressed in percentage and includes all forms of generations (hydro, wind, geothermal, and solar). From this point of view, Brazil (AM4) and Venezuela (AM5) account for a maximum of 87.8% and 70.2%, respectively, from the total contributions, when compared to South Africa (AF2–AF4) and Thailand (AS1), where significantly lower values are noticed. From this distribution it can be observed that the wind & solar share are quite insignificant, most of the countries reporting a zero value, with more promising results being reported near the sites AS3 and AM1.
The results presented in Table 1 are completed by the info provided in Figure 2, where various trend patterns can be observed. Regarding the electricity balance, it can be noticed that the values constantly fluctuate, with the mention that for the first time Mexico reported a negative value in 2015. In terms of the CO2 emissions, Brazil has in the present a maximum of 500 MtCO2, which is almost twice as high as the value reported in 1990. In the renewable energy market, it can be observed that the European market registers an ascending trend, reaching a maximum of 34.2% in 2015, when comparing to the Global values, where a constant decline seems to be noticed. Regarding the wind and solar industry, it can be observed that there is an interest for these two energetic sectors, except for Russia and Venezuela, where the values are close to zero.

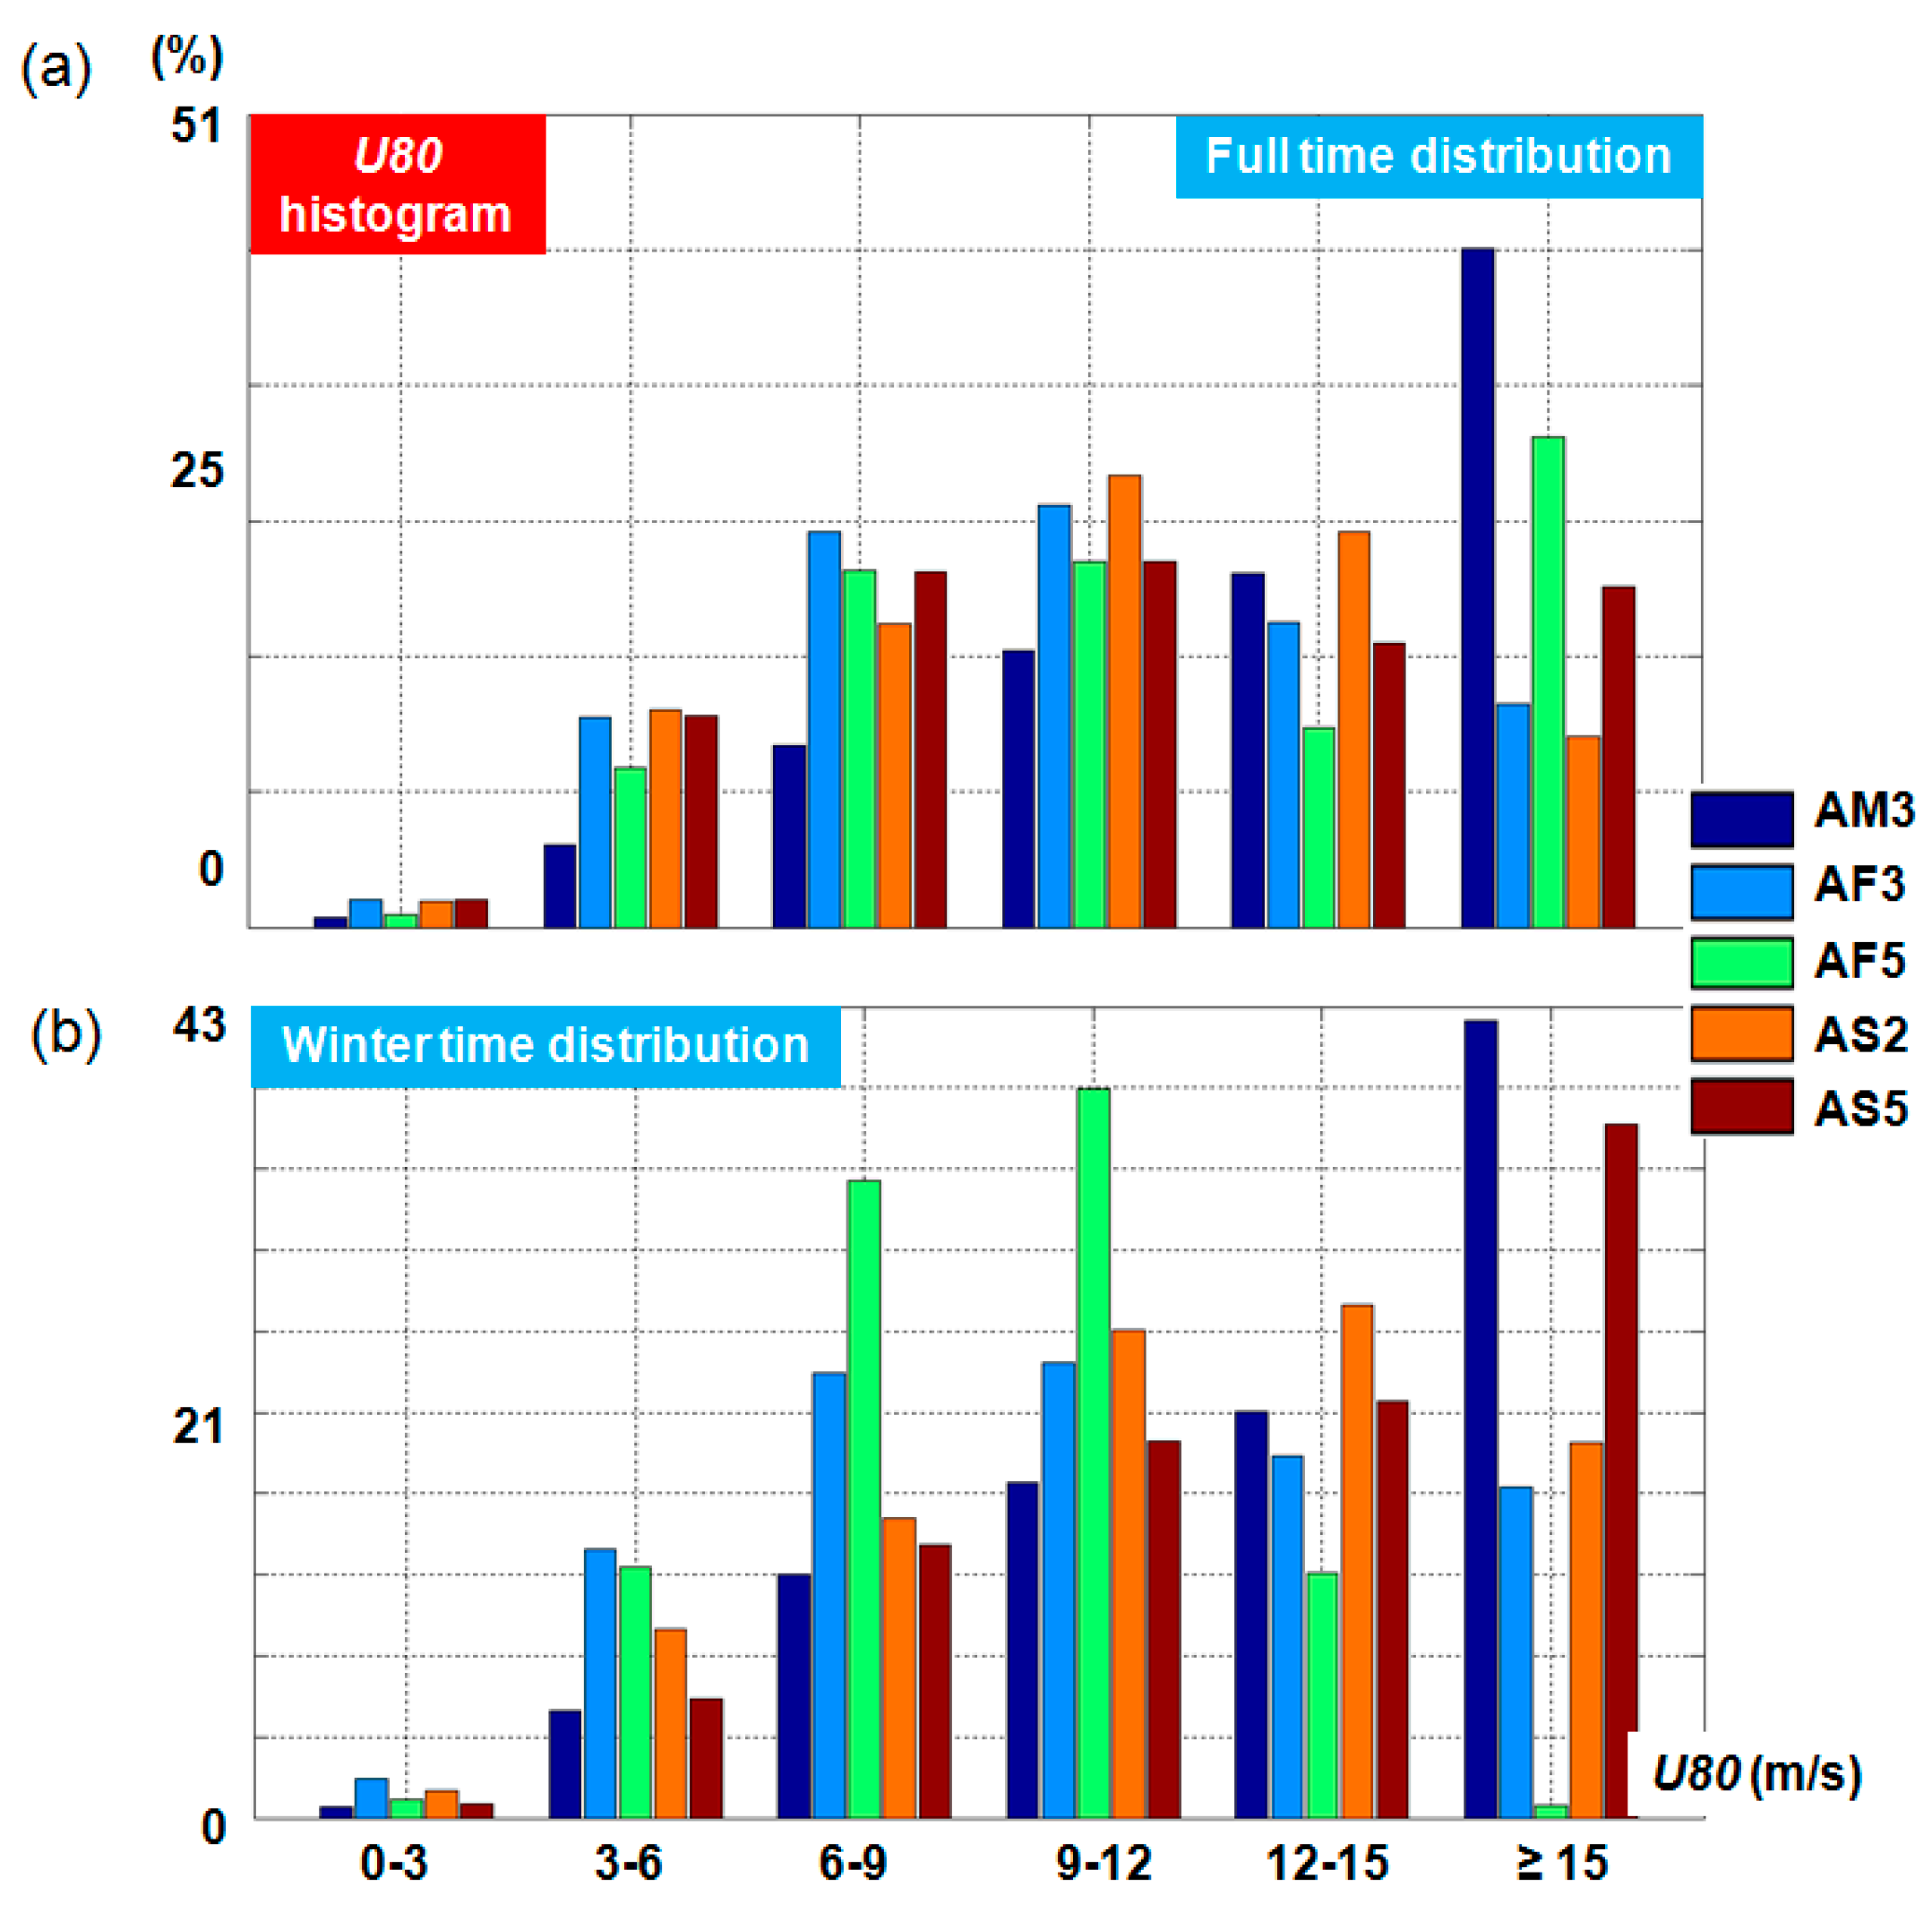
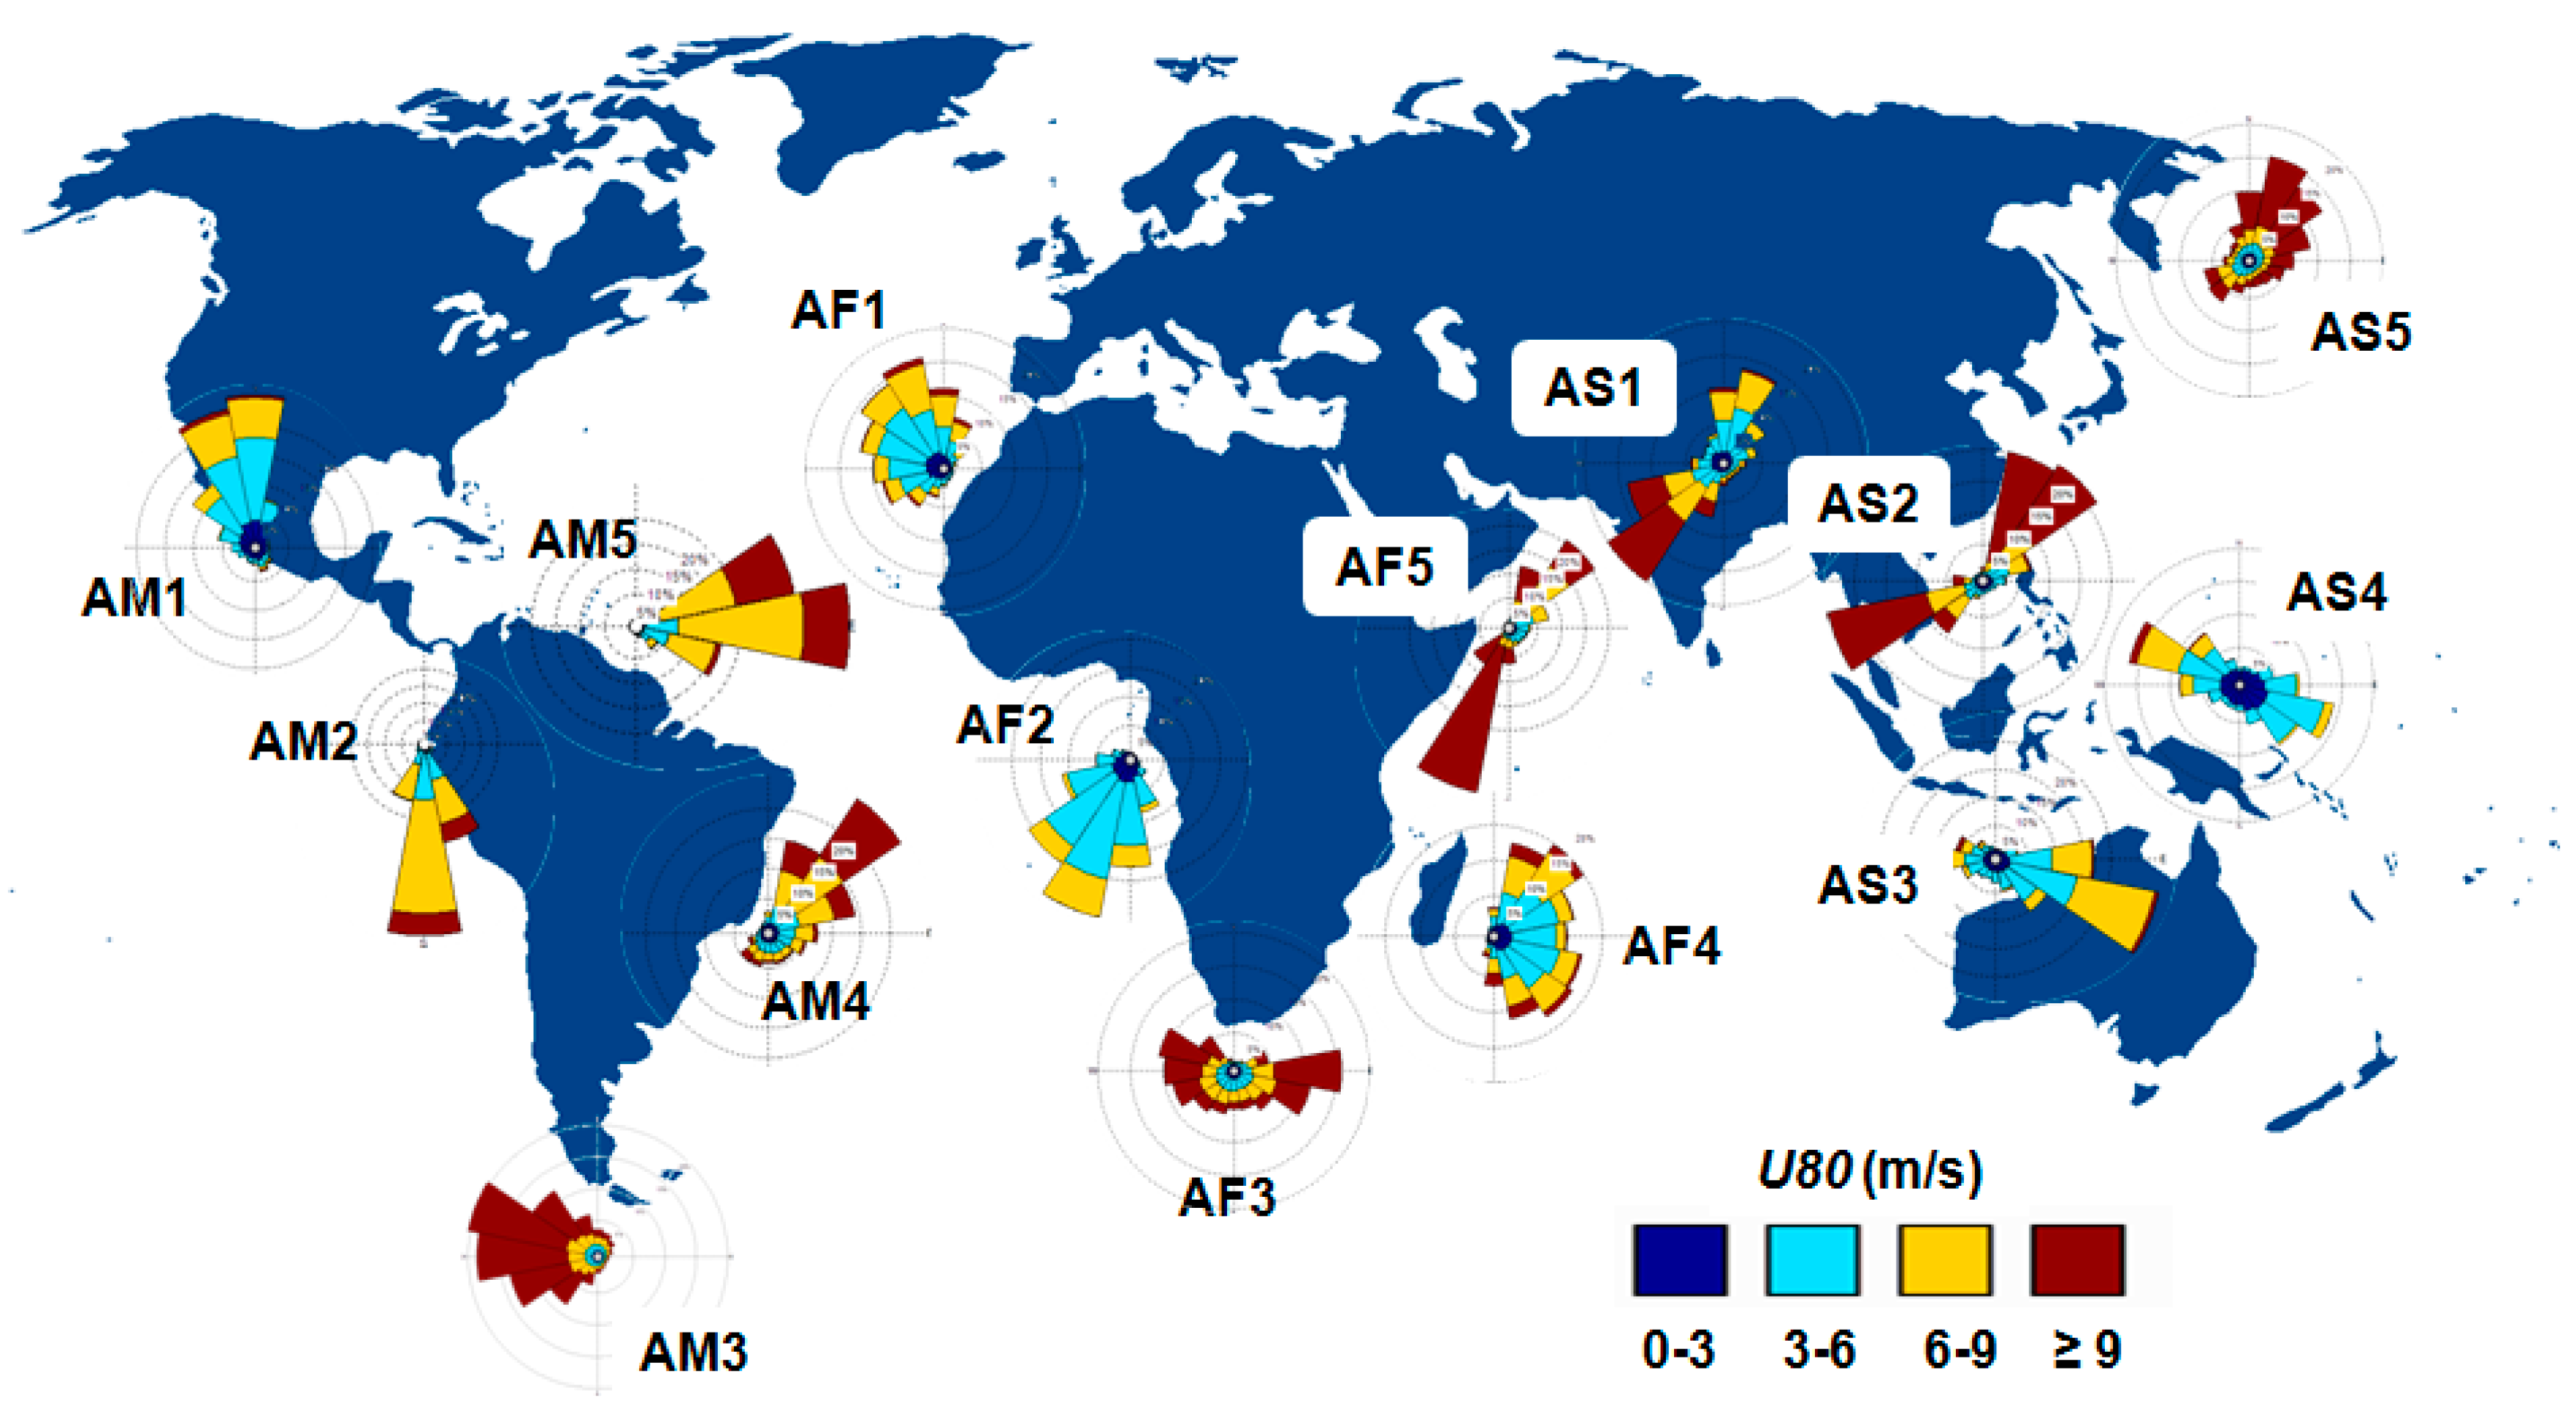
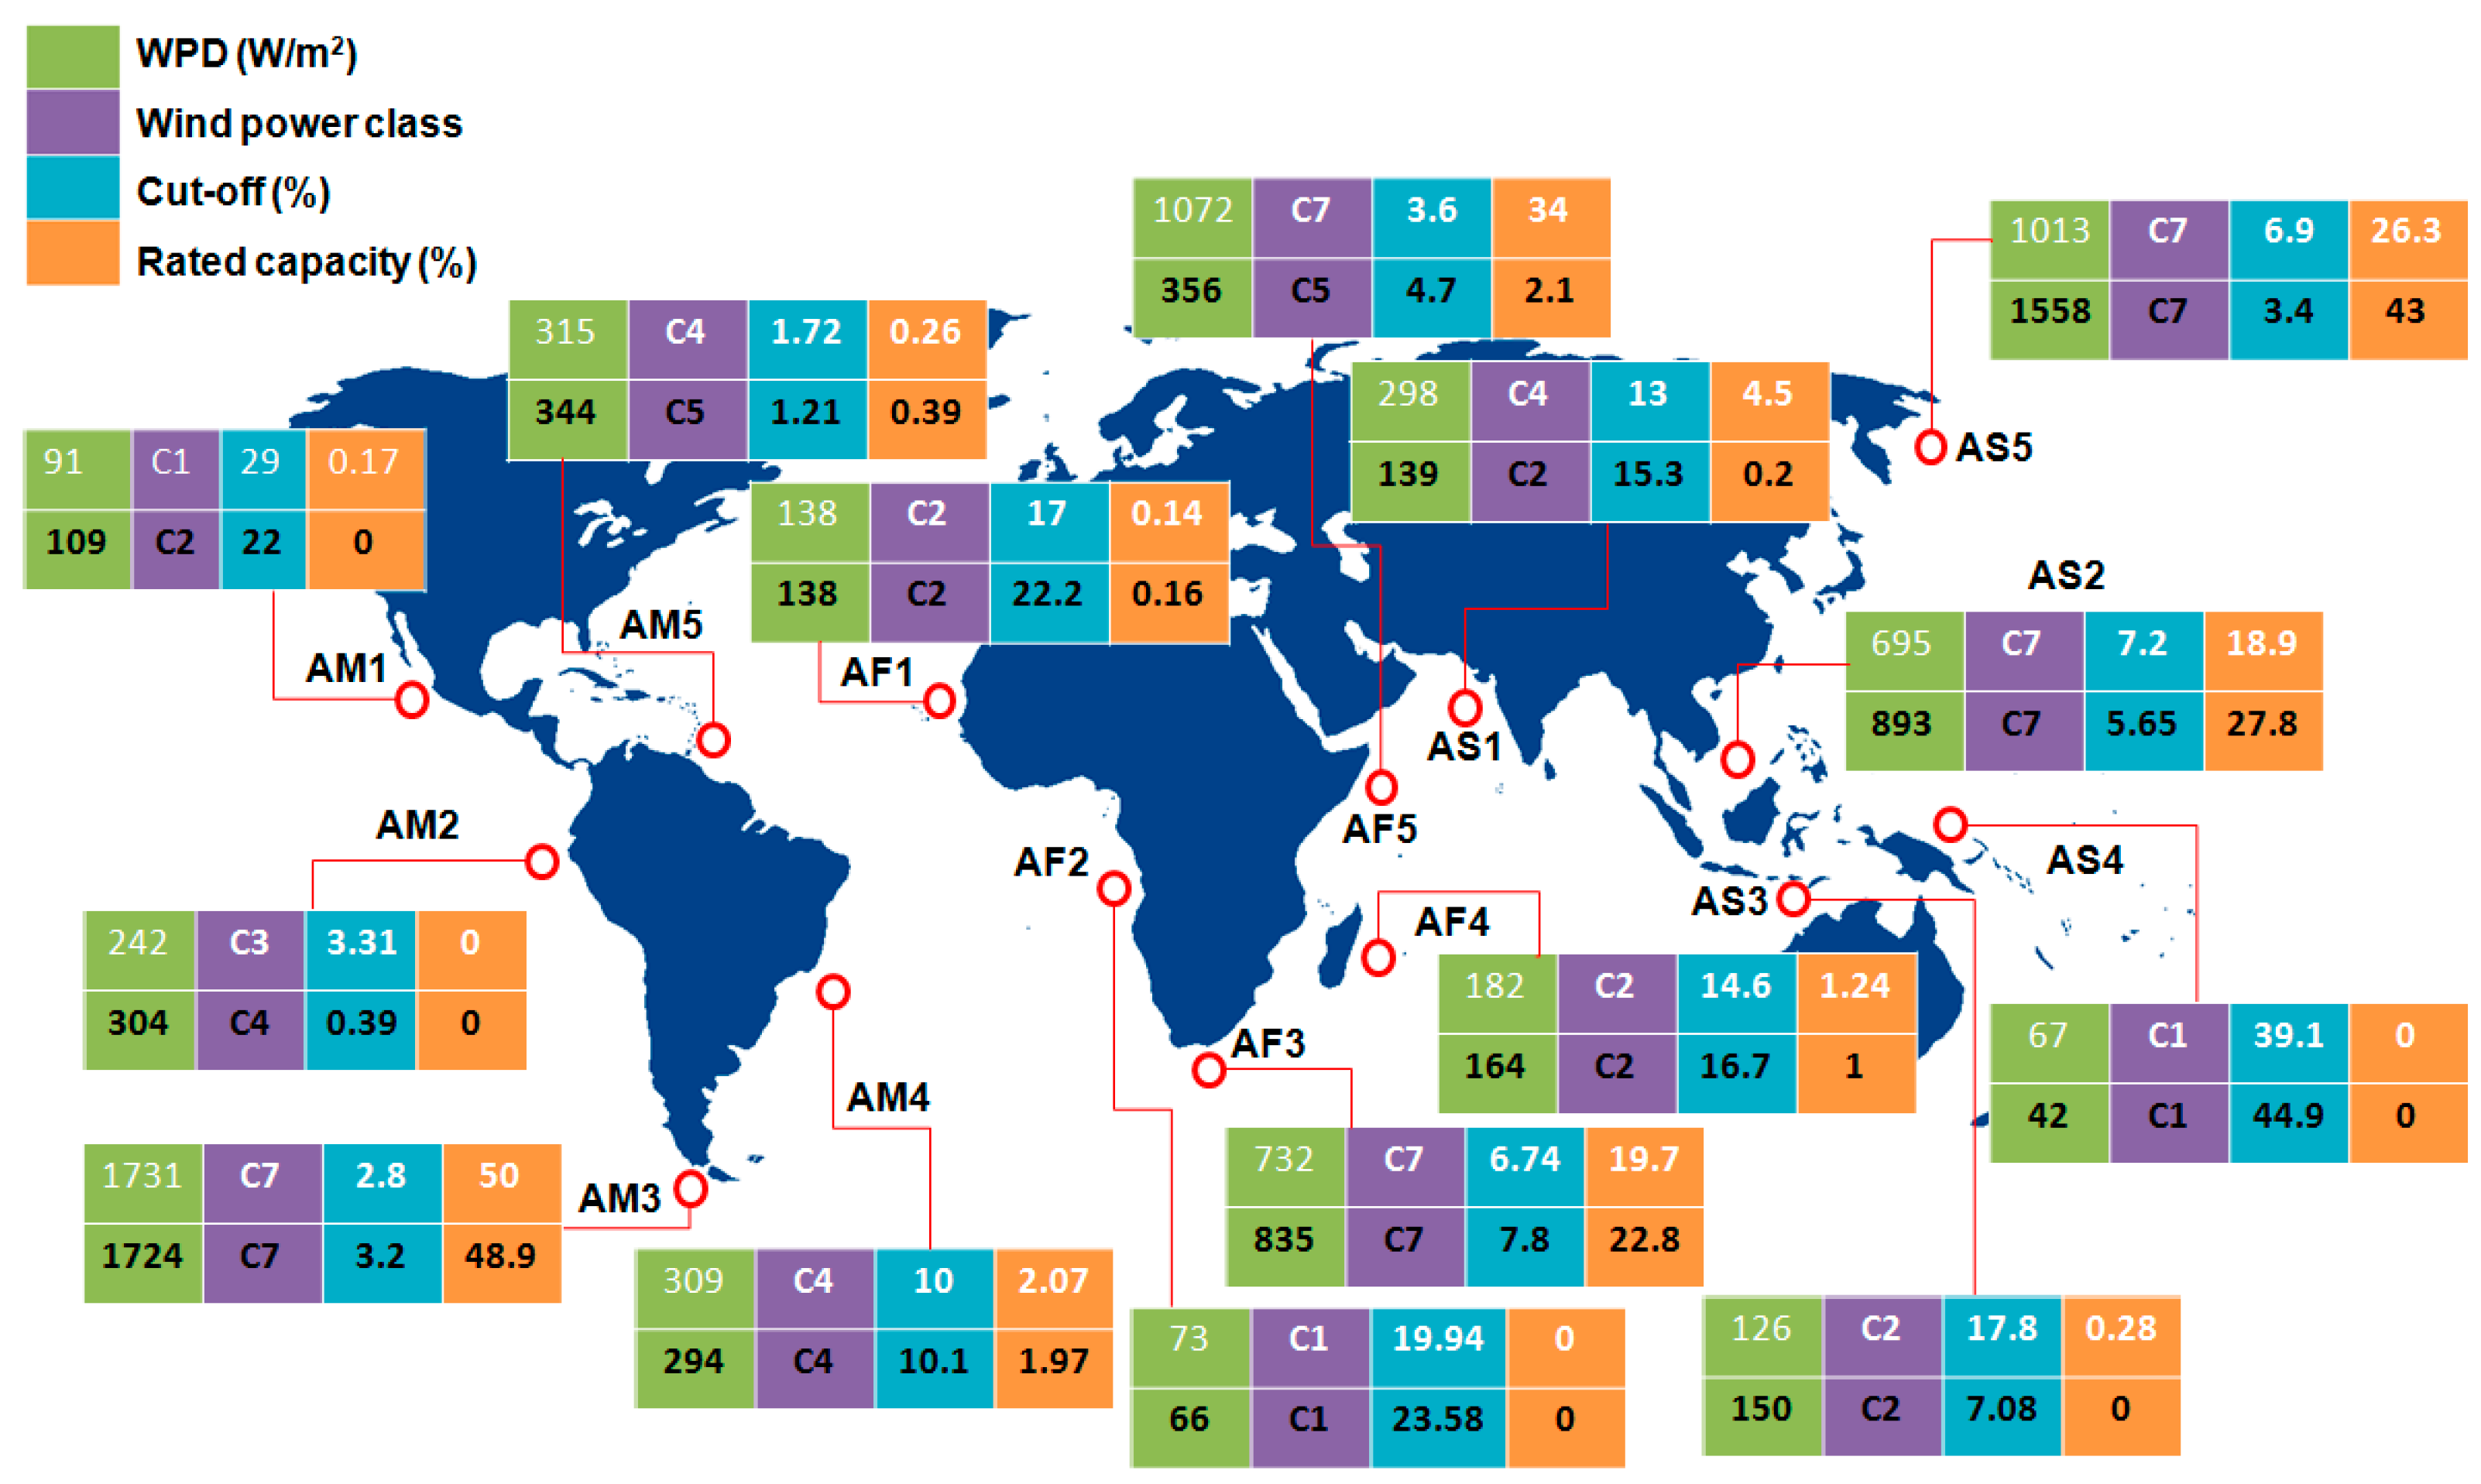
3.1. Analysis of the Wind Conditions

Figure 3a presents the variation of the mean wind speed (U80 parameter), structured on full time and winter time distribution, where the latest was considered to be the interval between October and March for the sites located in the Northern Hemisphere, while the interval April-September was considered as winter time for the Southern Hemisphere. In this figure, the sites located in the Southern Hemisphere are marked with the symbol *. The site AM3 stands out with a maximum wind velocity value of 12.3 m/s (full and winter time distribution), being followed by the site AS5 with 11.78 m/s (in winter) and AF5 with 10.24 m/s (for full time). Much lower values can be encountered near the sites AM1, AF2, and AS4, with the mention that the conditions reported in the vicinity of the site AS4 do not exceed 4 m/s. A more detailed evaluation of the wind conditions is represented in Figure 3b, where the monthly variation of the local conditions was represented for some reference sites. There are significant variations between the monthly values, except for the sites AM3 and AF3, which reveal mean values in the range 12–13.4 m/s and 8.3–9.3 m/s, respectively. Definitely, the most severe changes are corresponding to the site AF5, which during the summer may reach a maximum wind speed value of 16.9 m/s, as compared to the winter time, when a maximum of 9.5 m/s is reported in December. The site AS5 shows a clearer presence of the winter and summer seasons, indicating a maximum value of 13.2 m/s in December and a minimum value of 6.7 m/s from May to July.
The U80 histograms are represented in Figure 4 by taking into account the sites considered in Figure 3b. From the first analysis, it can be observed that the wind conditions in the classes 0–3 m/s are quite insignificant regardless the considered time interval, while the site AF5 seems to present during winter more consistent values below the 12 m/s limit. The following wind classes can be considered as representative for the site AM3 ≥15 m/s and AF3, AF5, AS2, AS5 6–12 m/s, with the mention that the site AS5 register more often winds speeds exceeding 15 m/s, which may be considered an advantage in relationship with the performance of a wind turbine. There are significant differences between the full and winter time distribution, as for example, in the case of the site AF5, it can be noticed the attenuation of the extreme values during winter.
Besides the wind speed, another important parameter is the wind direction, which significantly influences the layout of particular offshore wind farms [72]. Such distribution is highlighted in Figure 5 for all of the sites, by using wind roses based on the full time distribution. The current results closely follow the global prevailing wind pattern, in some cases the dominant wind directions being influenced by the coastline orientation, as in the case of the site AM2 or AF5, respectively. For the site AM3, the western sector seems to be dominant when compared to the site AF3, where the distribution is divided between the western and the eastern sectors. The sites AF5, AS1, and AS2 are under the influence of the prevailing and the trade winds, when compared to the site AS5 the polar winds coming from the northeast sector are dominant.
The wind conditions from the intervals 6–9 m/s and higher than 9 m/s are encountered more often, except for the sites AM1, AF1, AF2, AF4, AS3, and AS4, where the interval 3–6 m/s seems to be dominant.
Similar to the Beaufort scale, which describes the empirical correlation between the wind speed and a particular sea state [73], also the wind energy potential of a particular site can be identified throughout the wind power classes denoted from C1 to C7 [64,65,66,74], where the latest one represents the most attractive from an energetic perspective. In Table 2, the two indexes mentioned above, WPD and wind classes, are evaluated (only for the full time distribution) when considering all of the reference sites. The WPD index has average values in the range: 91–1731 W/m2 America sites; 73–1073 W/m2 Africa sites; and 67–1013 W/m2 Asia sites, with the mention that the site AM3, AF5, and AS2 present more important values for each region.
The wind power distribution is expressed in percentage, the dominant values being highlighted. There are two dominant classes, which gather most of the important values, C1 and C7, which represent more promising conditions at the sites AM3, AF3, AF5, AS2, and AS5. Except for the site AM3, which seems to have more important resources (C7-72.27%), it can be mentioned that for the rest of the energetic sites that the values from the class C7 do not exceed 50%.

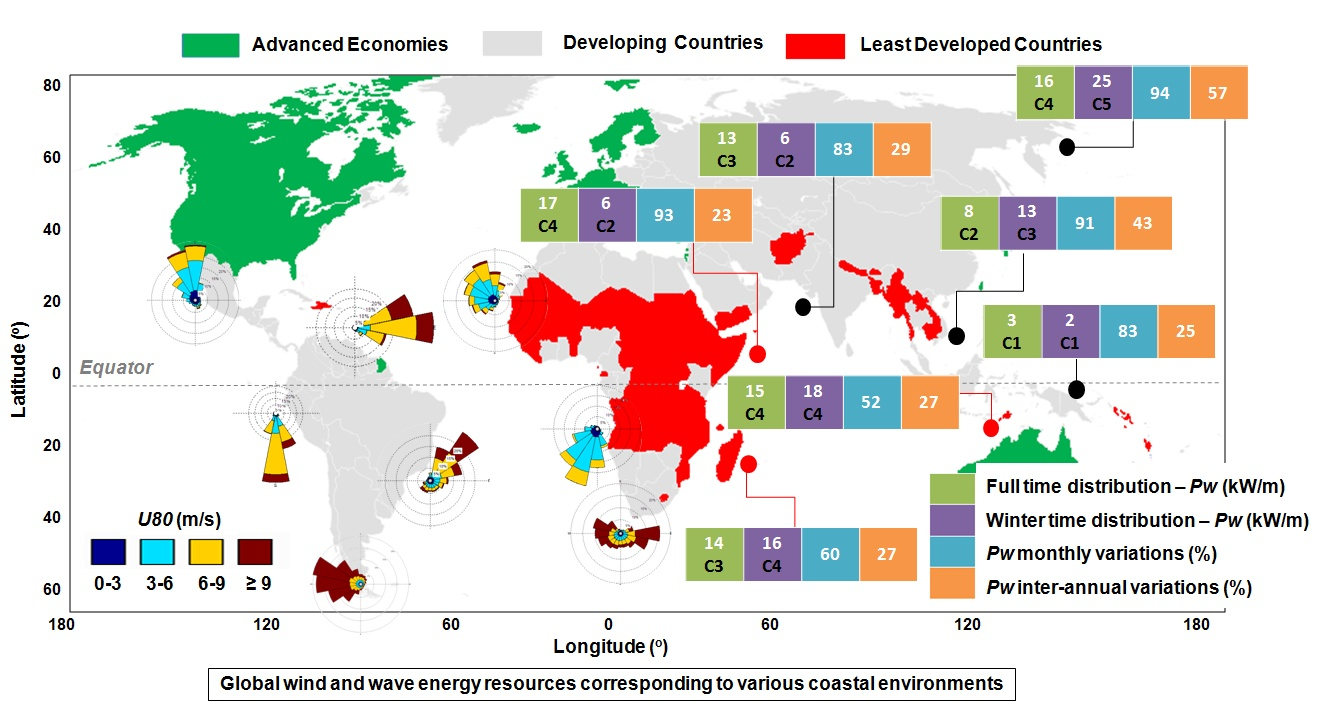
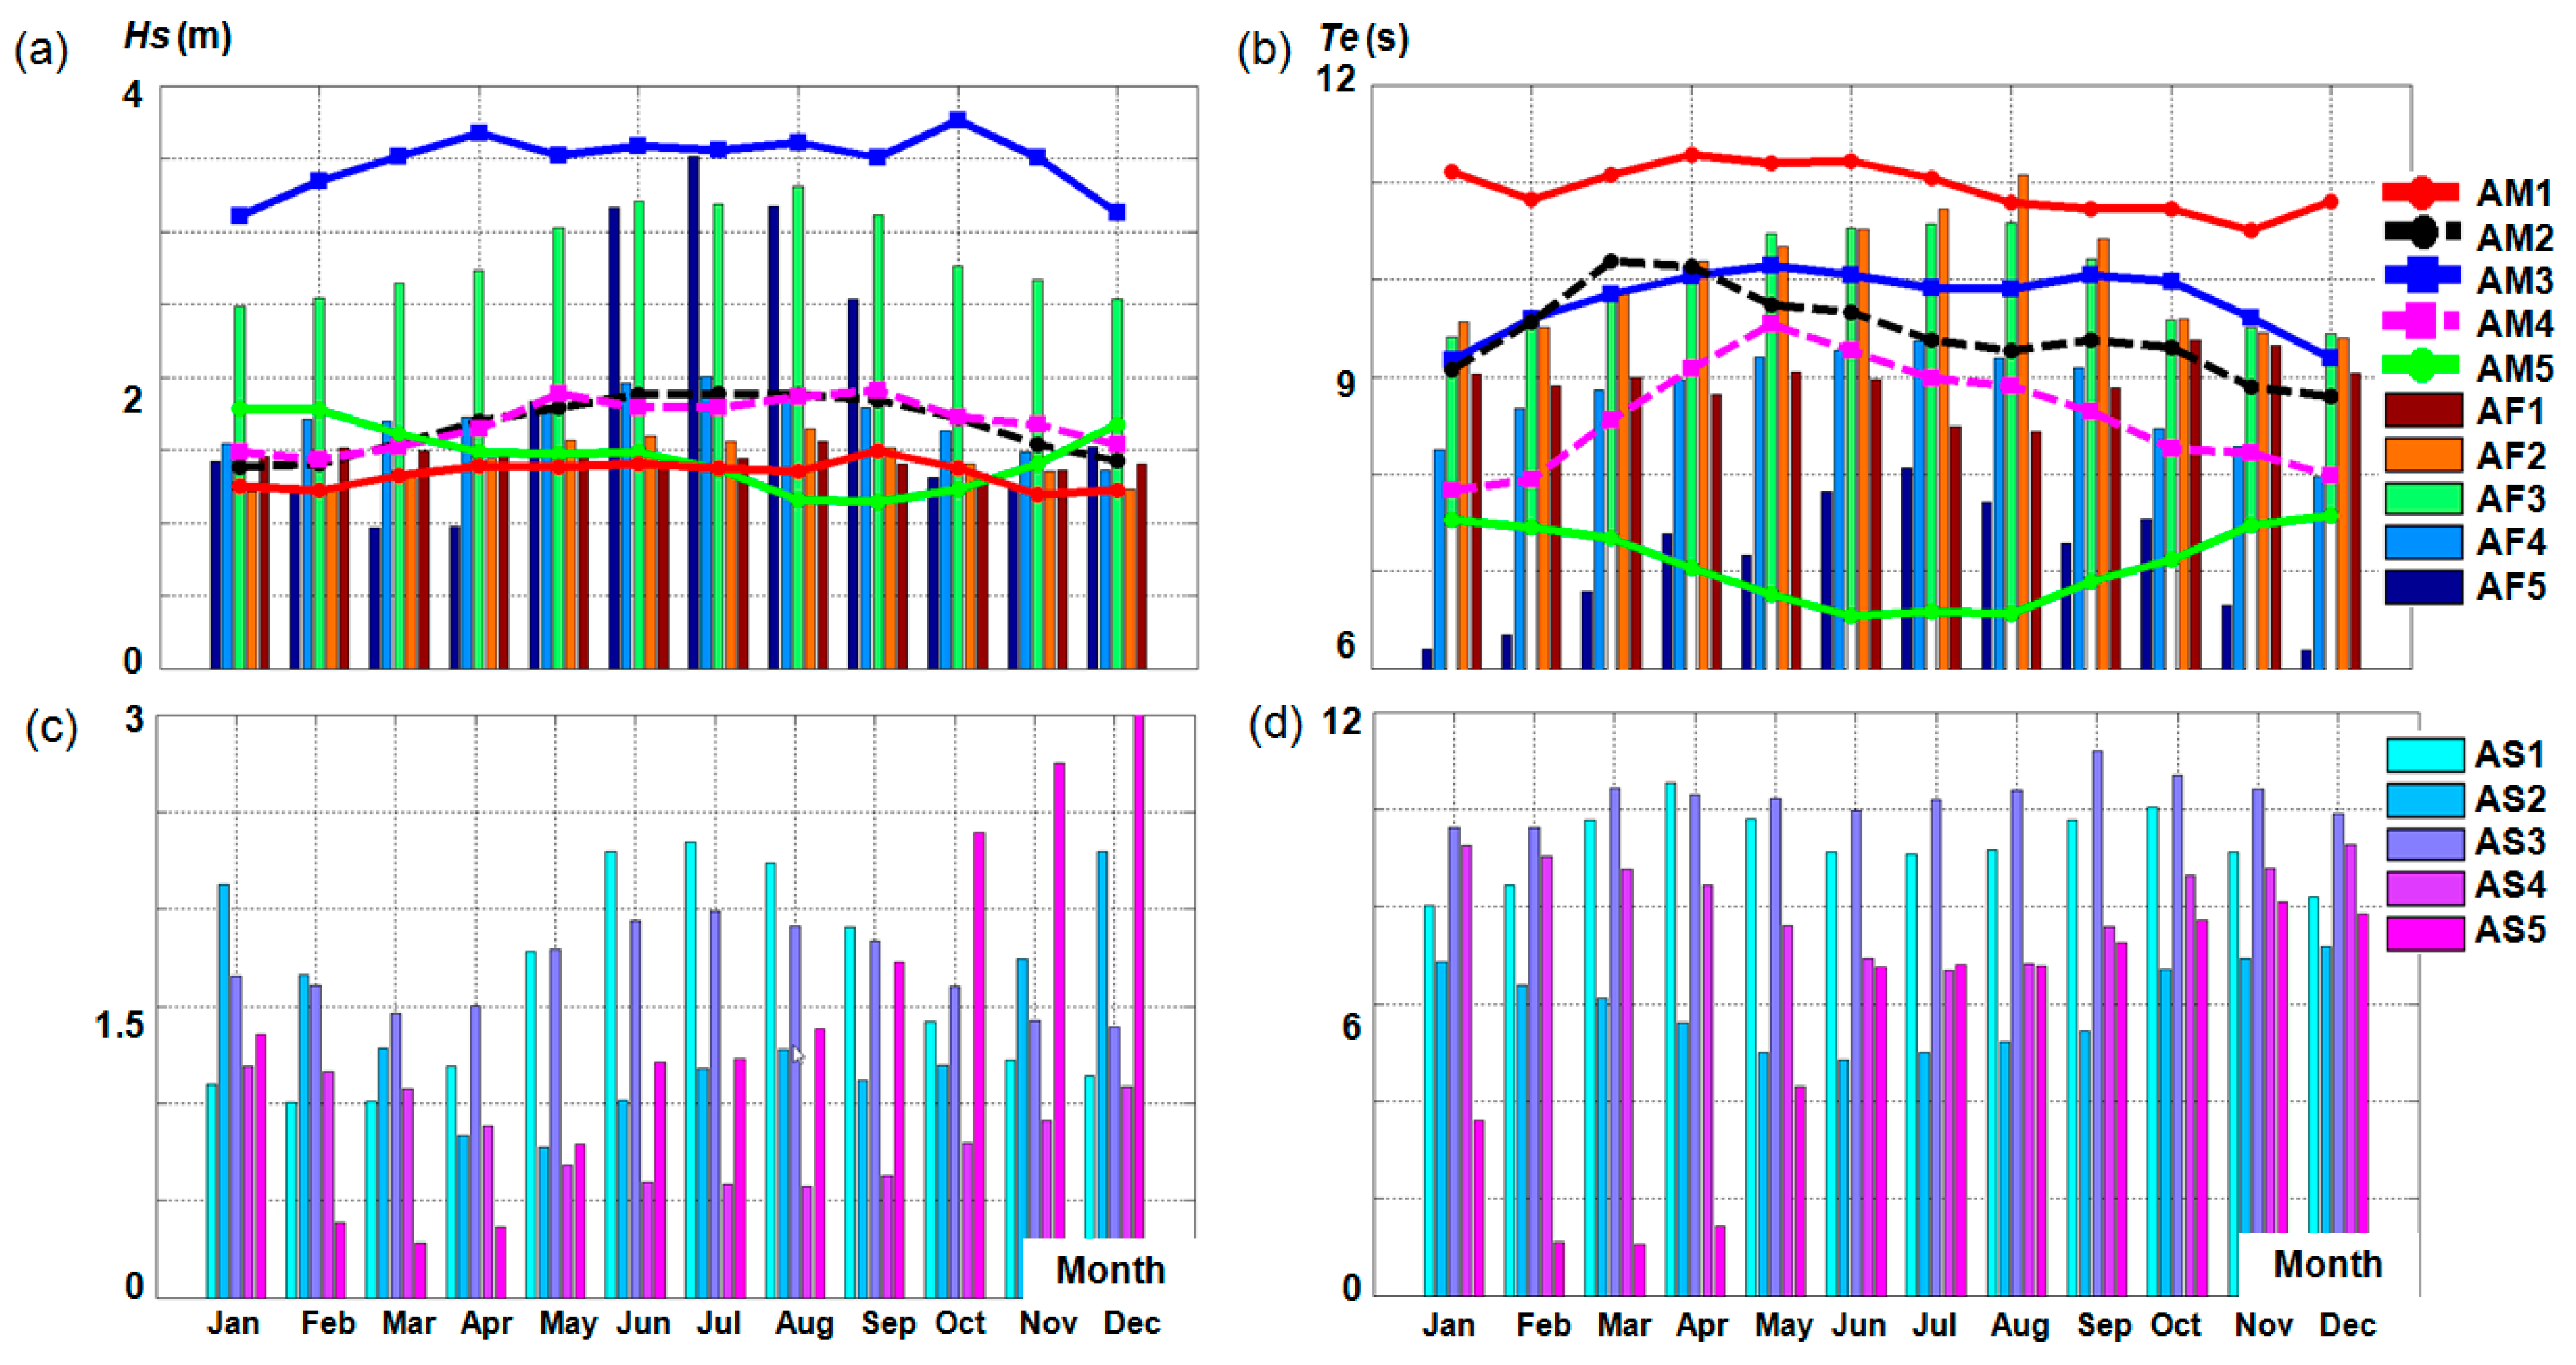
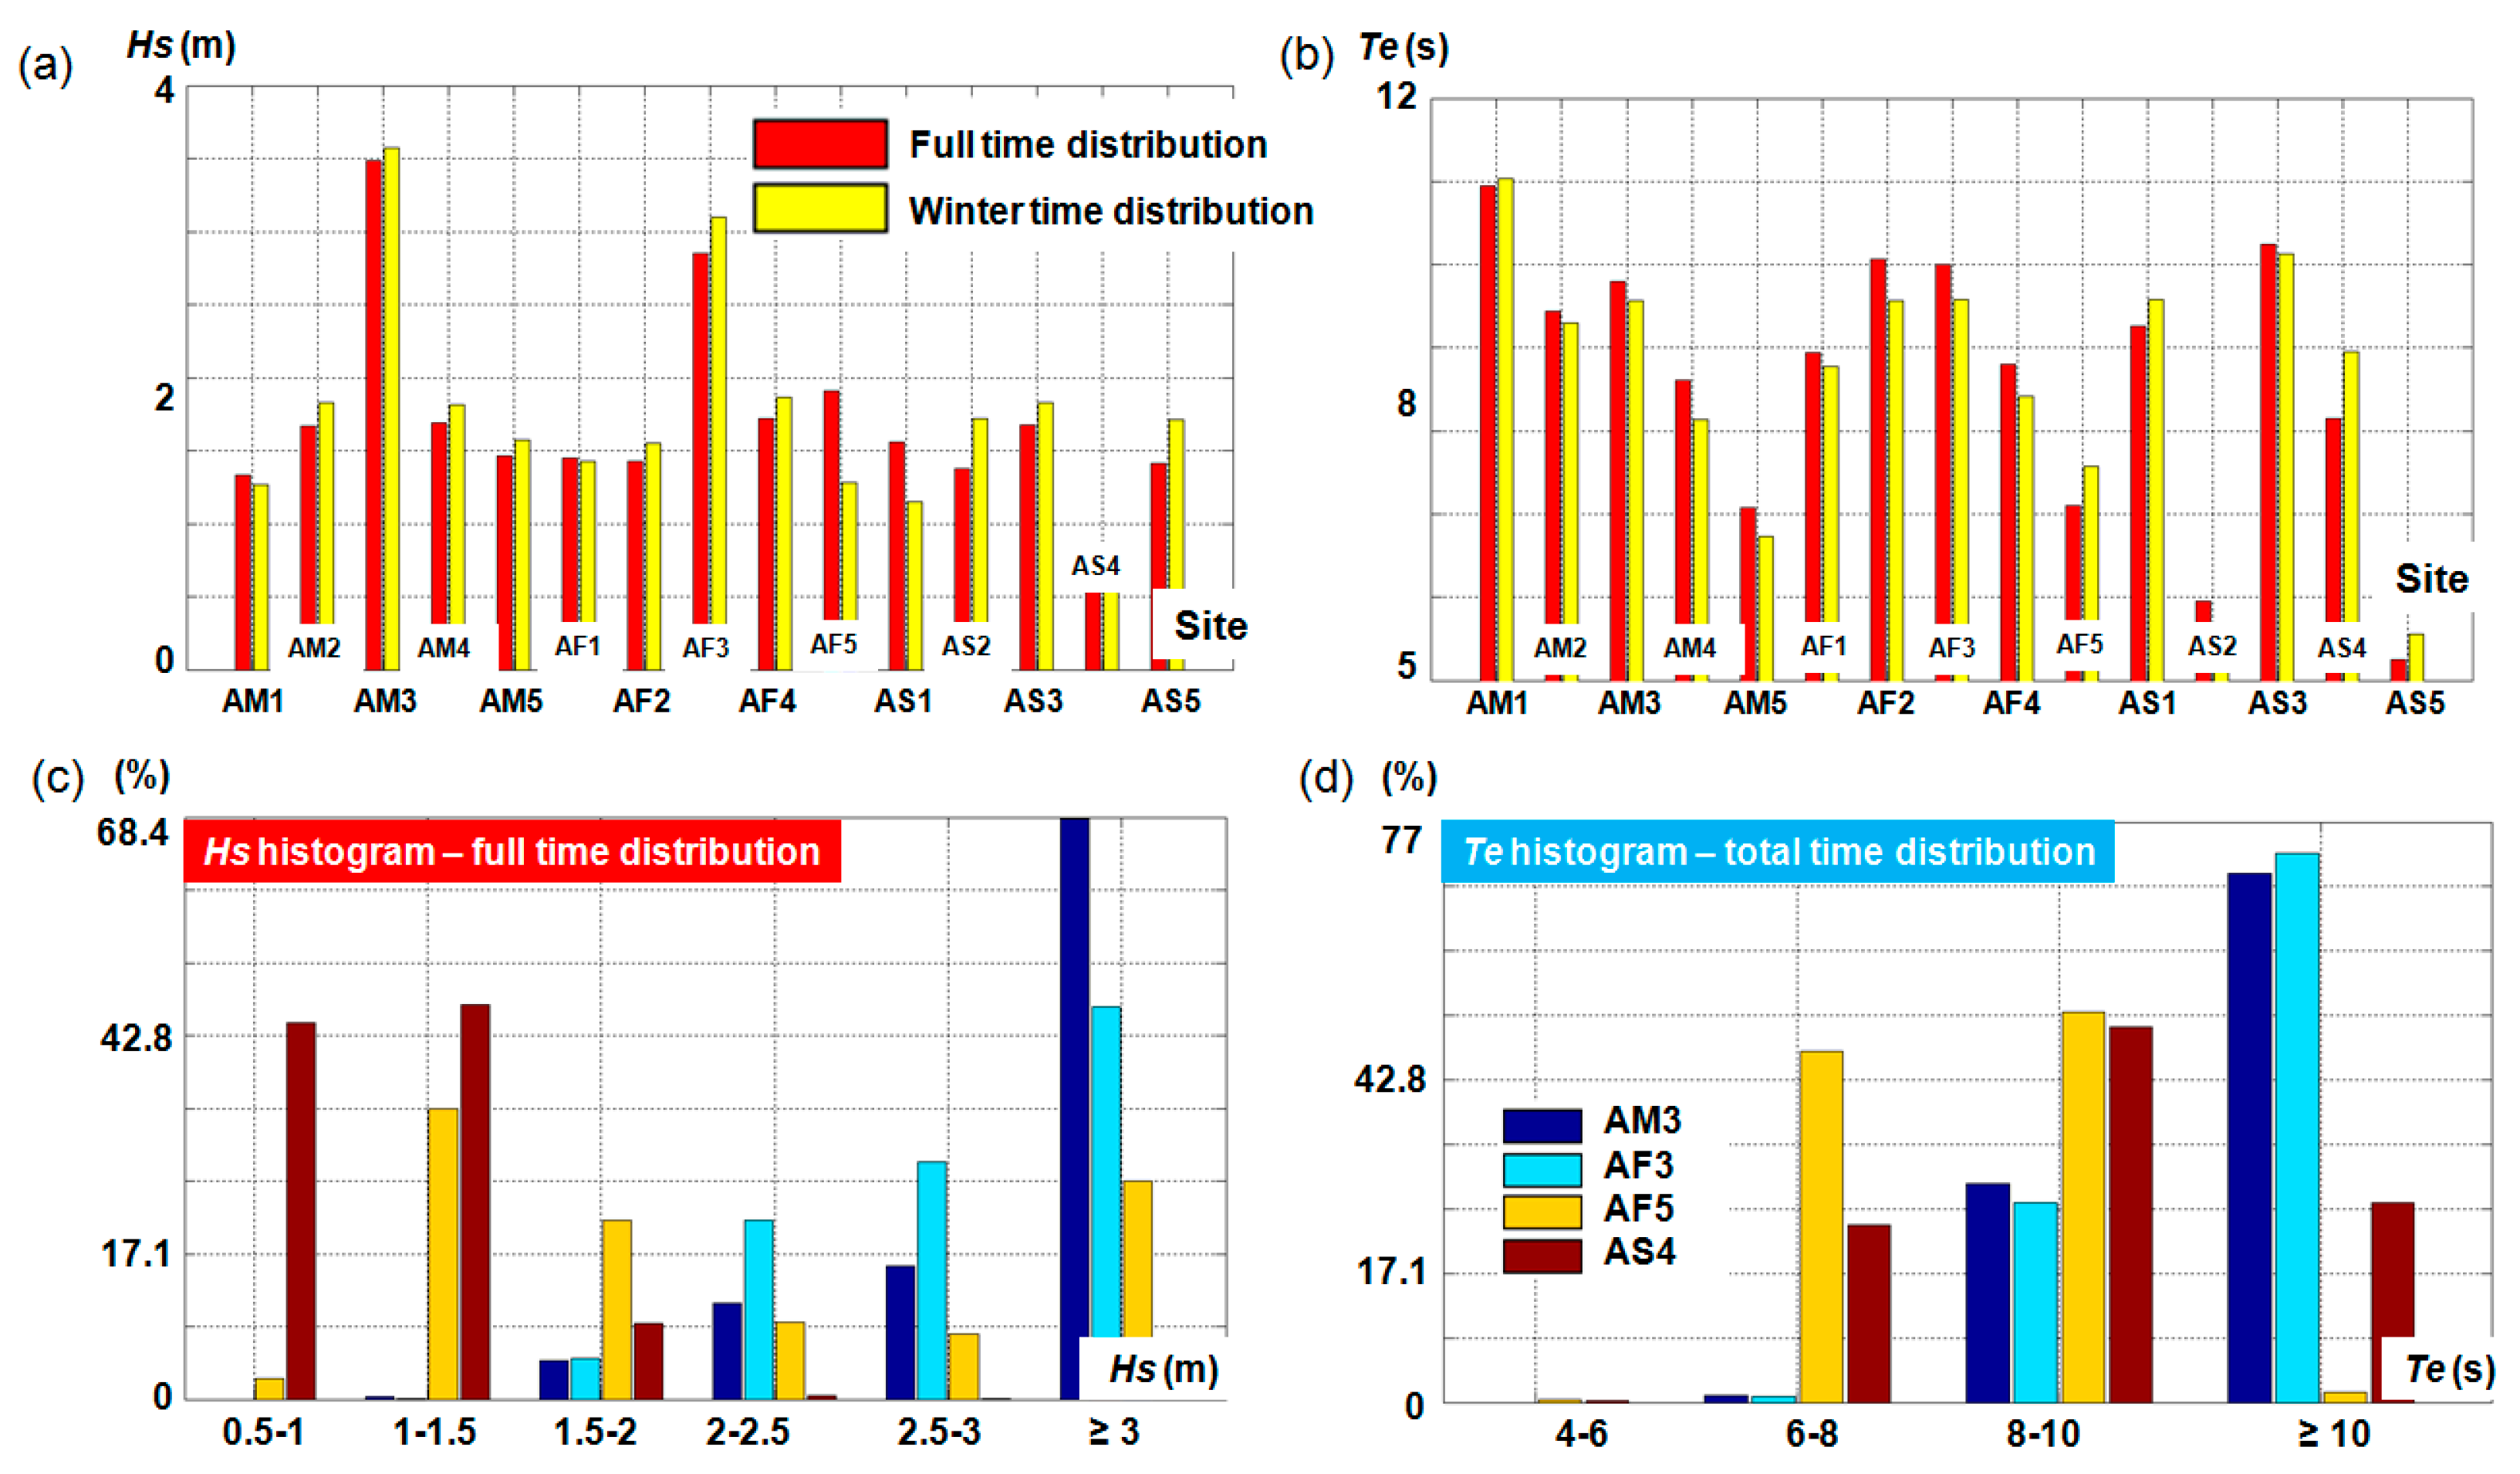
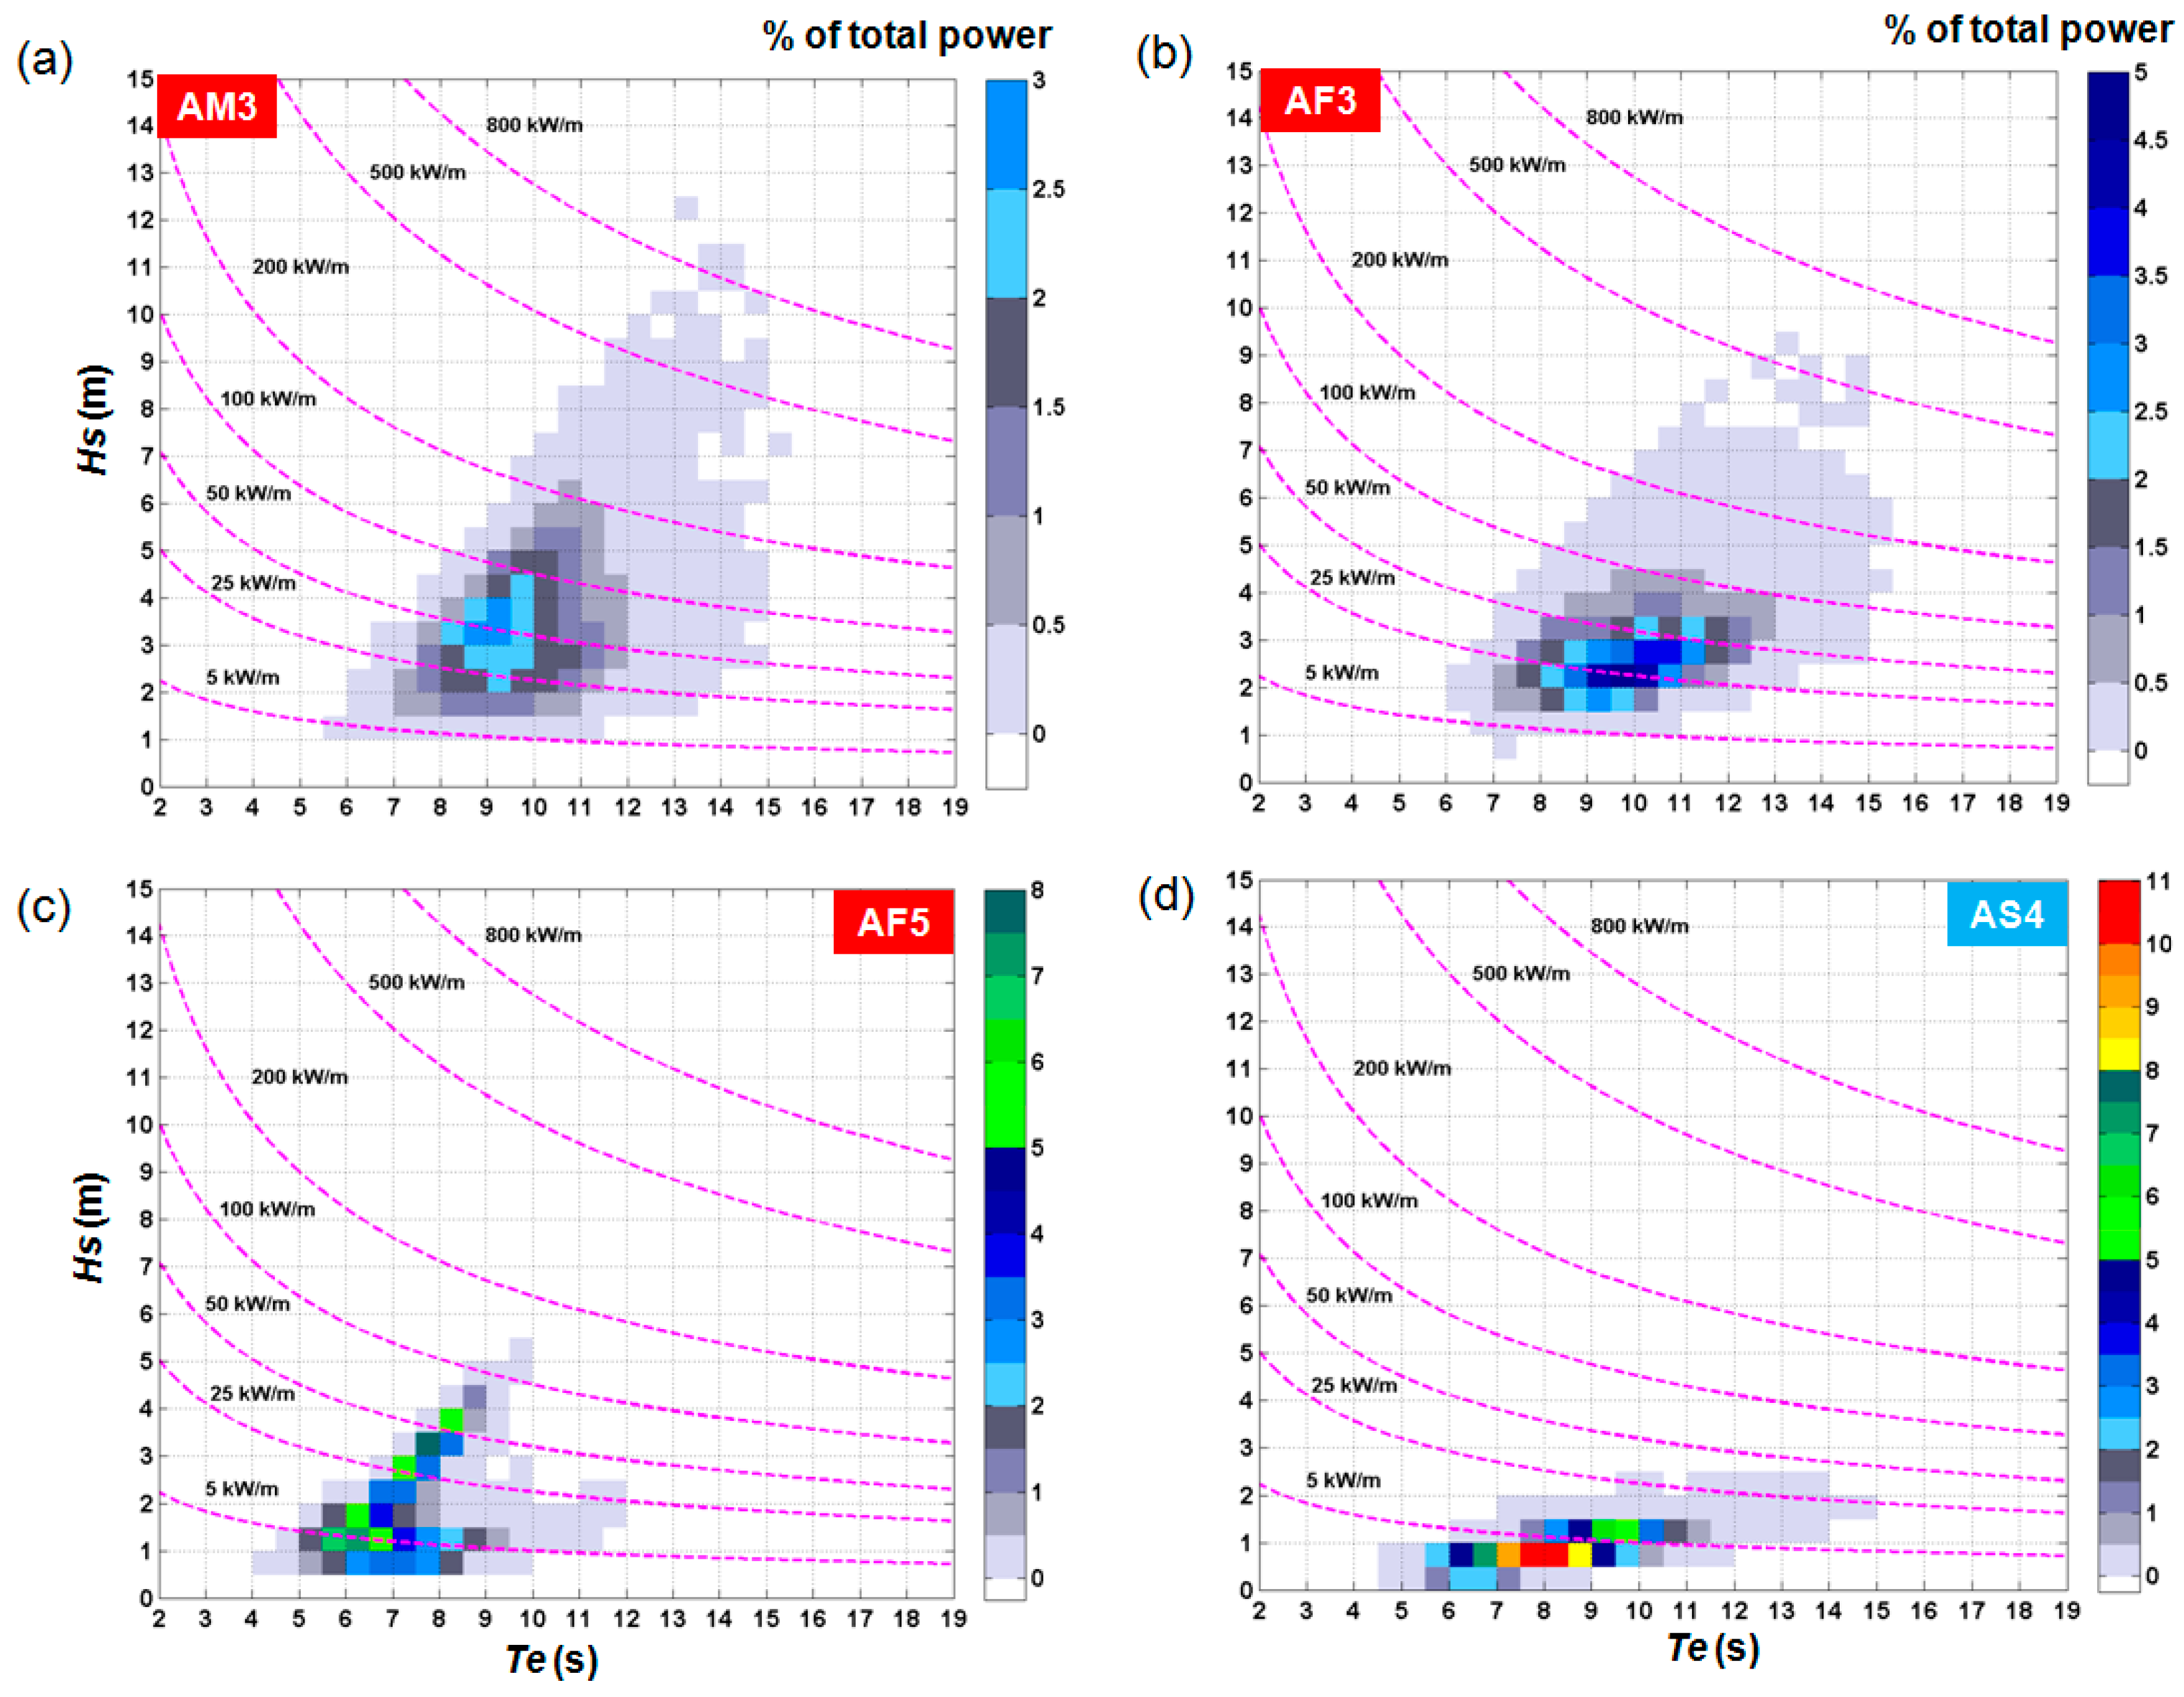
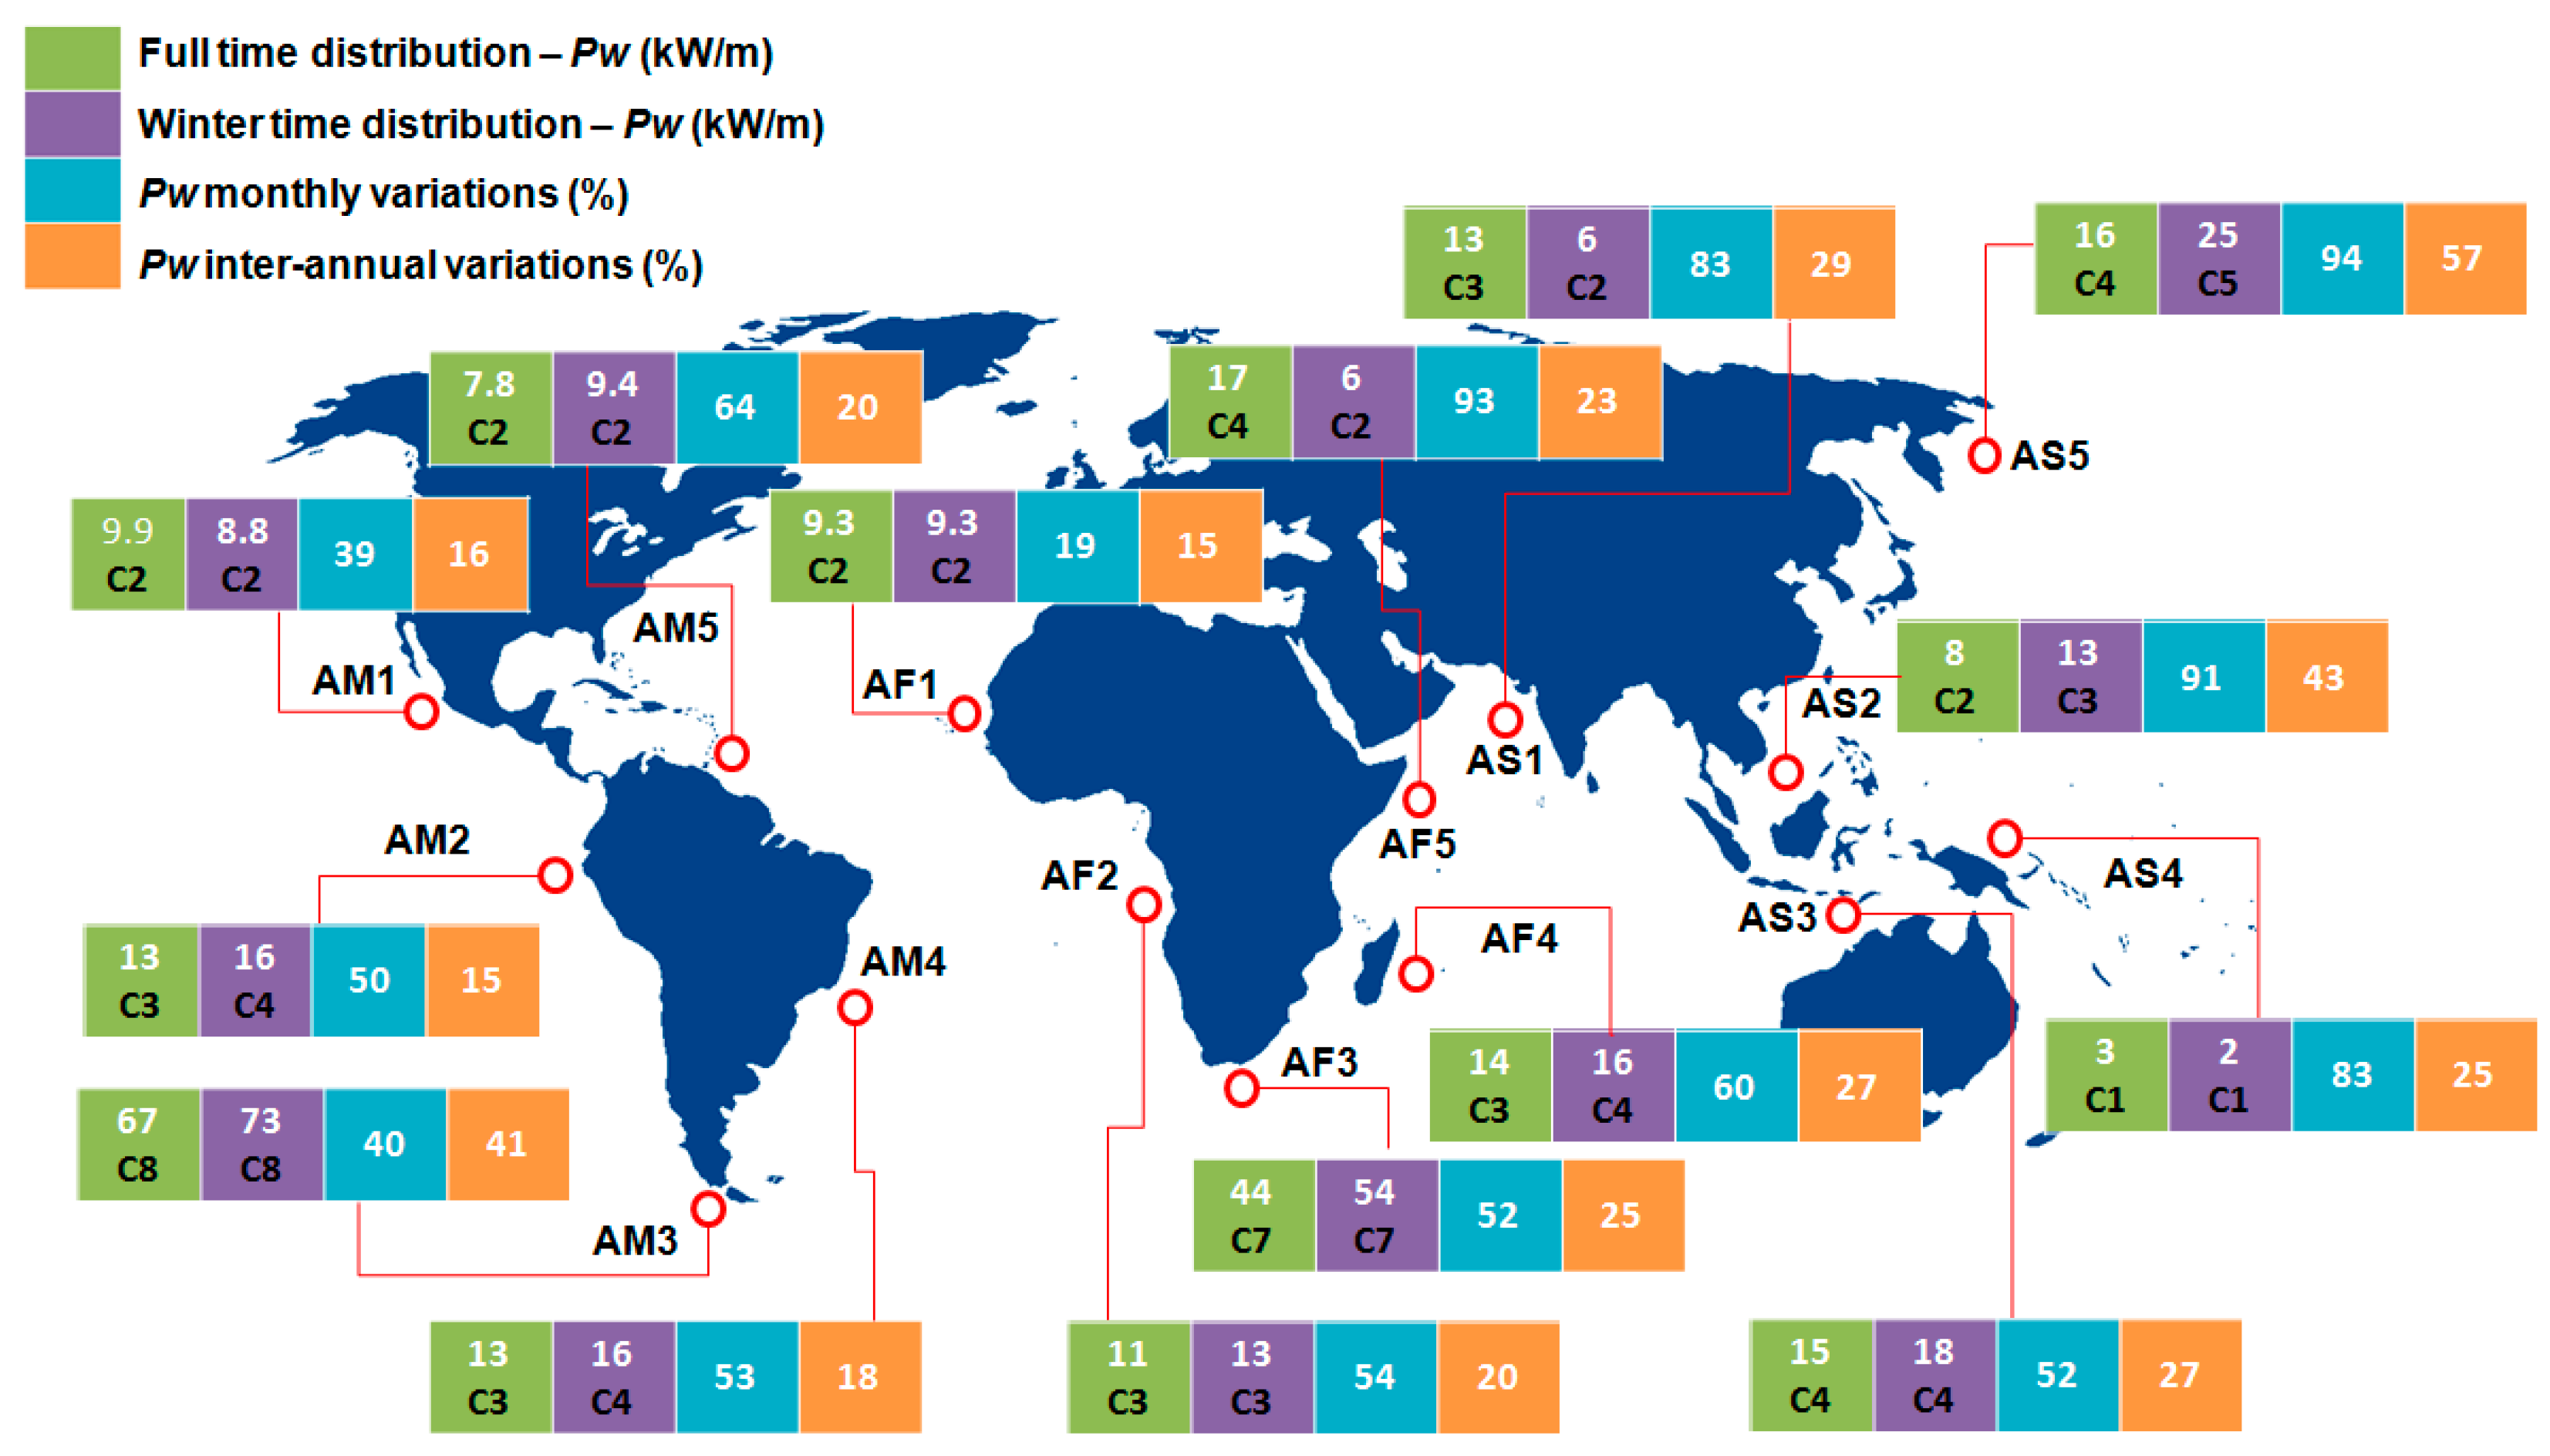
3.2. Analysis of the Wave Conditions

In Figure 6, the monthly distribution of the Hs and Te parameters are presented. Regarding the Hs values, it can be mentioned that from the group sites AM, that the site AM3 stand out with values located in the range 3.1–3.8 m, being followed at a larger distance by the remaining AM sites, which does not exceed the 2 m limit, not even during the winter time. From the group sites AF, the most important values correspond to the sites AF3 and AF5, which may reach maximum values of 3.3 m (in August) and 3.5 m (in July), respectively. Going to the AS sites, it can be mentioned that from May to August, the sites AS1 and AS3 may have a maximum of 2.3 m, while during October–December, the site AS5 stands out with values in the range 2.4–3 m. Considerably lower values are noticed during February–April, when the site AS5 may report a minimum of 0.28 m. The monthly variation of the parameter Te is illustrated in Figure 6b, of which the values are expected to vary in the range of: AM1 → 10.5–11.3 s; AM3 → 9.2–10 s; AM5 → 6.5–7.6 s; AF2 → 9.4–11.1 s; AF4 → 8–9.3 s; AS1 → 8–10.5 s; AS3 → 9.6–10.4 s; AS5 → 1.1–8.1 s.
The wave energy potential is highlighted more clearly in Figure 7a, where the average values of the Hs index are structured in full and winter time distribution, respectively. The average values are in the range 1.2–2 m, with the mention that there are sites where the wave heights do not exceed the 1.5 m limit, as in the case of the sites AM1 and AF1. Regarding the maximum values, the sites AM3 and AF3 stand out with peaks of 3.6 m and 3.1 m, while on the opposite side, the site AS4 seems to be located with the lowest value (0.6 m).
The wave period may vary from 5.2 s to 11 s, reporting a constant decrease of the values obtained from the site AM1 to AM5 and a normal (Gaussian) distribution of for the AF sites. From the group sites AS, lower values are reported close to the sites AS2 and AS5, while for the remaining sites, there can be values expected in the range 8.1–10.3 s. Figure 7c illustrates the structure of the wave height for the most promising sites presented in histograms. The site AS4 was selected in order to highlight the differences between an energetic area and a moderate one, and as can be observed that this site is characterized by a significant presence of the waves in the interval 0.5–1.5 m, which is not the case for other sites. By comparing the site AM3 with AF5, it can be mentioned that the first one presents a significant percentage of waves that exceed 3 m (≈68%), when compared to the last one where the waves from the interval 1–1.5 m (≈26%) are more consistent. The site AF3 presents a constant increase of the values, reaching a maximum percentage for the Hs values located above the 3 m limit. Regarding the histograms of the wave periods (Figure 7d), there is a tendency of the sites AF5 and AS4 to have more consistent values in the range 6–10 s, as compared to AM3 and AF3, where the wave periods higher than 10 s represent the peak of these distribution.
A complete statistical analysis of the wave parameters is presented in Table 3. Throughout the 95th index, denoted that the 95 percentile represents a statistical parameter indicating that the value obtained is higher than 95% of the data in the time series. In the case of the Hs parameter, this reaches a maximum of 5.8 m for the site AM3 and 4.1 m for AS5, when compared to AS4 where a value of 1.4 m represents an energetic condition. Although the site AS5 seems to indicate the presence of higher values, from the analysis of the wave heights distributed below 1 m, it can be observed that almost 42% of the heights are grouped in this range. Regarding the wave power, the following average values can be mentioned from each reference group: AM3 67.5 kW/m; AF3 44.4 kW/m; AS3 and AS5 ≈ 15.5 kW/m with the mention that the site AS5 also reports a value of 72.1 kW/m for the 95 percentile.
Another evaluation of the sea state distribution is presented in Figure 8, where the bivariate distributions of the parameter Hs and Te were represented for the reference sites AM3, AF3, AF5, and AS4. The bivariate distribution represents a joint evaluation of the Hs and Te parameters, which is capable of providing enough information to fully define a sea state. These diagrams are computed by using ΔHs × ΔTe cells (0.5 m × 0.5 s), which are expressed as a percentage from the total occurrences. By combining these diagrams with a particular power matrix of a wave energy converter, it is possible to evaluate the performances of a wave energy converter [56,75]. The results are computed only for the full time distribution, which are indicated in terms of the percentage of the total occurrences, being also indicated the wave power isolines covering the interval 5–800 kW/m. The differences between the sites are obvious, especially in the case of the site AS4 where a flat distribution of the data around the 5 kW/m isoline can be observed.
In the case of the site AM3 a 3% distribution of the values located in the range of 3–4 m and 8.5–9.5 s can be reported, with the mention that the fingerprint of this can also reveal values that are located between 200 kW/m and 800 kW/m. Regarding the site AF3, it can be mentioned that a maximum distribution of 5% is reported by the cells located in the intervals 2–3 m and 9–11 s, respectively.

4. Discussion of the Results

In this section, a detailed investigation of the wind and wave energy potential is carried out. Figure 9 illustrates the distribution of the wind power density represented for the full (first line) and winter time distribution (second line), where the results are indicated in terms of the average values and the associated wind power classes. The sites AM3, AF3, AS2, and AS5 present values that reveal a constant distribution in class 7, when comparing to the site AF5, where a 1072 W/m2 (class 7) is indicated during winter and a 356 W/m2 define the full time (class 5). The sites AM4 and AM5 can be also taken into account for a wind project since they indicate winds from the classes C4 and C5 (294–344 W/m2). Moderate conditions are reported by the sites AM1, AF1, AF2, AS3, and AS4, where the values do not exceed the C1 and C2 classification, which is not viable for a wind project. In order to identify the theoretical performance of a wind turbine the cut-off and rated capacity indexes of a wind turbine were evaluated (in %).
For the cut-off distribution the percentage located below these values (3 m/s in this case) was evaluated, during which the turbine would not generate electricity. For the rated capacity, the interval between the rated wind speed (12.5 m/s in this case) and the cut-off value was considered, which for most important offshore wind turbines are set to 25 m/s [76]. During this period, the wind generator will report the best performances in terms of electricity output. Maximum values of the cut-off distribution are accounted by the sites AS4—44.9%, AM1—29%, and AF2—23.58%, while on an opposite side there can be mentioned the sites AM3—2.8%, AM5—1.21% and AM2—0.39%. Regarding the rated capacity index, it can be mentioned that with the exception of the sites AM3, AF3, AF5, AS2, and AS5, the remaining sites present values close to zero.
As for the wave energy, Figure 10 presents a similar assessment, where for PW, eight wave classes were also indicated to the respective mean value. Similar to the wind energy, the wave energy can be divided also into classes, for this work only eight intervals being considered [77] denoted from C1 to C8, the first one being associated with a low energy level. The site AM3 exceeds the 60 kW/m limit, which is associated with the class C8, are followed by the site AF3 with a maximum power of 54 kW/m (class C7). Other relevant sites include AS3 and AS5, which present average values in the range of 15–25 kW/m2, and other sites that may report values in the C4 interval. The monthly variations are more significant for the sites that are located in the northern hemisphere, the differences between the minimum and maximum values are close to 90% for AS5, AS2, and AF5, while for the sites located in the southern part, in general the values are close to 50%.
If we discuss the inter-annual fluctuations, the differences are smaller than in the case of the monthly fluctuations, with the mention that the sites AM3, AS2, and AS5 have the maximum peaks of 41%, 43%, and 57%, respectively. A much smaller variation is reported at the sites AM1, AM2, and AF1, where the values are close to 15%, while for the rest of the sites, the fluctuations are located in the range of 20–30%.
Regarding the fluctuations of the marine conditions, Table 4 presents the variation of the U80 and Hs parameters. Regarding the monthly fluctuations, it can be mentioned that most of the sites located in the western part (except for AM3, AM5, and AF3) indicate more severe variations of the U80 parameter when compared to the Hs values, also including here the site AS1 located on the eastern side.
For the wind conditions, a maximum value of 62.12% is reported by AS1, followed by 49.91% for AF1, while for the waves a maximum of 90.57% is accounted by AS5 and a minimum of 17.57% is associated to AM3. In terms of the inter-annual values, for the wind speed, it can be mentioned that the sites AS2, AM2, and AS4 have values in the range 21.72–23.02% when compared to the wave height inter-annual variations, where a maximum of 47.83% is reported close to AS5.
Figure 11 illustrates the normalized distribution of the two parameters, where each average value was divided to the maximum value reported by the reference sites. The results are sorted in a descending order, where the points AM3, AF3, and AF5 can be included in the top five sites (wind and waves). For the wind conditions the following values can be mentioned AM3—1, AF5—0.82, AS5—0.77, AS2—0.72, AF3—0.71, and as for the waves, more consistent values are reported by AM3—1, AF3—0.81, AF5—0.54, AF4—0.54, and AM4—0.49.
Figure 12 illustrates the distribution of the THD index that was introduced on Equation (3). Based on these results, it can be observed that wave THD presents much lower value than in the case of the wind conditions. This may be considered to be a realistic evaluation if we take into account that the wave energy varies more slowly in time and space, than in the case of the wind resources There are also some exceptions, as in the case of the site AF5, where the two values coincide with each other, and for the sites AS2 and AS5 where the wind THD is lower. The wind THD varies between 0.69 and 1.94, the biggest differences being noticed between the sites AM5 and AM1. From the AF group, a maximum of 1.71 is reported by AF4, while a minimum of 0.93 is accounted by the site AF2. Regarding the values that are associated with the wave index, it can be observed that the best locations to develop a wave project are in the vicinity of the sites AM1, AM2, and AF1, which present values located below 0.51, while on contrary, the less attractive sites seem to be AS2 and AS5 with 1.42 and 2.03.

5. Conclusions

In the present work, a detailed assessment of the global wind and wave conditions in the nearshore environments of some developing countries was carried out, based on the 16-year time interval (2001–2016) of reanalysis data. The presented results provide a better understanding of the considered marine resources by taking into account an updated state-of-the-art database. In the context of emerging wind-wave projects, by analyzing the energy profile of each site and the seasonal variability it is possible to indicate the most suitable environments from this point of view. Since in the present work we focused on the average values, it is not viable to use the present information for the design of the coastal structures, where the extreme values are more important. Also, it can be mentioned that at this moment the price of electricity that is generated from the offshore wind and wave sources is still higher than the ones coming from the fossil fuels power plants, and therefore in the developing areas there are no possibility for such solutions. Nevertheless, these two marine resources (wind and wave) may represent a sustainable solution for the near future and starting from the present results, some scenarios can be elaborated in this direction.
The main findings and contributions of the present work are presented below:
  • throughout a literature review, the energy market and the progress of the renewable industry were identified for each target area. For the regions that are not included in the Global Statistical report [71], the associated values can be considered as an optimistic indicator;
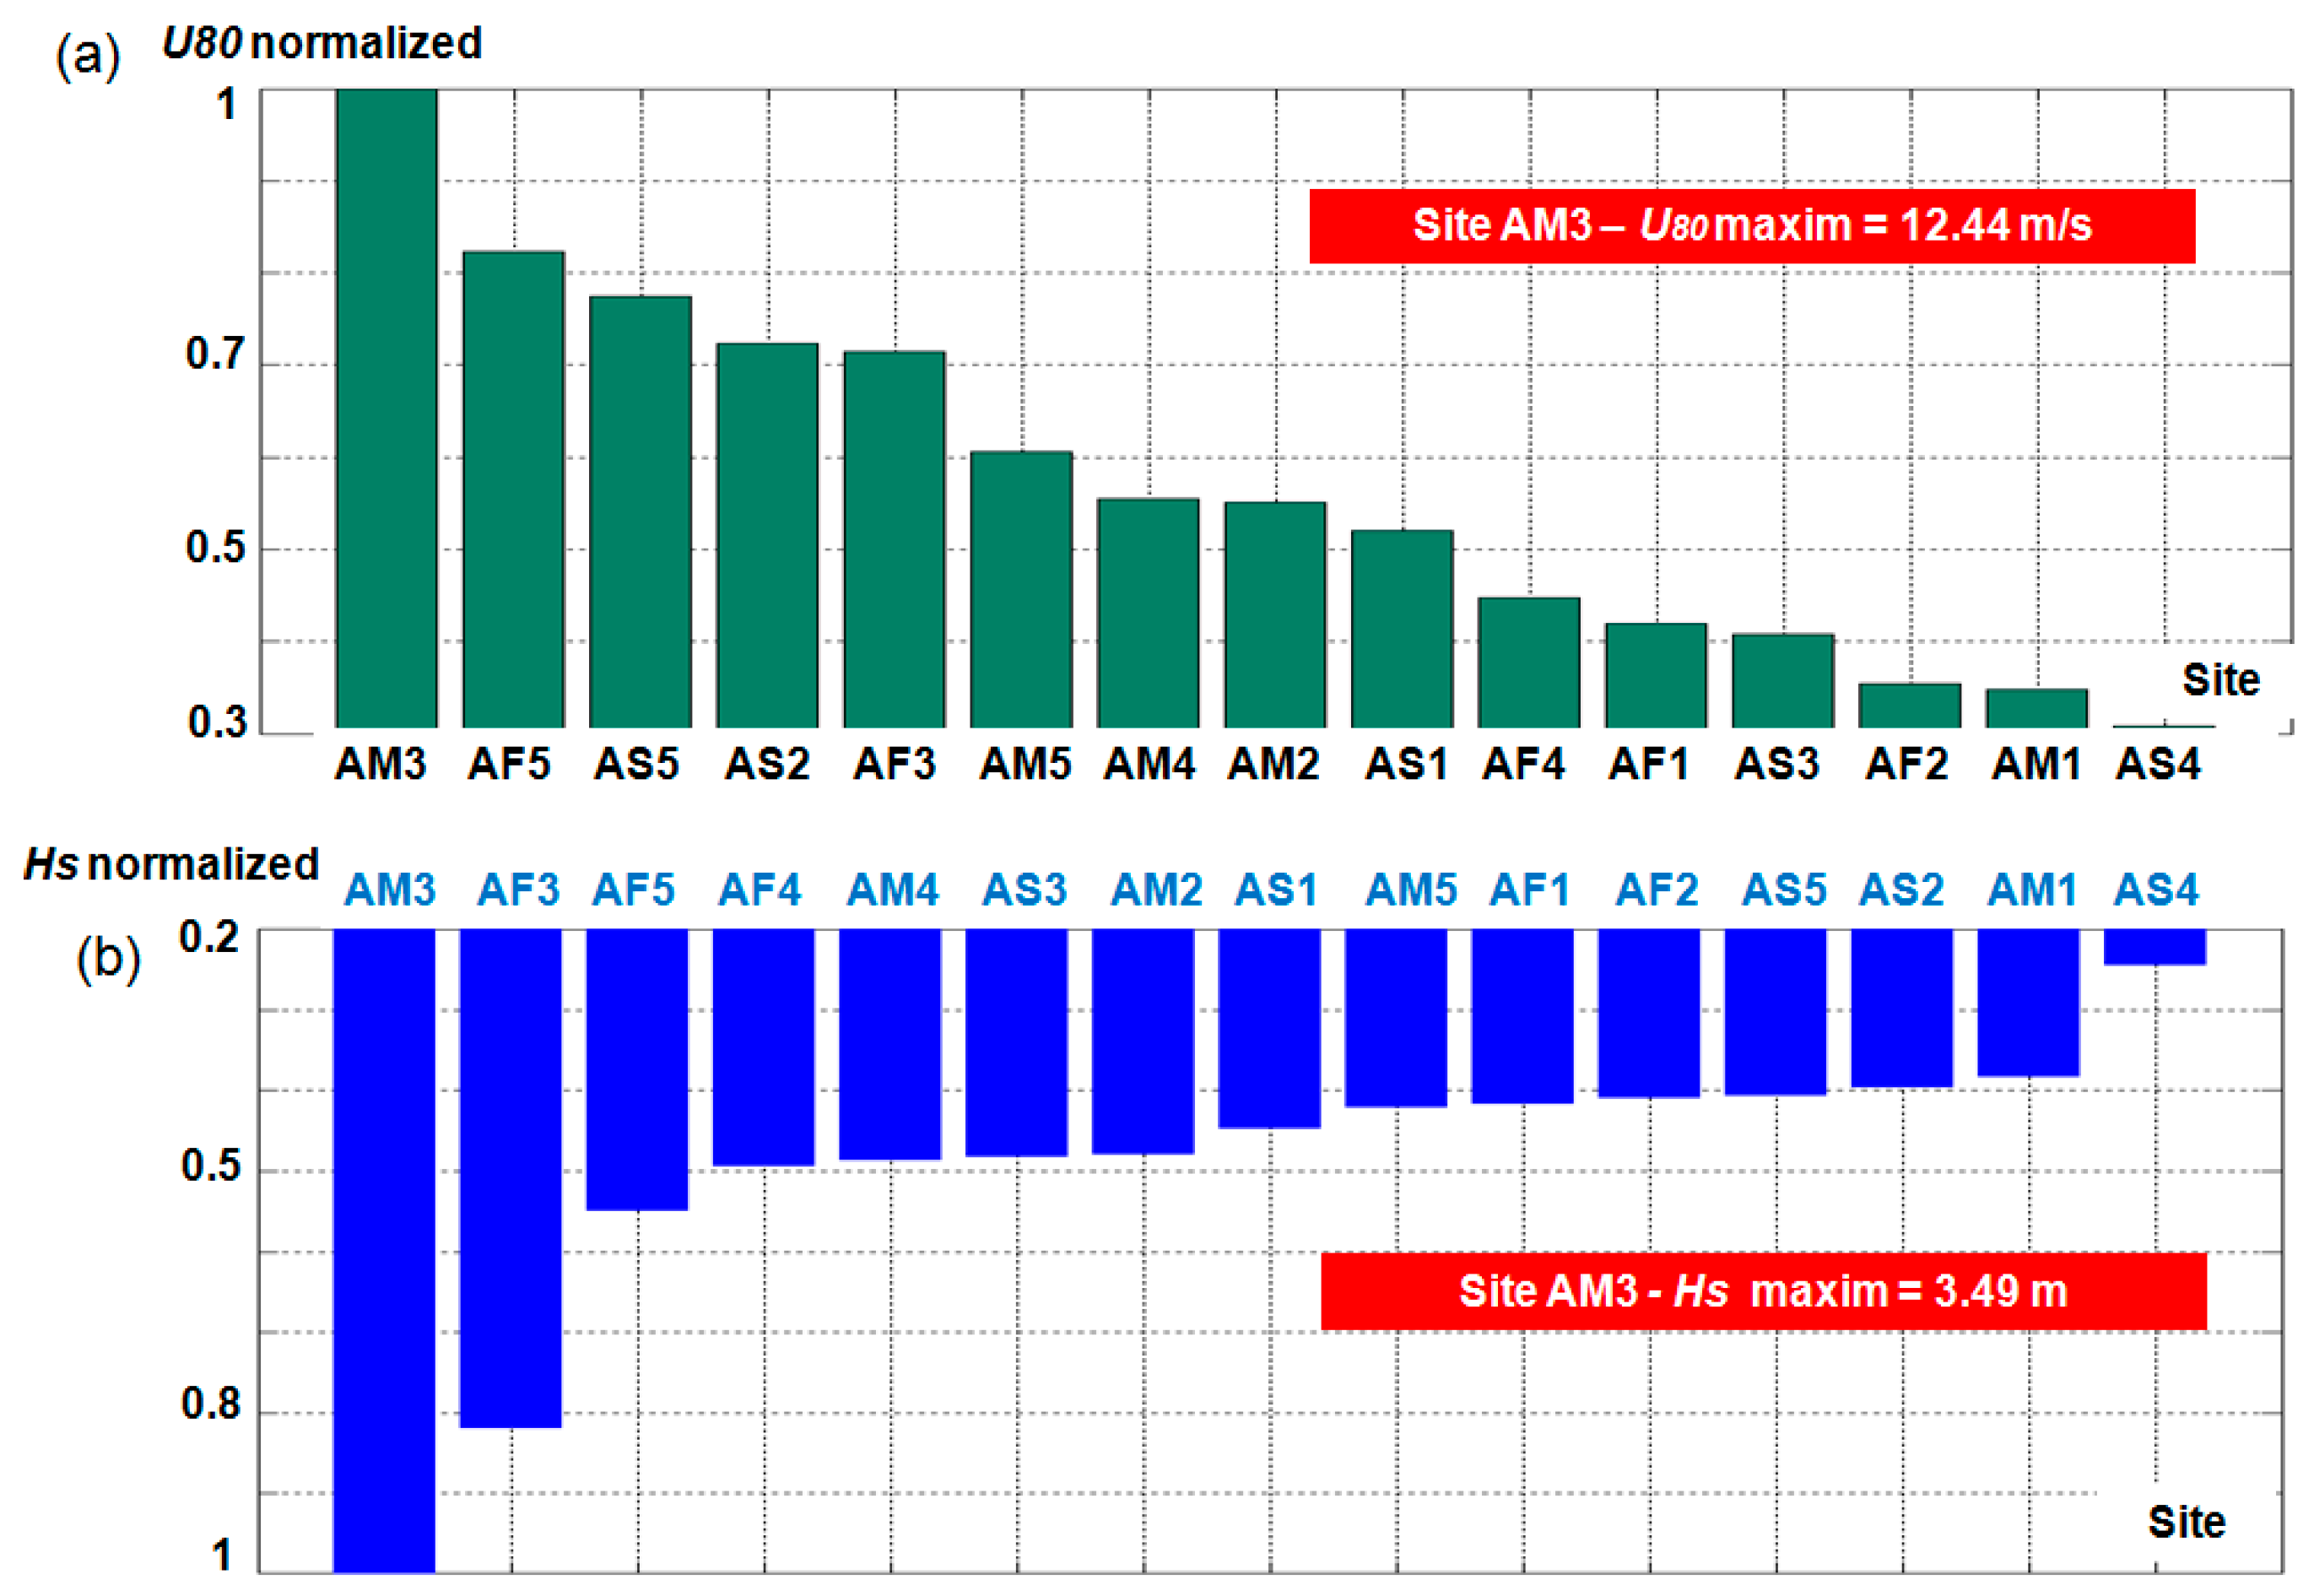
  • more promising sites in terms of the wind resources were identified, which are close to: AM3 (Chile), AF5 (Somalia), AS5 (Russia), AS2 (Vietnam), and AF3 (South Africa), respectively;
  • lower wind resources are noticed close to: AF4 (Madagascar), AF1 (Guinea-Bissau), AS3 (Timor), AF2 (Angola), AM1 (Mexico), and AS4 (Papua New Guinea), respectively. This means that it will not be viable to develop an offshore wind project near these sites; and,
  • the best performances of a wind turbine are expected to be registered close to the site AM3. In this case a rated capacity of 50% was obtained, which means that the generator will operate at full capacity at least 50% from the time interval considered for evaluation.
  • in terms of the wave energy most of the sites present values located in the classes C1, C2, and C3, which are considered to be moderate;
  • the best performances of a wave farm are expected to be obtained near the sites AM3 (Chile) and AF3 (South Africa). Since the wind and waves are more powerful close to these areas, it can be expected that a joint wind-wave project will be more successful in these two coastal environments;
  • in general, the inter-annual variations of the Hs parameter exceed the monthly variations;
  • on a global scale, the AS group sites present more significant monthly variations of the wave heights; and,
  • a classification of the sites, according to their wind and wave height was represented by taking into account the normalized values.

Acknowledgments

The ERA-Interim data used in this study have been obtained from the ECMWF data server. This work was carried out in the framework of the research project REMARC (Renewable Energy extraction in MARine environment and its Coastal impact), supported by the Romanian Executive Agency for Higher Education, Research, Development and Innovation Funding—UEFISCDI, grant number PN-III-P4-IDPCE-2016-0017. Finally, the authors would like to express their gratitude to the reviewers for their constructive suggestions and observations that helped in improving the present work.

Author Contributions

Eugen Rusu has guided this research, discussed the data and drawn the main conclusions. Florin Onea performed the literature review and also gathered, processed and analyzed the data. The final manuscript has been approved by all authors.

Conflicts of Interest

The authors declare no conflict of interest.

References

  1. Best, R.; Burke, P.J. The importance of government effectiveness for transitions toward greater electrification in developing countries. Energies 2017, 10, 1247. [Google Scholar] [CrossRef]
  2. Martinez, M.L.; Intralawan, A.; Vazquez, G.; Perez-Maqueo, O.; Sutton, P.; Landgrave, R. The coasts of our world: Ecological, economic and social importance. Ecol. Econ. 2007, 63, 254–272. [Google Scholar] [CrossRef]
  3. Amadi, H.N. Impact of Power Outages on Developing Countries: Evidence from Rural Households in Niger Delta, Nigeria. J. Energy Technol. Policy 2015, 5, 27–38. [Google Scholar]
  4. Gallup, J.L. Geography and Socioeconomic Development in Latin America and the Caribbean; Chapter 3 of Economic and Social Progress in Latin America, 1999–2000 Report; Inter-American Development Bank: Washington, DC, USA, 2000. [Google Scholar]
  5. U.S. Army Corps of Engineers. Coastal Engineering Manual; EM 1110-2-1100; U.S. Army Corps of Engineers: Washington, DC, USA, 2008.
  6. Perez-Collazo, C.; Greaves, D.; Iglesias, G. A review of combined wave and offshore wind energy. Renew. Sustain. Energy Rev. 2015, 42, 141–153. [Google Scholar] [CrossRef]
  7. Astariz, S.; Iglesias, G. Enhancing wave energy competitiveness through co-located wind and wave energy farms. A review on the shadow effect. Energies 2015, 8, 7344–7366. [Google Scholar] [CrossRef]
  8. Karimirad, M.; Koushan, K. WindWEC: Combining wind and wave energy inspired by hywind and wavestar. In Proceedings of the 2016 IEEE International Conference on Renewable Energy Research and Applications (ICRERA), Birmingham, UK, 20–23 November 2016. [Google Scholar] [CrossRef]
  9. Marzband, M.; Parhizi, N.; Savaghebi, M.; Guerrero, J.M. Distributed Smart Decision-Making for a Multi-microgrid System Based on a Hierarchical Interactive Architecture. IEEE Trans. Energy Convers. 2016, 31, 637–648. [Google Scholar] [CrossRef]
  10. Marzband, M.; Azarinejadian, F.; Savagheb, M.; Guerrero, J.M. An optimal energy management system for islanded microgrids based on multiperiod artificial bee colony combined with Markov Chain. IEEE Syst. J. 2015, 11, 1712–1722. [Google Scholar] [CrossRef]
  11. Marzband, M.; Sumper, A.; Ruiz-Alvareza, A.; Dominguez-Garcia, J.L.; Tomoiaga, B. Experimental evaluation of a real time energy management system for stand-alone microgrids in dayahead markets. Appl. Energy 2013, 106, 365–376. [Google Scholar] [CrossRef]
  12. Rusu, E.; Onea, F. Estimation of the wave energy conversion efficiency in the Atlantic Ocean close to the European islands. Renew. Energy 2016, 85, 687–703. [Google Scholar] [CrossRef]
  13. Marzband, M.; Javadi, M.; Dominguez-Garcia, J.L.; Moghaddam, M.M. Non-cooperative game theory based energy management systems for energy district in the retail market considering DER uncertainties. IET Gener. Transm. Distrib. 2016, 10, 2999–3009. [Google Scholar] [CrossRef]
  14. Valinejad, J.; Marzband, M.; Akorede, M.; Barforoshi, T.; Jovanovic, M. Generation expansion planning in electricity market considering uncertainty in load demand and presence of strategic GENCOs. Electr. Power Syst. Res. 2017, 152, 92–104. [Google Scholar] [CrossRef]
  15. Hanley, K.E.; Belcher, S. A global climatology of wind–wave interaction. J. Phys. Oceanogr. 2010, 40, 1263–1282. [Google Scholar] [CrossRef]
  16. Reguero, B.G.; Menendez, M.; Mendez, F.J.; Minguez, R.; Losada, I.J. A Global Ocean Wave (GOW) calibrated reanalysis from 1948 onwards. Coast. Eng. 2012, 65, 38–55. [Google Scholar] [CrossRef]
  17. Mentaschi, L.; Vousdoukas, M.I.; Voukouvalas, E.; Dosio, A.; Feyen, L. Global changes of extreme coastal wave energy fluxes triggered by intensified teleconnection pattern. Geophys. Res. Lett. 2016, 44, 2416–2426. [Google Scholar] [CrossRef]
  18. Rusu, L.; Onea, F. The performances of some state of the art wave energy converters in locations with the worldwide highest wave power. Renew. Sustain. Energy Rev. 2017, 75, 1348–1362. [Google Scholar] [CrossRef]
  19. Iglesias, G.; Carballo, R. Wave energy and nearshore hot spots: The case of the SE Bay of Biscay. Renew. Energy 2010, 35, 2490–2500. [Google Scholar] [CrossRef]
  20. Global Wind Energy Council (GWEC). Global Wind Energy Outlook; GWEC: Brussels, Belgium, 2016. [Google Scholar]
  21. United Nations Environment Programme. Renewable Energy and Energy Efficiency in Developing Countries: Contributions to Reducing Global Emissions; Second Report 2016; United Nations Environment Programme: Nairobi, Kenya, 2016. [Google Scholar]
  22. United Nations Development Programme (UNDP). Human Development Report 2015: Work for Human Development; UNDP: New York, NY, USA, 2015; ISBN 978-92-1-126398-5. [Google Scholar]
  23. Johnston, R.B.; Berg, M.; Johnson, C.A.; Tilley, E.; Hering, J.G. Water and Sanitation in Developing Countries: Geochemical Aspects of Quality and Treatment. Elements 2011, 7, 163–168. [Google Scholar] [CrossRef]
  24. Eurek, K.; Sullivan, P.; Gleason, M.; Hettinger, D.; Heimiller, D.; Lopez, A. An improved global wind resource estimate for integrated assessment models. Energy Econ. 2017, 64, 552–567. [Google Scholar] [CrossRef]
  25. Lu, X.; McElroy, M.B.; Kiviluoma, J. Global potential for wind-generated electricity. Proc. Natl. Acad. Sci. USA 2009, 106, 10933–10938. [Google Scholar] [CrossRef] [PubMed] [Green Version]
  26. Hemer, M.A.; Trenham, C.E. Evaluation of a CMIP5 derived dynamical global wind wave climate model ensemble. Ocean Model. 2016, 103, 190–203. [Google Scholar] [CrossRef]
  27. Stopa, J.E.; Cheung, K.F. Periodicity and patterns of ocean wind and wave climate. J. Geophys. Res. Oceans 2014, 119, 5563–5584. [Google Scholar] [CrossRef]
  28. Dobrynin, M.; Murawsky, J.; Yang, S. Evolution of the global wind wave climate in CMIP5 experiments. Geophys. Res. Lett. 2012, 39, L18606. [Google Scholar] [CrossRef]
  29. Jiang, H.; Chen, G. A global view on the swell and wind sea climate by the Jason-1 mission: A revisit. J. Atmos. Ocean. Technol. 2013, 30, 1833–1841. [Google Scholar] [CrossRef]
  30. Semedo, A.; Susel, K.; Rutgersson, A.; Sterl, A. A global view on the wind sea and swell climate and variability from ERA-40. J. Clim. 2011, 24, 1461–1479. [Google Scholar] [CrossRef]
  31. Emmanouil, G.; Galanis, G.; Kalogeri, C.; Zodiatis, G.; Kallos, G. 10-year high resolution study of wind, sea waves and wave energy assessment in the Greek offshore areas. Renew. Energy 2016, 90, 399–419. [Google Scholar] [CrossRef]
  32. Foti, E.; Musumeci, R.; Leanza, S.; Cavallaro, L. Feasibility of an offshore wind farm in the gulf of Gela: Marine and structural issues. Wind Eng. 2010, 34, 65–84. [Google Scholar] [CrossRef]
  33. Omrani, H.; Drobinski, P.; Arsouze, T.; Bastin, S.; Lebeaupin-Brossier, C.; Mailler, S. Spatial and temporal variability of wind energy resource and production over the north western Mediterranean sea: Sensitivity to air-sea interactions. Renew. Energy 2017, 101, 680–689. [Google Scholar] [CrossRef]
  34. Soukissian, T.; Karathanasi, F.; Axaopoulos, P. Satellite-based offshore wind resource assessment in the mediterranean sea. IEEE J. Ocean. Eng. 2017, 42, 73–86. [Google Scholar] [CrossRef]
  35. Onea, F.; Deleanu, L.; Rusu, L.; Georgescu, C. Evaluation of the wind energy potential along the Mediterranean Sea coasts. Energy Explor. Exploit. 2016, 34, 766–792. [Google Scholar] [CrossRef]
  36. Guedes Soares, C.; Bento, A.R.; Gonçalves, M.; Silva, D.; Martinho, P. Numerical evaluation of the wave energy resource along the Atlantic European coast. Comput. Geosci. 2014, 71, 37–49. [Google Scholar] [CrossRef]
  37. Gleizon, P.; Campuzano, F.; Carracedo, P.; Martinez, A.; Goggins, J.; Atan, R.; Nash, S. Wave Energy Resources along the European Atlantic coast. Mar. Renew. Energy 2017. [Google Scholar] [CrossRef]
  38. Cahill, B.G.; Lewis, T. Wave energy resource characterisation of the Atlantic marine energy test site. Int. J. Mar. Energy 2013, 1, 3–15. [Google Scholar] [CrossRef]
  39. Kim, G.; Jeong, W.M.; Lee, K.S.; Jun, K.; Lee, M.E. Offshore and nearshore wave energy assessment around the Korean Peninsula. Energy 2011, 36, 1460–1469. [Google Scholar] [CrossRef]
  40. Iuppa, C.; Cavallaro, L.; Foti, E.; Vicinanza, D. Potential wave energy production by different wave energy converters around Sicily. J. Renew. Sustain. Energy 2015, 7. [Google Scholar] [CrossRef]
  41. Liberti, L.; Carillo, A.; Sannino, G. Wave energy resource assessment in the Mediterranean, the Italian perspective. Renew. Energy 2013, 50, 938–949. [Google Scholar] [CrossRef]
  42. Zheng, C.-W.; Zhuang, H.; Li, X.; Li, X.-Q. Wind energy and wave energy resources assessment in the East China Sea and South China Sea. Sci. China Technol. Sci. 2012, 55, 163–173. [Google Scholar] [CrossRef]
  43. Pastor, J.; Liu, Y. Wave climate resource analysis based on a revised Gamma spectrum for wave energy conversion technology. Sustainability 2016, 8, 1321. [Google Scholar] [CrossRef]
  44. Guiberteau, K.L.; Liu, Y.; Lee, L.; Kozman, T.A. Investigation of developing wave energy technology in the Gulf of Mexico. Distrib. Gener. Altern. Energy J. 2012, 27. [Google Scholar] [CrossRef]
  45. Dias, F.; Renzi, E.; Gallagher, S.; Sarkar, D.; Wei, Y.; Abadie, T.; Cummins, C.; Rafiee, A. Analytical and computational modelling for wave energy systems: The example of oscillating wave surge converters. Acta Mech. Sin. 2017, 33, 647–662. [Google Scholar] [CrossRef] [PubMed]
  46. Bellew, S.; Køhler, A.; Juliussen, A.; Le Faucheux, P.; Yde, A.; Verelst, D. Joint Wind Wave Testing and Validation of Floating Power Plant’s Renewable Hybrid. MARINET-TA1-FPPHybVa Report. 2015. Available online: http://www.marinet2.eu/wp-content/uploads/2017/04/FPP-MARINET-Official-Report-for-ECN-Tests_FPPHybVal-1.pdf (accessed on 27 September 2017).
  47. Onea, F.; Rusu, E. The expected efficiency and coastal impact of a hybrid energy farm operating in the Portuguese nearshore. Energy 2016, 97, 411–423. [Google Scholar] [CrossRef]
  48. Onea, F.; Rusu, L. Coastal impact of a hybrid marine farm operating close to Sardinia Island. In Proceedings of the OCEANS 2015, Genoa, Italy, 18–21 May 2015. [Google Scholar] [CrossRef]
  49. Marzband, M.; Ardeshiri, R.R.; Moafi, M.; Uppal, H. Distributed generation for economic benefit maximization through coalition formation based on Game Theory. Int. Trans. Electr. Energy Syst. 2017, 27, 1–16. [Google Scholar] [CrossRef]
  50. A real-time evaluation of energy management systems for smart hybrid home Microgrids. Electr. Power Syst. Res. 2016, 143, 624–633. [CrossRef]
  51. Adaptive load shedding scheme for frequency stability enhancement in microgrids. Electr. Power Syst. Res. 2016, 140, 78–86. [CrossRef]
  52. Marzband, M.; Yousefnejad, E.; Sumper, A.; Dominguez-Garcia, J.L. Real time experimental implementation of optimum energy management system in standalone microgrid by using multi-layer ant colony optimization. Int. Trans. Electr. Energy Syst. 2016, 75, 265–274. [Google Scholar] [CrossRef] [Green Version]
  53. Marzband, M.; Ghadimi, M.; Sumper, A.; Dominguez-Garcia, J.L. Experimental validation of a real-time energy management system using multi-period gravitational search algorithm for microgrids in islanded mod. Appl. Energy 2014, 128, 164–174. [Google Scholar] [CrossRef] [Green Version]
  54. Marzband, M.; Parhizi, N.; Adabi, J. Optimal energy management for stand-alone microgrids based on multi-period imperialist competition algorithm considering uncertainties: Experimental validation. Int. Trans. Electr. Energy Syst. 2015, 26, 1358–1372. [Google Scholar] [CrossRef]
  55. Onea, F.; Rusu, L. A long-term assessment of the Black Sea wave climate. Sustainability 2017, 9, 1875. [Google Scholar] [CrossRef]
  56. Rusu, L.; Onea, F. Assessment of the performances of various wave energy converters along the European continental coasts. Energy 2015, 82, 889–904. [Google Scholar] [CrossRef]
  57. Cavaleri, L. Wave modeling-missing the peaks. J. Phys. Oceanogr. 2009, 39, 2757–2778. [Google Scholar] [CrossRef]
  58. World Bank. World Development Indicators 2017 Maps. Available online: http://data.worldbank.org/products/wdi-maps (accessed on 10 April 2017).
  59. Dee, D.P.; Uppala, S.M.; Simmons, A.J.; Berrisford, P.; Poli, P.; Kobayashi, S.; Andrae, U.; Balmaseda, M.A.; Balsamo, G.; Bauer, P.; et al. The ERA-interim reanalysis: Configuration and performance of the data assimilation system. Q. J. R. Meteorol. Soc. 2011, 137, 553–597. [Google Scholar] [CrossRef]
  60. Cardinali, C. Data Assimilation. Observation Impact on the Short Range Forecast; ECMWF Lecture Notes; European Centre for Medium-Range Weather Forecasts (ECMWF): Reading, UK, 2013. [Google Scholar]
  61. Persson, A.; Grazzini, F. User Guide to ECMWF Forecast Products 4.0; ECMWF Report; European Centre for Medium-Range Weather Forecasts (ECMWF): Reading, UK, 2007. [Google Scholar]
  62. Shanas, P.R.; Sanil Kumar, V. Temporal variations in the wind and wave climate at a location in the eastern Arabian Sea based on ERA-interim reanalysis data. Nat. Hazards Earth Syst. Sci. 2014, 14, 1371–1381. [Google Scholar] [CrossRef] [Green Version]
  63. Kubik, M.L.; Coker, P.J.; Hunt, C. Using meteorological wind data to estimate turbine generation output: A sensitivity analysis. In Proceedings of the World Renewable Energy Congress, Linkoping, Sweden, 8–13 May 2011. [Google Scholar]
  64. Gunturu, U.B.; Schlosser, C.A. Characterization of wind power resource in the United States. Atmos. Chem. Phys. 2012, 12, 9687–9702. [Google Scholar] [CrossRef] [Green Version]
  65. Archer, C.L.; Jacobson, M.Z. The spatial and temporal distributions of U.S. winds and wind power at 80 m derived from measurements. J. Geophys. Res. Atmos. 2003, 108. [Google Scholar] [CrossRef]
  66. Onea, F.; Rusu, E. Efficiency assessments for some state of the art wind turbines in the coastal environments of the Black and the Caspian seas. Energy Explor. Exploit. 2016, 34, 217–234. [Google Scholar] [CrossRef]
  67. Tong, W. Fundamentals of wind energy. In Wind Power Generation and Wind Turbine Design; WIT Press: Southampton, UK, 2010; Volume 44, p. 112. [Google Scholar]
  68. Folley, M. The Wave Energy Resource. Ocean Eng. Oceanogr. 2017, 7. [Google Scholar] [CrossRef]
  69. Tulin, M.P. On the transport of energy in water waves. J. Eng. Math. 2007, 58, 339–350. [Google Scholar] [CrossRef]
  70. Astariz, S.; Iglesias, G. Selecting optimum locations for co-located wave and wind energy farms. Part II: A case study. Energy Convers. Manag. 2016, 122, 599–608. [Google Scholar] [CrossRef]
  71. Enerdata. Global Statistical Yearbook 2016; Enerdata: Grenoble, France, 2016. [Google Scholar]
  72. Pillai, A.C.; Chick, J.; Khorasanchi, M.; Barbouchi, S.; Johanning, L. Application of an offshore wind farm layout optimization methodology at Middelgrunden wind farm. Ocean Eng. 2017, 139, 287–297. [Google Scholar] [CrossRef]
  73. Singleton, F. The Beaufort scale of winds—Its relevance, and its use by sailors. Weather 2008, 63, 37–41. [Google Scholar] [CrossRef]
  74. Archer, C.L.; Jacobson, M.Z. Evaluation of global wind power. J. Geophys. Res. 2005, 110, 1–20. [Google Scholar] [CrossRef]
  75. Rusu, E.; Onea, F. Study on the influence of the distance to shore for a wave energy farm operating in the central part of the Portuguese nearshore. Energy Convers. Manag. 2016, 114, 209–223. [Google Scholar] [CrossRef]
  76. Onea, F.; Ciortan, S.; Rusu, E. Assessment of the potential for development hybrid wind-wave projects in the European nearshore. Energy Environ. 2017, 1–18. [Google Scholar] [CrossRef]
  77. Lagoun, M.; Benalia, A.; Benbouzid, M. Ocean Wave Converters: State of the Art and Current Status. In Proceedings of the 2010 IEEE International Energy Conference, Manama, Bahrain, 18–22 December 2010; pp. 636–641. [Google Scholar] [CrossRef]
Figure 1. Global map representing the developing countries targeted [58] and the reference sites considered for evaluation.
Energies 10 01866 g001
Figure 2. Dynamics of the main energy parameters corresponding to the interval 1990–2015, based on the Global Statistical Yearbook 2016 [71]. The results are indicated for: (a) Electricity balance trade; (b) CO2 emissions; (c) share of renewable electricity; (d) wind and solar contribution to the electricity budget.
Energies 10 01866 g002
Figure 3. Assessment of the wind conditions (at height of 80 m) considering 16-year of European Centre for Medium range Weather Forecast (ECMWF) wind data (2001–2016). The results are indicated in terms of the mean values for: (a) distribution of the parameter U80 (m/s) corresponding to the full and winter time distribution, respectively; (b) monthly variation of the wind speed U80.
Energies 10 01866 g003
Figure 4. U80 histograms based on 16-year of ECMWF wind data (2001–2016), where: (a) full time distribution; and, (b) winter time distribution.
Energies 10 01866 g004
Figure 5. Wind roses corresponding to 16-year of ECMWF wind data (2001–2016), considering the full time distribution only.
Energies 10 01866 g005
Figure 6. Monthly variations of the main wave parameters corresponding to the 16-year interval (2001–2016). The results (average values) are indicated in terms of the wave parameters: (a,c) Hs (m)—America/Africa and Asia; (b,d) Te (s)—America/Africa and Asia.
Energies 10 01866 g006
Figure 7. Wave conditions corresponding to 16-year of ECMWF wave data (2001–2016), average values reported for: (a) Hs and (b) Te; (c) Hs histogram and (d) Te histogram (in %).
Energies 10 01866 g007
Figure 8. Sea states characteristics described by the bivariate distributions of the wave parameters Hs and Te. The results are processed for the 16-year interval (2001–2016) considering only the full time distribution for: (a) AM3 site; (b) AF3 site; (c) AF5 site; and, (d) AS4 site.
Energies 10 01866 g008
Figure 9. Wind energy potential (evaluated when considering the parameter U80) corresponding to the 16-year of ECMWF wind data (2001–2016). The first and the second lines of each table are related to the full and winter time distribution, respectively.
Energies 10 01866 g009
Figure 10. Wave energy potential corresponding to 16-year of ECMWF wave data (2001–2016). From C1 to C7 the energy classes are indicated according to [77], with the mention that the last one (C8) relates the highest energy level.
Energies 10 01866 g010
Figure 11. Normalized non-dimensional values of the parameters U80 and Hs, reported at the reference sites for the full time distribution. The results are indicated for: (a) U80 normalized; (b) Hs normalized.
Energies 10 01866 g011
Figure 12. The distribution of the THD (total harmonic distortion) indicator considered to represent the normalized power of wind (WPD) and the wave power (Pw). The results are related to the full time distribution considering 16-year of ECMWF wind and wave data (2001–2016).
Energies 10 01866 g012
Table 1. Global statistics concerning the energy portfolio corresponding to the time interval 1990–2015 (average values). The results were processed from the Global Statistical Yearbook 2016 [71]. For the sites underlined the nearest country in the region was considered as a reference.
Site →AM1AM2
AM3
AM4AM5AF1AF2
AF3
AF4
AF5AS1AS2AS3AS5EUWorld
Stat ↓
EBT (TWh)01360010400−169-
TBT (Mtoe)−601837−140−111−24−1240−21−122−450777-
CO2 intensity (kCO2/$2005p)0.290.290.160.360.070.770.240.310.350.241.030.30.42
Renewable (%)18.358.387.870.231.21.915.77.49.614.91822.320
Wind & solar (%)3.30.30.4000.10.40.204.4031.3
Table 2. Wind power density (WPD) statistics based on 16-year of ECMWF data (2001–2016) at a height of 80 m above the sea level.
SiteMean WPD (W/m2)Wind Power Classes (%) at a Height of 80 m *
C1C2C3C4C5C6C7
AM191.4273.4114.334.173.061.711.671.64
AM2242.423.8624.3513.2412.018.899.568.08
AM317319.395.182.703.072.784.6072.27
AM4309.234.2415.317.137.335.958.7921.25
AM5315.316.3619.2411.4112.0510.2913.3717.28
AF1137.657.7818.817.125.353.773.713.46
AF273.375.8218.493.531.470.470.170.05
AF373223.0811.55.385.574.857.0742.54
AF4181.754.8818.566.145.143.534.147.61
AF5107318.5310.064.714.964.006.6751.09
AS1297.343.5916.586.345.524.115.5918.27
AS2695.521.288.724.4675.034.677.4348.4
AS3125.259.1121.237.25.042.782.402.24
AS467.3180.7510.712.872.161.241.390.88
AS5101322.710.034.754.944.106.1947.27
* C1 (<107 W/m2); C2 (107–201 W/m2); C3 (201–258 W/m2); C4 (258–325 W/m2); C5 (325–390 W/m2); C6 (390–509 W/m2); C7 (≥509 W/m2). According to the values indicated in [65].
Table 3. Statistics of the main wave parameters (Hs, Te and Pw) corresponding to the 16-year of ECMWF data (2001–2016).
SiteHs (m)Hs-95th (m)<1 m (%)Te (s)Te-95th (s)Pw (kW/m)Pw-95th (kW/m)
AM11.331.816.4910.9139.8719
AM21.672.270.369.4511.613.426.4
AM33.495.8109.791267.5177
AM41.692.571.578.6111.113.432.9
AM51.462.085.937.078.67.8116.2
AF11.451.881.318.9410.89.3116.7
AF21.422.086.410.112.510.925.3
AF32.854.5201012.544.4111
AF41.722.530.88.810.613.829.5
AF51.913.6916.67.18.616.854
AS11.562.8319.29.2611.812.634.9
AS21.382.9337.15.958.38.332.5
AS31.682.53.2610.312.915.234.4
AS40.851.3770.78.1510.33.398.73
AS51.414.0742.45.259.615.872.1
Table 4. Monthly and inter-annual fluctuations of the parameters U80 and Hs, based on the 16-year ECMWF data (2001–2016). For the wind conditions the values exceeding the 25 m/s limit were not taken into account.
SiteU80 Monthly Variations (%)U80 Inter-Annual Variations (%)Hs Monthly Variations (%) Hs Inter-Annual Variations (%)
AM135.0419.320.156.577
AM239.422.9826.98.075
AM310.7514.2417.5718.91
AM426.419.7724.776.206
AM532.5217.4836.112.6
AF149.918.77914.35.09
AF226.979.6825.968.202
AF313.5113.1924.9411.91
AF417.199.59131.9910.74
AF570.447.93872.468.563
AS162.1210.7357.1811.08
AS253.5223.0266.2624.81
AS342.5115.5330.0811.48
AS441.3621.7251.948.852
AS549.0316.3190.5747.83

