Combining Life Cycle Environmental and Economic Assessments in Building Energy Renovation Projects

Abstract
1. Introduction
2. Methods
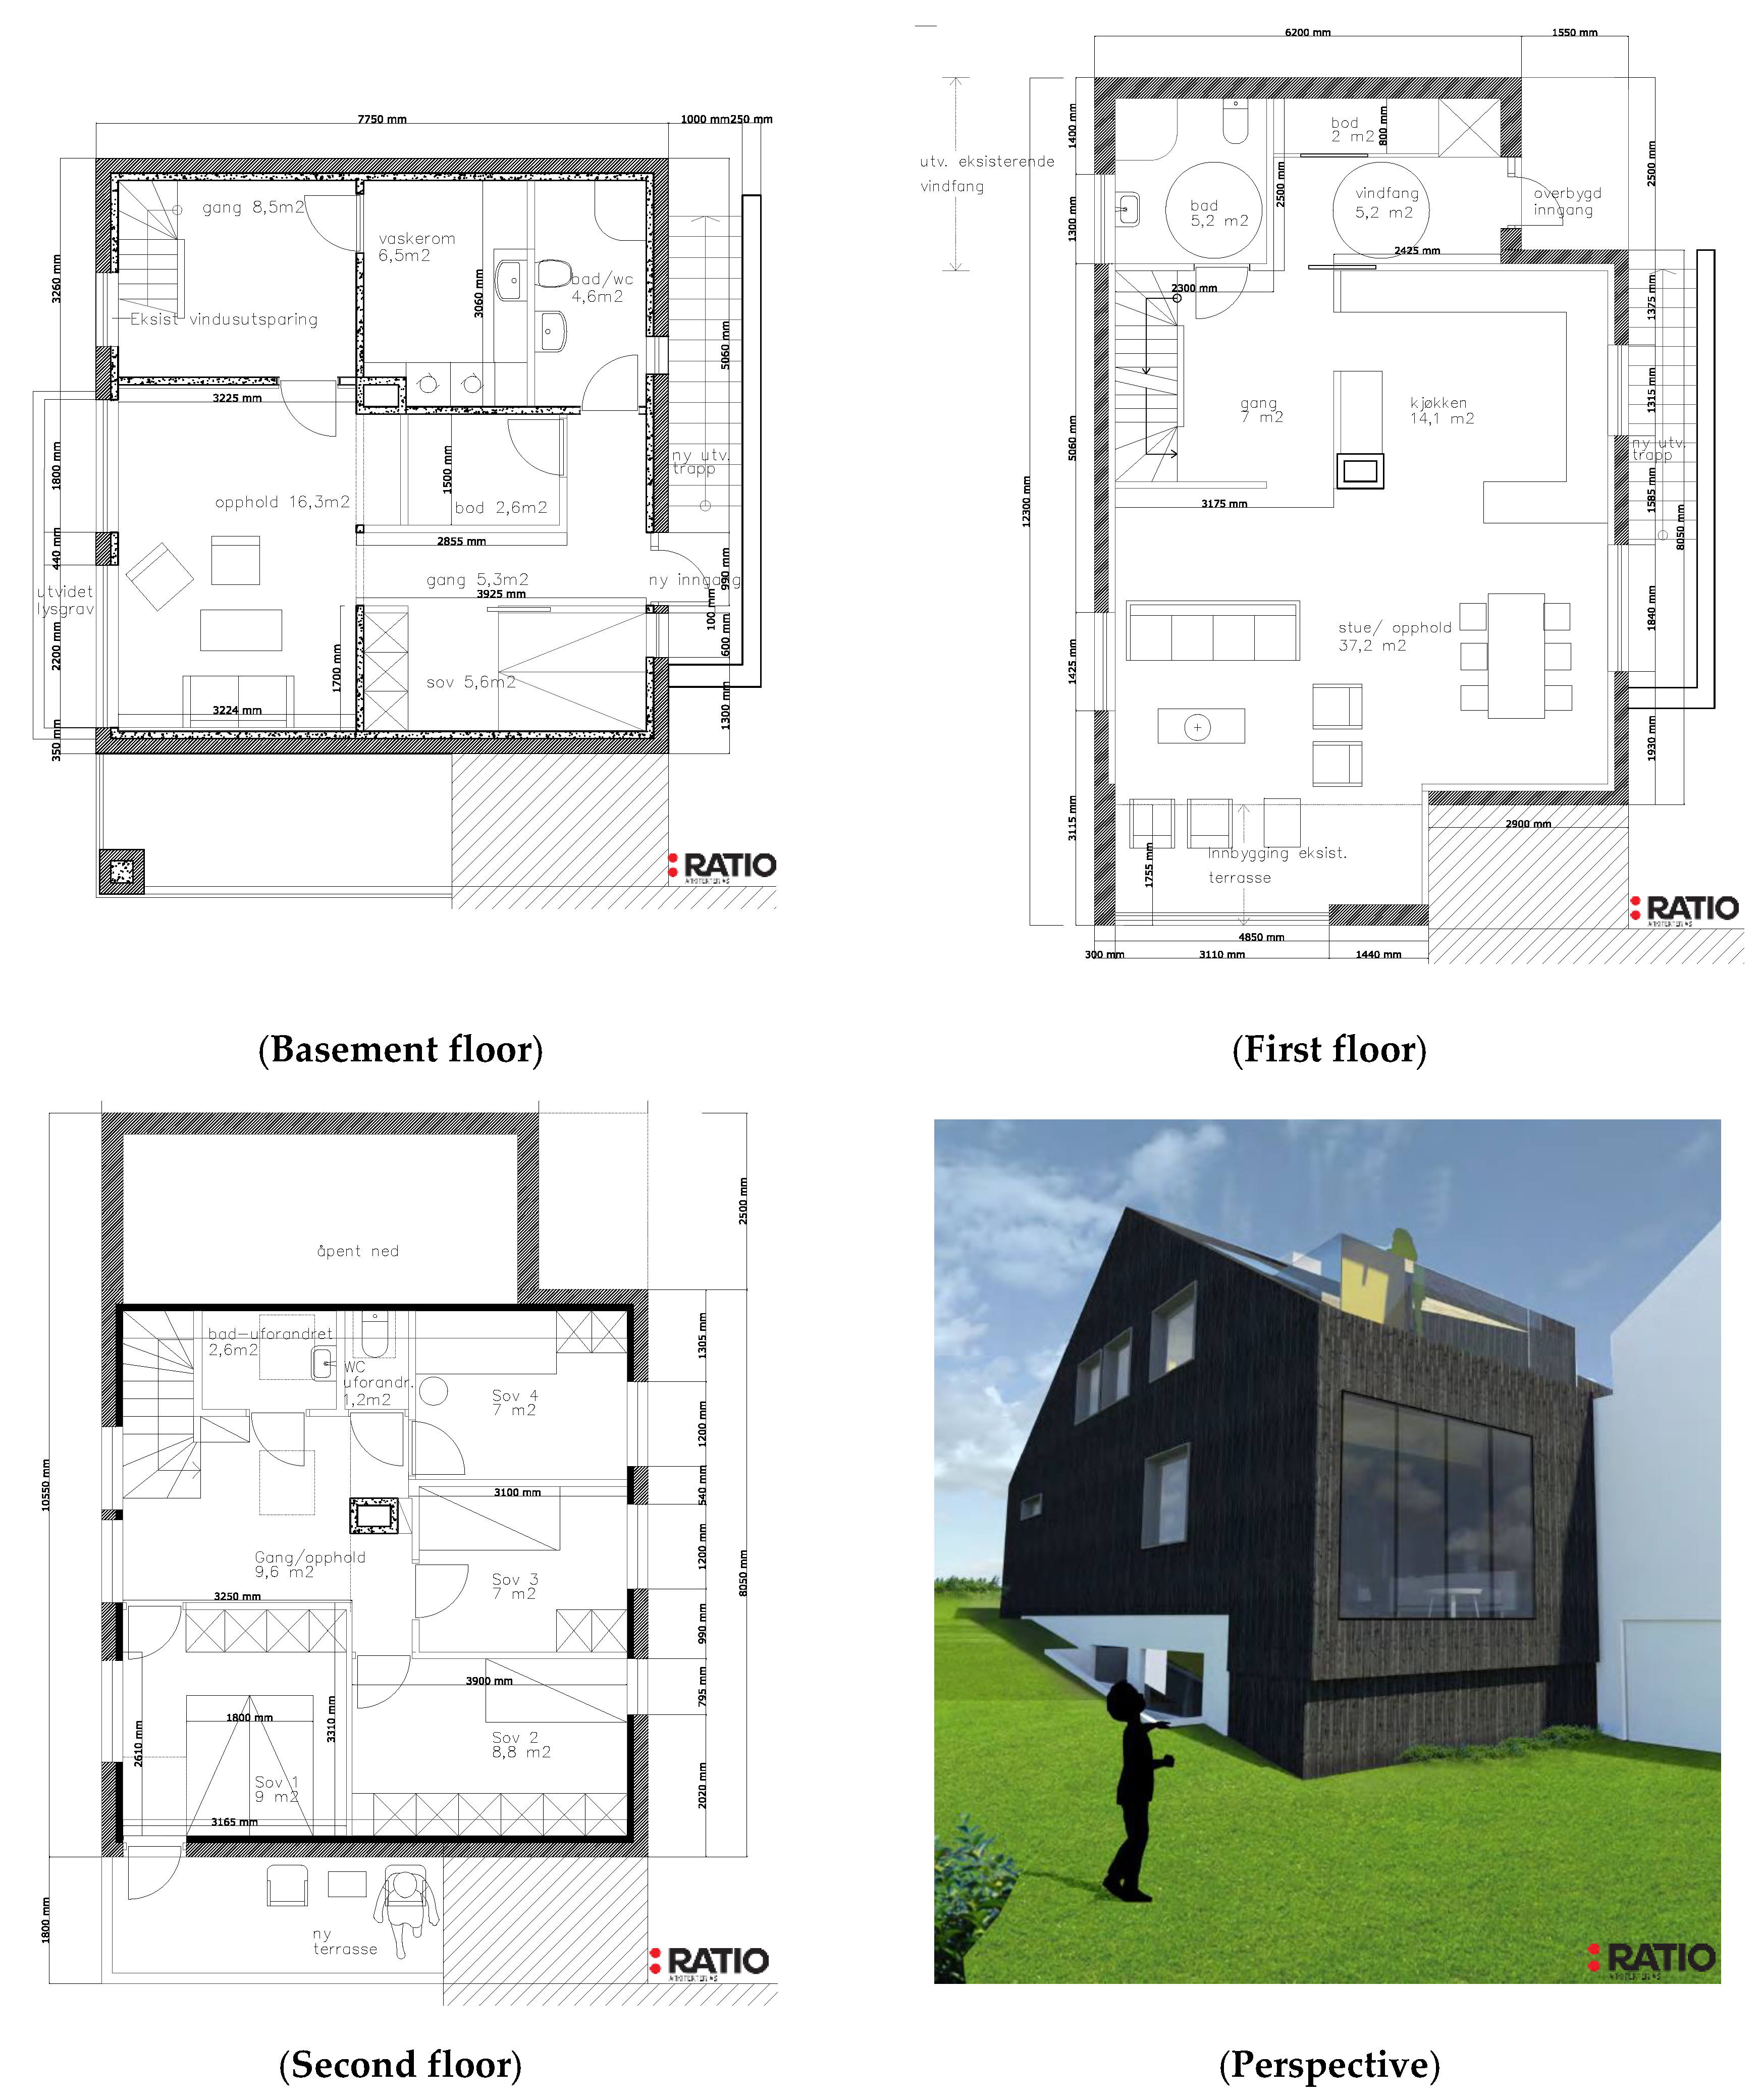
2.1. Case Study
- S1: electric radiators, electric floor heating, air-to-air heat pump, and wood stove;
- S2: electric radiators, electric floor heating, and no RETs;
- S3: multi-split air-to-water heat pump with water radiators;
- S4: electric radiators, electric floor heating, wood stove, and no RETs;
- S5: electric radiators, electric floor heating, and PV system;
- S6: electric radiators, electric floor heating, PV system, and solar thermal system;
- S7: multi-split air-to-water heat pump with water radiators, PV system, and solar thermal system.
2.2. Analyses Performed
2.2.1. Life Cycle Assessment
2.2.2. Life Cycle Costing Analysis
2.2.3. Sensitivity Analyses
3. Results
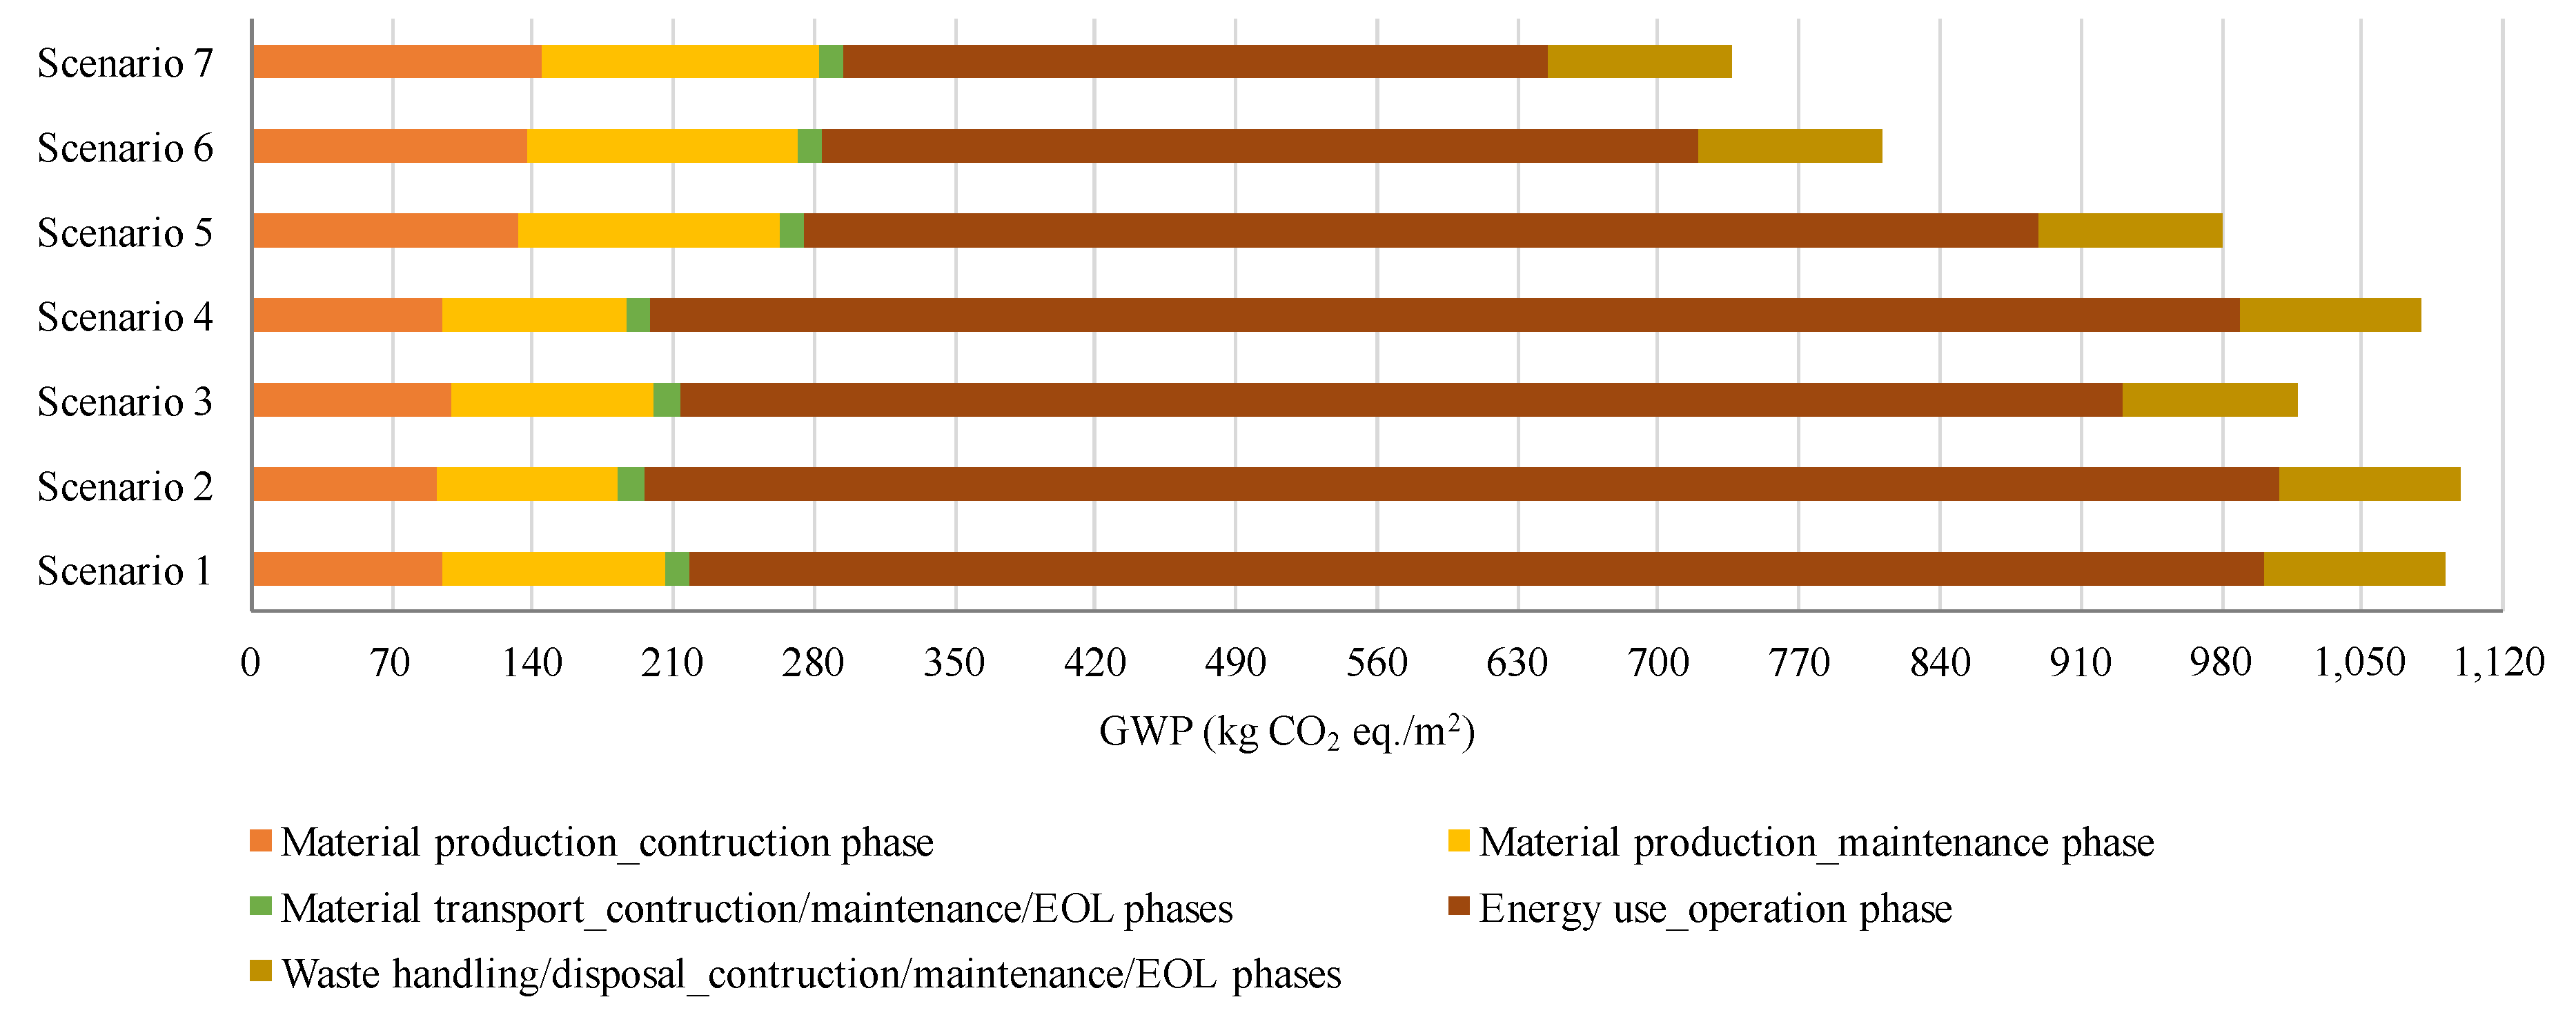
3.1. Life Cycle Assessment
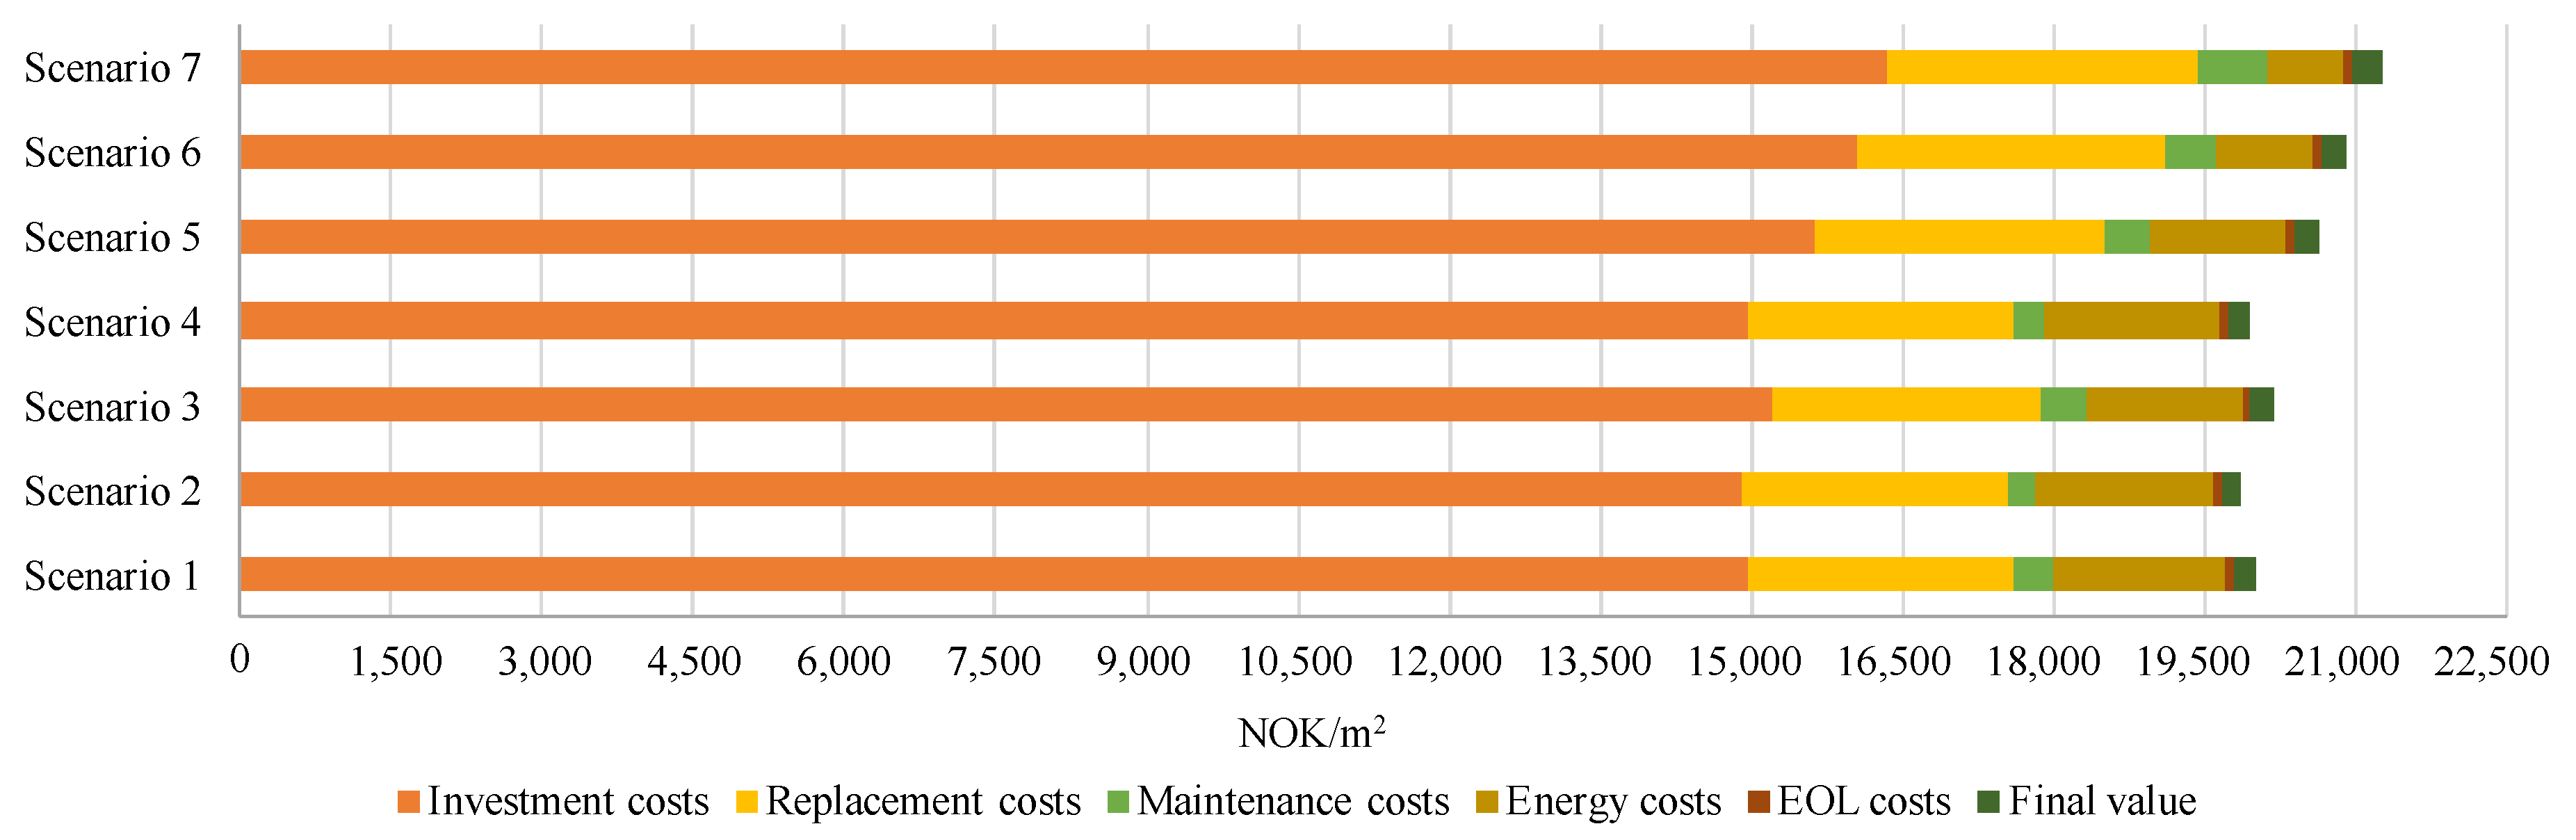
3.2. Life Cycle Cost Analysis
3.3. Combined Life Cycle Assessment & Life Cycle Costing Results
3.4. Sensitivity Analyses
4. Discussion
5. Conclusions
Supplementary Materials
Acknowledgments
Author Contributions
Conflicts of Interest
References
- Sev, A. How can the construction industry contribute to sustainable development? A conceptual framework. Sustain. Dev. 2009, 17, 161–173. [Google Scholar] [CrossRef]
- European Parliament; Council of the European Union. Energy Performance of Buildings (Recast); Directive 2010/31/EU; European Parliament: Brussels, Belgium, 2010. [Google Scholar]
- Ma, Z.; Cooper, P.; Daly, D.; Ledo, L. Existing building retrofits: Methodology and state-of-the-art. Energy Build. 2012, 55, 889–902. [Google Scholar] [CrossRef]
- Pisello, A.L.; Petrozzi, A.; Castaldo, V.L.; Cotana, F. On an innovative integrated technique for energy refurbishment of historical buildings: Thermal-energy, economic and environmental analysis of a case study. Appl. Energy 2016, 162, 1313–1322. [Google Scholar] [CrossRef]
- Tiberi, M.; Carbonara, E. Comparing Energy Improvements and Financial Costs of Retrofitting Interventions in a Historical Building. Energy Procedia 2016, 101, 995–1001. [Google Scholar] [CrossRef]
- Panthi, K.; Das, K.; Abdel-Salam, T. Sustainability and cost assessment of coastal vacation homes for energy retrofits. Built Environ. Proj. Asset Manag. 2017, 7, 185–198. [Google Scholar] [CrossRef]
- Cellura, M.; Ciulla, G.; Guarino, F.; Longo, S. Redesign of a Rural Building in a Heritage Site in Italy: Towards the Net Zero Energy Target. Buildings 2017, 7, 68. [Google Scholar] [CrossRef]
- Beccali, M.; Cellura, M.; Fontana, M.; Longo, S.; Mistretta, M. Energy retrofit of a single-family house: Life cycle net energy saving and environmental benefits. Renew. Sustain. Energy Rev. 2013, 27, 283–293. [Google Scholar] [CrossRef]
- Xu, P.; Chan, E.H.-W.; Qian, Q.K. Success factors of energy performance contracting (EPC) for sustainable building energy efficiency retrofit (BEER) of hotel buildings in China. Energy Policy 2011, 39, 7389–7398. [Google Scholar] [CrossRef]
- Ferreira, M.; Almeida, M. Benefits from energy related building renovation beyond costs, energy and emissions. Energy Procedia 2015, 78, 2397–2402. [Google Scholar] [CrossRef]
- International Organization for Standardization (ISO). Environmental Management—Life Cycle Assessment—Principles and Framework; ISO 14040; ISO: Geneva, Switzerland, 2006. [Google Scholar]
- International Organization for Standardization (ISO). Environmental Management—Life Cycle Assessment—Requirements and Guidelines; ISO 14044; ISO: Geneva, Switzerland, 2006. [Google Scholar]
- European Committee for Standardization (CEN). Sustainability of Construction Works—Assessment of Environmental Performance of Buildings—Calculation Method; EN 15978; CEN: Brussels, Belgium, 2011. [Google Scholar]
- Vilches, A.; Garcia-Martinez, A.; Sanchez-Montañes, B. Life cycle assessment (LCA) of building refurbishment: A literature review. Energy Build. 2017, 135, 286–301. [Google Scholar] [CrossRef]
- Dong, B.; Kennedy, C.; Pressnail, K. Comparing life cycle implications of building retrofit and replacement options. Can. J. Civ. Eng. 2005, 32, 1051–1063. [Google Scholar] [CrossRef]
- Pombo, O.; Rivela, B.; Neila, J. The challenge of sustainable building renovation: Assessment of current criteria and future outlook. J. Clean. Prod. 2016, 123, 88–100. [Google Scholar] [CrossRef]
- Oregi, X.; Hernandez, P.; Hernandez, R. Analysis of life-cycle boundaries for environmental and economic assessment of building energy refurbishment projects. Energy Build. 2017, 136, 12–25. [Google Scholar] [CrossRef]
- International Organization for Standardization (ISO). Environmental Labels and Declaration—Type III Environmental Declarations—Principles and Procedures; ISO 14025; ISO: Geneva, Switzerland, 2006. [Google Scholar]
- Khasreen, M.M.; Banfill, P.F.G.; Menzies, G.F. Life-Cycle Assessment and the Environmental Impact of Buildings: A Review. Sustainability 2009, 1, 674–701. [Google Scholar] [CrossRef]
- Frischknecht, R.; Jungbluth, N.; Althaus, H.-J.; Bauer, C.; Doka, G.; Dones, R.; Hischier, R.; Hellweg, S.; Humbert, S.; Köllner, T.; et al. Implementation of Life Cycle Impact Assessment Methods. Ecoinvent Report No. 3, v. 2.0; Swiss Centre for Life Cycle Inventories: Dübendorf, Switzerland, 2007. [Google Scholar]
- Flanagan, R. Life Cycle Costing: Theory and Practice; BSP Professional Books: Oxford, UK, 1989. [Google Scholar]
- Goh, B.H.; Sun, Y. The development of life-cycle costing for buildings. Build. Res. Inf. 2015, 44, 319–333. [Google Scholar] [CrossRef]
- Amstalden, R.W.; Kost, M.; Nathani, C.; Imboden, D.M. Economic potential of energy-efficient retrofitting in the Swiss residential building sector: The effects of policy instruments and energy price expectations. Energy Policy 2007, 35, 1819–1829. [Google Scholar] [CrossRef]
- Ouyang, J.; Ge, J.; Hokao, K. Economic analysis of energy-saving renovation measures for urban existing residential buildings in China based on thermal simulation and site investigation. Energy Policy 2009, 37, 140–149. [Google Scholar] [CrossRef]
- Islam, H.; Jollands, M.; Setunge, S. Life cycle assessment and life cycle cost implication of residential buildings—A review. Renew. Sustain. Energy Rev. 2015, 42, 129–140. [Google Scholar] [CrossRef]
- International Organization for Standardization (ISO). Buildings and Constructed Assets—Service-Life Planning—Part 5: Life-Cycle Costing; ISO 15686–5; ISO: Geneva, Switzerland, 2008. [Google Scholar]
- Dodoo, A.; Gustavsson, L.; Sathre, R. Life cycle primary energy implication of retrofitting a wood-framed apartment building to passive house standard. Resour. Conserv. Recycl. 2010, 54, 1152–1160. [Google Scholar] [CrossRef]
- Ouyang, J.; Wang, C.; Li, H.; Hokao, K. A methodology for energy-efficient renovation of existing residential buildings in China and case study. Energy Build. 2011, 43, 2203–2210. [Google Scholar] [CrossRef]
- Bin, G.; Parker, P. Measuring buildings for sustainability: Comparing the initial and retrofit ecological footprint of a century home—The REEP House. Appl. Energy 2012, 93, 24–32. [Google Scholar] [CrossRef]
- Desogus, G.; Di Pilla, L.; Mura, S.; Pisano, G.L.; Ricciu, R. Economic efficiency of social housing thermal upgrade in Mediterranean climate. Energy Build. 2013, 57, 354–360. [Google Scholar] [CrossRef]
- Passer, A.; Ouellet-Plamondon, C.; Kenneally, P.; John, V.; Habert, G. The impact of future scenarios on building refurbishment strategies towards plus energy buildings. Energy Build. 2016, 124, 153–163. [Google Scholar] [CrossRef]
- Nemry, F.; Uihlein, A.; Colodel, C.M.; Wetzel, C.; Braune, A.; Wittstock, B.; Hasan, I.; Kreißig, J.; Gallon, N.; Niemeier, S.; et al. Options to reduce the environmental impacts of residential buildings in the European Union—Potential and costs. Energy Build. 2010, 42, 976–984. [Google Scholar] [CrossRef]
- Ostermeyer, Y.; Wallbaum, H.; Reuter, F. Multidimensional Pareto optimization as an approach for site-specific building refurbishment solutions applicable for life cycle sustainability assessment. Int. J. Life Cycle Assess. 2013, 18, 1762–1779. [Google Scholar] [CrossRef]
- Cetiner, I.; Edis, E. An environmental and economic sustainability assessment method for the retrofitting of residential buildings. Energy Build. 2014, 74, 132–140. [Google Scholar] [CrossRef]
- Pombo, O.; Allacker, K.; Rivela, B.; Neila, J. Sustainability assessment of energy saving measures: A multi-criteria approach for residential buildings retrofitting—A case study of the Spanish housing stock. Energy Build. 2016, 116, 384–394. [Google Scholar] [CrossRef]
- The Norwegian Building Authority (DIBK). Chapter 14: Energy. In Guidance on Technical Requirements for Construction Works (TEK 10); DIBK: Oslo, Norway, 2010. [Google Scholar]
- Dixit, M.K.; Culp, C.H.; Fernández-Solís, J.L. System boundary for embodied energy in buildings: A conceptual model for definition. Renew. Sustain. Energy Rev. 2013, 21, 153–164. [Google Scholar] [CrossRef]
- EQUA Simulation AB. IDA Indoor Climate and Energy (IDA ICE), Version 4.7; EQUA Simulation AB: Stockholm, Sweden, 2016. [Google Scholar]
- Standard Norge. Calculation of Energy Performance of Buildings—Method and Data; NS 3031; Standard Norge: Oslo, Norway, 2014. [Google Scholar]
- Standard Norge. Criteria for Passive Houses and Low Energy Buildings—Residential Buildings; NS 3700; Standard Norge: Oslo, Norway, 2013. [Google Scholar]
- American Society of Heating, Refrigerating and Air-Conditioning Engineers (ASHRAE). International Weather Files For Energy Calculations 2.0 (IWEC2); ASHRAE: Atlanta, GA, USA, 2012. [Google Scholar]
- Joint Research Centre. Photovoltaic Geographical Information System (PVGIS). Geographical Assessment of Solar Resource and Performance of Photovoltaic Technology; Joint Research Centre: Brussels, Belgium, 2001. [Google Scholar]
- Beckam, W.A.; Klein, S.A.; Duffie, J.A. Solar Heating Design, by the F-Chart Method; Wiley: New York, NY, USA, 1977. [Google Scholar]
- European Committee for Standardization (CEN). Energy Performance of Buildings—Economic Evaluation Procedure for Energy Systems in Buildings; EN 15459; CEN: Brussels, Belgium, 2007. [Google Scholar]
- SINTEF Byggforsk. Intervals for Maintenance and Replacement of Building Parts. SINTEF Byggforsk, 2010. Available online: https://www.byggforsk.no/dokument/3312/intervaller_for_vedlikehold_og_utskifting_av_bygningsdeler (accessed on 30 March 2017).
- Wernet, G.; Bauer, C.; Steubing, B.; Reinhard, J.; Moreno-Ruiz, E.; Weidema, B. The ecoinvent database version 3 (part I): Overview and methodology. Int. J. Life Cycle Assess. 2016, 21, 1218–1230. [Google Scholar] [CrossRef]
- PRé Sustainability. SimaPro Classroom, Version 8.1.1; PRé Sustainability: Amersfoort, The Netherlands, 2016. [Google Scholar]
- Itten, R.; Frischknecht, R.; Stucki, M. Life Cycle Inventories of Electricity Mixes and Grid; Paul Scherrer Institut (PSI): Villigen, Switzerland, 2014. [Google Scholar]
- Norconsult Informasjonssystemer AS and Bygganalyse AS. Norsk Prisbok; Norconsult Informasjonssystemer AS and Bygganalyse AS: Sandvika, Norway, 2016. [Google Scholar]
- Statistisk Sentralbyrå, Electricity Prices. 2016. Available online: https://www.ssb.no/energi-og-industri/statistikker/elkraftpris (accessed on 30 March 2017).
- Enova SF, Clean Burning Wood Stove. 2017. Available online: https://www.enova.no/privat/alle-energitiltak/biovarme/rentbrennende-vedovn/ (accessed on 30 March 2017).
- Standard Norge. Life Cycle Costs for Construction Works—Principles and Classification; NS 3454; Standard Norge: Oslo, Norway, 2013. [Google Scholar]
- Dahlstrøm, O.; Sørnes, K.; Eriksen, S.T.; Hertwich, E.G. Life cycle assessment of a single-family residence built to either conventional- or passive house standard. Energy Build. 2012, 54, 470–479. [Google Scholar] [CrossRef]
- Blengini, G.A.; Di Carlo, T. The changing role of life cycle phases, subsystems and materials in the LCA of low energy buildings. Energy Build. 2010, 42, 869–880. [Google Scholar] [CrossRef]
- Risholt, B.; Time, B.; Hestnes, A.G. Sustainability assessment of nearly zero energy renovation of dwellings based on energy, economy and home quality indicators. Energy Build. 2013, 60, 217–224. [Google Scholar] [CrossRef]
- Moschetti, R.; Mazzarella, L.; Nord, N. An overall methodology to define reference values for building sustainability parameters. Energy Build. 2015, 88, 413–427. [Google Scholar] [CrossRef]


| Description | Value |
|---|---|
| Total number of floors (-) | 3 |
| Net floor area (m2) | 159.0 |
| Gross internal floor area (m2) | 176.7 |
| Gross external floor area (m2) | 211.8 |
| Gross volume (m3) | 563.50 |
| External wall area (m2) | 386.54 |
| Window area (m2) | 29 |
| Average thermal bridge (W/m2/K) | 0.03 |
| Air leakage, 50 Pa (1/h) | 1 |
| Description | S1 | S2 | S3 | S4 | S5 | S6 | S7 |
|---|---|---|---|---|---|---|---|
| Electric space heating (kWh/m2) | 27.0 | 28.3 | 16.9 | 30.3 | 28.3 | 28.3 | 16.9 |
| Wood fuel (kWh/m2) | 6.6 | - | - | 13.3 | - | - | - |
| Heating & ventilation auxiliaries (kWh/m2) | 8.2 | 8.2 | 8.3 | 8.2 | 8.2 | 8.2 | 8.2 |
| Domestic hot water (kWh/m2) | 31.4 | 31.4 | 31.4 | 31.4 | 31.4 | 31.4 | 31.4 |
| Electric appliances (kWh/m2) | 17.5 | 17.5 | 17.5 | 17.5 | 17.5 | 17.5 | 17.5 |
| Lighting (kWh/m2) | 11.4 | 11.4 | 11.4 | 11.4 | 11.4 | 11.4 | 11.4 |
| PV system (kWh/m2) | - | - | - | - | −22.5 | −22.5 | −22.5 |
| Solar thermal system (kWh/m2) | - | - | - | - | - | −21.1 | −21.1 |
| Total annual delivered energy (kWh/m2) | 95.5 | 96.8 | 85.5 | 98.8 | 74.3 | 53.1 | 41.8 |
© 2017 by the authors. Licensee MDPI, Basel, Switzerland. This article is an open access article distributed under the terms and conditions of the Creative Commons Attribution (CC BY) license (http://creativecommons.org/licenses/by/4.0/).
Share and Cite
Moschetti, R.; Brattebø, H. Combining Life Cycle Environmental and Economic Assessments in Building Energy Renovation Projects. Energies 2017, 10, 1851. https://doi.org/10.3390/en10111851
Moschetti R, Brattebø H. Combining Life Cycle Environmental and Economic Assessments in Building Energy Renovation Projects. Energies. 2017; 10(11):1851. https://doi.org/10.3390/en10111851
Chicago/Turabian StyleMoschetti, Roberta, and Helge Brattebø. 2017. "Combining Life Cycle Environmental and Economic Assessments in Building Energy Renovation Projects" Energies 10, no. 11: 1851. https://doi.org/10.3390/en10111851
APA StyleMoschetti, R., & Brattebø, H. (2017). Combining Life Cycle Environmental and Economic Assessments in Building Energy Renovation Projects. Energies, 10(11), 1851. https://doi.org/10.3390/en10111851