1. Introduction
Dynamic heat transfer performance of building envelopes has been extensively studied, being of fundamental importance in building thermal behavior. Different authors have reached very different conclusions in relation to the research methods, climatic conditions, and key performance indicators [
1]. Yet, the only available method to evaluate the attitude of a building element to reduce the effect of the heat wave that flows through it is applicable only to homogeneous layers with sinusoidal temperature solicitation, as reported in References [
2,
3]. Thus, it is not suitable for the evaluation of blocks in which two-dimensional (2-D) and three-dimensional (3-D) effects on heat transfer are not negligible. Field studies have pointed out relevant differences between measured and simulated results, even in walls made of full blocks, probably due to mortar [
4].
As far as homogeneous multilayered walls are considered, studies by Asan and Sancaktar [
5], Asan [
6], and Lakatos [
7] have shown that wall thickness is the most relevant parameter for the time lag of heat wave flux, though wall composition is also important. These results seem to be congruent with the common assumption that a high mass per unit front area of a wall leads to a high time lag. This is reflected in the terms used to describe dynamic heat transfer behavior such as thermal mass, and heavy/light wall [
1].
Some preliminary studies on non-steady state heat transfer in hollow bricks have provided conflicting results. Some papers are concerned with the effective heat capacity of hollow blocks. Lacarrière et al. [
8] found that the effective heat capacity per unit volume of a brick is of the same order of that of the solid part of the brick in an experimental study on the response of a single vertically perforated brick subjected to a step temperature change. On the contrary, Sala et al. [
9], in an experimental study on the response of a three-layered wall made of a Expanded Polystyrene (EPS) insulating layer, a hollow brick layer, and a gypsum layer, subject to a triangular temperature-pulse, found that the effective heat capacity per unit volume of the brick was nearly half of that of the clay which the solid part of the brick consisted of. Moreover, Zhang and Wachenfeldt [
10] calculated that the heat capacity per unit volume of the equivalent homogeneous layer was about two times that of the solid part of a slab with a cavity area fraction about 50%, through numerical simulations. Although some of these studies did not provide time lag response to temperature solicitation, data from Reference [
8] implied an 80% reduction of time lag due to a 50% reduction in front mass.
Other papers provide heat flux response graphs from numerical simulations or experiments that allow to observe the time lag. Martín et al. [
11] and the cited paper from Sala et al. [
9] provided experimental results of triangular pulse temperature solicitation on multilayer walls containing hollow bricks. In the former, the time lag is 4.4 h with a 180-mm thick brick layer, while the latter presents a time lag less than one hour for a 40-mm thick brick layer. Zhang et al. [
12] experimentally studied heat transfer through a 190-mm thick layer of lightweight aggregate concrete with vertical cavities of two different sizes. They have found a 4.4 h time lag with a 24-h period of sinusoidal solicitation that is similar to that found in Reference [
11], with similar thickness but higher front mass and different solicitation. Moreover, Arendt et al. [
13] numerically studied the influence of cavity size on time lag and decrement factor in a 300-mm thick clay brick. Their results show that there is a maximum in time lag and a minimum in decrement factor at an intermediate cavity concentration, which is at an intermediate front mass. Cianfrini et al. [
14] showed that time lag is not straightforwardly dependent on front mass in insulated blocks, while it is so in some conventional bricks [
15]. Thus, the dynamic heat transfer performance of a block may not be simply inferred from material properties and geometry.
Besides, the heat transfer rate through outer walls may be reduced by filling bricks cavities with insulating materials. This has been confirmed in steady state heat transfer by some experimental and numerical studies, such as those of Zukowski and Haese [
16], Tang et al. [
17], Pavlík et al. [
18], and Bassiouny et al. [
19].
In this framework, the aim of the present study is to point out which are the relevant parameters for the thermal inertia of insulated blocks. A two-dimensional numerical study was performed under the assumption that the investigated block is subjected to a triangular temperature pulse on one side while the other is kept at a constant temperature. Standardized B9 block was chosen among those reported in EN1745:2002 [
20], as a simplification of the integration domain is possible. Moreover, as it has a high cavity fraction, the insulating material properties are predicted to be more relevant on overall behavior. Different insulating materials and clay properties are considered.
2. Mathematical Formulation
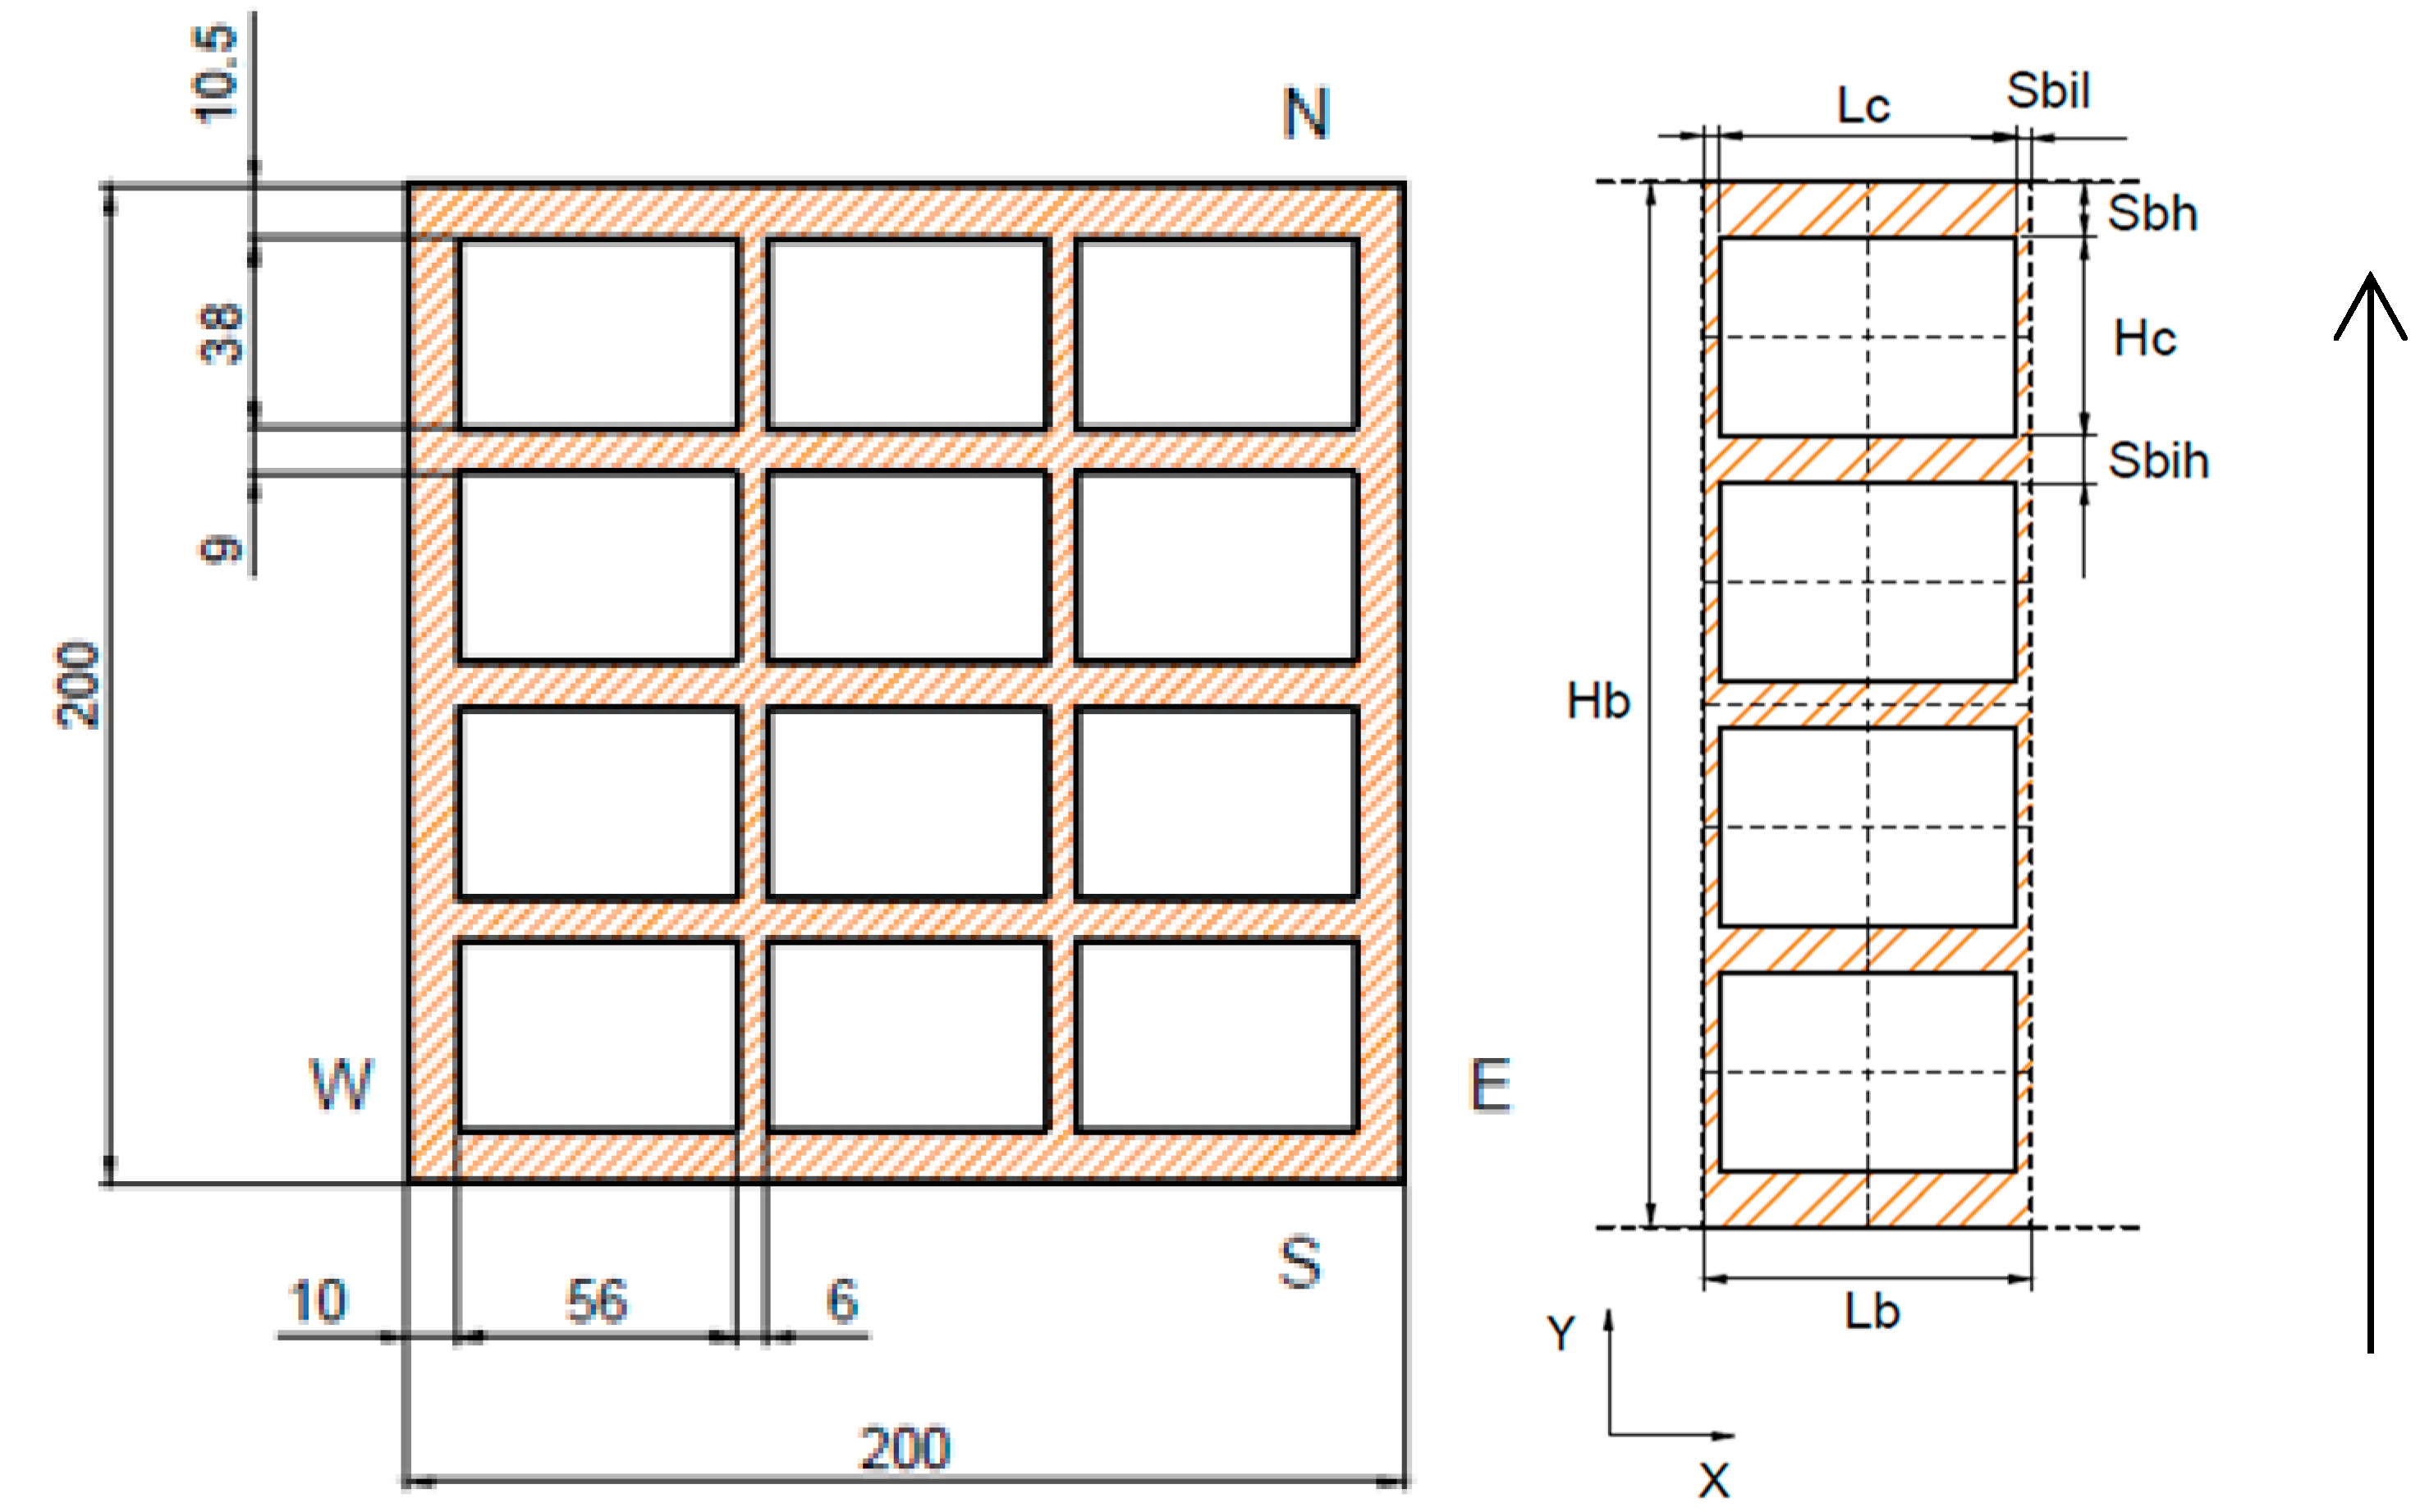
The reference masonry unit is depicted in
Figure 1. The brick is made of clay, while the cavities are considered to be filled with three different insulating materials or the same clay. The simulation domain is limited to the central line of cavities, imposing adiabatic boundary conditions along the midlines of the ribs.
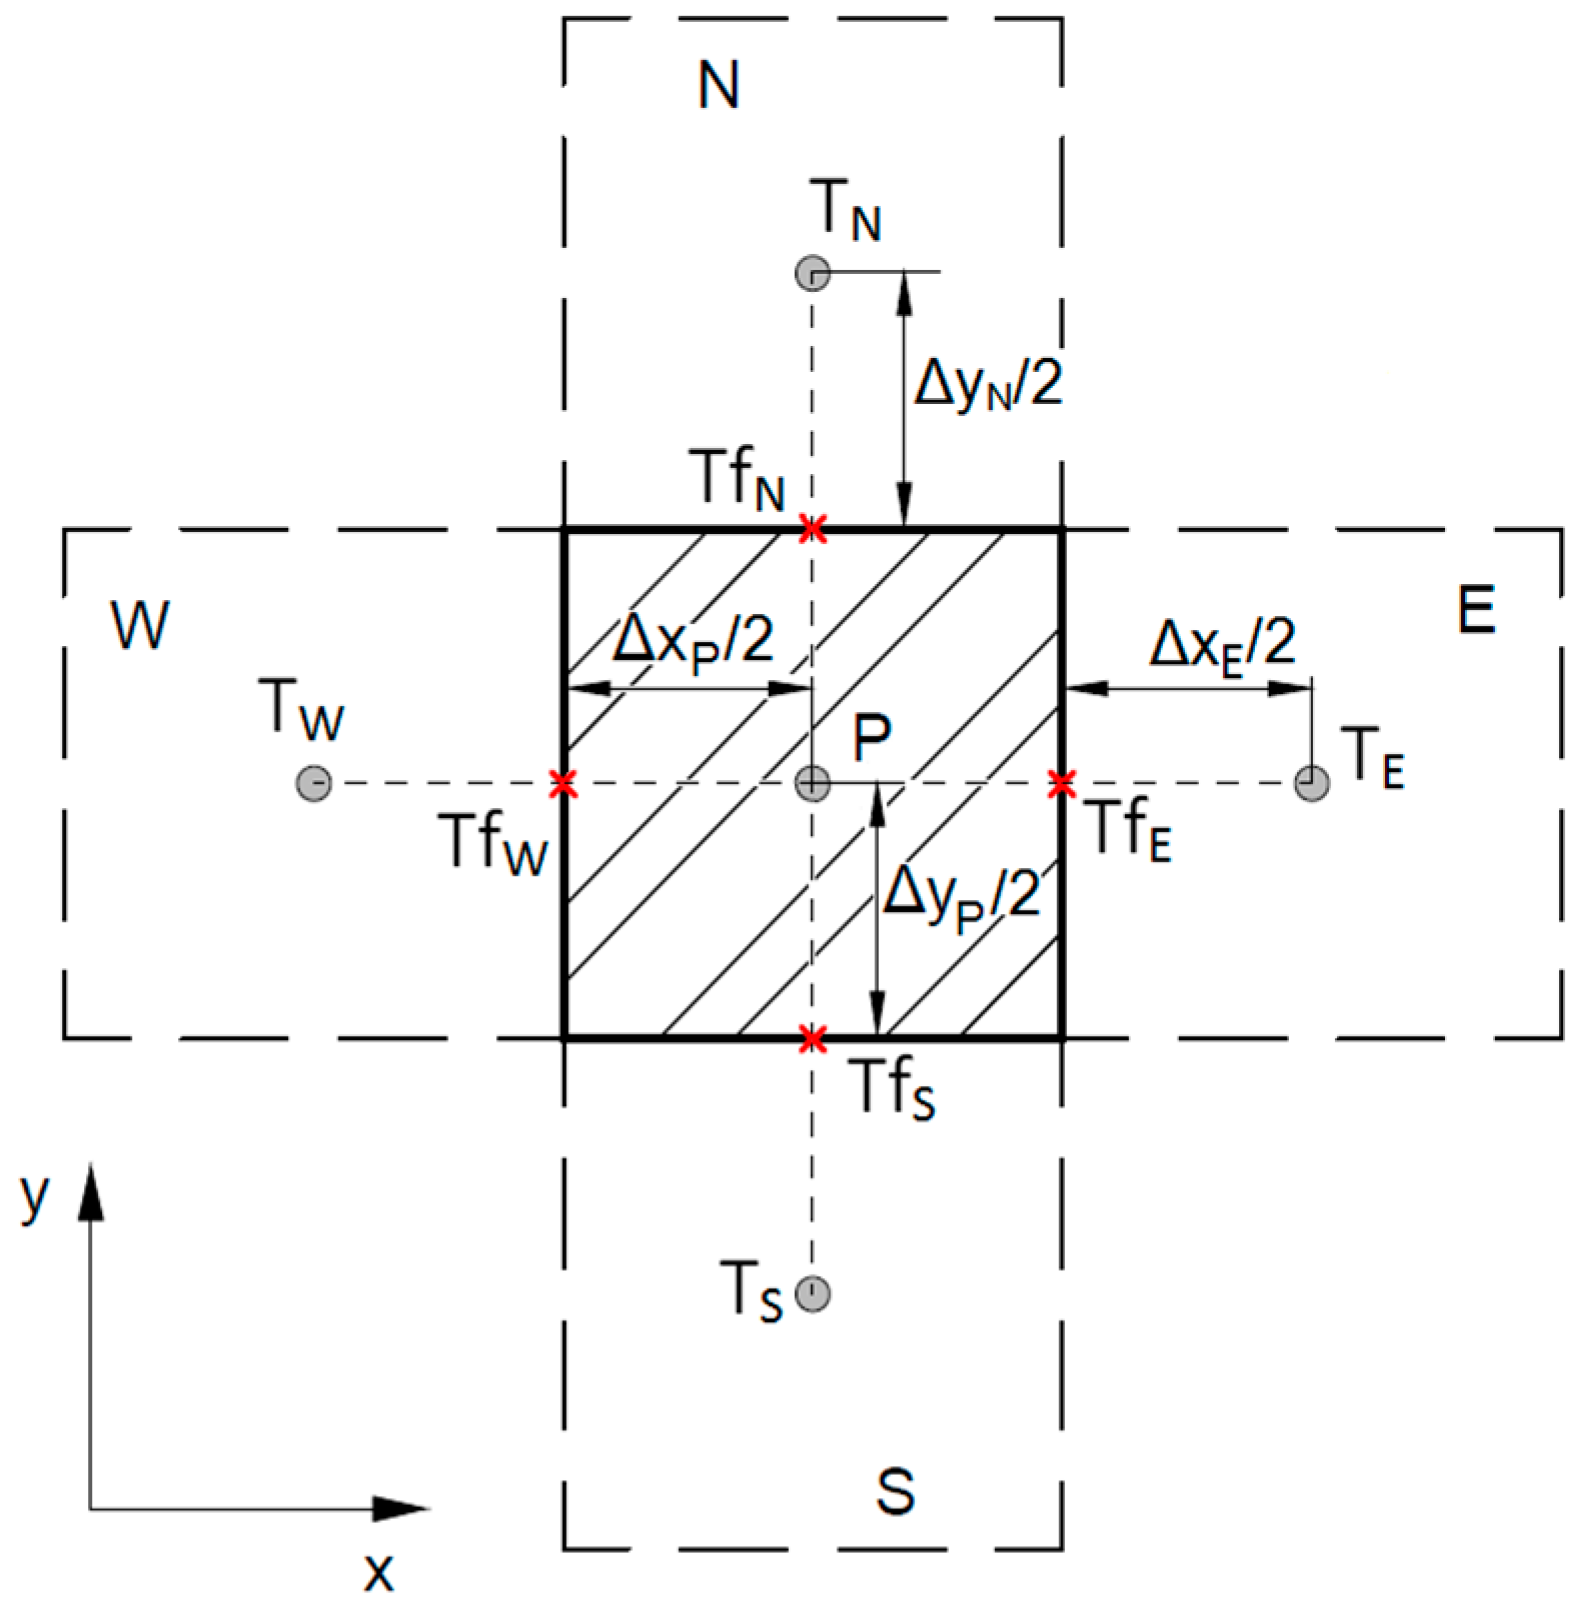
Triangular pulse excitation was used to check the dynamic heat transfer characteristics, applied to face S, as proposed in Reference [
9]. This kind of solicitation allows us to evaluate the time lag as the delay between the peak of the temperature pulse and the peak of heat transfer on the other side, as well as the decrement factor, which is the ratio of the actual peak heat transfer to that with constant temperature equal to the peak value, as defined in Reference [
4], as depicted in
Figure 2. A 10-K high, 2-h wide pulse was chosen. As stated above, adiabatic conditions were assumed along domain boundaries defined by the dashed lines, while the face N, which was not subject to the pulse, was kept at constant uniform temperature.
The thermal field equation is described by a Cartesian two-dimensional Fourier’s equation for conducting fields:
where
k stands for thermal conductivity,
T for temperature,
cp for isobaric specific heat,
ρ for density, and
τ for time.
On surface N, a 20 °C uniform and constant temperature was imposed. On surface S, a uniform triangular pulse temperature was imposed:
- -
increasing from 20 °C to 30 °C with a 2.778 × 10⁻³ K/s (10 K/h) temperature increase rate in the period from time 0 s to time 3600 s;
- -
decreasing from 30 °C to 20°C with a −2.778 × 10⁻³ K/s (−10 K/h) temperature decrease rate in the period from time 3600 s to time 7200 s;
- -
constant at 20 °C for any time afterwards.
At the cavity boundary, heat flux conservation is given by:
where, besides the symbols used in Equation (1),
n stands for direction perpendicular to boundary, either
x or
y, and subscripts
a and
b stand for the materials on the sides of the boundary.
A 20 °C uniform temperature in whole integration domain was used as an initial condition.
3. Computational Procedure
The governing equation was solved through a control-volume formulation of the finite-difference method, along with boundary and initial conditions stated above. A rectangular mesh was used, as sketched in
Figure 3. A first-order backward scheme was used for time stepping. At inner nodes, the discretization of Equation (1) becomes:
Equation (3) is adapted in boundary elements, imposing temperature values on TfN and TfS, or adiabatic boundary conditions, i.e., TfE = TP and TfW = TP, whichever is relevant.
The discretized equations lead to a system of linear equations. The iterative Jacobi algorithm [
21] was implemented to solve the system.
The average heat flux through face N (of length Lb) was calculated by integration, Equation (4). The temperature derivative was calculated by three-point backwards derivative. Integration was done by Trapezoid rule (first degree Newton-Cotes formula).
The code was checked against reference simple analytic solutions found in Reference [
2]. Steady state 2-D fields were compared for a rectangular homogenous slab with adiabatic boundary conditions on three sides, and sinusoidal temperature on the fourth. Analytic solution of temperature field is given by Equation (5). Comparison of numerical solutions for different slab and mesh sizes are provided in
Table 1, with very good agreement.
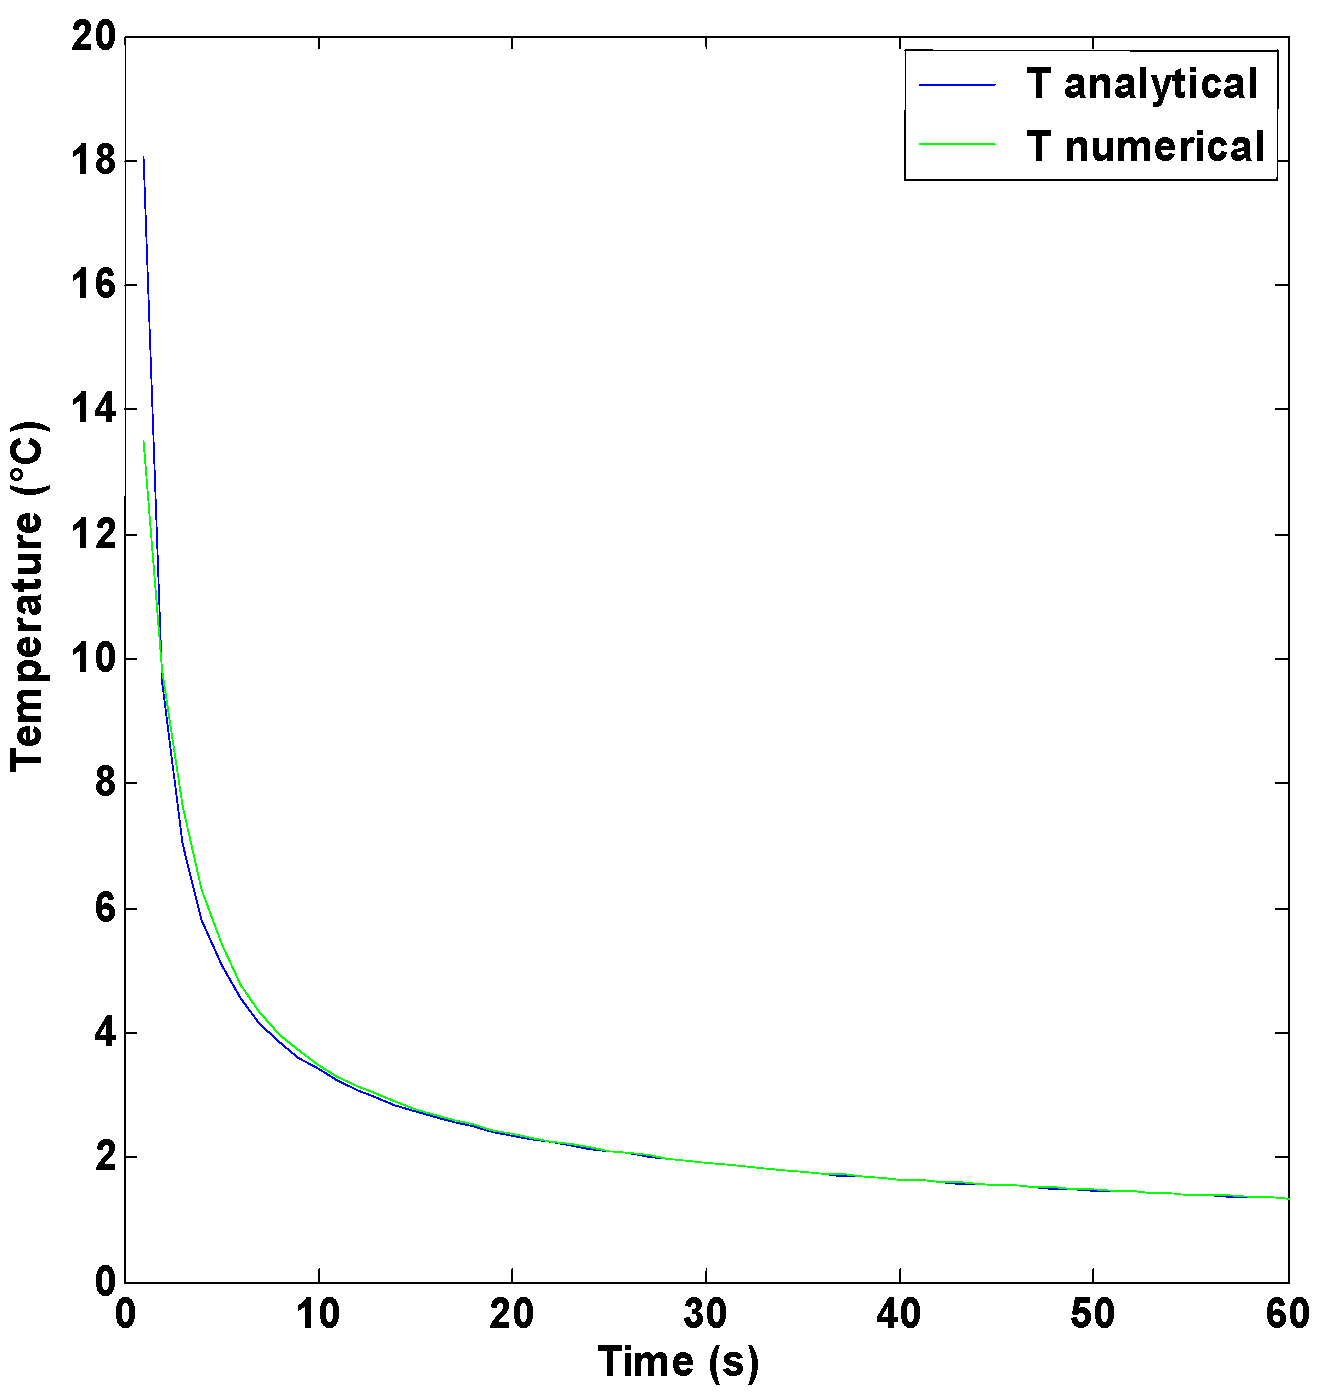
Unsteady temperature fields were compared for a rectangular homogenous slab with adiabatic boundary condition on three sides, and step temperature change on the fourth, from 20 °C to 0 °C. Analytic solution of temperature field is given by Equation (6). Comparison between analytical and numerical solutions is shown in
Figure 4. Relative temperature difference is lower than 4 × 10
−4 for the 24-h long simulation, apart from the initial time steps.
Moreover, a self-consistency test was conducted to determine the optimal mesh-size, time step, and variance limit for iterations. A 5-s time step and 10−4 variance limit were found to create a good balance between calculation time and solution accuracy with mesh sizes between 21 × 103 and 44 × 210, depending on the cavity number and geometry.
4. Results
Numerical simulations were performed for each kind of insulation filler, as well as for full blocks. Masonry material includes clay of three different densities. Insulating filling materials that are considered in present paper are Expanded Perlite, Mineral Wool, and Expanded Polystyrene. Properties of materials are given in
Table 2. Properties of clay are provided in Reference [
20] according to density. Properties of insulating materials come from datasheets available on manufacturers’ websites.
Clay of maximum density (heavy weight clay (HWC)) shows a thermal conductivity circa three times higher than the lower density clay (light weight clay (LWC)). The thermal diffusivity of HWC is only 30% higher than that of LWC, as density compensates for thermal conductivity. All types of insulating materials have lower thermal conductivity and specific heat per unit volume than clay. On the contrary, the thermal diffusivity of insulating materials in comparison to clay is slightly lower for Mineral Wool, but almost double for Expanded Polystyrene and 10 times higher for Expanded Perlite. Notice that as all materials share similar specific heat, their heat capacity per unit volume is proportional to density.
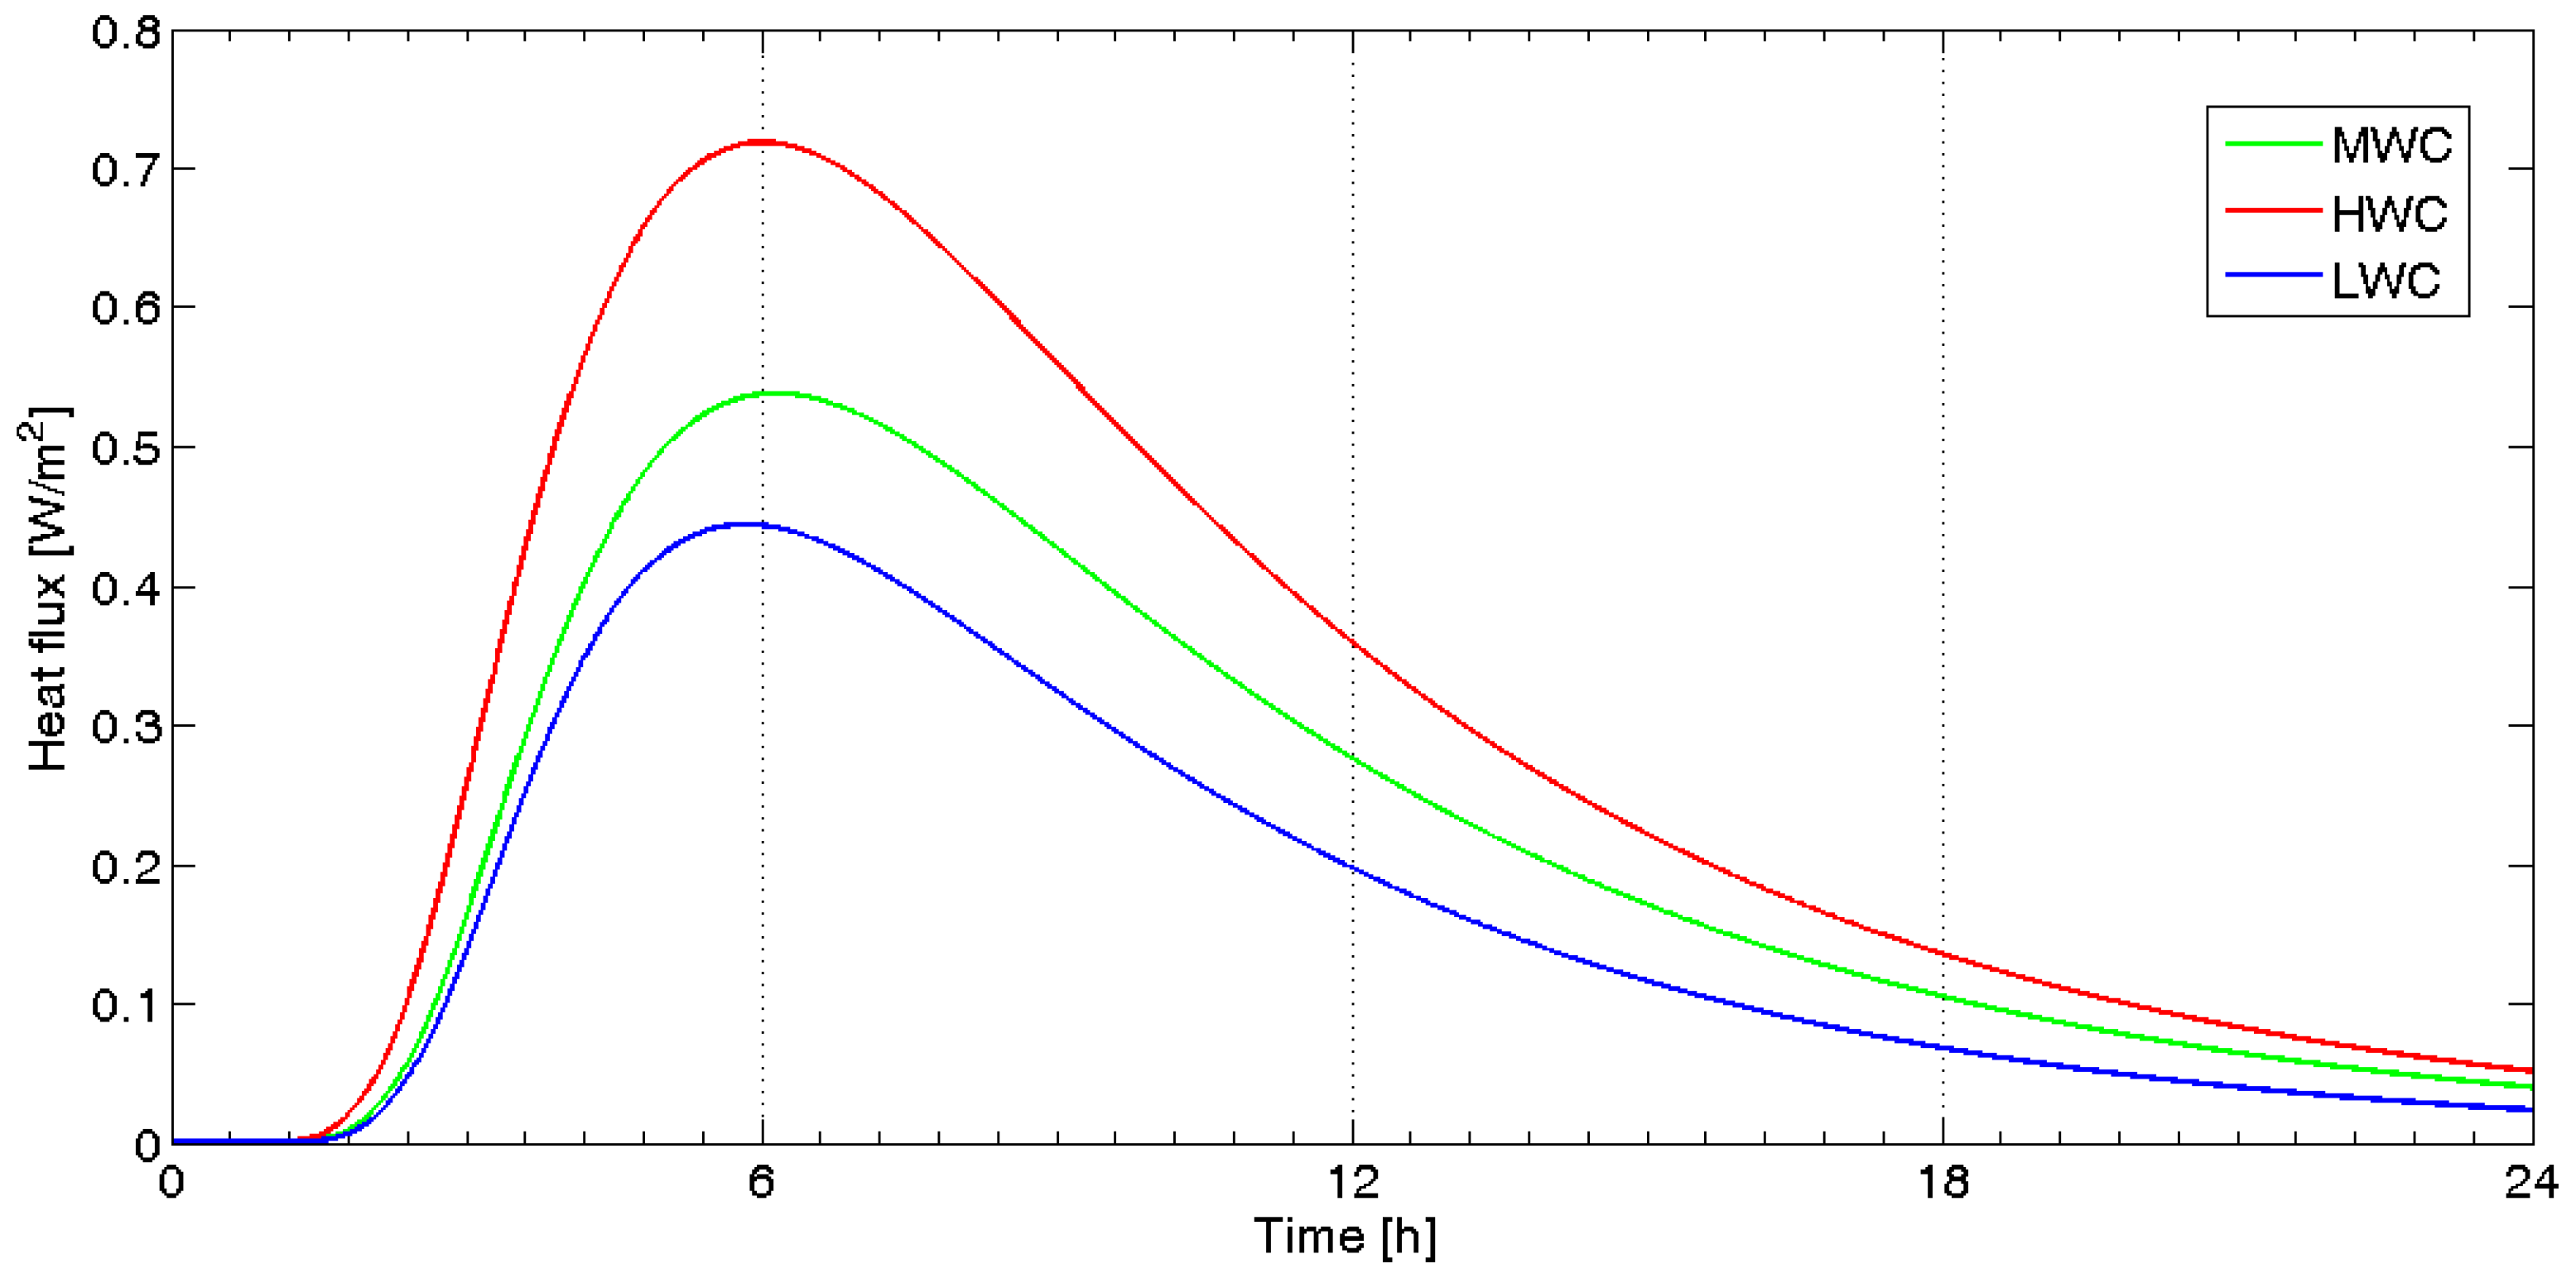
For each simulation, heat transfer rate on face N is calculated from Equation (4). Time evolution of heat flux for block filled with Mineral Wool is depicted in
Figure 5, with different clay density. All seem to share the same time lag despite having very different front masses.
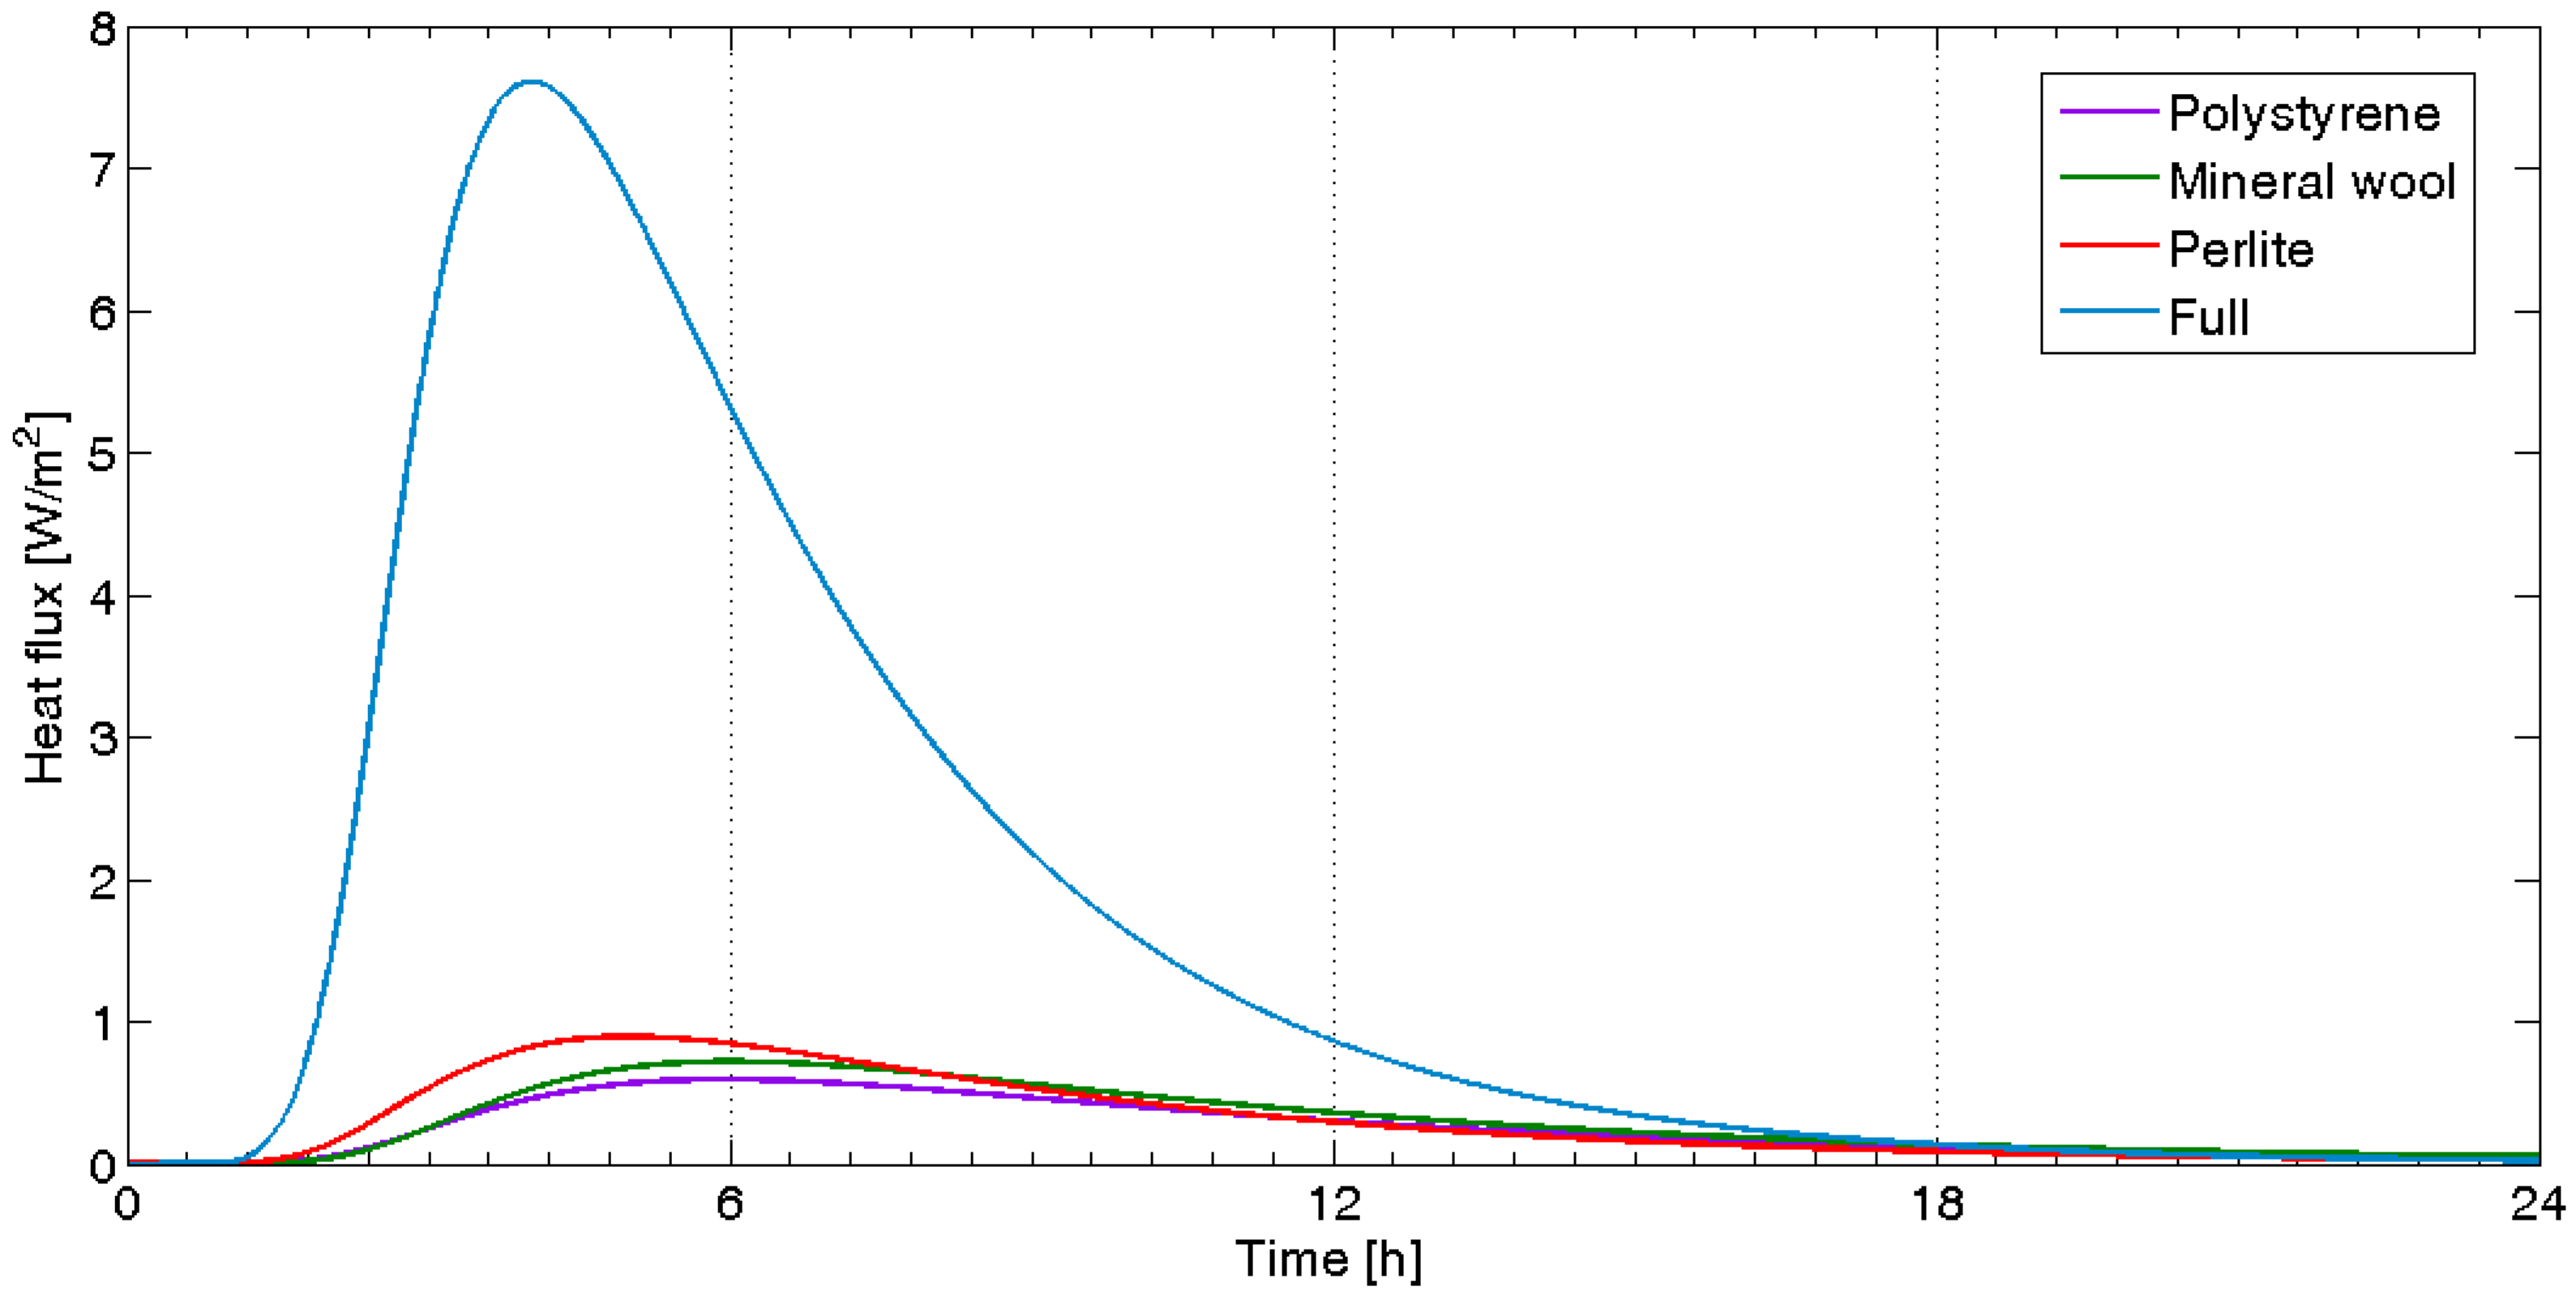
Comparing time evolution of heat flux for blocks made of the same clay (HWC) but with different infill materials, larger differences in time lag were found, as shown in
Figure 6. What is more evident is that although the full block has the highest front mass, it shows the least time lag.
Thus, for each configuration, the time lag (Δτ) was calculated as the delay between the temperature peak on face S and the heat flux peak on face N, as well as damping degree, which is the reciprocal of the decrement factor.
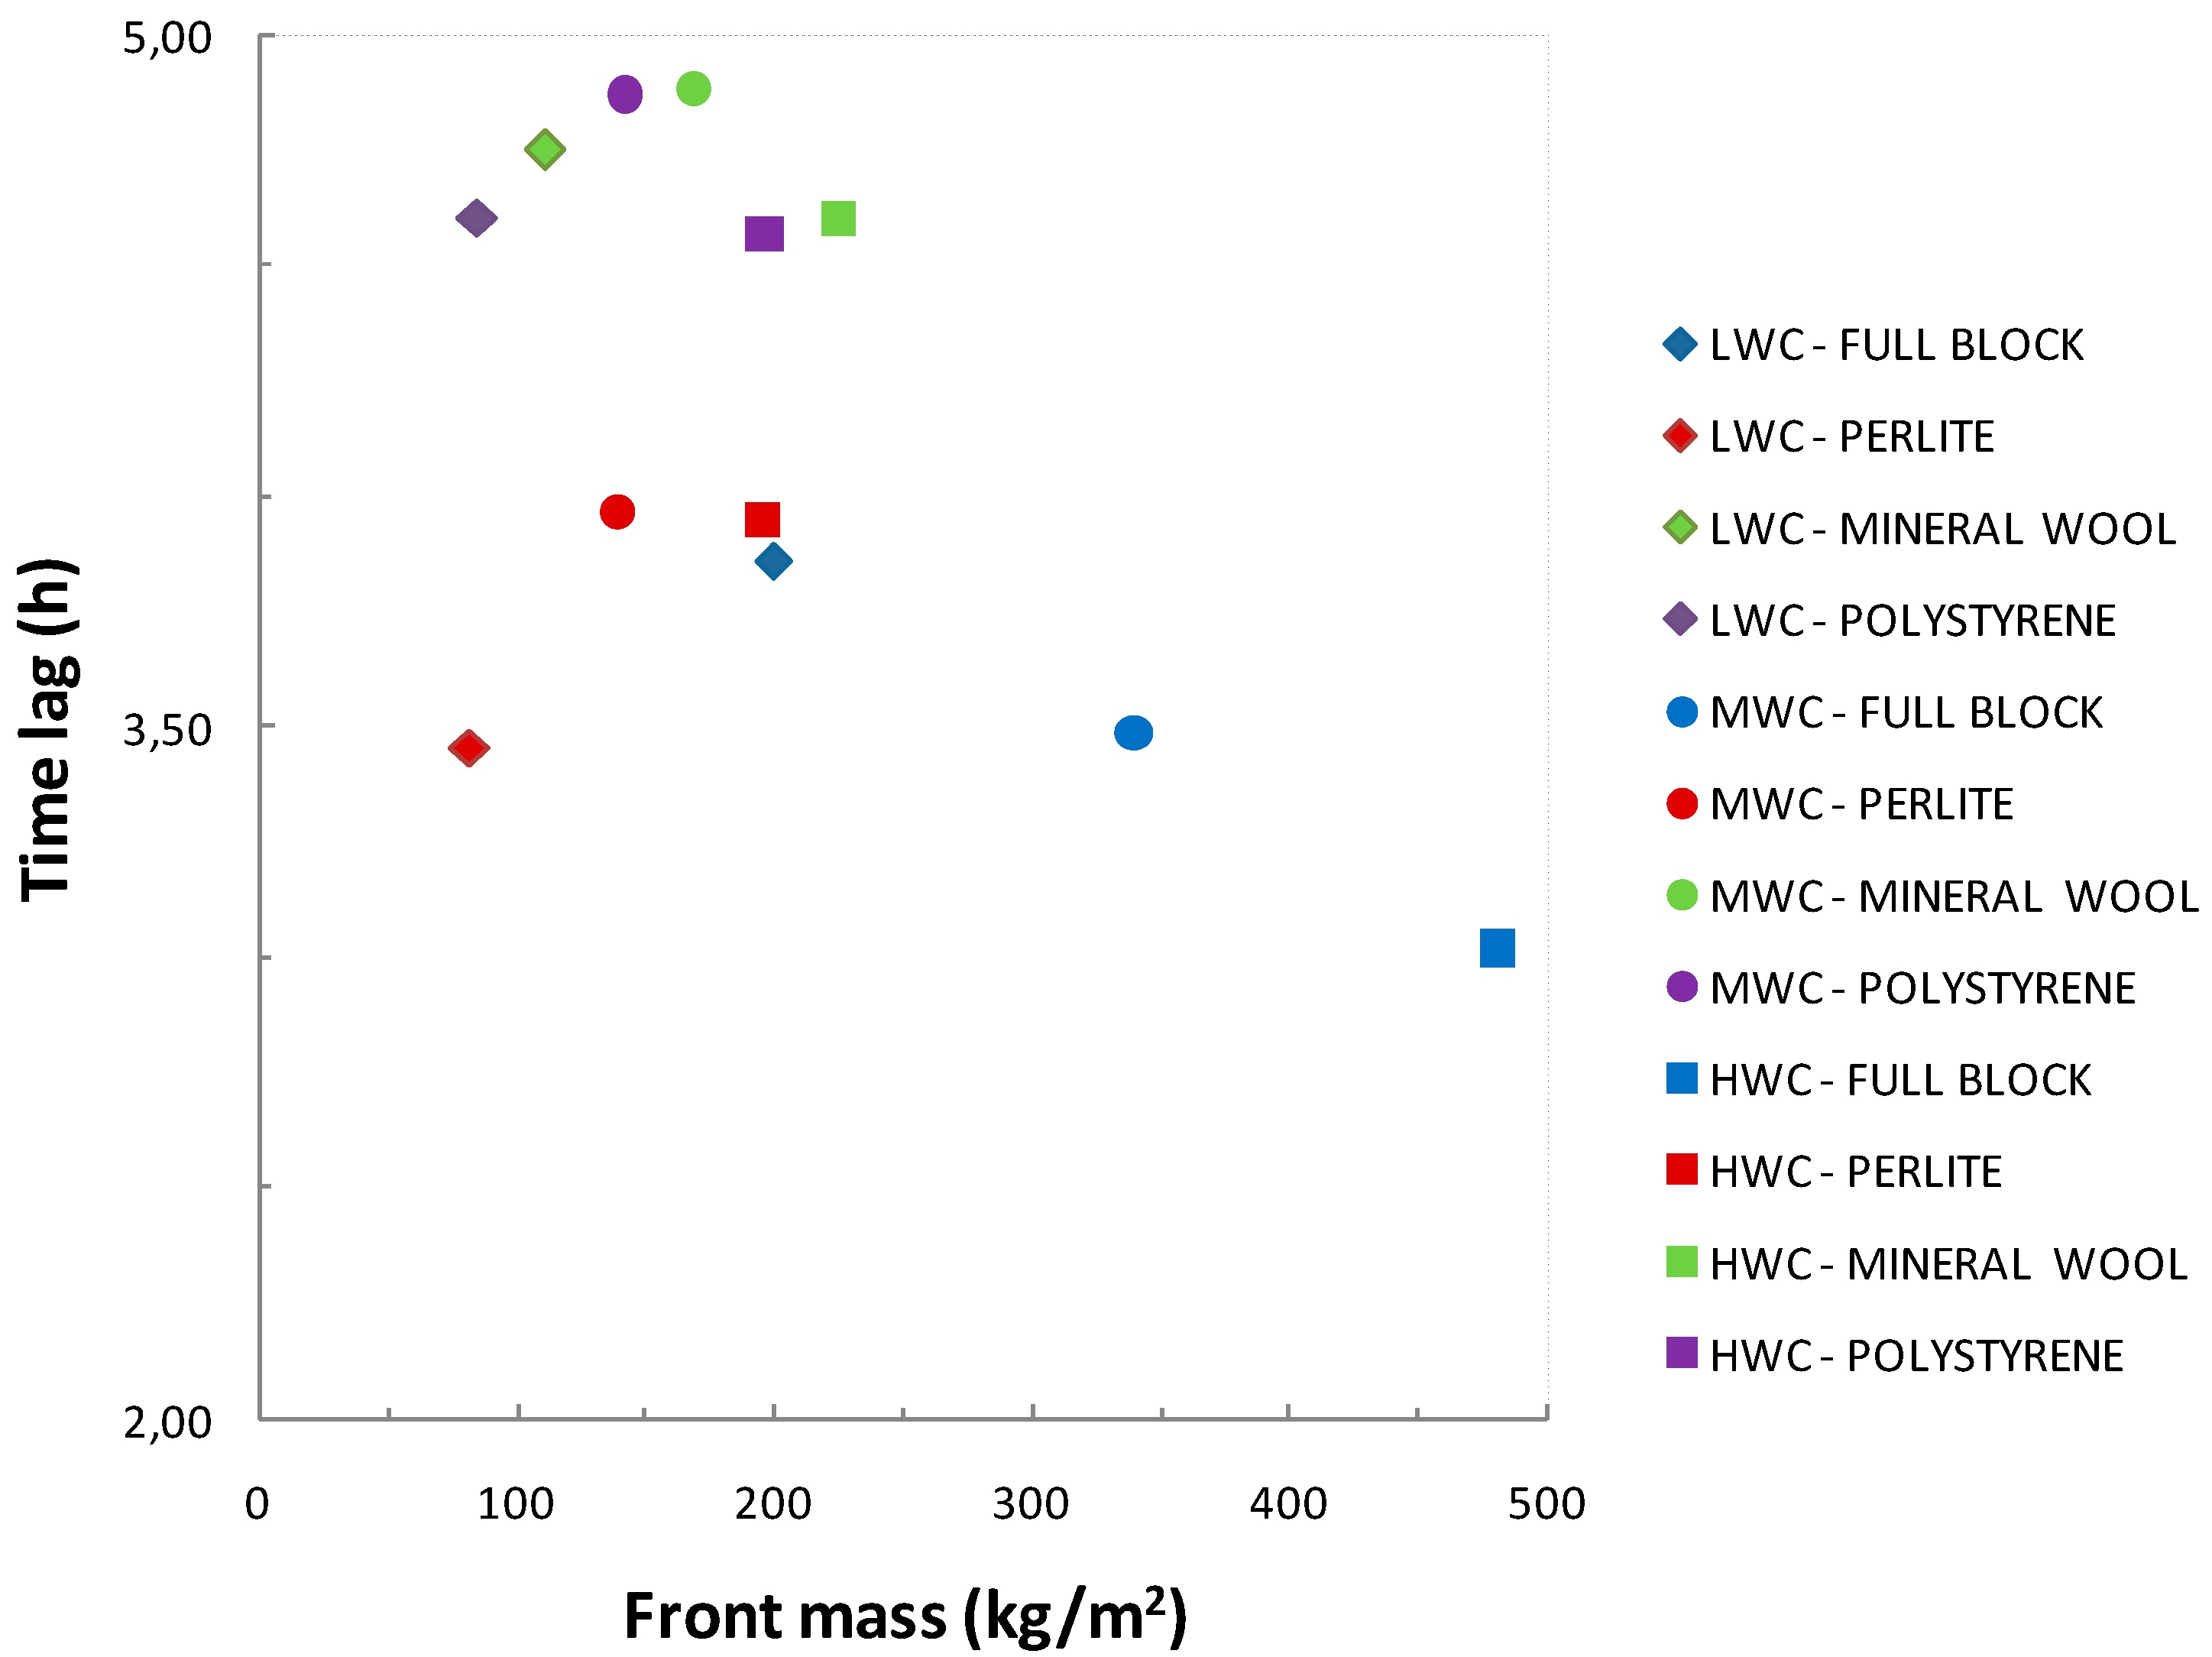
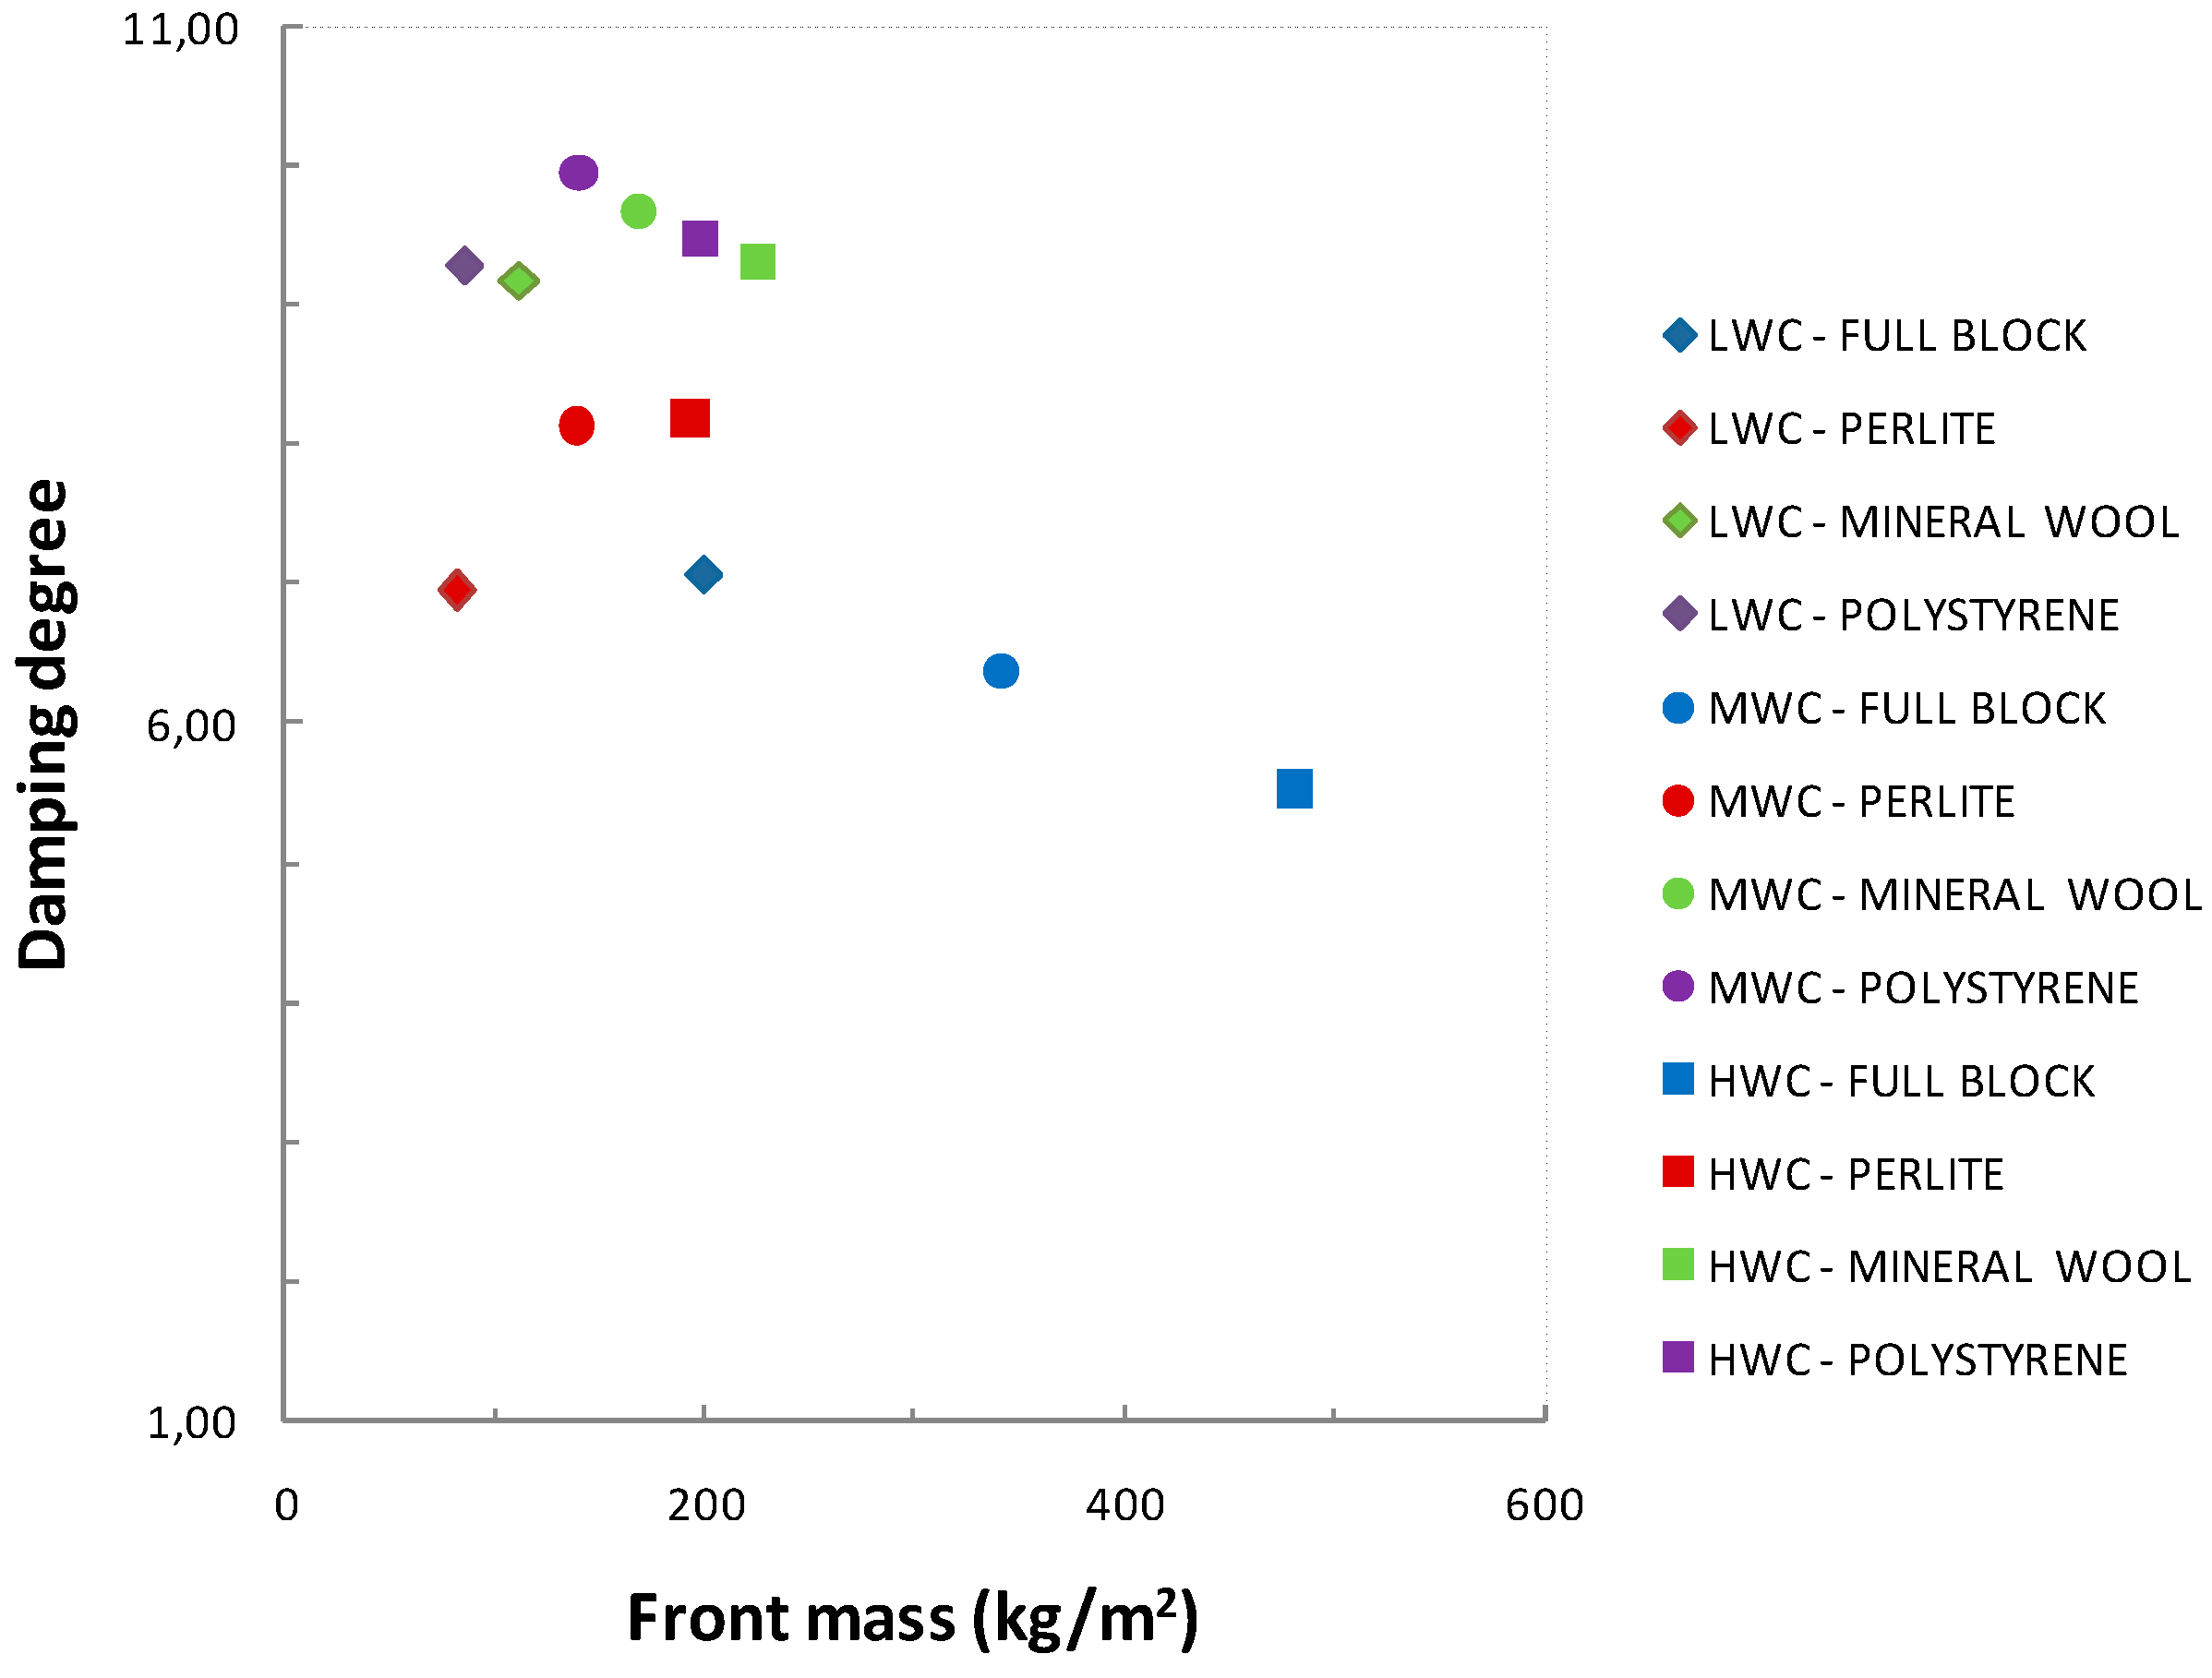
Time lags and damping degrees for different combinations of clay density and insulating material as well as full blocks vs. front masses of the block are plotted in
Figure 7 and
Figure 8, respectively. It is evident that front mass is not directly linked to time lag nor to decrement factor.
5. Discussion
Results show that time lag is far from being linearly correlated to front mass. The highest time lag values were found for Mineral Wool insulated blocks. On the contrary, Expanded Perlite insulation, which has a much higher thermal diffusivity, showed lower time lags than other insulating materials.
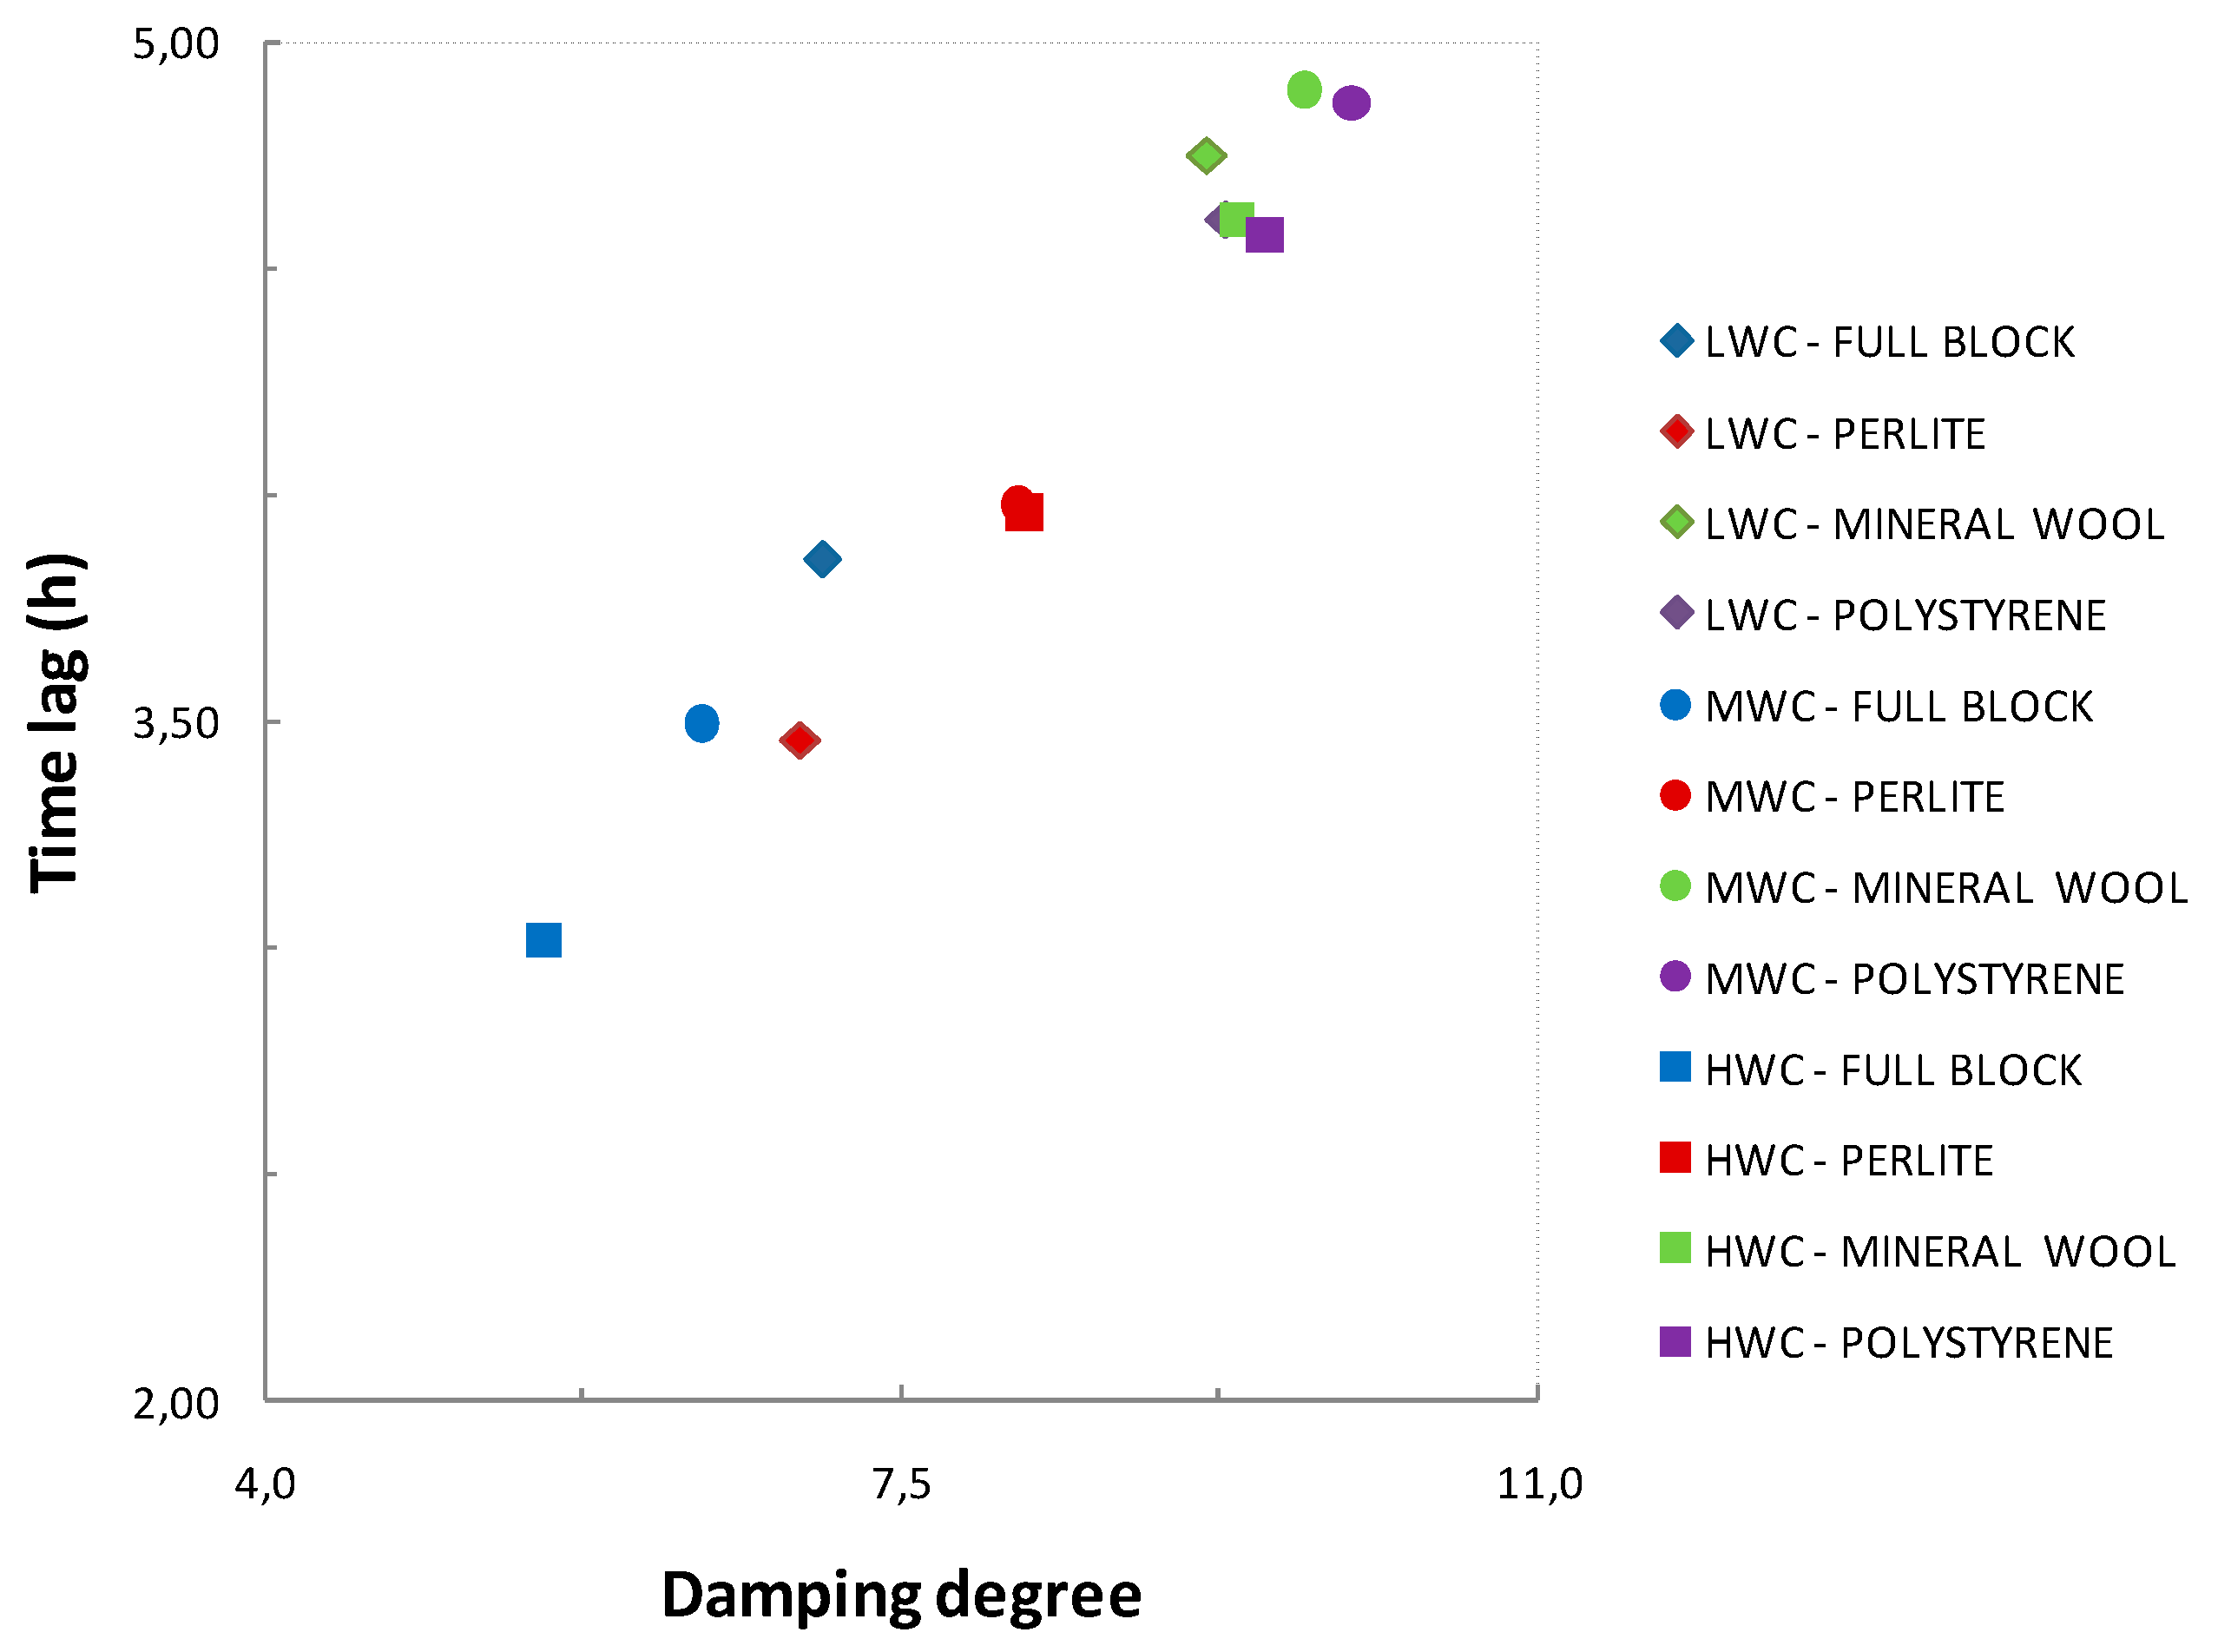
The values in
Figure 7 and
Figure 8 seem to have almost the same arrangement; thus, time lag was plotted versus damping degree, as shown in
Figure 9. A linear correlation emerged between these two performance indicators.
Full blocks showed a reverse correlation to front mass, as lighter clay provided higher time lags. In fact, clay density was found to be directly correlated to thermal diffusivity, so this might be relevant to predicting dynamic response to temperature solicitation.
Thermal diffusivity is the ratio of heat conduction to heat capacity per unit volume of a given medium. So, it is possible to define it as the ratio between equivalent thermal conductivity and specific heat per unit volume for a non-homogeneous block.
Equivalent thermal conductivity (
keq) may be defined as the ratio of steady state heat flux per unit area (
qsteady) multiplied by its thickness (
Hb) to the temperature difference on its sides (
TS − TN):
Moreover, it is possible to define the mean heat capacity per unit volume (cv) as the average of heat capacity per unit volume of each composing material weighted with its volume (area in a 2-D configuration):
The equivalent thermal diffusivity of a block is thus defined from Equation (9):
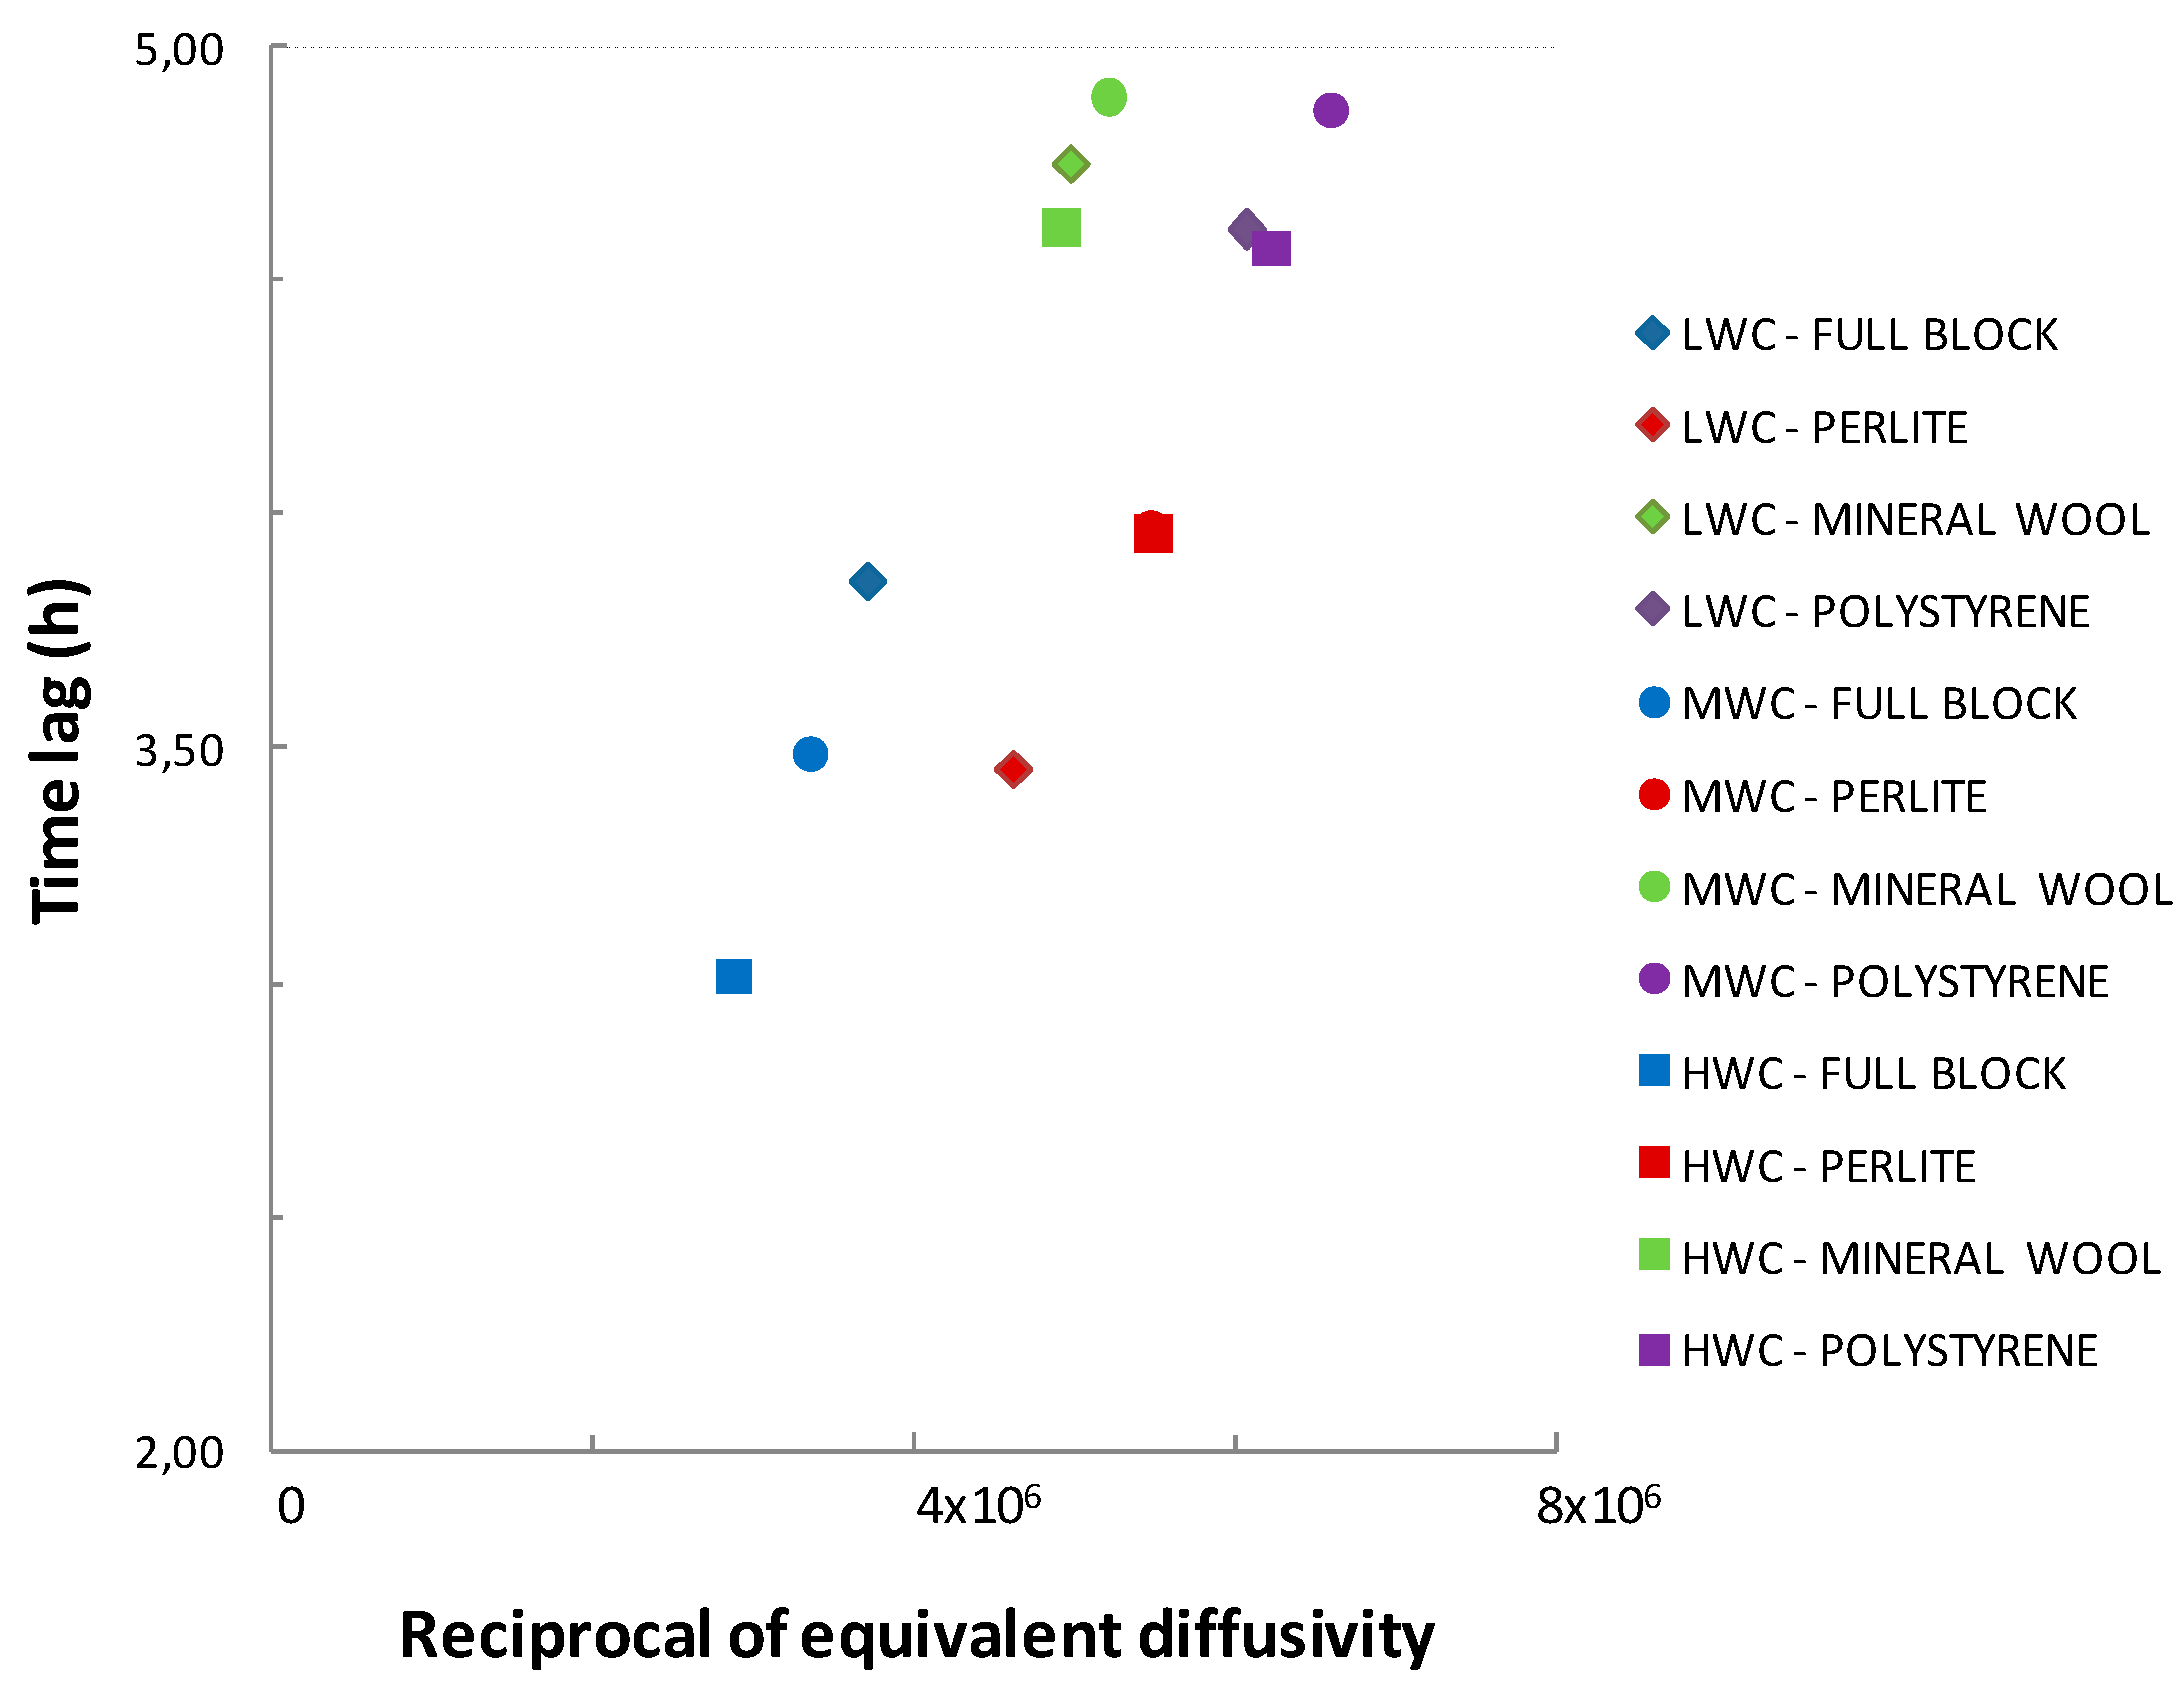
Plotting time lag for the considered blocks against their equivalent thermal diffusivity, there emerged a clear correlation, as depicted in
Figure 10. Plotting time lag values against the reciprocal of equivalent thermal diffusivity of each block showed a straight correlation, as depicted in
Figure 11. Yet, full blocks and those insulated with Mineral Wool exhibited a steeper correlation compared to blocks insulated with high thermal diffusivity materials such as Expanded Polystyrene and Expanded Perlite. More materials and different blocks should be considered to provide enough data to propose a correlating equation that would be of any practical interest.
6. Conclusions
Heat transfer in blocks with different infill insulating materials has been numerically studied. Dynamic thermal features including time lag and decrement factor, in response to a triangular temperature pulse, have been analyzed. The influence of front mass on time lag that is implicit in common expressions such as “heavy walls” and “light walls”, used to describe building performance in the open literature, has been found to be not correct. On the contrary, for some blocks, a lower front mass leads to a higher time lag.
Once the equivalent thermal diffusivity of blocks is defined, there is a straight correlation between time lag and the reciprocal of equivalent thermal diffusivity. Yet, there is some spreading of data due to insulating material thermal diffusivity.
Moreover, a linear correlation between damping degree and time lag has been found, thus further analysis should be focused on the latter in order to determine the dynamic thermal features of building components.
However, this is just a first approach to a wide field of research showing unexpected results. Much more work should be conducted in order to fully understand the unsteady behavior of hollow and insulated blocks, as block thickness is expected to play a relevant role.


