Article

Battery Storage Technologies for Electrical Applications: Impact in Stand-Alone Photovoltaic Systems

1
Andrew and Erna Viterbi Faculty of Electrical Engineering, Technion—Israel Institute of Technology, Haifa 3200003, Israel
2
Department of Electrical and Computer Engineering, Elizade University, P. M. B 002, Ilara-Mokin, Ondo State, Nigeria
3
Department of Computer Systems, Tallinn University of Technology, Akadeemia tee 15a, 12618 Tallinn, Estonia
*
Author to whom correspondence should be addressed.
Energies 2017, 10(11), 1760; https://doi.org/10.3390/en10111760
Submission received: 29 September 2017 / Revised: 22 October 2017 / Accepted: 24 October 2017 / Published: 2 November 2017
(This article belongs to the Section D: Energy Storage and Application)

Abstract

:
Batteries are promising storage technologies for stationary applications because of their maturity, and the ease with which they are designed and installed compared to other technologies. However, they pose threats to the environment and human health. Several studies have discussed the various battery technologies and applications, but evaluating the environmental impact of batteries in electrical systems remains a gap that requires concerted research efforts. This study first presents an overview of batteries and compares their technical properties such as the cycle life, power and energy densities, efficiencies and the costs. It proposes an optimal battery technology sizing and selection strategy, and then assesses the environmental impact of batteries in a typical renewable energy application by using a stand-alone photovoltaic (PV) system as a case study. The greenhouse gas (GHG) impact of the batteries is evaluated based on the life cycle emission rate parameter. Results reveal that the battery has a significant impact in the energy system, with a GHG impact of about 36–68% in a 1.5 kW PV system for different locations. The paper discusses new batteries, strategies to minimize battery impact and provides insights into the selection of batteries with improved cycling capacity, higher lifespan and lower cost that can achieve lower environmental impacts for future applications.

1. Introduction

Energy storage technologies are a key element of modern electrical power system, both for the conventional and the renewable energy systems applications [1]. They have a wide range of applications in electrical systems both in the on-grid and off-grid electrical power generation systems, and are amongst the distributed energy resources (DERs) [1,2]. Some of their major applications include balancing the variable characteristics of the renewable energies, providing ancillary services such as frequency and voltage stability, ensuring a reliable energy supply and increased penetration of renewable energy technologies [1,2,3].
The storage systems currently engaged for stationary applications include the pumped hydro, compressed-air, superconducting magnetic, capacitors and super-capacitors, flywheel, pumped heat and battery technologies [3]. Battery technologies are one among the promising storage systems for stationary applications, because of their maturity and the ease with which they could be designed and installed compared to other storage technologies [4,5].
There are several challenges that exist in modern electrical power systems, which attract the attention and concerted efforts of energy experts, developers and researchers in the field of practice. Some of these problems include frequency and voltage stability, power quality issues such as voltage distortion and sag, intermittent renewable energy output, energy control, peak demand, reliability of energy supply, bi-directional power flow, integration of renewable energy-based microgrids and large-scale wind power etc. [1,5]. Energy storage systems have been used in different ways to address some of the mentioned challenges.
It is of interest in this current paper to form an appreciable background by detailing the different kinds of battery technologies and applications, and reviewing some of the existing studies in the literature. This will help to identify the milestones reached and the possible research gap. A critical review of the electrical energy storage has been presented [1], which focus on the common energy storage systems that are engaged for stationary applications such as the pumped hydro, compressed-air, supercapacitor, superconducting magnetic, batteries, flywheel and thermal systems. Similarly, contributions of the studies in [2,3,4] are on the comprehensive review of energy storage systems. The studies compared the characteristics and costs of the energy storage systems.
The energy storage sizing has been discussed for effective primary and secondary control of low-inertia microgrid systems, focusing on the frequency and voltage stability of the energy generation system [6]. The optimization of a battery energy storage system has also been presented, focusing on primary frequency control [7]. The dynamic frequency control support by energy storage has been discussed for reducing the impact of wind and solar generation on the isolated power system’s inertia [8]. A review on the inertia response and frequency control techniques for renewable energy sources has been discussed, comparing the renewable energy generation systems without storage with those having a storage system [9].
A study focusing on the battery energy storage has been presented for enabling the integration of distributed solar power generation [10]. A review on the battery energy storage applications has been discussed with emphasis on wind integrated systems [11]. The efficiency improvement of mini hydro pump storage power plant using Archimedes turbine has been discussed [12]. A study on energy storage as the core of renewable energy technologies has been presented [13], focusing on the key storage technologies and their characteristics. The electricity energy storage technology options have also been presented [14].
The future-oriented analysis of battery technologies has also been published [15], focusing on the available storage technologies, and selecting and synthetically characterizing the possible emerging technologies with a time horizon. The overview of current development in electrical energy storage technologies and the application potential in power system operation has been discussed [16]. A review paper has also been published on the current and future electrical energy storage devices [17], presenting the storage technologies used for renewable energy applications. The seasonal energy storage in a renewable energy system has been discussed emphasizing the energy storage capacity required to balance the intermittent renewable energy resources [18]. A research on the technologies for mitigating fluctuation caused by renewable energy sources has been published [19].
A review on redox flow batteries for the storage of renewable energy has been discussed. The authors first highlighted different storage technologies but placed emphasis on the characteristics, discharge cycles, round-trip efficiency and the applications of flow batteries in electrical power system [20]. A comparative overview of large-scale battery systems for electricity storage has also been presented, focusing on the types, operational characteristics and the applications of battery systems in large scale solar and wind energies [21]. A study on the application of battery-based storage systems in household-demand smoothening in electricity-distribution grids has been published [22]. A battery energy storage system has been discussed, with emphasis on the residential electricity peak demand shaving application [23].
The electrical energy storage systems in electricity generation have been discussed, introducing the energy policies, innovative technologies, and regulatory regimes for widespread application [24]. A review of available methods and development on energy storage has been published. The authors provided the technology update [25]. A comparative life cycle cost analysis of different electrical energy storage systems has been discussed [26]. The authors considered the pumped hydropower storage, compressed air energy storage (CAES), flywheel, electrochemical batteries (e.g., lead-acid, NaS, Li-ion, and Ni–Cd), flow batteries (e.g., vanadium-redox), superconducting magnetic energy storage, supercapacitors, and the hydrogen energy storage. An optimized home energy management system has been presented with integrated renewable energy and storage resources [27]. The authors focus on how the renewable energy resources and storage systems could be optimized for sustainable energy utilization.
The economic assessment of energy storage systems providing primary reserve and peak shaving in small isolated power systems has been discussed [28]. A study on the energy storage and its use with intermittent renewable energy has been published [29]. The research on the power systems’ optimal peak-shaving has been published with focus on the application to secondary storage [30]. The authors consider the optimal peak shaving strategy, which enables the minimization of the power peak and the provision of an analytic design technique for achieving the optimal peak shaving. A study considering the state-of-the-art review of energy storage and real life applications has been presented [31].
A study that considers improving the reliability of photovoltaic-based hybrid power system with battery storage in low wind locations has been discussed [32]. The authors focus on how reliable energy could be supplied to the users by incorporating a battery storage system the energy system. The real-time testing of energy storage systems in renewable energy applications has been presented [33]. A study has been published on lead-acid battery response to various formation levels, focusing on the off-grid solar and conventional applications [34], while the research in [35] by the same authors concentrate on internal resistance aspect of lead-acid battery response to various formation levels.
The development of phase change materials (PCMs) for low temperature energy storage applications has been presented, for buildings, solar water heating/drying/foot warmers applications [36]. The research on the evaluation of grid-level adaptability for stationary battery energy storage system applications in Europe has been published [37]. A review of recent developments of photovoltaics integrated with battery storage systems and related feed-in tariff policies has been presented [38]. The evaluation of electrical energy storage (EES) technologies for renewable energy has also been presented, using the US Pacific Northwest as case study [39].
Batteries pose threats to the environment and of course, to human health [1]. Though several existing studies in the literature have presented quality research on the various battery technologies and their applications, some of which have been mentioned [1,2,3,4,6,7,8,9,10,11,12,13,14,15,16,17,18,19,20,21,22,23,24,25,26,27,28,29,30,31,32,33,34,35,36,37,38,39], evaluating the environmental impact of batteries in electrical systems remains a gap that requires concerted research efforts. Every component in the electrical system has its environmental impact [40], but the focus of this study is not only to present an overview of the battery systems, but also to examine their GHG impact in the energy system.
The existing studies provide relevant and useful background for understanding the different types of energy storage technologies, their features and characteristics, developments and applications in electric power systems. Furthermore, some of the authors have presented how the storage systems can be employed as possible solutions to the challenges of variable characteristics of renewable energies, frequency and voltage instability, peak demand, reliability, power quality issues, grid-integrated microgrids and large-scale wind etc. Some of the studies also consider the life-cycle cost of the storage options, while a few others discussed future-oriented evaluation of battery technologies. However, none of these studies [1,2,3,4,6,7,8,9,10,11,12,13,14,15,16,17,18,19,20,21,22,23,24,25,26,27,28,29,30,31,32,33,34,35,36,37,38,39] has considered the evaluation of the environmental impact of batteries in the electrical system. Such an evaluation will be useful for better understanding of the battery lifecycle impact and the possible ways to achieve environmentally friendly energy solutions and operation in the future, in the wake of increased renewable energy-based electricity systems around the world.
Therefore, while this current paper focuses on the review of the state-of-the art of battery storage technologies, it analyses the environmental impact of battery storage technologies in a renewable energy system application. To achieve a sustainable energy requires the consideration of some enabling planning, development and management perspectives, which include the social, technical, economic and the environmental aspects [40]. Though some of the studies have considered the techno-economic aspects, which is an acceptable analysis technique for ascertaining the technical and economic feasibility of the system [1,4,15,26,37], it is also important to examine the environmental impact of the storage system over the energy system’s lifetime. Therefore, this research attempts to consider the critical gap by first introducing an optimal battery technology sizing approach, which is crucial for determining the battery capacity and selecting the suitable battery cells for energy generation applications. It also analyses the life cycle environmental impact of batteries in a renewable energy system application.
In order to determine an optimal battery size, this paper proposes a novel approach that interfaces two critical energy generation design factors such as the reliability and cost. The study considers the system reliability in terms of loss of power probability (LOPP), which is relates the unmet energy demand with the total energy demand over the year [4]. Obtaining a minimum cost at a given LOPP is an important objective and criterion that informs the technology selection. The paper considers the cost in terms of the cost of energy (COE) in $/kWh, using the life cycle cost analysis [31].
To assess the impact of batteries, this study uses a stand-alone or grid-independent solar PV energy generation system as a case study. It then examines how the lifespan, cycling capacity and the number of replacements of the lead-acid battery cells contribute to the environmental impact of the system over the project lifetime of 25 years. Lead-acid battery has been selected for the analysis because of its commercial maturity and cost-effectiveness compared to other systems [5,26]; more so, it is the most widely used battery storage technology. The proposed contributions of this paper are expected to provide insights not only into the global progress in battery technologies, but also stand as a reference point for ascertaining the impact of batteries in electrical power systems, especially the off-grid systems that are associated with frequent replacements of battery banks over the project life [5].
The study uses the lifecycle emission rate (LCER) of the lead-acid battery and the number of times the battery cells are replaced over the PV energy system’s lifespan of 25 years, to assess the GHG impact of different sizes of batteries. In addition to the impact assessment, the paper highlights the possible strategies to minimize the environmental impact of battery cells, and discussed the important criteria for selecting battery technologies for energy systems application. These can serve as a basis for environmental sustainability planning. This paper maintains a position that while it is important for the research community to continually work towards improving the cycling capacity, round-trip efficiency and the energy density of batteries, it is also necessary to intensify research in the aspect of environmental impact of batteries in the modern-day energy system.
The remaining part of the paper is arranged as follows: Section 2 discusses the existing battery technologies and their comparison; Section 3 presents the case study and methodology; Section 4 focuses on the results of the impact analysis; Section 5 presents the new and future battery technologies; Section 6 presents the criteria for battery selection while Section 7 concludes the paper.

2. Battery Storage Technologies

Rechargeable (secondary) battery storage systems comprise of a wide range of technologies and are classified based on the type of electrodes and electrolytes used in their storage system arrangements [
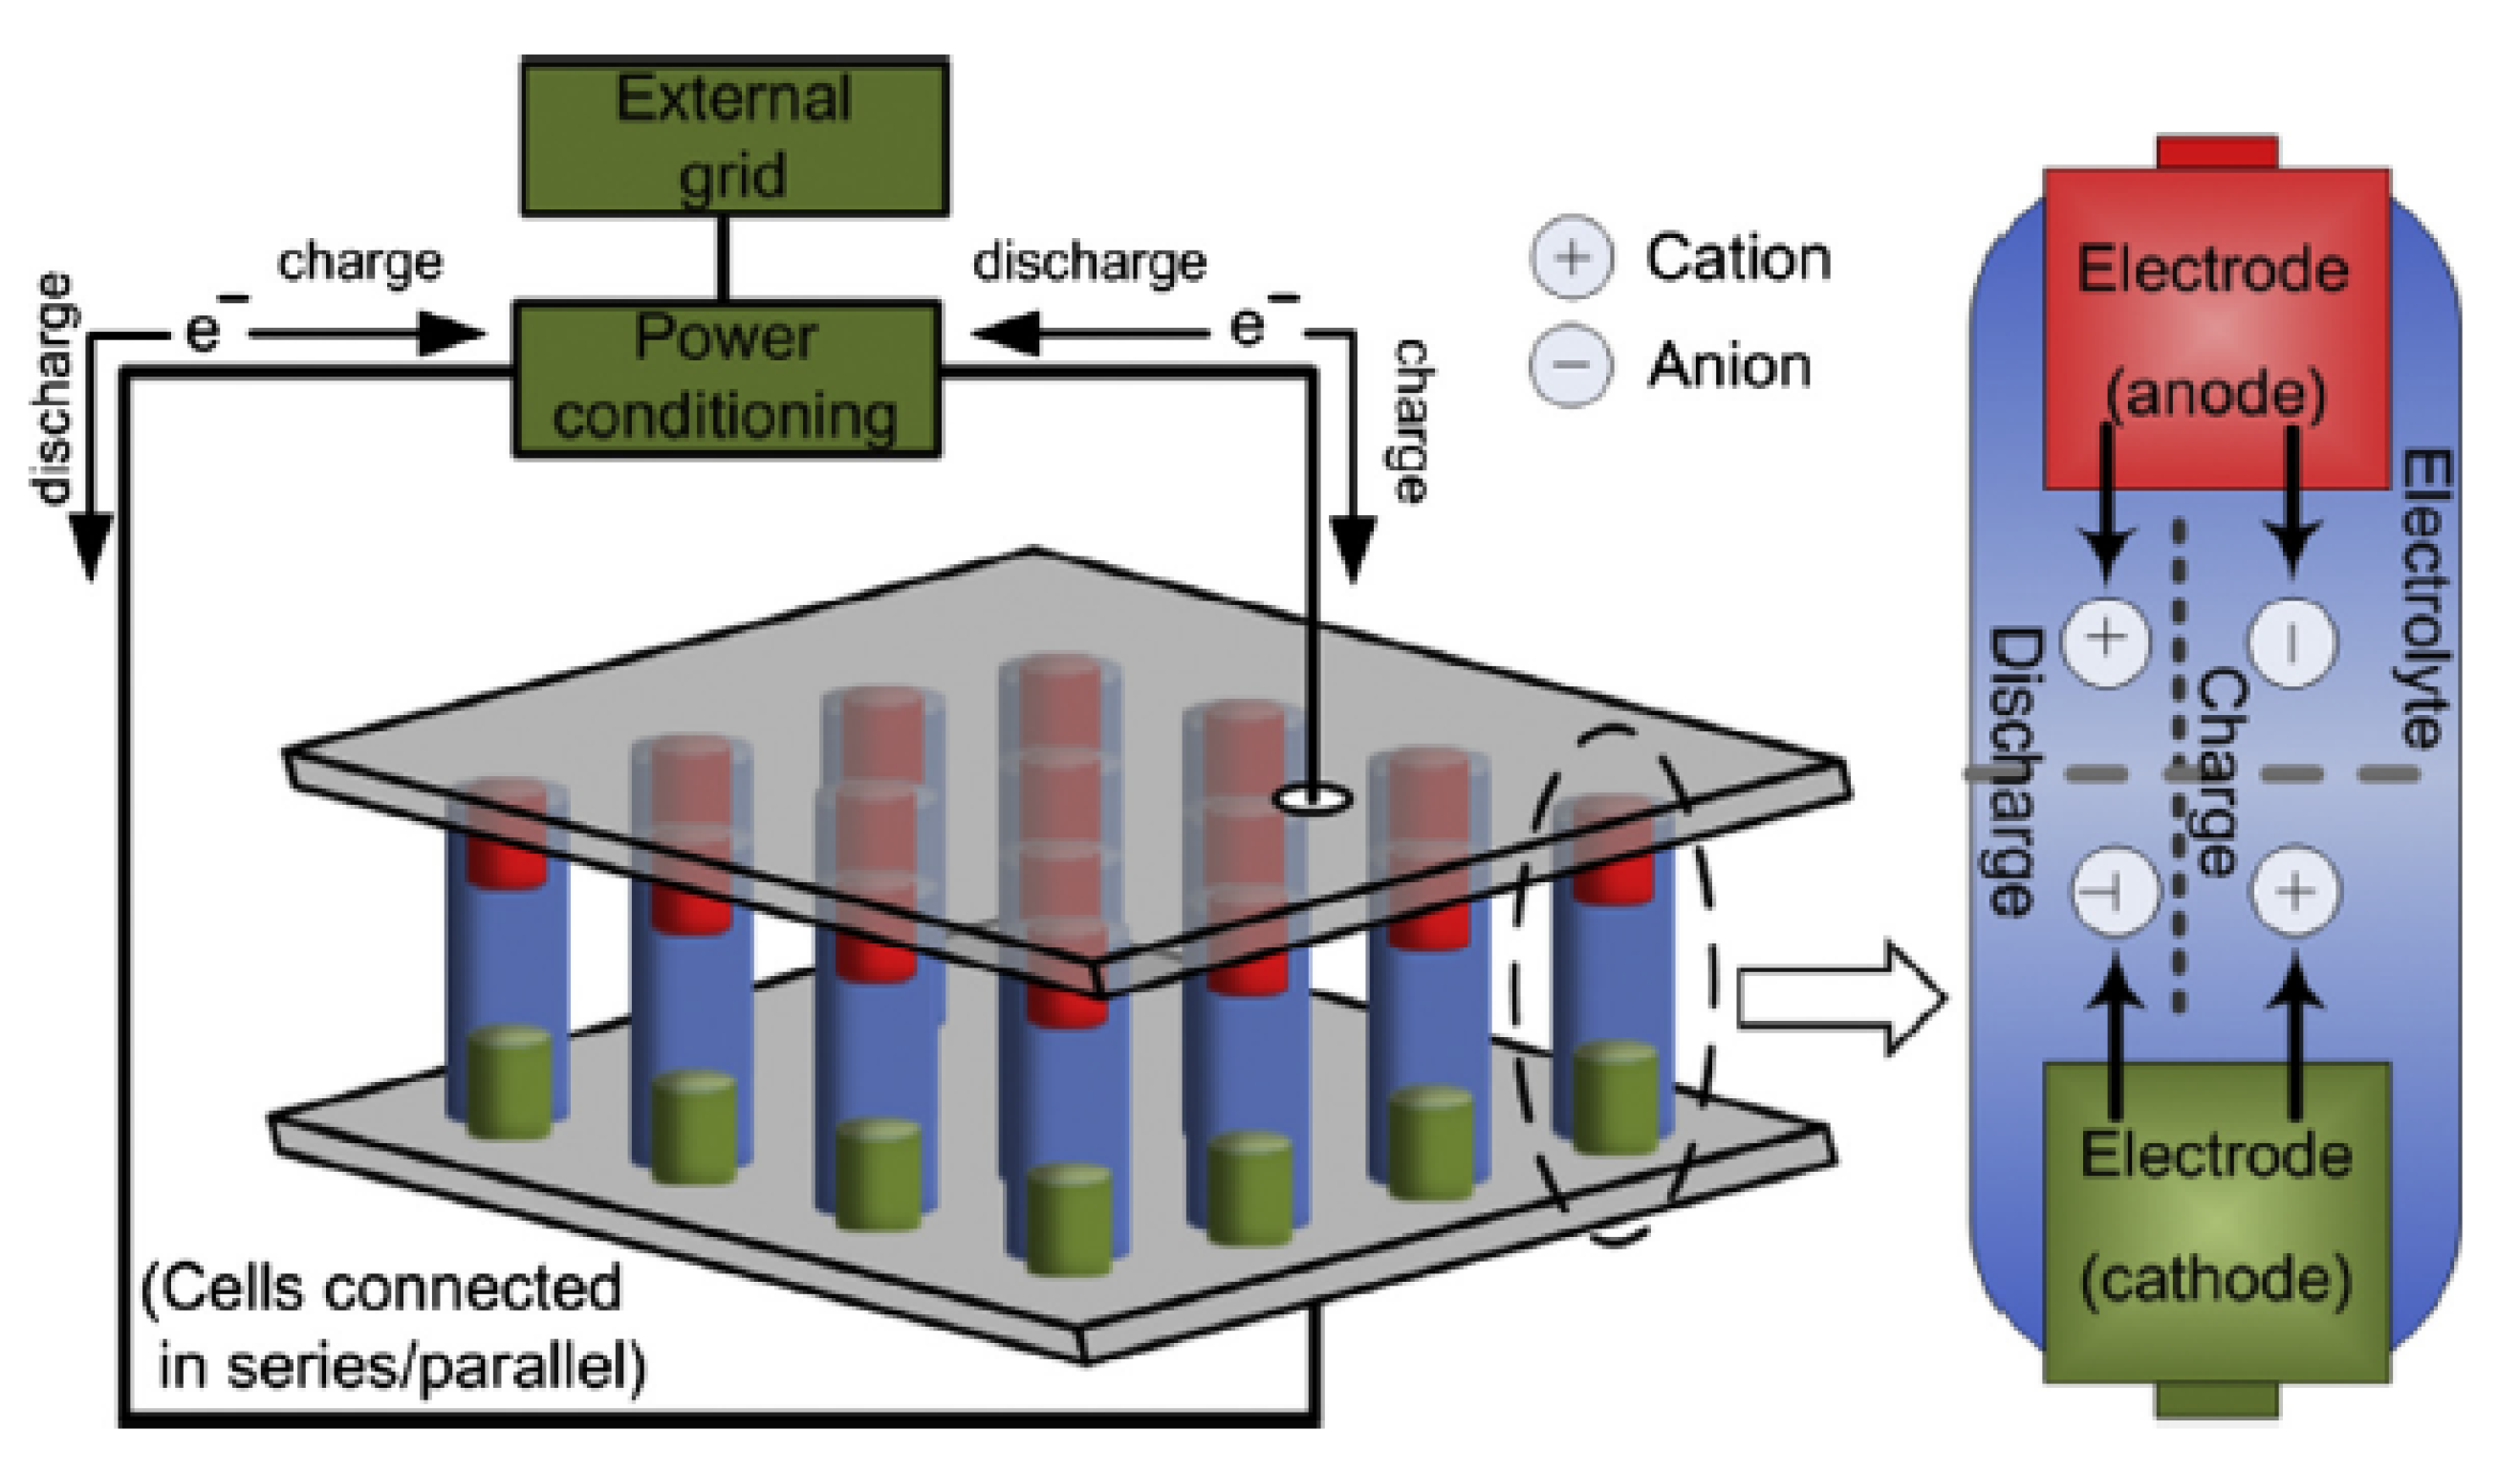
26]. The operation of a typical battery energy system is presented in Figure 1. The battery system is made up of electrochemical cells that are wired in series, and which generate electrical energy at a specified voltage through an electrochemical reaction. Each electrochemical cell has two electrodes (i.e., anode and cathode) and an electrolyte [16]. An electrochemical cell can convert energy from electrical to chemical energy and vice-versa. At discharge, the electrochemical reactions occur at the two electrodes at the same time. Therefore, electrons are provided from the anodes and are collected at the cathodes at the external circuit. During the charge state, the reverse reactions occur and the battery is recharged through an external voltage that is applied to the electrodes.
The battery technologies are practically the most widely used storage technologies because of the ease with which they are designed and manufactured [41], and are employed for bridging power applications in electrical systems [3]. This is because of their relatively lower cycling capacity compared to super-capacitors, flywheel and superconducting magnetic storage systems that are popularly used for power quality purposes.
The popular battery technologies systems currently engaged for stationary applications include the lead-acid, sodium sulfur (NaS), sodium-nickle chloride (NaNiCl 2 ), also known as ZEBRA, nickel cadmium (Ni–Cd), lithium-ion (Li-ion), zinc-bromide (Zn–Br), polysulfide bromine (PSB) and vanadium-redox (VRFB) [26], including the new systems such as advanced valve regulated (VRLA) lead-acid, lead-carbon, metal-air technologies, UltraBattery, battery with current collector improvement, advanced sodium-metal chloride, high performance sodium-copper chloride and nanostructured energy materials in lithium batteries.
The history of battery advancements is presented in Table 1. The information details the various inventions, the Scientists who developed the ideas/technologies between the year 1600 and 2002. The voltaic cell technology was invented in 1800 by Alessandro Volta, which sets the pace for the battery storage system, even though the idea of electrochemistry dates to 1600.
Some notable current practical renewable energy-based and power applications of batteries are summarized as follows [43]:
  • Bulk wind to distributed energy storage. Coupling the wind resource with distributed battery storage will help address the issue of intermittent energy generation. As such, large scale wind may be integrated with the existing grid in the future.
  • Community-based energy storage (CES). A community battery storage system may be designed to island, meaning that when a localized section of the distribution power system is isolated from the grid, it can support the users’ demand, e.g., a back-up power. Battery systems can also be used as part of a completely autonomous power generation system with a solar PV, wind, small hydro, biomass and/or distributed diesel power plant serving an off-grid homes or community.
  • Distributed grid-integrated PV system. A grid-connected or on-site storage located/connected near the PV system helps to manage the challenges of rapid output variations, daily variations, power quality issues-harmonics and the mismatch between the PV output and the users’ demand that are posed by grid-connected PV systems without storage.
  • Energy storage and plug-in vehicles. A distributed battery storage system for electric vehicle charging can be a part of a localized energy system strategy to integrate a distributed solar PV power to improve the reliability of energy supply at a specified portion of the electric grid.
  • End-user bill management. Storage system could be employed to reduce the cost of electricity service. Such an application could also help the end-users to “time-shift” their energy from PV or other generation options or it could be employed to integrate a nearby solar PV system. In this case, a time-of-use (TOU) energy pricing may use storage to reduce electricity cost when the demand and the price of energy are low, and then used later when the demand and price are high, instead of purchasing high-priced electricity.
  • Flexible peaking resource. “Peakers” or “Peaking resources” are designed to serve peak electricity demand. One of the alternatives to peakers is the energy storage option, e.g., battery, which can provide a responsive and high flexible peaking resource compared to the demand-side management approaches. Using modular battery storage for serving a peaking demand could also be cost-effective.
  • Frequency regulation. Traditionally, frequency regulation is essentially the “ramping” of electric generation assets in a timeframe of minutes. However, electricity storage has the potential of serving this purpose in milliseconds, which also provides an economic prospect. For instance, the Pacific Northwest National Laboratory (PNNL) suggested that storage systems on a millisecond timeframe could have a value of at least that of 20 mins timeframe electric power assets. Battery storage system is one the popular storage options that can contribute to the grid stability.
  • Spinning reserve. Utilities are usually charged with the responsibility of being able to accommodate the loss of the largest power generator in the network with minimum load flow and frequency deviation. In this situation, all generators have a proportion of their reserve capacity associated with their primary energy source and inertia. For a steam-power option, additional fuel is wasted as the generator will be operated below its rated capacity. Nowadays, storage systems are used for this capability through dedicated power converters that interact the with the power grid.
  • Transmission and distribution (T & D) upgrade deferral. Storage systems are a key option for deferring or avoiding the need for upgrading the transmission and distribution apparatus. Since a modular configuration of a storage system, e.g., battery could be employed to serve a small proportion of peak demand, there will not be the need to increase the capacity of the T and D in the short-term. This also helps to extend the life span of the T and D equipment.
  • Uninterruptible power systems (UPS). Battery systems are a crucial component of the UPS used to provide a stable and reliable power for critical loads, e.g., medical, emergency lighting and communication equipment, to minimize or forestall lost productivity, facilities or equipment damage.

2.1. Lead-Acid

The lead acid technologies are the oldest form of battery energy storage system developed by a French physicist Gaston Planté in 1859 [1,3,26,41]. They have been a common storage option for mini-or micro-grids or the grid-independent electrical power systems, uninterrupted power supply and spinning reserve applications [1].
The electrochemistry of lead-acid technologies in the charge state consists of a lead dioxide (PbO 2 ) and lead (Pb) in a concentrated tetraoxosulphate (VI) acid electrolyte [41]. The PbO 2 and the Pb are the positive and negative electrodes, respectively. However, in the discharge state, the electrodes—lead dioxide and the lead are converted to lead sulphate (PbSO 4 ); thus, they consumed the sulphate ions. This development reduces the specific gravity of the electrolyte to a level similar that of water, meaning that the electrolyte loses its dissolved tetraoxosulphate (VI) acid and turns to water [1,41].
The PbO 2 (positive electrode) is the key factor that influences the performance and cycle life of a lead-acid technologies [41], while Pb (negative electrode) determines the cold-temperature performance of the systems. The electrochemical reactions of lead-acid batteries are as follows. At the anode (i.e., positive electrode)
Pb + S O 4 2 PbS O 4 + 2 e
At the cathode (i.e., negative electrode)
Pb O 2 + S O 4 2 + 4 H + + 2 e PbS O 4 + 2 H 2 O
There are different types of lead acid technologies including the flooded type that requires regular topping up with distilled water and the sealed maintenance free type that has a gelled/absorbed electrolyte, and the valve regulated type [1,3].
Lead-acid batteries have a low cycle life ranging from ~2000–2500, a round trip-efficiency (RTE) of ~70–90%, and a lifespan of ~5–15 years and a low energy density of ~40–50 Wh/kg [26,41]. They are identified as low-cost secondary battery technologies, which is one of the reasons for their widespread application electrical and renewable energy applications.
They possess a moderately good operating temperature ranging from 40 C –60 C [41]. However, they have a potential for generating a negative environmental influence because of the toxic remnants they produce [1]. Their grids also contain antimony and arsenic, which constitute health hazards [41].

2.2. Sodium-Sulfur

The NaS technologies were developed by NGK Insulators and Tokyo Electric Power in 1987 [26]. They are one of the most proven battery storage technologies for the mega-watt scale electrical applications [14]. They NaS batteries have been applied for power quality and power time shift purposes, because of their relatively higher RTE ranging from 75–~90% [1,
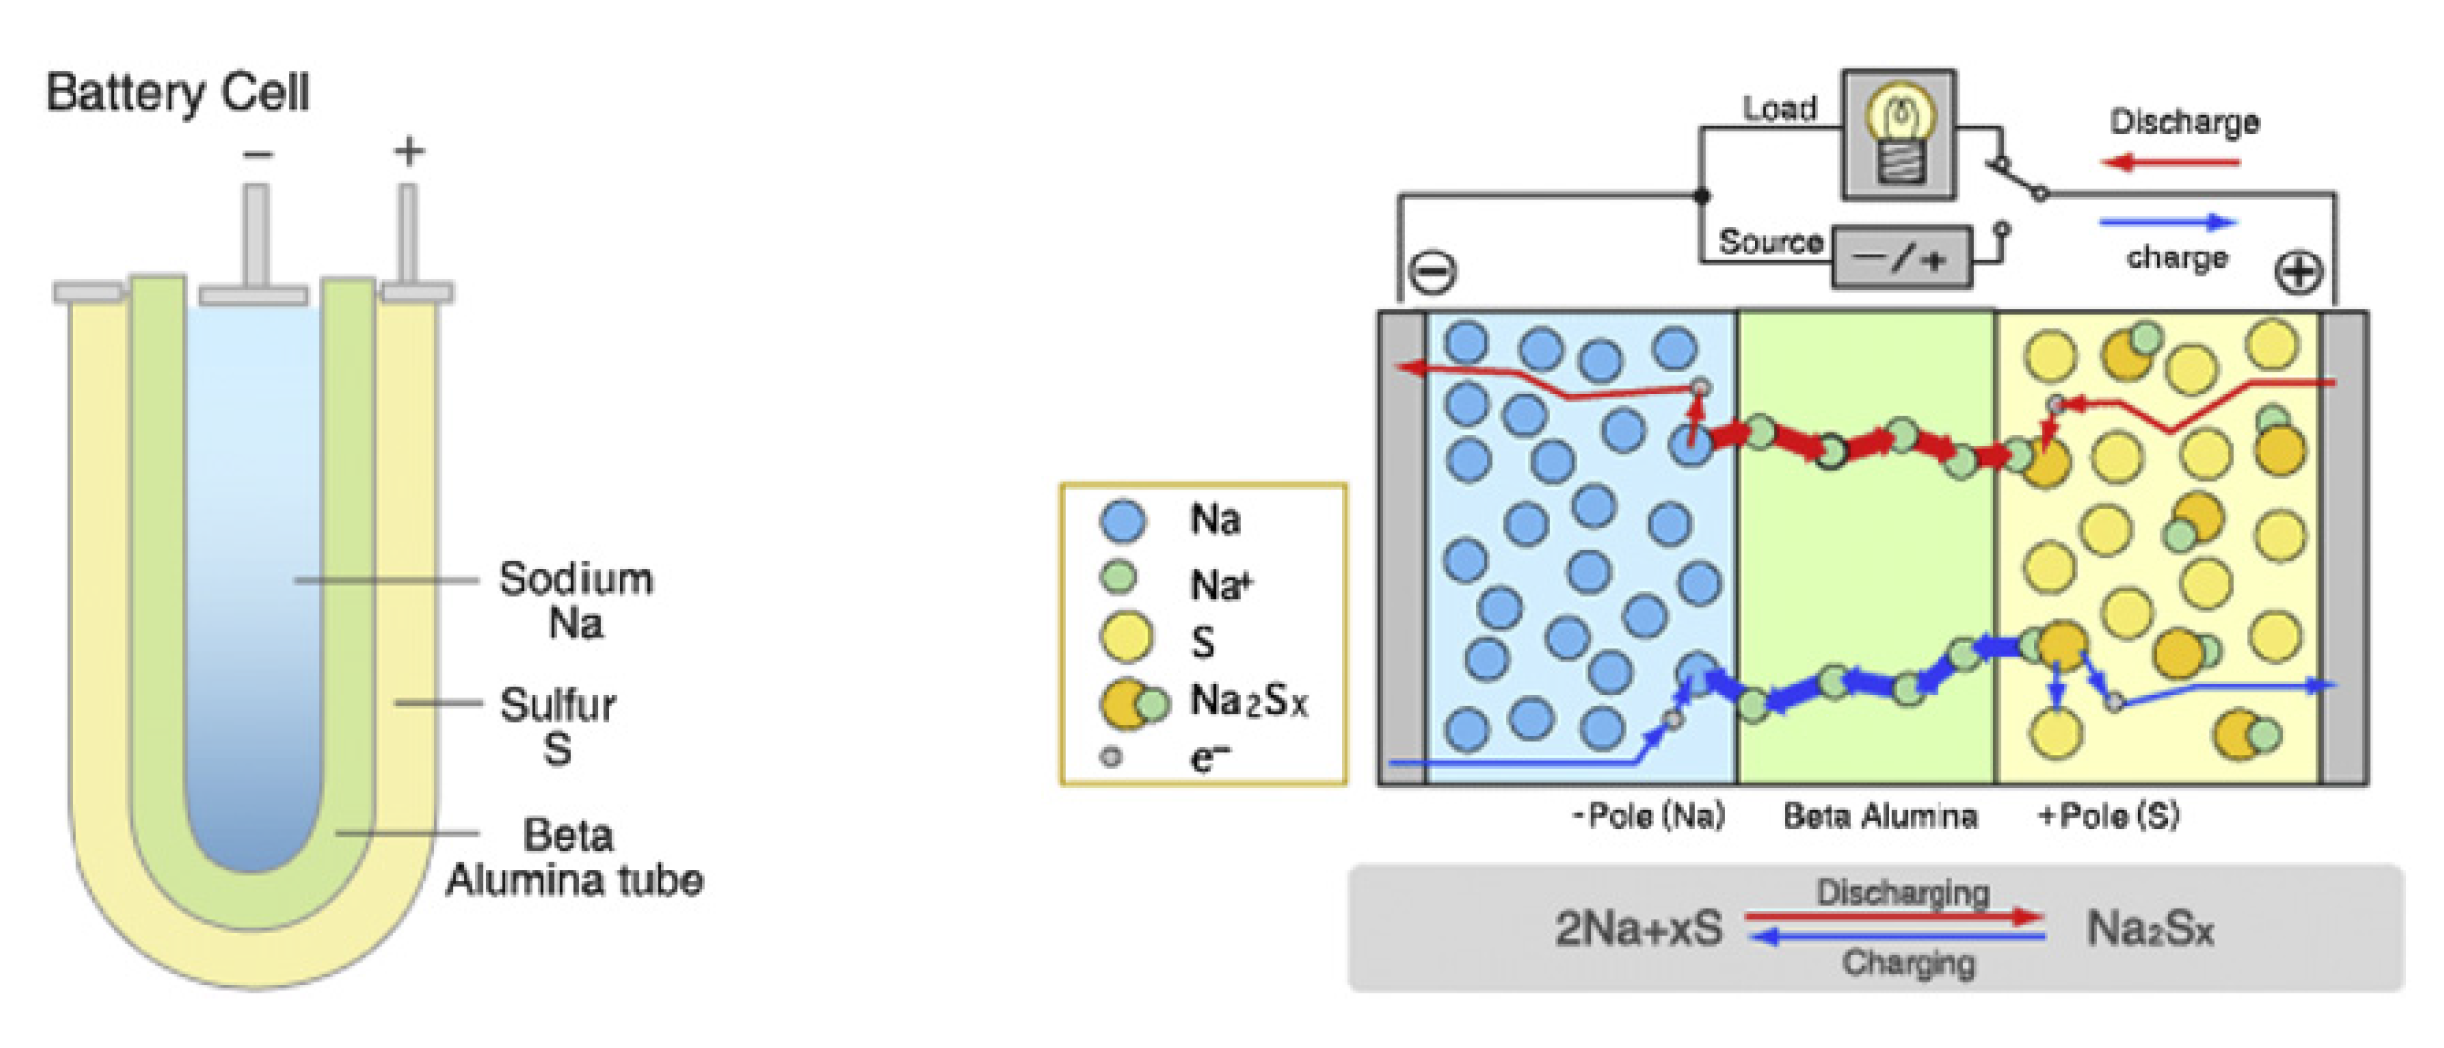
26]. The NaS battery consists of molten sulphur at the anode and molten sodium at the cathode, which are separated by a solid beta alumina ceramic electrolyte [1]. The electrolyte allows the positive sodium (Na + ) ions to flow through it and then combines with sulphur to form sodium polysulphides as
2 Na + 4 S N a 2 S 4
In the discharge state, the Na + ions flow through the electrolyte and this causes electrons to flow in the battery’s external circuit, thus, delivering 2 V. The electrochemistry is a reversible process, as charging causes the Na 2 S 4 to release the Na + back through the electrolyte, to recombine as elemental sodium (Na). The schematic diagram of the structure of NaS is presented in Figure 2.
They have a cycle life, lifespan and discharge time of 2500–4500, ~10–15 yr and up to 7 h, respectively [44]. The power rating of the technology is scalable, and this promises widespread utility-scale applications in the future. The typical energy and power densities of the NaS technology range from 150–240 Wh/kg and 150–230 W/kg, respectively [1]. However, the main drawback of this technology is that a heat source is usually required that uses a part of the battery’s energy; thus, reducing the battery performance, as it needs to operate at a high temperature of about 300–350 C , see [1].

2.3. Nickel-Cadmium

This technology is one of the oldest battery storage technologies [1,26,45], for instance, the nickel-cadmium (Ni–Cd) battery was invented by Waldmar Jungner in 1899. However, the application of the Ni–Cd was limited because of material cost and the difficulty to manufacture. There exist five different battery technologies that use the nickel-electrode in their design, manufacture and operation [3,45]. These include the nickel-iron (NiFe), Ni–Cd, nickel hydrogen (Ni–H 2 ), nickel metal hydride (Ni–MH), and nickel-zinc (Ni–Zn). Ni–Cd and Ni–MH are the widely used technologies compared to others; however, Ni–Cd is currently the most utilized nickel-electrode in modern utilities around the world [45].
They have energy and power density of 50–75 Wh/kg and 150–300 W/kg, respectively, cycle life of 2000–2500, a lifespan of ~10–20 years and RTE of ~70–72%, see [3,11,44]. The Ni–Cd battery is employed for different applications such as power quality and for forestalling unscheduled outage, i.e., emergency reserve for communication services, for power tools, portable devices and emergency lighting, UPS and generator starting [1,26].
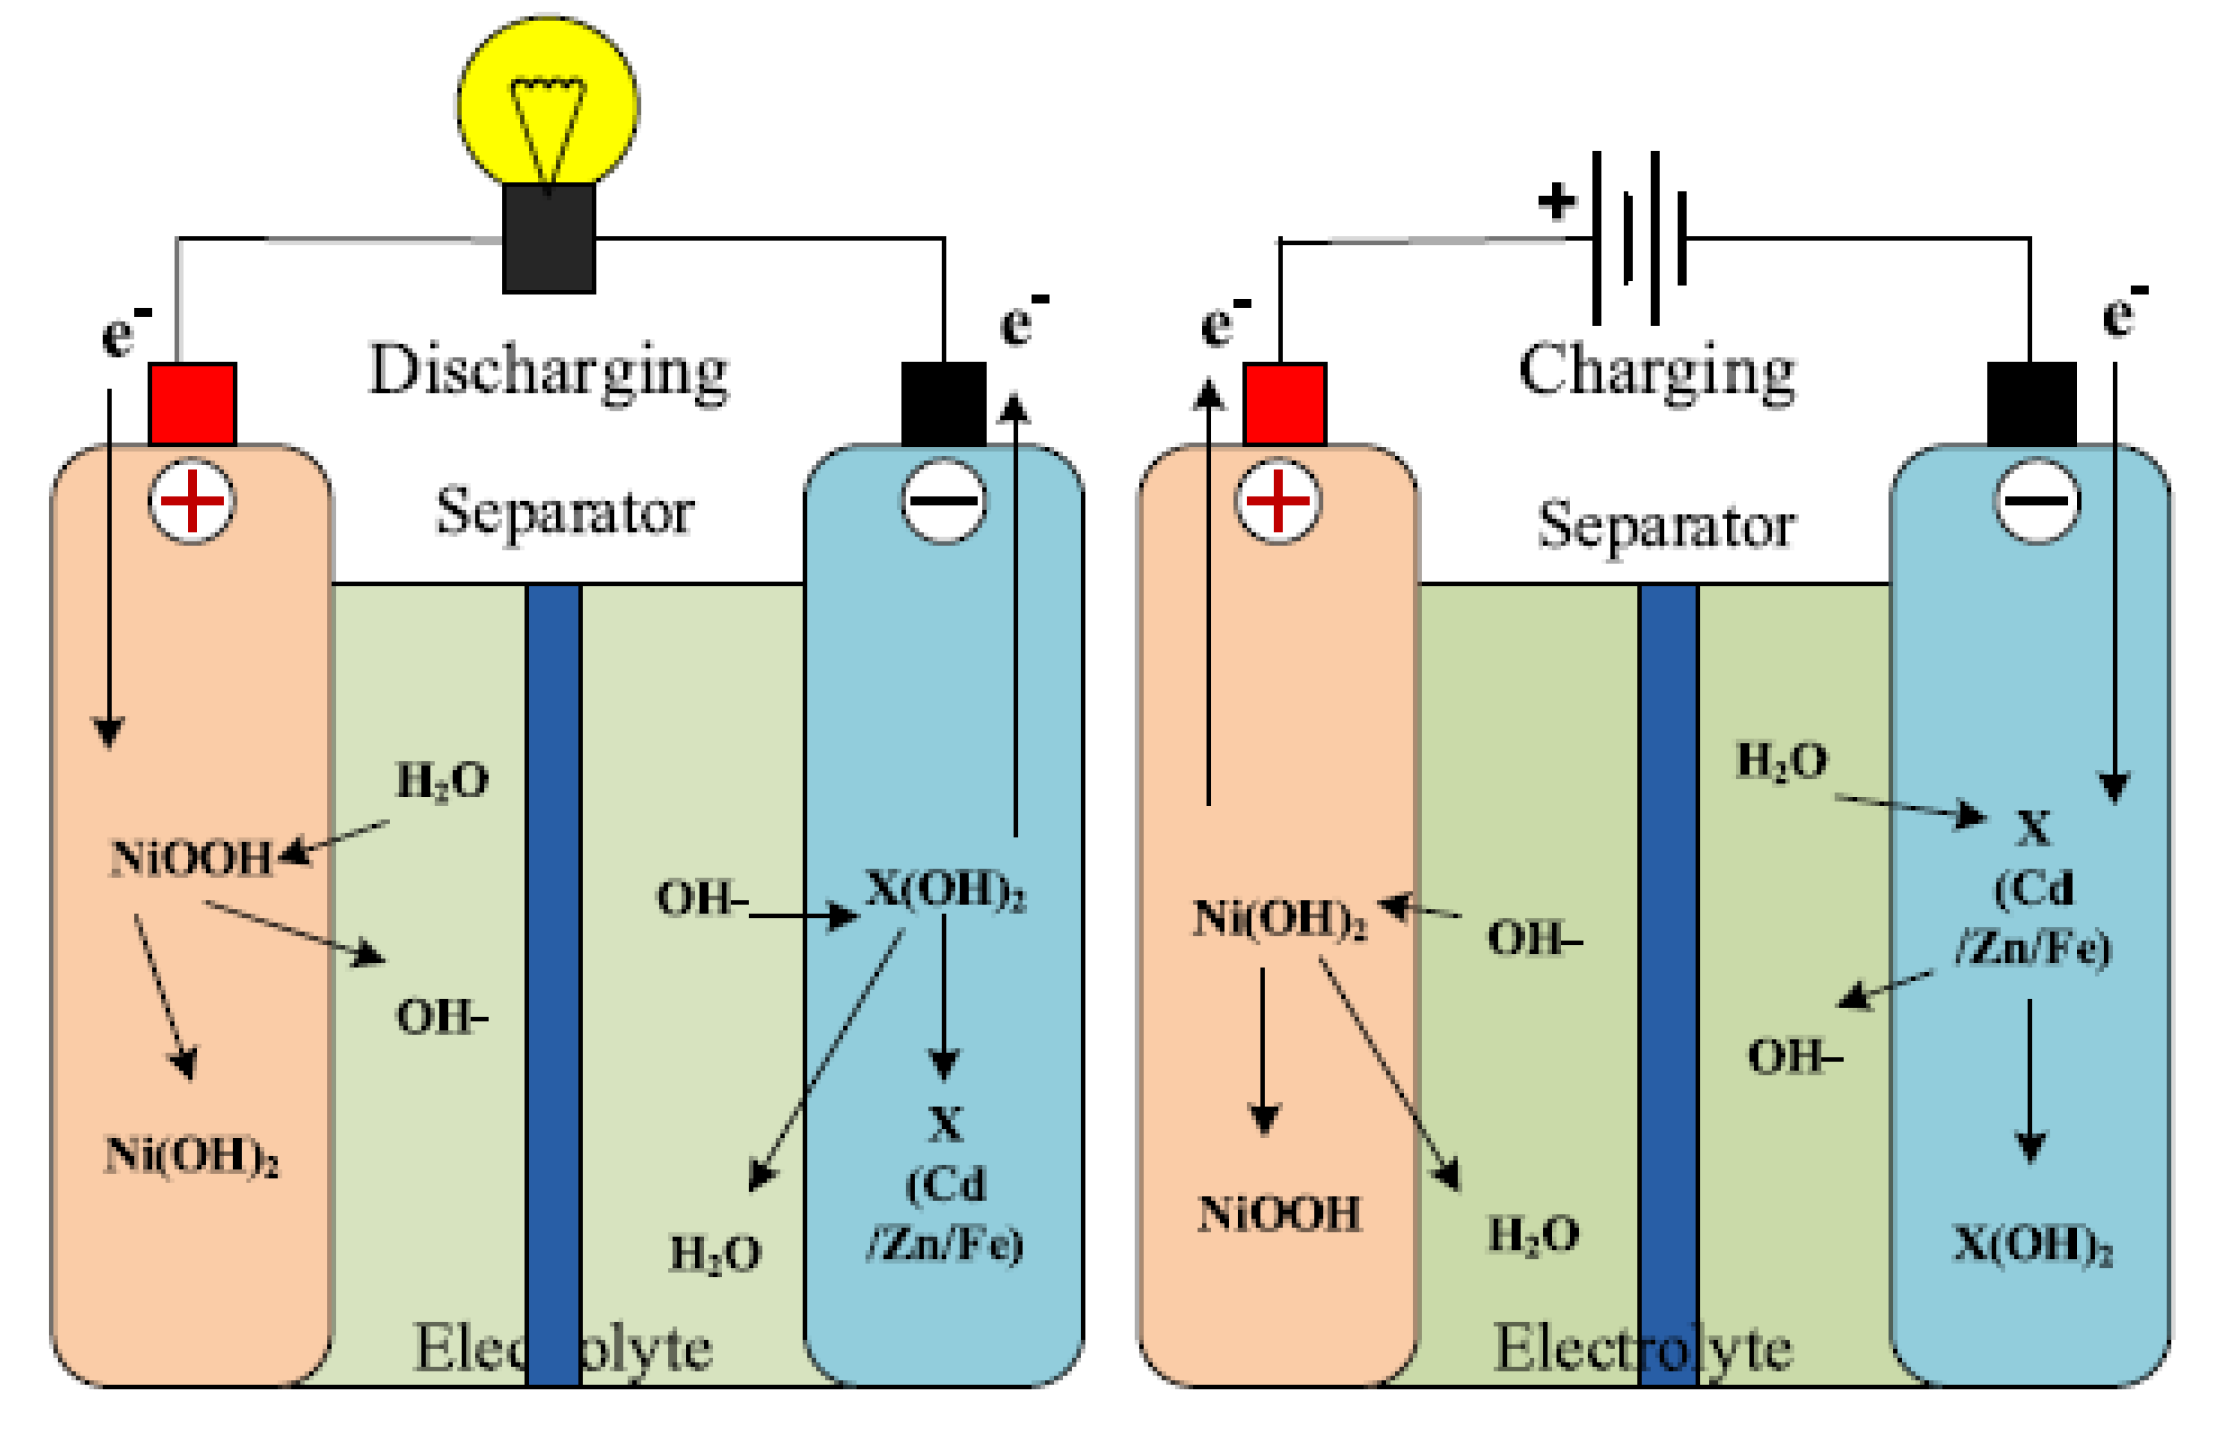
The anode of the Ni–Cd battery is nickel hydroxide (Ni(OH) 2 ) while the cathode is a cadmium hydroxide plate. The battery also has a separator, and an alkaline electrolyte [1]. The battery usually designed with a metal case and a sealing plate, equipped with a safety valve. During the charging process, the Ni(OH) 2 is converted to nickel oxyhydroxide–NiOOH, while the anode is converted to cadmium hydroxide Cd(OH) 2 [3,46,47]. The conversion process of the anode is possible through oxidation when it is charged in the presence of aqueous potassium hydroxide KOH. In the discharge state, NiOOH reacts with H 2 O to produce the Ni(OH) 2 and hydroxide ion at the anode [45,47]. The electrochemistry of the battery system is described by
2 NiO ( OH ) + Cd + 2 H 2 O 2 Ni ( OH ) 2 + Cd ( OH ) 2
and illustrated in Figure 3.

2.4. Lithium-Ion

Traditionally, lithium-based batteries are widely used in smaller appliances, such as mobiles and laptops but not employed for electric power supply purposes [11]. Lithium batteries are fast developing since their invention in the 1960s and are categorized into lithium polymer cells and lithium-ion technologies [1,11,42,49]. In lithium-ion battery technology, the organic carbonates of lithium (LiPF 6 ) are used as electrolyte. The negative electrode is usually a lithium metal oxide such as LiMO 2 , LiCoO 2 or LiNiO 2 , etc., while the positive electrode is made of a graphitic carbon [1].
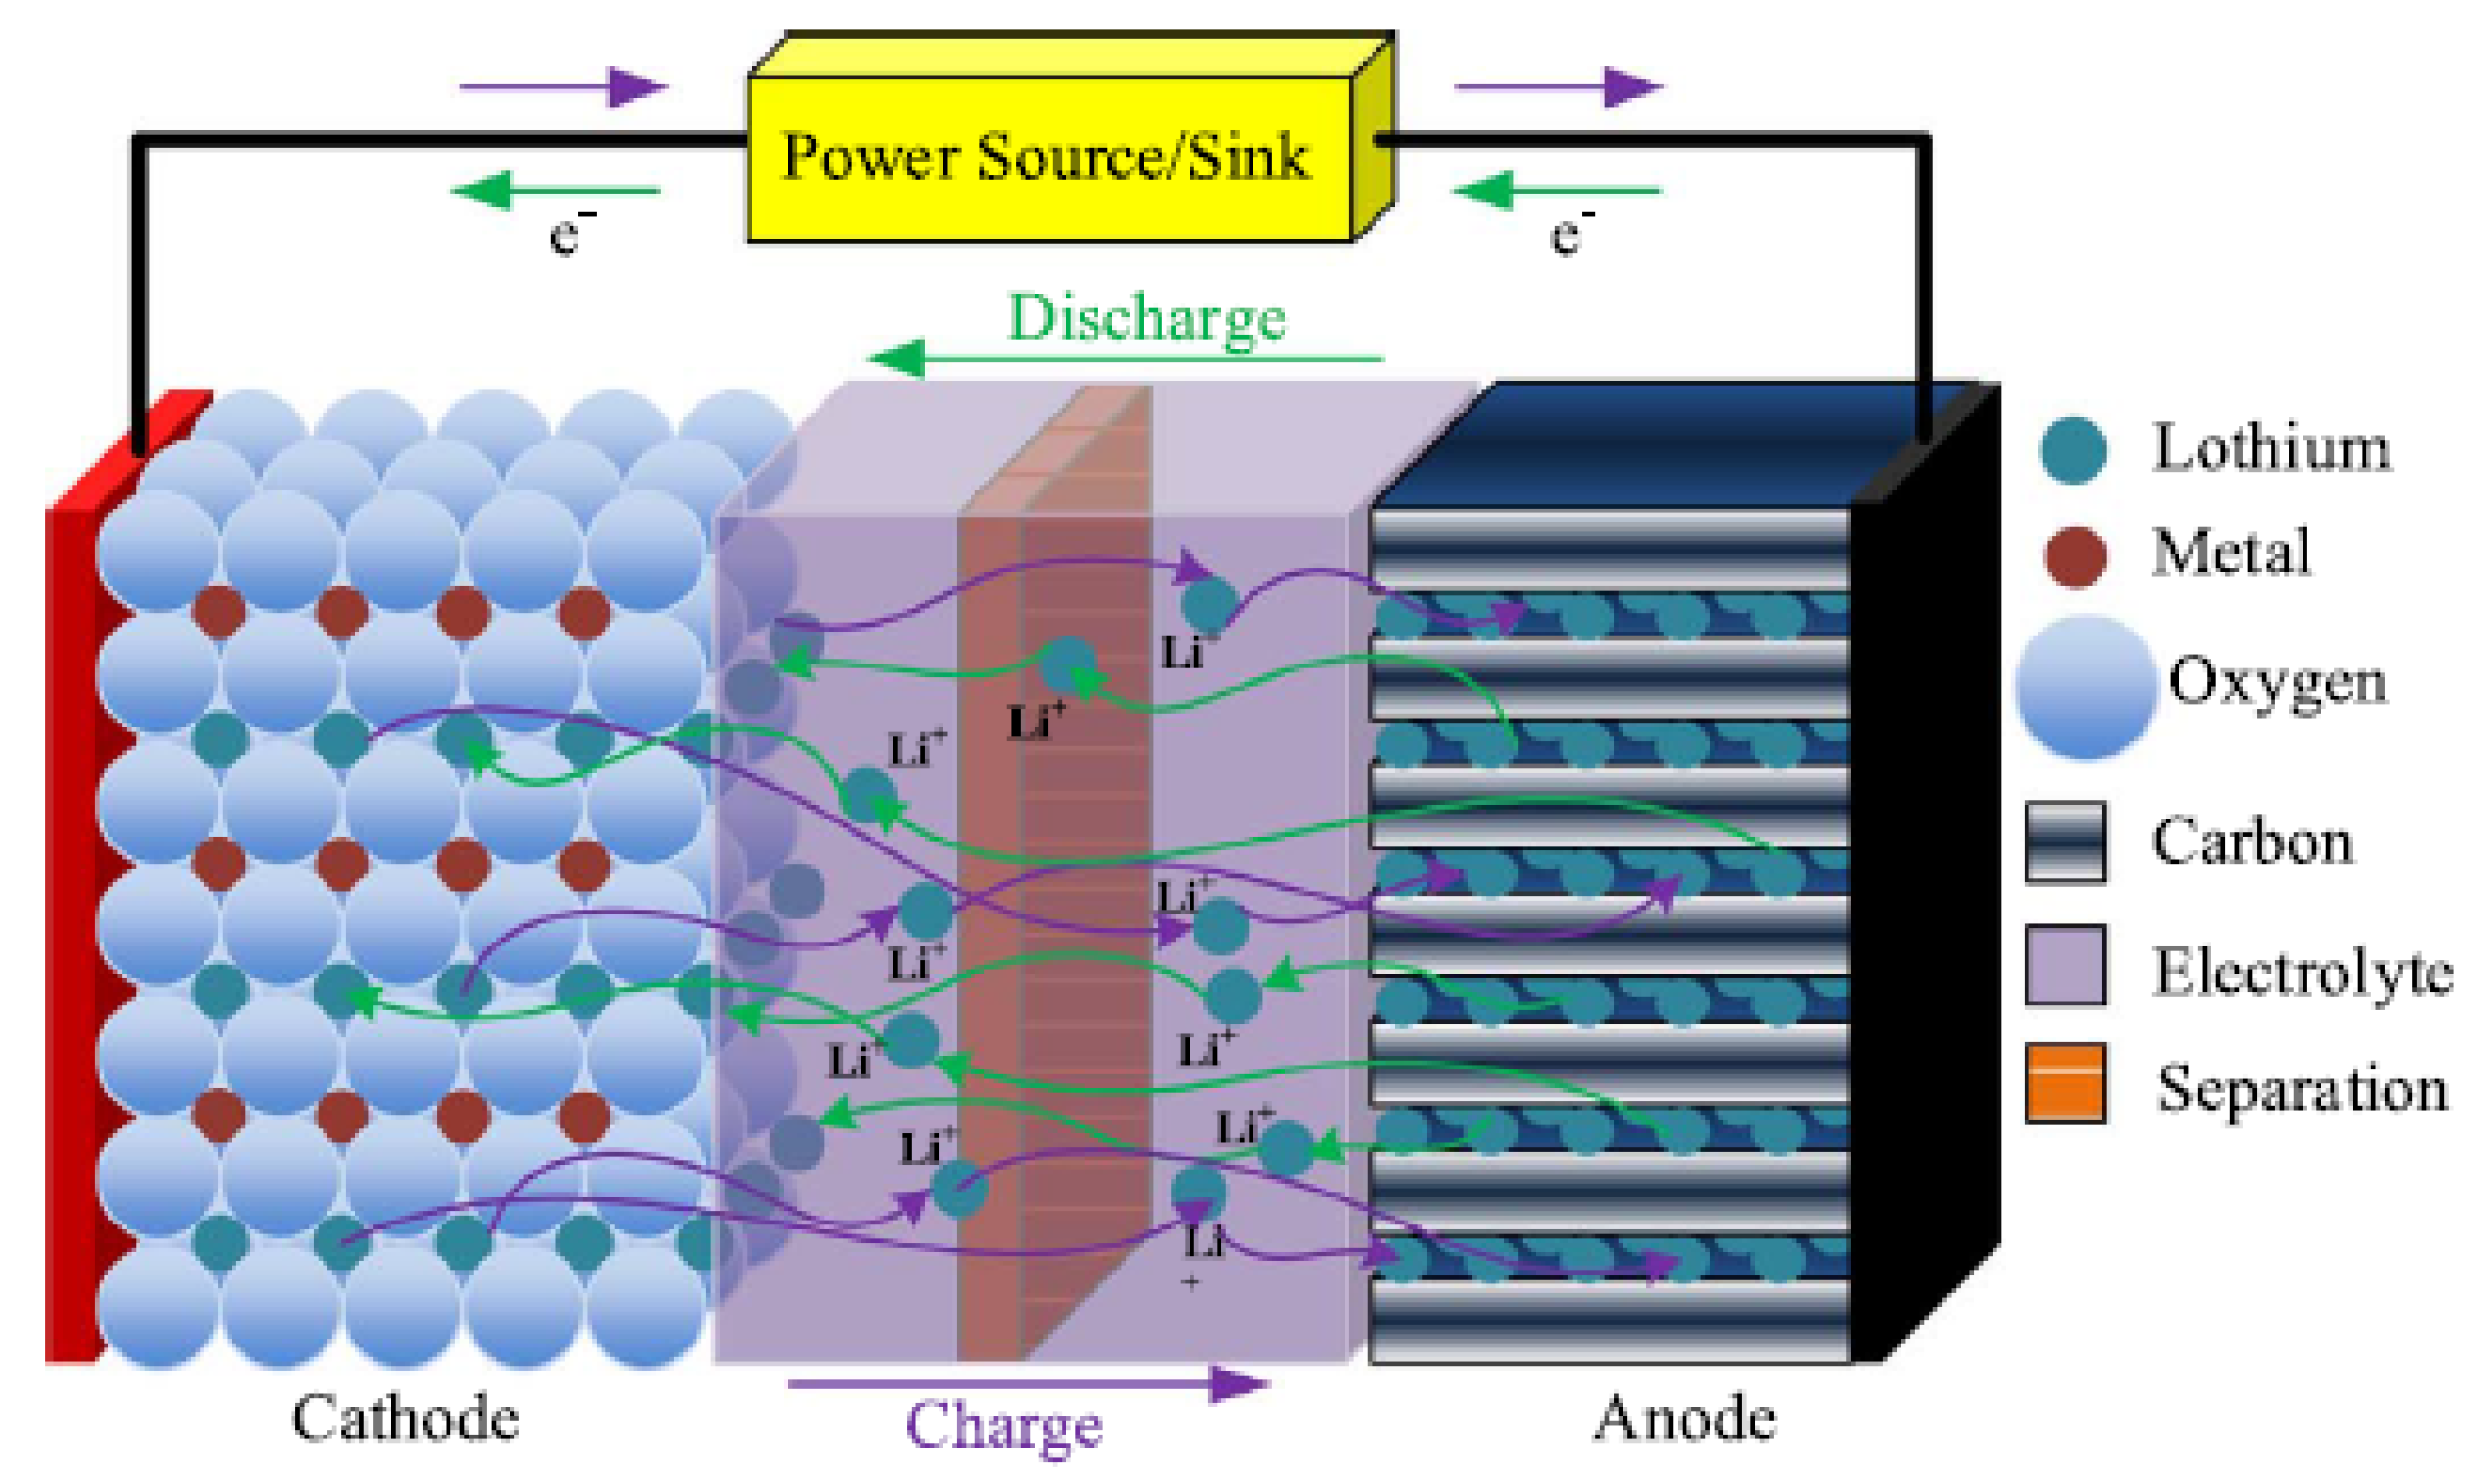
During charging, the lithium atoms in the negative electrode become ions and migrate to the positive electrode (i.e., carbon) where they recombine with external electrons to form the lithium atoms [1,11], as
C + x L i + x e L i x C
and
LiM O 2 L i 1 x M O 2 + x L i + + x e
During discharging, the process is reversed. The battery electrochemistry is illustrated in Figure 4.
As research and development in the technology advances, the energy density has increased from 75–200 Wh/kg, with an increased cycle life of 10,000 cycles [1]. The RTE of the Li-ion batteries is about 100%. This is an important of this technology over other battery technologies. The lithium polymer batteries, on the other hand, have relatively lower efficiency and lifespan [11].

2.5. Flow Batteries

These battery technologies are designed to store energy in the electrolyte solutions—a feature that is opposite to the conventional battery technologies in which the electrodes are used for such a task [1,26,50]. The battery arrangement also includes additional electrolyte that is stored externally in tanks, and is pumped through the cell (or cells) of the reactor [1].
The mode of operation of flow battery technologies is based on reduction-oxidation (redox) reactions of the electrolytes. In the charging state, one electrolyte is oxidized at the positive electrode while the other is reduced at the negative electrode [16]. This way, the electrical energy is converted to chemical energy. The chemical reaction is reversible and it allows the battery to be charged, discharged and recharged as desired.
The power and energy capacities of these battery technologies could be designed independently, i.e., the energy capacity is determined by the amount of electrolyte that is stored in external tanks but the power rating is ascertained through the active area of the cell compartment [26,50,51,52,53]. These technologies have the potential for continuous release of energy at a high rate, with a discharge of up to 10 h [1].
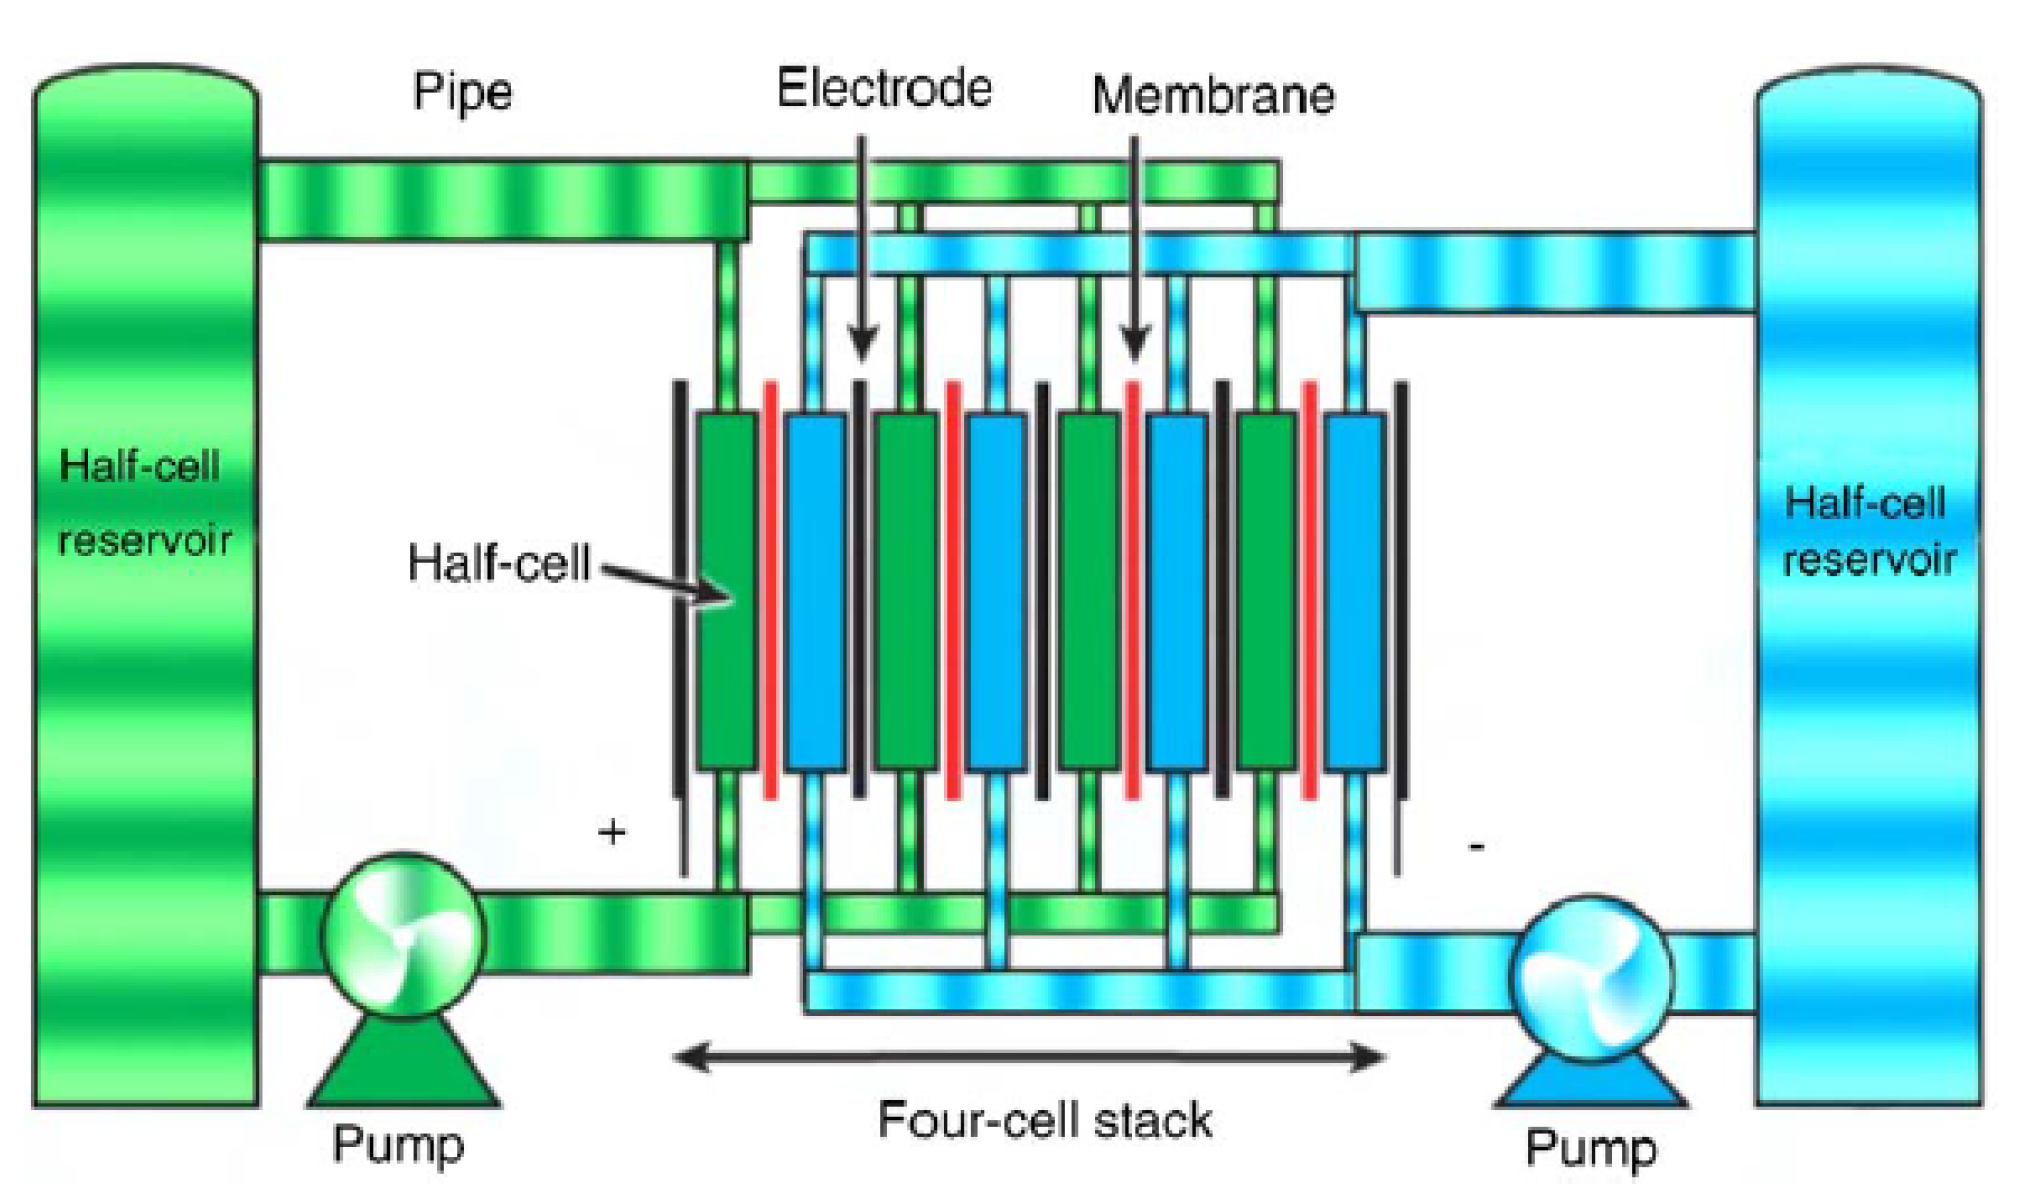
Flow batteries are categorized into two technologies such as redox flow batteries and hybrid flow batteries, depending on if all electro-active materials could be dissolved in the electrolyte [16]. Examples of the redox type are all vanadium (e.g., vanadium redox flow (VRB)), polysulphide bromide (PSB), iron-chromium etc., while the hybrid types are zinc-bromine and zinc-cerium [50]. The schematic diagram of the structure of a flow battery is shown in Figure 5.

2.5.1. Zinc-Bromine

In these battery technologies, two aqueous electrolyte solutions contain the reactive materials made of zinc (Zn) and bromine (Br) elements, which are stored in two external tanks [16]. During the discharge process, the reactive materials combine to form zinc-bromide, and then generate 1.8 V across each of the battery cells [1]. This then increase the Zn 2 + and Br-ion densities in the two electrolyte tanks. However, in the charge state, zinc is deposited as a thin layer on a side of the composite electrode, while bromine is developed as a dilute solution on the other side of the membrane. It then reacts with other agents, i.e., organic amines to develop thick bromine oil, which sinks to the bottom of the electrolytic tank [1]. This is mixed with the remaining electrolyte during discharge. The chemical reactions at the anode and the cathode are described by
2 B r B r 2 ( aq ) + 2 e
and
Z n 2 + + 2 e Zn
respectively [1], while battery structure is illustrated in Figure 6.
The zinc-bromine batteries have a lower RTE and lifespan of ~65–75% and over 2000, respectively, compared to the conventional lead-acid batteries [1,16]. They have an energy density ranging from 30–50 Wh/kg [1]. However, the major problems with ZnBr battery are material corrosion and dendrite formation [16].

2.5.2. Sodium-Nickel Chloride

This technology has been commercially available since about two decades ago [26]. It is otherwise known as Zero Emission Battery Research (ZEBRA) and is also recognized as a high-temperature battery with temperature ranging from 270–350 C [1,26]. In the case of NaNiCl 2 , the nickel chloride is used as the anode instead of sulphur as is the case with NaS. The electrochemistry for ZEBRA is described by
2 NaCl + Ni NiC l 2 + 2 Na
ZEBRA battery technologies can withstand limited overcharge and discharge; they possess better safety characteristics, a higher cell voltage of 2.58 V, compared to the NaS technologies [1]. They have a cycle life of ~2500 and a lifespan ranging from 10–14 years, with a discharge time of seconds to hours and RTE of ~85–90% [55]. However, they possess energy and power densities of ~100–120 Wh/kg and ~150–200 W/kg, respectively, which are better than the values reported for lead-acid technologies.

2.5.3. Vanadium Redox

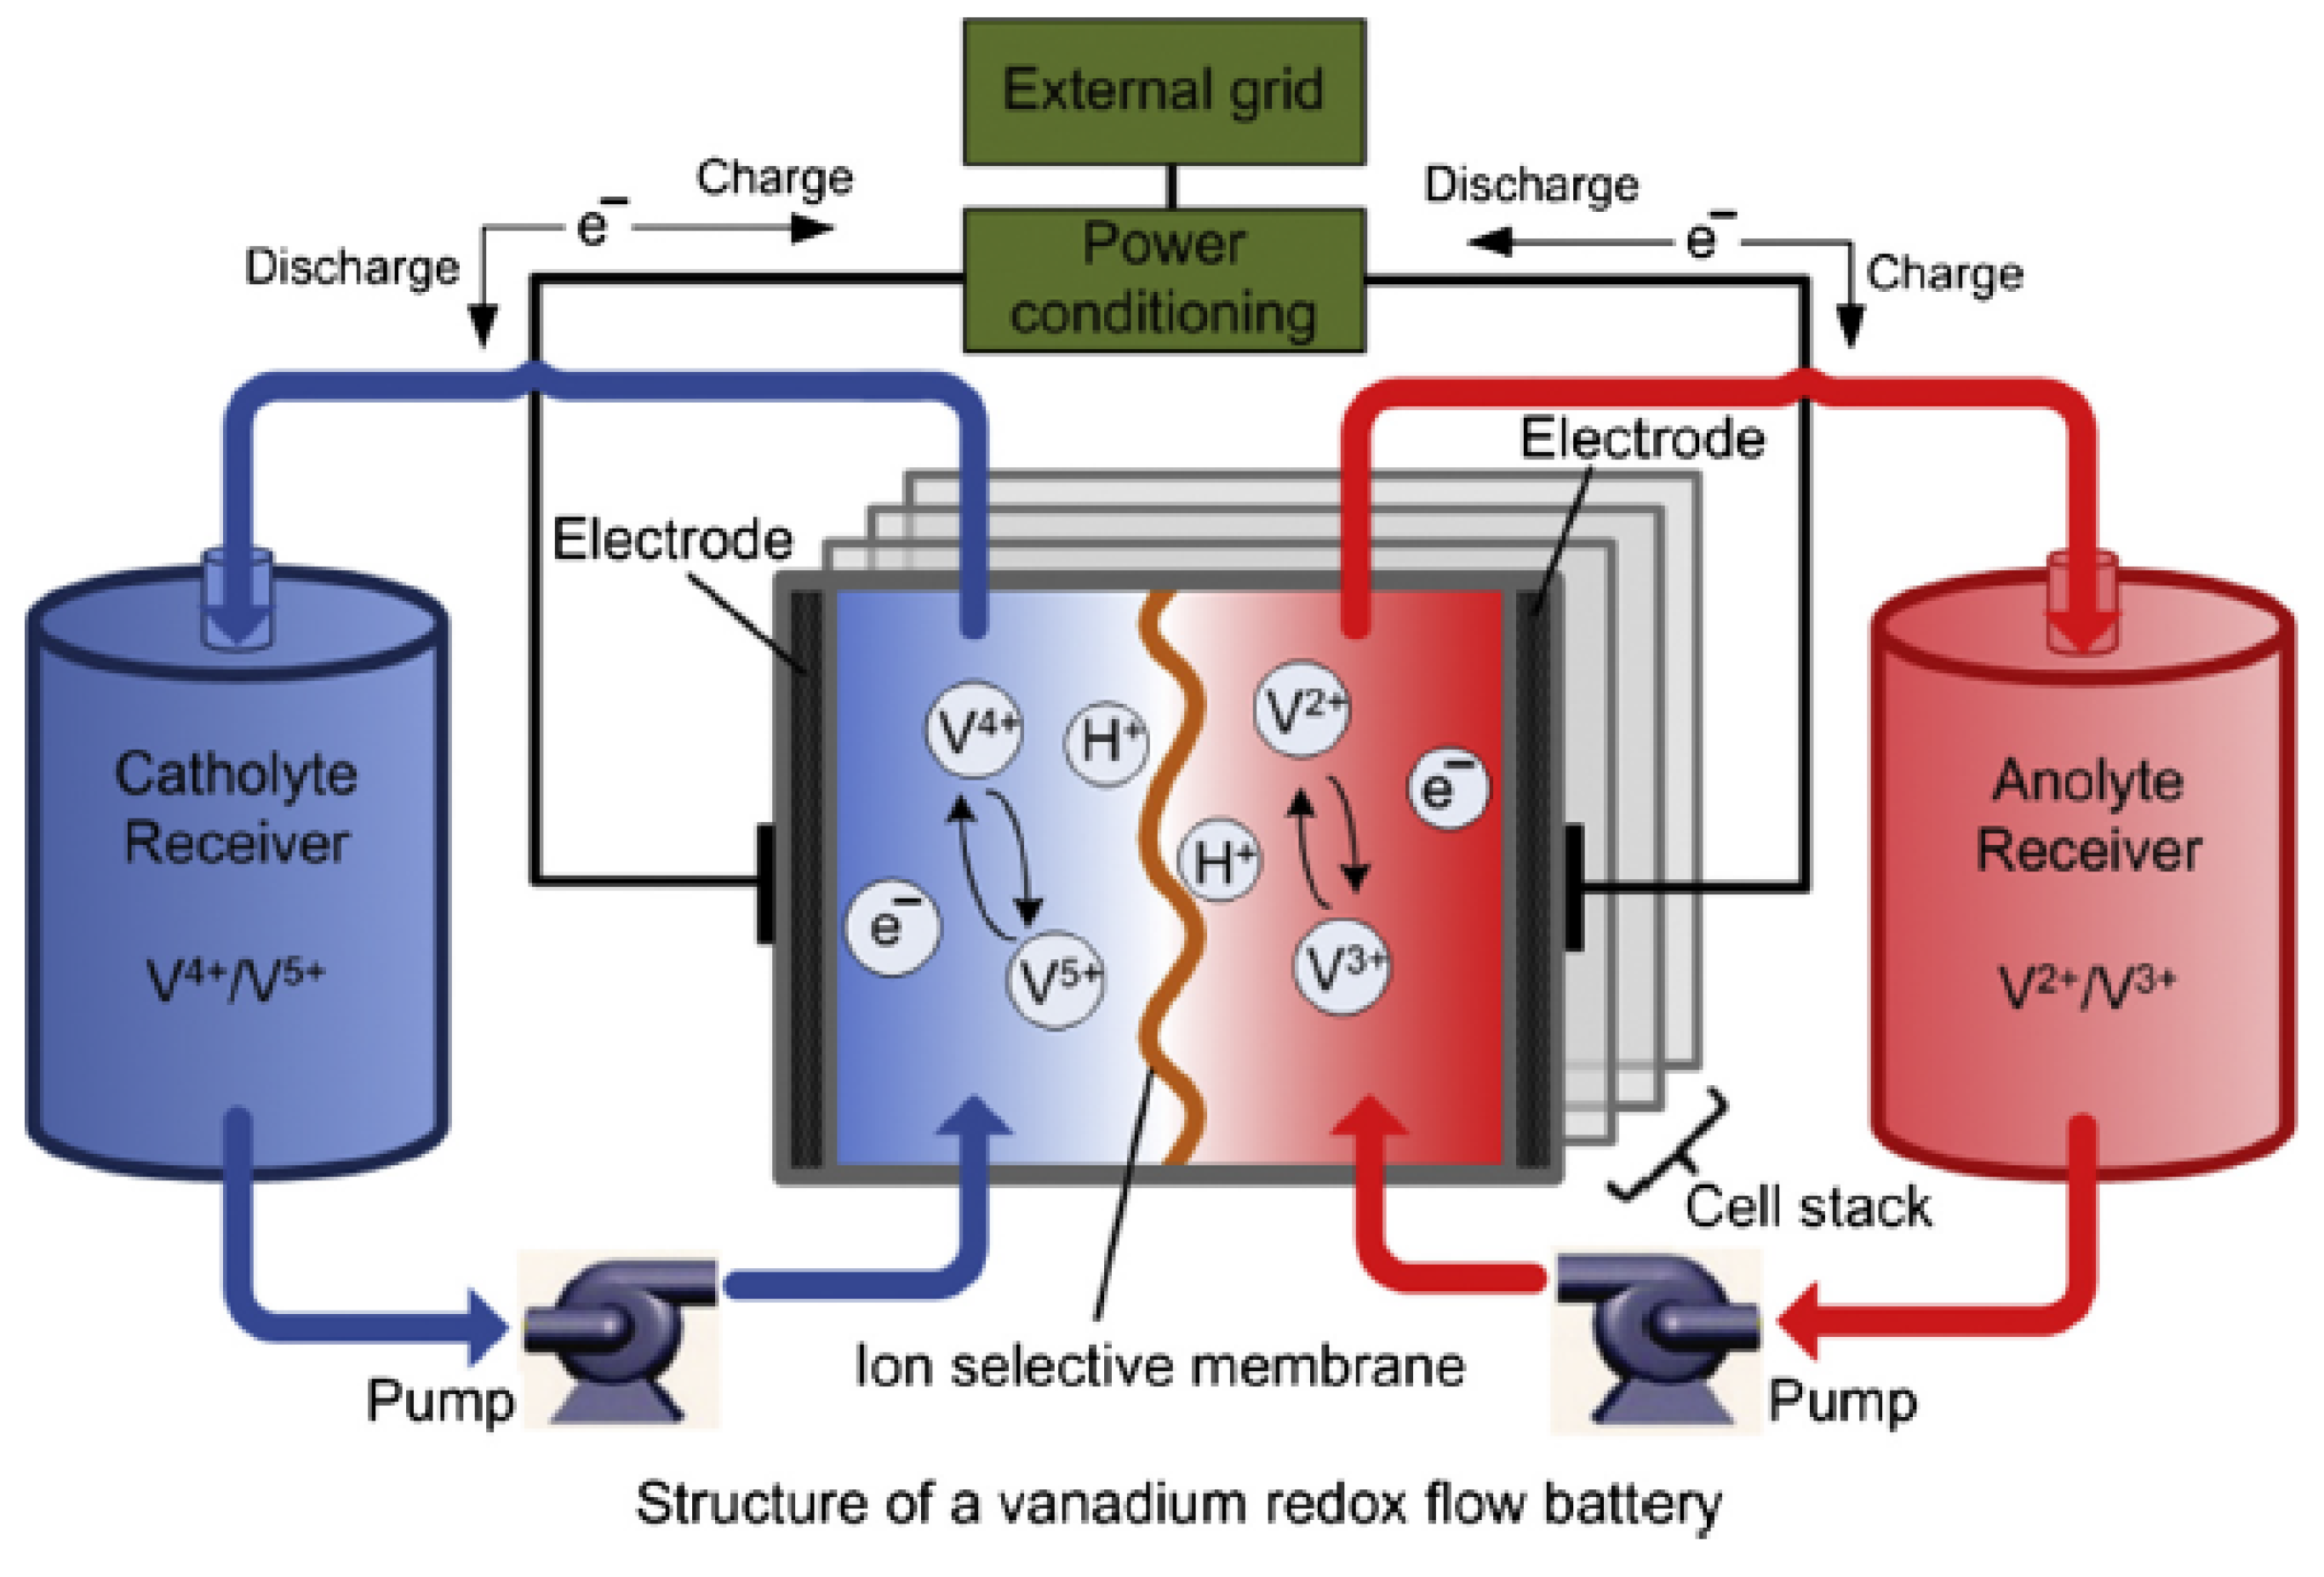
The vanadium redox flow (VRB) is one among the mature flow battery technologies, and it stores energy by using the vanadium redox ions V 2 + /V 3 + and V 4 + /V 5 + in two different electrolytic tanks [1,16,56,57,58]. It uses the vanadium in the four oxidation states, thus, making it to have only one active element in the anolyte and catholyte [16,50]. In the charge/discharge states, the process involves the exchange of H + ions through the selective membrane of the ion, and a cell voltage of 1.4 V is developed in the process [16]. The chemical reactions are described by
V 4 + V 5 + + e
and
V 3 + + e V 2 +
while the structure of VRB is illustrated in Figure 7.
Vanadium redox batteries possess quick responses, even faster than 0.001 s and they have cycle life in the range of 10,000 to over 16,000 cycles [16,29]. They have a RTE of ~85% and can guarantee continuous power with a discharge duration of over 24 h [16]. They have an energy density of 10–30 Wh/kg and lifespan of 5–10 years [1]. They are suitable for enhancing power quality, uninterruptible power supply UPS, forestalling unscheduled power outages, and balancing the intermittent characteristics of renewable energies [16]. However, the major challenges with VRBs are low electrolyte stability and solubility, which results in low energy density, and relatively higher operating cost [1,16].

2.5.4. Polysulphide Bromine

In these batteries, a reversible electrochemical reaction is allowed between two electrolytes (salt solution) viz. sodium bromide and sodium polysulfide, as described in [1]
3 NaBr + N a 2 S 4 2 N a 2 S 2 + NaB r 3
The electrolytes are separated in the cells by a polymer membrane that only allows the migration of positive sodium ions, making the battery to generate ~1.5 V across the membrane [1].
The main advantages of PSB batteries are the abundance and cost-effectiveness of the materials for producing the two electrolytes and their solubility in aqueous electrolyte [16]. They also have a fast response time of around 0.02 s [1,58], and this makes them a suitable technology for power system frequency control and voltage control. They have a lifespan ranging from 10–15 years, and a RTE efficiency of ~75% and they also operate at room temperature [1,16]. However, during the electrochemical reactions, bromine and sodium sulphate crystals are produced and this may result in negative environmental impact [16].

2.6. Comparison of the Battery Technologies

The comparison of the battery energy storage systems is presented in Table 2 and Table 3. This includes the development status of the different technologies, the energy and power capital cost and their environmental influence, advantages and shortcomings.
It is clearly presented that the lead-acid is a mature technology; NaS, NiCd and ZEBRA have a commercial status, while that of VRB is early commercialization. Li-ion, ZnBr and the VRB are also developed, while PSB is currently still in its development stage. Apart from these technologies, there are some new technologies that are currently being researched and developed by some laboratories/Scientists around the world. These will be discussed later in this study.
The information presented in Table 2 further demonstrates that the lead-acid is not only a mature technology, but also one of the cheapest battery storage option of the all the technologies presented. Its energy and power capital costs range from 200–400 ($/kWh) and 300–600 ($/kW), compared to the values presented for the other technologies. It also obvious that the ZEBRA presents cost effective power and energy solutions.
Though the lead-acid battery is mature and presents a cheap energy storage option, it produces toxic remains, which has a negative environmental influence. Furthermore, the NiCd, VRB and PSB technologies are also toxic and they have a negative environmental influence. One of the possible measures to address issue of the negative effect is by using an effective recycling system [1,16]. Such a measure will minimize the cumulative environmental impact.

3. Grid-Independent PV System

This study uses an existing grid-independent solar PV energy generation system presented in [66], as a case study. The analysis of a silicon-based 1.5 kW PV energy system was discussed in this previous work, focusing on off-grid houses in six different locations in Nigeria. The research considered six remote houses, one from each of the Nigeria’s geo-political zones.
However, while the life cycle impact of the 1.5 kW solar PV array was considered, the study did not examine the life cycle impact of the battery cells. Therefore, this current research intends to provide a better evaluation of the proposed PV energy system by including the impact of the battery storage system. The results are expected to provide a basis for better understanding of the percentage contribution of the impact of batteries in a renewable energy system application (e.g., a solar PV system in this case).
Importantly, there is currently, no solar PV cell production plant in Nigeria. Even the existing 7.5 MW NASENI PV panel manufacturing plant in the country sources its PV cells from other countries [67]. Therefore, the PV cells/modules that are used in the country are imported mostly from other countries, China, US and Europe (especially China). In this case, the LCER for China [68] was used to analyze the impact of the PV system in Nigeria. Though the results of the analysis are approximate, they are expected to aid the understanding of the energy flow and life-cycle environmental impact of solar PV system. A similar approach is used in this study for the battery impact analysis, as there is a dearth of battery manufacturing plants and its life cycle assessment (LCA) inventory in the country.

3.1. Brief Background

The locations used are typical remote communities with no access to the national grid. However, they experience a good sunshine, which can make solar PV systems a suitable energy option for the intended users. Therefore, the solar energy resources can be useful for addressing the prevailing challenge of electricity shortage in the communities.
The average peak sun hour (PSH) of Nigeria’s six geo-political zones is shown in Figure 8, see [66], which ranges from 3.84–6.8 and 3.45–5.98 for the northern and southern regions, respectively [69]. These zones are North-east (NE), North-west (NW), North-central (NC), South-east (SE), South-south (SS) and the South-west (SW). The PSH represents the average solar irradiation of these locations in kWh/m 2 /d [70]. It is, therefore, evident that the country’s northern region has a relatively higher solar energy resource.
The load profiles of the houses for the six locations are shown in Figure 9. There is a disparity in the demand profiles even though the same PV capacity of 1.5 kW are considered for all the locations, while the values of the peak sun hour differ. The demand ranges from 4.15–6.29 kWh/day. The energy consumption patterns of the houses are similar because the same category of people is considered all over the zones, i.e., the low-income occupants.

3.2. Methodology

The life cycle impact of the off-grid solar PV arrays has been discussed in the previous paper without considering the impact of the balance of system (BOS)-battery and inverter [66]. However, in this new study, the impact of the battery and the inverter will be assessed. The study uses the life cycle emission rate (LCER) reported in [69,71] to estimate the total impact of the battery and the inverter systems.

3.2.1. Life Cycle Emissions

The solar PV system’s life cycle GHG emissions are evaluated as an equivalent of carbon dioxide (CO 2 ) over a 100-year integrated time frame, based on the most recent GWP factors presented by the Intergovernmental Panel on Climate Change (IPCC) [66,68,72,73,74,75,76]. The major emissions include the CO 2 , methane (CH 4 ), Dinitrogen monoxide (N 2 O) and chlorofluorocarbons (CFC), with a corresponding GWP of 1, 25, 298 and 4750–14400 [68]. The carbon emissions are calculated as
C E = j G H G μ x C E x Y E O
based on the mentioned information, where C E represents the solar PV’s life cycle emissions; index x stands for the species of emissions that belong to the specified GHG family; μ x represents the GWP factor corresponding to the species of emissions x. C E x represents the cumulative emissions of species x over the PV system’s life cycle, which is the addition of the direct and the indirect emissions [66,67,68,77,78,79]. The Y E O is the PV system’s yearly energy output. The LCER is measured in g CO 2 -eq./kWh, while the total GHG impact of a system/component is measured in kg CO 2 -eq.
The existing LCA data published in [77] shows that the life cycle GHG emissions of crystalline PV range from 50–100 g CO 2 -eq./kWh. LCERs of 37.3 and 72.2 g CO 2 -eq./kWh have been published for Europe and China, respectively [68], while the values of 35–55 g CO 2 -eq./kWh were published [80]. The emission rate of 70 g CO 2 -eq./kWh has also been published [81,82], while the value of 31 g CO 2 -eq./kWh was presented in [82].
The above-mentioned values were reported in the literature for the PV aspect of the energy system. However, a part of the aims of this paper is to assess the impact of battery in the off-grid PV system. Therefore, we use the LCER of 24250 g CO 2 -eq./kWh, respectively, for the lead acid battery, while the corresponding value of 26,300 g CO 2 -eq./kW is used for the inverter based on the studies published in [69,71]. Again, we make use of these values from the literature because of the lack of LCA data/inventory in Nigeria for PV, battery and inverter. We depend on the values to achieve approximate assessment of the PV/battery system that can aid the understanding of the life cycle impact of an off-grid PV system, rather than the current assumptions in the country that solar PV systems are 100% carbon neutral. The yearly energy output of the PV system in kWh can be estimated by [76]:
Y E O = S I R R A η P V P R
where S I R R , A, η P V , and P R represent the solar irradiation (kWh/m 2 /yr), area of the PV array (m 2 ), PV module efficiency (%), and performance ratio (%), respectively.

3.2.2. Battery Capacity

This study uses the Hybrid Optimisation Model for Electric Renewables (HOMER) tool to simulate the battery bank. The tool simulates the operation of an energy system by making energy balance assessments for each of the 8760 h in a year [83]. For each hour, it compares the energy generation and the demand in the hour to the energy that the system is capable of supplying at that given hour, and estimates the flows of energy to and from each component of the energy generation system. HOMER is a commercially available tool for simulating microgrid systems and components such as PV, wind generator, hydro generator, biomass, battery bank, converters, electrolyzer etc. After simulating the possible system configurations, the tool helps to display a list of configurations, sorted by the life cycle cost for comparing the system design options and decision making.
The battery bank size, energy demand and the autonomy are related by the standard expression represented by [68,76,77,82,83,84,85]:
A D D d = N b V n Q n η b 1 q min 100 ,
where A D , D d , N b , V n , Q n , η b , and q min are the battery autonomy, daily demand (kWh), number of cells in the battery bank, nominal voltage of a single battery cell (V), nominal capacity of a single cell (Ah), battery round-trip efficiency (%), and the minimum battery state of charge (%), respectively. Since the minimum battery state of charge corresponds to the maximum depth of discharge (DoD), Equation (3) can be rewritten as follows, also considering a nominal voltage, V n for the battery bank.
A D D d = N b V n Q n η b D o D .
The battery bank size in Ah, in this case, is the product of N b and Q n , which can be calculated by:
N b Q n = A D D d η b V n D o D
The number of battery cells is an important parameter in this study as it affects both the cost and reliability of the system.

3.2.3. Optimum Battery Capacity

In HOMER simulation environment, the battery charge power that corresponds to the maximum charge rate (MCR) by:
P m c r = ( 1 e α c Δ t ) ( Q max Q ) Δ t ,
where P m c r , α c , Δ t , Q max , and Q represent the battery charge power at MCR (kW), battery’s MCR (A/Ah), length of the time step (hr), battery bank’s total capacity (kWh) and battery bank’s total energy at the beginning of the time step (kWh), respectively.
The maximum charge power of the battery bank that corresponds to the maximum charge current (MCC) by:
P m c c = N b I max V n 1000 ,
where P m c c and I max stand for the maximum charge power at MCC (kW) and battery bank’s MCC (A).
The maximum battery charge power is then equated to the minimum of the three parameters, assuming each applies after the charging losses as
P max = min { P k b m , P m c r , P m c c } η b ,
where P max and P k b m represent the maximum battery charge power (kW) and the maximum amount of power that can be absorbed by a battery bank each time step according to the kinetic battery model (KBM) principle [83].
This paper evaluates the reliability and the cost of energy (COE) as means to select the optimal battery technology. The battery is crucial to the reliability of off-grid solar electricity systems. The reliability is examined in terms of the LOPP, which is estimated by [86]:
L O P P = t = 1 8760 D u d t = 1 8760 D t d
where D u d and D t d are the unmet demand and the total demand over the year.
The cost could be divided into fixed and non-fixed costs. The fixed cost in this case, includes the initial and the installation costs of the battery bank, while the non-fixed costs, otherwise referred to the variable costs include the replacement and the maintenance costs over the project life. The costs or cash flows over the specified project life are estimated in terms of present value using the present value factor [85,87,88]:
P v = F v 1 + i 1 + d n
where P v , F v , i, d, and n represent the present value, future value in the nth period, inflation rate (%), interest rate (%) and number of years or periods. The life cycle cost ( L c ) is estimated by using the capital recovery factor ( C r f ) as
C r f = i ( i + 1 ) n i ( i + 1 ) n 1 ,
while the COE is calculated by
C O E = C r f L c D t d .
In practical terms, there is usually a trade-off between the reliability of energy supply and the cost. This is because achieving the highest system reliability may not be economically feasible, but this paper shows with evidence how these two critical factors can inform battery selection.
The life span of the battery bank is determined by [85]:
L S = C C 365 ,
where L S and C C represent the battery’s lifespan (in years) and cycle, respectively. The capacity of the PV inverter is estimated by [70]:
S I n v = 1 . 25 L t ,
where S I n v and L t represent the inverter size and the total load, respectively. Table 4 presents the input parameters.

4. Result and Discussion

4.1. PV Energy Output

The yearly output of the PV array is presented in Figure 10, which has previously been shown in [66]. We include this result in this current paper to provide the information necessary to understand the total impact of the proposed grid-independent PV system. The convention in photovoltaic engineering is that the energy generated by the PV array is used to charge the battery bank, while the users receive an energy supply from the inverter [5]. Therefore, even though this paper majorly focuses on the review of battery, optimal battery sizing and technology selection strategy and the evaluation of their impact in an off-grid PV system, it is also necessary to mention other main components that works with the battery to supply energy to the users. The 1.5 kW PV array consists of six units of 250 W NASENI solar module [67], which were locally assembled and fabricated in Nigeria.
The energy produced by the PV array in the NE, NW, NC, SE, SS and SW locations are about 446, 434, 395, 358, 299 and 382 kWh/yr, respectively. It is obvious that the electricity produced by the PV systems follow the same trend as the locations’ solar irradiation. This is because energy generation by a PV system is a function of the irradiation of the site [74], therefore, the disparity in the energy produced by the same 1.5 kW PV in the locations is expected because of the difference in the solar energy potential.

4.2. Size of the Battery Banks and the Inverter

The sizes of the battery banks in the locations are presented in Figure 11. The result demonstrates that the battery capacity follows the users’ demand trend. The size of the battery for the systems at the NE, NW, NC, SE, SS and SW locations are about 925, 919, 620, 635, 611 and 794 Ah, respectively.
The battery sizing is guided by IEEE standard [5] and the Trojan battery design procedure [85]. The specifications of the battery cells used for the application are shown in Table 5. The types of battery cells are obtained from the Hybrid Optimisation Model for Electric Renewables (HOMER) simulation tool’s library [83], while the configuration and the number of cells required are determined based on Ampere-hour (Ah) capacity needed for the application.
A maximum DoD of 80% is commonly used for grid-connected energy systems, while a maximum DoD of 50% is recommended for off-grid systems [5,85]. Therefore, the battery sizing analysis in this paper has been based on a maximum DoD of 50% for the off-grid PV system considered. Three different battery technologies were selected from the HOMER library for the application.
However, there is the need to provide analysis to determine the optimal technology for each case or location. These lead-acid flooded battery technologies include Surette S 460, (6V 460 Ah) [83], USB US-305 (6V 305 Ah) [89], and CG2 800 (2V 800 Ah) [90], and as referred to as technology 1, technology 2, and technology 3, respectively, in the subsequent discussion. Again, the lead-acid battery has been selected for the analysis because of its commercial maturity and cost-effectiveness compared to other systems [4,25], and it is the most widely used battery storage technology for off-grid applications around [91].

4.2.1. Technology Selection for NE Location

The results shown in Figure 12a–c reveal the relationship between the number of batteries, LOPP and the COE for the system in the NE location. The number of battery, apart from being a function of the battery size, it determines the optimum point for the two critical factors—LOPP and COE. Such an approach provides an opportunity for the designer to decide on which level of reliability and cost that the energy system will be based.
The least number of cells in Figure 12a is 8, which corresponds to LOPP of 0.15 and COE of 0.167$/kWh, while the highest number of cells is 240 with the corresponding values of 0.02 and 4.312$/kWh for the LOPP and the COE. The LOPPs of 0.15 and 0.02 implies that the users’ demand will not be met for 1314 and 175 h in the year, translating to energy loss for 55 and 7 days in the year.
The lowest number of cells in the results presented in Figure 12b is 8 and the values of LOPP and COE are 0.163 and 0.214$/kWh, while the values of LOPP and COE for 268 cells are 0.03 and 4.198$/kWh, respectively. The LOPPs of 0.163 and 0.03 corresponds to energy loss for 1428 and 263 h, i.e., 59 and 11 days, respectively.
The least number of cells in the results presented in Figure 12c is 12 and the values of LOPP and COE are 0.12 and 0.185$/kWh, while the values of LOPP and COE for 252 cells are 0 and 3.424$/kWh, respectively. The LOPP of 0.12 corresponds to energy loss of 1051 h, i.e., 44 days.
The results demonstrate that the LOPP decreases as the number of battery cells increases, while the COE increases as the number of battery cells increases. Achieving the highest reliability is associated with highest COE, while the least reliability incurs relatively low COE. What this implies is that it will be highly expensive to provide a 24 h electricity supply to the users, but they could use conventional generators for the shortfall. The configuration with the minimum LOPP or COE is considered in this study as the optimum option.
Therefore, for the NE case, the technology 1 is the optimum option in terms of cost as it has the least COE for the minimum number of cells of 8, while technology 3 is the optimum option in terms of reliability as it gives the lowest LOPP for the minimum number of battery cells of 12 for the given demand in Figure 9. The results further demonstrate that technology 3 gives the optimum reliability and cost when the number of battery cells is 252, compared to the other two technologies.

4.2.2. Technology Selection for NW Location

The least number of cells in Figure 13a is 8, which corresponds to LOPP of 0.16 and COE of 0.169$/kWh, while the highest number of cells is 256 with the corresponding values of 0.01 and 4.595$/kWh for the LOPP and the COE. The LOPPs of 0.16 and 0.01 implies that the users’ demand is not met for 1402 and 88 h in the year, translating to energy loss for 58 and 4 days in the year.
The least number of cells in the results presented in Figure 13b is 8 and the values of LOPP and COE are 0.165 and 0.214$/kWh, while the values of LOPP and COE for 272 cells are 0.03 and 4.356$/kWh, respectively. The LOPPs of 0.165 and 0.03 correspond to energy loss of 1445 and 263 h, i.e., 60 and 11days, respectively.
The lowest number of cells in the results presented in Figure 13c is 12 and the values of LOPP and COE are 0.14 and 0.192$/kWh, while the values of LOPP and COE for 300 cells are 0 and 4.101$/kWh, respectively. The LOPP of 0.14 corresponds to energy loss of 1226, i.e., 51 days.
The results are similar to those of NE location. They also reveal that the LOPP decreases as the number of battery cells increases, while the COE increases as the number of battery cells increases. The configuration with the minimum LOPP or COE is also considered to determine the optimum option(s). Therefore, for the NW case, the technology 1 is the optimum option in terms of cost as it has the least COE for the minimum number of cells of 8, while technology 3 is the optimum option in terms of reliability as it gives the lowest LOPP for the minimum number of battery cells of 12 for the specified demand in Figure 9. The results further show that technology 3 gives the optimum reliability and cost when the number of battery cells is 300 compared to the other technologies.

4.2.3. Technology Selection for NC Location

The least number of cells in Figure 14a is 4, which corresponds to LOPP of 0.08 and COE of 0.155$/kWh, while the highest number of cells is 24 with the corresponding values of 0 and 0.634$/kWh for the LOPP and the COE. The LOPP of 0.08 implies that the users’ demand is not met for 701 h in the year, translating to energy loss for 29 days in the year.
The least number of cells in the results presented in Figure 14b is 4 and the values of LOPP and COE are 0.13 and 0.205$/kWh, while the values of LOPP and COE for 32 cells are 0 and 0.718$/kWh, respectively. The LOPP of 0.13 corresponds to an energy loss for 1139 h, i.e. 47 days.
The lowest number of cells in the results presented in Figure 14c is 12 and the values of LOPP and COE are 0.01 and 0.247$/kWh, while the values of LOPP and COE for 24 cells are 0 and 0.408$/kWh, respectively. The LOPP of 0.01 corresponds to energy loss for 88 h, i.e., about 4 days.
The LOPP decreases as the number of battery cells increases, while the COE increases as the number of battery cells increases. For the NC case, the technology 1 is the optimum option in terms of cost as it has the least COE for the minimum number of cells of 4, while technology 3 is the optimum option in terms of reliability as it gives the lowest LOPP for the minimum number of battery cells of 12 for the specified demand in Figure 9. The results further reveal that technology 3 gives the optimum reliability and cost when the number of battery cells is 24 compared to the other technologies.

4.2.4. Technology Selection for SE Location

The least number of cells in Figure 15a is 8, which corresponds to LOPP of 0.06 and COE of 0.218$/kWh, while the highest number of cells is 48 with the corresponding values of 0 and 1.237$/kWh for the LOPP and the COE. The LOPP of 0.06 implies that the electricity demand is unmet for 526 h in the year, translating to energy loss for 22 days in the year.
The least number of cells in the results presented in Figure 15b is 8 and the values of LOPP and COE are 0.08 and 0.242$/kWh, while the values of LOPP and COE for 68 cells are 0 and 1.486$/kWh, respectively. The LOPP of 0.08 corresponds to energy loss for 701 h, i.e., 29 days.
The lowest number of cells in the results presented in Figure 15c is 12 and the values of LOPP and COE are 0.03 and 0.246$/kWh, while the values of LOPP and COE for 48 cells are 0 and 0.952$/kWh, respectively. The LOPP of 0.03 corresponds to energy loss for 263 h, i.e., about 11 days.
The LOPP decreases as the number of battery cells increases, while the COE increases as the number of battery cells increases. For the SE case, the technology 1 is the optimum option in terms of cost as it has the least COE for the minimum number of cells of 8, while technology 3 is the optimum option in terms of reliability as it gives the lowest LOPP for the minimum number of battery cells of 12 for the specified demand in Figure 9. The results further demonstrate that technology 3 gives the optimum reliability and cost when the number of battery cells is 48 compared to the other technologies.

4.2.5. Technology Selection for SS Location

The least number of cells in Figure 16a is 8, which corresponds to LOPP of 0.06 and COE of 0.229$/kWh, while the highest number of cells is 52 with the corresponding values of 0 and 1.394$/kWh for the LOPP and the COE. The LOPP of 0.06 means that the energy demand is unmet for 526 h in the year, translating to energy loss for 22 days in the year.
The least number of cells in the results presented in Figure 16b is 8 and the values of LOPP and COE are 0.08 and 0.242$/kWh, while the values of LOPP and COE for 68 cells are 0 and 1.486$/kWh, respectively. The LOPP of 0.08 corresponds to an energy loss for 701 h, i.e., 29 days.
The lowest number of cells in the results presented in Figure 16c is 12 and the values of LOPP and COE are 0.03 and 0.256$/kWh, while the values of LOPP and COE for 48 cells are 0 and 0.982$/kWh, respectively. The LOPP of 0.03 corresponds to energy loss for 263 h, i.e., about 11 days.
For the SS case, the technology 1 is the optimum option in terms of cost as it has the least COE for the minimum number of cells of 8, while technology 3 is the optimum option in terms of reliability as it gives the lowest LOPP for the minimum number of battery cells of 12 for the respective energy demand in Figure 9. The results further show that technology 3 gives the optimum reliability and cost when the number of battery cells is 48 compared to the other technologies.

4.2.6. Technology Selection for SW Location

The least number of cells in Figure 17a is 8, which corresponds to LOPP of 0.15 and COE of 0.195$/kWh, while the highest number of cells is 240 with the corresponding values of 0 and 4.922$/kWh for the LOPP and the COE. The LOPP of 0.15 means that the energy demand is unmet for 1314 h in the year, translating to energy loss for 55 days in the year.
The least number of cells in the results presented in Figure 17b is 8 and the values of LOPP and COE are 0.165 and 0.224$/kWh, while the values of LOPP and COE for 284 cells are 0.015 and 5.061$/kWh, respectively. The LOPPs of 0.165 and 0.015 correspond to energy loss for 1445 and 131 h, i.e., 60 and >6 days, respectively.
The lowest number of cells in the results presented in Figure 17c is 12 and the values of LOPP and COE are 0.12 and 0.217$/kWh, while the values of LOPP and COE for 216 cells are 0 and 3.43$/kWh, respectively. The LOPP of 0.12 corresponds to energy loss for 1051 h, i.e., about 44 days.
For the SW case, the technology 1 is the optimum option in terms of cost as it has the least COE for the minimum number of cells of 8, while technology 3 is the optimum option in terms of reliability as it gives the lowest LOPP for the minimum number of battery cells of 12 for the respective energy demand in Figure 9. The results further show that technology 3 gives the optimum reliability and cost when the number of battery cells is 216 compared to the other technologies.
The selected battery sizes and the required number of cells are shown in Table 5. The cells are connected in series to get the required voltage, while they are stringed to get the required ampere-hour capacity. The same battery specification has been used for the systems in NE and NW; also, other type of the same specification is used for NC, SE and SS because of the proximity in the Ah capacity based on the aforementioned analysis and selection strategy.
The cycle and DoD characteristics of the selected batteries are presented in Figure 18, Figure 19 and Figure 20. The cycles that correspond to the DoD of 0.5 are 1450, 1450, 1150, 1150, 1150 and 1650 for the sites. These are presented in Figure 21, including the lifespan of the battery cells. The battery lifespans are 3.97, 3.97, 3.15, 3.15, 3.15, 3.15 and 4.52 for the specified locations.
The peak load for the locations ranges from 0.284–0.430 kW, so a 1 kW inverter system is selected for the application.

4.3. Impact of the PV Array Only

The lifecycle GHG emissions of the 1.5 kW PV array for the locations as presented in the previous study [66] range from 1907 to 5819 kg CO 2 -eq. A project lifetime of 25 years has been assumed for the analysis and the detailed values are shown on Table 6.

4.4. Impact of the PV Array with Battery and Inverter

The environmental impact of the components of the grid-independent PV systems in all the locations is summarised in Table 6, while Figure 22 shows the contributions by the systems in different locations. The lower and the higher GHG values for the PV are based on the two input LCERs of 37.3 and 72.2 g CO 2 -eq. from the literature [68]. It is observed that the battery bank has GHG emissions impact ranging from about 36–54% in the system. The number of replacements of the Surette S 460, USB US-305, and CG2 800 cells is 5, 6, and 4, respectively, at a DoD of 50%, while that of the inverter is 2. Though the PV electricity system requires relatively smaller battery sizes for the locations, the impact is significant because of relatively shorter life and the frequent replacements of the battery cells over the system’s project life of 25 years.
The analysis presented above is based on a DoD of 50%. In the operation of batteries, it is possible to have DoD> 50% because of the increased users’ energy consumption. Therefore, this study assesses the effect of a higher DoD on the GHG impact by considering new DoD of 65 and 80%. The cycling capacities of the batteries in the location in this situation are 1300, 1300, 1035, 1035, 1035 and 1285 for the DoD of 65%, while the values obtained for the DoD of 80% are 875, 875, 675, 675, 675 and 850, respectively. These values are lower compared to the initial values of 1450, 1450, 1150, 1150, 1150 and 1650 for the DoD of 50%. The results presented in Figure 23 reveal that the increased DoD leads to an increase in the battery GHG impact. The new battery impacts range from 2961–3364 kg CO 2 -eq. and 4160–4844 kg CO 2 -eq.
Furthermore, the analysis presented in Table 6 is based on the battery DoD of 50%. Therefore, the percentage impact of the batteries for DoD of 65% and 80% is about 36–61% and 45–68%, respectively, with the corresponding PV impacts of about 39–63% and 31–54%.
The results of the battery GHG impact can be compared with the values of about 11% and 86% reported in the literature [73] for PV array and battery components of a Solar Home System (SHS). The other values obtained by the same author are about 18% and 75%, respectively. These demonstrate that the battery system has a significant environmental impact in a solar PV system because of the relatively short lifespan of the battery cells.

4.5. Strategy to Minimize Battery Impact

The impact analysis presented in this study with reference to the literature has established that batteries have a significant environmental impact in an off-grid PV system. It is also necessary to consider the possible strategies to minimize this impact, to contribute to the achievement of the desired environmental sustainability in the future.
Making efforts to lengthen the battery lifetime, for instance by improving the charge/discharge control system and educating the users on battery maintenance and management [73], will be useful for achieving decreased environmental impacts. Based on our field experience, we have found that several energy users within the remote communities in Nigeria do not understand how to maintain battery banks. The reason is that it is a common practice by politicians to distribute renewable energy systems, especially the community-based PV water pumping and street lighting systems, to communities mainly for campaigning purposes without any plan to sustain the continuous operation of such systems. The users consider this as a donation and do not commit themselves to the maintenance of the systems, which is why there is an increased PV system failure in the country.
The poor operation of battery banks results in their short lifespan. It is against this backdrop that it is necessary to educate and train the users on the best approach to properly maintain and manage battery systems, with the overall goal of reducing their environmental impact.
In addition, the use of quality batteries with relatively high performance and lifespan, such as the Hoppecke OPzS Vented lead-acid battery that has an expected life of up to 20 years with a cycling capacity of 1500 at DoD of 80% [93], though this has a higher cost, can help to minimise the environmental influence of batteries. This is also the case of advanced battery technologies that have the potential to experience only a single replacement over a PV plant’s life span of 20 years [94,95].
Another way to reduce the environmental impact of batteries is using effective recycling system. Most batteries contain toxic materials. For instance, lead is one of these toxic metals and after the useful life of the battery, it is necessary that proper management takes place, i.e., collection and recycling [95]. The battery’s useful life is referred to the time during which it can be charged and retain the charge, usually estimated to be between 1 and 5 years for conventional lead acid batteries.
Unless recycling is done, certain toxic materials pose a potential threat to the environment and human health. In addition, it is easier and less energy intensive to recover scrap batteries than producing a new one from the ore, e.g., the production of recycled lead material requires only about 35–40% of the energy required to produce new lead material from the ore [95]. However, there is a dearth of battery recycling technologies or plants in Nigeria, including several developing countries that are currently adopting grid-independent PV system for electrifying remote communities.
Therefore, the involvement of government in this situation is necessary to help develop policies and legislations that will guide the use of batteries and enable the widespread application of battery cycling, to reduce the risk of environmental threat posed on people by the battery cells after their useful life. The battery recycling plant, in this case, is expected to be a hub for recycling used batteries from renewable energy systems and other applications, such as car/traction or batteries used in the industries.

5. New and Future Battery Technologies

5.1. Advanced Battery Technology

5.1.1. UltraBattery

This battery technology is essentially a hybrid lead acid, which integrates the battery and the supercapacitor at the electrode plate part [41,94]. The lead acid and the capacitor are combined in a single cell arrangement. The lead dioxide is the positive electrode of the lead-acid battery, while the spongy lead serves as the negative electrode. The capacitor has the same electrode as the lead acid battery but its negative electrode is the porous carbon [41]. Because both systems have the same positive electrode, lead dioxide, it is possible to connect the lead negative electrode and the capacitor negative electrode in parallel and arranged in the same cell with the positive electrode.
The asymmetric capacitor electrodes have a property of generating hydrogen gas during charge because of the porous carbon material they are made of. Furthermore, hydrogen inhibitors are required in the UltraBattery technology for suppressing the generation of hydrogen gas during charge to the same level of that of lead electrode. The structure of the battery is shown in Figure 24.
One of the advantages of this technology is that it has a smaller DC voltage window than that of a conventional supercapacitor alone, and can, therefore, use lower cost DC-to-AC conversion systems [94]. In addition, the carbon-supercapacitor characteristics make the battery system to be able to handle high power peaks and operate for a longer time in the partial state of charge (pSoC), which is one of the short-comings of the conventional valve regulated lead acid (VRLA) battery. The capacity of the UltraBattery to operate in the pSoC for a longer time mitigates the deteriorating effect of the conventional lead-acid technology that leads to shorter lifespan [96]. The shorter lifespan of the conventional battery technology contributes to higher number of replacements and increased environmental impacts in PV systems. The UltraBattery has a long cycling capacity and lifespan with less frequent replacements like the conventional VRLA systems and has a lower lifetime cost/kWh [97], and it can be almost completely recycled into a new battery (96% specifically) [98].
The Advanced Lead Acid Battery Consortium (ALABC) has conducted a study which reveals that some VRLA systems can achieve significant partial charge operation in PV system. For instance, it was found that VRLA tubular gel technology operated between a state of charge (SoC) of 10% and 40% at 40 C , supports the cycling capacity of 2100 [94]. The UltraBattery has typical DC-to-DC efficiency ranging from 86% to 95%, which is higher than the efficiency of a conventional lead acid battery [96]. Therefore, it can accept charge more efficiently compared to the VRLA technology, and suitable for microgrids, commercial and household energy storage, grid ancillary services, renewable energy integration, transport system and multipurpose backup for data centers with deep-cycle applications ranging from 0.4–10 MW [98].

5.1.2. PbC Capacitor Battery

The PbC battery technology is essentially an asymmetrically supercapacitive lead-acid-carbon hybrid battery with a multi-cell arrangement [41]. The negative electrodes in the lead-acid batteries are spongy lead plates, while the negative electrodes in a PbC battery are five-layer arrangements that involve two carbon electrodes, two corrosion barriers and a current collector. The Axion Power International Inc., that developed this technology has revealed that the PbC technology can withstand a cycling capacity of 1600 before failure in a deep-discharge application, e.g., 90%. This performance is better than conventional lead-acid batteries that can only operate around 500 cycles under such operating conditions. This translates to a relatively high lifespan and less replacements over a specified period, faster recharge rates and minimal maintenance.

5.1.3. Battery with Current Collector Improvement

Practically, what relates the battery’s specific energy in (Wh/kg) and the cycling capacity (i.e., charge/discharge cycles) of lead-acid batteries (both vented and the valve regulated types) is that the higher the specific energy the lower the battery’s cycling capacity [41]. Based on this, it is necessary to enhance both the specific energy and the cycling capacity of the conventional lead-acid batteries to make them more suitable for power applications in the future.
The low utilization efficiency of the active mass on the positive electrode and the weight of the lead current collectors are two major factors that limit the specific energy of the lead-acid battery. The structural arrangement of the current collector is an important factor for determining the utilization efficiency of the positive active mass (PAM) [41]. Examples of this arrangement are lead alloy-coated reticulated carbon and the lead alloy-coated polymer current collectors that can achieve PAM utilization efficiency of 55–63%, compared to the conventional grid having a value of 25%.
The initial R and D reports and tests suggest cycling capability during high rate (pSoC) operation of lead-carbon batteries to range from 4–5 times higher than a comparable VRLA battery (e.g., 12,000 cycles at DoD of 10% with lead-carbon vs. 2000 cycles with conventional VRLA), making the PbC battery system a promising low-cost technology for future application [4].

5.1.4. Advanced Sodium-Metal Chloride Batteries

The novel Na–FeCl 2 ZEBRA battery is a promising technology for future stationary applications. This is because of the low material costs of Fe cathode and relatively high cycling performance, including good DC output voltage and energy density [99]. The research output presented in [99] reveals that the Na–FeCl 2 can achieve an energy density and efficiency of about 135 Wh/kg and >92%, respectively, compared to the corresponding values of ~100–120 Wh/kg and ~85–90% for the traditional ZEBRA battery (Na–NiCl 2 ) [55].
The battery technology is continually being researched and given attention, and due to the mentioned features and its other inherent properties such as the appreciable safety and reliability, the technology is a promising battery alternative to the relatively expensive Na–NiCl 2 for electrical applications.

5.1.5. High Performance Sodium Copper Chloride

The Na–CuCl 2 batteries are also currently being researched and found to be a promising alternative to the Na–NiCl 2 through its excellent technical performances. This battery’s cathode has the potential to deliver a high energy of about 580 Wh/kg with a cycling capability of >1000 and relatively high round-trip efficiency of about 97% [100]. Kim et al. also maintained that this battery chemistry can be extended to copper halide materials such as CuBr 2 and CuF 2 that show exciting performances when used as cathode materials for the Na–Cu halide technology.

5.2. Nanostructured Energy Materials in Lithium Batteries

The lithium battery is nearly reaching its theoretical energy density because of the limitation of the anodic and cathodic materials [101]. While the advanced battery systems such as lithium metal, e.g., Li–S and Li–O 2 technologies are still under development, the application of nanostructured materials is expected to provide an efficient means to improve the battery system’s performance [101,102,103].
Generally, the Li-ion battery has some advantages over the lead-acid and Ni-based battery technologies such as the high energy density, long lifespan etc. However, the state-of-the-art Li battery technology will not be able to meet up future applications in terms of high energy density because of the limited specific capacity of the anodic graphite (372 mAh/g) and the oxide cathode (100–400 mAh/g) [103,104].
Apart from this, there is the need to enhance the Li battery’s power density to meet up with the developments in modern EVs. This gives appreciable directions for research and developments in nanostructured electrodes for the Li technology, whose advantages include high electronic and ionic conductivity, high specific surface area, high utilization of active materials, long cycling capacity etc [103].
The Li battery technology with nanostructured energy materials could achieve relatively high energy and power density for future electric power applications with minimum environmental impact. In a Li–S battery arrangement, for instance, the lithium anode and the sulfur cathode can achieve a very high theoretical specific energy of 3860 and 1672 mAh/g, respectively. Apart from the possibility of achieving the energy density, sulfur cathode is readily available as it is abundant, cost effective and non-toxic. This will make it possible for the Li–S technology to achieve relatively low environmental impact compared to the conventional lead acid batteries.

5.3. Metal-Air based Batteries

These battery technologies use metal as the fuel and the air as the oxidant, and are considered the most compact and potentially the cheapest battery [1]. They are environmentally friendly, though they have a low round-trip efficiency of <50% and a cycling capability of a few hundreds, they have the potential of achieving cost effective storage solutions with less environmental hazards compare to the conventional lead-acid batteries.
Therefore, there is a need for intensive research to further develop the electrical rechargeability of these systems for secondary battery applications in the future. Examples of these systems are lithium air [103], zinc air [1], sodium-oxygen [105], aluminium air, magnesium air and iron air systems [106]. The parameters of various metal-air batteries are shown in Table 7, [106]. These batteries have been investigated to have very high theoretical energy density of around 2–10 times more than that of lithium-ion battery technology [56,106,107], which makes them to be a promising energy storage option for future electrical application despite their current technical challenges.

6. Criteria for Battery Selection

It is necessary to consider certain decision variables in the selection of battery systems. These include the initial cost, lifetime, installation cost, maintenance cost, shipping cost, replacement cost, disposal cost, safety, cycling capacity and round-trip efficiency, reliability and environmental impact [108]. This is because they basically affect the type of battery technology that is employed for a specific power application. This study has demonstrated how the reliability and cost factors form a major criterion for selecting battery technologies for off-grid solar energy generation applications.
Generally, the cost of solar PV modules has drastically reduced over the past decade [91], which is one of the factors that have contributed to the widespread application of photovoltaic electricity both for on-grid and off-grid applications around the world. However, this is not the same with the battery systems. Batteries are more expensive than the PV modules in a typical PV system application, for instance, one of the recent studies on the techno-economic evaluation of PV microgrid reveals that the cost of the battery bank ranges from 40–46% of the total microgrid cost [109]. This demonstrates that the total cost of battery—initial, installation, maintenance, shipping, replacement and disposal cost is one of the key factors that affect the selection of batteries.
Moreover, the initial cost can, to a large extent, determine the expected lifetime, efficiency and cycle performance of batteries, since the battery cells with higher performances will be more expensive than those with relatively lower performances, e.g., Li-ion versus lead acid batteries in terms of efficiency and energy density. Some batteries have a higher maintenance cost, such as the vented or flooded batteries because of the routine top up of the electrolyte in the cells [1,5,41], while some others have relatively low maintenance cost, e.g., the VRLA battery technologies that do not require topping up of the electrolyte, OPzS battery, UltraBattery etc.
In addition, battery cells are usually replaced a number of times over an energy system’s project life, which gives rise to replacement costs over the system’s lifecycle; the disposal cost is incurred at the end of the battery’s useful life. Batteries are usually transported from a manufacturer in one country or location to another and are finally delivered to the site where they are installed, which give rise to the shipping and the installation costs. The optimal battery solution is the one that has the lowest lifecycle cost, i.e., $/kWh, which is strongly connected to the mentioned decision variables [5].
Apart from the economic consideration, it is crucial to consider the safety of operation and the environmental impact of the battery. The use of batteries with a high degree of operational safety and a low environmental impact is encouraged and advocated [14]. Therefore, battery technologies are usually taking through extensive compliance testing before they are certified safe to be operated by the users [93]. The minds of the intended users will be at rest when the battery system is safe to use.
Ascertaining the environmental risk or impact of using or operating a type of battery is another important consideration. The impact is a function of the battery materials. For instance, lead and cadmium are very toxic materials [1], and the energy planners, developers and users-alike are being conscious of the risks of using these batteries. Therefore, the standard procedures of operation are recommended and the use of effective recycling process is employed after the battery system’s useful life. Apart from cost, the lifetime of a battery is dependent on its use. A properly operated and maintained battery system will have longer life, less replacements over time, thus, resulting in lower environmental impacts.

6.1. Future Work

The lead-acid batteries remain the commonly used storage system for off-grid energy generation applications both in the developed and the developing countries of the world [91]. The developed countries have standards and policies guiding the use of these batteries, but these are not available in several developing countries, including Nigeria.
Over 60% of Nigeria’s citizens, for instance, do not have access to the national grid [109]; it is against this backdrop that grid-independent solar PV systems are proposed for off-grid communities and households in the country. This is also the case with several other developing countries such as Bangladesh, Malawi, etc. [110]. Based on this development, as the rate of deployment of PV/battery systems increases, it is also important to consider the possible standards and policies that guide the use and end-of-life management of the batteries. Therefore, our future work will be based on the recommendation of policies that can possibly guide the deployment and widespread application of PV/battery systems in developing countries, and the modality for recycling decommissioned plant components toward actualising the environmental sustainability.

7. Conclusions

This research has presented an overview of the battery energy storage technologies for electrical power application. It has also compared the technical properties and performance of the various systems such as the cycling capacity, power and energy densities, round trip-efficiencies and the costs. The existing battery technologies considered include lead-acid, sodium sulfur, sodium-nickle chloride, nickel cadmium, lithium-ion, zinc-bromide, polysulfide bromine and vanadium-redox.
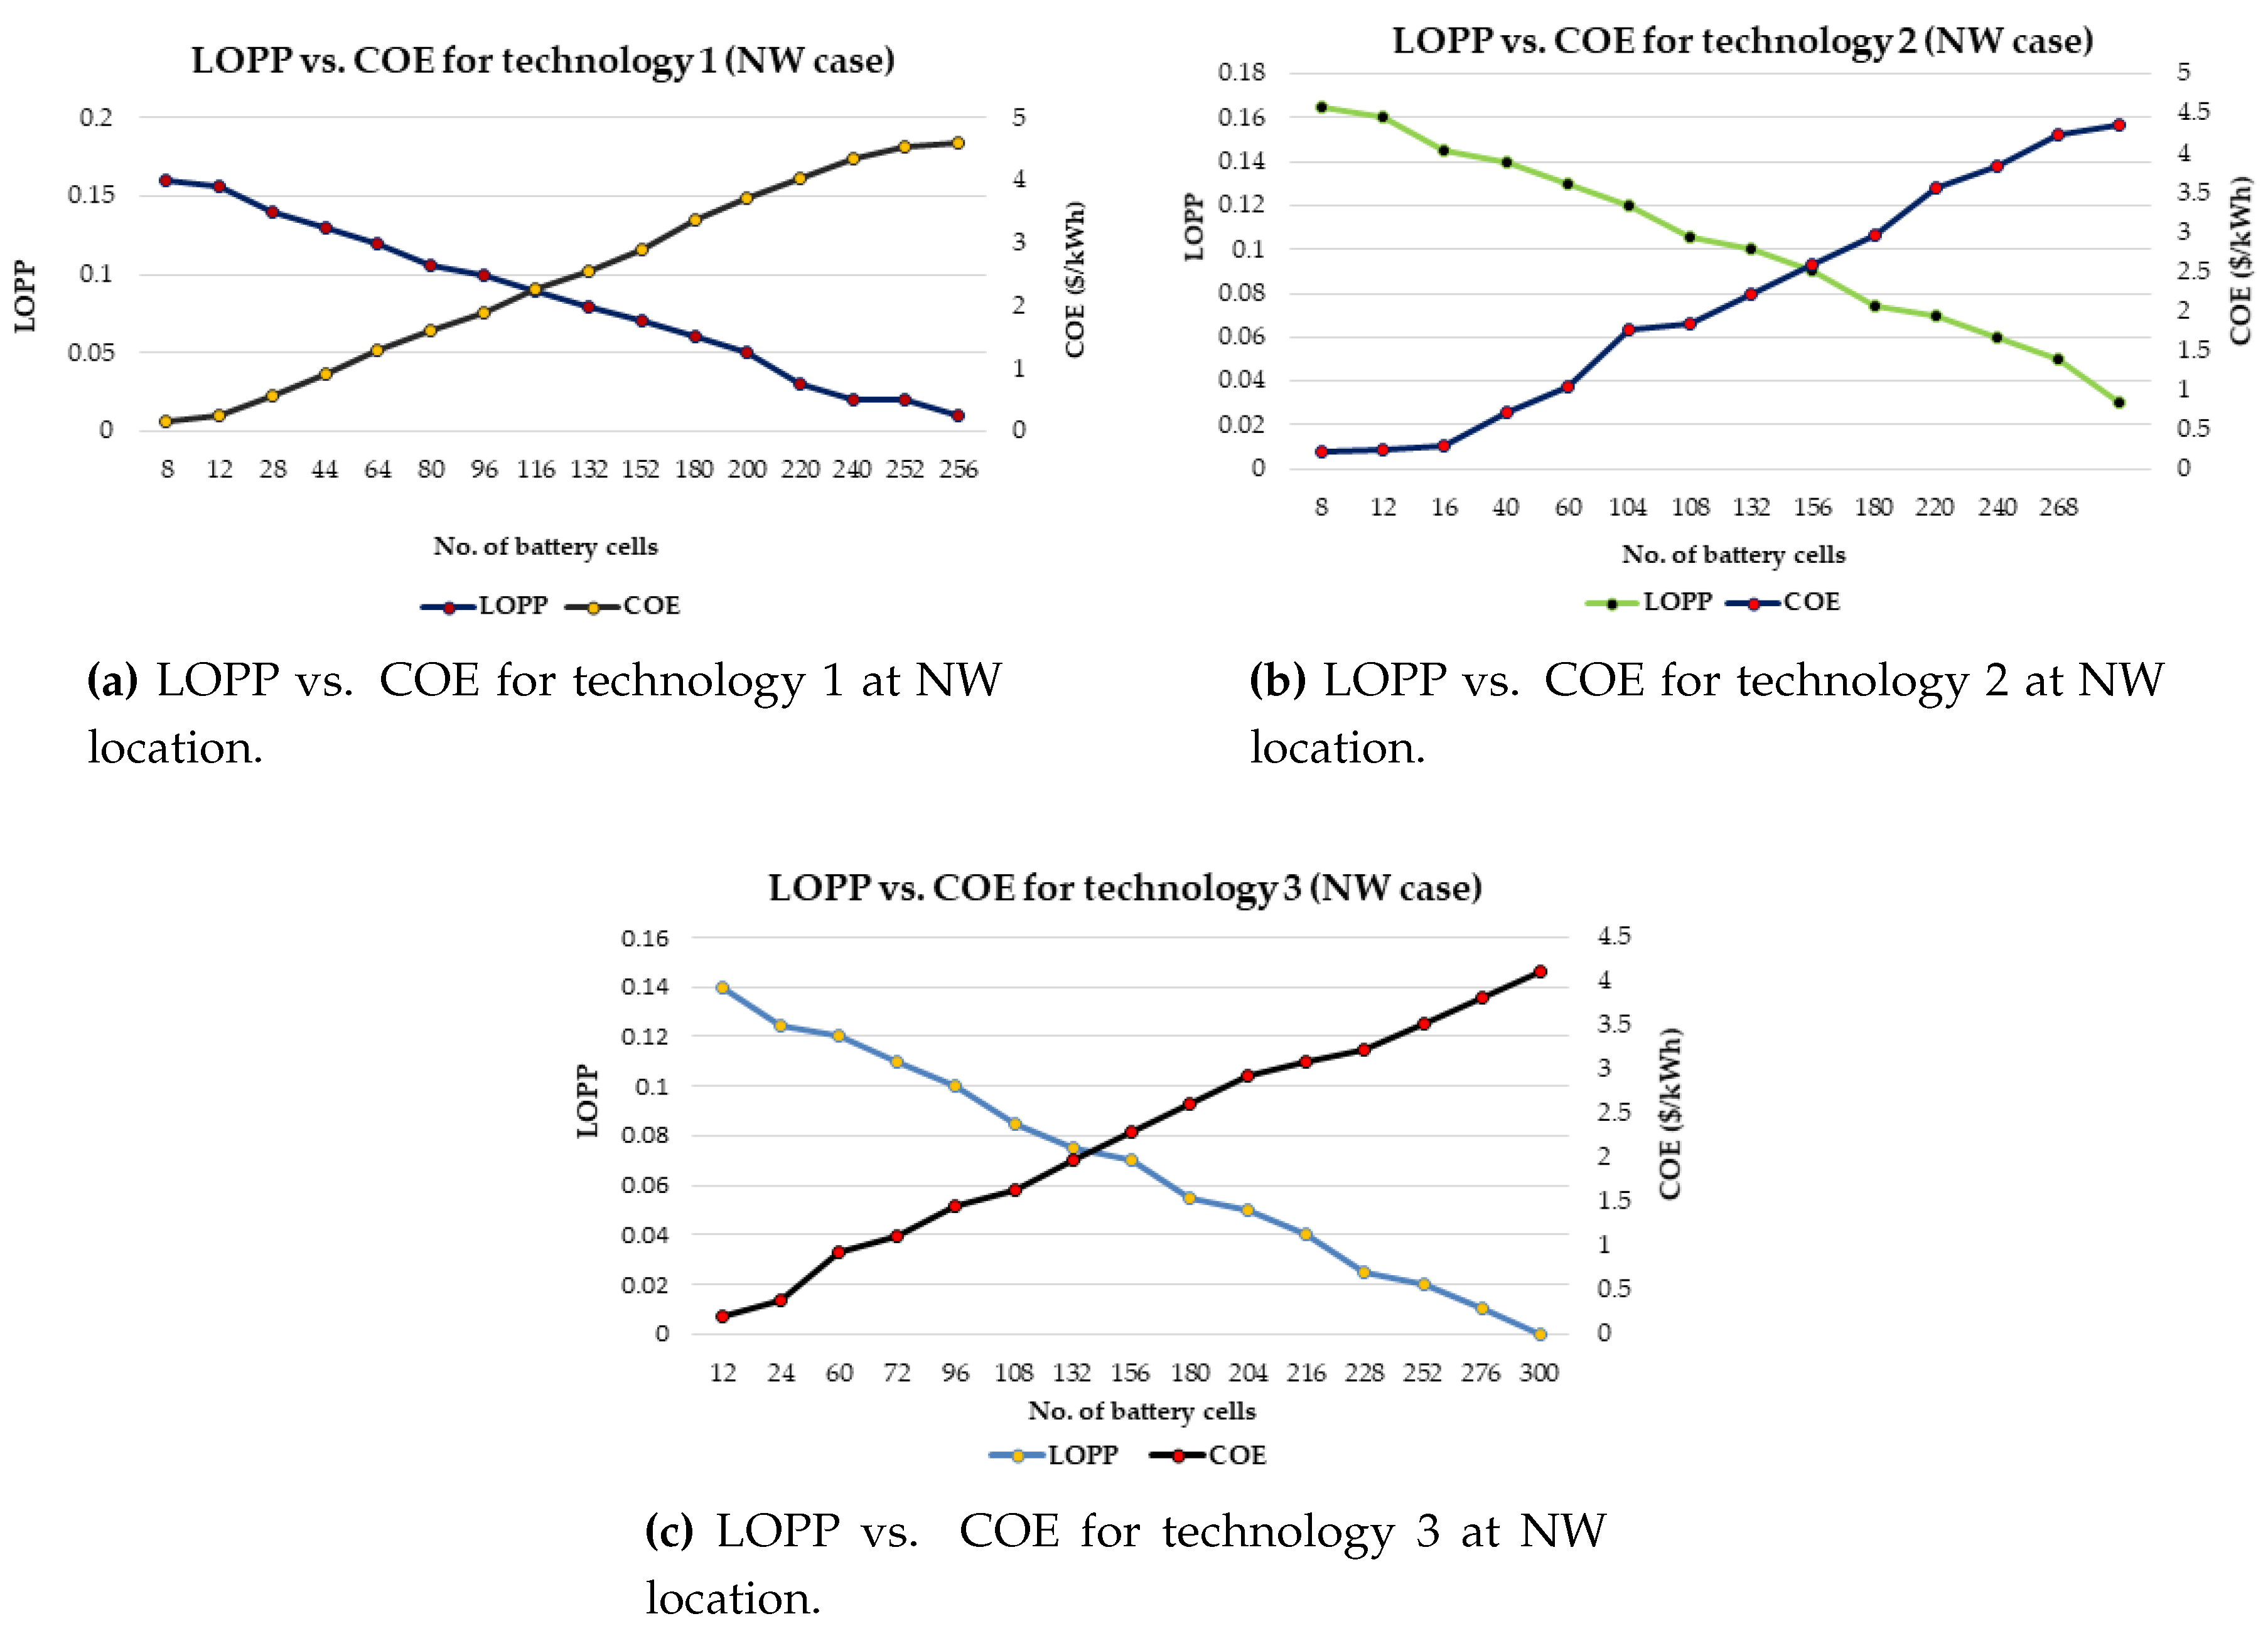
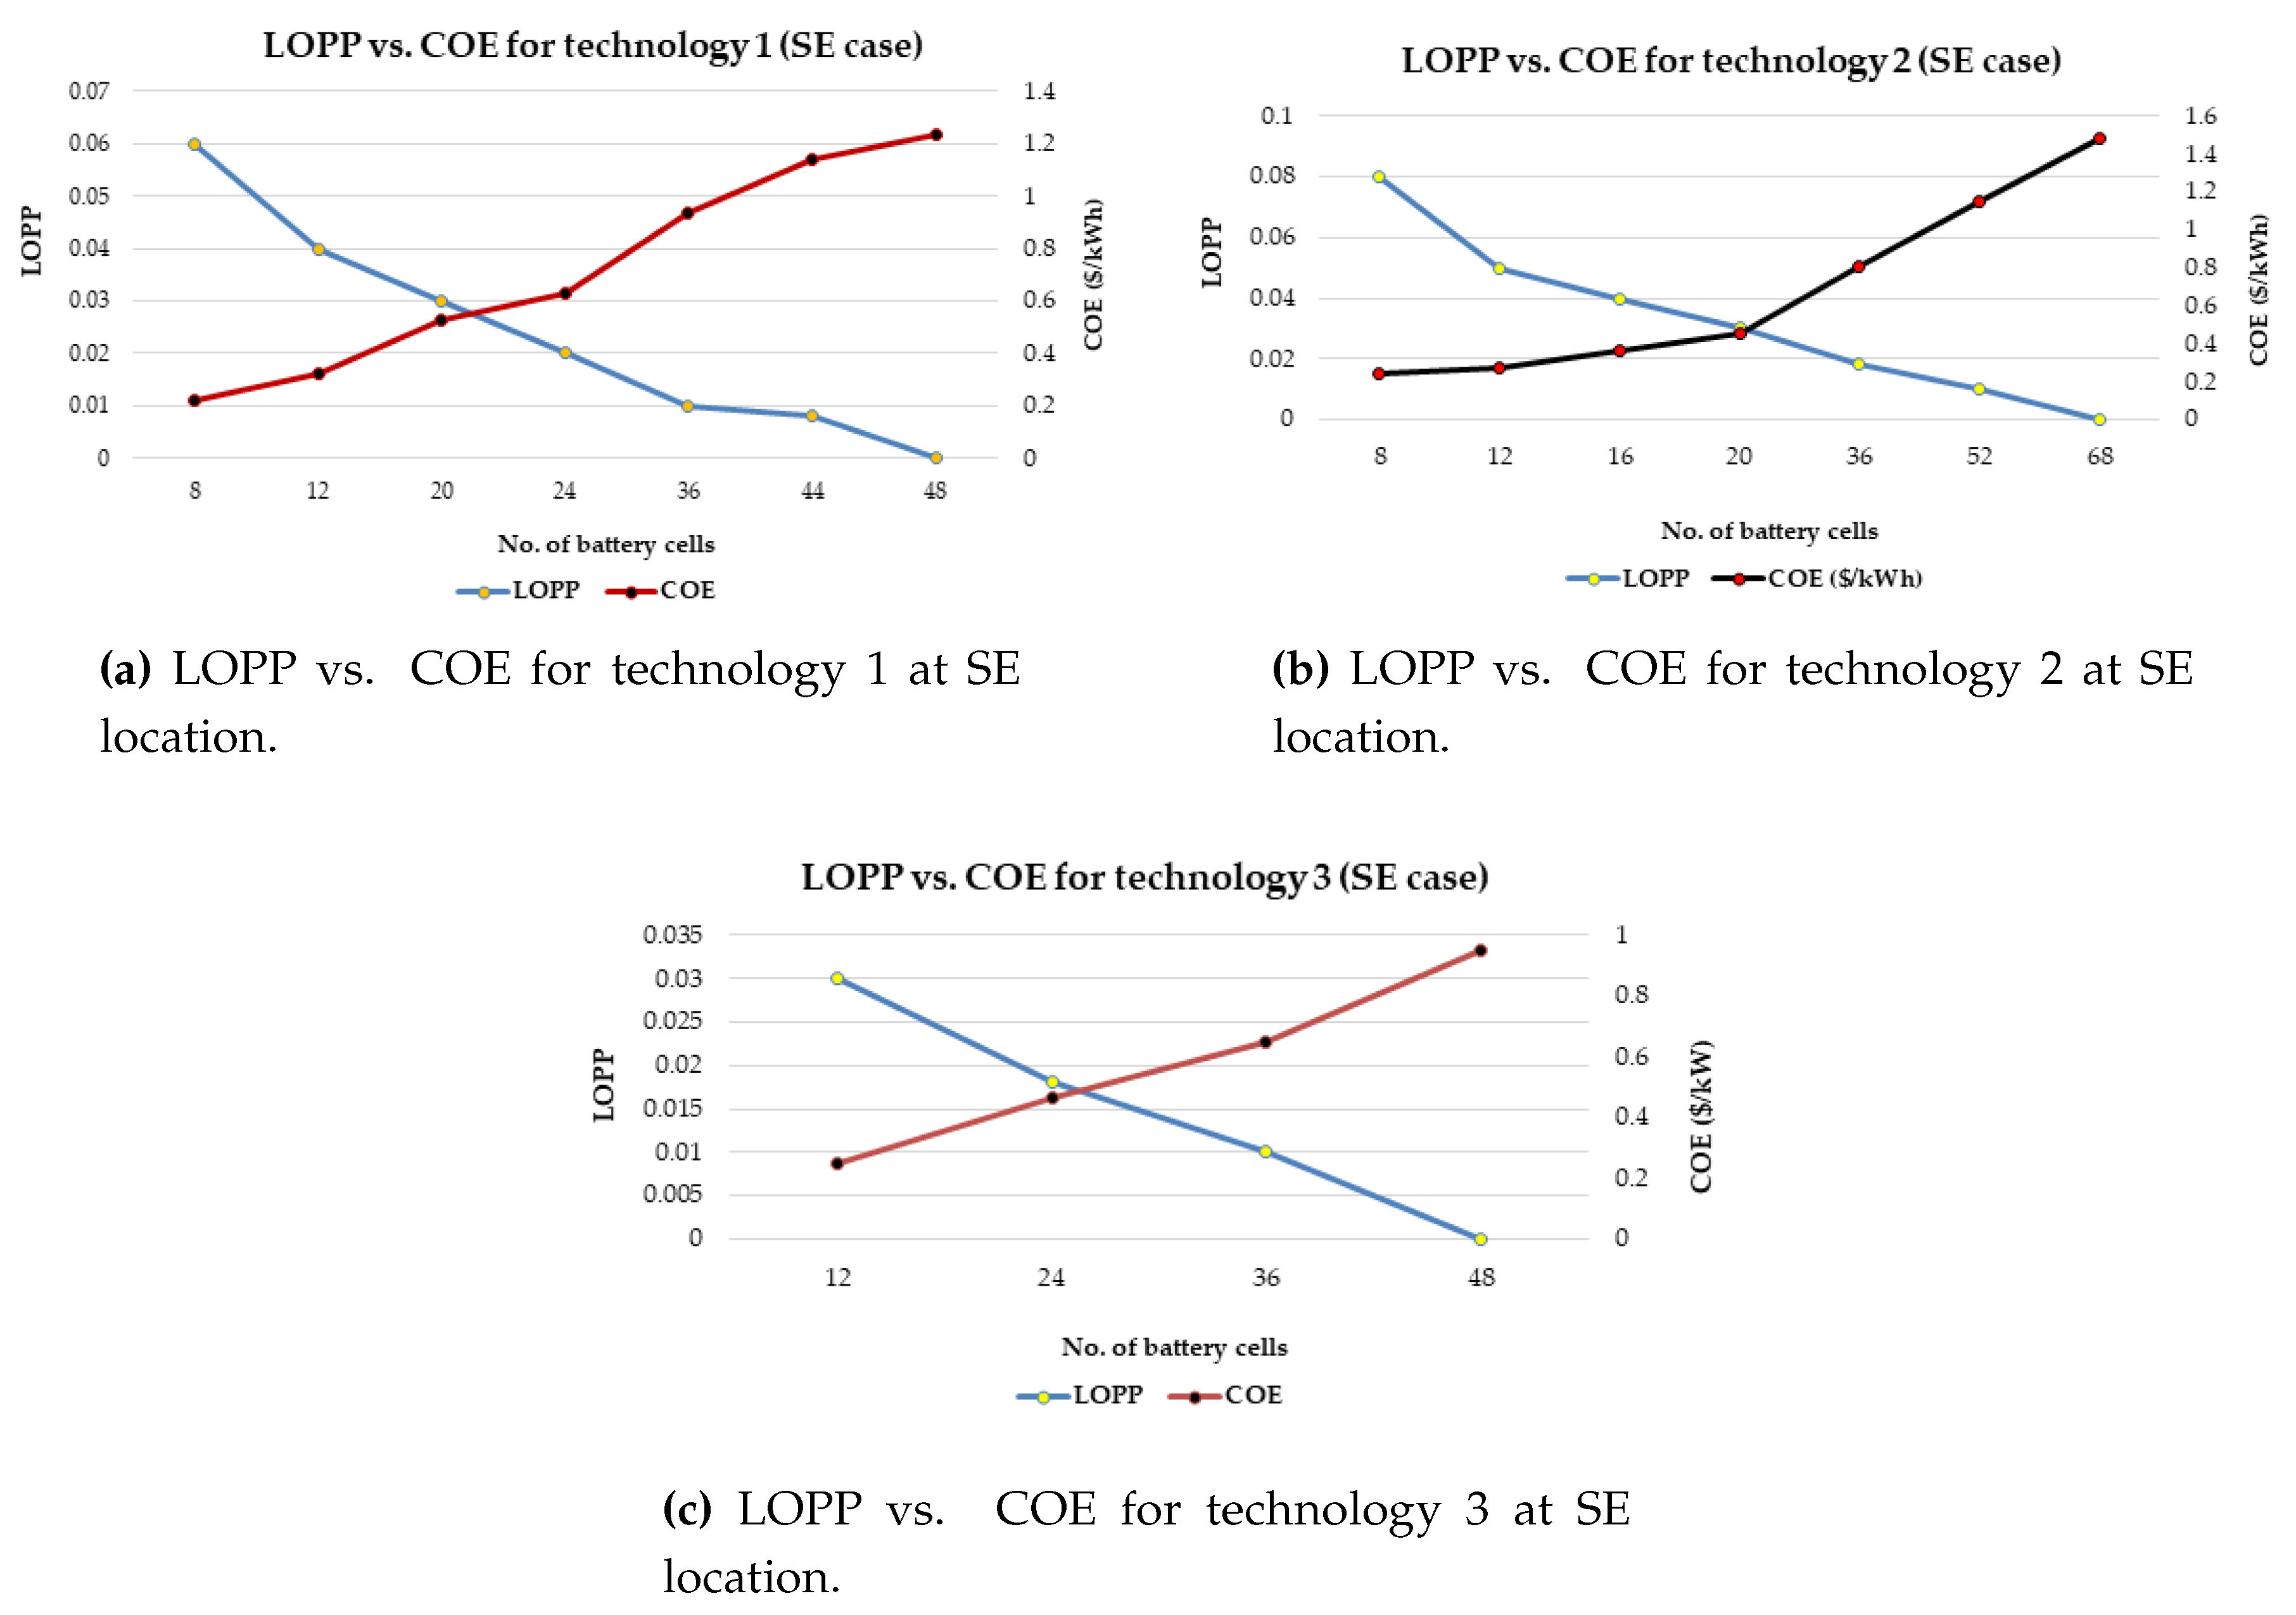
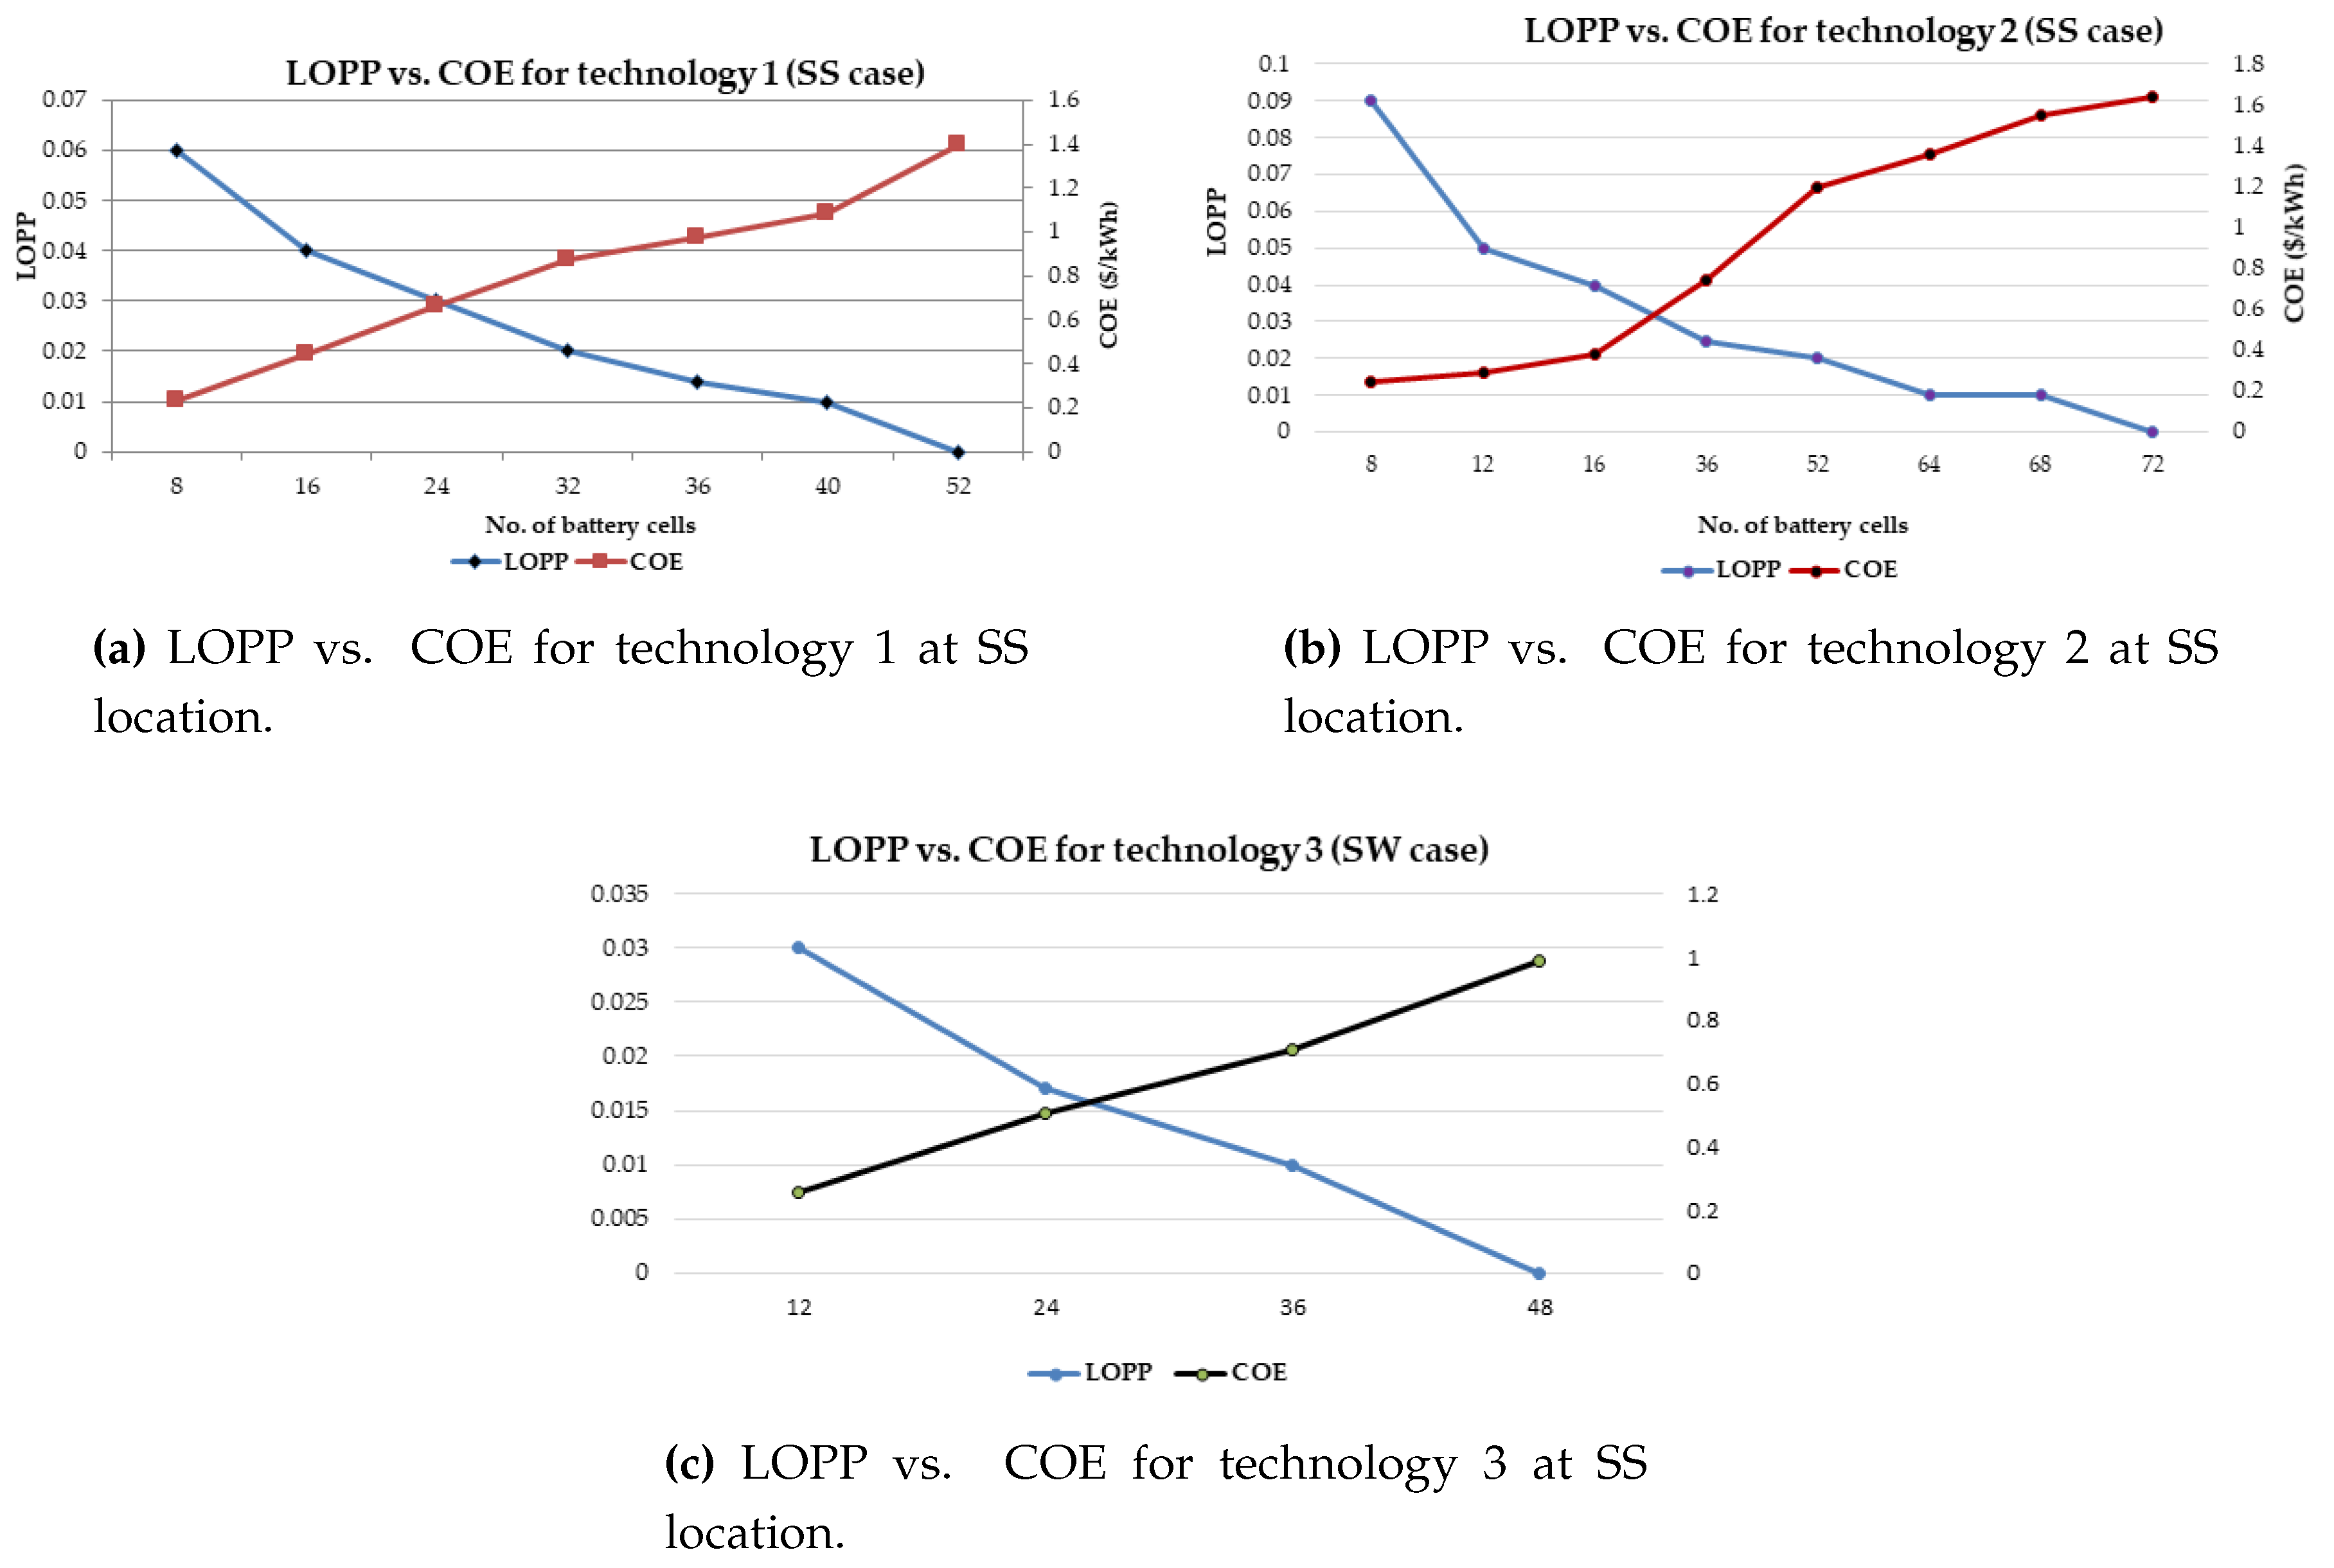
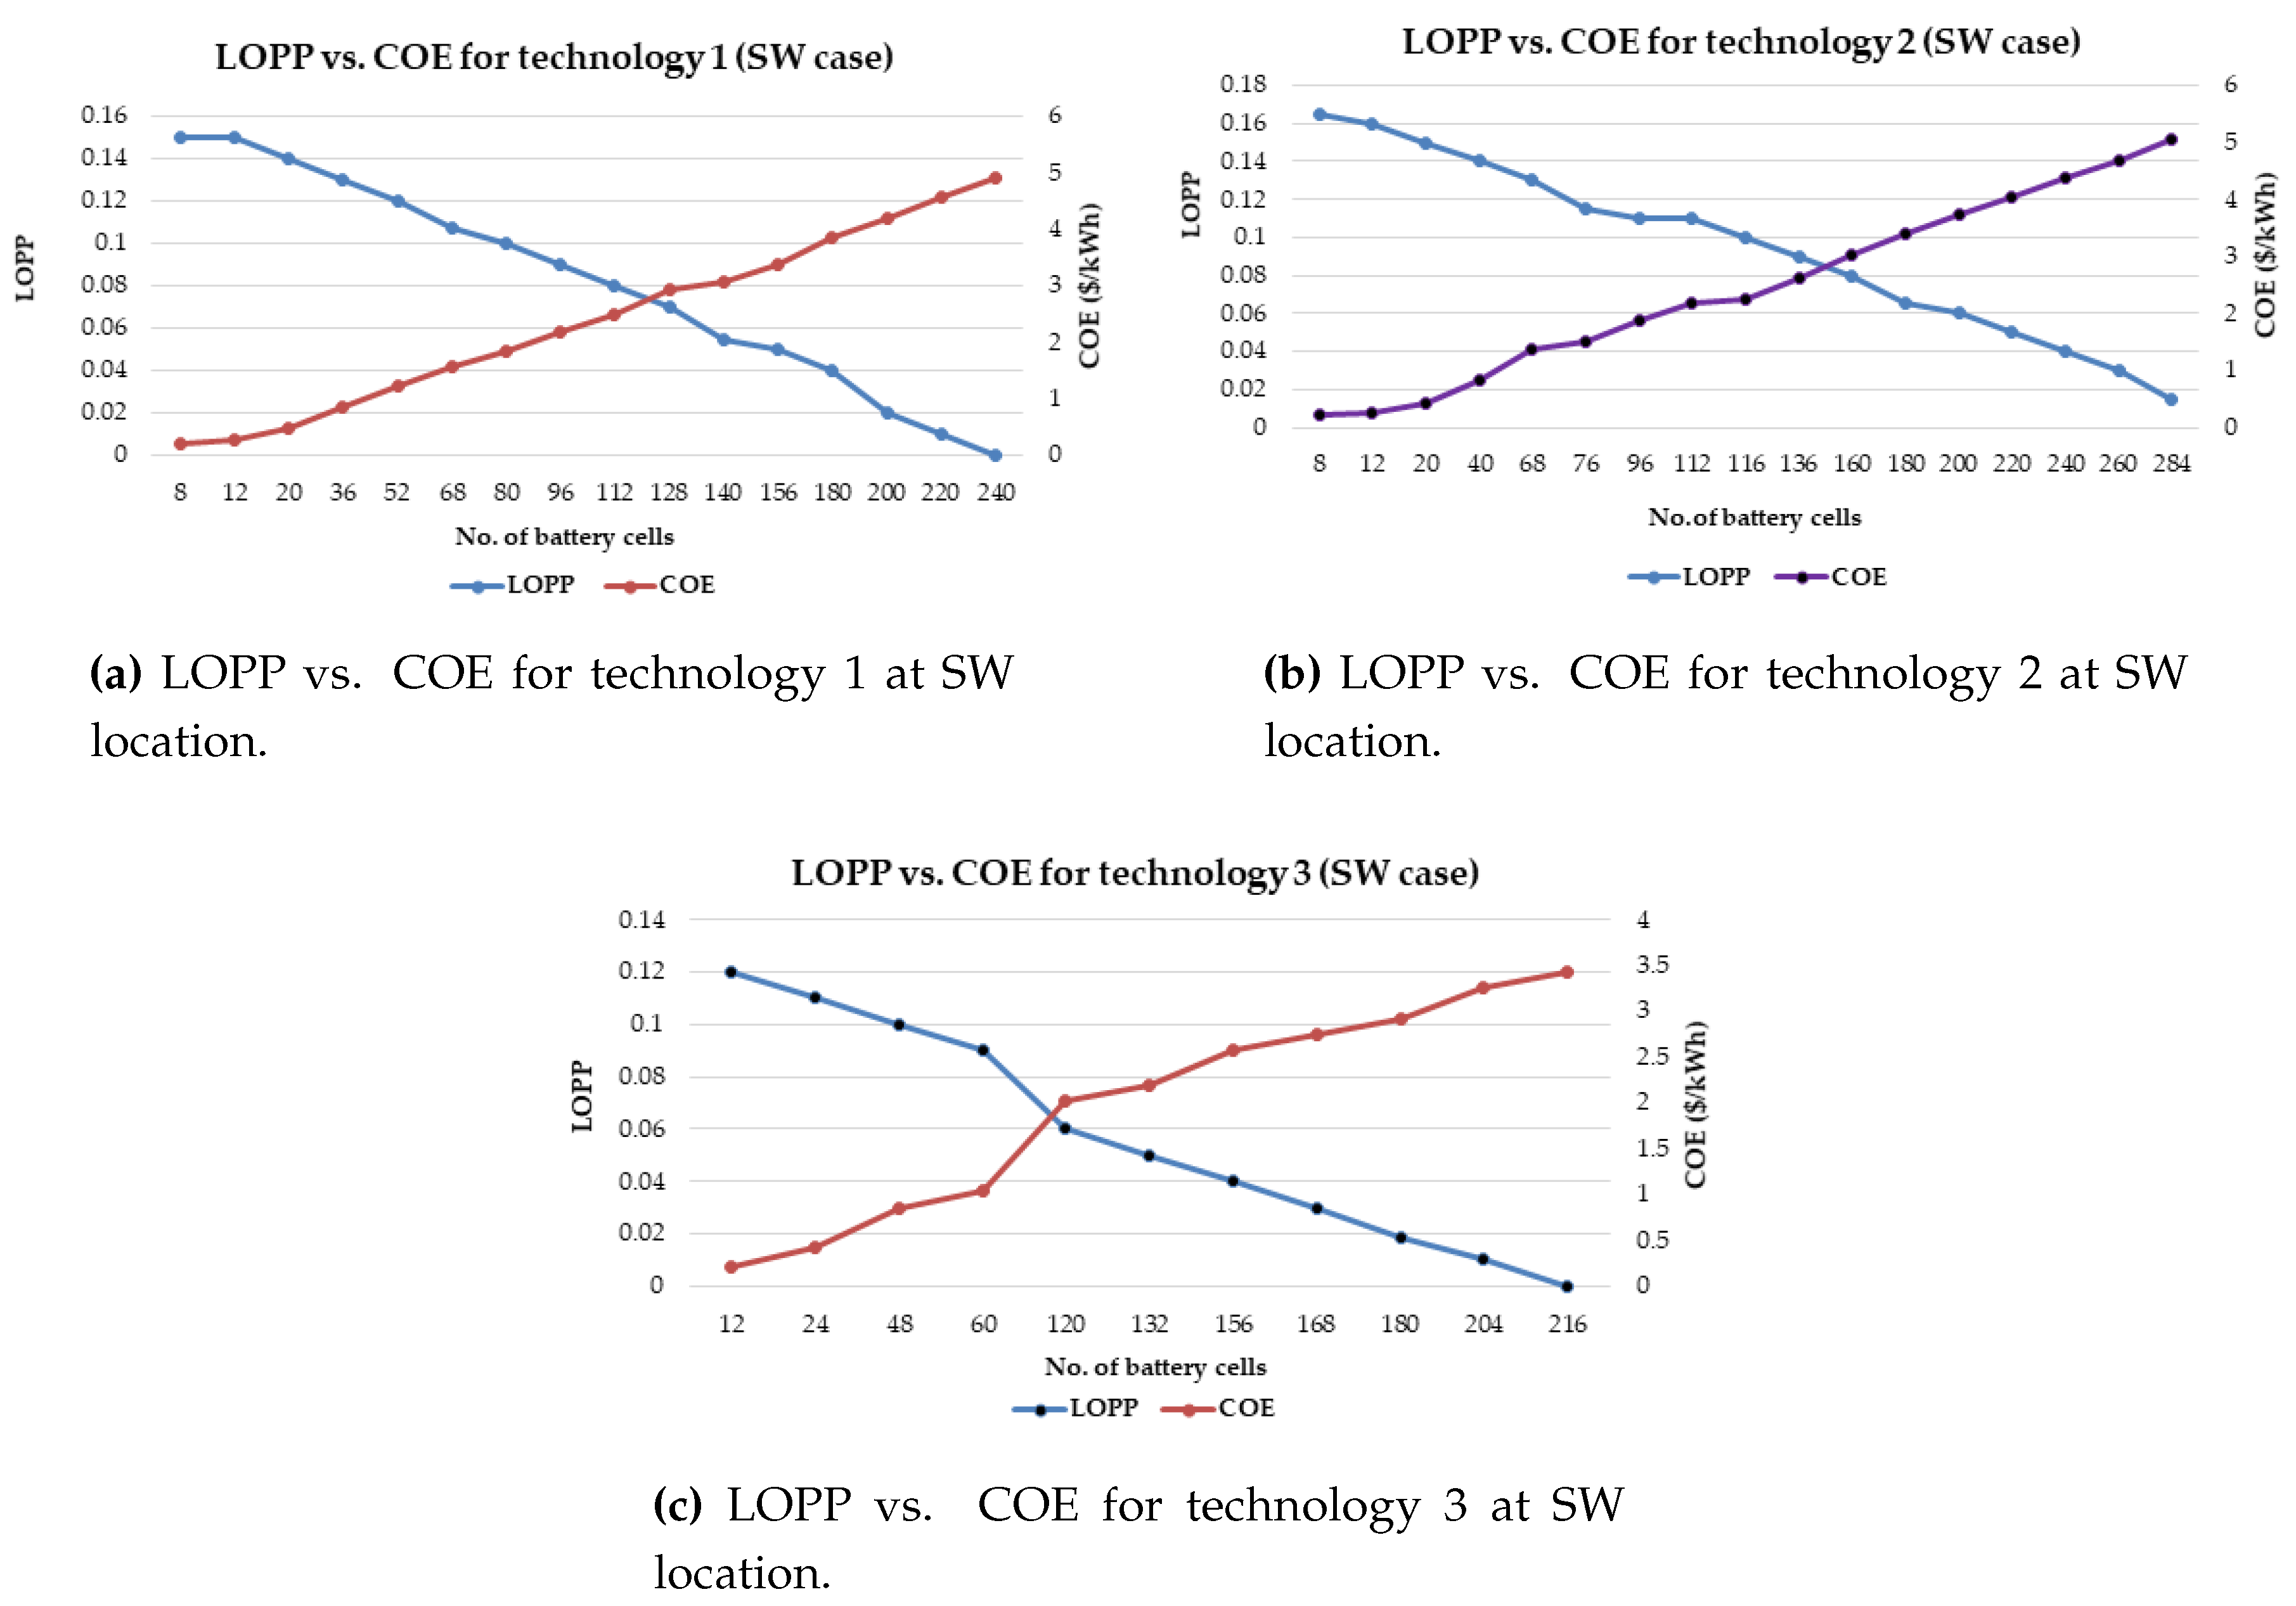
It has also proposed a general strategy for optimal battery sizing and technology selection in a typical stand-alone photovoltaic (PV) system. This approach considers two critical energy generation design factors such as the reliability and cost. The reliability has been examined in terms of the loss of power probability (LOPP), while the cost has been considered in terms of the cost of energy (COE), using the life cycle cost analysis. The battery banks were simulated in Hybrid Optimisation Model for Electric Renewables (HOMER) environment. The selection strategy results demonstrate that the LOPP decreases as the number of battery cells increases, while the COE increases as the number of battery cells increases for the six different energy configurations. Therefore, the configurations with the minimum LOPPs or COE have been selected as the optimum options. The approach and results can be repeated for any other location around the world.
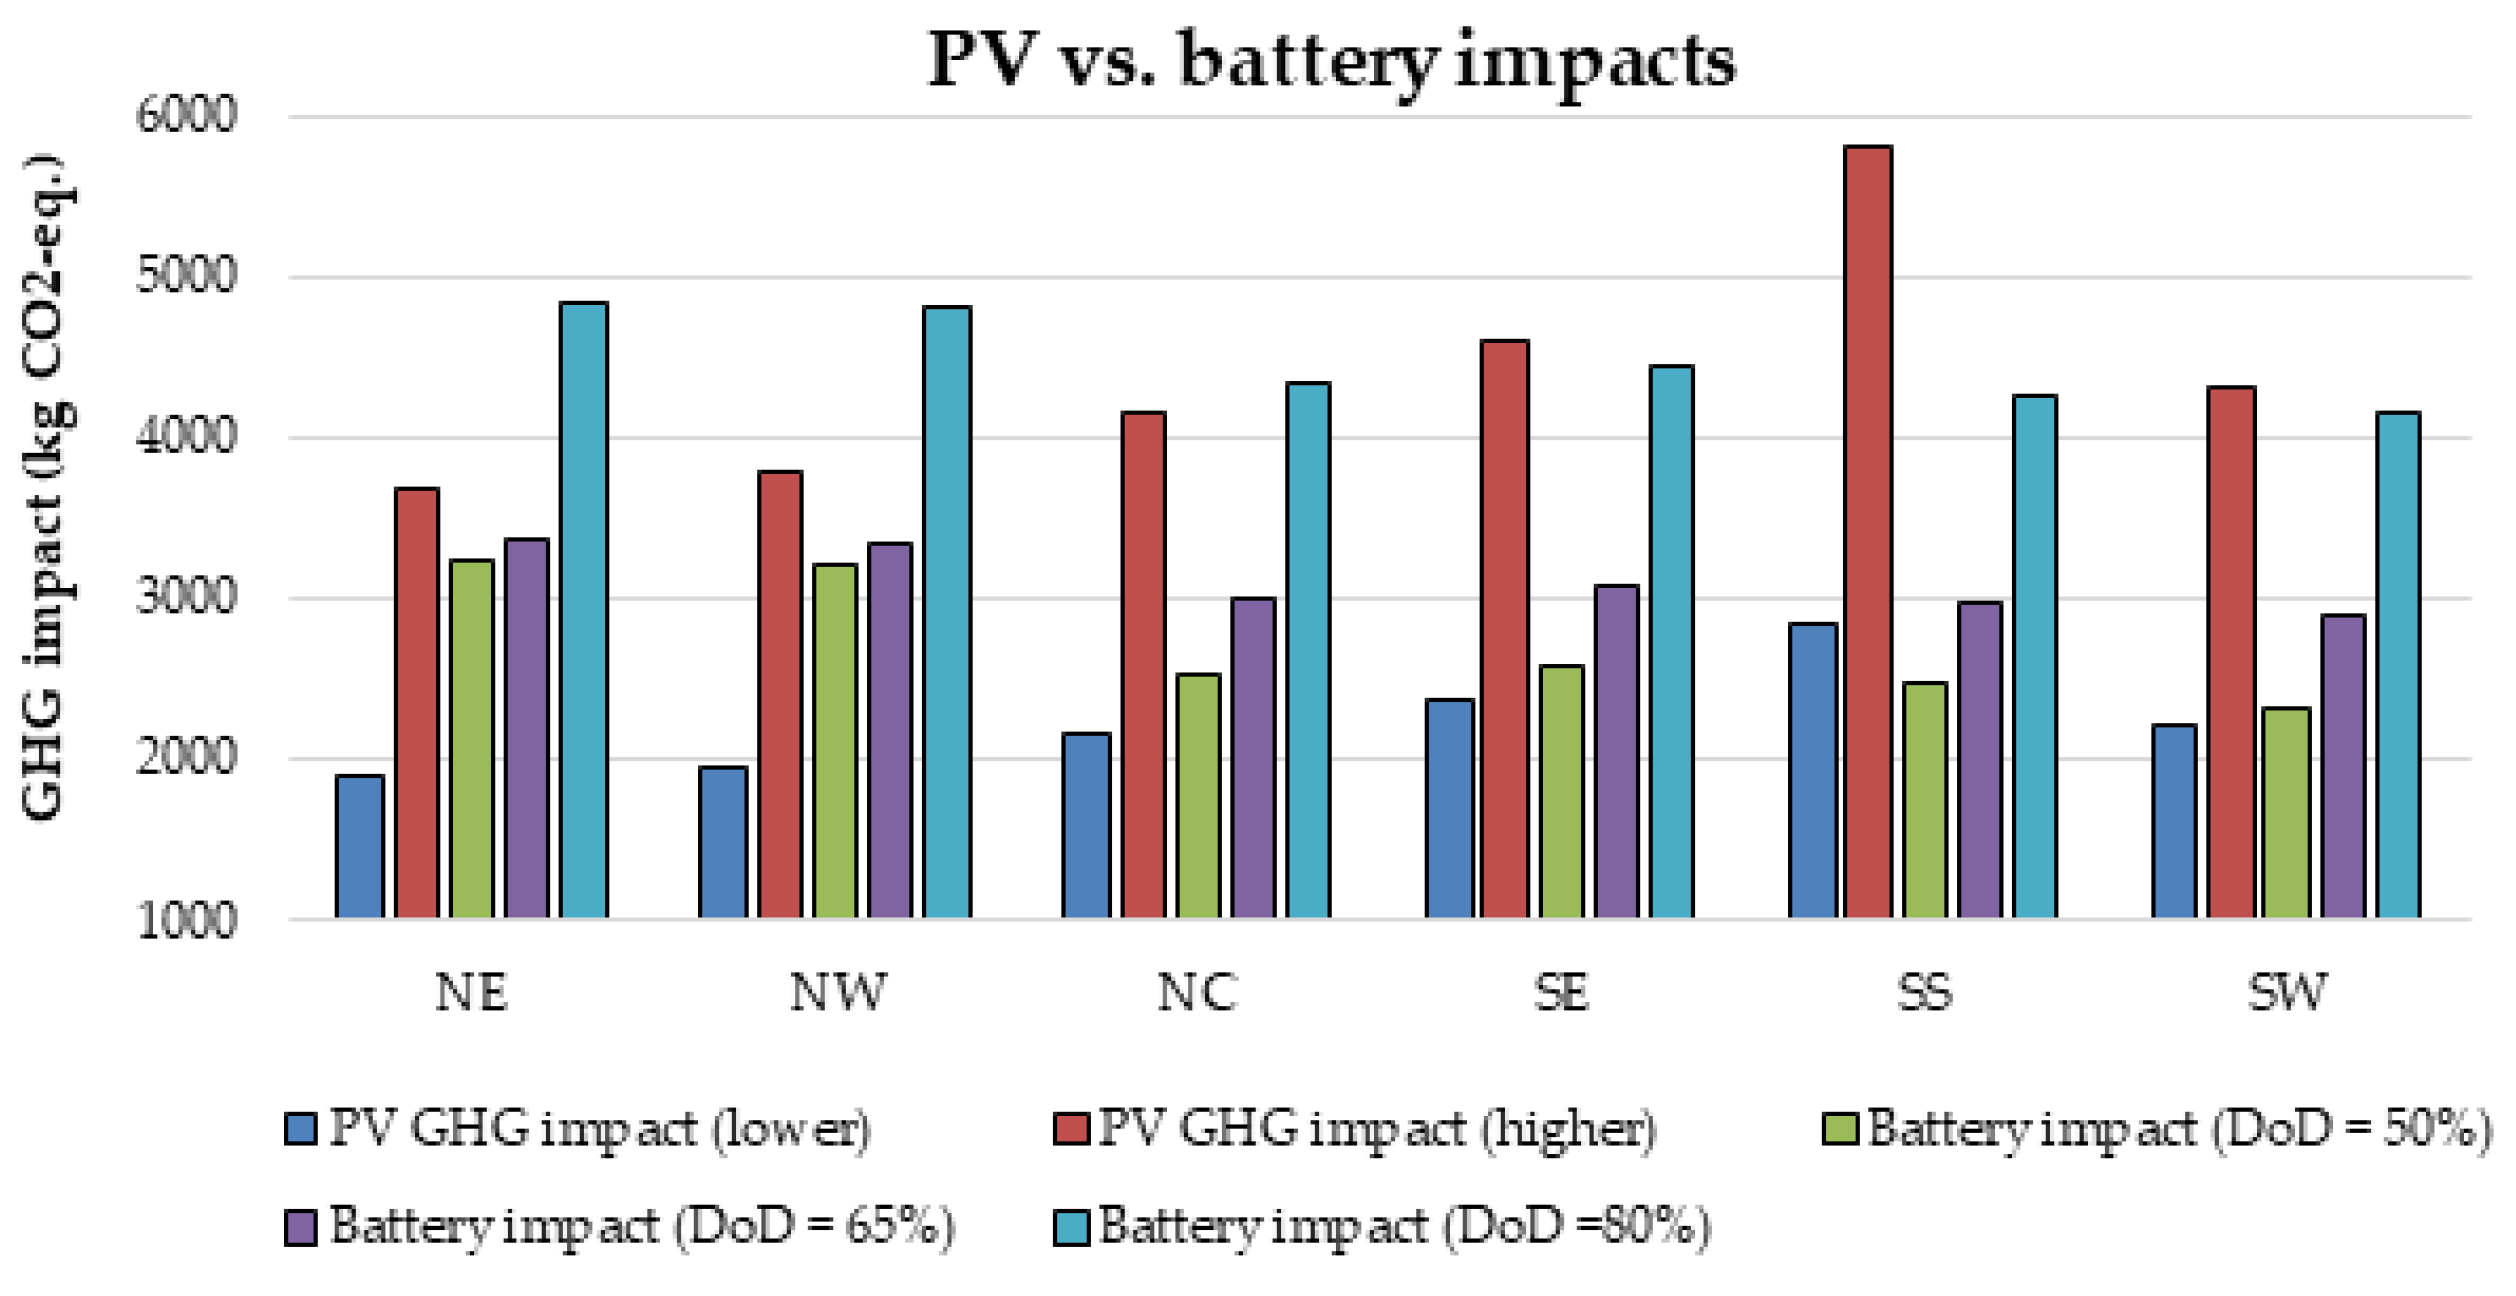
Furthermore, there is currently an increased use of batteries than ever due to the widespread application of renewable energy systems around the world. As a result, the issue of environmental risk and the potential hazard to human health by the use of batteries is very crucial in the energy system field of practice. This is because some of the battery materials are toxic, e.g., lead, cadmium etc. Therefore, efforts have been made in this paper to examine the environmental impact of batteries in a renewable energy system, using a 1.5 kW stand-alone solar PV system as a case study. The energy system was considered for 6 different locations in Nigeria and the GHG impact was estimated based on the life cycle emission rate reported in the literature. The results demonstrate that the battery has a significant impact in the off-grid PV system, achieving GHG impact of about 36–68% in the PV system for battery depth of discharge (DoD) values of 50–80%.
The study demonstrates that the battery impact is attributed to the shorter lifespan of the battery cells and their frequent replacements over a 25-year project life. Though the results are approximate, they can be useful for better understanding of the life cycle environmental impact of batteries in a typical stand-alone PV system. Therefore, making concerted efforts to lengthen the battery lifetime, for instance, by improving their charge/discharge control system and educating the users on battery maintenance and management, will be useful for achieving decreased environmental impacts.
The paper discussed new batteries such as advanced valve regulated lead-acid, lead-carbon, metal-air technologies, UltraBattery, battery with current collector improvement, advanced sodium-metal chloride, high performance sodium-copper chloride and nanostructured energy materials in lithium batteries, which are new and promising battery technologies for future applications with improved cycle life performance, higher lifespan and lower cost that can achieve lower environmental impacts. The study also highlighted the decision variables for selecting battery systems for electrical power applications, which can be useful for planning purposes.
The absence of effective policies and recycling systems for batteries in several developing countries means that there is the danger of serious environmental risks in the future, as there is an increased interest in the adoption and deployment of PV/battery system in these countries. Our future work will focus on the policy recommendation for widespread use and management of battery systems.

Acknowledgments

Daniel Akinyele and Yoash Levron were supported by Grand Technion Energy Program (GTEP) and a Technion fellowship. Juri Belikov was supported by the Estonian Research Council grant MOBTP36.

Author Contributions

All authors have worked on this manuscript together and all authors have read and approved the manuscript.

Conflicts of Interest

The authors declare no conflict of interest.

References

  1. Chen, H.; Cong, T.N.; Yang, W.; Tan, C.; Li, Y.; Ding, Y. Progress in electrical energy storage system: A critical review. Prog. Nat. Sci. 2009, 19, 291–312. [Google Scholar] [CrossRef]
  2. Schainker, R.B. Executive overview: Energy storage options for a sustainable energy future. In Proceedings of the IEEE Power Engineering Society General Meeting, Denver, CO, USA, 6–10 June 2004; pp. 2309–2314. [Google Scholar]
  3. Akinyele, D.O.; Rayudu, R.K. Review of energy storage technologies for sustainable power networks. Sustain. Energy Technol. Assess. 2014, 8, 74–91. [Google Scholar] [CrossRef]
  4. Leadbetter, J.; Swan, L.G. Selection of battery technology to support grid-integrated renewable electricity. J. Power Sources 2012, 216, 376–386. [Google Scholar] [CrossRef]
  5. Institute of Electrical and Electronics Engineers (IEEE). Recommended Practice for Sizing Lead-Acid Batteries for Stand-Alone Photovoltaic (PV) Systems; IEEE Std 1013-2007 (Revision of IEEE Std 1013-2000); IEEE: Piscataway, NJ, USA, 2007; pp. 1–58. [Google Scholar]
  6. Toliyat, A.; Kwasinski, A. Energy storage sizing for effective primary and secondary control of low-inertia microgrids. In Proceedings of the IEEE 6th International Symposium on Power Electronics for Distributed Generation Systems, Aachen, Germany, 22–25 June 2015; pp. 1–7. [Google Scholar]
  7. Oudalov, A.; Chartouni, D.; Ohler, C. Optimizing a battery energy storage system for primary frequency control. IEEE Trans. Power Syst. 2007, 22, 1259–1266. [Google Scholar] [CrossRef]
  8. Delille, G.; François, B.; Malarange, G. Dynamic frequency control support by energy storage to reduce the impact of wind and solar generation on isolated power system’s inertia. IEEE Trans. Sustain. Energy 2012, 3, 931–939. [Google Scholar] [CrossRef]
  9. Dreidy, M.; Mokhlis, H.; Mekhilef, S. Inertia response and frequency control techniques for renewable energy sources: A review. Renew. Sustain. Energy Rev. 2017, 69, 144–155. [Google Scholar] [CrossRef]
  10. Hill, C.A.; Such, M.C.; Chen, D.; Gonzalez, J.; Grady, W.M. Battery energy storage for enabling integration of distributed solar power generation. IEEE Trans. Smart Grids 2012, 3, 850–857. [Google Scholar] [CrossRef]
  11. Fathima, A.H.; Palanisamy, K. Battery energy storage applications in wind integrated systems—A review. In Proceedings of the International Conference on Smart Electric Grid, Guntur, India, 19–20 September 2014; pp. 1–8. [Google Scholar]
  12. Ahmad, A.; Amin, M.A.; Javed, A.H.; Faiz, M.T. Efficiency improvement of mini hydro pump storage power plant using Archimedes turbine. In Proceedings of the International Conference on Energy, Environment and Sustainable Development, Paris, France, 21–22 January 2016. [Google Scholar]
  13. Li, P. Energy storage is the core of renewable technologies. IEEE Nanotechnol. Mag. 2008, 2, 13–18. [Google Scholar] [CrossRef]
  14. Rastler, D.M. Electricity Energy Storage Technology Options: A White Paper Primer on Applications, Costs and Benefits; Electric Power Research Institute: Palo Alto, CA, USA, 2010. [Google Scholar]
  15. Halicka, K.; Lombardi, P.A.; Styczyński, Z. Future-oriented analysis of battery technologies. In Proceedings of the IEEE International Conference on Industrial Technology, Seville, Spain, 17–19 March 2015; pp. 1019–1024. [Google Scholar]
  16. Luo, X.; Wang, J.; Dooner, M.; Clarke, J. Overview of current development in electrical energy storage technologies and the application potential in power system operation. Appl. Energy 2015, 137, 511–536. [Google Scholar] [CrossRef]
  17. Elliman, R.; Gould, C.; Al-Tai, M. Review of current and future electrical energy storage devices. In Proceedings of the International Universities Power Engineering Conference, Stoke on Trent, UK, 1–4 September 2015; pp. 1–5. [Google Scholar]
  18. Converse, A.O. Seasonal energy storage in a renewable energy system. Proc. IEEE 2012, 100, 401–409. [Google Scholar] [CrossRef]
  19. Katoh, S.; Ohara, S.; Itoh, T. Technologies for mitigating fluctuation caused by renewable energy sources. In Proceedings of the International Power Electronics Conference, Hiroshima, Japan, 18–21 May 2014; pp. 850–856. [Google Scholar]
  20. Alotto, P.; Guarnieri, M.; Moro, F. Redox flow batteries for the storage of renewable energy: A review. Renew. Sustain. Energy Rev. 2014, 29, 325–335. [Google Scholar] [CrossRef]
  21. Poullikkas, A. A comparative overview of large-scale battery systems for electricity storage. Renew. Sustain. Energy Rev. 2013, 27, 778–788. [Google Scholar] [CrossRef]
  22. Purvins, A.; Papaioannou, I.T.; Debarberis, L. Application of battery-based storage systems in household-demand smoothening in electricity-distribution grids. Energy Convers. Manag. 2013, 65, 272–284. [Google Scholar] [CrossRef]
  23. Leadbetter, J.; Swan, L. Battery storage system for residential electricity peak demand shaving. Energy Build. 2012, 55, 685–692. [Google Scholar] [CrossRef]
  24. Kyriakopoulos, G.; Arabatzis, G. Electrical energy storage systems in electricity generation: Energy policies, innovative technologies, and regulatory regimes. Renew. Sustain. Energy Rev. 2016, 56, 1044–1067. [Google Scholar] [CrossRef]
  25. Mahlia, T.M.I.; Saktisahdan, T.J.; Jannifar, A.; Hasan, M.H.; Matseelar, H.S.C. A review of available methods and development on energy storage; technology update. Renew. Sustain. Energy Rev. 2014, 33, 532–545. [Google Scholar] [CrossRef]
  26. Zakeri, B.; Syri, S. Electrical energy storage systems: A comparative life cycle cost analysis. Renew. Sustain. Energy Rev. 2015, 42, 569–596. [Google Scholar] [CrossRef]
  27. Ahmad, A.; Khan, A.; Javaid, N.; Hussain, H.M.; Abdul, W.; Almogren, A.; Alamri, A.; Niaz, I.A. An optimized home energy management system with integrated renewable energy and storage resources. Energies 2017, 10, 549. [Google Scholar] [CrossRef]
  28. Sigrist, L.; Lobato, E.; Rouco, L. Energy storage systems providing primary reserve and peak shaving in small isolated power systems: An economic assessment. Int. J. Electr. Power 2013, 53, 675–683. [Google Scholar] [CrossRef]
  29. Barton, J.P.; Infield, D.G. Energy storage and its use with intermittent renewable energy. IEEE Trans. Energy Convers. 2004, 19, 441–448. [Google Scholar] [CrossRef]
  30. Levron, Y.; Shmilovitz, D. Power systems’ optimal peak-shaving applying secondary storage. Electr. Power Syst. Res. 2012, 89, 80–84. [Google Scholar] [CrossRef]
  31. Aneke, M.; Wang, M. Energy storage technologies and real life applications—A state of the art review. Appl. Energy 2016, 179, 350–377. [Google Scholar] [CrossRef]
  32. Sinha, S.; Chandel, S.S. Improving the reliability of photovoltaic-based hybrid power system with battery storage in low wind locations. Sustain. Energy Technol. Assess. 2017, 19, 146–159. [Google Scholar] [CrossRef]
  33. Caruana, C.; Sattar, A.; Al-Durra, A.; Muyeen, S.M. Real-time testing of energy storage systems in renewable energy applications. Sustain. Energy Technol. Assess. 2015, 12, 1–9. [Google Scholar] [CrossRef]
  34. Deveau, J.; White, C.; Swan, L.G. Lead-acid battery response to various formation levels—Part A: Recommended formation levels for off-grid solar and conventional applications. Sustain. Energy Technol. Assess. 2015, 11, 1–10. [Google Scholar] [CrossRef]
  35. Deveau, J.; White, C.; Swan, L.G. Lead-acid battery response to various formation levels—Part B: Internal resistance. Sustain. Energy Technol. Assess. 2015, 11, 126–133. [Google Scholar] [CrossRef]
  36. Sharma, A.; Shukla, A.; Chen, C.R.; Wu, T.N. Development of phase change materials (PCMs) for low temperature energy storage applications. Sustain. Energy Technol. Assess. 2014, 7, 17–21. [Google Scholar] [CrossRef]
  37. Muller, M.; Vierstein, L.; Truong, C.N.; Eiting, A.; Hesse, H.C.; Witzmann, R.; Jossen, A. A review of recent developments of photovoltaics integrated with battery storage systems and related feed-in tariff policies. J. Energy Storage 2017, 9, 1–11. [Google Scholar]
  38. Bayod-Rújula, A.A.; Burgio, A.; Leonowicz, Z.; Menniti, D.; Pinnarelli, A.; Sorrentino, N. Recent developments of photovoltaics integrated with battery storage systems and related feed-in tariff policies: A review. Int. J. Photoenergy 2017, 2017, 1–12. [Google Scholar] [CrossRef]
  39. Kim, J.; Suharto, Y.; Daim, T. Evaluation of Eelectrical Energy Storage (EES) technologies for renewable energy: A case from the US Pacific Northwest. J. Energy Storage 2017, 11, 25–54. [Google Scholar] [CrossRef]
  40. Akinyele, D.; Levron, Y. The Environmental Impact of Distributed Energy Resources (DERs) in Modern Electric Power Systems. IEEE Smart Grid Newslett. 2017. Available online: https://www.researchgate.net/publication/314400187_The_Environmental_Impact_of_Distributed_Energy_Resources_DERs_in_Modern_Electric_Power_Systems (accessed on 15 September 2017).
  41. Jung, J.; Zhang, L.; Zhang, J. Lead-Acid Battery Technologies: Fundamentals, Materials, and Applications, 1st ed.; CRC Press: Boca Raton, FL, USA, 2015. [Google Scholar]
  42. Whittingham, M.S. History, evolution, and future status of energy storage. Proc. IEEE 2012, 100, 1518–1534. [Google Scholar] [CrossRef]
  43. Energy Storage Association. Available online: http://energystorage.org (accessed on 15 September 2017).
  44. Díaz-González, F.; Sumper, A.; Gomis-Bellmunt, O.; Villafáfila-Robles, R. A review of energy storage technologies for wind power applications. Renew. Sustain. Energy Rev. 2012, 16, 2154–2171. [Google Scholar] [CrossRef]
  45. EPRI and the U.S. Department of Energy. EPRI-DOE Handbook of Energy Storage for Transmission and Distribution Applications; Technical Report; Electric Power Research Institute (EPRI): Palo Alto, CA, USA, 2003.
  46. Yang, Z.; Zhang, J.; Kintner-Meyer, M.C.W.; Lu, X.; Choi, D.; Lemmon, J.P.; Liu, J. Electrochemical energy storage for green grid. Chem. Rev. 2011, 111, 3577–3613. [Google Scholar] [CrossRef] [PubMed]
  47. Hadjipaschalis, I.; Poullikkas, A.; Efthimiou, V. Overview of current and future energy storage technologies for electric power applications. Renew. Sustain. Energy Rev. 2009, 13, 1513–1522. [Google Scholar] [CrossRef]
  48. Hannan, M.A.; Hoque, M.M.; Mohamed, A.; Ayob, A. Review of energy storage systems for electric vehicle applications: Issues and challenges. Renew. Sustain. Energy Rev. 2017, 69, 771–789. [Google Scholar] [CrossRef]
  49. Battery University. History of Battery Advancements. Available online: http://batteryuniversity.com/learn/article/battery_developments (accessed on 15 September 2017).
  50. Nguyen, T.; Savinell, R.F. Flow Batteries. Electrochem. Soc. Interface 2010, 19, 54–56. [Google Scholar]
  51. Eyer, J.M.; Iannucci, J.J.; Butler, P.C. Estimating Electricity Storage Power Rating and Discharge Duration for Utility Transmission and Distribution Deferral. A study for the DOE Energy Storage Program; Technical Report; United States Department of Energy: Washington, DC, USA, 2005.
  52. Taylor, E.J. Flow battery structures to improve performance and reduce manufacturing cost. In Proceedings of the Energy Storage Program Peer Review and Update Meeting, Washington, DC, USA, 26–28 September 2012. [Google Scholar]
  53. Modiba, P. Electrolytes for Redox Flow Battery Systems. Ph.D. Thesis, University of Stellenbosch, Stellenbosch, South Africa, 2010. [Google Scholar]
  54. Van der Linden, S. Bulk energy storage potential in the USA, current developments and future prospects. Energy 2006, 31, 3446–3457. [Google Scholar] [CrossRef]
  55. Antonucci, V. Battery energy storage technologies for power system. In Proceedings of the Workshop on International Partnership for Hydrogen and Fuel Cells in the Economy, Seville, Spain, 15–16 November 2012; pp. 1–27. [Google Scholar]
  56. Linden, D.; Reddy, T.B. Handbook of Batteries, 3rd ed.; McGraw-Hill: New York, NY, USA, 2002. [Google Scholar]
  57. Divya, K.C.; Østergaard, J. Battery energy storage technology for power systems—An overview. Electr. Power Syst. Res. 2009, 79, 511–520. [Google Scholar] [CrossRef]
  58. Weber, A.Z.; Mench, M.M.; Meyers, J.P.; Ross, P.N.; Gostick, J.T.; Liu, Q. Redox flow batteries: A review. J. Appl. Electrochem. 2010, 41, 1137. [Google Scholar] [CrossRef]
  59. Schoenung, S.M. Energy Storage Systems Cost Update: A Study for the DOE Energy Storage Systems Program; Technical Report; Sandia National Laboratories: Livermore, CA, USA, 2011. [Google Scholar]
  60. Schoenung, S.M. Characteristics and Technologies for Long- vs. Short-Term Energy Storage: A Study by the DOE Energy Storage Systems Program; Technical Report; Sandia National Laboratories: Livermore, CA, USA, 2001. [Google Scholar]
  61. Barin, A.; Canha, L.N.; Magnago, K.; da Rosa Abaide, A. Fuzzy multi-sets and multi-rules: Analysis of hybrid systems concerning renewable sources with conventional and flow batteries. In Proceedings of the International Conference on Intelligent System Applications to Power Systems, Curitiba, Brazil, 8–12 November 2009; pp. 1–6. [Google Scholar]
  62. Taylor, P.; Bolton, R.; Stone, D.; Zhang, X.P.; Martin, C.; Upham, P.; Li, Y.; Porter, R.; Bonvallet, E.P. Pathways for Energy Storage in the UK; Technical Report; Centre for Low Carbon Futures: Birmingham, UK, 2012. [Google Scholar]
  63. Guney, M.S.; Tepe, Y. Classification and assessment of energy storage systems. Renew. Sustain. Energy Rev. 2017, 75, 1187–1197. [Google Scholar] [CrossRef]
  64. Baker, J. New technology and possible advances in energy storage. Energy Policy 2008, 36, 4368–4373. [Google Scholar] [CrossRef]
  65. Electropedia. Available online: http://www.mpoweruk.com/ (accessed on 15 September 2017).
  66. Akinyele, D.O.; Rayudu, R.K.; Nair, N.K.C. Life cycle impact assessment of photovoltaic power generation from crystalline silicon-based solar modules in Nigeria. Renew. Energy 2017, 101, 537–549. [Google Scholar] [CrossRef]
  67. The National Agency for Science and Engineering Infrastructure (NASENI). The Karshi Solar Panel Plant. Available online: http://www.naseni.org/ (accessed on 15 September 2017).
  68. Yue, D.; You, F.; Darling, S.B. Domestic and overseas manufacturing scenarios of silicon-based photovoltaics: Life cycle energy and environmental comparative analysis. Sol. Energy 2014, 105, 669–678. [Google Scholar] [CrossRef]
  69. Markvart, T.; Castañer, L. Practical Handbook of Photovoltaic: Fundamentals and Applications, 1st ed.; Elsevier: Oxford, UK, 2003. [Google Scholar]
  70. Mohanty, P.; Muneer, T.; Kolhe, M.L. Solar Photovoltaic Systems Application: A Guide for Off-grid Electrification; Springer: Cham, Switzerland, 2015. [Google Scholar]
  71. Bortolini, M.; Gamberi, M.; Graziani, A.; Pilati, F. Economic and environmental bi-objective design of an off-grid photovoltaic-battery-diesel generator hybrid energy system. Energy Convers. Manag. 2015, 106, 1024–1038. [Google Scholar] [CrossRef]
  72. Fthenakis, V.; Frischknecht, R.; Raugei, M.; Kim, H.C.; Alsema, E.; Held, M.; de Wild-Scholten, M. Methodology Guidelines on Life Cycle Assessment of Photovoltaic Electricity; Technical Report; International Energy Agency Photovoltaic Power Systems Programme: Upton, MA, USA, 2011. [Google Scholar]
  73. Alsema, E.A. Environmental Life Cycle Assessment of Solar Home Systems; Technical Report; Department of Science Technology and Society, Utrecht University: Utrecht, The Netherlands, 2000. [Google Scholar]
  74. Bubenzer, A.; Luther, J. Photovoltaics Guidebook for Decision-Makers: Technological Status and Potential Role in Energy Economy, 1st ed.; Springer: Berlin/Heidelberg, Germany, 2003. [Google Scholar]
  75. Fthenakis, V.M.; Kim, H.C. Photovoltaics: Life-cycle analyses. Sol. Energy 2011, 85, 1609–1628. [Google Scholar] [CrossRef]
  76. Ito, M. Life Cycle Assessment of PV systems, Crystalline Silicon—Properties and Uses; InTech: Rijeka, Croatia, 2011. [Google Scholar]
  77. Laleman, R.; Albrecht, J.; Dewulf, J. Comparing Various Indicators for the LCA of Residential Photovoltaic Systems. In Life Cycle Assessment of Renewable Energy Sources; Green Energy and Technology; Springer: London, UK, 2013; pp. 211–239. [Google Scholar]
  78. Bhandari, K.P.; Collier, J.M.; Ellingson, R.J.; Apul, D.S. Energy payback time (EPBT) and energy return on energy invested (EROI) of solar photovoltaic systems: A systematic review and meta-analysis. Renew. Sustain. Energy Rev. 2015, 47, 133–141. [Google Scholar] [CrossRef]
  79. Fthenakis, V.; Betita, R.; Shields, M.; Vinje, R.; Blunden, J. Life cycle analysis of high performance monocrystalline silicon photovoltaic systems: Energy payback times and net energy production value. In Proceedings of the European Photovoltaic Solar Energy Conference and Exhibition, Frankfurt, Germany, 24–28 September 2012; pp. 4667–4671. [Google Scholar]
  80. Fthenakis, V.M.; Kim, H.C.; Alsema, E. Emissions from Photovoltaic Life Cycles. Environ. Sci. Technol. 2008, 42, 2168–2174. [Google Scholar] [CrossRef] [PubMed]
  81. Schaefer, H.; Hagedorn, G. Hidden energy and correlated environmental characteristics of P.V. power generation. Renew. Energy 1992, 2, 159–166. [Google Scholar] [CrossRef]
  82. Kommalapati, R.; Kadiyala, A.; Shahriar, M.T.; Huque, Z. Review of the life cycle greenhouse gas emissions fom different photovoltaic and concentrating solar power electricity generation systems. Energies 2017, 10, 350. [Google Scholar] [CrossRef]
  83. HOMER Energy. Available online: https://www.homerenergy.com/ (accessed on 15 September 2017).
  84. Akinyele, D.O.; Rayudu, R.K.; Nair, N.K.C. Development of photovoltaic power plant for remote residential applications: The socio-technical and economic perspectives. Appl. Energy 2015, 155, 131–149. [Google Scholar] [CrossRef]
  85. Trojan Battery. Renewable Energy Battery Sizing Calculator. Available online: http://www.batterysizingcalculator.com/ (accessed on 15 September 2017).
  86. Shen, W.X. Optimally sizing of solar array and battery in a standalone photovoltaic system in Malaysia. Renew. Energy 2009, 34, 348–352. [Google Scholar] [CrossRef]
  87. Delavaripour, H.; Karshenas, H.R.; Bakhshai, A.; Jain, P. Optimum battery size selection in standalone renewable energy systems. In Proceedings of the INTELEC 2011—2011 33rd International Telecommunications Energy Conference, Amsterdam, The Netherlands, 9–13 October 2011; pp. 1–7. [Google Scholar]
  88. International Electrotechnical Commission. Recommendations for Renewable Energy and Hybrid Systems for Rural Electrification—Part 4: System Selection and Design; Technical Report; International Electrotechnical Commission: Geneva, Switzerland, 2017. [Google Scholar]
  89. Rolls Battery Engineering. Available online: http://www.rollsbattery.com/ (accessed on 15 September 2017).
  90. US Battery Manufacturing Company. Available online: http://usbattery.com/ (accessed on 15 September 2017).
  91. REN21. Renewables 2017 Global Status Report; Technical Report; Renewable Energy Policy Network for the 21st Century: Paris, France, 2017. [Google Scholar]
  92. Vision Battery. Available online: http://www.vision-batt.com/ (accessed on 15 September 2017).
  93. Hoppecke Battery. Available online: https://www.hoppecke.com/en/ (accessed on 15 September 2017).
  94. McKeon, B.B.; Furukawa, J.; Fenstermacher, S. Advanced lead-acid batteries and the development of grid-scale energy storage systems. Proc. IEEE 2014, 102, 951–963. [Google Scholar] [CrossRef]
  95. The Schumacher Centre for Technology and Development. Available online: http://www.worldwidehelpers.org/ (accessed on 15 September 2017).
  96. UltraBattery Performance Benefits. Available online: http://ultrabattery.com/technology/ultrabattery-performance-benefits/ (accessed on 15 September 2017).
  97. CSIROpedia: UltraBattery. Available online: http://csiropedia.csiro.au/ultrabattery/ (accessed on 15 September 2017).
  98. Ecoult. UltraBattery Energy Storage: A New Dimension in Lead-Acid Battery Technology. Available online: http://www.ecoult.com/ (accessed on 15 September 2017).
  99. Li, G.; Lu, X.; Kim, J.Y.; Viswanathan, V.V.; Meinhardt, K.D.; Engelhard, M.H.; Sprenkle, V.L. An advanced Na–FeCl2 ZEBRA battery for stationary energy storage application. Adv. Energy Mater. 2015, 5, 1–7. [Google Scholar] [CrossRef]
  100. Kim, B.R.; Jeong, G.; Kim, A.; Kim, Y.; Kim, M.G.; Kim, H.; Kim, Y.J. High performance Na–CuCl2 rechargeable battery toward room temperature ZEBRA-type battery. Adv. Energy Mater. 2016, 6, 1–7. [Google Scholar] [CrossRef]
  101. Zhang, X.; Cheng, X.; Zhang, Q. Nanostructured energy materials for electrochemical energy conversion and storage: A review. J. Energy Chem. 2016, 25, 967–984. [Google Scholar] [CrossRef]
  102. Sun, Y.; Liu, N.; Cui, Y. Promises and challenges of nanomaterials for lithium-based rechargeable batteries. Nat. Energy 2016, 1, 1607. [Google Scholar] [CrossRef]
  103. Aricò, A.S.; Bruce, P.; Scrosati, B.; Tarascon, J.M.; van Schalkwijk, W. Nanostructured materials for advanced energy conversion and storage devices. Nat. Mater. 2005, 4, 366–377. [Google Scholar] [CrossRef] [PubMed]
  104. Nitta, N.; Wu, F.; Lee, J.T.; Yushin, G. Li-ion battery materials: Present and future. Mater. Today 2015, 18, 252–264. [Google Scholar] [CrossRef]
  105. Das, S.K.; Lau, S.; Archer, L.A. Sodium-oxygen batteries: A new class of metal-air batteries. J. Mater. Chem. A 2014, 2, 12623–12629. [Google Scholar] [CrossRef]
  106. Zhang, X.; Wang, X.G.; Xie, Z.; Zhou, Z. Recent progress in rechargeable alkali metal-air batteries. Green Energy Environ. 2016, 1, 4–17. [Google Scholar] [CrossRef]
  107. Li, Y.; Lu, J. Metal-Air Batteries: Will They Be the Future Electrochemical Energy Storage Device of Choice? ACS Energy Lett. 2017, 2, 1370–1377. [Google Scholar] [CrossRef]
  108. Albright, G.; Edie, J.; Al-Hallaj, S. A Comparison of Lead Acid to Lithium-Ion in Stationary Storage Applications; ALLCELL Technologies LLC: Chicago, IL, USA, 2012; pp. 1–14. [Google Scholar]
  109. Akinyele, D.O. Techno-Economic and Life-Cycle Impact Analysis of Solar Photovoltaic Microgrid Systems for Off-Grid Communities. Ph.D. Thesis, Victoria University of Wellington, Wellington, New Zealand, 2016. [Google Scholar]
  110. Louie, H.; Dauenhauer, P.; Wilson, M.; Zomers, A.; Mutale, J. Eternal light: Ingredients for sustainable off-grid energy development. IEEE Power Energy Mag. 2014, 12, 70–78. [Google Scholar]
Figure 1. Schematic diagram illustrating the operation of a battery system [16].
Energies 10 01760 g001
Figure 2. Diagram of NaS battery [1,4].
Energies 10 01760 g002
Figure 3. Charge/discharge operation of NiCd battery [48].
Energies 10 01760 g003
Figure 4. Lithium-ion battery electrochemistry [48].
Energies 10 01760 g004
Figure 5. Schematic diagram of a flow battery [1,54].
Energies 10 01760 g005
Figure 6. Zinc-bromine battery [48].
Energies 10 01760 g006
Figure 7. Schematic diagram illustrating the operation of a VRB [16].
Energies 10 01760 g007
Figure 8. Peak sun hour of the locations [66].
Energies 10 01760 g008
Figure 9. Load profiles of the houses [66].
Energies 10 01760 g009
Figure 10. PV array’s yearly energy output [66].
Energies 10 01760 g010
Figure 11. Different battery sizes.
Energies 10 01760 g011
Figure 12. Technology selection for NE location.
Energies 10 01760 g012
Figure 13. Technology selection for NW location.
Energies 10 01760 g013
Figure 14. Technology selection for NC location.
Energies 10 01760 g014
Figure 15. Technology selection for SE location.
Energies 10 01760 g015
Figure 16. Technology selection for SS location.
Energies 10 01760 g016
Figure 17. Technology selection for SW location.
Energies 10 01760 g017
Figure 18. Surette S 460 cell cycling capacity and the DoD [89].
Energies 10 01760 g018
Figure 19. USB US-305 cell cycling capacity and the DoD [90].
Energies 10 01760 g019
Figure 20. CG2 800 cell cycling capacity and the DoD [92].
Energies 10 01760 g020
Figure 21. Battery cycling capacity and the lifespan.
Energies 10 01760 g021
Figure 22. GHG impact of the PV and battery.
Energies 10 01760 g022
Figure 23. Effect of increased DoD on GHG impact.
Energies 10 01760 g023
Figure 24. Structure of the UltraBattery technology [41,94].
Energies 10 01760 g024
Table 1. History of battery developments [42].
YearInventionInventor
1600Establishment of electrochemistry studyWilliam Gilbert (UK)
1745Invention of Leyden jar. Stores static electricityEwald Georg von Kleist (NL)
1791Discovery of animal electricityLuigi Galvani (Italy)
1800Invention of the voltaic cell (zinc, copper disks)Alessandro Volta (Italy)
1802First electric battery capable of mass productionWilliam Cruickshank (UK)
1820Electricity through magnetismAndré-Marie Ampère (France)
1833Announcement of the Faraday’s lawMichael Faraday (UK)
1836Invention of the Daniell cellJohn F. Daniell (UK)
1839Invention of the fuel cell (H 2 /O 2 )William Robert Grove (UK)
1859Invention of the lead acid batteryGaston Planté (France)
1868Invention of the Leclanché cell (carbon-zinc)Georges Leclanché (France)
1881Invention of lead grid lattice (current system)Camile Alphonse Faure (France)
1899Invention of the nickel-cadmium batteryWaldemar Jungner (Sweden)
1901Invention of the nickel-iron batteryThomas A. Edison (USA)
1932Invention of the sintered pole plateSchlecht & Ackermann (Germany)
1947Successful sealing of the nickel-cadmium batteryGeorg Neumann (Germany)
1949Invention of the alkaline-manganese batteryLewis Urry, Eveready Battery
1970sDevelopment of valve-regulated lead acid batteryGroup effort
1990Commercialization of nickel-metal-hydride batteryGroup effort
1991Commercialization of lithium-ion batterySony (Japan)
1994Commercialization of lithium-ion polymerBellcore (USA)
1995Introduction of pouch cell using Li-polymerGroup effort
1995Proposal of industry standard for SMBusDuracell and Intel
1996Introduction of Li-ion with manganese cathodeMoli Energy (Canada)
1996Identification of Li-phosphate (LiFePO 4 )University of Texas (USA)
2002Improvement of Li-phosphate,University of Montreal, Quebec Hydro,
nanotechnology, commercializationMIT, others
2002Various patents filed on nanomaterials for batteriesGroup effort
Table 2. Cost and development status comparison of the battery technologies.
TechnologyDevelopment StatusEnergy Capital Cost ($/kWh)Power Capital Cost ($/kWh)Environmental Influence
Lead-acidMature [1,16,24]200–400 [1,16,41], 364 [26], 330 [59]200–300 [60], 200–400 [24], 300–600 [1,16], 400 [16,59]toxic remains; requires recycling
NaSDeveloped/ Commercialized [1,16,24]275 [26], 300–500 [1], 350 [59], 450 [61]300–500 [24], 350–3000 [62], 1000–3000 [1,16]
NiCdDeveloped/ Commercialized [1,16,24]474 [26], 500–1500 [1,16,62]500–1500 [1,16], 400–2400 [62]highly toxic; recycling is required
Li-ionDeveloped/Early stage technology [1,16,24]695 [26], 900–1300 [63], 1590 [14], 1200–4000 [1,16]300–500 [24], 600–2500 [1,16], 2770–3800 [14]
ZnBrDeveloped [1]200 [60], 400 [57], 700–2500 [1]150–1000 [1], 500 [64]
ZEBRACommercialized stage100–200 [1]150–300 [1]
VRBDemonstration/Early commercialization stage [1,15]600–1500 [1,16]150—1000 [1,24], 600 [61]toxic remains
PSBDeveloping stage [1,16]700–2500 [1,16]150–1000 [1], 450 [61]bromine and sodium sulphate crystals are produced, which may have a negative impact
Table 3. Comparison of the advantages and the shortcomings of the technologies [1,15,16,65].
TechnologyAdvantagesShortcoming
Lead-acidLow cost, mature and readily available, reliable and easily replaced, suitable for power quality, UPS and spinning reserve applications.High maintenance requirement, short cycling capability, low power and energy density, Slow charge, Low weight-to-energy ratio, thermal management requirement, and has an environmental hazard (i.e., toxic component).
NaSRelatively high power and energy density, efficient, economical for power quality and peak shaving purposes.Heat source requirement, high cost.
NiCdRelatively high energy density, relatively low cycling capability, high mechanical resistance, low maintenance requirement, suitable for power tools, emergency lighting, generator starting, telecoms and portable devices.High cost, environmental hazard (e.g., toxic heavy metal “cadmium”), memory effect in which case the charge on the battery becomes full after a couple of full discharges.
Li-ionRelatively high power and density, almost 100% efficient, higher cycling capacity, fast response to charge and discharge operations.High cost, degrades at high temperatures.
ZEBRAAbility to withstand limited overcharge and discharge with a better safety features and a relatively high electrochemical cell voltage (2.58 V), suitable for load-leveling applications in the industry.Lower power and energy density compared to NaS, suitable for large capacity applications (>20 kWh capacity), only one manufacturer produces this battery technology (i.e., Beta R&D in the UK).
VRBHigh round-trip efficiency (RTE), suitable for improved power quality, UPS, peak-shaving, integration of renewable resources.
PSBOperates at room temperature.Relatively low DC output voltage (about 1.5 V).
ZnBr Lower RTE and lifespan compared to the conventional lead-acid, suffers material corrosion and dendrite formation.
Redox Flow batteriesRelatively high power and energy density, useful for large-scale applications.High cost, complex standardization.
Table 4. Input parameters.
ParameterValueRef.
A D 1.5[5]
η b (%)85[5]
DoD (%)50[84]
V N (V)24[5]
P R (%)80[72]
i (%)6[83]
d (%)6[83]
Cost of S460 ($)250[83]
Cost of US 305 ($)250[83]
Cost of CG2 ($)350[83]
PV array LCER (g CO 2 -eq./kWh)37.3–72.2[68]
Battery LCER (g CO 2 -eq./kWh)24,250[71]
Inverter LCER (g CO 2 -eq./kW)26,300[71]
Inverter lifespan (yr)8
Table 5. Selected battery cells.
SiteBattery Capacity (Ah)Type/SpecificationConfiguration# of Cells
NE925Surette S 460, (6 V 460 Ah), Flooded lead acid [89]2 strings of 4 cells8
NW919Surette S 460 (6 V 460 Ah), Flooded lead acid [89]2 strings of 4 cells8
NC620USB US-305 (6 V 305 Ah), Flooded lead acid [90]1 string of 4 cells4
SE635USB US-305 (6 V 305 Ah), Flooded lead acid [90]2 strings of 4 cells8
SS611USB US-305 (6 V 305 Ah), Flooded lead acid [90]2 strings of 4 cells8
SW794CG2 800 (2 V 800 Ah) Flooded lead acid [92]1 string of 12 cells12
Table 6. The impact of the PV, battery and the inverter components.
ComponentGHG Impact (kg CO 2 -eq.)Impact (%)
PV array1907–581944.9–64.0
Inverter28–420.46–0.66
Battery2311–322935.52–54.43
PV array + Inverter + Battery4246–9090
Table 7. Parameters of the metal-air batteries [106].
BatteryVoltage (V)Theoretical Specific Capacity (Ah/kg)Theoretical Energy Density (Wh/kg)
Al-air2.7110302791
Mg-air3.099202843
Zn-air1.656581085
Li-air2.9611703463
Na-air2.274871105
2.336871600
K-air2.48377935

