Article

Revising the Static Geological Reservoir Model of the Upper Triassic Stuttgart Formation at the Ketzin Pilot Site for CO2 Storage by Integrated Inverse Modelling

1
Fluid Systems Modelling, GFZ German Research Centre for Geosciences, Telegrafenberg, 14473 Potsdam, Germany
2
Geothermal Energy Systems, GFZ German Research Centre for Geosciences, Telegrafenberg, 14473 Potsdam, Germany
3
Geological Storage, GFZ German Research Centre for Geosciences, Telegrafenberg, 14473 Potsdam, Germany
*
Author to whom correspondence should be addressed.
Energies 2017, 10(10), 1559; https://doi.org/10.3390/en10101559
Submission received: 8 September 2017 / Revised: 28 September 2017 / Accepted: 4 October 2017 / Published: 11 October 2017

Abstract

:
The Ketzin pilot site for CO 2 storage in Germany has been operated from 2007 to 2013 with about 67 kt of CO 2 injected into the Upper Triassic Stuttgart Formation. Main objectives of this undertaking were assessing general feasibility of CO 2 storage in saline aquifers as well as testing and integrating efficient monitoring and long-term prediction strategies. The present study aims at revising the latest static geological reservoir model of the Stuttgart Formation by applying an integrated inverse modelling approach. Observation data considered for this purpose include bottomhole pressures recorded during hydraulic testing and almost five years of CO 2 injection as well as gaseous CO 2 contours derived from 3D seismic repeat surveys carried out in 2009 and 2012. Inverse modelling results show a remarkably good agreement with the hydraulic testing and CO 2 injection bottomhole pressures (R 2 = 0.972), while spatial distribution and thickness of the gaseous CO 2 derived from 3D seismic interpretation exhibit a generally good agreement with the simulation results (R 2 = 0.699 to 0.729). The present study successfully demonstrates how the integrated inverse modelling approach, applied for effective permeability calibration in a geological model here, can substantially reduce parameter uncertainty.

1. Introduction

Geological storage of carbon dioxide (CO 2 ) in saline aquifers is considered as significant contribution to mitigation of anthropogenic greenhouse gas emissions into the atmosphere [1], and thus provides a substantial mitigation measure for climate change and ocean acidification [2] which has been widely discussed and investigated in the past two decades.
In this context, geological CO 2 storage at pilot scale has been undertaken from 2007 to 2013 at the Ketzin site in Germany with a total of about 67 kt of CO 2 injected into the Upper Triassic Stuttgart Formation at 620–650 m depth. The Ketzin project aimed at investigating efficient strategies for monitoring and predicting long-term CO 2 behaviour in the geological subsurface besides demonstrating the general feasibility of its long-term storage in saline aquifers [3,4,5,6,7,8]. Static geological and numerical modelling has been supporting site operation since the initial planning phase of the project [9,10,11,12,13,14,15,16,17,18]. With the availability of new data, the static geological model has been continuously further developed, revised and matched against field observations to enable reliable short- to long-term predictions using coupled numerical multiphase flow, hydromechanical and hydrochemical models [14,15,19,20,21]. In this context, substantial efforts have been undertaken to integrate data from ongoing on-site field tests and continuous observations as well as laboratory experiments on the Stuttgart Formation reservoir rocks with numerical simulations [12,14,19,20,22,23,24,25,26,27,28,29,30,31,32]. Recent activities especially focussed on integration of the 3D seismic survey data with other geophysical findings and numerical simulations [33,34,35,36], also in view of defining conformance criteria between geophysical monitoring and numerical model predictions to be considered in German and EU-wide regulations [37].
The present study aims at revision of the effective permeability distribution in the latest static geological reservoir model [13,16] with the help of an integrated inverse modelling approach, since the initial static model does not allow to match observations with dynamic simulation results. For that purpose, advantage of the most reliable monitoring data available is taken, including bottomhole pressures observed during hydraulic testing of the Stuttgart Formation in the wells Ktzi 200, Ktzi 201 and Ktzi 202 [38,39,40,41] as well as those observed during almost five years of CO 2 injection in the wells Ktzi 201 and Ktzi 202 [42,43,44,45,46,47,48,49]. Further observations taken into account in the process of inverse model calibration are the gaseous CO 2 contours, derived from two 3D seismic repeat surveys undertaken in 2009 and 2012, with the related baseline survey carried out before the start of CO 2 injection in 2005 [50,51]. Available geological data on the Stuttgart Formation at the Ketzin site is relatively detailed in the near-well area, compared to that in the model far-field where model alterations undertaken in the scope of a model revision cannot be validated. For this reason, an update of the facies distribution is taken into account by revising effective permeabilities according to the inverse optimization results. Hence, quantitative indicators for diverging thickness or areal extent of the sandstone channels embedded in the fluvial floodplain facies of the reservoir formation result from the presented inverse modelling procedure. Multiple facies model realizations as commonly applied for risk assessments (e.g., [21]) are disregarded in the present study, since the objective is revising one existing reservoir model, previously parametrized using the most reliable geological data retrieved at the Ketzin pilot site [15,16], and resulting in one static geological model that can be reasonably validated based on the observations made during the undertaken hydraulic testing and CO 2 injection phases. Data limiting the feasible extent of model validation include recorded bottomhole pressures and the gaseous CO 2 extent determined by 3D seismics. Hence, a far-field facies model revision would provide limited significance for the purpose of the present study, only.
In summary, it is demonstrated that the methodological approach of employing integrated inverse simulations that take into account dynamic data from site characterization and operation in one optimization run is capable to elaborate an excellent matching between observations and simulations, while uncertainties are being substantially reduced. Further, the findings are discussed in the context of previous (semi-)analytical and numerical interpretations of the hydraulic testing data [38,39,40,41].

2. Materials and Methods

2.1. Numerical Forward Models

Two numerical forward models have been developed to be applied in the present study: the first one to simulate the hydraulic testing undertaken in 2007 and a second one for simulation of the CO 2 injection period from June 2008 to January 2013. Both models are parametrized using the porosity and permeability distributions given in the latest static geological model [13,16], upscaled to the revised simulation grid (cf. Figure 1) using the Petrel software package [52]. Nested local grid refinements (LGRs) are introduced in the new simulation grid to reduce the original reservoir simulation model grid element count from more than 648,000 to 102,336, with a horizontal resolution of 6–8 m in the near-well region and up to 90 m in the far-field [32].
The numerical simulator MUFITS (BLACKOIL module, version 2015.G02) [53,54] is used to realize both forward model runs, since previous studies demonstrate that it is capable to reproduce exactly the same results for a long-term CO 2 injection period at the Ketzin site as a popular standard industry reservoir simulator [54]. The detailed parametrization of the multiphase flow model is given in Kempka et al. [11,13], Kempka and Kühn [12] and Class et al. [55], while all details on the hydraulic testing model implementation are provided in Kempka and Norden [32].

2.2. Integrated Numerical Inverse Model

Kempka and Norden [32] show that the latest revised reservoir model [13,16] requires modifications in spatial permeability distribution to achieve a good agreement (i.e., deviation between observations and simulation results below 1 bar) with bottomhole pressures observed during hydraulic testing. Kempka and Kühn [12] as well as Kempka et al. [13] further emphasize this requirement in view of successfully matching the observed bottomhole pressures and CO 2 arrival times in both observation wells (Ktzi 200 and Ktzi 202) in a long-term simulation of CO 2 injection at the Ketzin site. While inverse modelling approaches undertaken by Class et al. [55] to determine the permeability distribution were hindered by limited computational efficiency of the employed simulator, and thus did not result in a satisfactory match between observed and simulated bottomhole pressures, Kempka and Kühn [12] managed to achieve this objective using a relatively simple approach, defining different permeability multipliers for the near-well region and the far-field. However, taking into account the fluvial origin of the highly heterogeneous Stuttgart Formation with high-permeable sandstone channels embedded in a low-permeable floodplain facies, this approach does not allow to sufficiently address spatial permeability variation determined by the heterogeneous facies distribution. Consequently, a more sophisticated inverse modelling approach is required to integrate the hydraulic testing phase undertaken during site characterization with the five-year period of CO 2 injection [32].
Since previous studies indicate that reservoir permeability is the parameter of highest sensitivity [12,55], pilot points were employed for calibration of the spatial reservoir permeability distribution. For that purpose, the MUFITS simulator has been integrated with the parameter estimation tool PEST++ (version 3.5.0) [56] in a flexible simulation framework [57]. This allowed to run parallel PEST++ processes on multiple computational nodes, with each starting parallel MUFITS simulations, and thus resulting in an acceptable computational time for the 736 integrated forward model runs (hydraulic testing and CO 2 injection) carried out in 16 inverse iterations in the present study. PEST++ regularization mode is used with 157 parameters of which 53 are set adjustable, resulting in tied multipliers on the main diagonal of the permeability tensor and an additional global multiplier for the vertical-to-horizontal permeability ratio. The number of observations considered in the inverse simulation run is 153, including bottomhole pressures observed during hydraulic testing and CO 2 injection in different wells, CO 2 arrival times at the observations wells as well as the contours of the gaseous CO 2 detected by the 3D seismic repeat surveys in 2009 and 2012. The PLPROC software package [58] is used to carry out a 2D interpolation of the calculated permeability multipliers at the 52 pilot points (cf. Figure 6 and Figure 7) onto the numerical simulation grid.
The lower limit for the permeability multipliers at the pilot points is set to 1 × 10 - 4 to avoid infinitesimal permeabilities being assigned to the reservoir simulation grid, while the upper limit was set to a relatively high value of 1 × 10 10 to allow for exchanging floodplain facies by sandstone channels in the calibrated model. Further, the global multiplier for vertical permeability is allowed to vary over a range of 1 × 10 - 2 to 1 × 10 0 . 32 time-dependent bottomhole pressure observations are considered in the numerical forward model used to simulate the hydraulic testing (cf. Figure 2). In addition, the numerical forward model for simulation of CO 2 injection introduces further 89 bottomhole pressure observations (cf. Figure 4), two CO 2 arrival times and 30 geometric points to account for the outer contours of gaseous CO 2 extent in the Stuttgart Formation (cf. Figure 6 and Figure 7), detected by 3D seismics in 2009 and 2012. CO 2 arrival was observed about 21 and 271 days after the start of injection at the first (Ktzi 200) and second observation wells (Ktzi 202), respectively. Contour lines derived from the outer contours of gaseous CO 2 detected by 3D seismics are taken into account by spatial observation points with a gaseous CO 2 thickness of 5 m in 2009 (14 data points) and 7.5 m in 2012 (16 data points) following the discussion on detectability limits in Lüth et al. [37]. All bottomhole pressure observations are weighted with a value of 10, expect for outliers which exhibit weighting values of 0.1 to 1.0 depending on their impact on the overall inverse modelling results. Spatial thickness observation points are weighted with values of 0.5. The inverse modelling run ends when the pre-defined criterion, i.e., reduction of the relative objective function over a specific number of successive iterations is met.

3. Results

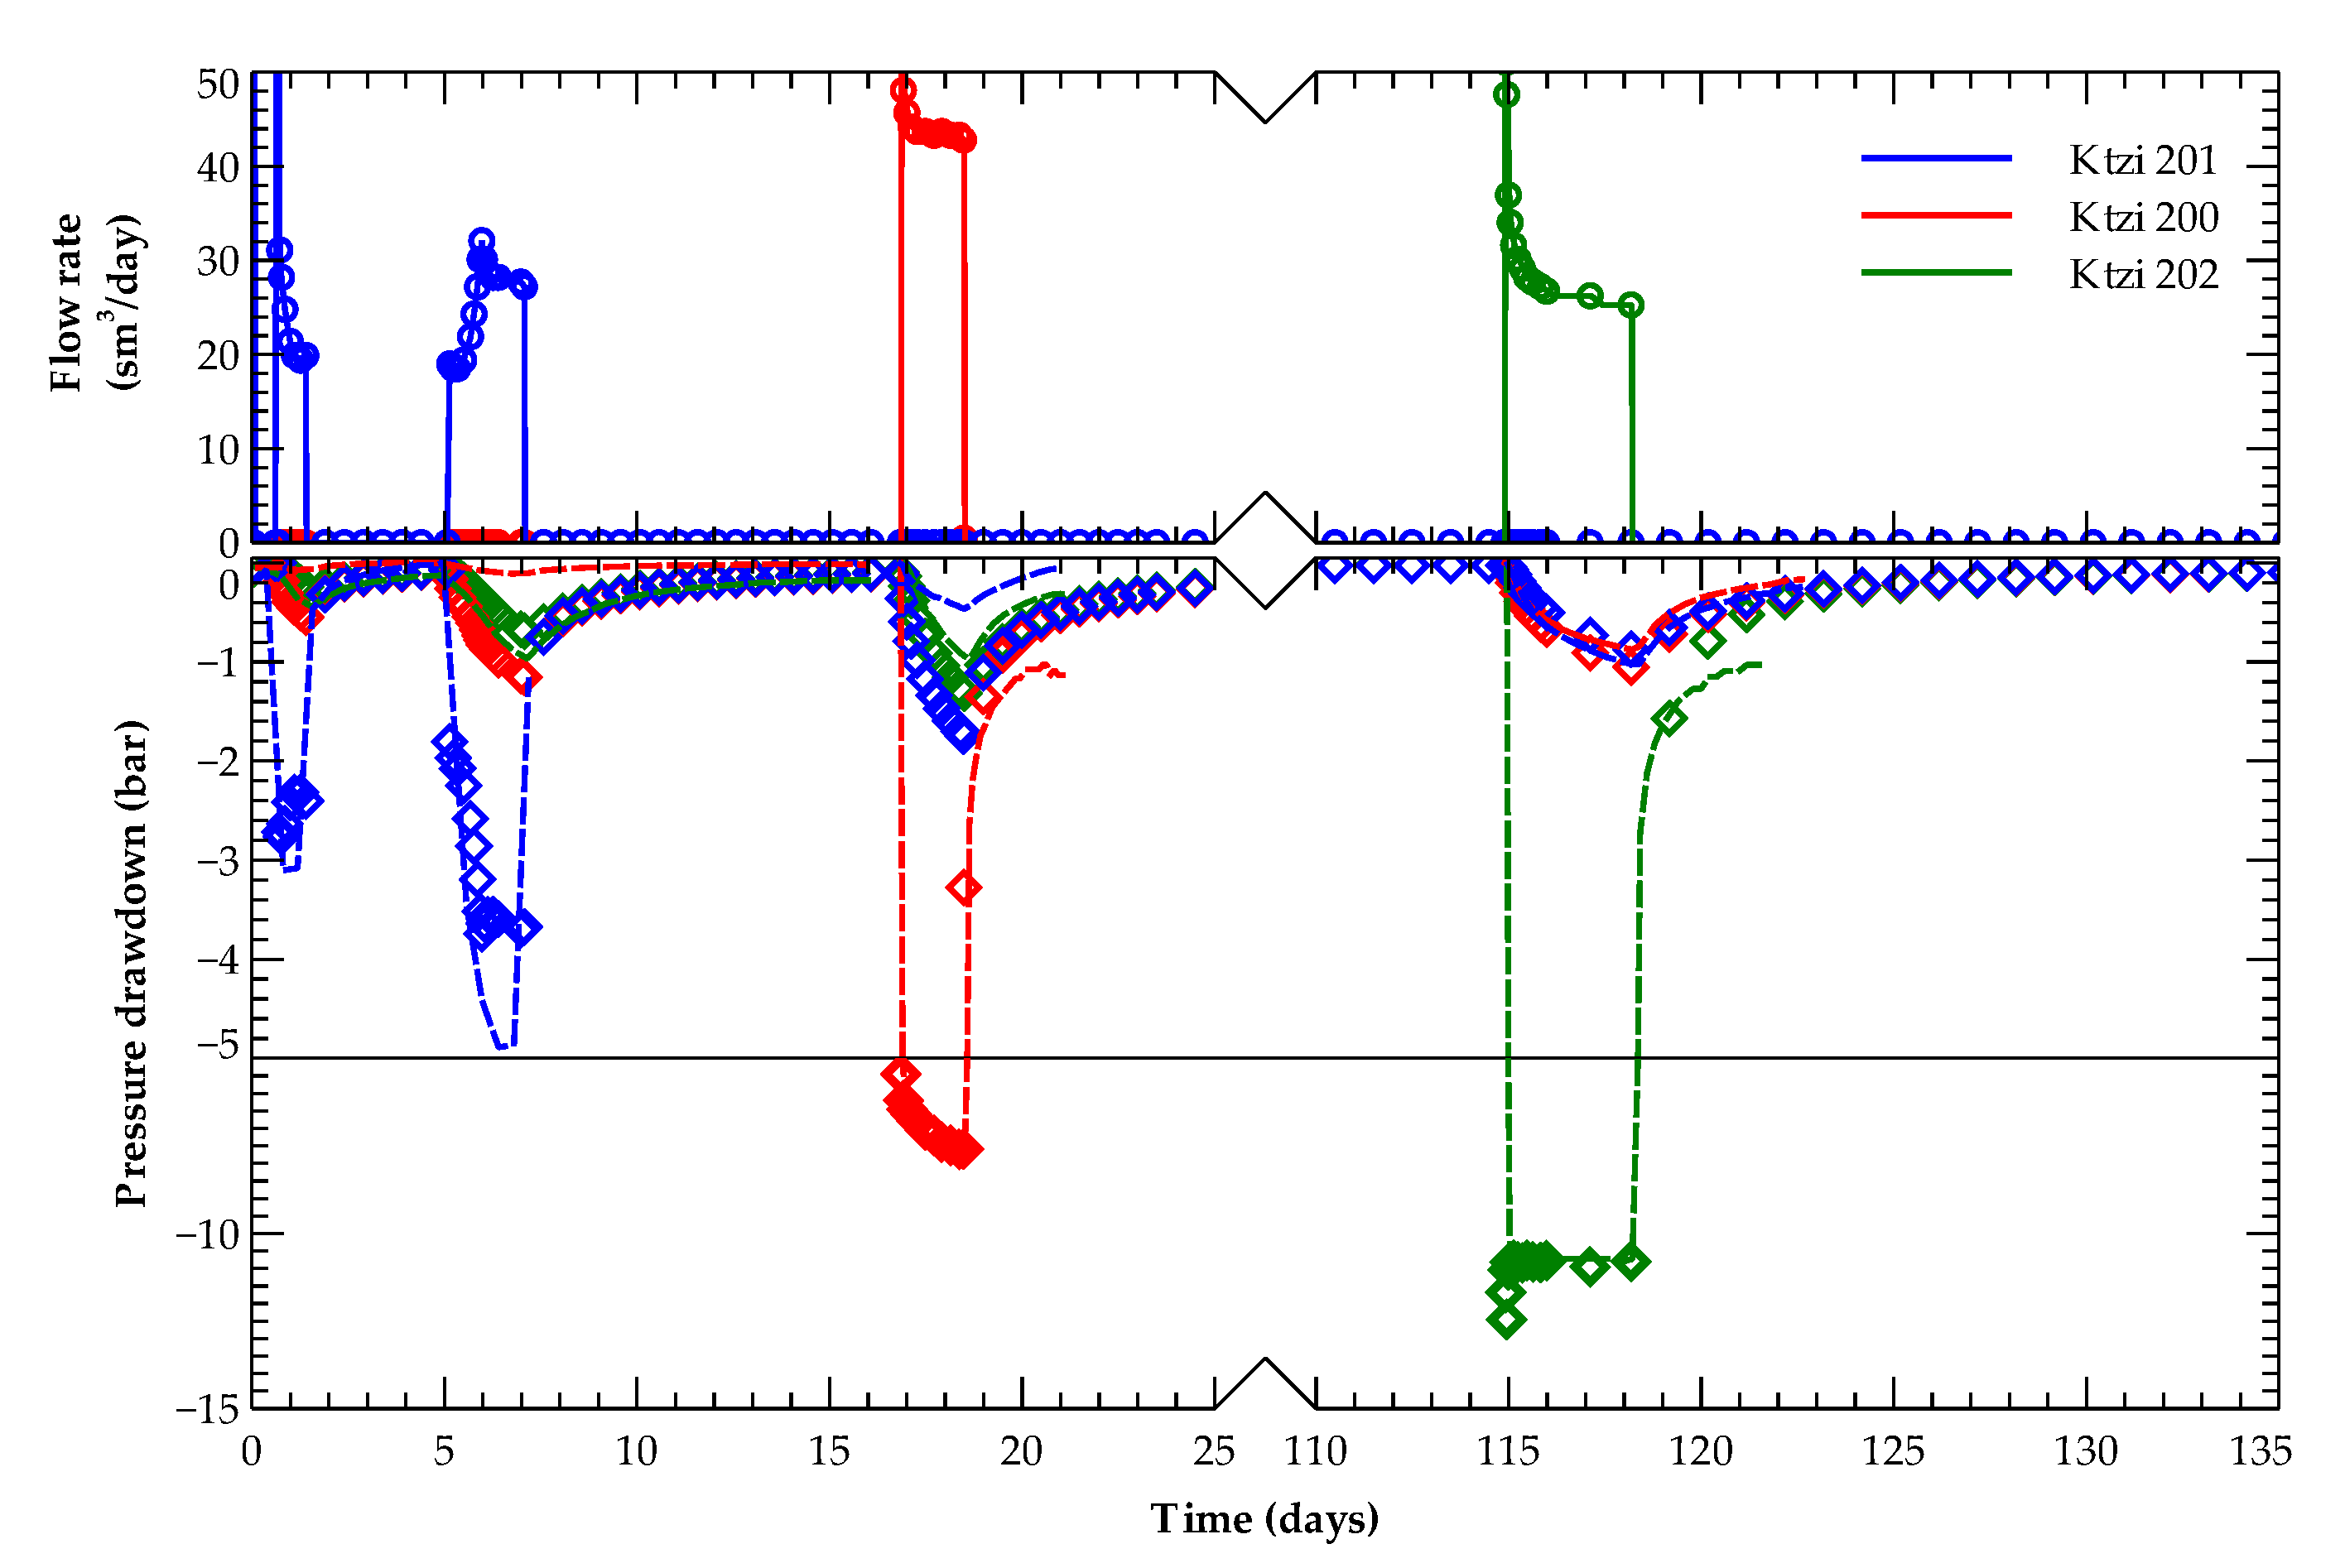
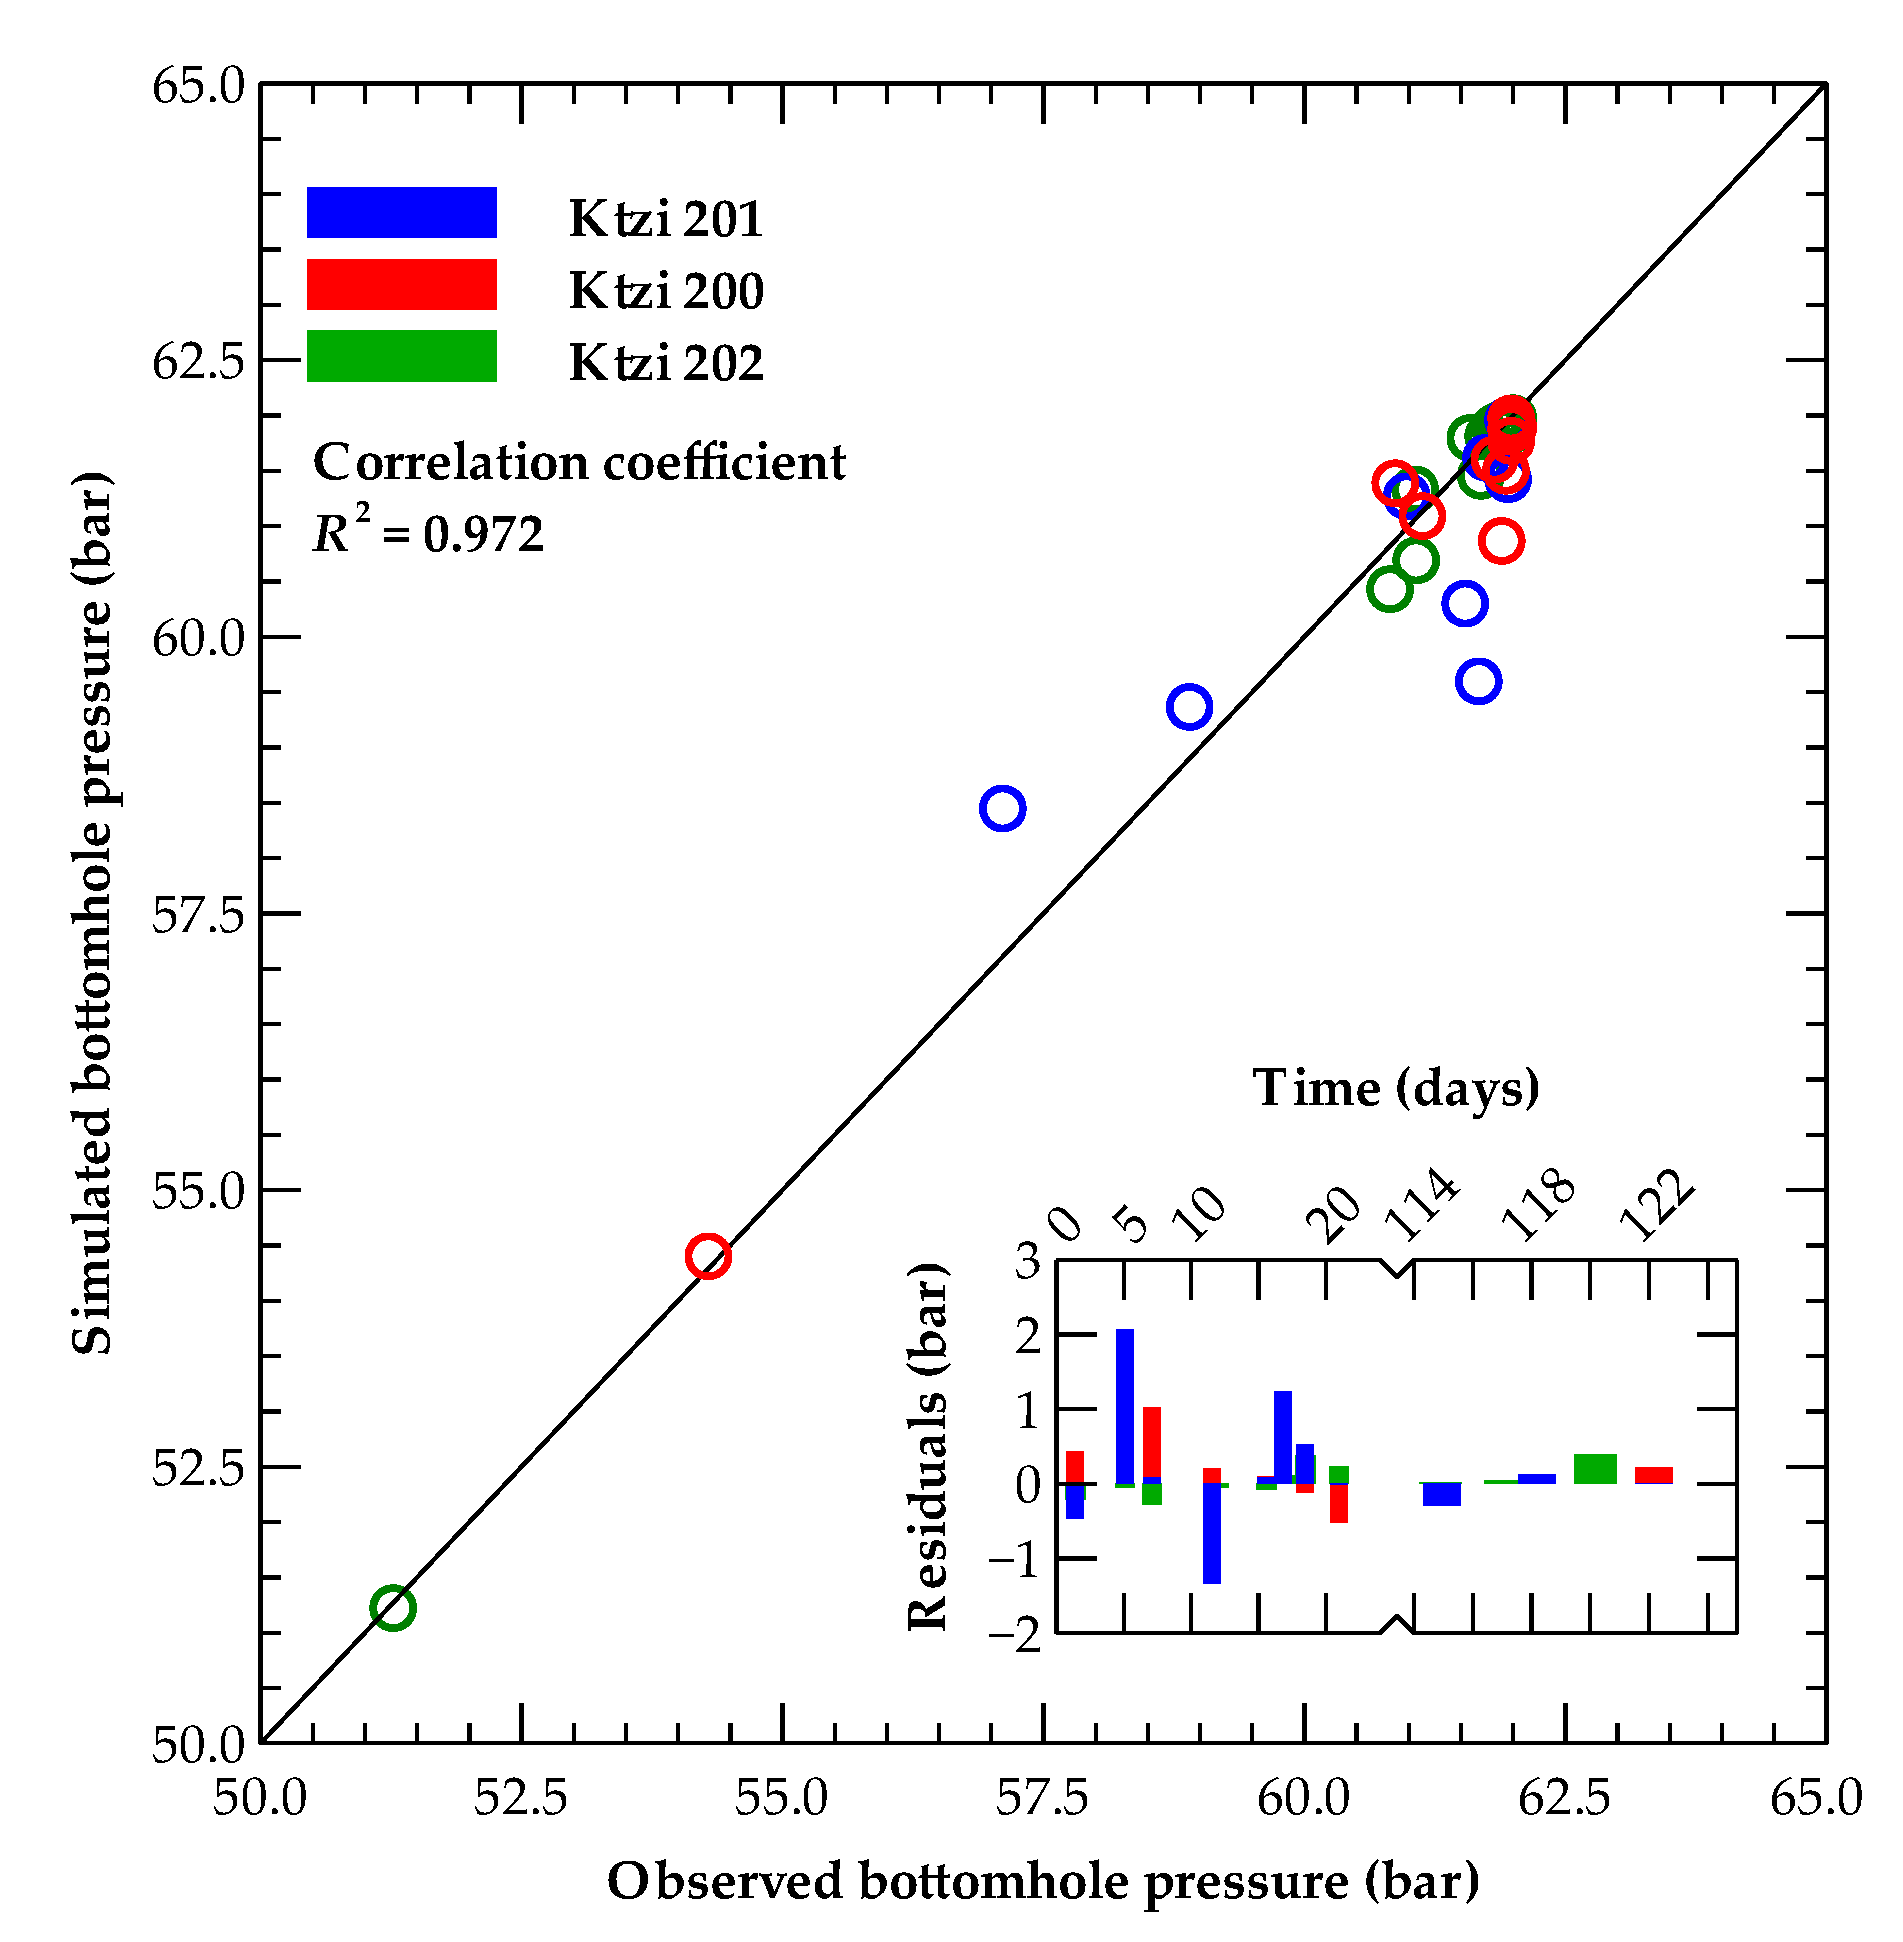
3.1. Hydraulic Testing Phase
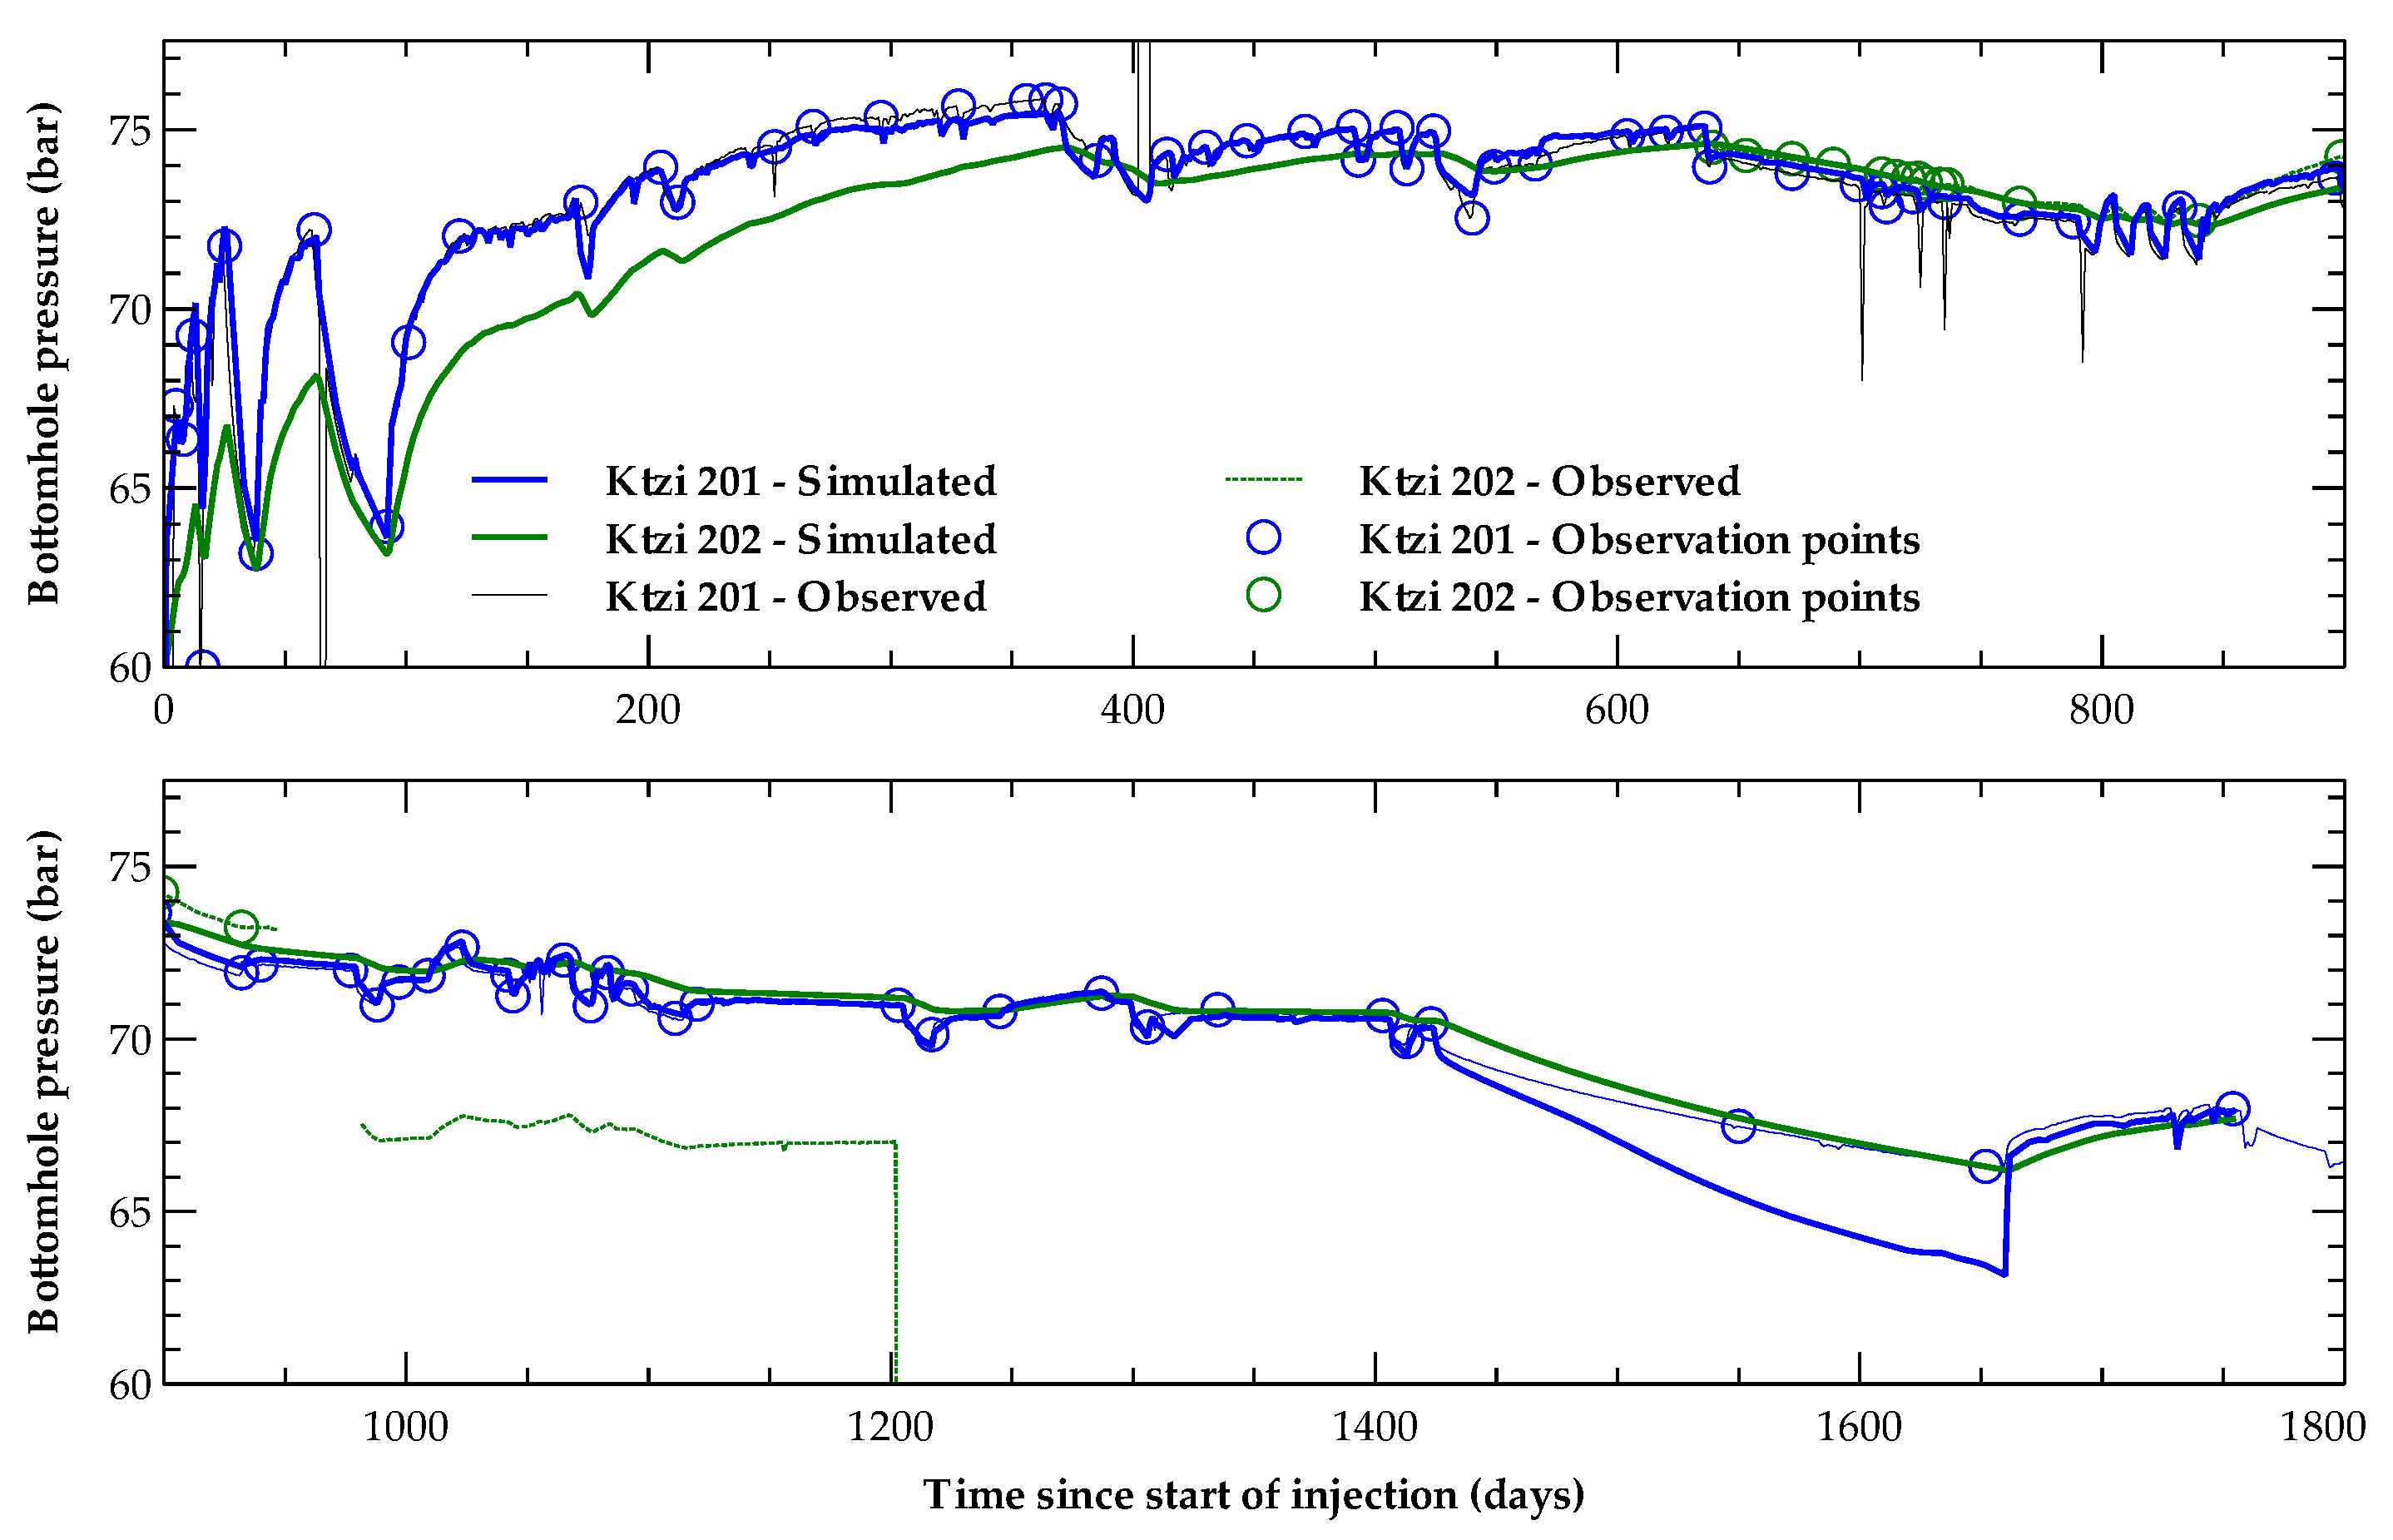
Simulation results of the hydraulic testing phase, using the static geological model after its calibration by inverse modelling are illustrated in Figure 2. The simulated pressure drawdown shows a generally good agreement (cf. residuals plotted in Figure 3) with the observations made during pumping in all three wells, especially in view of the calibrated local well permeabilities, determined by the pressure drawdown in the pumping well. Deviations between both data occur during pumping in the Ktzi 201 well, where pressure drawdown is underestimated by about 1 bar. The 2-bar residual plotted in Figure 3 is likely attributed to a slight time shift between the flow and observation data, and can thus be disregarded. Further deviations between simulation results and observations are found in the pressure responses of the Ktzi 200 well during pumping in the Ktzi 201 well and vice versa, amounting to 1 and 1.3 bar, respectively (Figure 3). These cross-well pressure drawdown deviations indicate that the hydraulic connectivity between both wells is apparently worse than estimated by the inverse modelling procedure. On the other hand, the Ktzi 202 well exhibits excellent agreement in view of its local hydraulic connectivity as well as that to the Ktzi 201 and Ktzi 200 wells (Figure 3). This becomes also obvious from the excellent match of the simulated and observed Ktzi 202 pressure responses during pumping in the two other wells.
Figure 3 shows that agreement between simulated and observed pressure drawdown is high with a correlation coefficient of R 2 = 0.972. Relatively high residuals occur for the Ktzi 201 and Ktzi 200 well pressure drawdown during days 5 to 7 and days 17 to 19, representing the two alternating pumping and observation periods for both wells. Residuals during pumping in the Ktzi 202 are negligibly low with maximum values below 0.4 bar.

3.2. CO 2 Injection Phase

Figure 4 shows the time-dependent development of observed bottomhole pressures in the Ktzi 201 and Ktzi 202 wells plotted against the simulated bottomhole pressures, using the static geological model after its revision by inverse modelling. Simulation results exhibit an excellent fit of both data for the Ktzi 201 well, especially emphasized by the perfect match for the hydraulic well interference test run during days 790 to 842. Further, all bottomhole pressure responses related to changes in injection rates and injection stops are perfectly matched. Residuals are relatively low with maximum values below 1 bar, besides those attributed to low-weighted pressure observations (Figure 5). The latter include the high pressure drop at day 16 as well as the long injection stop between days 1424 and 1660. The first deviation may be explained by a measurement error, what becomes obvious from the sudden observed bottomhole pressure jumps to be found in Figure 4. However, this observation was anyway considered in the inverse modelling procedure to include the early injection phase response in the model calibration.
The deviation between simulated and observed bottomhole pressure during the long injection stop results from a temperature drop in the injection well, accompanied by a density increase of the CO 2 in the well. This temperature drop, which is not in the focus of the present study, cannot be reproduced by the isothermal BLACKOIL simulation model applied here, so that the simulated bottomhole pressure decrease during this period is substantially higher than the observed one due to the lower simulated CO 2 density in the Ktzi 201 well. The validity of the simulation model applied here is demonstrated by the bottomhole pressure decline simulated for the Ktzi 202 well, which did not experience a temperature drop with resulting pressures in the order of those in the Ktzi 201 well. Another evidence for this hypothesis is the fact that simulated and observed bottomhole pressures are in excellent agreement after restart of injection at day 1660 (Figure 4), where injection proceeded at reservoir temperature again.
For the Ktzi 202 well, only a relatively short record of bottomhole pressure is available for a time period of 308 days. Thereafter, the pressure gauge in the well exhibited a shift in the measured pressure that could not be reliably corrected, before it failed completely. Also for this well, a very good agreement between simulations and observations is achieved with maximum residual values below 1 bar (Figure 5).
The simulated extent of the gaseous CO 2 phase, based on the static geological model revised by inverse modelling is plotted in Figure 6a. CO 2 mainly migrates into northwestern direction towards the top of the Ketzin anticline, following the main sandstone channels present in the static reservoir model. Calculated permeability multipliers for the entire model are shown in Figure 6a with close-up views in Figure 6b and Figure 7a. Significant global permeability reductions are required in the reservoir model domain to achieve the pressure matching presented for the hydraulic testing and CO 2 injection phases, resulting in horizontal far-field permeability multipliers of about 0.07. The global vertical permeability multiplier has been estimated to about 0.07 in the course of the integrated inverse modelling procedure, representing a reasonable value considering the geological boundary conditions.
The close-up view of the area of the simulated CO 2 extent (Figure 6b) exhibits different regions of increased permeability multipliers, especially in the West of the near-well area, but also in its South and Northwest, influencing the areal CO 2 migration as indicated by the solid and dashed lines. For the near-well area (Figure 7a), regions of high permeabilities are determined in the South, Northeast and Northwest, while low-permeable regions are present between the three wells, in the West and Southeast. Specifically the permeability reduction between the three wells is relevant to explain the relatively late observed CO 2 arrival time at the Ktzi 202 well of 271 days in about 112 m distance to the injection well, compared to that at the Ktzi 200 well with about 21 days and only 50 m distance to the Ktzi 201 well.
Simulated CO 2 arrival time for the Ktzi 200 well is 33 days (twelve days deviation), while that for the Ktzi 202 well exhibits a perfect match. The mismatch of the arrival time in the first well is mainly resulting from the permeability decrease introduced by the calculated multipliers between the Ktzi 201 and Ktzi 200 wells. On the other hand, the simulation results for the hydraulic testing demonstrate that this permeability is apparently still too high, resulting in a conflicting situation that has been addressed by a hypothesis first published by Chen et al. [40]. The authors suggest that the sandstone channel thickness between both wells is reduced in comparison to that derived from the logs at the well locations. Following this hypothesis, a worse hydraulic connectivity would result from the reduced transmissivity, while CO 2 may still unhindered pass this low-thickness region.
Considering the implemented spatial observation points for the outline of the gaseous CO 2 extent detected by the 3D seismic repeat surveys in 2009 and 2012 (Figure 6b and Figure 7a), general agreement regarding the main direction of CO 2 migration can be found. Figure 7b shows the spatial distribution of the absolute residuals for all observation points with correlation coefficients of R 2 = 0.699 and R 2 = 0.729 between observed and simulated spatial thickness distributions of gaseous CO 2 for 2009 and 2012, respectively. Taking into account the detection threshold of the 3D seismic surveys of 5 to 7.5 m in 2009 and 2012, respectively, good qualitative agreement of both data is achieved with deviations in the southwestern near-well area for 2009 and in the East for 2012 (Figure 7b). CO 2 migration in northwestern direction may have remained unseen by 3D seismics due to the relatively high detection threshold, resulting from unfavourable survey boundary conditions (heavy rainfall) [37].

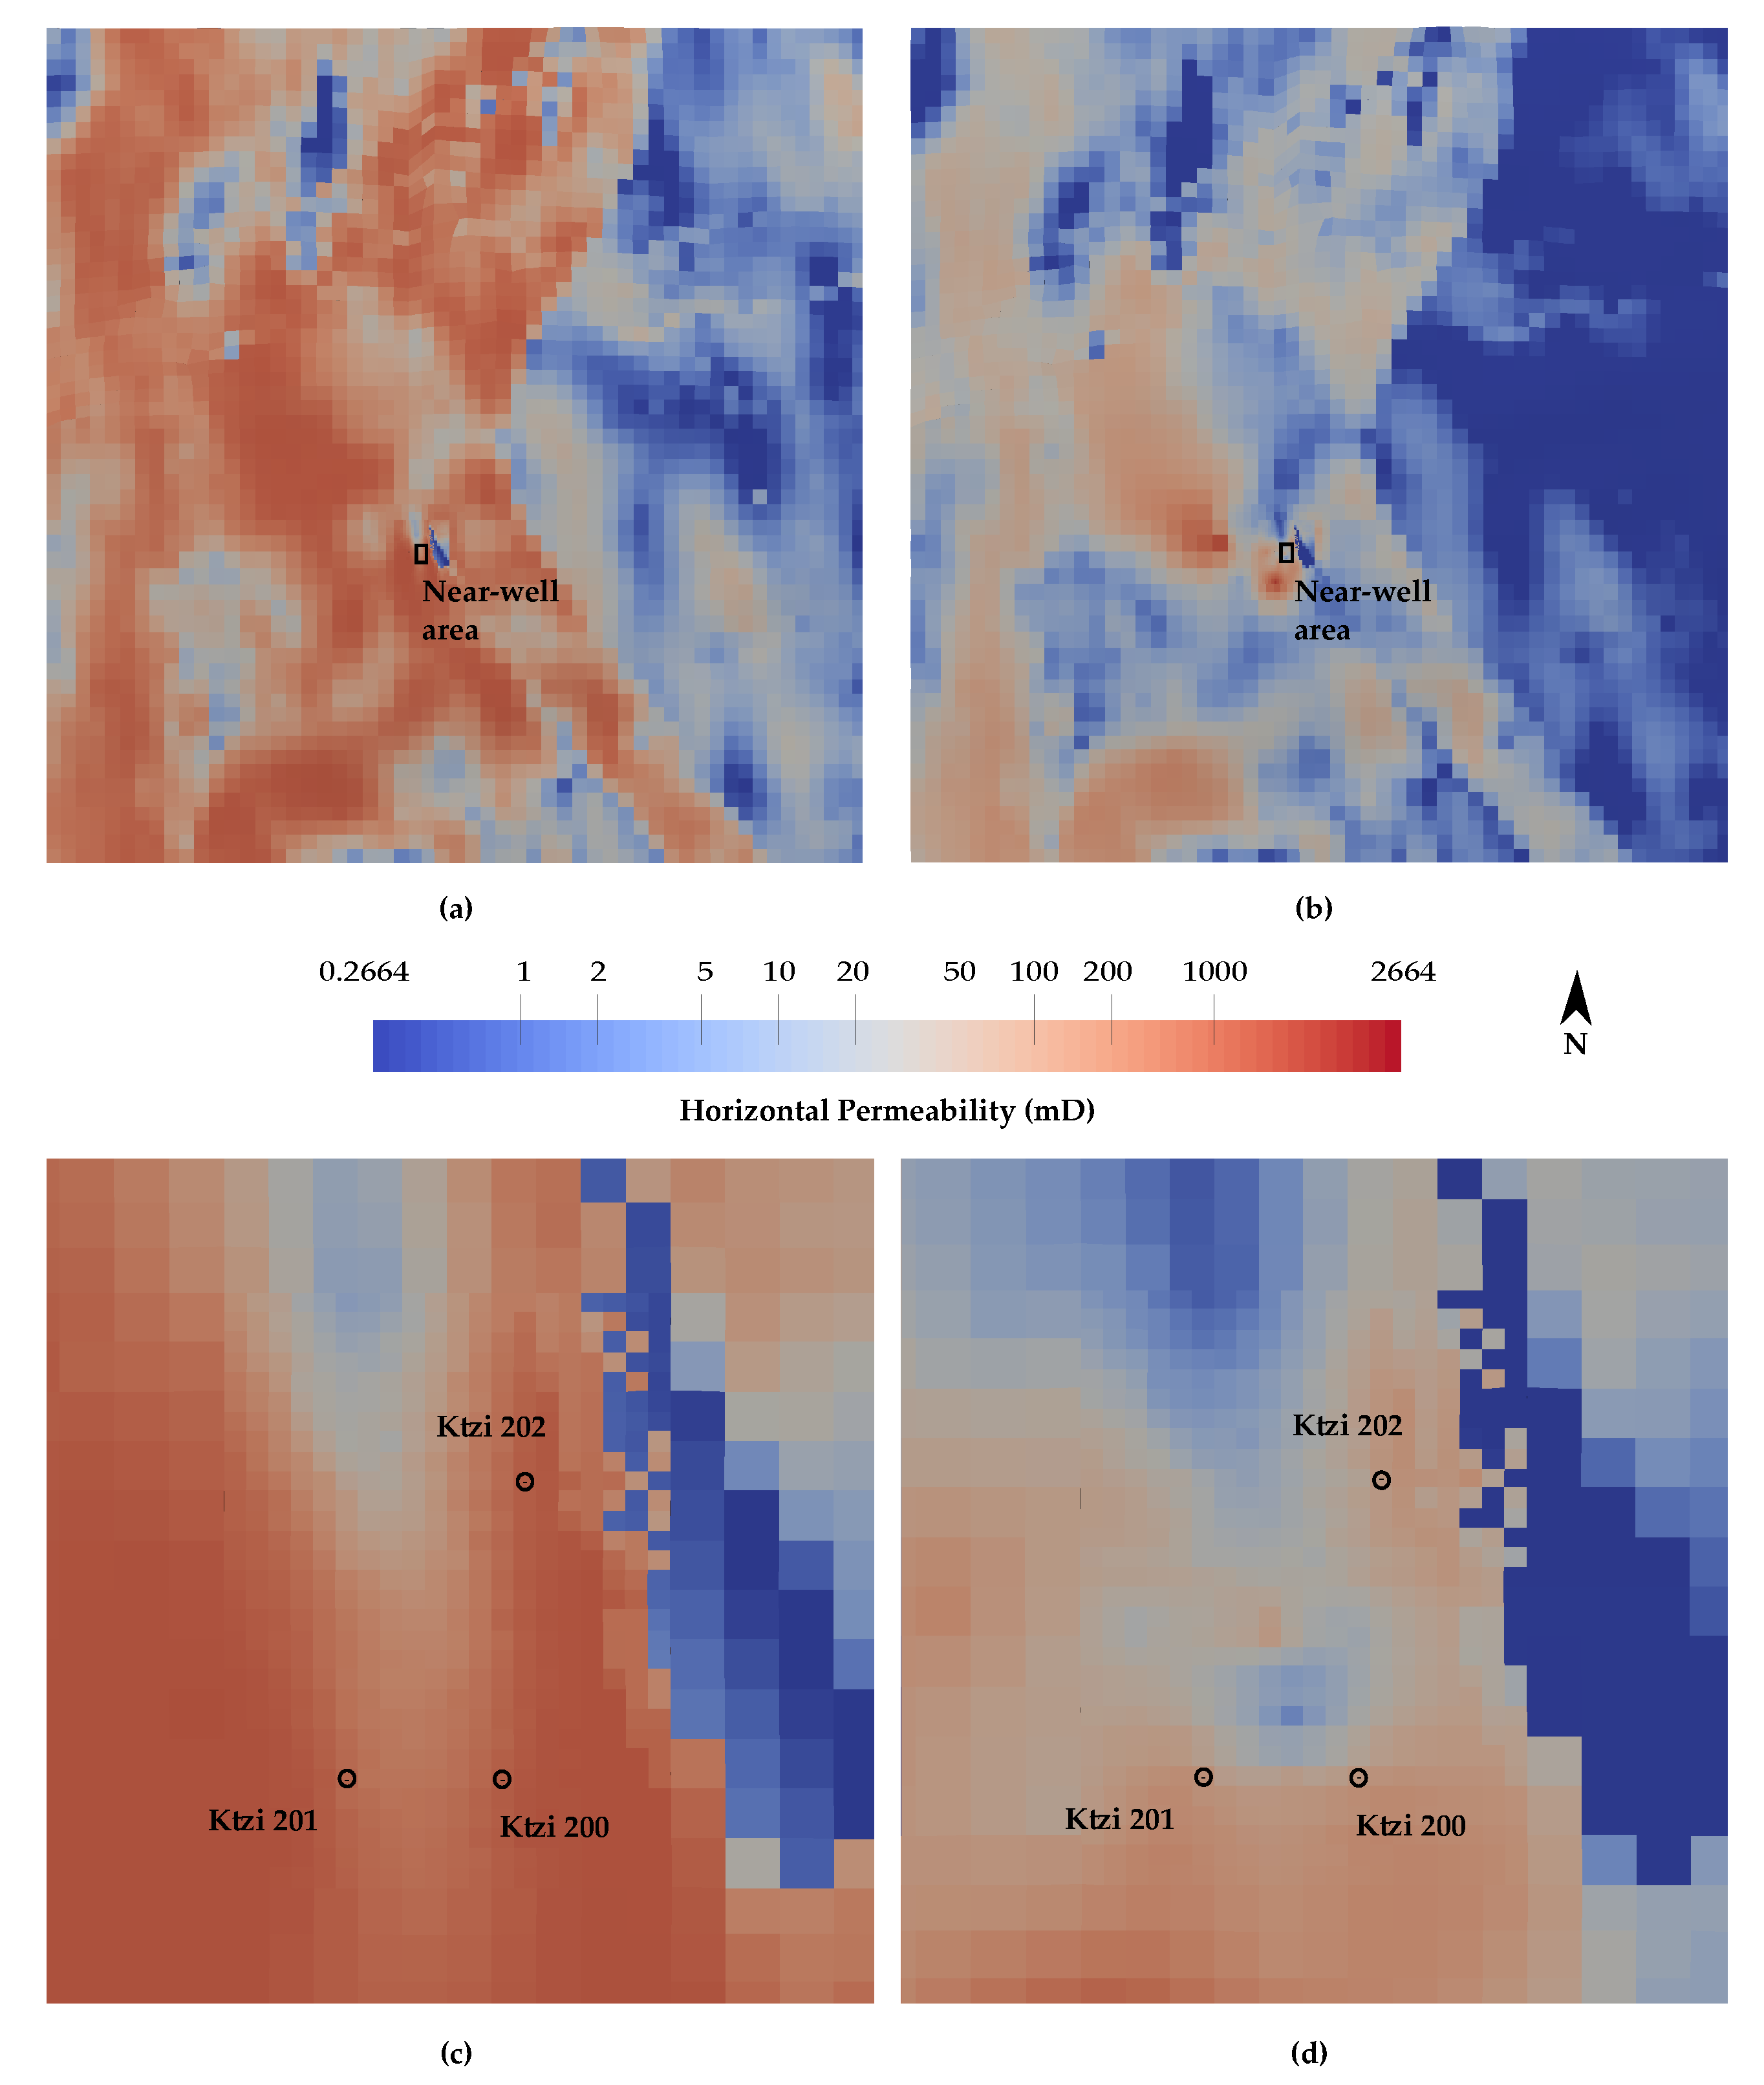
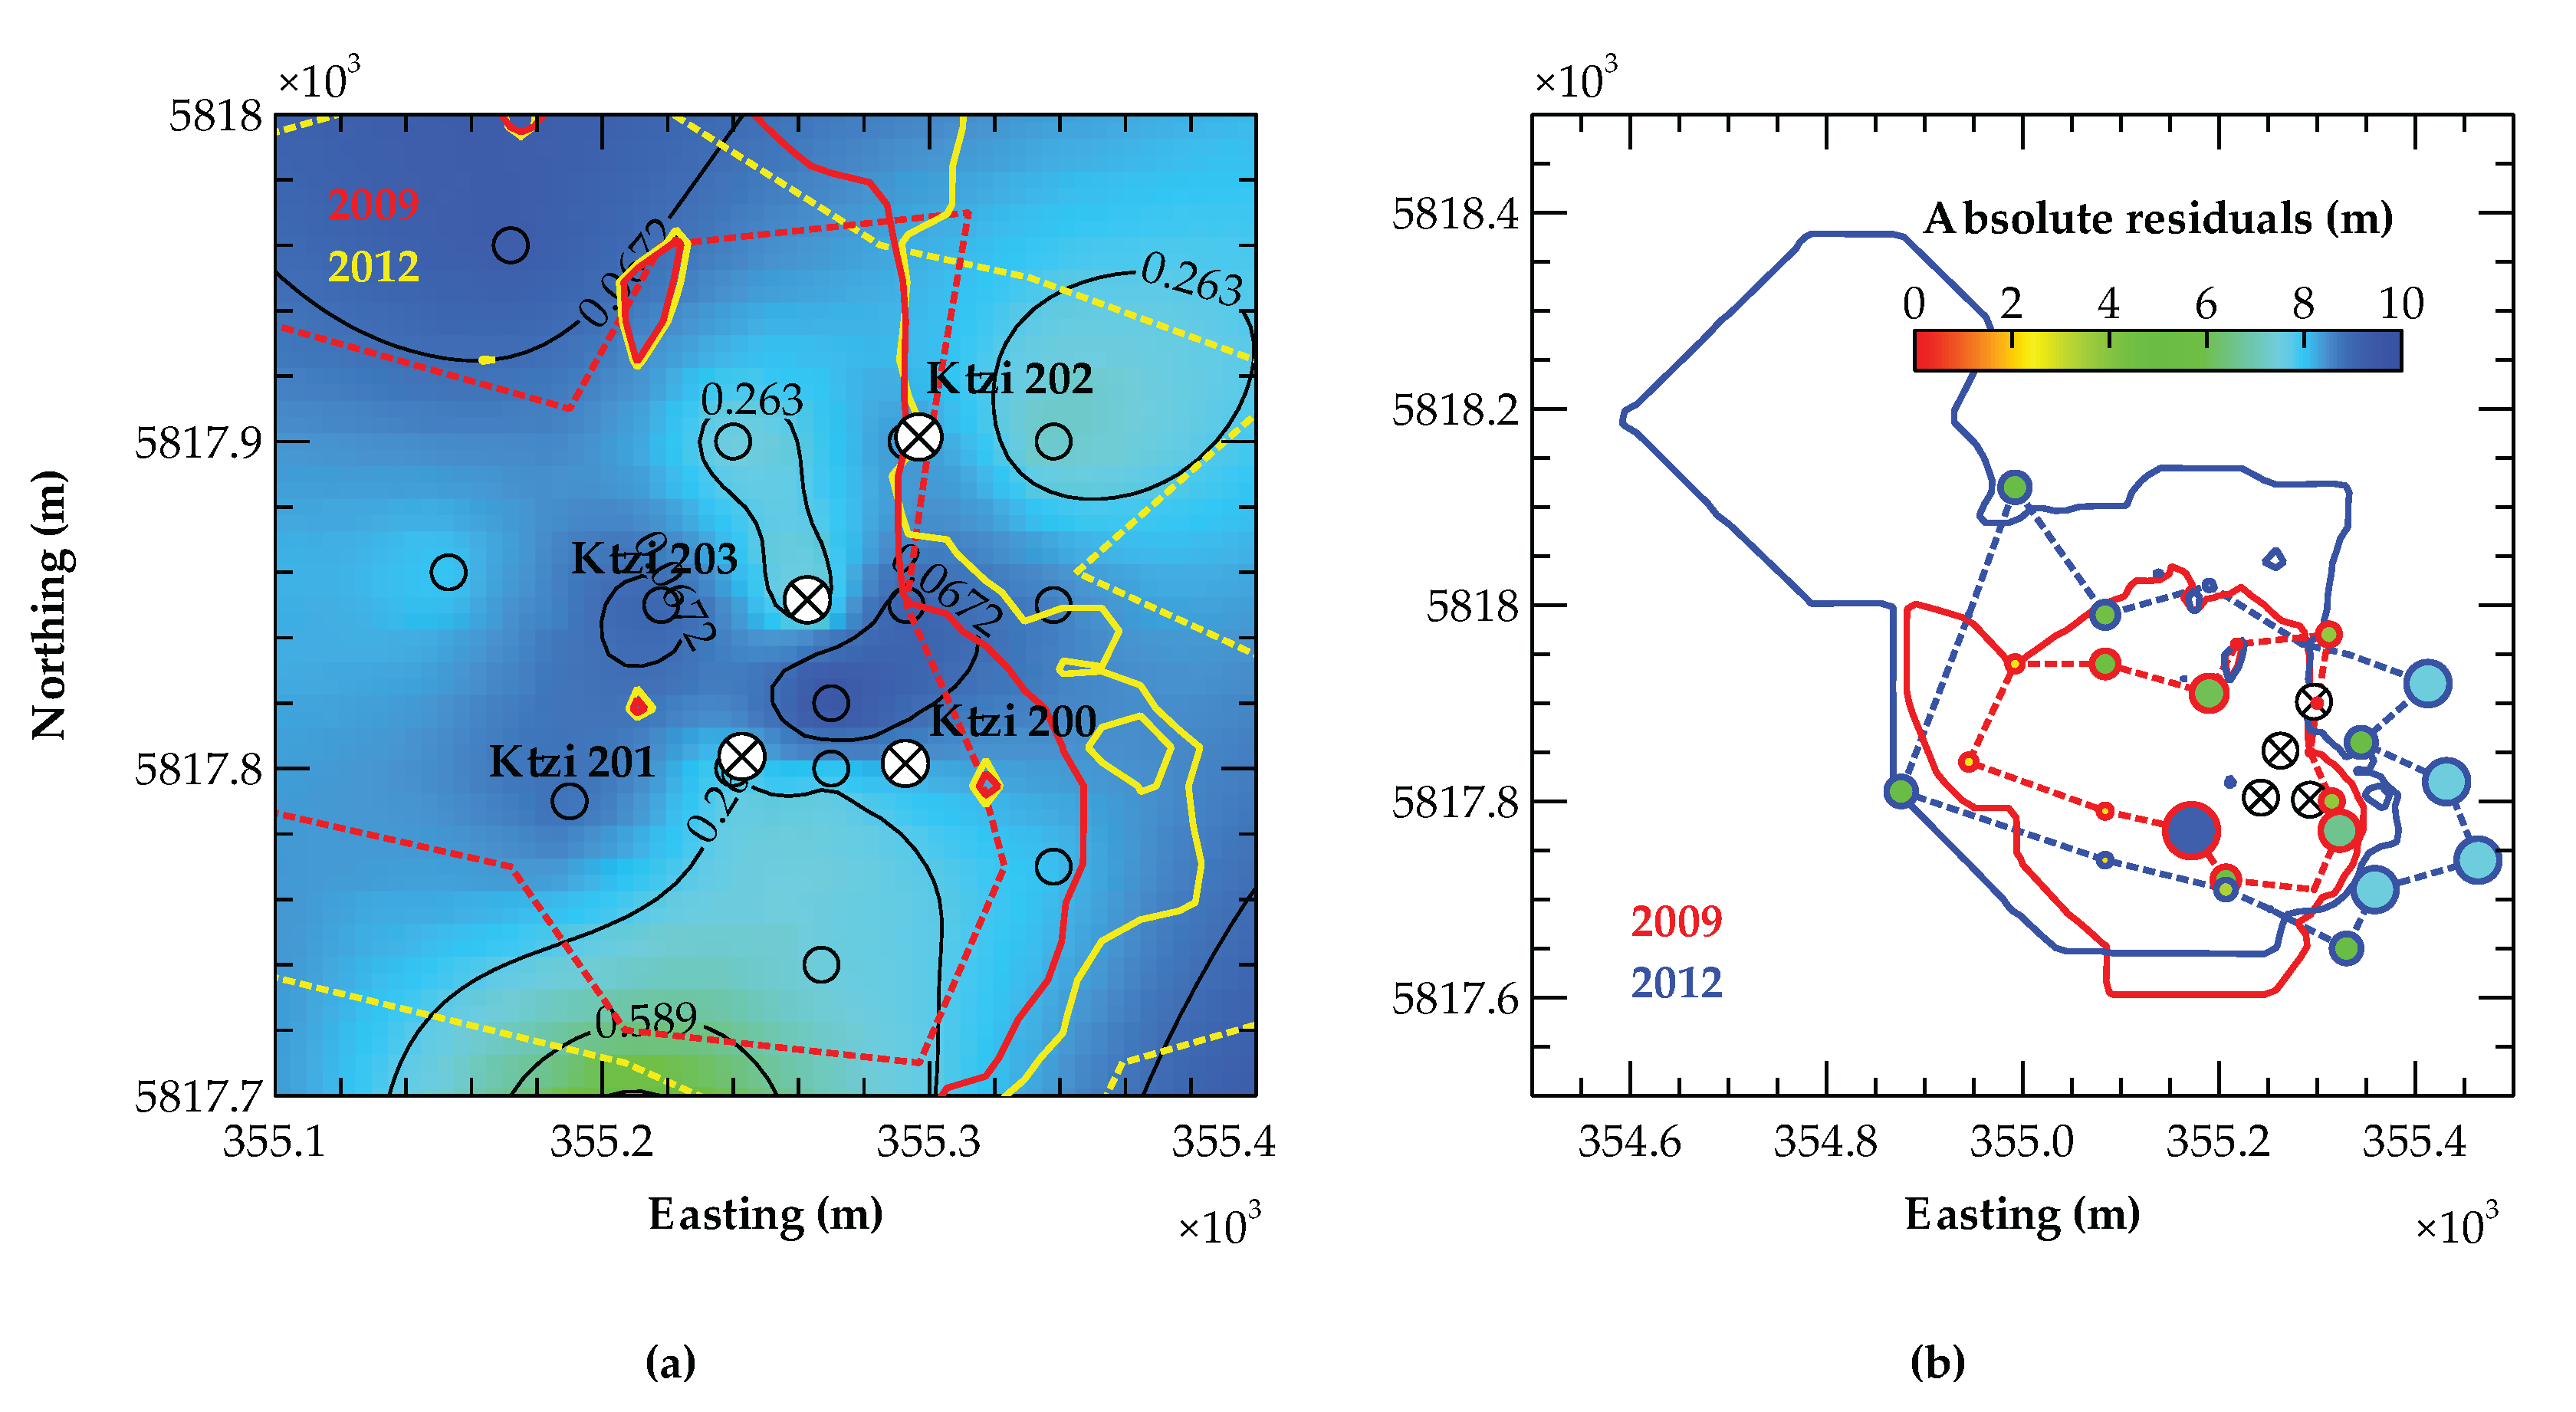
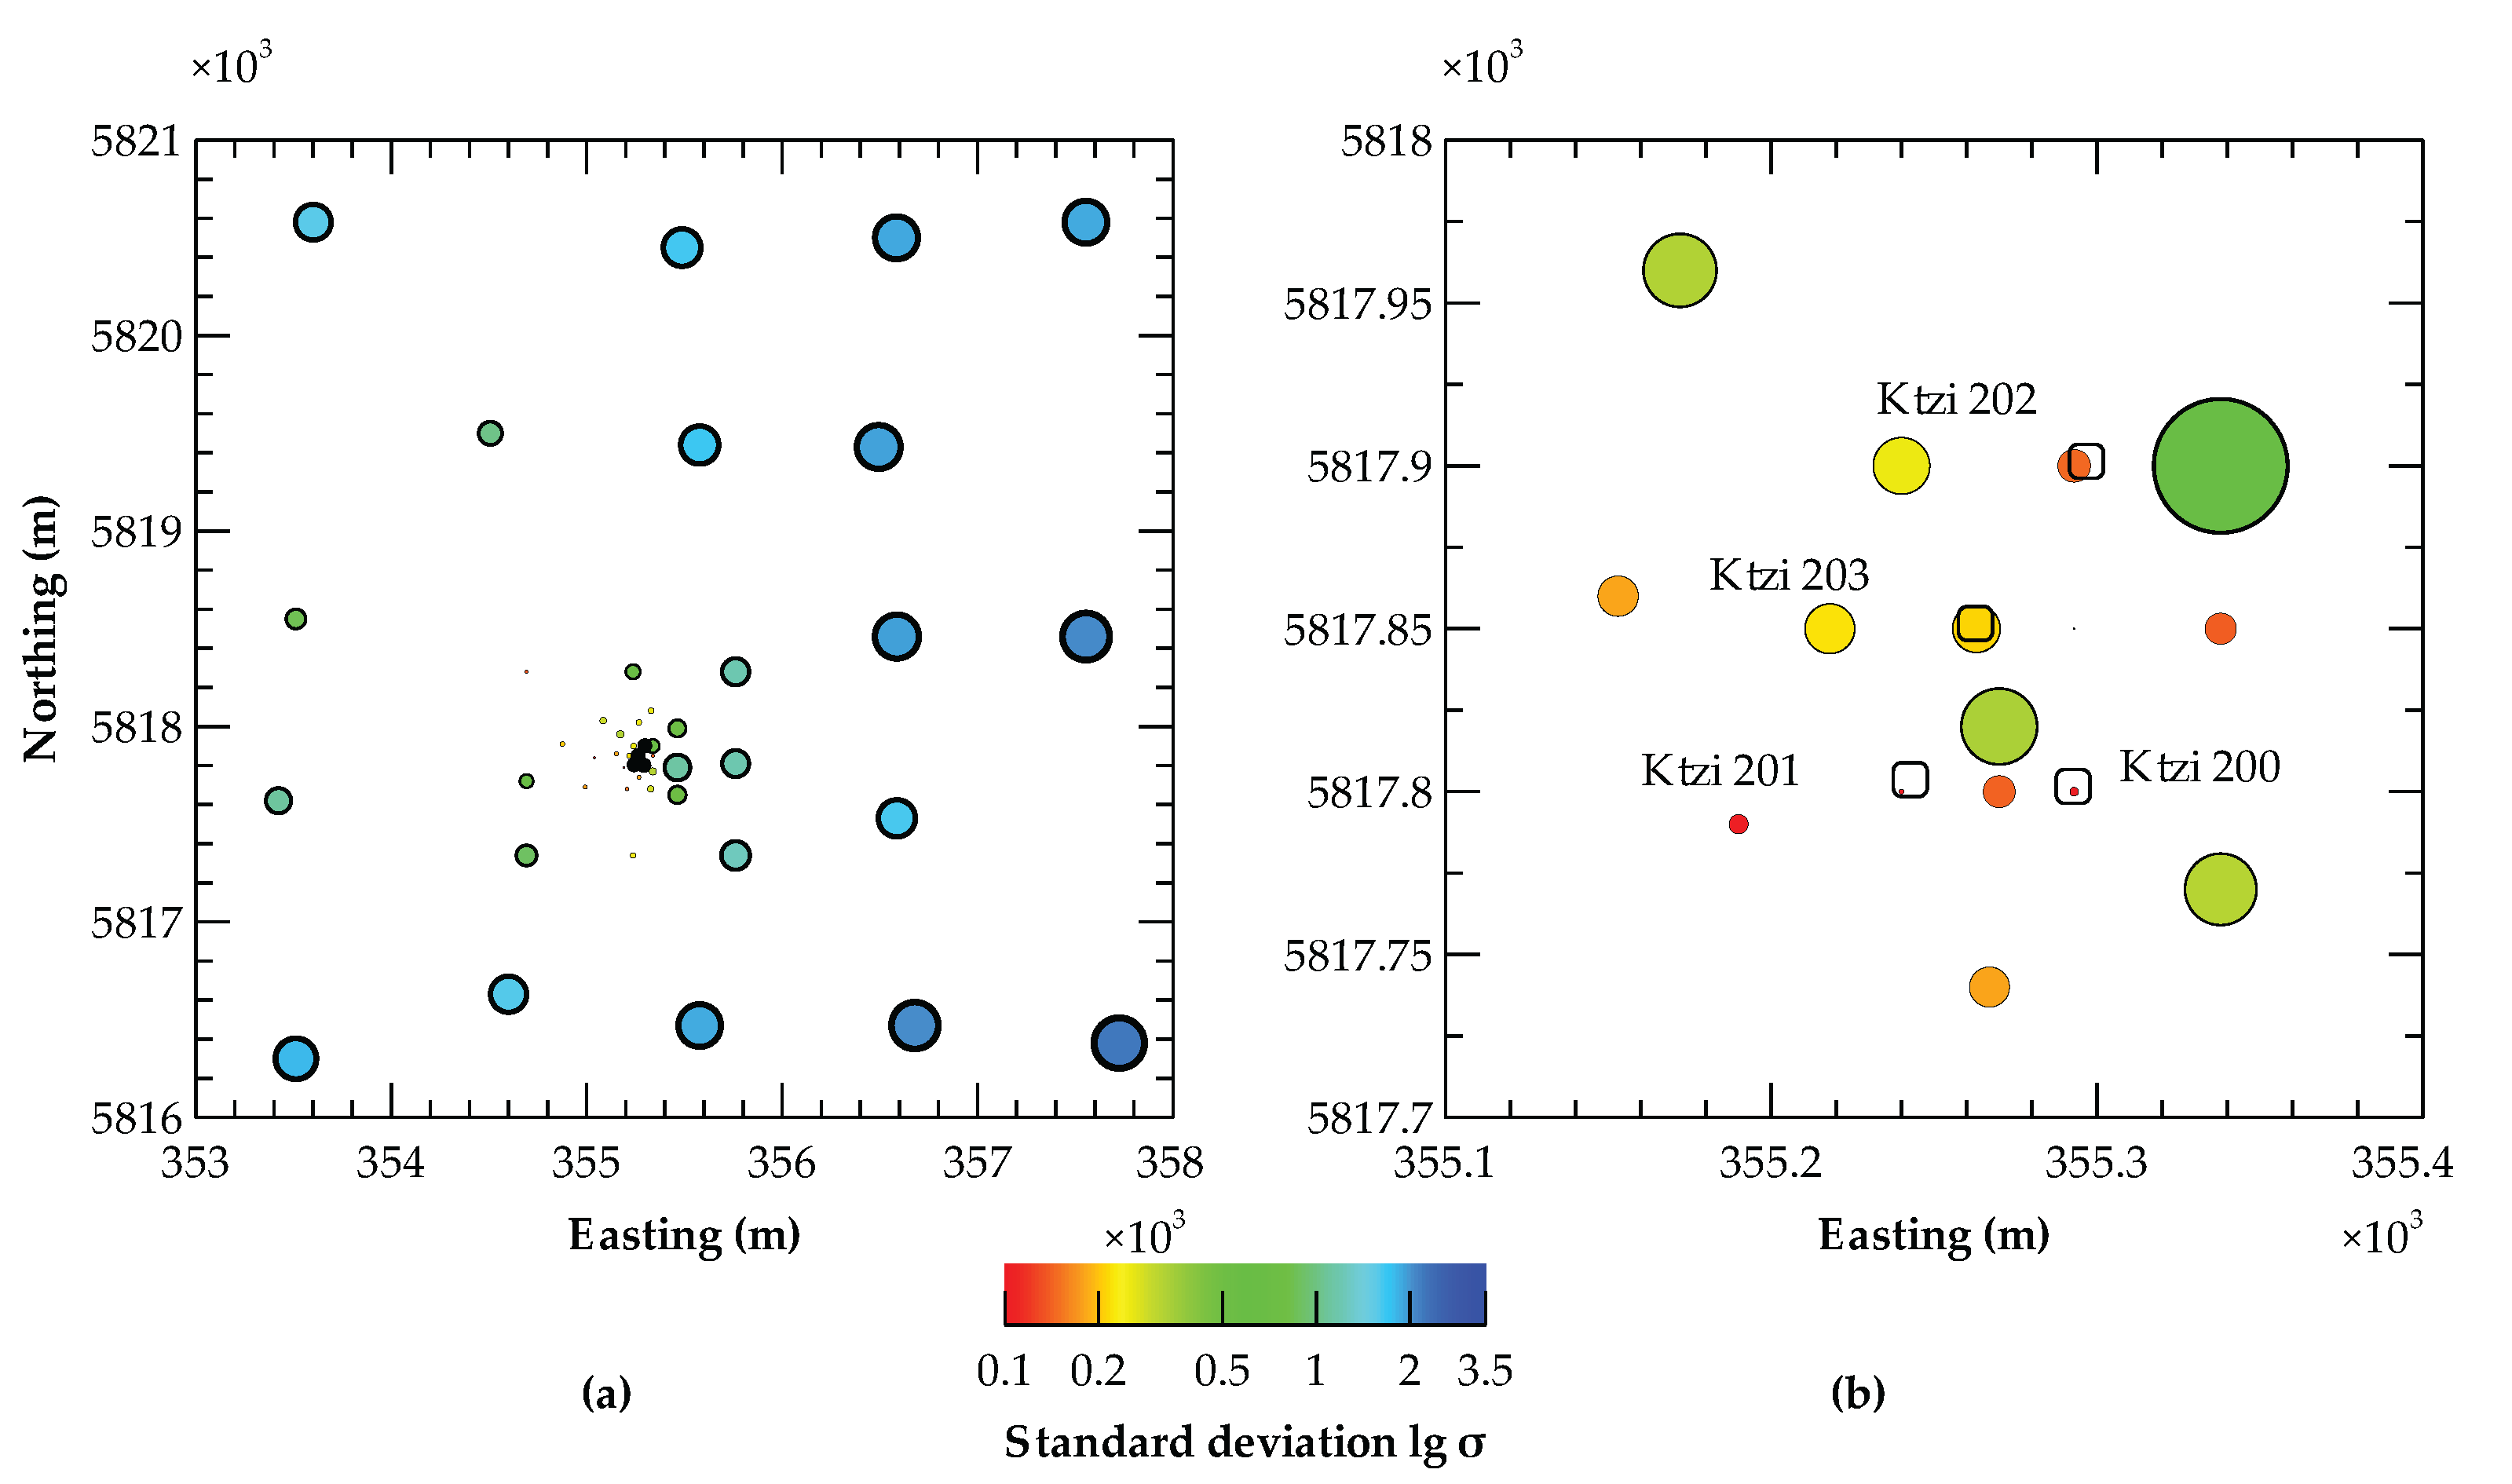
3.3. Spatial Permeability Distribution in the Revised Reservoir Model

Figure 8 shows the horizontal permeabilities in the initial static geological model and those revised by inverse model calibration. Revised permeabilities (Figure 8b,d) reflect the global permeability reduction, determined by the low global permeability multipliers introduced before. Regions of increased permeabilities are present in the West of the near-well area and in its Southwest (Figure 8b). Major changes in permeability distribution occur in the near-well area, where a region of low permeability, not present in the initial reservoir model (Figure 8c) is introduced between the three wells as an outcome of the inverse modelling process (Figure 8d). In summary, a more heterogeneous permeability distribution is found in the near-well area following the reservoir model revision, which may be also explained by changes in transmissivity, i.e., due to thickness variations of the respective sandstone channels as previously suggested in the context of the discussion of the CO 2 arrival time at the Ktzi 200 well.
To provide a quantitative analysis of the final parameter uncertainty, Figure 9 shows the standard deviations at the 52 pilot points resulting from the inverse model calibration. A notable reduction of the initial standard deviation of lg σ = 3.5 is achieved at all pilot points in the far-field, exhibiting maximum values of lg σ = 2.22 (Figure 9a). For the near-well area (Figure 9b), most standard deviations fall below values of lg σ = 0.25, whereby maximum standard deviations occur at the pilot points located in between the wells Ktzi 201 and Ktzi 200 as well as in the East of Ktzi 202 and the Southeast of Ktzi 200. The initial standard deviation for the vertical permeability multiplier is reduced from lg σ = 0.5 by about one order in magnitude lg σ = 0.051).
Comparing the integrated inverse modelling results with those produced by Kempka and Norden [32], where the authors considered hydraulic testing data only, substantial reduction in parameter uncertainty can be achieved in the model far-field and near-well area by the integrated methodology introduced in the present study. While limiting the inverse modelling to the hydraulic testing data does only notably reduce the local well parameter uncertainty, significant reductions are observed in a radius of about 100 m around the wells but also in the far-field as more observation data are taken into account. This effect is mainly attributed to the integration of spatial observation points to calibrate the gaseous CO 2 thickness in addition to the bottomhole pressures for the hydraulic testing and CO 2 injection phases.

4. Discussion and Conclusions

In the present study, it has been demonstrated how the integration of well log, geological and 3D seismic data substantially improves the results of a static geological model revision of a subsurface storage reservoir. For that purpose, two initially independent numerical flow simulation models on hydraulic testing carried out for the purpose of reservoir characterization and actual site operation in terms of CO 2 injection have been integrated into one numerical inverse model. This strategy allowed for taking advantage of the most reliable monitoring data acquired at the Ketzin pilot site in a single model calibration process.
Simulation results based on the static geological model revised within the scope of this study are generally in good to excellent agreement with the monitoring data applied as observations in the inverse modelling procedure. Simulation of the hydraulic testing phase reveals good agreement between observed and simulated pressure drawdown, expect for the hydraulic connection between the Ktzi 201 and Ktzi 200 wells, which is overestimated by the integrated model calibration. In contrast, simulated bottomhole pressures for the CO 2 injection phase exhibit an excellent agreement with minor deviations related to the isothermal approach used in the employed simulator module.
While a perfect match is achieved for the CO 2 arrival time at the Ktzi 202 well, that for the Ktzi 200 well is overestimated by about 50%. Since this is in contrast to the previously addressed finding on the overestimated hydraulic connection between the Ktzi 201 and Ktzi 200 wells, the outcome of the present study strongly supports the hypothesis introduced by Chen et al. [40]: a reduced transmissivity between both wells must be present, but not limit CO 2 migration at the same time. Given the reliability of the recorded data, a reasonable explanation for this effect can be only provided by a reduced thickness of the sandstone channel connecting the two wells, since this geological feature would weaken the hydraulic connection between these wells, while CO 2 would not be hindered to migrate from the Ktzi 201 to the Ktzi 200 well.
In view of the 3D seismic data integrated in the inverse model calibration, a general agreement of the CO 2 extent and its primary migration directions is observed, while only moderate correlation coefficients of 0.70 to 0.73 are achieved in contrast to the high values determined for the bottomhole pressure correlations in the hydraulic testing and CO 2 injection phases. However, it has to be taken into account that these data are spatially distributed, whereby the limited detection threshold of the 3D seismics of 5 to 7.5 m in 2009 and 2012, respectively, provides further sources of uncertainty to the monitoring data. Nevertheless, integration of these data provided a substantial contribution to parameter uncertainty reduction, compared to only considering bottomhole pressure data [32].
Even though the revised model allows to substantially improve the agreement between observed and simulated bottomhole pressures for the hydraulic testing and CO 2 injection phases as well as CO 2 arrival at the observation wells and the spatial extent of gaseous CO 2 distribution determined by 3D seismic interpretations, the significance of the present revision is rather limited to the near-well area, while the far-field model revision only provides indicators for areas with potentially diverging sandstone channel thickness and/or their areal extent. In this context, multiple realizations of the far-field facies model, bearing a reasonable amount of uncertainty were not undertaken here due to the limited feasibility of their validation. From the authors point of view, generating multiple model realizations is especially of relevance for risk assessments, where the model far-field can play an important role but of limited significance for the present study.
In summary, it has been demonstrated that the applied integrated inverse modelling approach, using two independent numerical simulation models for different phases of a CO 2 storage site’s life cycle can significantly contribute to improving the complex process of static geological model revision, while uncertainties are reduced by more than one order in magnitude.
Future modelling studies should aim at integration of additional observation data based on the methodology presented here, and especially overcome the present studies’ limitation of employing a 2D pilot point interpolation onto the numerical simulation grid. The latter would be of substantial relevance for assessing the likely sandstone channel thickness reduction in between the Ktzi 201 and Ktzi 200 wells, responsible for the deviation in CO 2 arrival time at the first observation well in addition to the contradicting overestimation of the hydraulic connectivity between both wells.

Acknowledgments

The authors gratefully acknowledge the funding for the Ketzin project received from the European Commission (6th and 7th Framework Program), two German ministries—the Federal Ministry of Economics and Technology and the Federal Ministry of Education and Research—and industry since 2004. The ongoing R&D activities are funded within the project COMPLETE by the Federal Ministry of Education and Research within the GEOTECHNOLOGIEN program. Further funding is received by VGS, RWE, Vattenfall, Statoil, OMV and the Norwegian CLIMIT program. Further, we want to express our gratitude to the anonymous reviewers for the impressively fast review and their comments, supporting us in improving the manuscript’s quality.

Author Contributions

Thomas Kempka designed and performed the research, analyzed the data, and wrote the paper; Ben Norden contributed with geological data and knowledge; Alexandra Ivanova and Stefan Lüth contributed with geophysical data and knowledge.

Conflicts of Interest

The authors declare no conflict of interest.

References

  1. Intergovernmental Panel on Climate Change (IPCC). IPCC Special Report on Carbon Dioxide Capture and Storage; Metz, B., Davidson, O., de Coninck, H.C., Loos, M., Meyer, L.A., Eds.; Cambridge University Press: Cambridge, UK; New York, NY, USA, 2005. [Google Scholar]
  2. Raven, J.; Caldeira, K.; Elderfield, H.; Hoegh-Guldberg, O.; Liss, P.S.; Riebesell, U.; Sheperd, J.; Turley, C.; Watson, A. Ocean Acidification due to Increasing Atmospheric Carbon Dioxide. Royal Society Policy Document. 2005. Available online: https://royalsociety.org/~/media/Royal_Society_Content/policy/publications/2005/9634.pdf (accessed on 22 September 2017).
  3. Schilling, F.; Borm, G.; Würdemann, H.; Möller, F.; Kühn, M.; CO2SINK Group. Status Report on the First European On-Shore CO2 Storage Site at Ketzin (Germany). Energy Procedia 2009, 1, 2029–2035. [Google Scholar] [CrossRef]
  4. Würdemann, H.; Möller, F.; Kühn, M.; Heidug, W.; Christensen, N.P.; Borm, G.; Schilling, F. CO2SINK—From site characterisation and risk assessment to monitoring and verification: One year of operational experience with the field laboratory for CO2 storage at Ketzin, Germany. Int. J. Greenh. Gas Control 2010, 4, 938–951. [Google Scholar] [CrossRef]
  5. Martens, S.; Liebscher, A.; Möller, F.; Würdemann, H.; Schilling, F.; Kühn, M.; Ketzin Group. Progress Report on the First European on-shore CO2 Storage Site at Ketzin (Germany)—Second Year of Injection. Energy Procedia 2011, 4, 3246–3253. [Google Scholar] [CrossRef]
  6. Martens, S.; Kempka, T.; Liebscher, A.; Lüth, S.; Möller, F.; Myrttinen, A.; Norden, B.; Schmidt-Hattenberger, C.; Zimmer, M.; Kühn, M.; et al. Europe’s longest-operating on-shore CO2 storage site at Ketzin, Germany: A progress report after three years of injection. Environ. Earth Sci. 2012, 67, 323–334. [Google Scholar] [CrossRef]
  7. Martens, S.; Liebscher, A.; Möller, F.; Henninges, J.; Kempka, T.; Lüth, S.; Norden, B.; Prevedel, B.; Szizybalski, A.; Zimmer, M.; et al. CO2 storage at the Ketzin pilot site: Fourth year of injection, monitoring, modelling and verification. Energy Procedia 2013, 37, 6434–6443. [Google Scholar] [CrossRef]
  8. Martens, S.; Möller, F.; Streibel, M.; Liebscher, A.; the Ketzin Group. Completion of five years of safe CO2 injection and transition to the post-closure phase at the Ketzin pilot site. Energy Procedia 2015, 59, 190–197. [Google Scholar] [CrossRef]
  9. Bielinski, A. Numerical Simulation of CO2 Sequestration in Geological Formations. Mitteilungsheft Nr. 155. Ph.D. Thesis, Department of Hydraulic Engineering, University of Stuttgart, Stuttgart, Germany, 2007. [Google Scholar]
  10. Probst, P. Numerical Simulations of CO2 Injection into Saline Aquifers: Estimation of Storage Capacity and Arrival Times using Multiple Realizations of Heterogeneous Permeability Fields. Master’s Thesis, Department of Hydraulic Engineering, University of Stuttgart, Stuttgart, Germany, 2008. [Google Scholar]
  11. Kempka, T.; Kühn, M.; Class, H.; Frykman, P.; Kopp, A.; Nielsen, C.M.; Probst, P. Modelling of CO2 arrival time at Ketzin—Part I. Int. J. Greenh. Gas Control 2010, 4, 1007–1015. [Google Scholar] [CrossRef]
  12. Kempka, T.; Kühn, M. Numerical simulations of CO2 arrival times and reservoir pressure coincide with observations from the Ketzin pilot site, Germany. Environ. Earth Sci. 2013, 70, 3675–3685. [Google Scholar] [CrossRef]
  13. Kempka, T.; Class, H.; Görke, U.J.; Norden, B.; Kolditz, O.; Kühn, M.; Walter, L.; Wang, W.; Zehner, B. A Dynamic Flow Simulation Code Intercomparison based on the Revised Static Model of the Ketzin Pilot Site. Energy Procedia 2013, 40, 418–427. [Google Scholar] [CrossRef]
  14. Kempka, T.; De Lucia, M.; Kühn, M. Geomechanical integrity verification and mineral trapping quantification for the Ketzin CO2 storage pilot site by coupled numerical simulations. Energy Procedia 2014, 63, 3330–3338. [Google Scholar] [CrossRef]
  15. Kempka, T.; Klein, E.; De Lucia, M.; Tillner, E.; Kühn, M. Assessment of Long-term CO2 Trapping Mechanisms at the Ketzin Pilot Site (Germany) by Coupled Numerical Modelling. Energy Procedia 2013, 37, 5419–5426. [Google Scholar] [CrossRef]
  16. Norden, B.; Frykman, P. Geological modelling of the Triassic Stuttgart Formation at the Ketzin CO2 storage site, Germany. Int. J. Greenh. Gas Control 2013, 19, 756–774. [Google Scholar] [CrossRef]
  17. Ouellet, A.; Bérard, T.; Desroches, J.; Frykman, P.; Welsh, P.; Minton, J.; Pamukcu, Y.; Hurter, S.; Schmidt-Hattenberger, C. Reservoir geomechanics for assessing containment in CO2 storage: A case study at Ketzin, Germany. Energy Procedia 2011, 4, 3298–3305. [Google Scholar] [CrossRef]
  18. Norden, B. Modelling of the near-surface groundwater flow system at the CO2SINK site Ketzin, Germany. Z. Dtsch. Ges. Geowiss. 2011, 162, 63–77. [Google Scholar] [CrossRef]
  19. Klein, E.; De Lucia, M.; Kempka, T.; Kühn, M. Evaluation of long-term mineral trapping at the Ketzin pilot site for CO2 storage: An integrative approach using geochemical modelling and reservoir simulation. Int. J. Greenh. Gas Control 2013, 19, 720–730. [Google Scholar] [CrossRef]
  20. De Lucia, M.; Kempka, T.; Kühn, M. A coupling alternative to reactive transport simulations for long-term prediction of chemical reactions in heterogeneous CO2 storage systems. Geosci. Model Dev. 2015, 8, 279–294. [Google Scholar] [CrossRef]
  21. Govindan, R.; Babaei, M.; Korre, A.; Shi, J.Q.; Durucan, S.; Norden, B.; Kempka, T. CO2 Storage Uncertainty and Risk Assessment for the Post-closure Period at the Ketzin Pilot Site in Germany. Energy Procedia 2014, 63, 4758–4765. [Google Scholar] [CrossRef]
  22. Kempka, T.; Klapperer, S.; Norden, B. Coupled hydro-mechanical simulations demonstrate system integrity at the Ketzin pilot site for CO2 storage, Germany. In Proceedings of the ISRM Regional Symposium—EUROCK 2014, Vigo, Spain, 27–29 May 2014. [Google Scholar]
  23. Baumann, G.; Henninges, J.; De Lucia, M. Monitoring of saturation changes and salt precipitation during CO2 injection using pulsed neutron-gamma logging at the Ketzin pilot site. Int. J. Greenh. Gas Control 2014, 28, 134–146. [Google Scholar] [CrossRef]
  24. Fischer, S.; Liebscher, A.; Zemke, K.; De Lucia, M.; the Ketzin Team. Does Injected CO2 Affect (Chemical) Reservoir System Integrity?—A Comprehensive Experimental Approach. Energy Procedia 2013, 37, 4473–4482. [Google Scholar] [CrossRef]
  25. Fischer, S.; Liebscher, A.; De Lucia, M.; Hecht, L.; the Ketzin Team. Reactivity of sandstone and siltstone samples from the Ketzin pilot CO2 storage site-Laboratory experiments and reactive geochemical modeling. Environ. Earth Sci. 2013, 70, 3687–3708. [Google Scholar] [CrossRef]
  26. Fischer, S.; De Lucia, M.; Liebscher, A. Kinetic modeling of laboratory CO2-exposure experiments performed on whole rock reservoir samples. Greenh. Gases 2014, 4, 244–256. [Google Scholar] [CrossRef]
  27. Lengler, U.; De Lucia, M.; Kühn, M. The impact of heterogeneity on the distribution of CO2: Numerical simulation of CO2 storage at Ketzin. Int. J. Greenh. Gas Control 2010, 4, 1016–1025. [Google Scholar] [CrossRef]
  28. Bergmann, P.; Lengler, U.; Schmidt-Hattenberger, C.; Giese, R.; Norden, B. Modelling the geoelectric and seismic reservoir response caused by carbon dioxide injection based on multiphase flow simulation: Results from the CO2SINK project. Chem. Erde Geochem. 2010, 70, 173–183. [Google Scholar] [CrossRef]
  29. Martens, S.; Kempka, T.; Liebscher, A.; Möller, F.; Schmidt-Hattenberger, C.; Streibel, M.; Szizybalski, A.; Zimmer, M. Field Experiment on CO2 Back-production at the Ketzin Pilot Site. Energy Procedia 2015, 76, 519–527. [Google Scholar] [CrossRef]
  30. Unger, V.; Kempka, T. Hydro-mechanical Simulations of Well Abandonment at the Ketzin Pilot Site for CO2 Storage Verify Wellbore System Integrity. Energy Procedia 2015, 76, 592–599. [Google Scholar] [CrossRef]
  31. Wagner, F.M. New Developments in Electrical Resistivity Imaging with Applications to Geological CO2 Storage. Ph.D. Thesis, ETH Zürich, Zürich, Switzerland, 2016. [Google Scholar]
  32. Kempka, T.; Norden, B. Inverse modelling of hydraulic testing to revise the static reservoir model of the Stuttgart Formation at the Ketzin pilot site. Energy Procedia 2017, 125, 640–649. [Google Scholar] [CrossRef]
  33. Huang, F.; Juhlin, C.; Han, L.; Sopher, D.; Ivandic, M.; Norden, B.; Deng, W.; Zhang, F.; Kempka, T.; Lüth, S. Feasibility of utilizing wavelet phase to map the CO2 plume at the Ketzin pilot site, Germany. Geophys. Prospect. 2017, 65, 523–543. [Google Scholar] [CrossRef]
  34. Huang, F.; Juhlin, C.; Han, L.; Kempka, T.; Lüth, S.; Zhang, F. Quantitative evaluation of thin-layer thickness and CO2 mass utilizing seismic complex decomposition at the Ketzin CO2 storage site, Germany. Geophys. J. Int. 2016, 207, 160–173. [Google Scholar] [CrossRef]
  35. Huang, F.; Bergmann, P.; Juhlin, C.; Ivandic, M.; Lüth, S.; Ivanova, A.; Kempka, T.; Henninges, J.; Sopher, D.; Zhang, F. The First Post-injection Seismic Monitor Survey at the Ketzin Pilot CO2 Storage Site: Results from Time-lapse Analysis. Geophys. Prospect. 2016. [Google Scholar] [CrossRef]
  36. Huang, F.; Juhlin, C.; Kempka, T.; Norden, B.; Zhang, F. Modeling 3D time-lapse seismic response induced by CO2 by integrating borehole and 3D seismic data–A case study at the Ketzin pilot site, Germany. Int. J. Greenh. Gas Control 2015, 36, 66–77. [Google Scholar] [CrossRef]
  37. Lüth, S.; Ivanova, A.; Kempka, T. Conformity assessment of monitoring and simulation of CO2 storage: A case study from the Ketzin pilot site. Int. J. Greenh. Gas Control 2015, 42, 329–339. [Google Scholar] [CrossRef]
  38. Wiese, B.; Böhner, J.; Enachescu, C.; Würdemann, H.; Zimmermann, G. Hydraulic characterisation of the Stuttgart formation at the pilot test site for CO2 storage, Ketzin, Germany. Int. J. Greenh. Gas Control 2010, 4, 960–971. [Google Scholar] [CrossRef]
  39. Chen, F.; Zhou, Q.; Birkholzer, J.T.; Wiese, B.; Norden, B.; Kempka, T. TOUGH2 simulation of the pumping tests at Ketzin site: Heterogeneity effects and model calibration. In Proceedings of the TOUGH Symposium on Lawrence Berkeley NationalLaboratory, Berkeley, CA, USA, 17–19 September 2012. [Google Scholar]
  40. Chen, F.; Wiese, B.; Zhou, Q.; Kowalsky, M.B.; Norden, B.; Kempka, T.; Birkholzer, J. Numerical modelling of the pumping tests at the Ketzin pilot site for CO2 injection: Model calibration and heterogeinity effects. Int. J. Greenh. Gas Control 2014, 22, 200–212. [Google Scholar] [CrossRef]
  41. Otto, C. Hydraulische Charakterisierung der Stuttgart Formation mittels Auswertung von Crosshole-Pumpversuchen und Inverser Modellierung. Master’s Thesis, University of Potsdam, Potsdam, Germany, 2013. (In German). [Google Scholar]
  42. Möller, F.; Liebscher, A.; Martens, S.; Schmidt-Hattenberger, C.; Kühn, M. Supplement 2008 to: Yearly Operational Datasets of the CO2 Storage Pilot Site Ketzin, Germany. 2008. Available online: http://dataservices.gfz-potsdam.de/panmetaworks/showshort.php?id=escidoc:65085 (accessed on 22 September 2017). [CrossRef]
  43. Möller, F.; Liebscher, A.; Martens, S.; Schmidt-Hattenberger, C.; Kühn, M. Supplement 2009 to: Yearly Operational Datasets of the CO2 Storage Pilot Site Ketzin, Germany. 2009. Available online: http://dataservices.gfz-potsdam.de/panmetaworks/showshort.php?id=escidoc:65091 (accessed on 22 September 2017). [CrossRef]
  44. Möller, F.; Liebscher, A.; Martens, S.; Schmidt-Hattenberger, C.; Kühn, M. Supplement 2010 to: Yearly Operational Datasets of the CO2 Storage Pilot Site Ketzin, Germany. 2010. Available online: http://dataservices.gfz-potsdam.de/panmetaworks/showshort.php?id=escidoc:65097 (accessed on 22 September 2017). [CrossRef]
  45. Möller, F.; Liebscher, A.; Martens, S.; Schmidt-Hattenberger, C.; Kühn, M. Supplement 2011 to: Yearly Operational Datasets of the CO2 Storage Pilot Site Ketzin, Germany. 2011. Available online: http://dataservices.gfz-potsdam.de/panmetaworks/showshort.php?id=escidoc:65103 (accessed on 22 September 2017). [CrossRef]
  46. Möller, F.; Liebscher, A.; Martens, S.; Schmidt-Hattenberger, C.; Kühn, M. Supplement 2012 to: Yearly Operational Datasets of the CO2 Storage Pilot Site Ketzin, Germany. Deutsches GeoForschungsZentrum GFZ. 2012. Available online: http://dataservices.gfz-potsdam.de/panmetaworks/showshort.php?id=escidoc:117124 (accessed on 22 September 2017).
  47. Möller, F.; Liebscher, A.; Martens, S.; Schmidt-Hattenberger, C.; Kühn, M. Supplement 2013 to: Yearly Operational Datasets of the CO2 Storage Pilot Site Ketzin, Germany. Deutsches GeoForschungsZentrum GFZ. doi:10.5880/GFZ.b103-12066. 2013. Available online: http://dataservices.gfz-potsdam.de/panmetaworks/showshort.php?id=escidoc:856906 (accessed on 22 September 2017).
  48. Möller, F.; Martens, S.; Liebscher, A.; Streibel, M. Supplement to: Dataset of the Back-production Test at the CO2 Storage Pilot Site Ketzin, Germany. 2015. Available online: http://dataservices.gfz-potsdam.de/panmetaworks/showshort.php?id=escidoc:987898 (accessed on 22 September 2017). [CrossRef]
  49. Möller, F.; Liebscher, A.; Schmidt-Hattenberger, C. Dataset of the Brine Injection at the CO2 Storage Pilot Site Ketzin, Germany. 2016. Available online: http://dataservices.gfz-potsdam.de/panmetaworks/showshort.php?id=escidoc:1528889 (accessed on 22 September 2017). [CrossRef]
  50. Förster, A.; Norden, B.; Zinck-Jorgensen, K.; Frykman, P.; Kulenkampff, J.; Spangenberg, E.; Erzinger, J.; Zimmer, M.; Kopp, J.; Borm, G.; et al. Baseline characterization of the CO2SINK geological storage site at Ketzin, Germany. Environ. Geosci. 2006, 13, 145–161. [Google Scholar] [CrossRef]
  51. Juhlin, C.; Giese, R.; Zinck-Jorgensen, K.; Cosma, C.; Kazemeini, H.; Juhojuntti, N.; Lüth, S.; Norden, B.; Förster, A. 3D baseline seismics at Ketzin, Germany: The CO2SINK project. Geophysics 2007, 72, 8121–8132. [Google Scholar] [CrossRef]
  52. Schlumberger. Petrel Seismic-to-Evaluation Software. Version. 2011. Available online: http://www.software.slb.com/products/petrel (accessed on 10 October 2017).
  53. Afanasyev, A. Hydrodynamic modelling of petroleum reservoirs using simulator MUFITS. Energy Procedia 2015, 76, 427–435. [Google Scholar] [CrossRef]
  54. Afanasyev, A.; Kempka, T.; Kühn, M.; Melnik, O. Validation of the MUFITS Reservoir Simulator Against Standard CO2 Storage Benchmarks and History-matched Models of the Ketzin Pilot Site. Energy Procedia 2016, 97, 395–402. [Google Scholar] [CrossRef]
  55. Class, H.; Mahl, L.; Ahmed, W.; Norden, B.; Kühn, M.; Kempka, T. Matching Pressure Measurements and Observed CO2 Arrival Times with Static and Dynamic Modelling at the Ketzin Storage site. Energy Procedia 2015, 76, 623–632. [Google Scholar] [CrossRef]
  56. Welter, D.E.; White, J.T.; Hunt, R.J.; Doherty, J.E. Approaches in Highly Parameterized Inversion: PEST++ Version 3, A Parameter ESTimation and Uncertainty Analysis Software Suite Optimized for Large Environmental Models: U.S. Geological Survey Techniques and Methods. Book 7. Section C12. 2015. Available online: https://pubs.er.usgs.gov/publication/tm7C12 (accessed on 22 September 2017).
  57. Kempka, T.; Nakaten, B.; De Lucia, M.; Nakaten, N.; Otto, C.; Pohl, M.; Tillner, E.; Kühn, M. Flexible Simulation Framework to Couple Processes in Complex 3D Models for Subsurface Utilization Assessment. Energy Procedia 2016, 97, 494–501. [Google Scholar] [CrossRef]
  58. PLPROC. PLPROC—A Powerful Parameter List Processor. Available online: http://www.pesthomepage.org/PLPROC.php (accessed on 22 September 2017).
Figure 1. (a) Revised reservoir model grid with 102,366 elements and LGRs. (b) Close-up view of near-well area, showing well locations and nested LGR structure. Distance between Ktzi 201 and Ktzi 200 is 50 m. Figure copyright [32] (modified), licensed under CC BY-NC-ND 4.0.
Energies 10 01559 g001
Figure 2. Flow rates as well as observed and simulated bottomhole pressure drawdown in the wells Ktzi 200, Ktzi 201 and Ktzi 202 in the hydraulic testing phase. Solid lines indicate applied flow rates and dashed lines the observed pressure drawdown, while circles represent the flow rates applied in the reservoir simulator and diamonds the simulated pressure response of the calibrated static reservoir model.
Energies 10 01559 g002
Figure 3. Observed versus simulated bottomhole pressures in the hydraulic testing phase exhibit a correlation coefficient of R 2 = 0.972. Residuals versus time are plotted in the inset.
Energies 10 01559 g003
Figure 4. Comparison of observed and simulated bottomhole pressures in the injection well Ktzi 201 and the second observation well Ktzi 202 in the CO 2 injection phase. Circles indicate the observations used in the integrated inverse modelling approach.
Energies 10 01559 g004
Figure 5. Observed versus simulated bottomhole pressures in the CO 2 injection phase exhibit a correlation coefficient of R 2 = 0.972. Residuals versus time are plotted in the inset.
Energies 10 01559 g005
Figure 6. (a) Plan view of simulated gaseous CO 2 extent in 2009 (red solid line) and 2012 (yellow solid line). (b) Close-up plan view of gaseous CO 2 extent detected by 3D seismics in 2009 (detection threshold 5 m, red dashed line) and 2012 (detection threshold 7.5 m, yellow dashed line), and simulated gaseous CO 2 thickness contours for 2009 (5 m thickness, solid red line) and 2012 (7.5 m thickness, solid yellow line). Empty circles represent pilot points, white-filled circles with crosses well locations including the well Ktzi 203 located in between Ktzi 201 and Ktzi 202. Blue-to-red contours show the permeability multipliers determined by inverse model calibration (UTM-WGS84 projection).
Energies 10 01559 g006
Figure 7. (a) Close-up plan view of gaseous CO 2 extent detected by 3D seismics in 2009 (detection threshold 5 m, red dashed line) and 2012 (detection threshold 7.5 m, yellow dashed line), and simulated gaseous CO 2 thickness contours for 2009 (5 m thickness, solid red line) and 2012 (7.5 m thickness, solid yellow line). Empty circles represent pilot points, white-filled circles with crosses well locations. Blue-to-red contours show the permeability multipliers determined by inverse model calibration. (b) Close-up plan view of absolute thickness residuals based on the data provided in Figure 6b. Circles are scaled to absolute residuals at their respective locations (UTM-WGS84 projection).
Energies 10 01559 g007
Figure 8. (a) Plan view of initial horizontal permeability distribution and (b) the revised one in the reservoir model far-field (5 km × 5 km, black rectangle indicates well locations). (c) Plan view of initial horizontal permeability distribution and (d) the revised one in the near-well area (distance between the wells Ktzi 201 and Ktzi 200 is 50 m). Fourth upper layer of simulation grid shown in all figures.
Energies 10 01559 g008
Figure 9. (a) Parameter uncertainty at pilot point locations in the calibrated model far-field (b) and near-well area, expressed by standard deviation lg σ . Initial standard deviations were defined to lg σ = 3.5 at all 52 pilot points. Empty rounded squares represent well locations. Other circle sizes correlate with calculated standard deviation values independently for each figure (UTM-WGS84 projection).
Energies 10 01559 g009

