An Electric Power Consumption Analysis System for the Installation of Electric Vehicle Charging Stations


Abstract
:1. Introduction
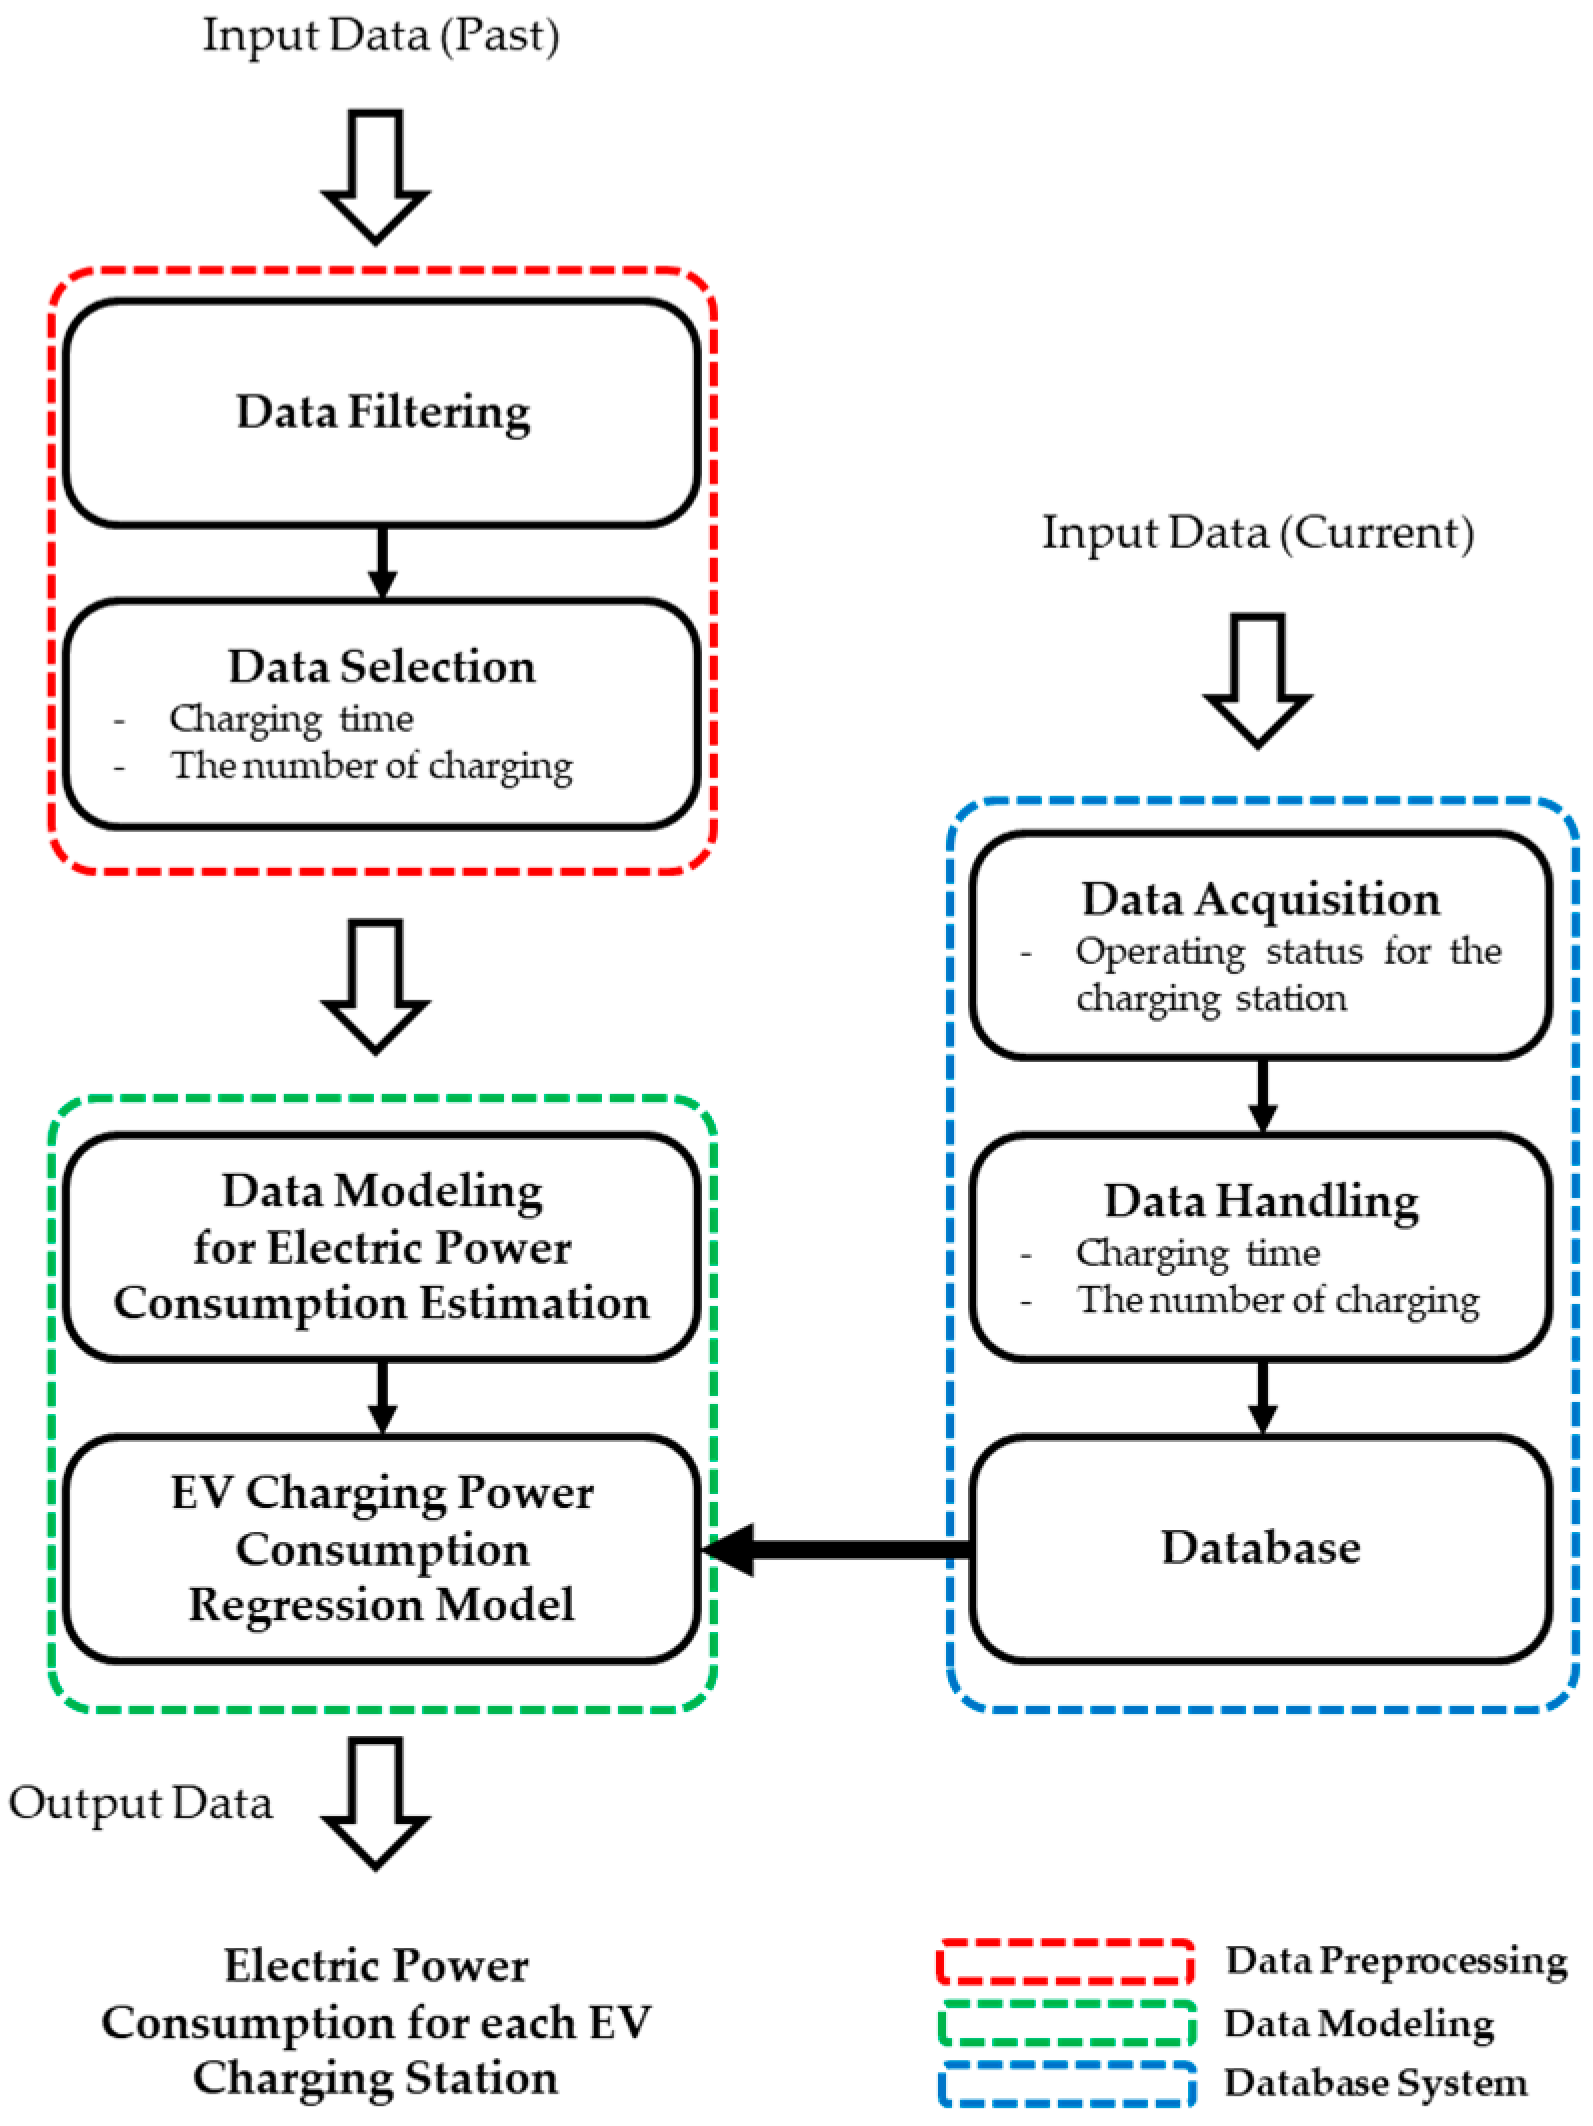
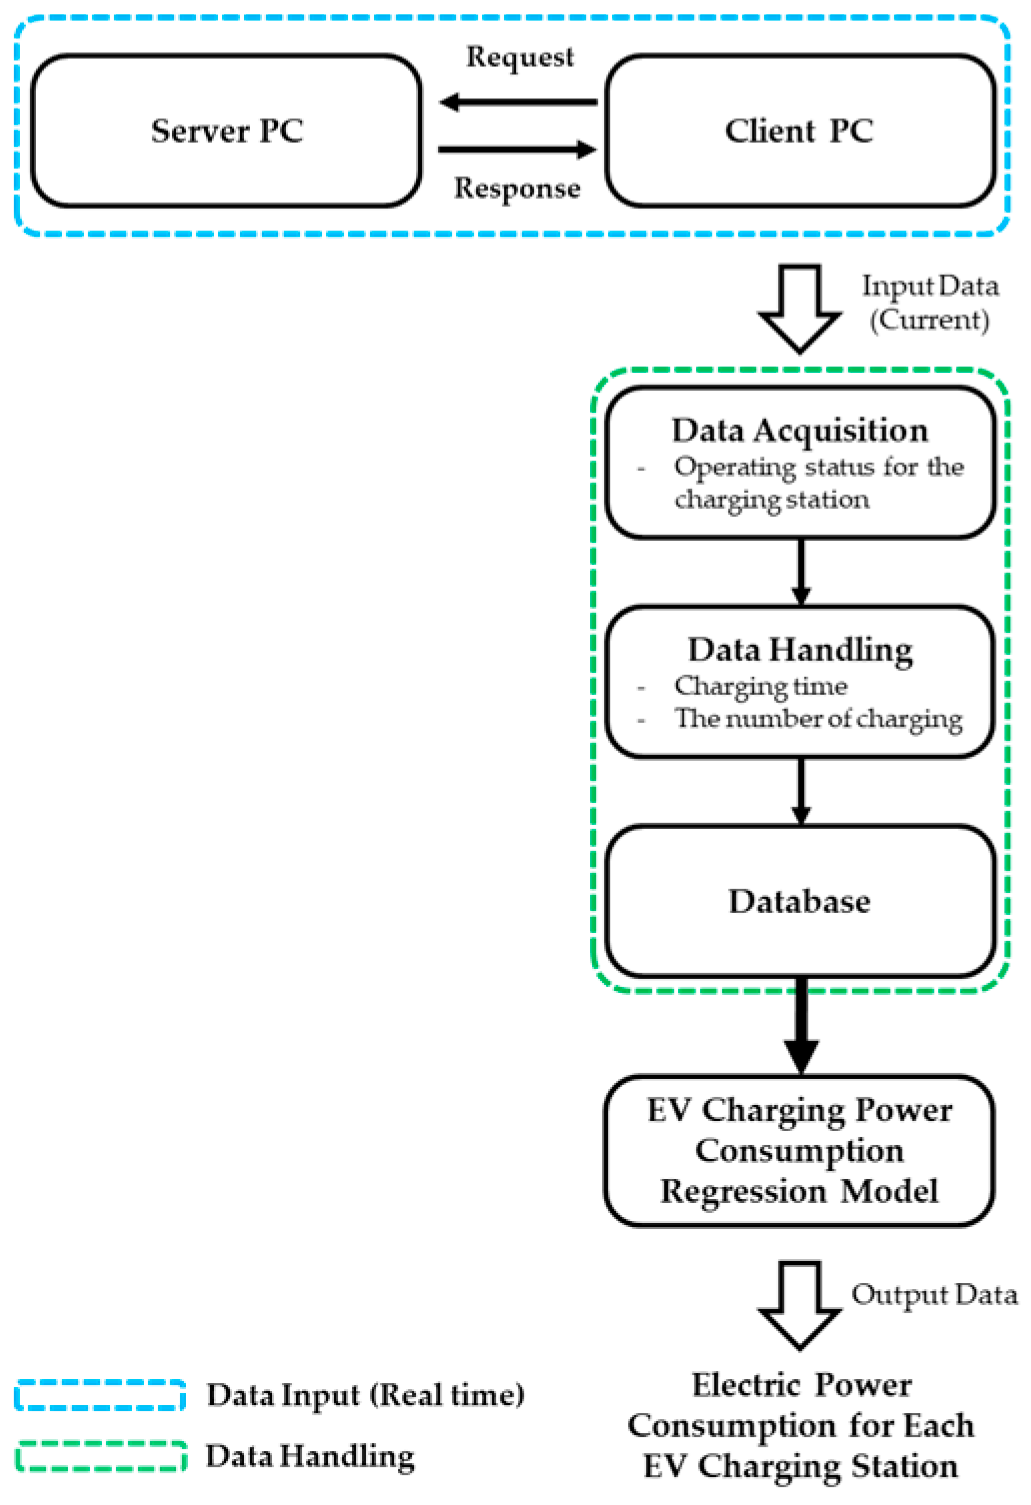
2. Proposed System
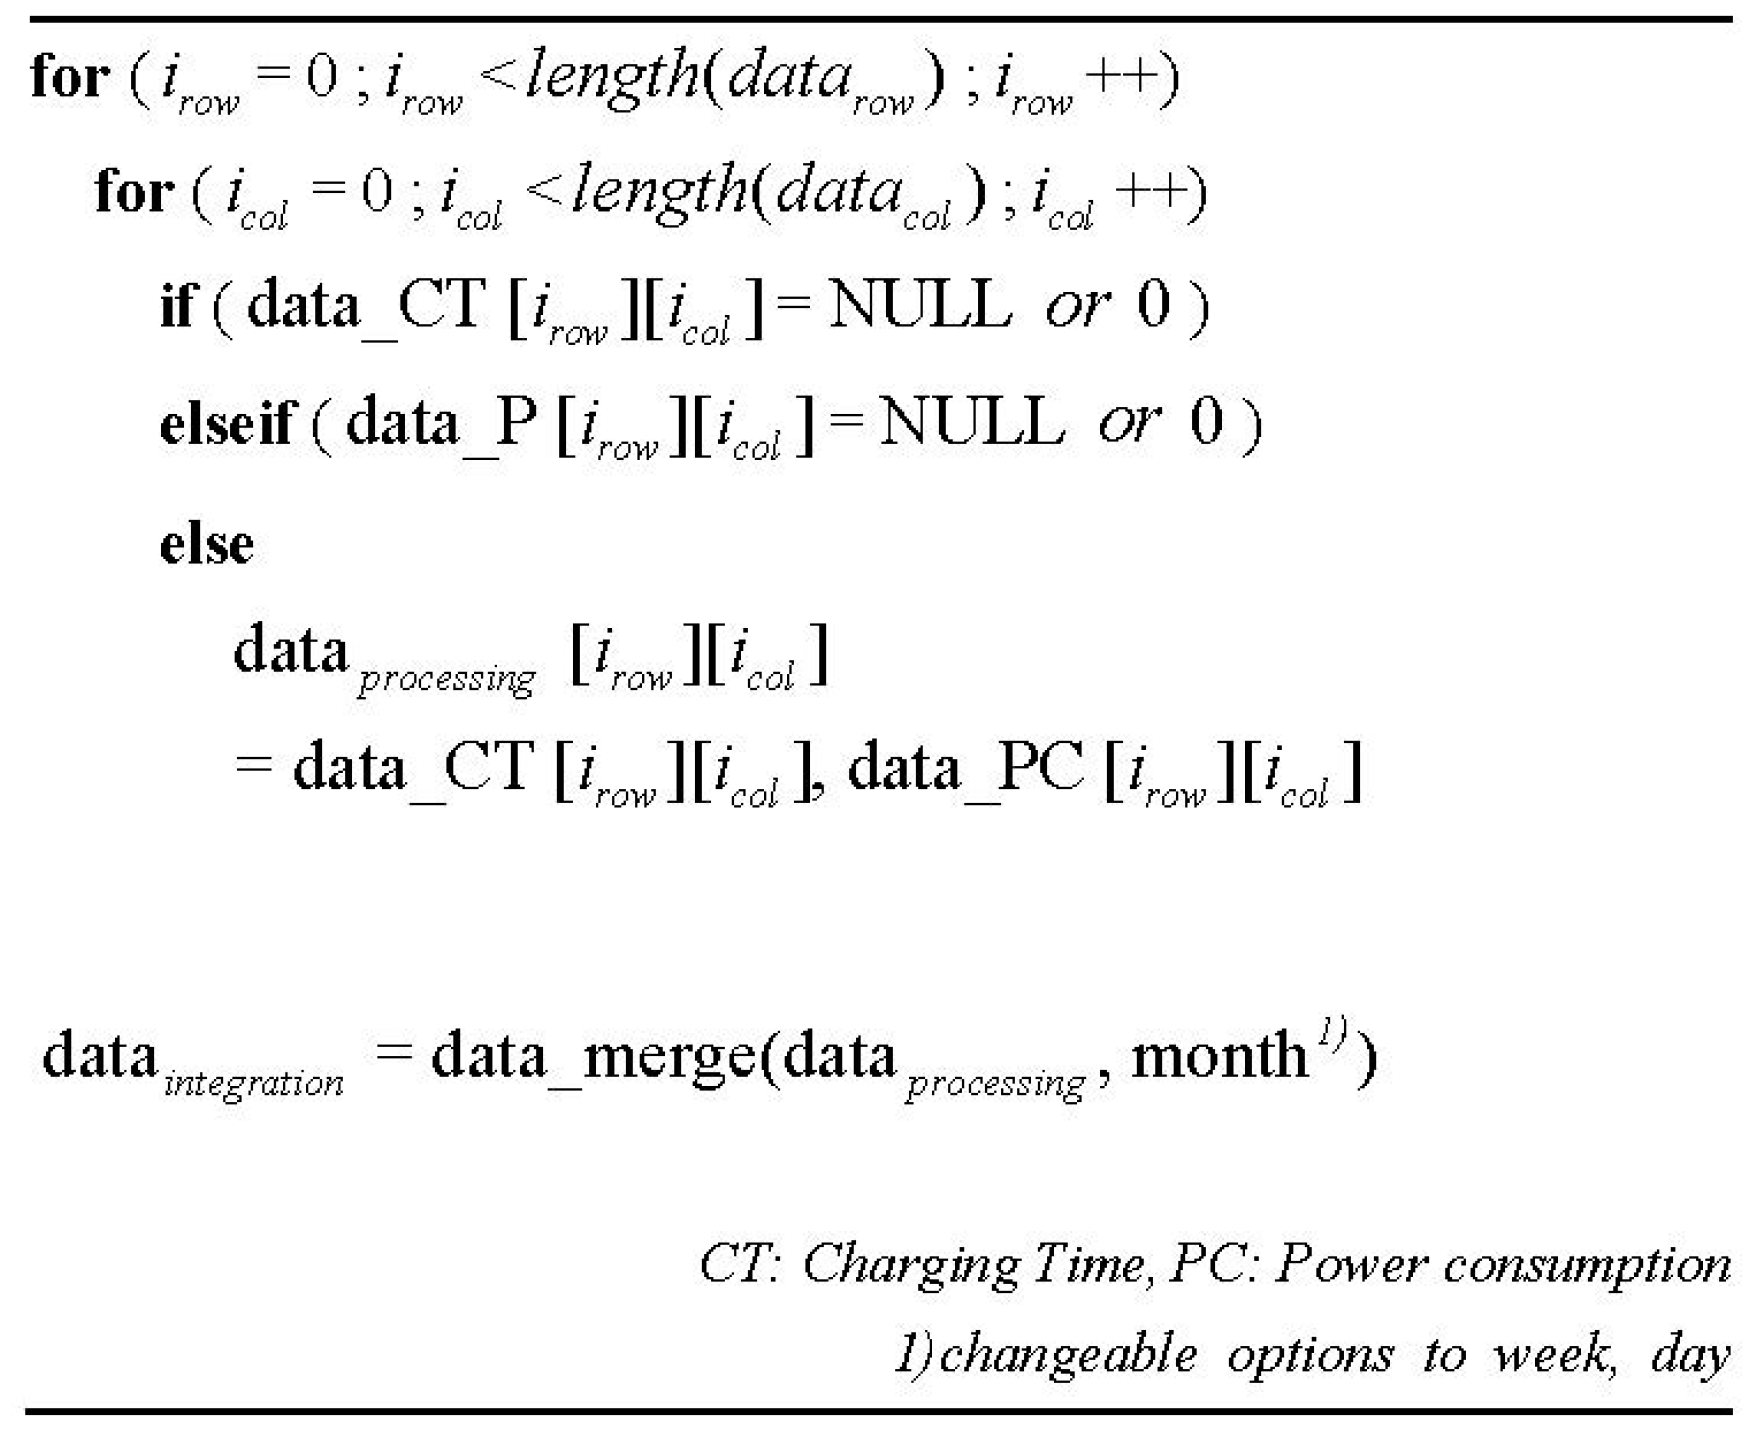
2.1. Data Preprocessing
2.1.1. Data Filtering
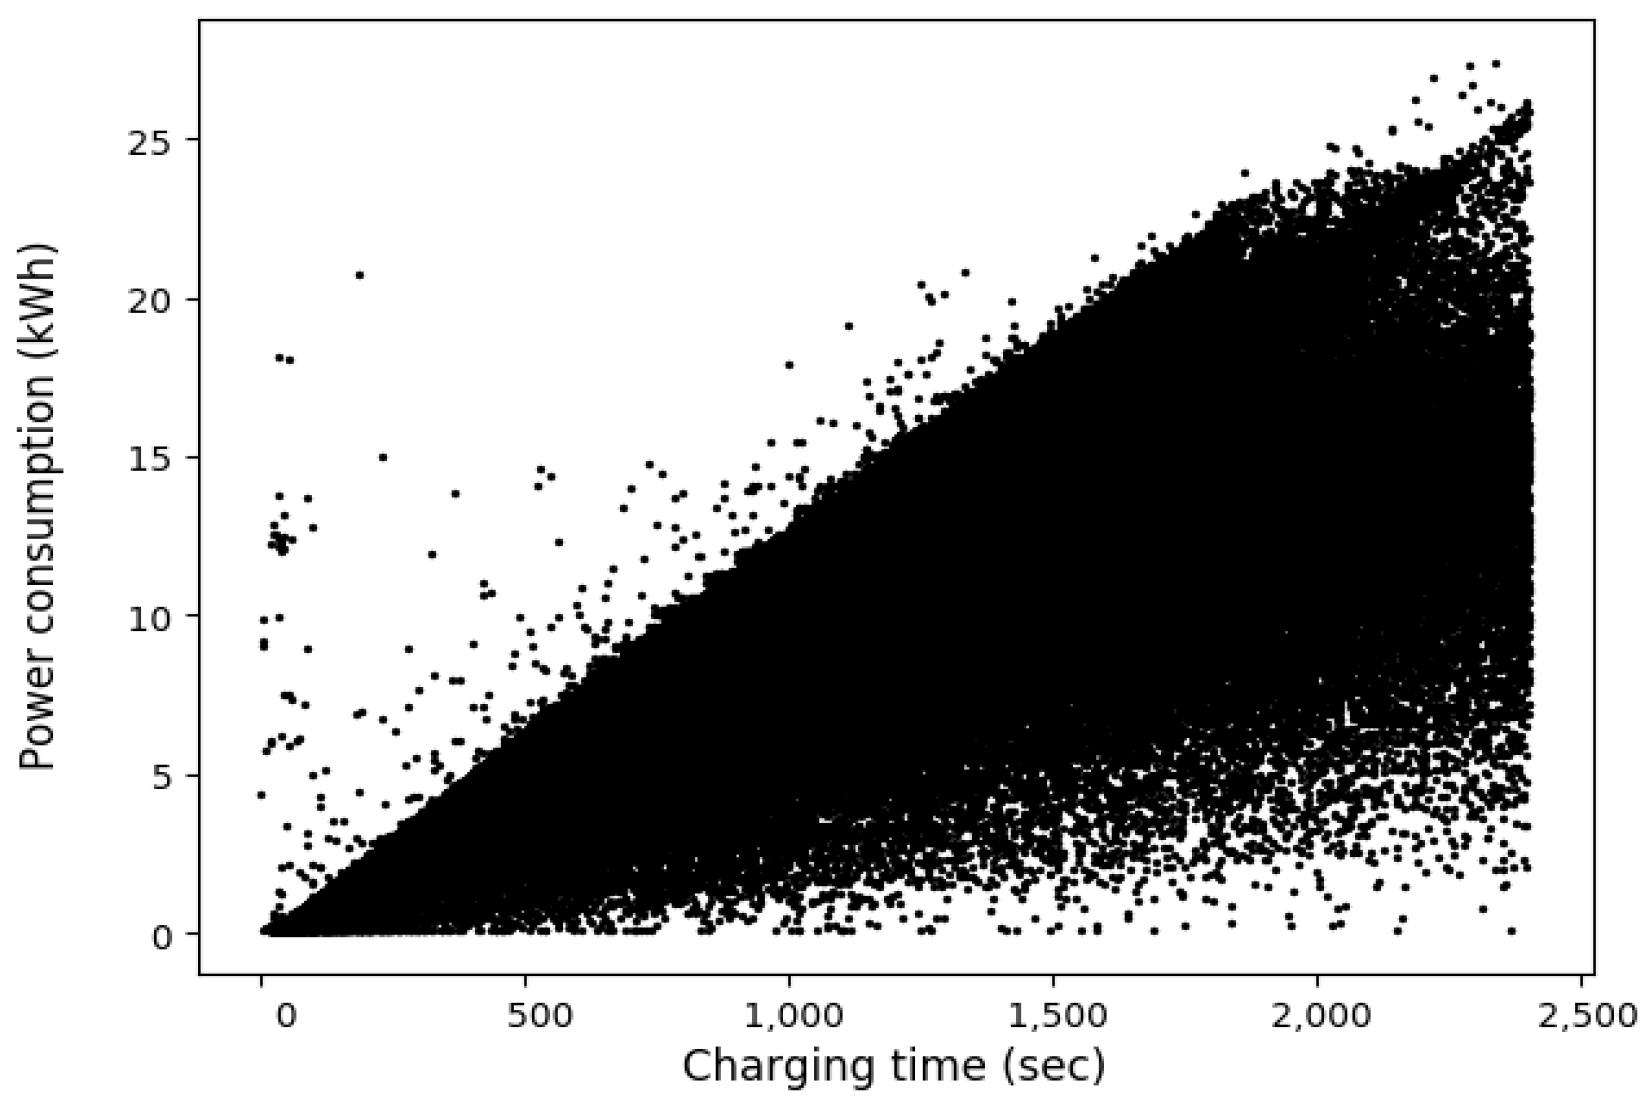
2.1.2. Data Selection
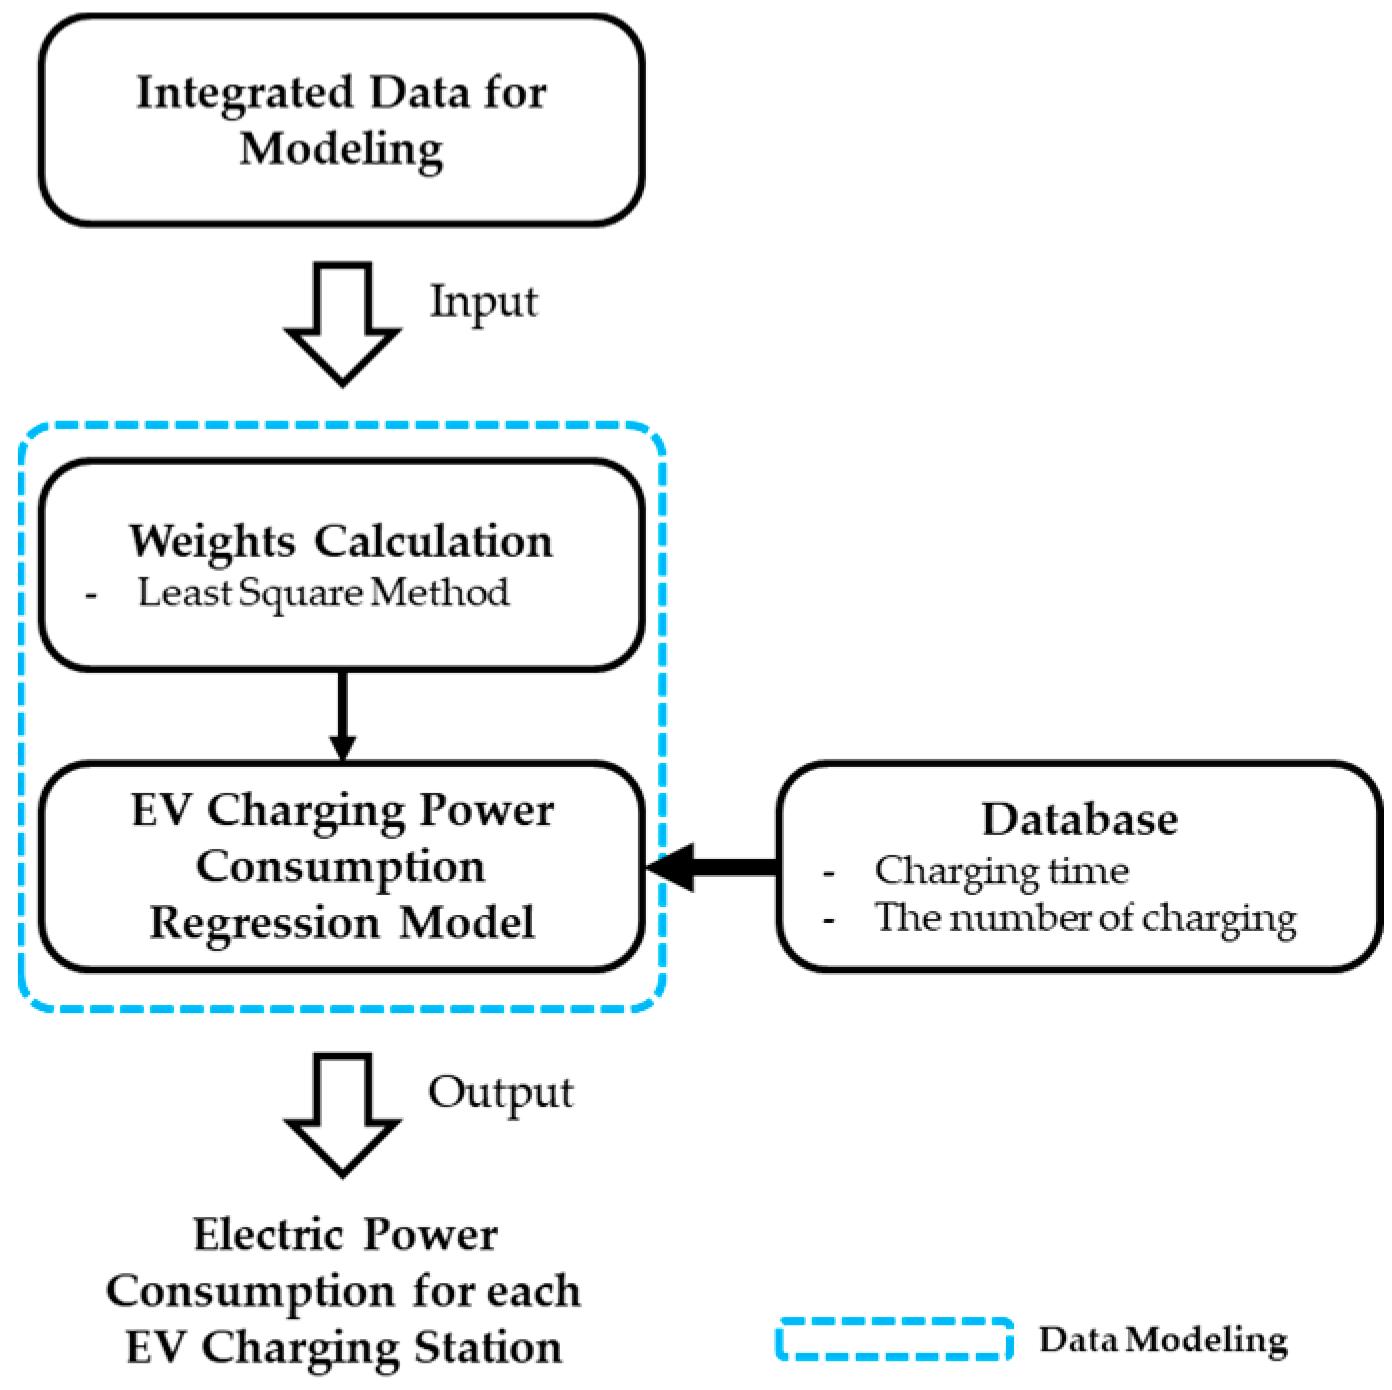
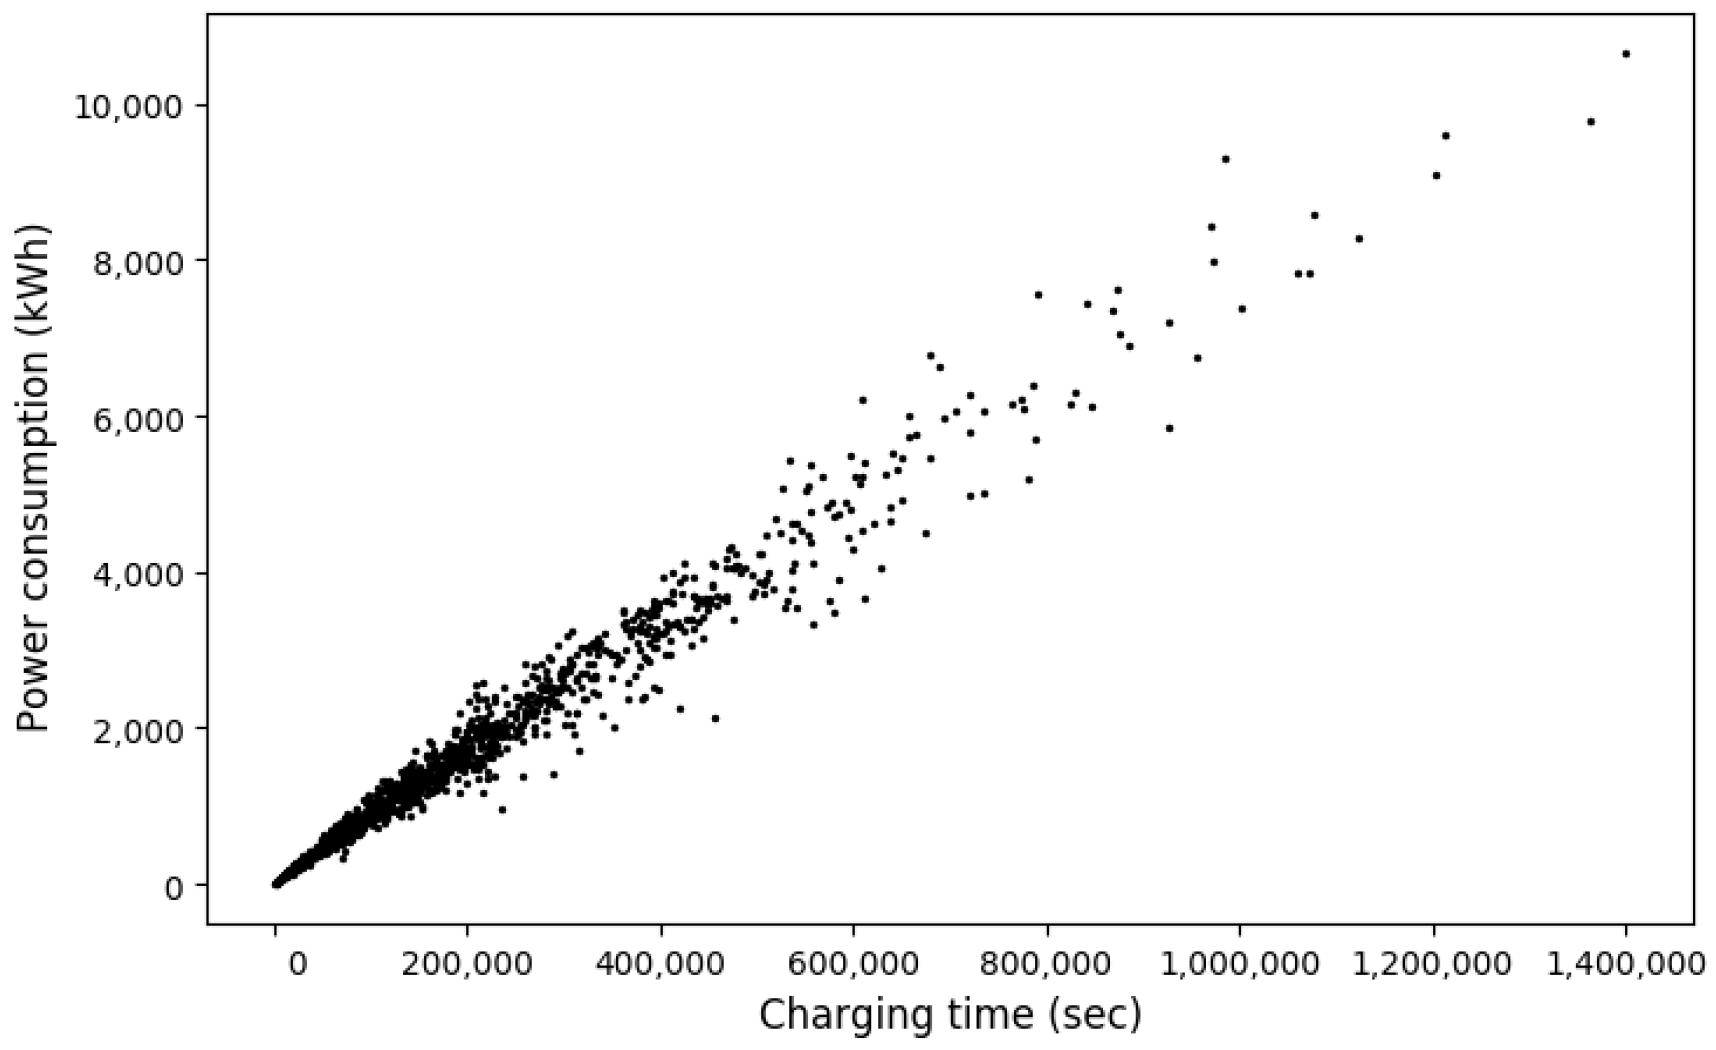
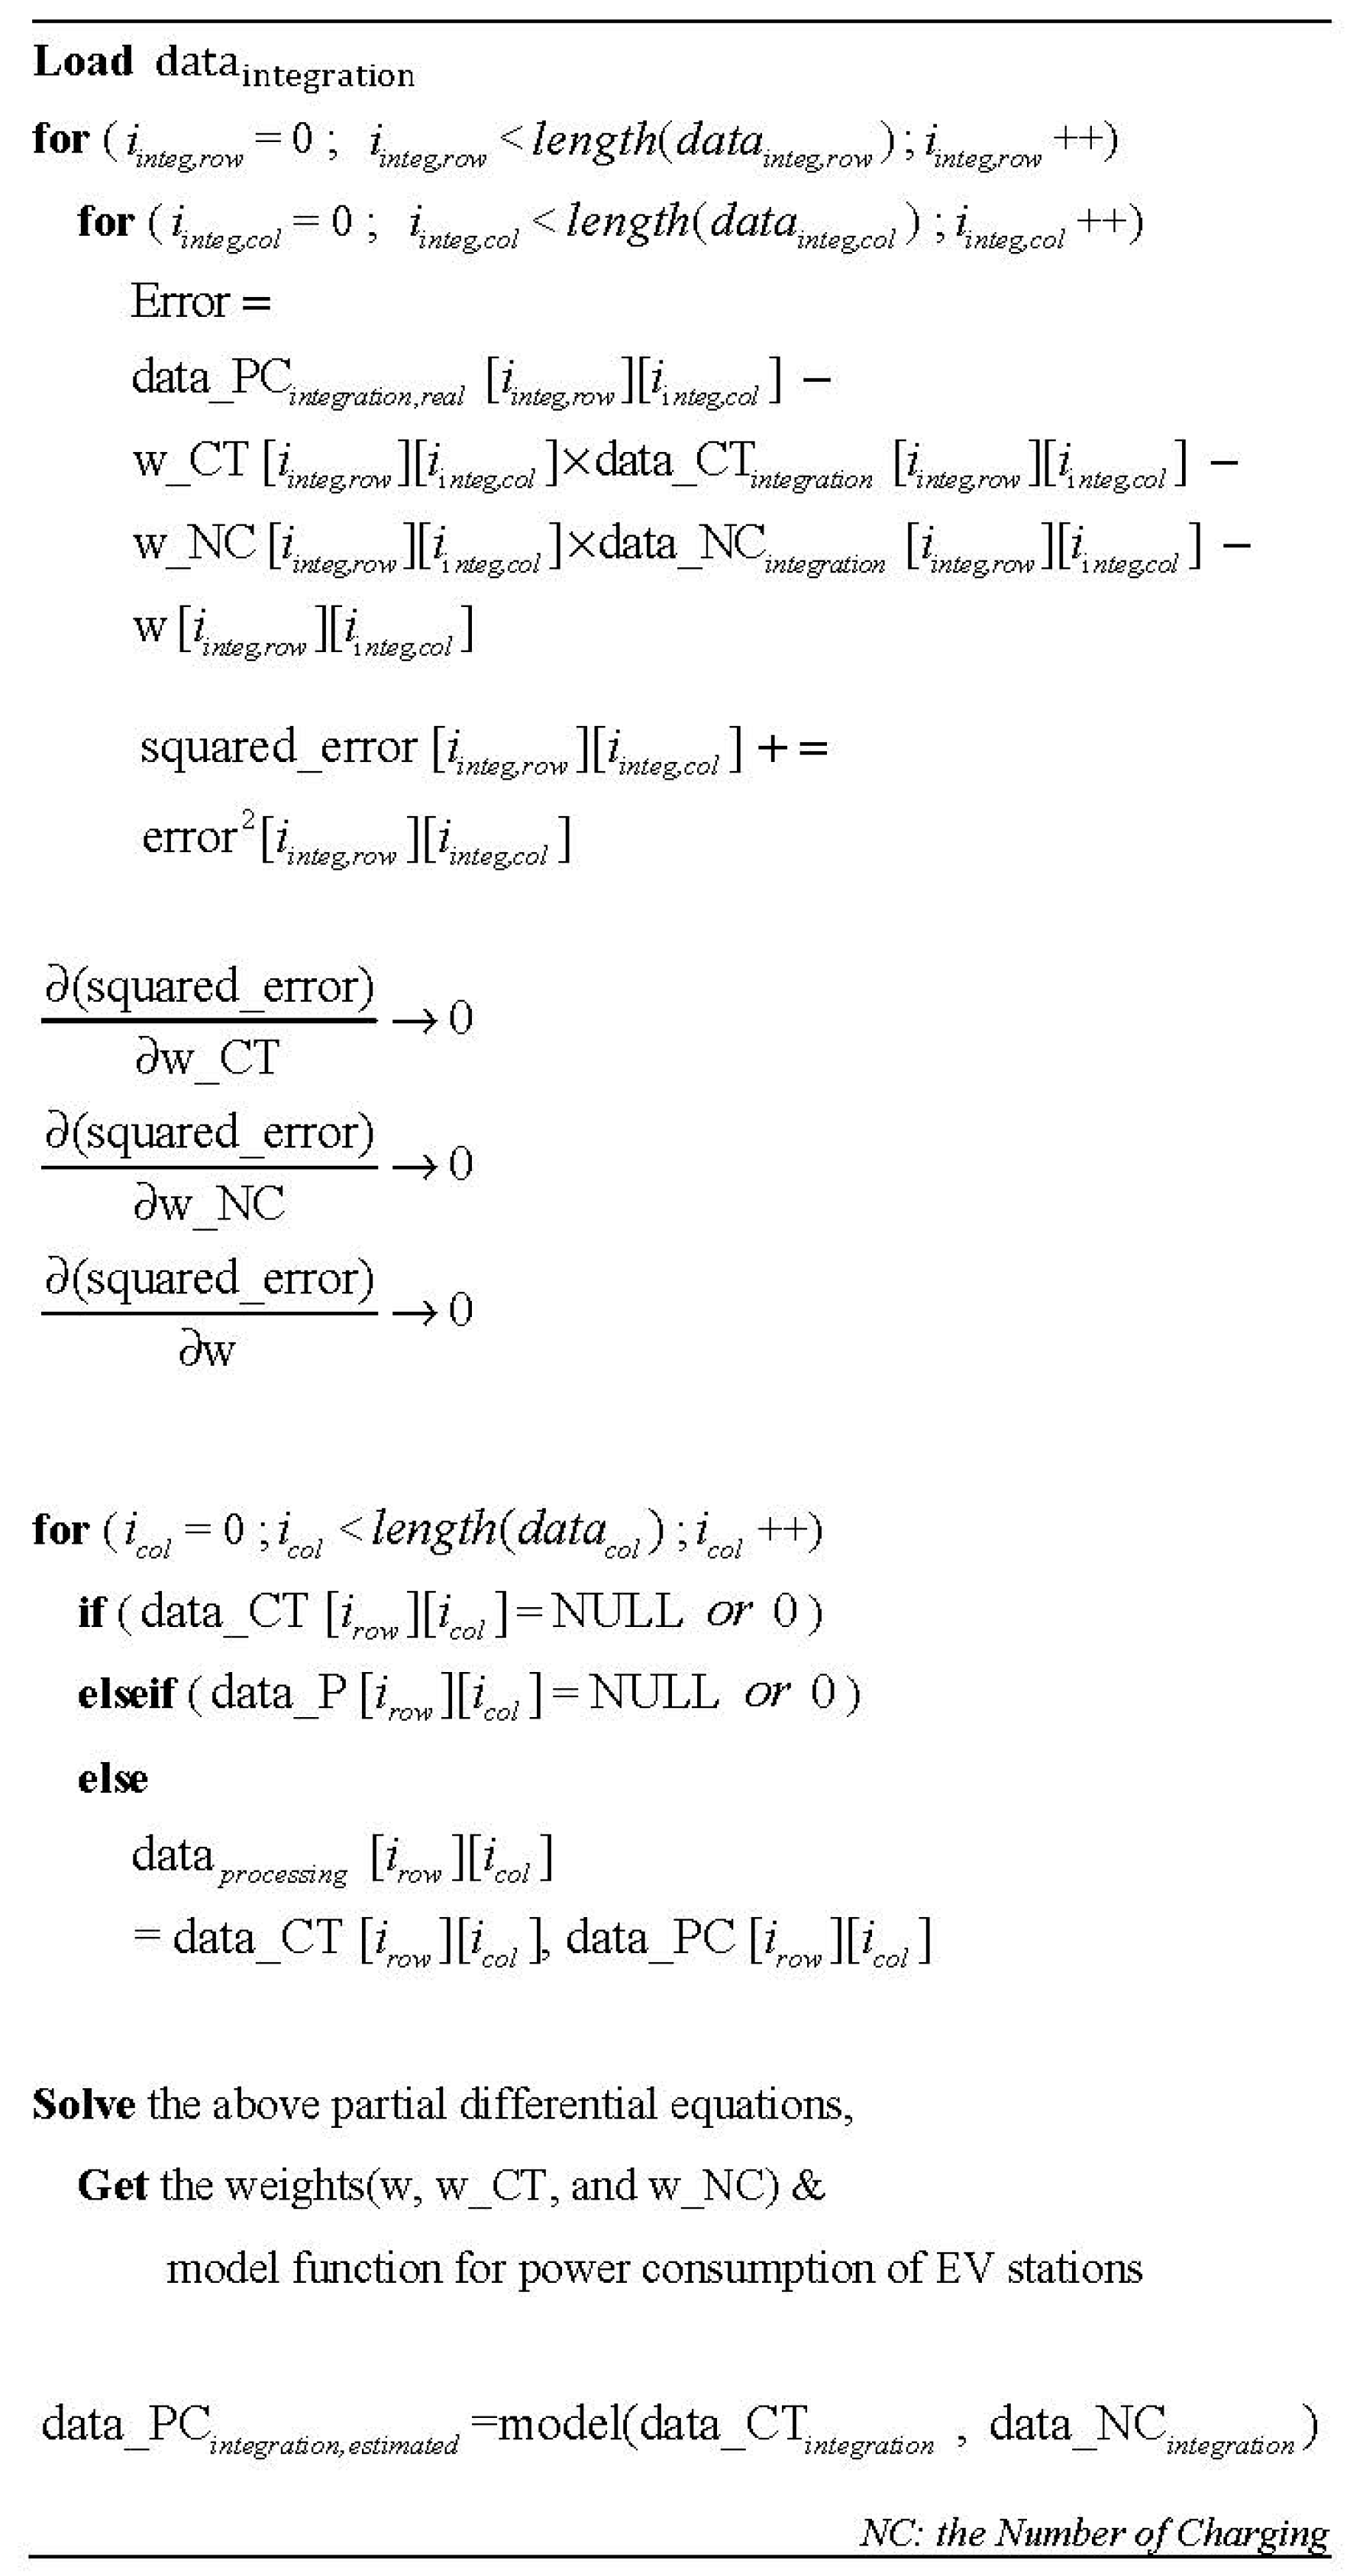
2.2. Data Modeling
EV Charging Power Consumption Regression Model
2.3. Database System
3. Experimental Results
3.1. System Implementation
3.2. Evaluation of EV Charging Power Consumption Regression Model
3.2.1. Evaluation Metrics
3.2.2. Evaluation Results for EV Charging Power Consumption Regression Model
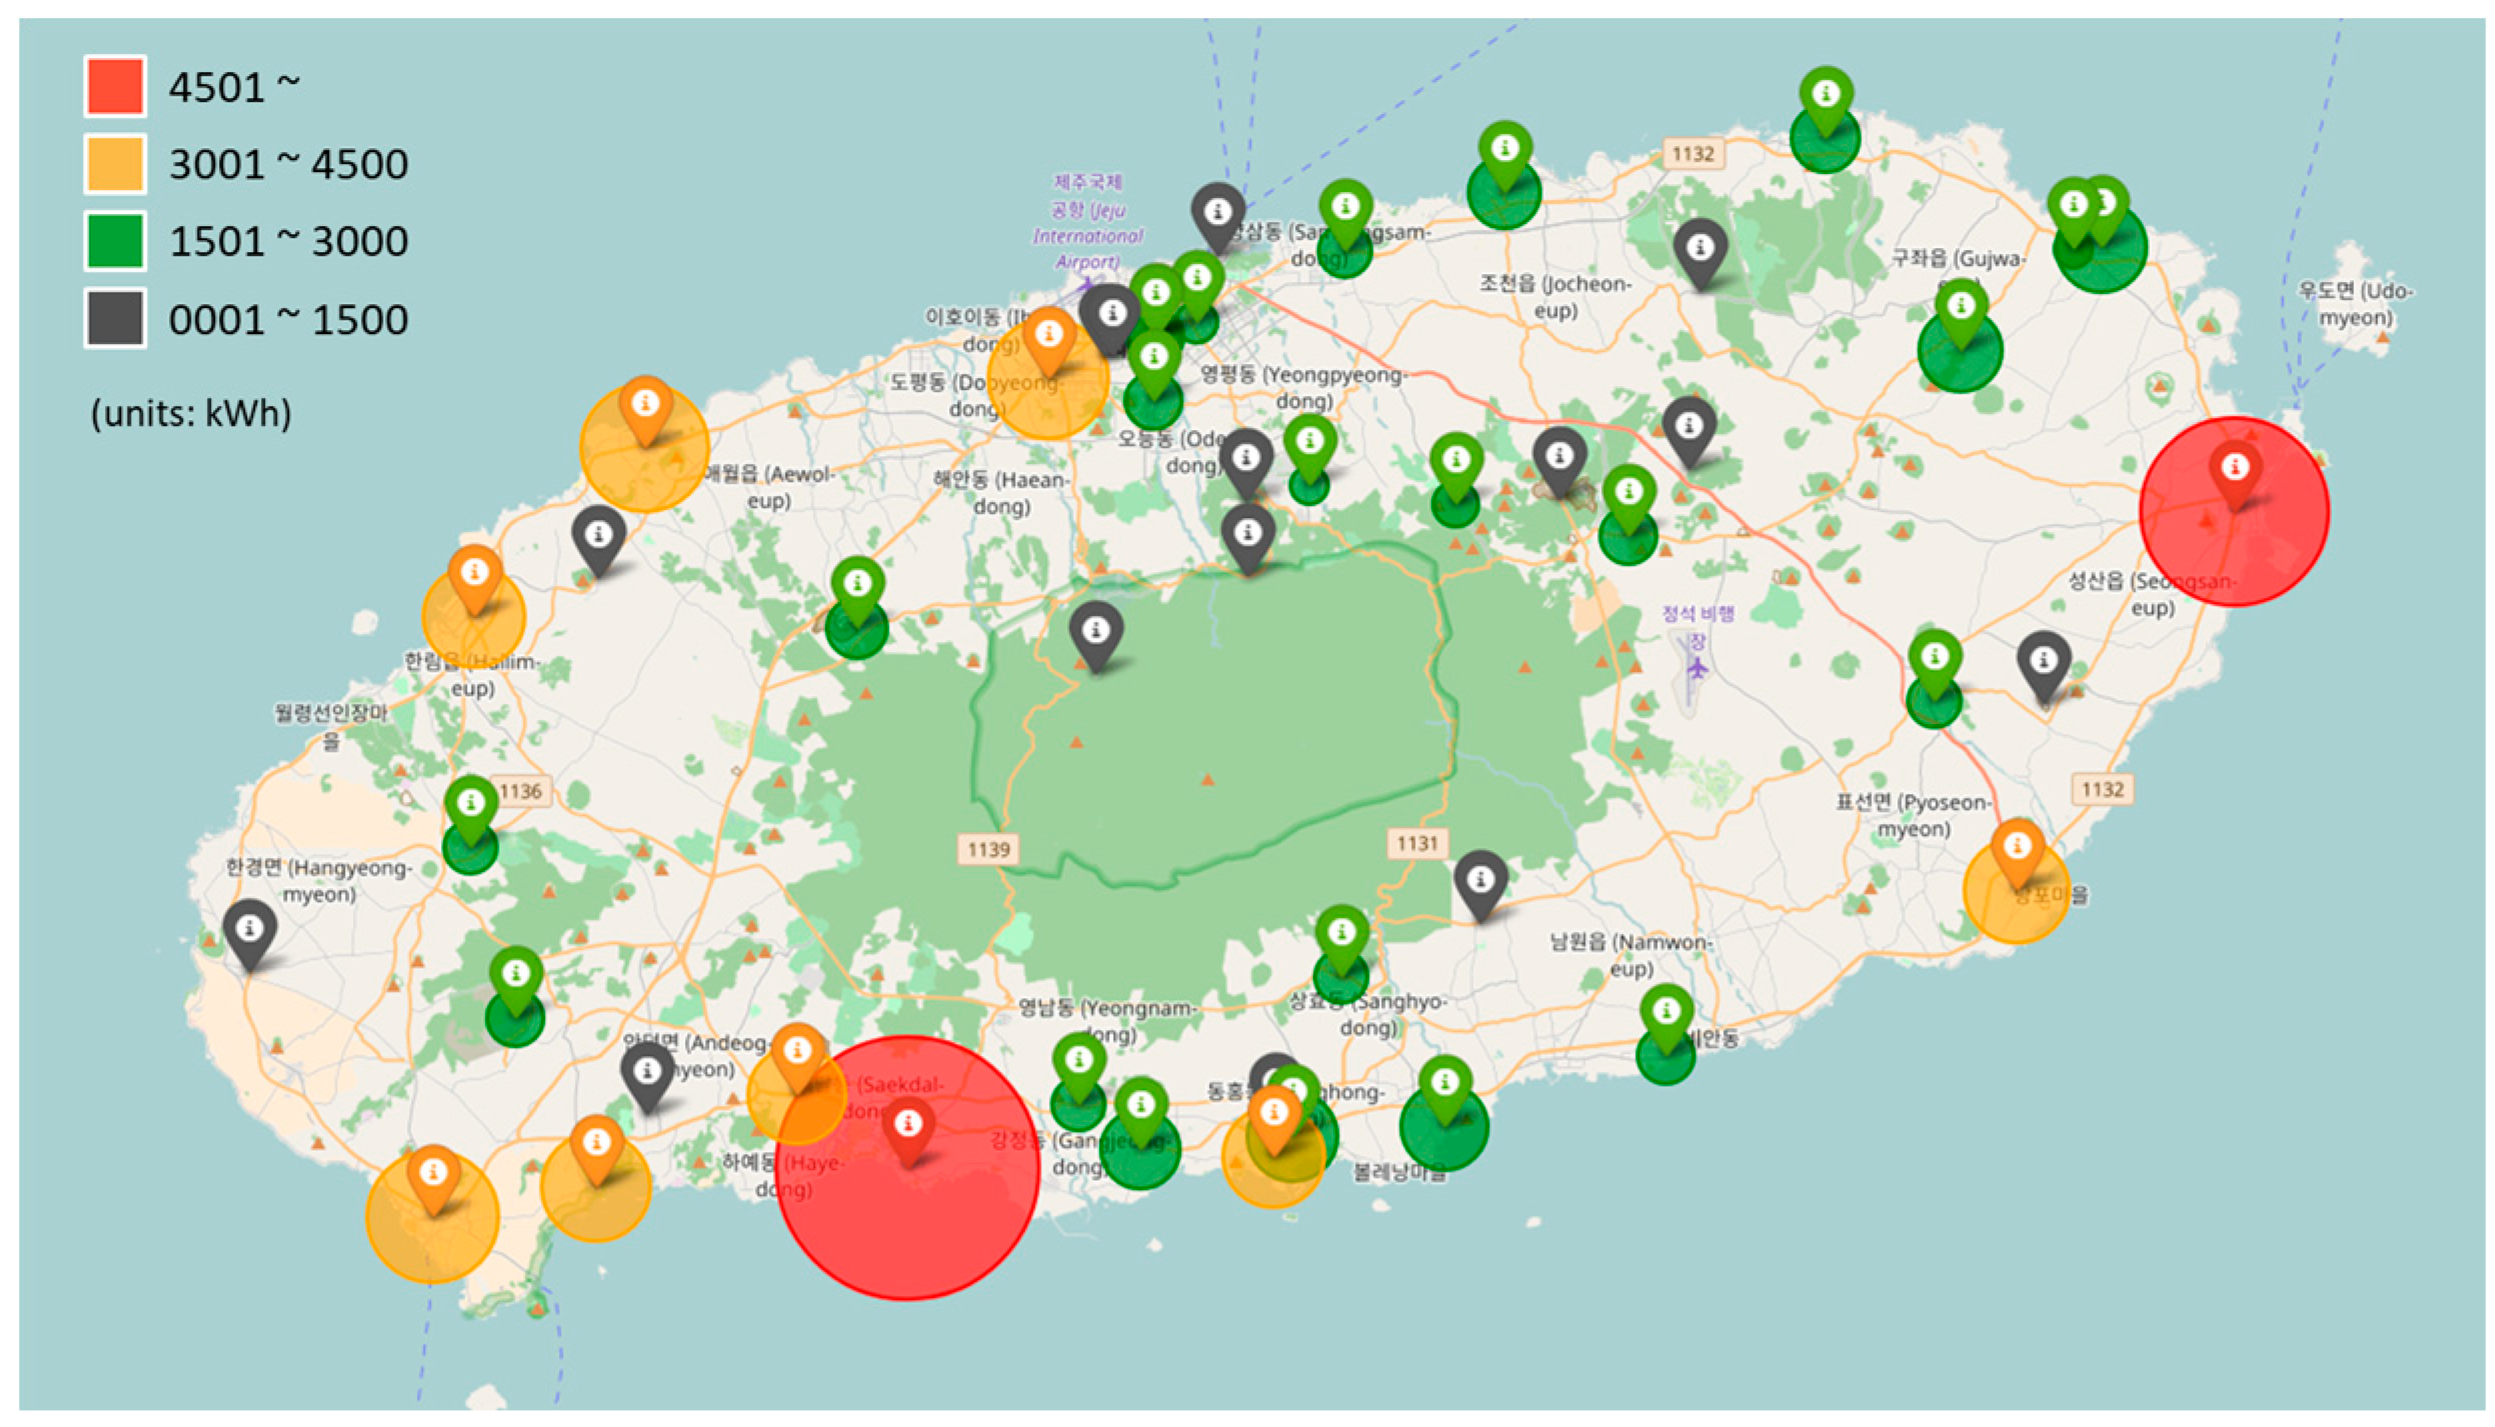
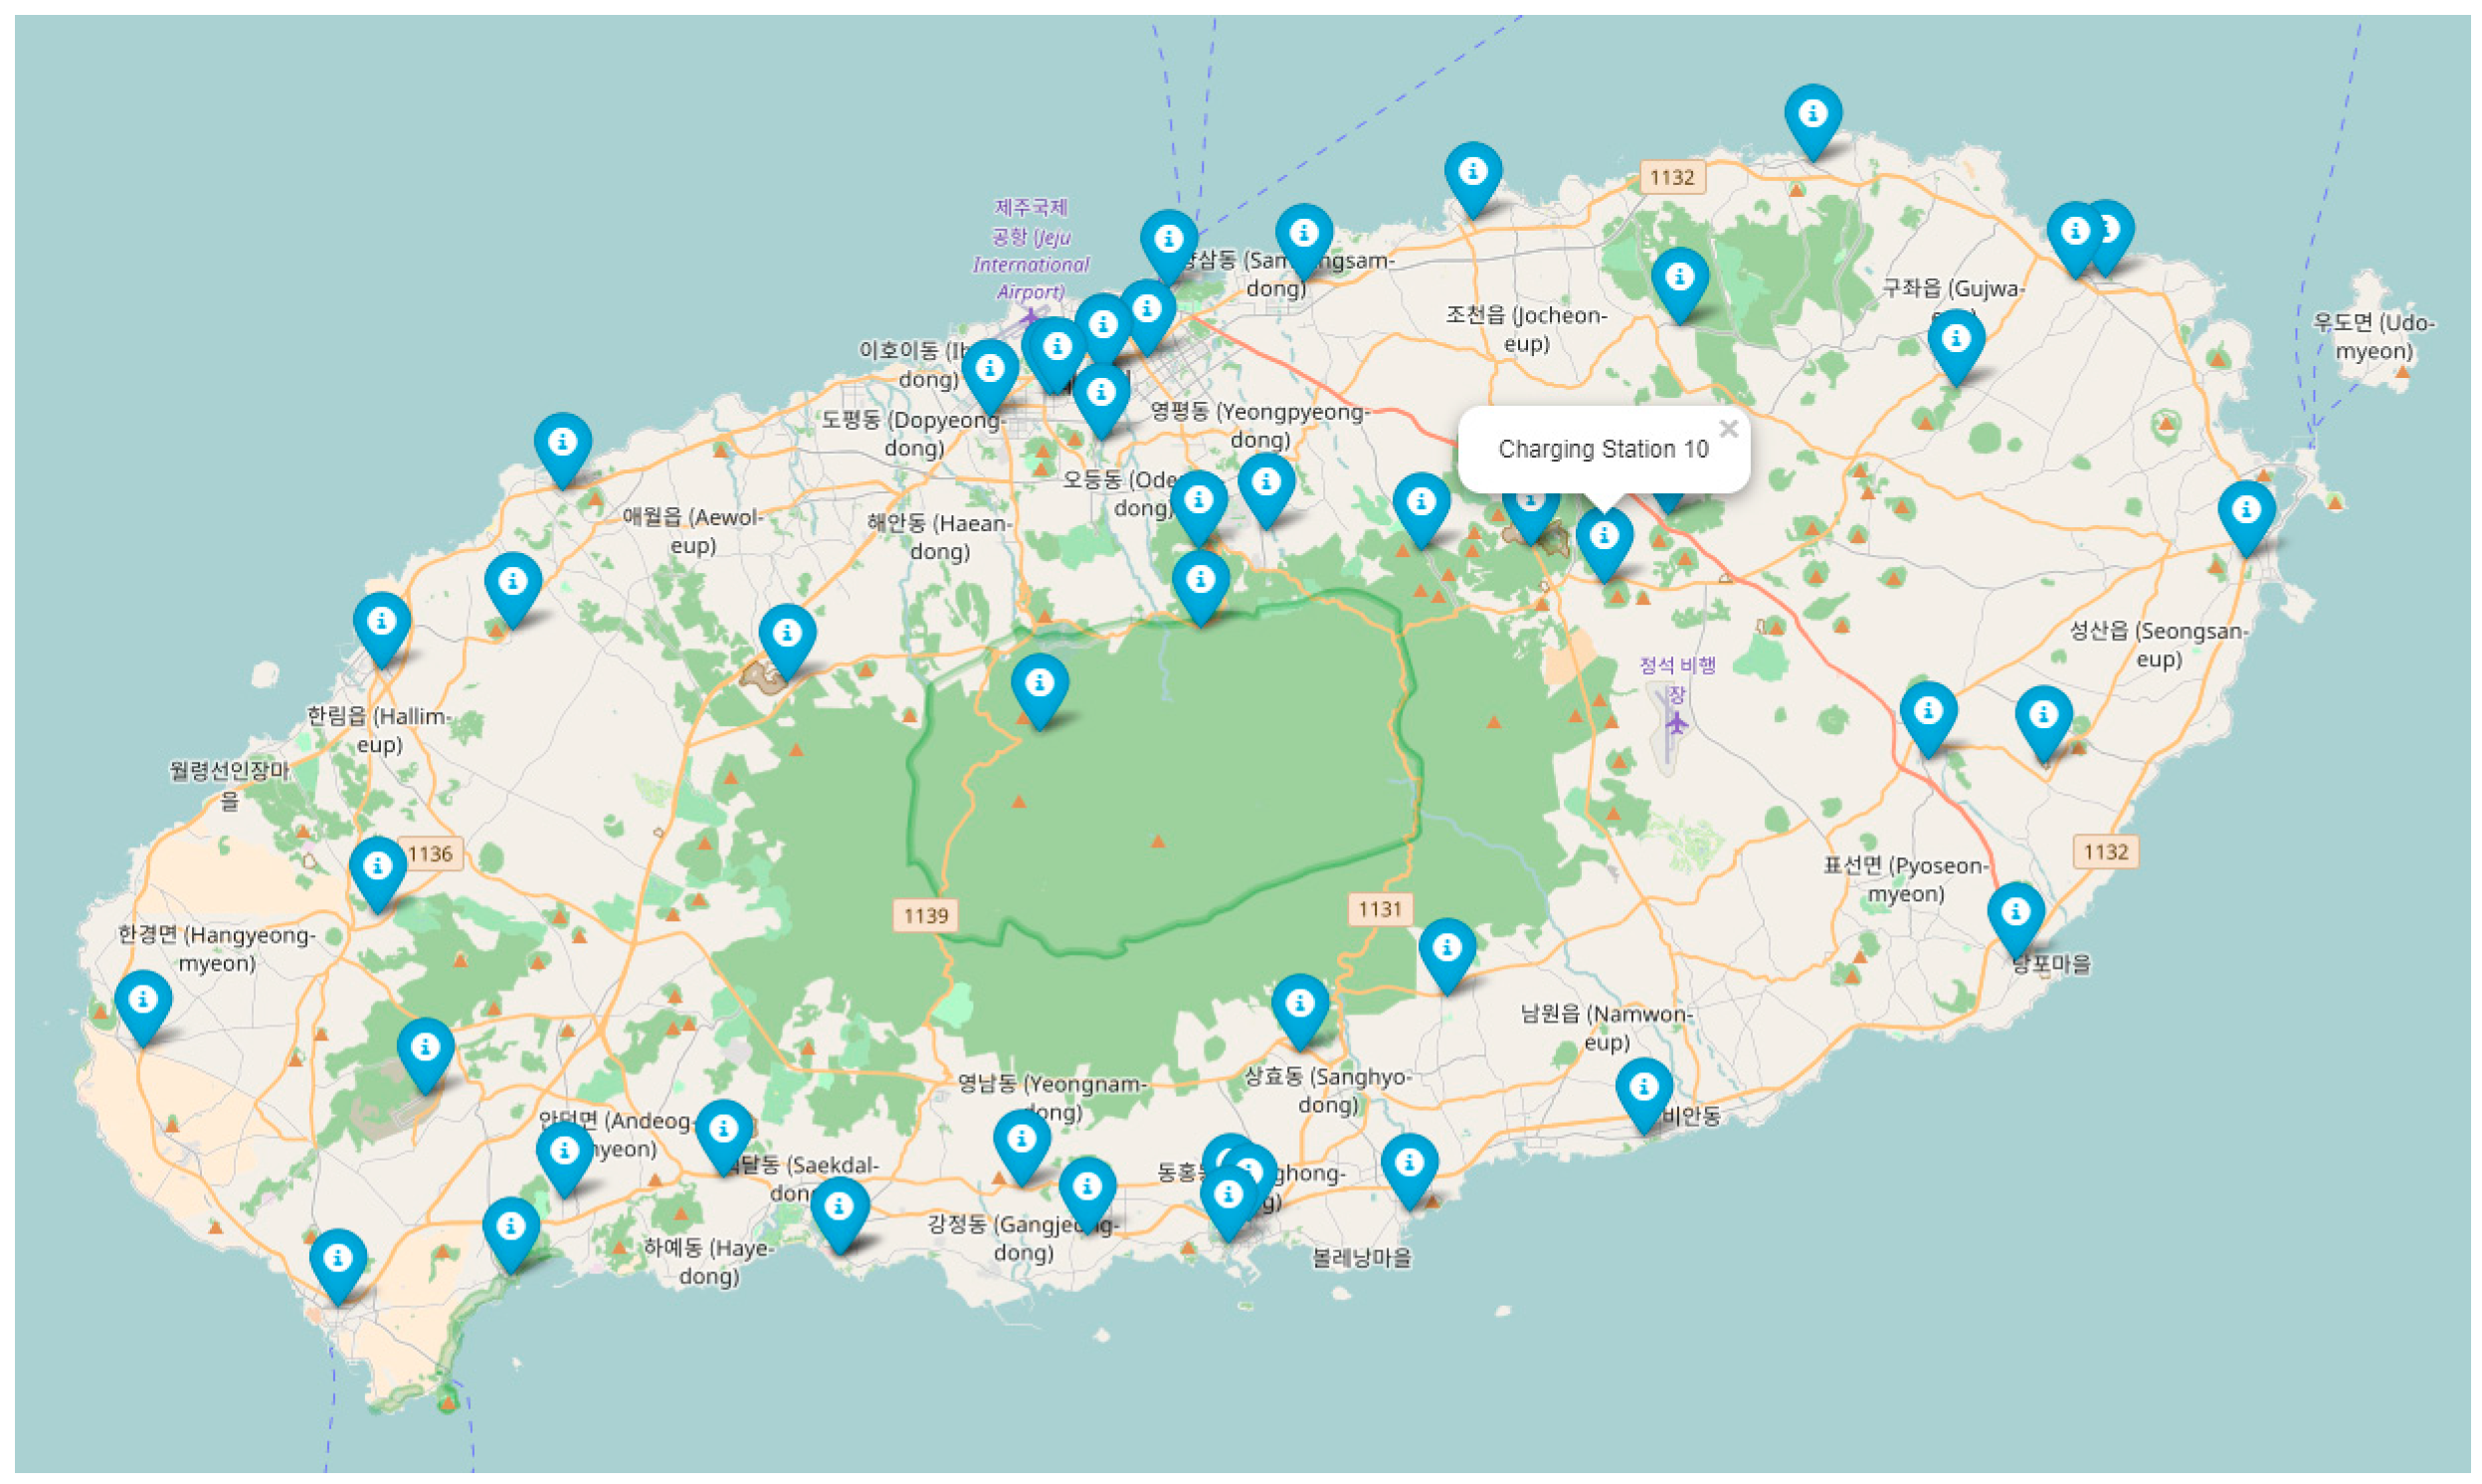
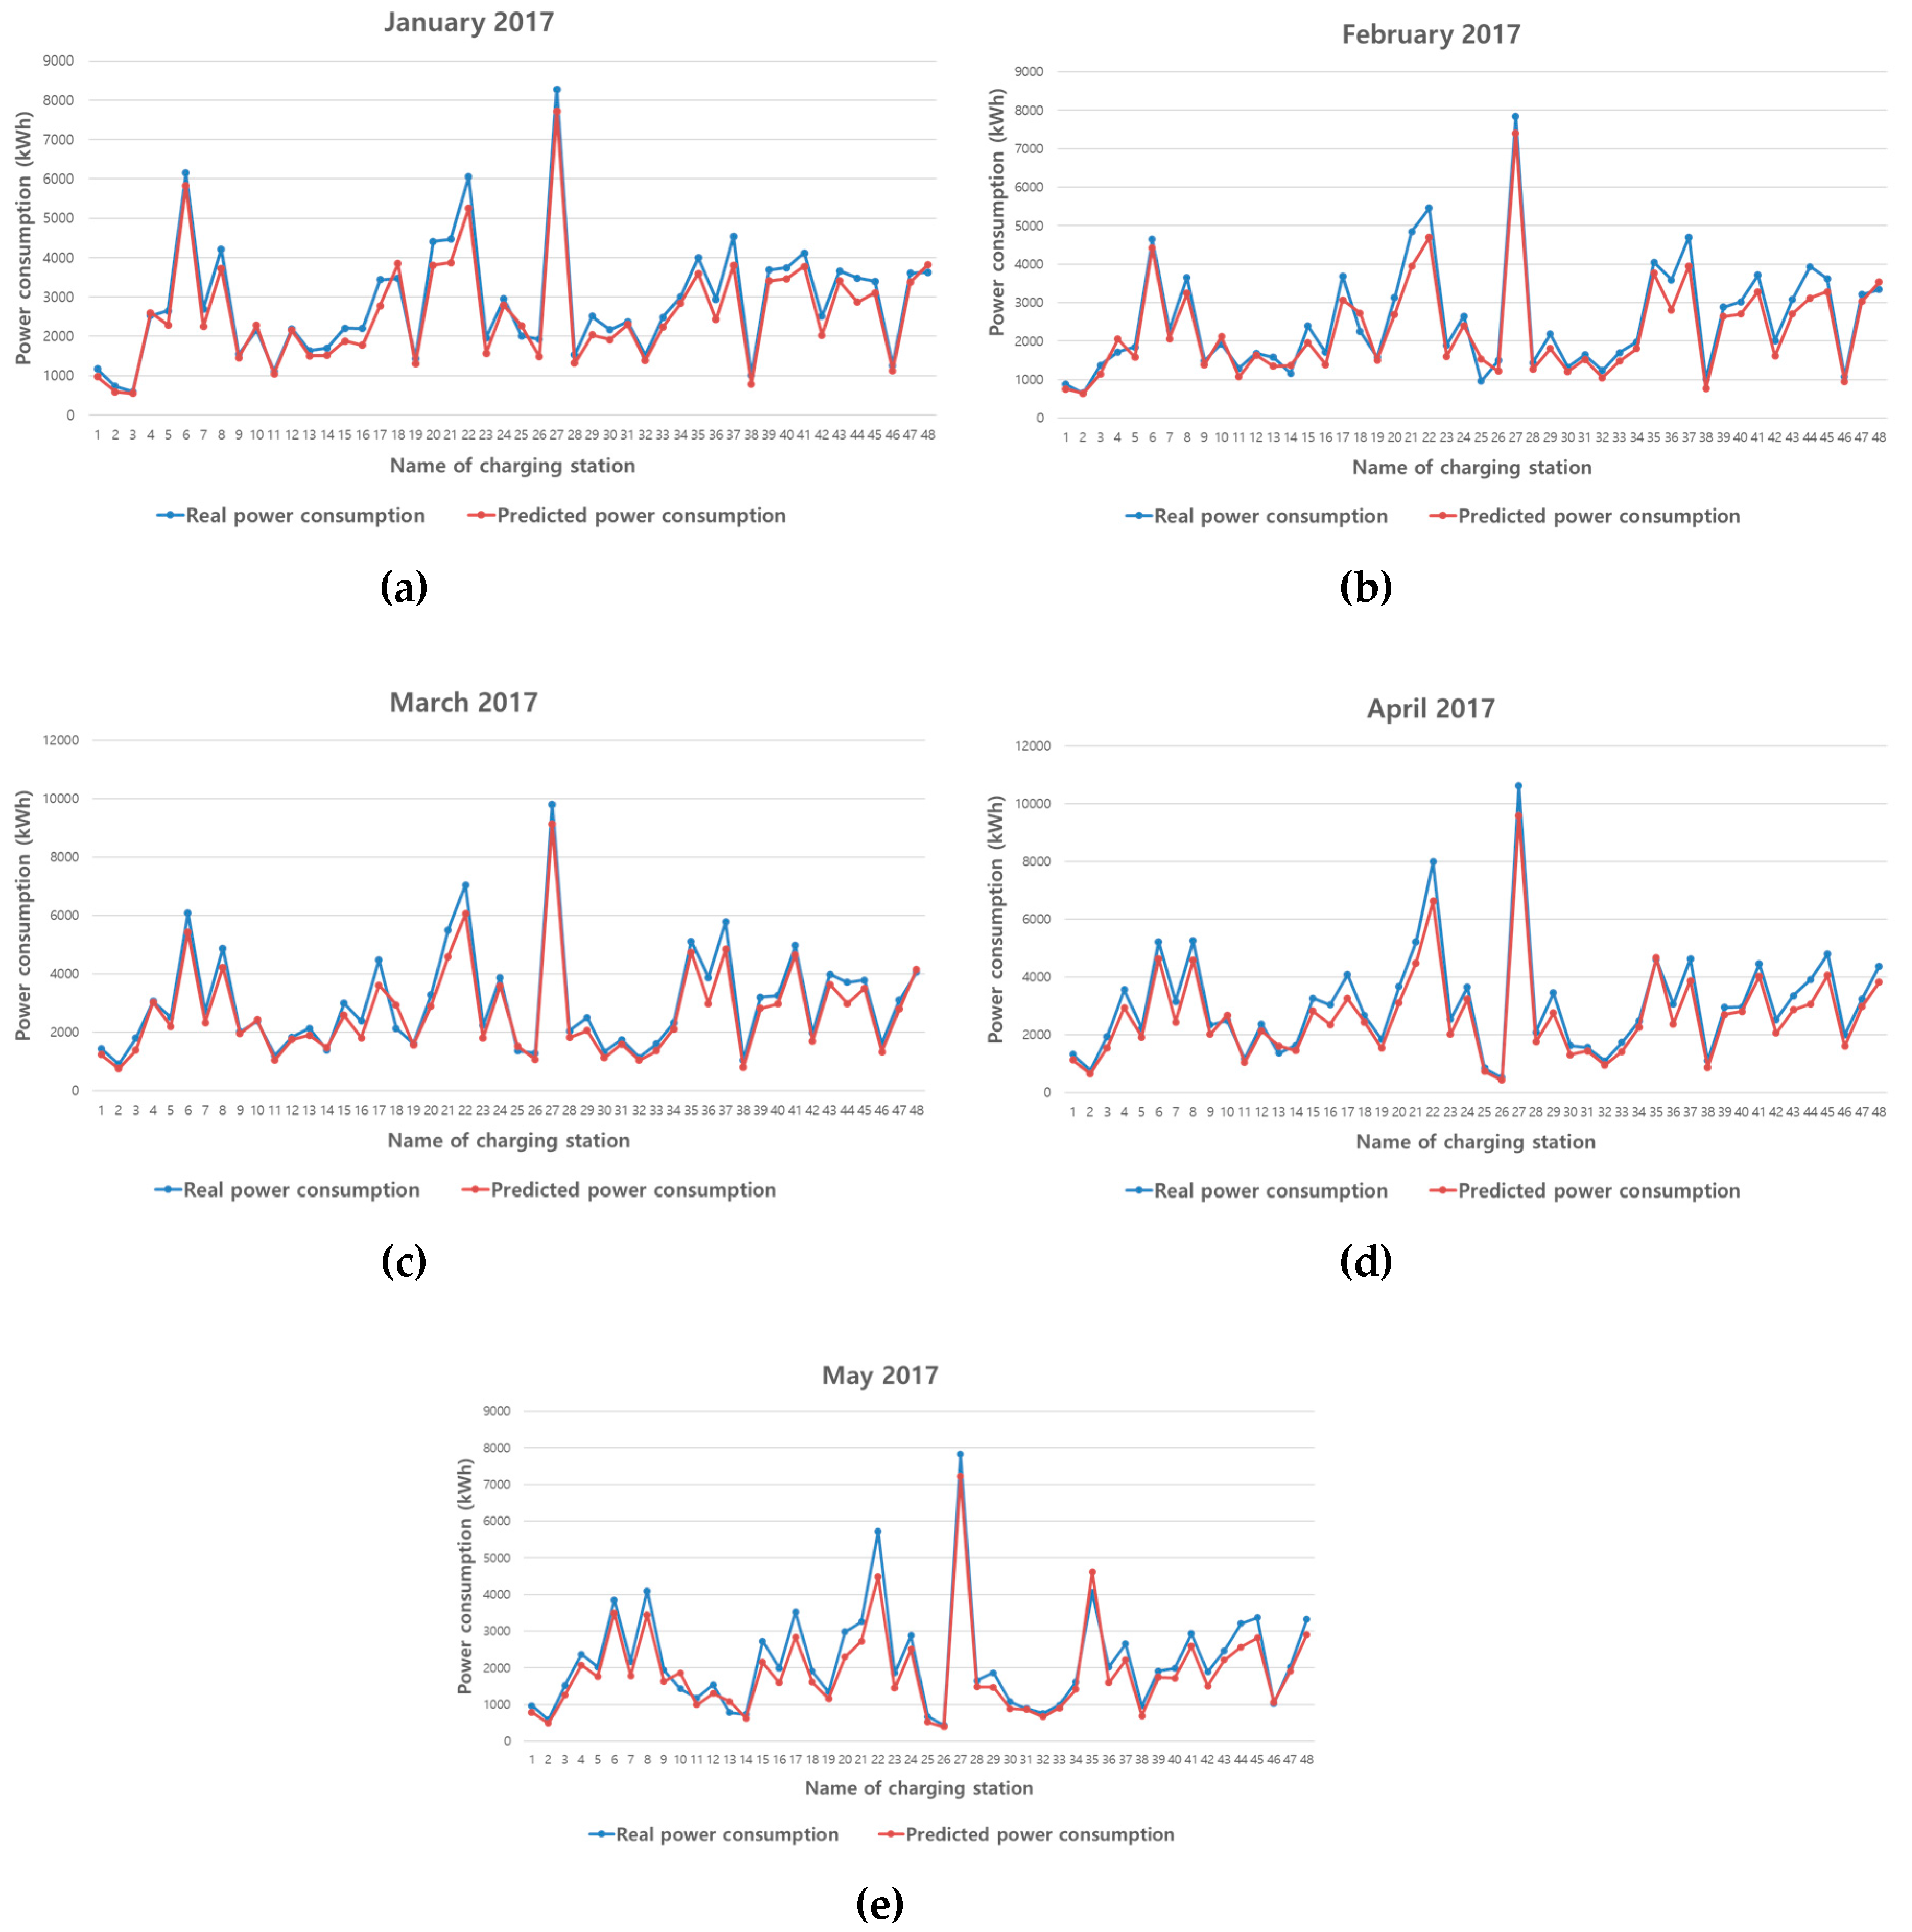
3.3. Electric Power Consumption for Each Charging Station
4. Conclusions
Acknowledgments
Author Contributions
Conflicts of Interest
References
- Schneider, K.; Gerkensmeyer, C.; Kintner-Meyer, M.; Fletcher, R. Impact Assessment of Plug-in Hybrid Vehicles on Pacific Northwest Distribution Systems. In Proceedings of the 2008 IEEE Power and Energy Society General Meeting—Conversion and Delivery of Electrical Energy in the 21st Century, Pittsburgh, PA, USA, 20–24 July 2008; pp. 1–6. [Google Scholar]
- Liu, Z.; Wen, F.; Ledwich, G. Optimal Planning of Electric-vehicle Charging Stations in Distribution Systems. IEEE Trans. Power Deliv. 2013, 28, 102–110. [Google Scholar] [CrossRef]
- Korea Power Exchange. Available online: www.kpx.or.kr/www/contents.do?key=356 (accessed on 27 July 2017).
- Qian, K.; Zhou, C.; Allan, M.; Yuan, Y. Modeling of Load Demand Due to EV Battery Charging in Distribution Systems. IEEE Trans. Power Syst. 2011, 26, 802–810. [Google Scholar] [CrossRef]
- Carlos Gomez, J.; Morcos, M.M. Impact of EV Battery Chargers on the Power Quality of Distribution Systems. IEEE Trans. Power Deliv. 2003, 18, 975–981. [Google Scholar] [CrossRef]
- Cheng, C.; Yuan, H.-M. Study on Impact of Electric Vehicles Charging Models on Power Load. In Proceedings of the 2017 2nd Asia Conference on Power and Electrical Engineering (ACPEE), Shanghai, China, 24–26 March 2017; pp. 1–6. [Google Scholar]
- Qiang, H.; Gu, Y.; Zheng, J.; Zhou, X.; Li, X. Modeling and Simulating of Private EVs Charging Load. Open Electr. Electron. Eng. J. 2015, 9, 231–237. [Google Scholar] [CrossRef]
- Cauwer, C.D.; Mierlo, J.V.; Coosemans, T. Energy Consumption Prediction for Electric Vehicles Based on Real-World Data. Energies 2015, 8, 8573–8593. [Google Scholar] [CrossRef]
- Sun, Q.; Liu, J.; Rong, X.; Zhang, M.; Song, X.; Bie, Z.; Ni, Z. Charging Load Forecasting of Electric Vehicle Charging Station Based on Support Vector Regression. In Proceedings of the 2016 IEEE PES Asia-Pacific Power and Energy Engineering Conference (APPEEC), Xi’an, China, 25–28 October 2016; pp. 1777–1781. [Google Scholar]
- Cao, Y.; Tang, S.; Li, C.; Zhang, P.; Tan, Y.; Zhang, Z.; Li, J. An Optimized EV Charging Model Considering TOU Price and SOC Curve. IEEE Trans. Smart Grid 2012, 3, 388–393. [Google Scholar] [CrossRef]
- Montgomery, D.C.; Peck, E.A.; Vining, G.G. Introduction to Linear Regression Analysis, 5th ed.; WILEY: Hoboken, NJ, USA, 2012; pp. 1–11. [Google Scholar]
- Ding, C.S. Using Regression Mixture Analysis in Educational Research. Pract. Assess. Res. Eval. 2006, 11, 1–11. [Google Scholar]
- Van De Geer, S.A. Least Squares Estimation. Encycl. Stat. Behav. Sci. 2005, 2, 1041–1045. [Google Scholar]
- Hattab, M.; Ma’itah, M.; Sweidan, T.; Rifai, M. Medium Term Load Forecasting for Jordan Electric Power System Using Particle Swarm Optimization Algorithm Based on Least Square Regression Methods. J. Power Energy Eng. 2017, 5, 75–96. [Google Scholar] [CrossRef]
- Chapra, S.C.; Canale, R.P. Numerical Methods for Engineers, 6th ed.; McGrawHill: New York, NY, USA, 2009; pp. 454–484. [Google Scholar]
- Hyndman, R.J. Another Look at Forecast-accuracy Metrics for Intermittent Demand. Foresight 2006, 4, 43–46. [Google Scholar]
- Jeong, H.; Kang, M.S. Effects of Reclaimed Wastewater Irrigation on Paddy Rice Yields and Fertilizer Reduction using the DSSAT Model. J. Korean Soc. Agric. Eng. 2011, 53, 67–74. [Google Scholar] [CrossRef]


| Period | The Number of Samples | ||
|---|---|---|---|
| Total | January 2015~May 2017 | Total | 1275 |
| Train | January 2015~December 2016 | Train | 1035 |
| Test | January 2017~May 2017 | Test | 240 |
| Charging Station | MAPE (%) | NRMSE (%) | RMSE (kWh) |
|---|---|---|---|
| 1 | 15.451 | 15.599 | 179.676 |
| 2 | 13.936 | 15.710 | 114.085 |
| 3 | 16.519 | 20.603 | 296.552 |
| 4 | 10.711 | 12.931 | 342.108 |
| 5 | 13.410 | 13.471 | 303.040 |
| 6 | 8.158 | 8.707 | 451.650 |
| 7 | 16.241 | 17.632 | 458.939 |
| 8 | 12.995 | 13.213 | 584.069 |
| 9 | 9.157 | 11.326 | 211.098 |
| 10 | 11.025 | 11.295 | 234.659 |
| 11 | 12.490 | 13.368 | 158.834 |
| 12 | 6.981 | 8.243 | 158.525 |
| 13 | 18.238 | 15.828 | 236.848 |
| 14 | 12.195 | 12.090 | 159.809 |
| 15 | 16.389 | 16.546 | 449.744 |
| 16 | 20.904 | 22.016 | 498.520 |
| 17 | 19.034 | 19.229 | 739.039 |
| 18 | 18.772 | 19.359 | 481.611 |
| 19 | 9.510 | 11.430 | 178.609 |
| 20 | 15.430 | 15.538 | 542.412 |
| 21 | 15.762 | 16.100 | 749.939 |
| 22 | 15.980 | 16.376 | 1057.214 |
| 23 | 19.304 | 19.650 | 411.719 |
| 24 | 9.258 | 9.635 | 308.196 |
| 25 | 24.049 | 26.018 | 303.870 |
| 26 | 17.216 | 22.498 | 253.966 |
| 27 | 7.355 | 7.819 | 694.061 |
| 28 | 12.582 | 13.151 | 230.326 |
| 29 | 19.009 | 19.630 | 490.568 |
| 30 | 14.519 | 14.941 | 224.324 |
| 31 | 6.115 | 6.601 | 108.307 |
| 32 | 11.511 | 11.729 | 134.658 |
| 33 | 12.917 | 13.896 | 236.226 |
| 34 | 8.983 | 8.603 | 196.159 |
| 35 | 7.897 | 8.562 | 373.645 |
| 36 | 21.212 | 22.008 | 681.857 |
| 37 | 16.251 | 16.627 | 741.549 |
| 38 | 23.792 | 23.733 | 243.021 |
| 39 | 8.944 | 9.258 | 270.607 |
| 40 | 9.053 | 8.876 | 265.537 |
| 41 | 9.532 | 9.318 | 376.084 |
| 42 | 18.570 | 18.847 | 611.516 |
| 43 | 10.465 | 10.660 | 352.668 |
| 44 | 19.961 | 20.178 | 736.698 |
| 45 | 11.466 | 12.614 | 478.727 |
| 46 | 12.577 | 16.829 | 234.730 |
| 47 | 7.025 | 7.383 | 224.033 |
| 48 | 7.779 | 8.966 | 335.583 |
| Average | 13.680 | 14.472 | 377.200 |
| Charging Stations | Results of Electric Power Consumption Estimation (kWh) | ||||
|---|---|---|---|---|---|
| 2017.01 | 2017.02 | 2017.03 | 2017.04 | 2017.05 | |
| 1 | 976.213 | 756.464 | 1236.498 | 1120.140 | 784.790 |
| 2 | 590.121 | 636.526 | 750.246 | 652.398 | 485.237 |
| 3 | 552.208 | 1147.194 | 1385.400 | 1542.782 | 1248.813 |
| 4 | 2602.497 | 2053.176 | 3030.883 | 2941.596 | 2074.697 |
| 5 | 2289.288 | 1586.676 | 2197.996 | 1917.641 | 1751.961 |
| 6 | 5828.593 | 4424.450 | 5439.767 | 4637.634 | 3490.620 |
| 7 | 2251.293 | 2057.878 | 2325.053 | 2444.330 | 1777.947 |
| 8 | 3726.512 | 3241.946 | 4217.238 | 4595.777 | 3443.886 |
| 9 | 1457.333 | 1387.426 | 1946.216 | 2012.424 | 1623.353 |
| 10 | 2279.002 | 2111.795 | 2426.759 | 2683.346 | 1861.458 |
| 11 | 1044.293 | 1074.133 | 1052.114 | 1031.406 | 987.764 |
| 12 | 2148.312 | 1635.317 | 1751.103 | 2130.562 | 1298.092 |
| 13 | 1508.265 | 1346.459 | 1898.658 | 1611.827 | 1081.810 |
| 14 | 1514.377 | 1365.704 | 1473.905 | 1453.898 | 619.288 |
| 15 | 1880.134 | 1963.911 | 2576.878 | 2816.803 | 2143.480 |
| 16 | 1771.526 | 1391.978 | 1811.822 | 2352.860 | 1591.869 |
| 17 | 2777.195 | 3066.460 | 3613.071 | 3258.248 | 2838.273 |
| 18 | 3847.843 | 2726.409 | 2944.637 | 2436.668 | 1610.939 |
| 19 | 1297.924 | 1500.394 | 1572.037 | 1533.338 | 1158.665 |
| 20 | 3804.497 | 2695.792 | 2894.391 | 3115.515 | 2291.576 |
| 21 | 3875.569 | 3944.853 | 4596.247 | 4479.708 | 2724.338 |
| 22 | 5256.725 | 4693.957 | 6061.103 | 6627.436 | 4486.161 |
| 23 | 1570.406 | 1603.341 | 1812.393 | 2017.678 | 1445.833 |
| 24 | 2789.299 | 2398.530 | 3595.961 | 3232.477 | 2504.128 |
| 25 | 2269.890 | 1537.480 | 1521.861 | 736.894 | 515.643 |
| 26 | 1482.610 | 1221.346 | 1072.123 | 422.713 | 382.967 |
| 27 | 7719.318 | 7399.833 | 9131.319 | 9594.894 | 7220.854 |
| 28 | 1316.652 | 1268.179 | 1824.046 | 1759.201 | 1478.019 |
| 29 | 2033.390 | 1802.304 | 2055.538 | 2749.107 | 1473.253 |
| 30 | 1911.909 | 1205.752 | 1127.083 | 1309.974 | 880.165 |
| 31 | 2297.967 | 1522.224 | 1587.423 | 1438.403 | 858.937 |
| 32 | 1392.964 | 1049.064 | 1032.935 | 951.645 | 662.474 |
| 33 | 2233.240 | 1479.628 | 1363.139 | 1412.116 | 899.896 |
| 34 | 2843.258 | 1801.099 | 2111.919 | 2251.922 | 1417.426 |
| 35 | 3592.196 | 3758.920 | 4743.391 | 4668.606 | 4613.922 |
| 36 | 2428.187 | 2808.836 | 2981.458 | 2374.108 | 1593.516 |
| 37 | 3800.969 | 3951.975 | 4845.238 | 3869.376 | 2213.418 |
| 38 | 781.994 | 762.668 | 797.131 | 874.836 | 690.174 |
| 39 | 3411.264 | 2637.594 | 2818.147 | 2699.666 | 1741.803 |
| 40 | 3463.866 | 2702.977 | 2973.250 | 2804.619 | 1715.859 |
| 41 | 3778.732 | 3279.961 | 4656.288 | 4011.937 | 2588.722 |
| 42 | 2031.265 | 1606.661 | 1687.461 | 2061.026 | 1501.821 |
| 43 | 3411.113 | 2711.128 | 3631.257 | 2868.211 | 2211.715 |
| 44 | 2866.347 | 3115.549 | 2985.109 | 3067.861 | 2566.092 |
| 45 | 3106.693 | 3279.131 | 3504.625 | 4053.709 | 2819.666 |
| 46 | 1131.955 | 945.591 | 1325.275 | 1601.398 | 1066.371 |
| 47 | 3372.183 | 3030.108 | 2803.408 | 2987.297 | 1904.476 |
| 48 | 3824.377 | 3535.450 | 4156.584 | 3820.395 | 2907.192 |
© 2017 by the authors. Licensee MDPI, Basel, Switzerland. This article is an open access article distributed under the terms and conditions of the Creative Commons Attribution (CC BY) license (http://creativecommons.org/licenses/by/4.0/).
Share and Cite
Cheon, S.; Kang, S.-J. An Electric Power Consumption Analysis System for the Installation of Electric Vehicle Charging Stations. Energies 2017, 10, 1534. https://doi.org/10.3390/en10101534
Cheon S, Kang S-J. An Electric Power Consumption Analysis System for the Installation of Electric Vehicle Charging Stations. Energies. 2017; 10(10):1534. https://doi.org/10.3390/en10101534
Chicago/Turabian StyleCheon, Seongpil, and Suk-Ju Kang. 2017. "An Electric Power Consumption Analysis System for the Installation of Electric Vehicle Charging Stations" Energies 10, no. 10: 1534. https://doi.org/10.3390/en10101534
APA StyleCheon, S., & Kang, S.-J. (2017). An Electric Power Consumption Analysis System for the Installation of Electric Vehicle Charging Stations. Energies, 10(10), 1534. https://doi.org/10.3390/en10101534