Article

Bi-Directional Coordination of Plug-In Electric Vehicles with Economic Model Predictive Control

School of Engineering, Manchester Metropolitan University, Manchester M1 5GD, UK
*
Author to whom correspondence should be addressed.
Energies 2017, 10(10), 1507; https://doi.org/10.3390/en10101507
Submission received: 30 August 2017 / Revised: 23 September 2017 / Accepted: 25 September 2017 / Published: 28 September 2017

Abstract

:
The emergence of plug-in electric vehicles (PEVs) is unveiling new opportunities to de-carbonise the vehicle parcs and promote sustainability in different parts of the globe. As battery technologies and PEV efficiency continue to improve, the use of electric cars as distributed energy resources is fast becoming a reality. While the distribution network operators (DNOs) strive to ensure grid balancing and reliability, the PEV owners primarily aim at maximising their economic benefits. However, given that the PEV batteries have limited capacities and the distribution network is constrained, smart techniques are required to coordinate the charging/discharging of the PEVs. Using the economic model predictive control (EMPC) technique, this paper proposes a decentralised optimisation algorithm for PEVs during the grid-to-vehicle (G2V) and vehicle-to-grid (V2G) operations. To capture the operational dynamics of the batteries, it considers the state-of-charge (SoC) at a given time as a discrete state space and investigates PEVs performance in V2G and G2V operations. In particular, this study exploits the variability in the energy tariff across different periods of the day to schedule V2G/G2V cycles using real data from the university’s PEV infrastructure. The results show that by charging/discharging the vehicles during optimal time partitions, prosumers can take advantage of the price elasticity of supply to achieve net savings of about 63%.

1. Introduction

Energy and mobility have become entwined in new and interesting ways. While energy and transport are generally responsible for some of the main challenges confronted within the current century, sustainability, electrification of transport, climate change and renewable energy dominate many debates. For example, electricity and transportation jointly account for about 60% of global primary energy demand [1], and there are ongoing efforts aimed at relying less on non-renewable resources.
According to the United Nations Environment Program (UNEP) report [2], district energy systems, such as the virtual power plant (VPP), can create a pathway to transit from intense use of fossil fuel and achieve a 30–50% reduction in primary energy consumption by harnessing renewable resources. This is also in line with regional mandates such as the European Commission’s 20-20-20 strategic objective to increase renewable uptake by 20% by the year 2020 and ensure a low-carbon economy by 2050 [3,4]. Although renewable uptake is increasingly explored [5], its sources are intermittent in nature, which can lead to voltage fluctuations and loss of loads. This can be compensated by energy storage systems [6] including battery banks in plug-in electric vehicles (PEVs). VPP provides a platform for smart coordination of distributed energy sources and loads in geographically-dispersed environments such as educational campuses, industrial parks and small communities. By integrating distributed energy resources (DERs) such as wind-turbine, micro-CHP, hydro-sources, photovoltaic systems (PV), storage and PEVs, the resulting network of energy resources and loads can be managed as a single entity.
In this work, the coordinating unit is called the central controller (CC), for simplicity. The role of the CC is to optimise energy generation, storage and consumption. Therefore, throughout this paper, VPP controller and CC are used interchangeably. PEVs are gaining acceptance as sources of dispatchable energy [7,8,9]. Their ability to release stored energy to the grid empowers end users hitherto considered as mere consumers to become active stakeholders as producers and consumers (prosumers) of electricity. This paradigm shift allows bi-directional power flow between the grid and prosumers. This study is carried out within the Triangulum; one of the lighthouse projects funded by the European Union (EU) aimed at transforming designated European cities into smart quarters. The test bed comprises Manchester, Eindhoven and Stavanger with Prague, Leipzig and Sabadell as the follower cities. The project has been organised into mobility, energy and information and communications technology (ICT). Within the mobility work stream, this paper investigates the economic benefits of smart decentralised coordination of PEV power flow by optimising the grid-to-vehicle (G2V) and vehicle-to-grid (V2G) operations in the VPP. As a deviation from most existing work in the area, this paper focuses on optimal power flow from the prosumer’s point of view to maximise the economic benefits using price as the main driver. Therefore, issues such as voltage and loading constraints are not addressed here.
While transport already accounts for about 25% of global energy consumption [10], it is also responsible for 23% of emissions [11]. Therefore, the adoption of PEVs as energy sources in the smart grid is a major step in the journey toward sustainability and greener energy. It has been predicted that PEVs will constitute 7% of global vehicle sales by 2020 [3]. However, as more PEVs are deployed on the roads, unmanaged G2V could have adverse effects on the distribution network which could result in undesirable consequences. The effects could range from occasional brownouts to outright blackouts at peak demands. Hence, the suppliers, prosumers and distribution network operators (DNOs) have the joint responsibility of ensuring that the connection of PEVs does not undermine the stability of the grid.
PEVs are already playing a critical role in ensuring a cleaner environment. In the U.K. for example, it is predicted that by 2030, about 60% of all new car sales will be PEVs, and there is an ambitious plan to de-carbonise the U.K. vehicle parc by 2050 [12]. The concept of V2G allows PEVs to be active players in grid operations. Though still in its early stage [13], V2G can play a vital role in the economics, environmental sustainability and the reliability of grid systems [14]. In addition, this role is expected to become more significant as PEV wireless charging technology becomes accessible [15,16]. It will also come in handy in peer-to-peer energy trading and applications [17].
As the electricity demand for PEV charging grows, developments in V2G technology will play a vital role in the grid modernisation strategy. In the U.S. for example, if the current trend is sustained, no fewer than 160 new power plants will be required to meet the PEV load demand if every vehicle is to be charged at peak periods [14]. However, smart grid technologies, with a bi-directional flow of electricity, can be explored to distribute charging over off-peak periods. The energy stored in the PEV batteries when the electricity cost is lowest can then be transferred back to the grid at peak times when the price is the highest. This will contribute to the de-carbonisation of the electricity system by harnessing opportunities such as low-carbon night-time generation [18].
It has also been argued that the economic performance of PEVs could be greatly enhanced through value-added utilisation of their energy storage capability [19]. In [19], a test bed was used to demonstrate the feasibility and benefits of harnessing the storage capabilities of PEVs and used PEV batteries in small-scale energy management systems. However, as the interplay between supply and demand becomes more dynamic, tariff regimes will respond appropriately. There may also be the need for the PEV user to have preferences and control over the sale or purchase of energy for his/her PEV. A legitimate source of concern is the profitability of V2G due to the effects of charging and discharging on battery life cycle. Previous studies on battery behaviour have shown that V2G if properly implemented is profitable [20,21].
PEVs can be considered as loads, generating sources, energy storage or small portable power plants [22,23]. These can be achieved through opportunistic charging in surface parking garages in workplaces and municipal parking decks [24]. These parking facilities have in-built refuelling (charging) stations, which derive their energy from renewable sources such as solar roofs [25]. The PEVs can also discharge their energy back to the grid during peak demand. Therefore, to properly exploit the opportunities offered, it is imperative to develop smart and optimal vehicle charging and V2G scheduling schemes. Intermittent changes in demand necessitate that these schemes are adaptable and can be updated in real time based on electricity prices and prosumer behaviour. The predominant approach in the literature is to have a central controller that coordinates the charging. An alternative approach, which is explored in this work, is to have a charging algorithm for individual vehicles, thereby accommodating individual prosumer behaviour and preferences.
V2G has received significant attention from the research community [26,27,28,29,30]. In particular, a detailed review of V2G operation is given in [29]. In [31], stochastic mean field game theory was used to provide an optimal charging strategy for PEVs by controlling battery charging speed. Vehicles target scheduled times in a central charging station, and charging is dynamically controlled to minimise the total cost of charging. In [27], a central charging station was also considered. Stochastic linear programming was used to minimise the short-term cost of energy to the dispatching system by the integration of G2V and V2G operations.
Another strategy that is explored in PEV scheduling is model predictive control (MPC), used in [7] to minimise the cost of energy. PEV charging with V2G operation was presented as a mixed integer linear programming problem. Similarly, an optimised charging scheme using economic MPC (EMPC) was presented in [9]. While the work in [7,27,31] considered the charging problem as a centralised one, the work in [9] applied a decentralised approach, which is suitable for VPP. It was formulated as a linear programming problem; however, V2G operation was not considered. A study of the optimal charging strategy for lithium-ion batteries was also presented in [32]. Another work [33] presented the coordination of PEV charging and discharging using particle swarm optimisation and fuzzy decision making. However, the advantage of MPC lies in its ability to incorporate predictions and constraints in the optimisation process. As such, historic (or other) sources of energy price can be used for optimisation, which can be updated in real time to reflect actual prices. All the methods for optimising V2G discussed so far considered the problem from the perspective of other stakeholders such as the aggregators or retailers [34,35]. There is the need to develop a prosumer-focused charging schedule that will allow for more flexibility and profit for the vehicle owner.
For ease of integration into the VPP and customer flexibility, a decentralised approach based on [9] is adopted in this paper. The main contribution of this is two-fold:
  • First is in the structure of the problem: To the best of our knowledge, charge coordination strategies presented in the literature focus on coordination at the aggregator layer or other higher layers in the control hierarchy. In this paper, another layer of optimisation was added, which handles charging with the prosumer as the main deciding entity. This is a departure from the norm where the prosumer is not an active player in the dynamic market.
  • Second is in the development of the charging algorithm with V2G capabilities: A V2G strategy using model predictive control that can be embedded in PEVs was developed using real data from the Triangulum project. To ensure additional flexibility for the prosumer, a weighting parameter, q, was introduced.
The proposed algorithm supports an autonomous operation of VPP and can be adopted for group selling strategies [36] to reduce the cost of grid balancing and PEV maintenance. Since the algorithm can be embedded within the PEV, it is also suitable for wireless vehicle charging.
The rest of the paper is structured as follows. The system model is presented in Section 2. The MPC formulation used in this work is given in Section 3. In Section 4, the simulation and discussion of results are presented, and the paper is concluded in Section 5.

2. System Model

Figure 1 illustrates the information exchange between the energy distribution network and the various PEVs through the CC in a manner that is similar to [37]. However, in this figure, the CC aggregates the contributions from DERs, coordinates the charging/discharging of PEVs, as well as exploits opportunities for arbitrage between prosumers and the energy market. In the model, the CC reads information from the optimisation module embedded in the PEV. Such information includes [37] battery size, distance driven since the last charge, state of charge (SoC), owner’s preferred buying or selling price and willingness to participate in V2G/G2V activities. Based on the information obtained, the CC activates the appropriate charging schedule for each group of PEVs. However, actual charging of the vehicle is finally achieved using the algorithm developed in this work, which can be embedded in the vehicles.
Generally, the complexity and accuracy of a model depend on the requirements of the considered application. However, for linear control techniques such as MPC, it is often sufficient to use the simplest model that can capture the dominant dynamics of the considered process. In most cases, the effects of model inaccuracies can be compensated through the combined effects of feedback and optimisation [7]. Therefore, this work employs a linear time-invariant (LTI) discrete state space model for the SoC of the PEV battery.

2.1. Discrete State Space Model of the SoC

The SoC of the battery at any given time step k can be modelled as the sum of the SoC at time k 1 and the charge due to power flow to/from the battery. This effectively captures the dynamics of lithium-ion (Li-ion) batteries [38]. The dynamics of the SoC is described by (1). A similar formulation was used in [7].
x ( k ) = x ( k 1 ) + T s P n ,
where x ( k ) [ 0 , 1 ] is the SoC, T s is the sampling time, P n = P t Q m a x is the normalised power flow to the battery and Q m a x is the maximum capacity of the battery. The power, P t = η c P c η d P d + η e v d , where P c 0 is charging power with efficiency η c , P d 0 is the power when the battery discharges to the grid with efficiency η d , d 0 is the power demand due to driving and η e v is the PEV energy efficiency. It should be noted that energy efficiency here is defined as energy consumed per km. If we assume that the charging and discharging efficiencies are the same, then η c = η d = η . This restricting assumption is relaxed using weighting matrices to penalize V2G operation in the charging algorithm. Hence, the total power, P t , is given as:
P t = η ( P c P d ) + η e v d .
Since the battery cannot be charging and discharging concurrently, P c > 0 P d = 0 and P d > 0 P c = 0 . Then,
P = P c : P d = 0 P d : P c = 0
and P = 0 if P c = 0 and P d = 0 ; such that (2) can be written as:
P t = η P + η e v d .
The state space model for the SoC can be written as:
x ( k ) = A x ( k 1 ) + B u ( k ) + E d ( k ) ,
y ( k ) = C x ( k ) ,
state matrices, A, B, C and E are defined as:
A = 1 , B = T s η Q m a x , C = 1 and E = T s ,
where the manipulated variable, u = P , is the charging/discharging power and the power usage from driving d = η e v d Q m a x is the disturbance variable. The SoC of the battery is the state variable x, which is also the output y. Therefore, at any time instance k, the SoC at time instance k + 1 can be estimated based on the predicted user behaviour (power usage for driving) and power flow into the system using (5).

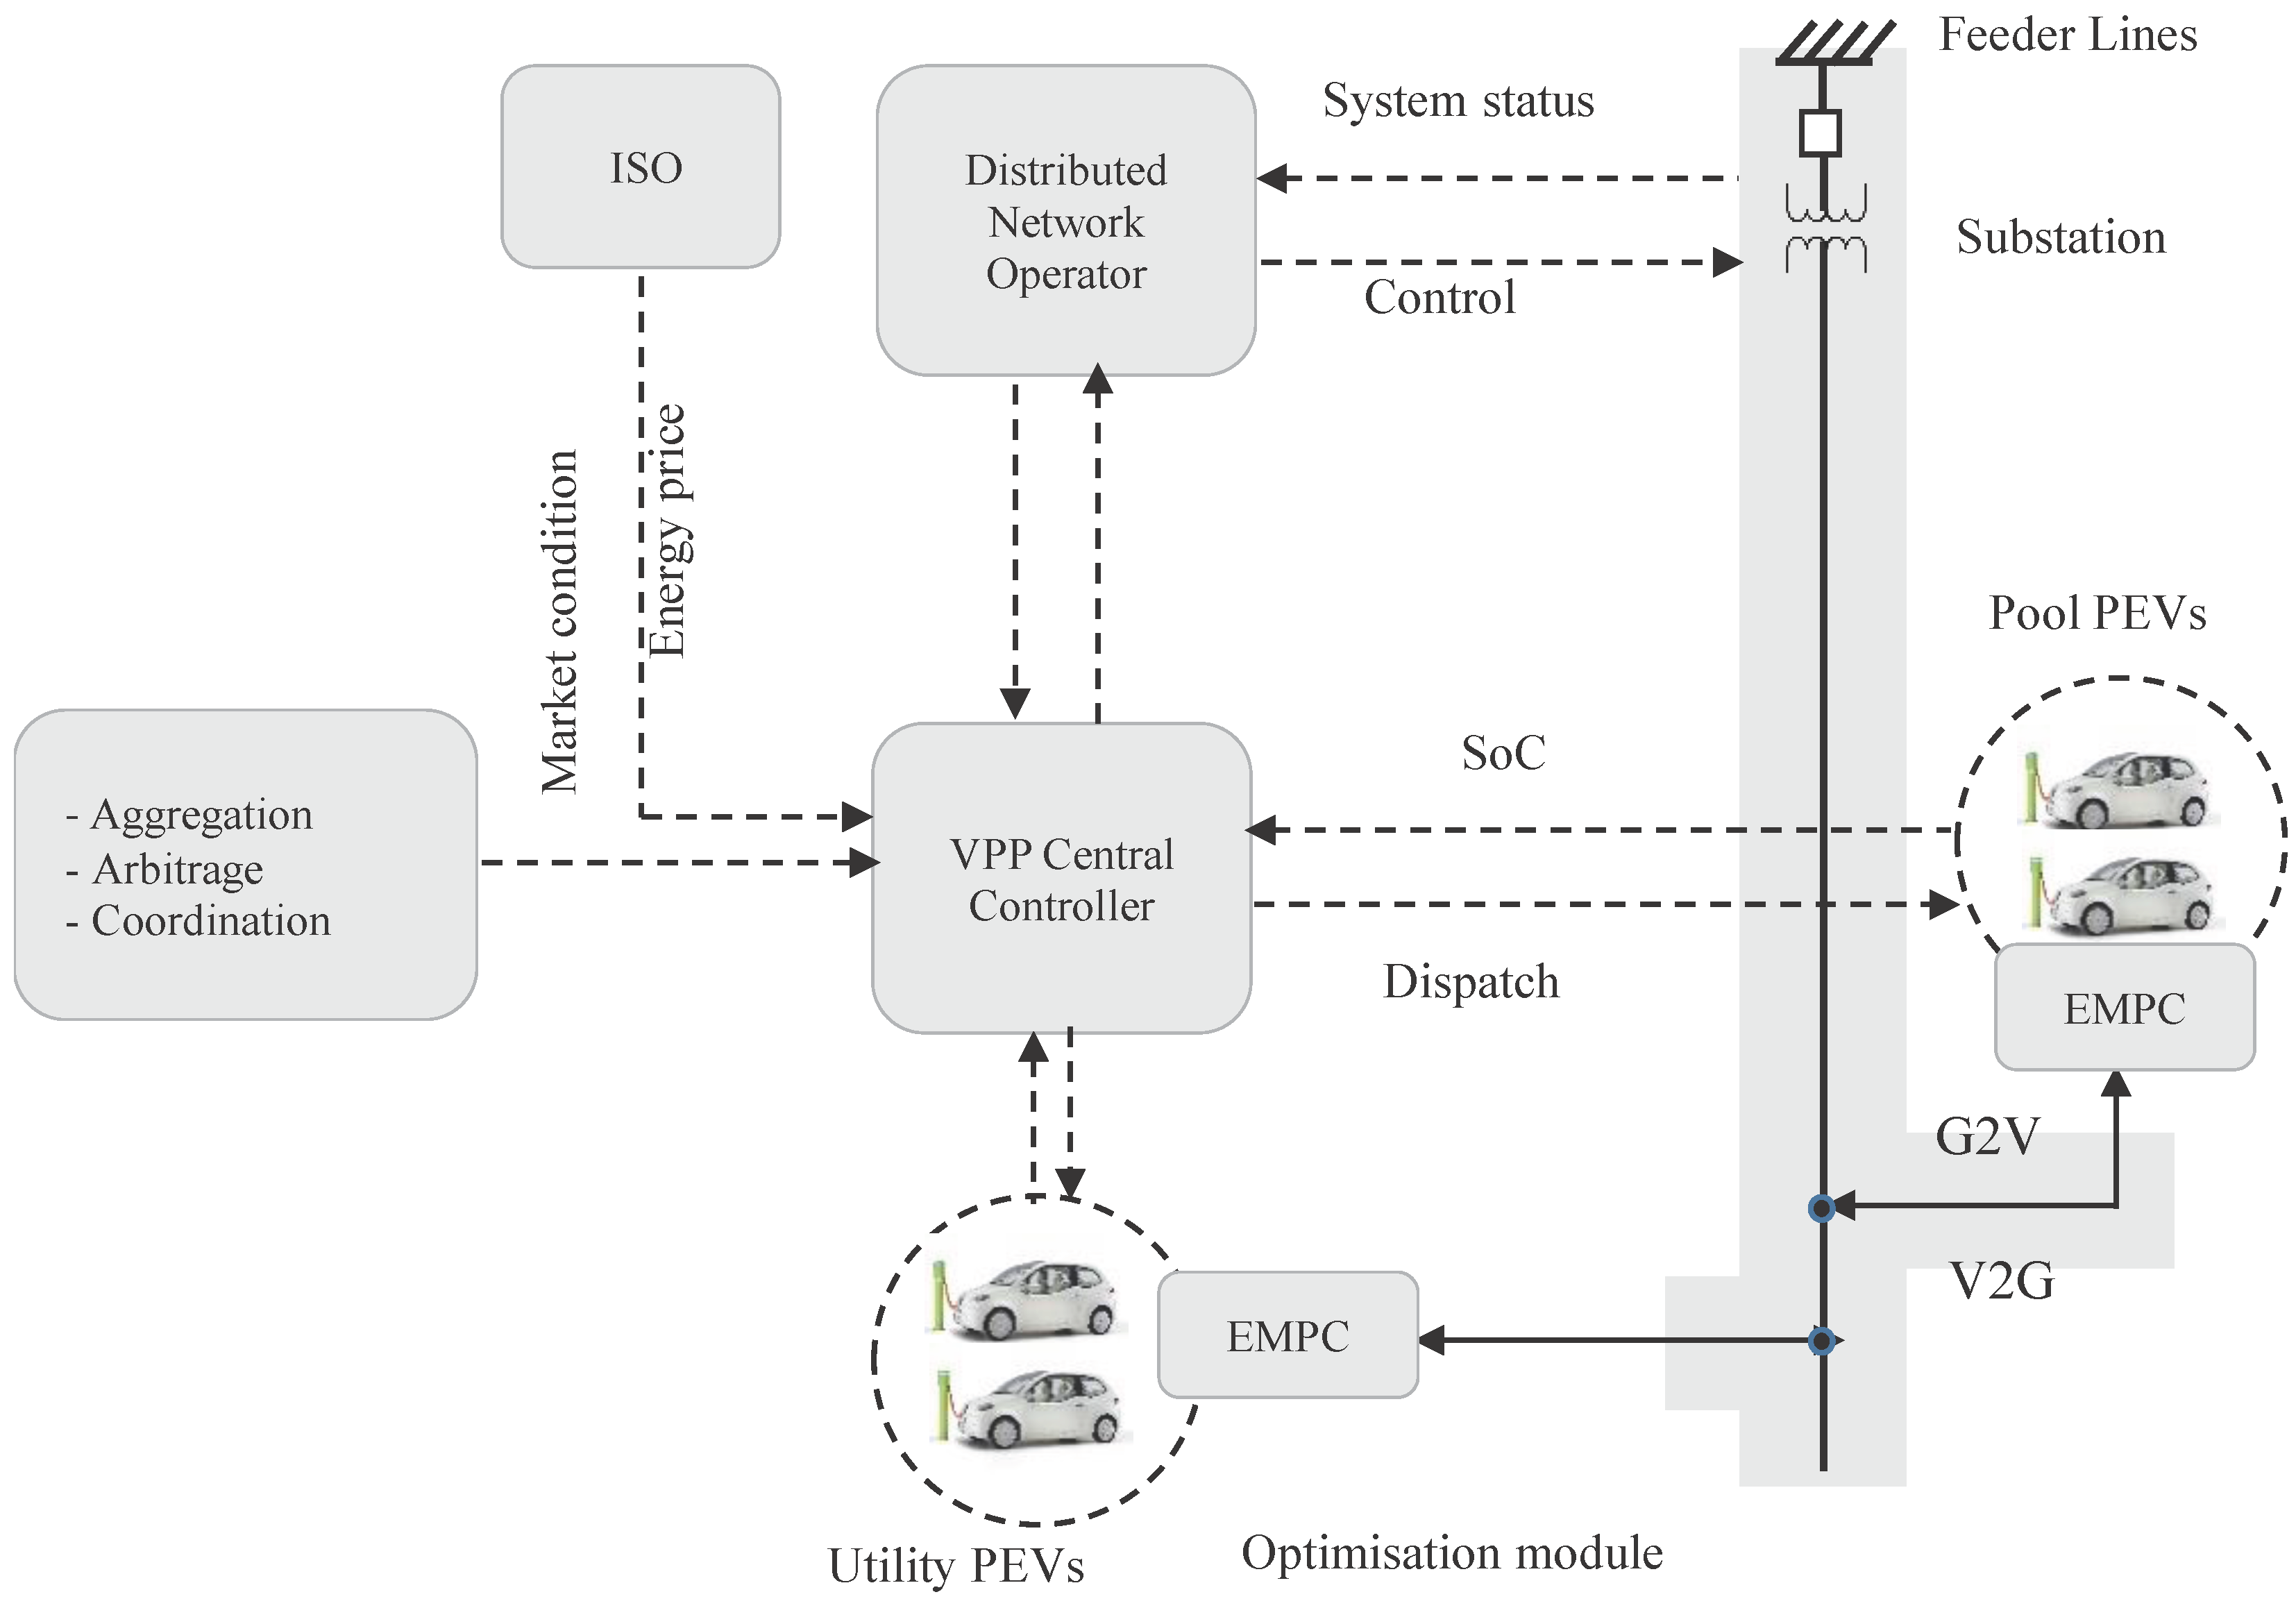
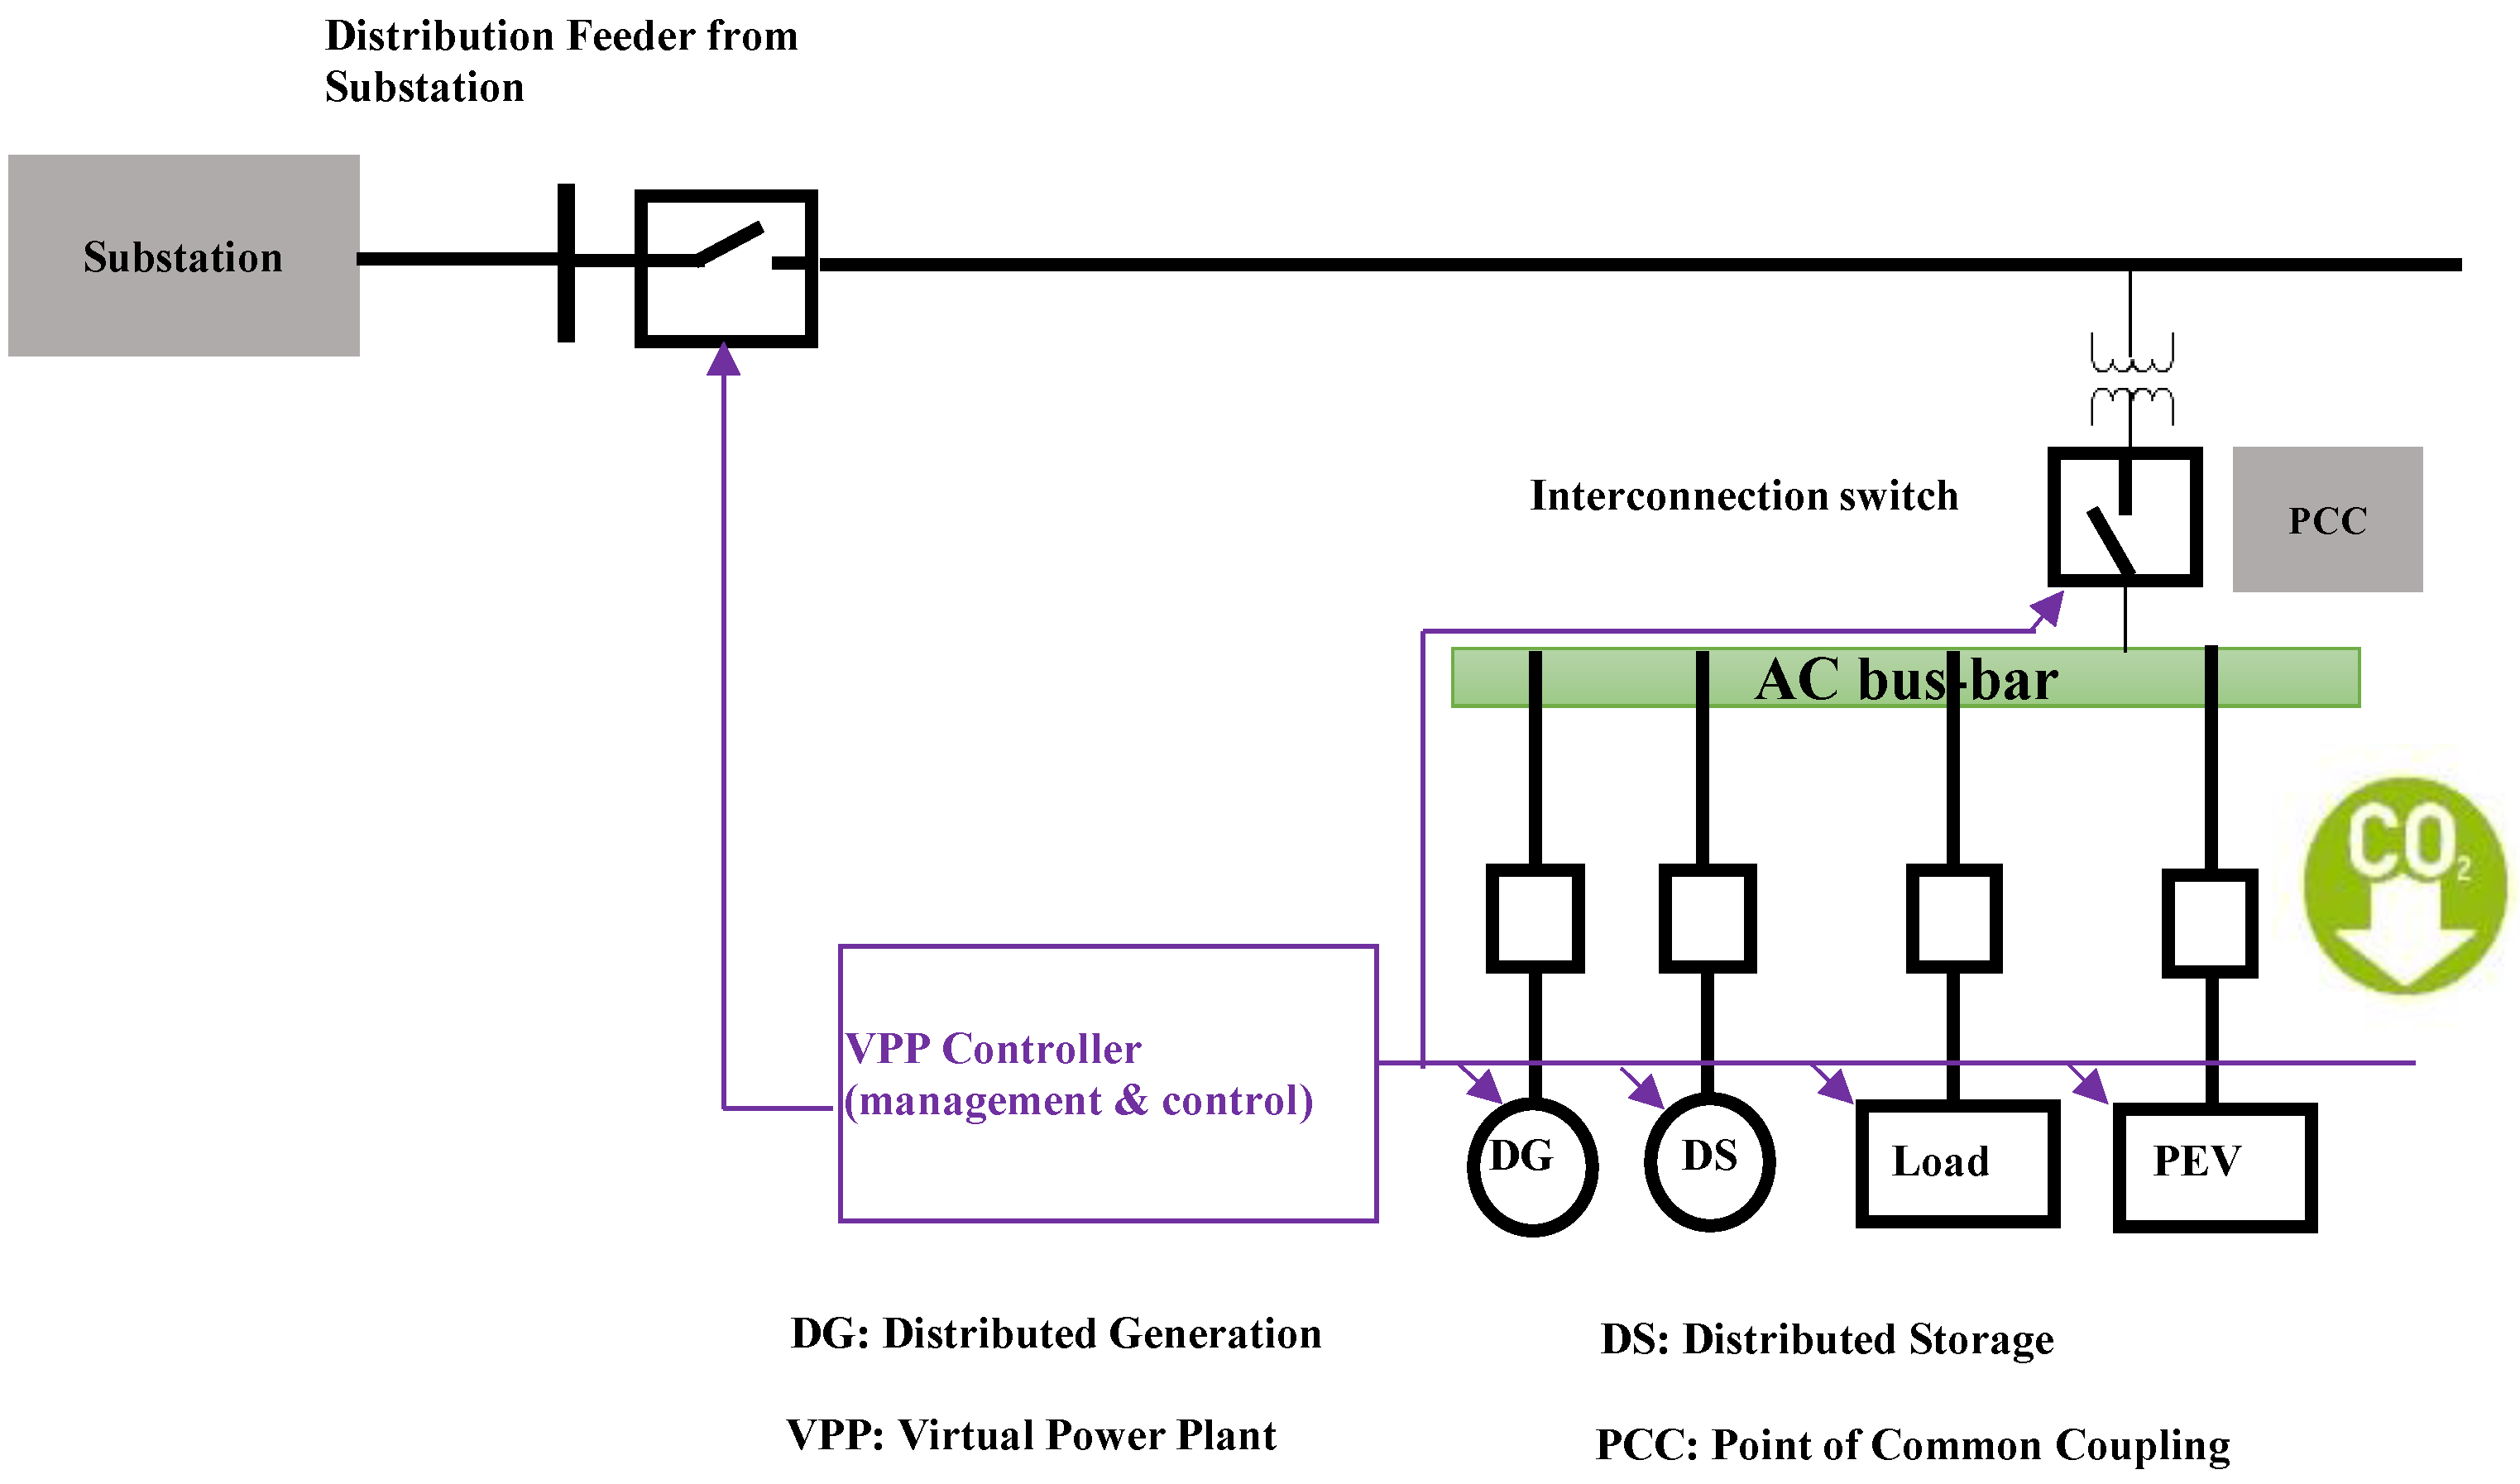
2.2. System Configuration

The IEEE 1547-2011 [39] standard provides a general guide for the design, operation and integration of DERs with electric power systems. The DERs could be distributed generators or storage systems. Adopting the layout in [40], the conceptual integration of DERs, PEVs and other loads in the VPP domain with the local distribution network is illustrated in Figure 2.
In the Triangulum project, the CC connects to all energy assets to optimise energy generation, storage and consumption. The energy intervention component (EIC) is installed on each distributed generation (DG) and distributed storage (DS) unit. For control purposes, the CC sends a request (control signal) to a DER; the EIC interprets the signal and adapts its operation to reflect the request. Such communication can be done directly between CC and the DERs or through the local building management system (BMS) as the gateway.
As shown in the figure, the VPP controller monitors and controls the operations of the DER assets (DG and DS) within the VPP domain. On the other hand, it is also responsible for monitoring the interconnection switch at point of common coupling (PCC)between the transformer and the AC bus-bar connected to the DERs and loads. The purpose of these signalling events with respect to PEV is to coordinate the uptake of energy (as DS) and release of energy (as DG) to the grid without compromising the system safety and reliability. Hence, before the EMPC can take or release energy to this grid, constraints as set by the VPP must be satisfied. The details of this are not within the scope of this paper. Apart from the mains, a workplace parking garage with embedded PV roof allows PEVs to connect to the available DC bus to store excess energy generated by the PV array. This provides an opportunity to use renewable energy without significantly impacting the grid.

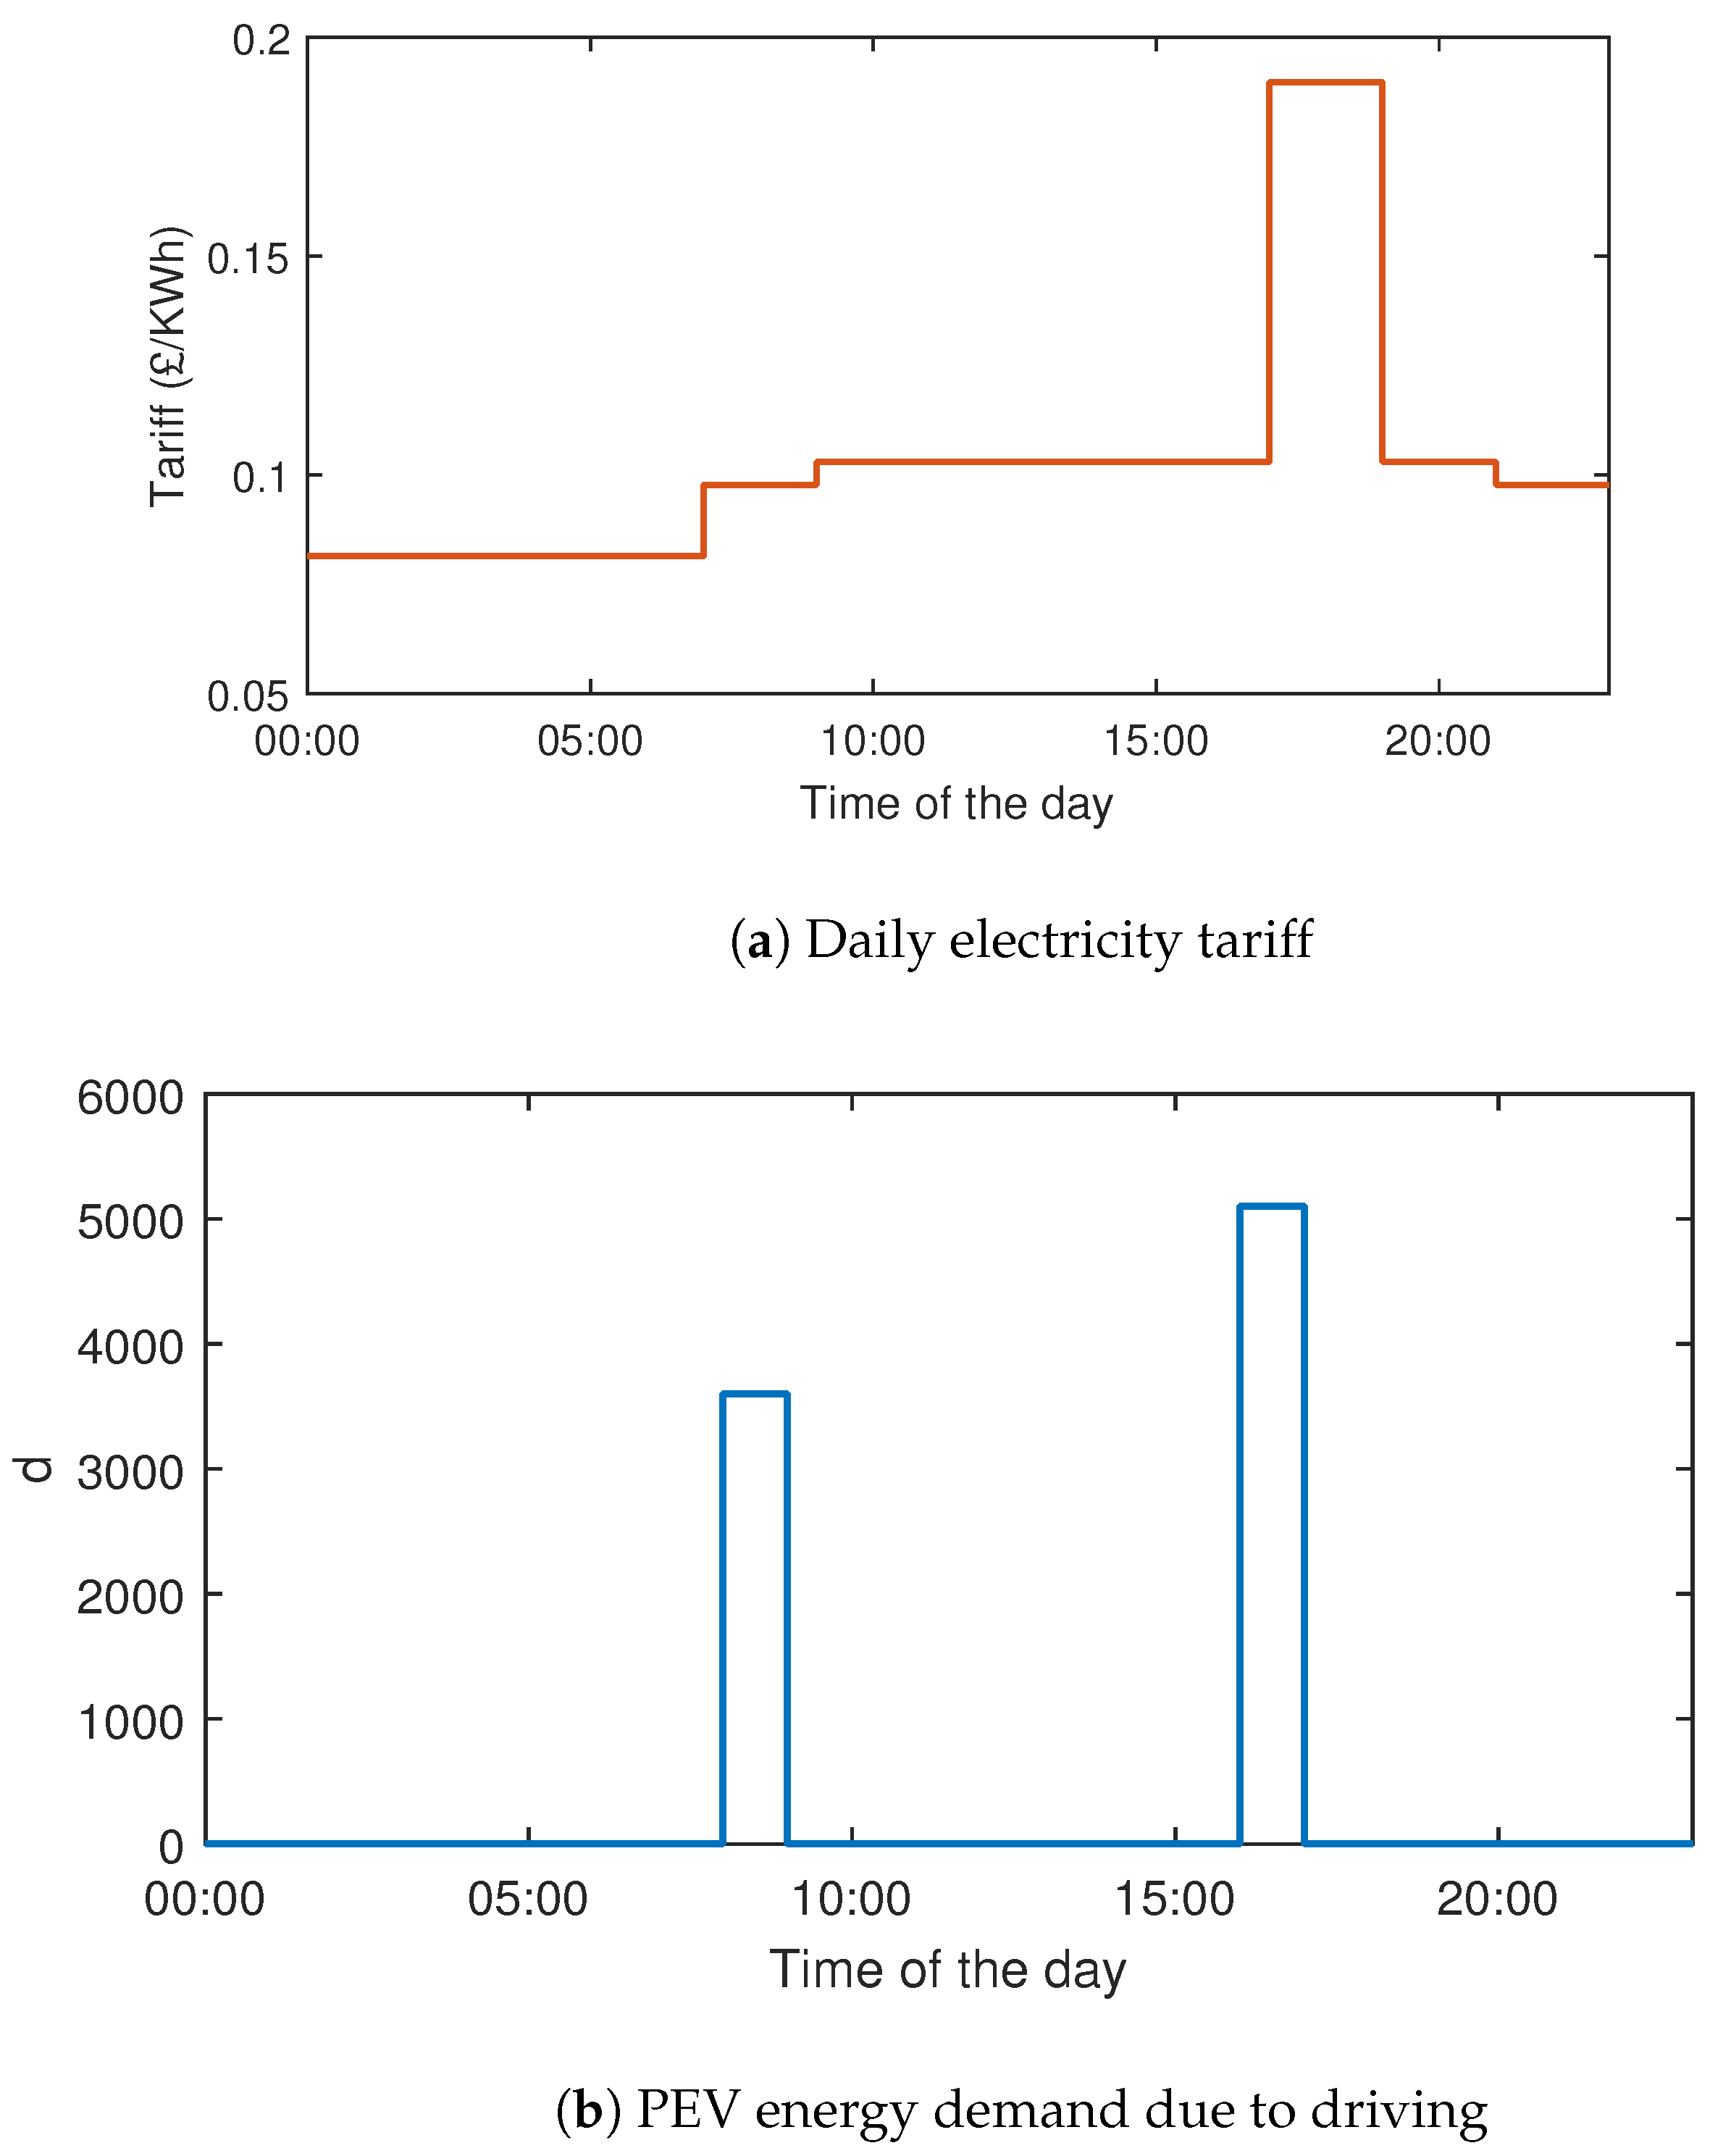
2.3. Case Study and Model Parameters

Within the Triangulum project, various datasets were generated from the existing PEVs and charging stations at Manchester Metropolitan University (MMU) over a period of four months. The information is summarised in Table 1.
The power flowing in to/out of the battery due to charging/discharging is bounded by the maximum charging/discharging current as:
P m i n P P m a x .
We assume here that the maximum charging and discharging currents are equal in magnitude, i.e., i m a x = i m i n . Then, P m i n = P m a x , and for a grid voltage of V g = 230 V, assuming a maximum allowable current of 10 A, the maximum power is given as:
P m a x = V g i m a x = 2300 W .
The two vehicles with the highest mileage were the mail and security vans with average mileages of about 64 km and 54 km, per day, respectively. Note that the mail van and security vehicles are used seven days a week, while the other vehicles are used only five days. This table shows that a total of 7884.33 kWh was used over the four-month period considered. Analysis of Table 1 is presented later in this section.
Data on vehicle charging were collected to investigate energy usage based on the tariff periods. Although a variable tariff can be realized in multiple time bands, this paper uses the contractual tariff of MMU with the energy supplier, and the energy price varies with time of the day, day of the week (weekday vs. weekend) and campus location. However, for the ease of understanding, a summary of the tariff schedule is presented in Table 2. It should be noted that Table 2 is for calculating the consumption element and does not include the standing, capacity and the transmission network use of system (TNUoS) triad charges, which are computed separately.
This tariff, shown in Table 2, is applied throughout this paper. The distribution of this energy usage across the different tariff regimes is presented in Figure 3. The figure reveals that within the charging duration, red, amber and green tariffs account for 10%, 51% and 39% of the total charging period, respectively. However, analysis of the tariff shows that the red, amber and green periods accounted for 6%, 37% and 57% of the total duration of a typical tariff week. One expects that the vehicle charging distribution would at least follow the same pattern as tariff periods; in reality, that was not the case. The distribution of charging duration across tariff regimes for individual vehicles in Figure 4 shows that some of the PEVs follow a charging trend similar to the tariff period distribution. Oak, for example, had 9%, 35% and 56% of its charge duration during the red, amber and green tariff periods, respectively.
Charging distribution across energy regimes for individual vehicles, presented in Figure 4, shows that vehicles charged during peak periods for a relatively shorter duration. This is expected because the peak period constitutes only about 6% of the hours in a typical week. Therefore, a majority of the vehicles charged for a longer duration during the least-tariff period (green period), which is also expected because the green period accounts for a higher percentage of the weekly hours. However, three of the vehicles (Maple, Willow and Mail) had longer charging periods during the amber period. This observation combined with the overall distribution of vehicle charging suggests that some improvements can be made to save cost. This can be achieved by maximizing PEV charging during green periods while minimising charging during the red period. Any balance of PEV charging left can then be shifted to the amber period. Details of the exact energy usage are given in Table 3.
In this study, vehicles are classified into three types based on usage. The first type of vehicles is personal PEVs driven to work in the morning at 8:00 a.m. and back home at 5:00 p.m. For this class of PEVs, data from a national travel survey showed that the average daily driving distance of workers is in the range of 40–50 km [41]. To allow some tolerance and account for unplanned trips, a daily travel of 65 km is considered in this work. This is split into two trips on a workday to distances of 30 km and 35 km. The second vehicle class is the pool vehicles. According to Table 1, for a pool vehicle, the average daily trip ranges between 20 km and 42 km. The third PEV type is the utility vehicles such as security and mail vans having average daily mileages of 54 km and 64 km, respectively. In each case, travel distance is considered to be uniformly distributed over the specified range. Among the three types of PEVs, the utility vehicles offer the least flexibility, as they may be requested at any time without prior notice.
Typically for PEVs, η e v [ 120 , 180 ] Wh/km [9]. Hence, in the case of personal PEVs driven to work, an average value of η e v = 150 Wh/km is used. For the pool vehicles studied in this work, η e v [ 148 , 155 ] , Wh/km resulting in an average value of η e v = 151.5 Wh/km. An average value of η e v = 150 Wh/km is used for the pool vehicles. For the utility vehicles, η e v [ 182 , 222 ] Wh/km, resulting in an average value of η e v = 202 Wh/km, an average value of η e v = 205 Wh/km is employed. A summary of the parameters used for the model is given in Table 4. The motivation for using these values is discussed in the next section.

3. Economic Model Predictive Control

MPC is a finite horizon optimal control scheme. At each sampling instance, MPC computes an optimal sequence of control moves by optimising an objective over a fixed horizon. Only the first move in the computed sequence is applied to the process. MPC has a number of advantages over traditional control schemes including its ability to explicitly cater for system constraints, optimisation in the loop, natural handling of multi-variable systems and ability to handle dead-time [42]. As such, MPC has found widespread applications in advanced process control and manufacturing [43,44]. MPC typically minimises the error from a set-point using a cost function, such as [44]:
f ( u , y ) = 1 2 k = 0 N 1 y ( k ) y s s Q 2 + u ( k ) u s s R 2 ,
where y s s and u s s are the steady state set-points of the output and input, respectively, x P 2 : = x T P x .
The need for optimisation in large-scale systems with optimal economic performance requirements and goals, such as reduced operational costs and improved efficiency, has motivated the application of MPC in the area of large-scale and networked systems. A variant of MPC commonly used to optimise operational and other costs is the EMPC. With the EMPC technique, the cost can generally be expressed as [9]:
f ( u , v ) = k = 0 N p 1 p ( k ) u ( k )
where p is the cost of the manipulated variable u. Minimising the cost function ensures that optimal decisions are made based on available resources, future prediction, constraint (system and operation) and the current state of the system. The cost function used in this work is:
minimize f = k = 0 N p 1 p ( k ) q ( k ) u ( k ) + ω v ( k )
subject to the constraints:
x ( k + 1 ) = A x ( k ) + B u ( k ) + E d ( k ) ,
y ( k ) = C x ( k ) ,
u m i n ( k ) u ( k ) u m a x ( k ) ,
y ( k ) y m i n v ( k ) ,
y ( k ) y m a x + v ( k ) and
v ( k ) 0 .
The term q was introduced as a tuning parameter to penalise the effect of the current or future tariff on the optimisation problem. Equal penalisation of future and current prices means q ( 0 ) = q ( 1 ) = = q ( n p 1 ) = q . q is also used to penalise V2G operation so as to account for the difference in charging and discharging efficiencies. The output is constrained by the allowable battery charge limits [ y m i n , y m a x ] = [ 0.2 , 0.9 ] as described in Section 2.3. Infeasibility is avoided by including the slack variable v k , which is discouraged using a large penalty, ω . The constraints on u are time-varying and are defined as:
u m i n ( k ) = P m i n for d k = 0 0 otherwise
u m a x ( k ) = P m a x for d k = 0 0 otherwise
To disable V2G operation, the lower constraint is specified as zero in the MPC formulation, i.e., u m i n ( k ) = u m i n = 0 , which is not time-varying. The same constraint could be dynamically used to ensure no V2G operation during green tariff regimes. As with the normal MPC scheme, only the first decision in the optimal charging plan is applied. Any fluctuations in the price of energy can be captured as a feedback to the finite horizon economic MPC scheme. The amount of power consumed while driving acts as a disturbance and can be predicted based on customer behaviour. This allows for optimal charging that ensures the rejection of disturbance forecast (i.e., the next vehicle trip). The algorithm for the proposed EV charging scheme is given in Algorithm 1.
Algorithm 1 Vehicle charging using MPC.
Input: Current (initial) state of charge SoC, x 0 , prediction horizon, N p , sample time, T s , vehicle usage pattern and electricity price.
Output: Input sequence, U = u ( 1 ) , u ( 2 ) , u ( N p ) i.e., charging power
 Compute prediction and constraint matrices
while PEV is connected to charger do
  Update vehicle usage
  Update electricity price
  Update prediction and constraint matrices and weights
  Solve constrained optimisation problem to obtain input sequence, U.
  Apply only the first element in the sequence, u ( 1 ) .
  Update state of charge
end while
It should be noted that all the tariffs used in the algorithm are derived from actual values presented in Table 2. For each of these vehicle categories, the PEV charging scheme is designed to support the following features.
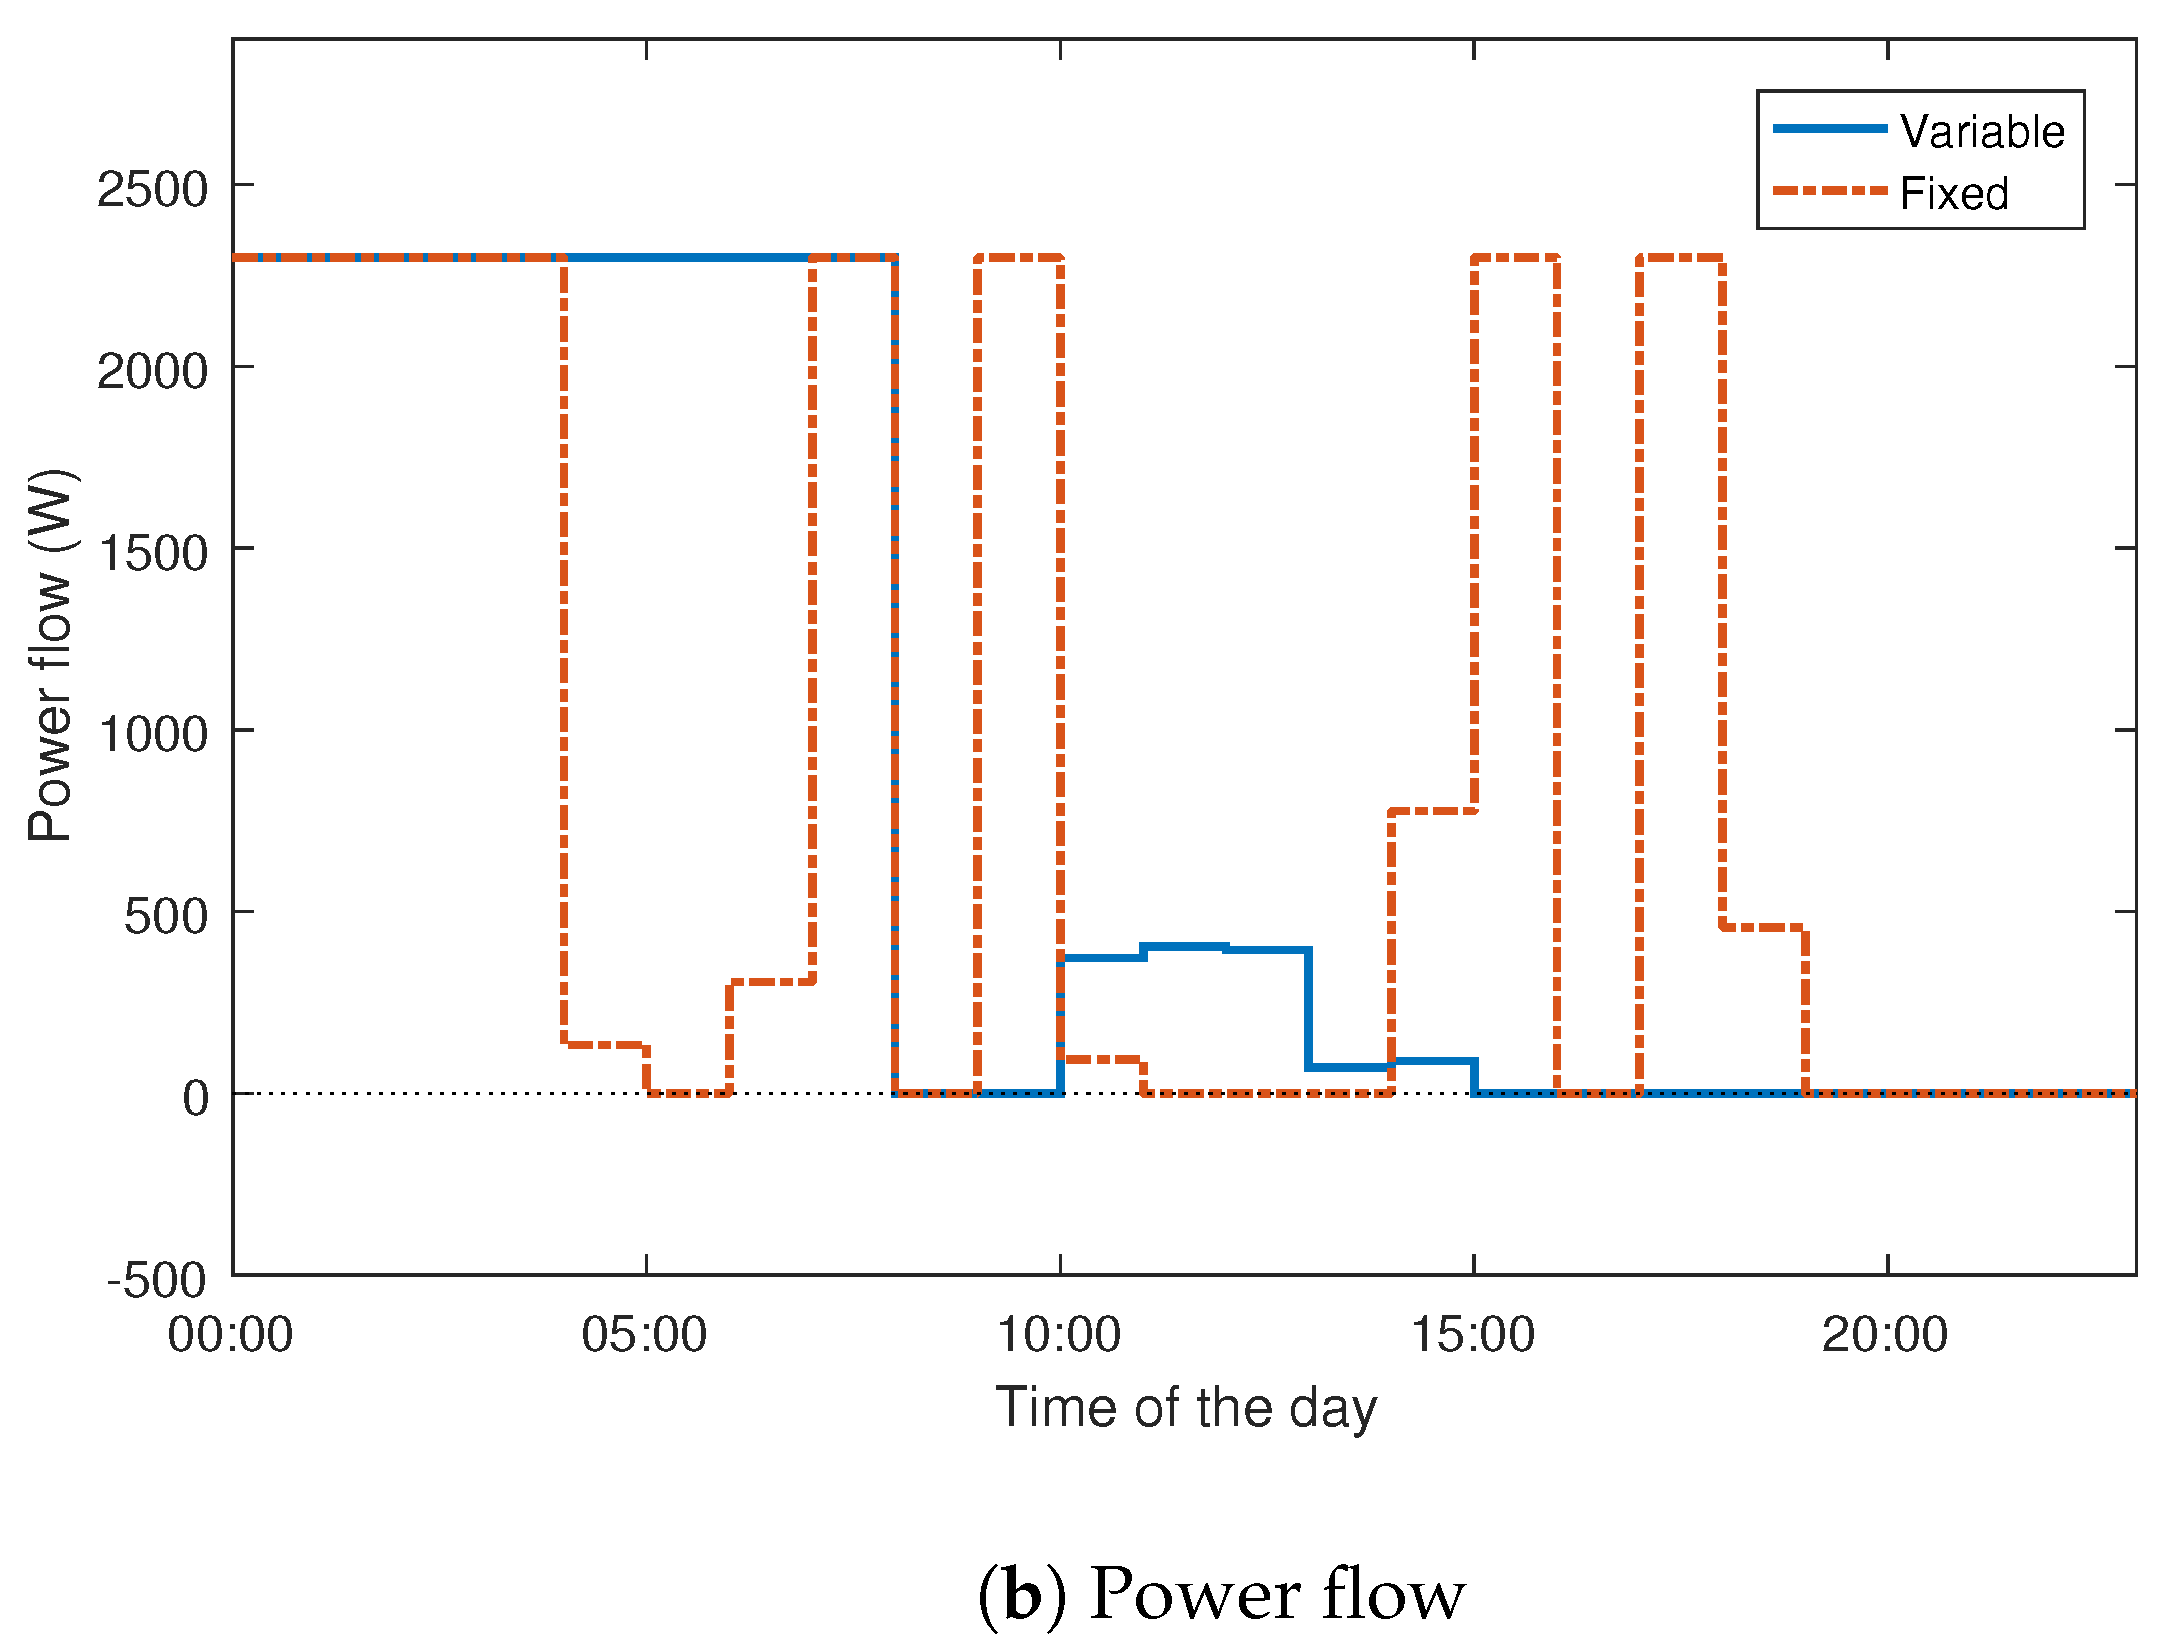
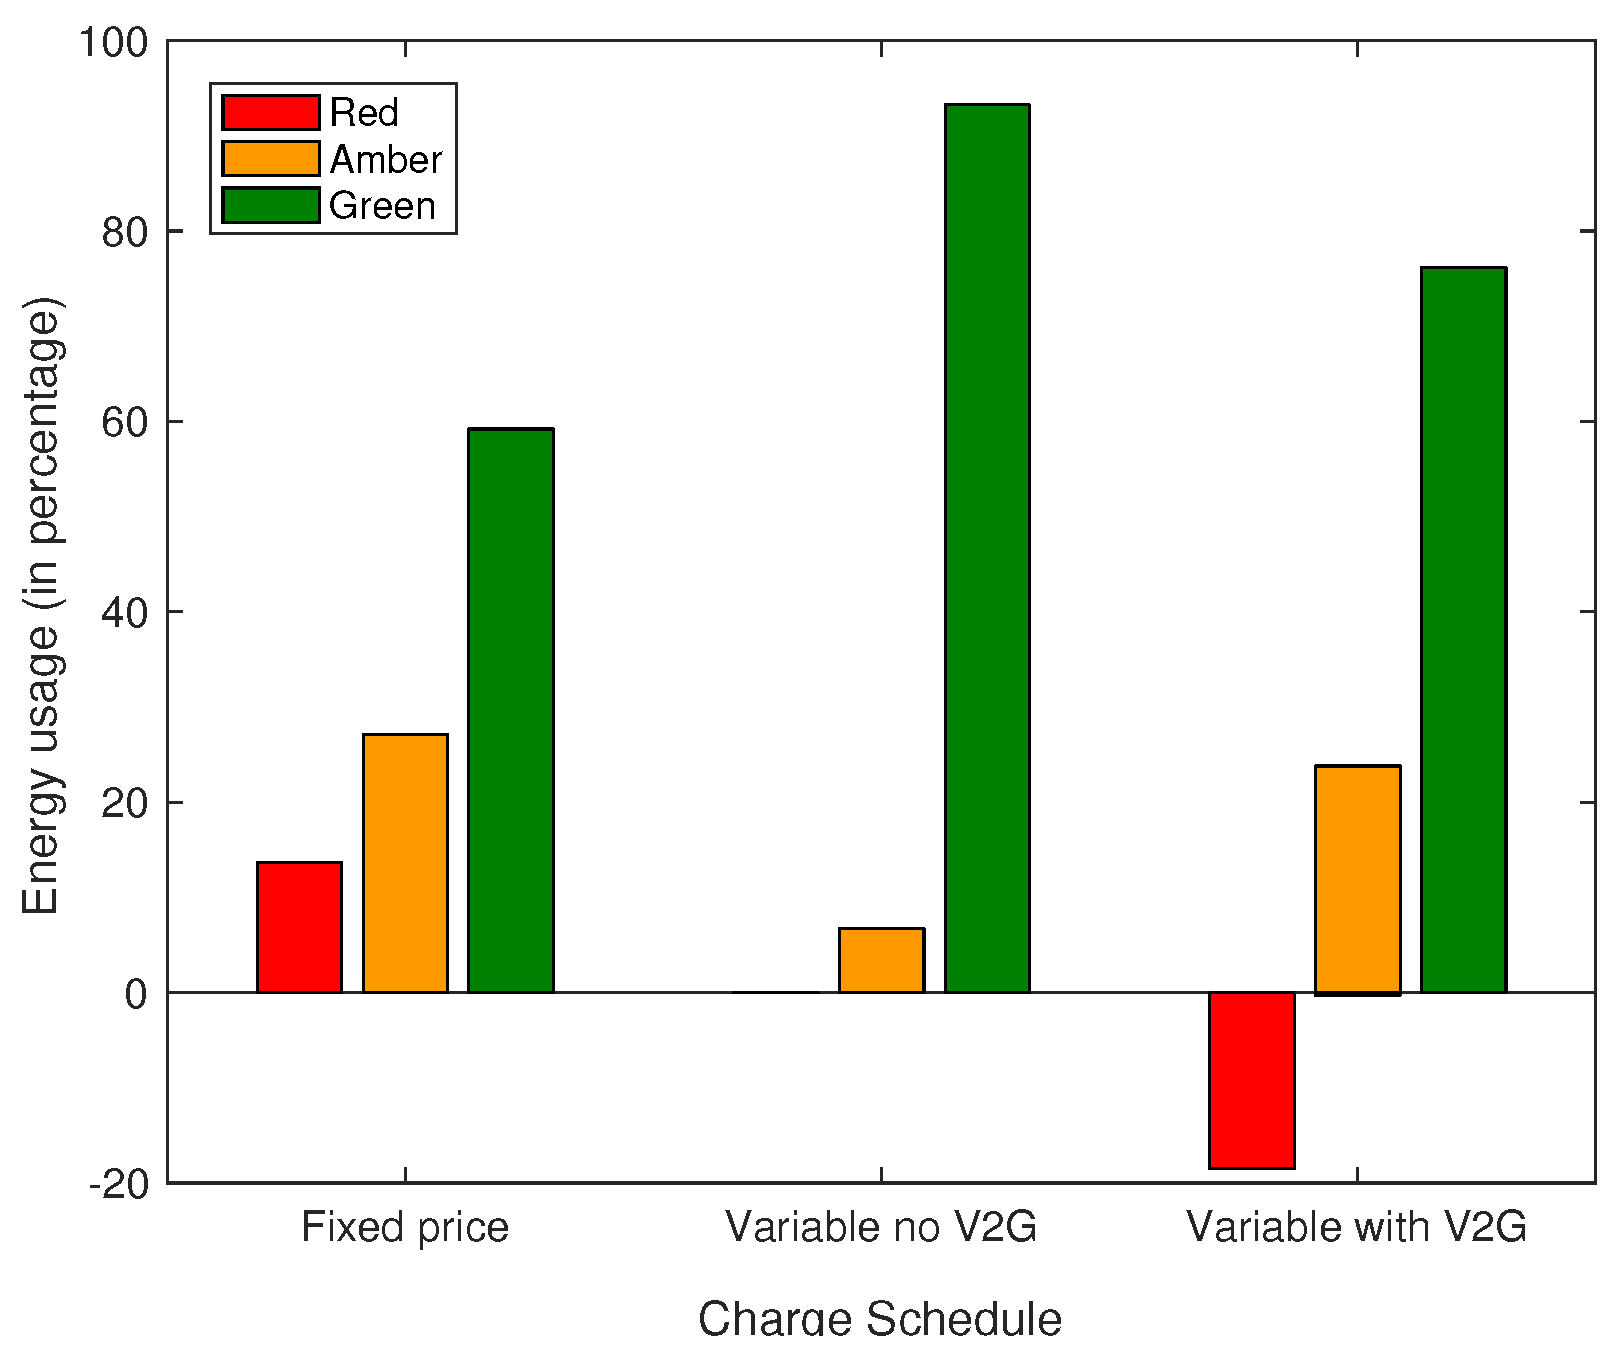
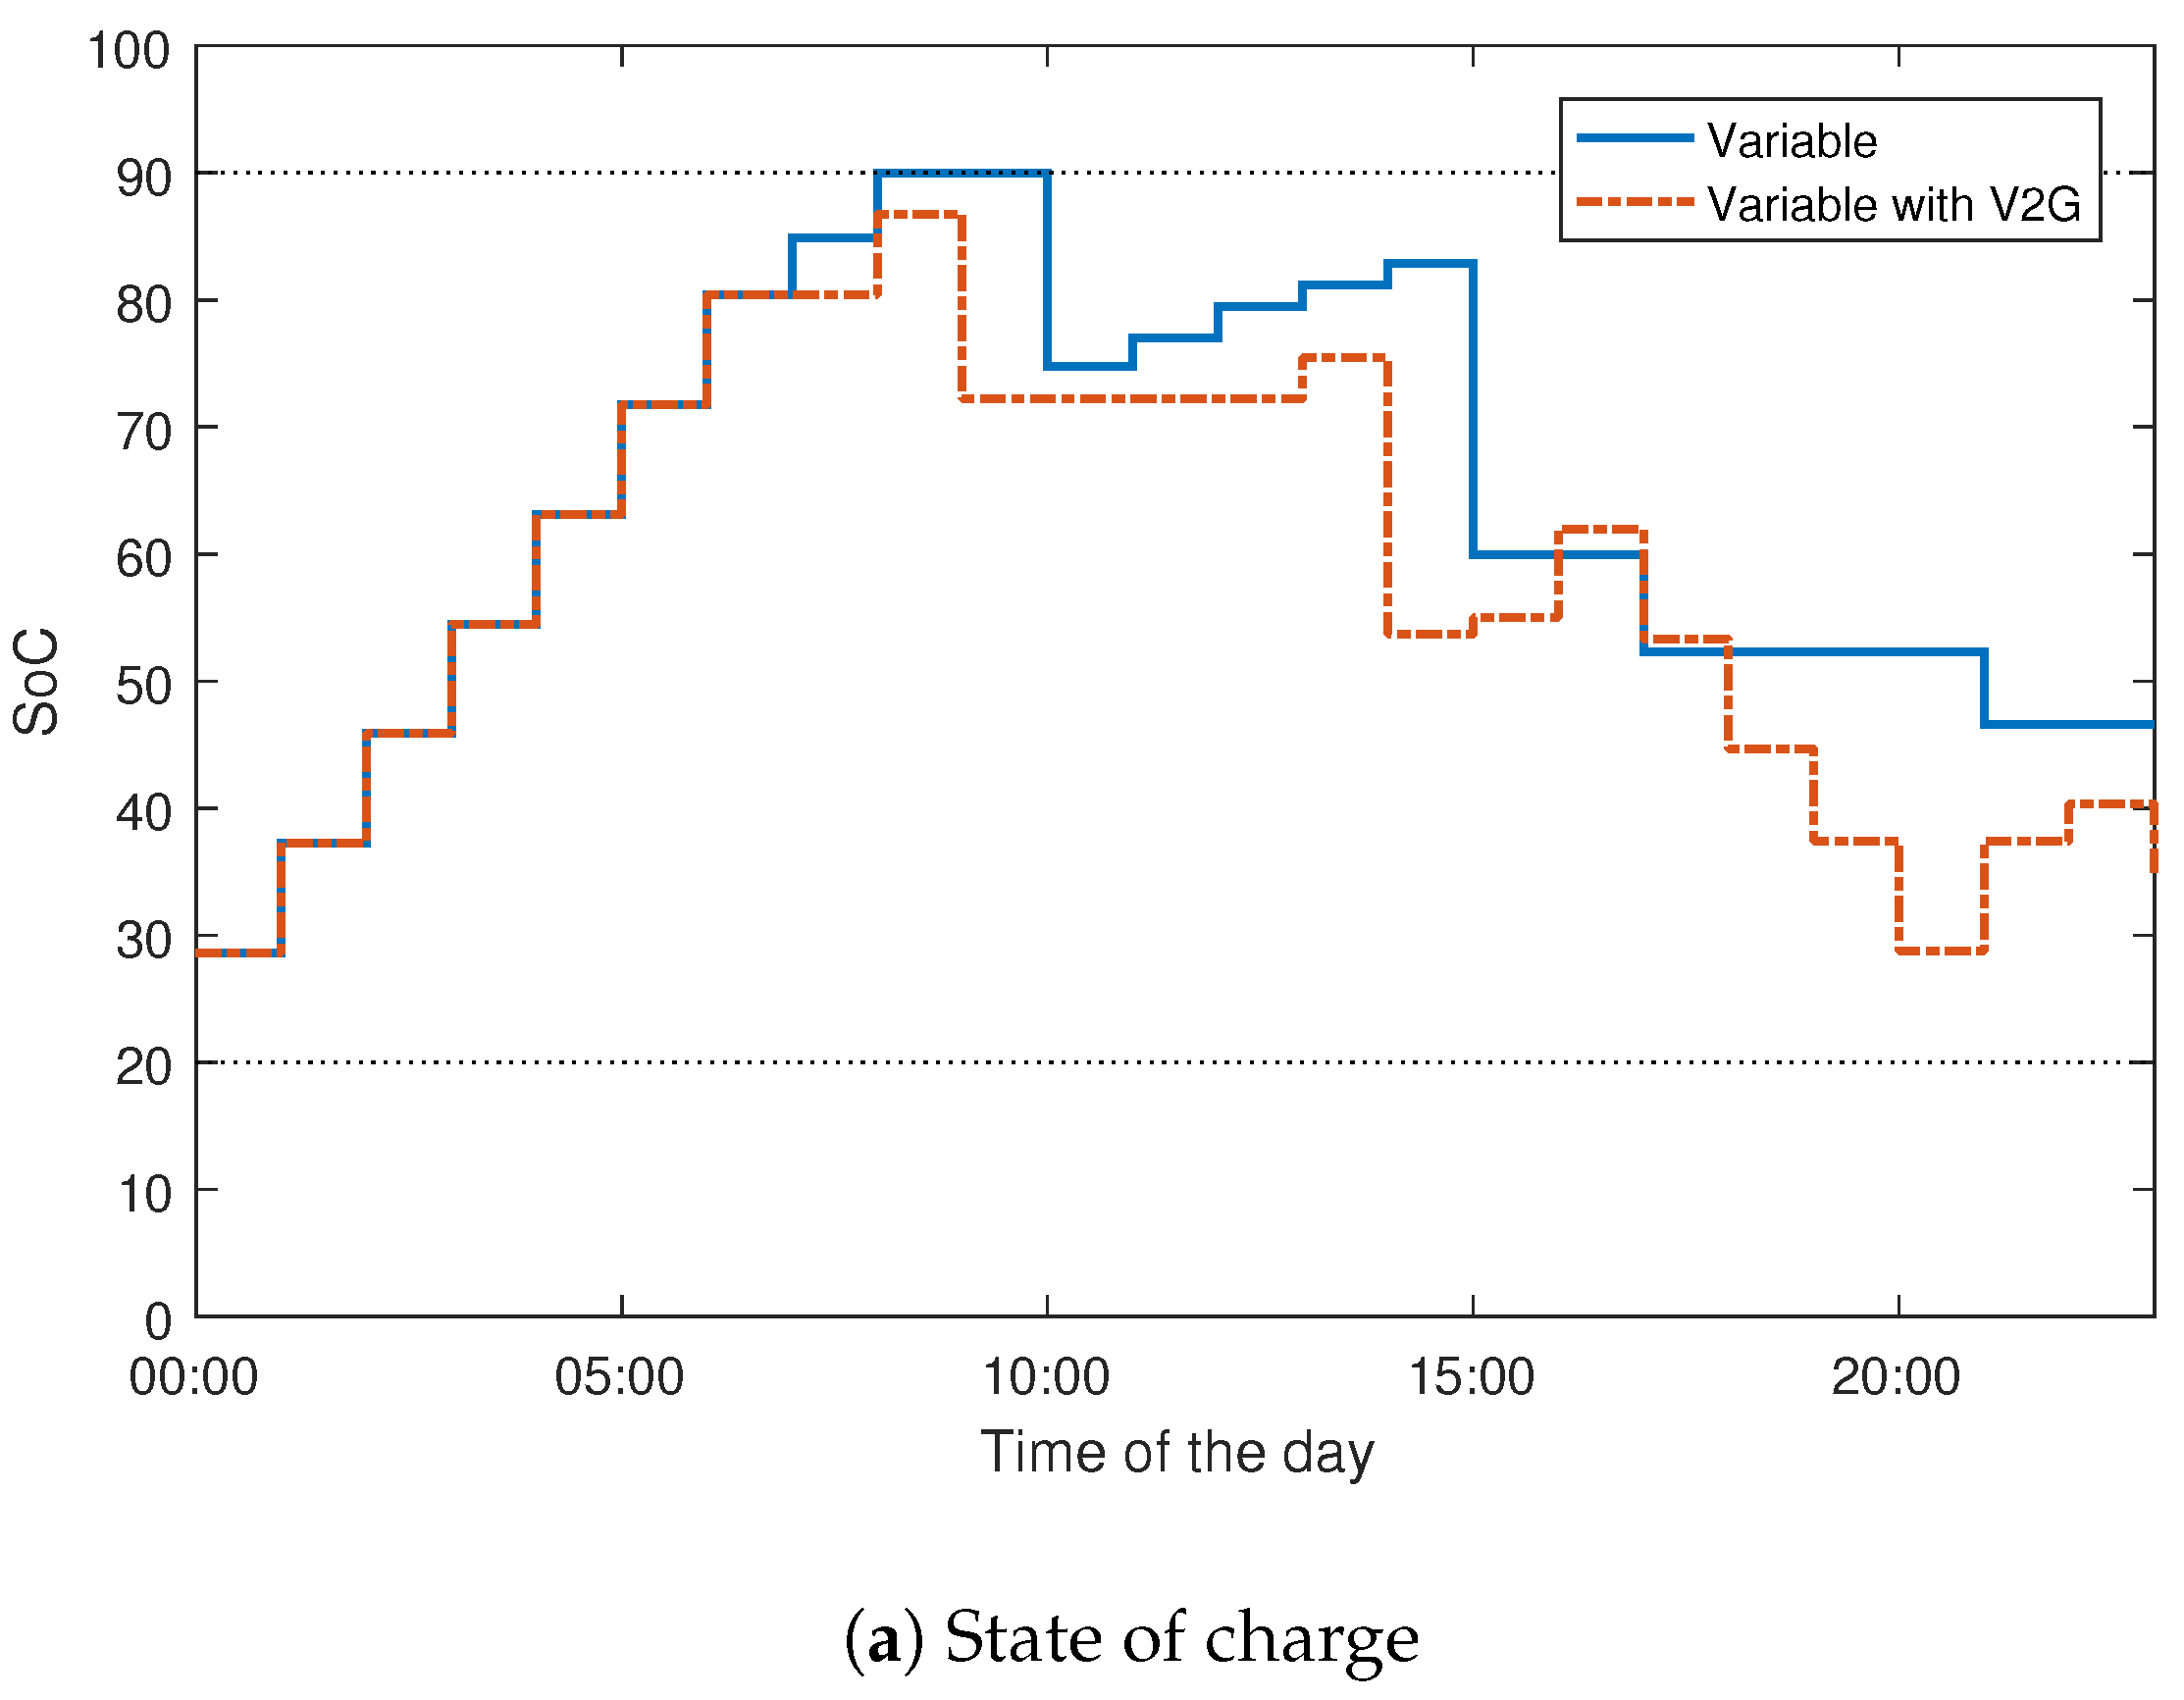
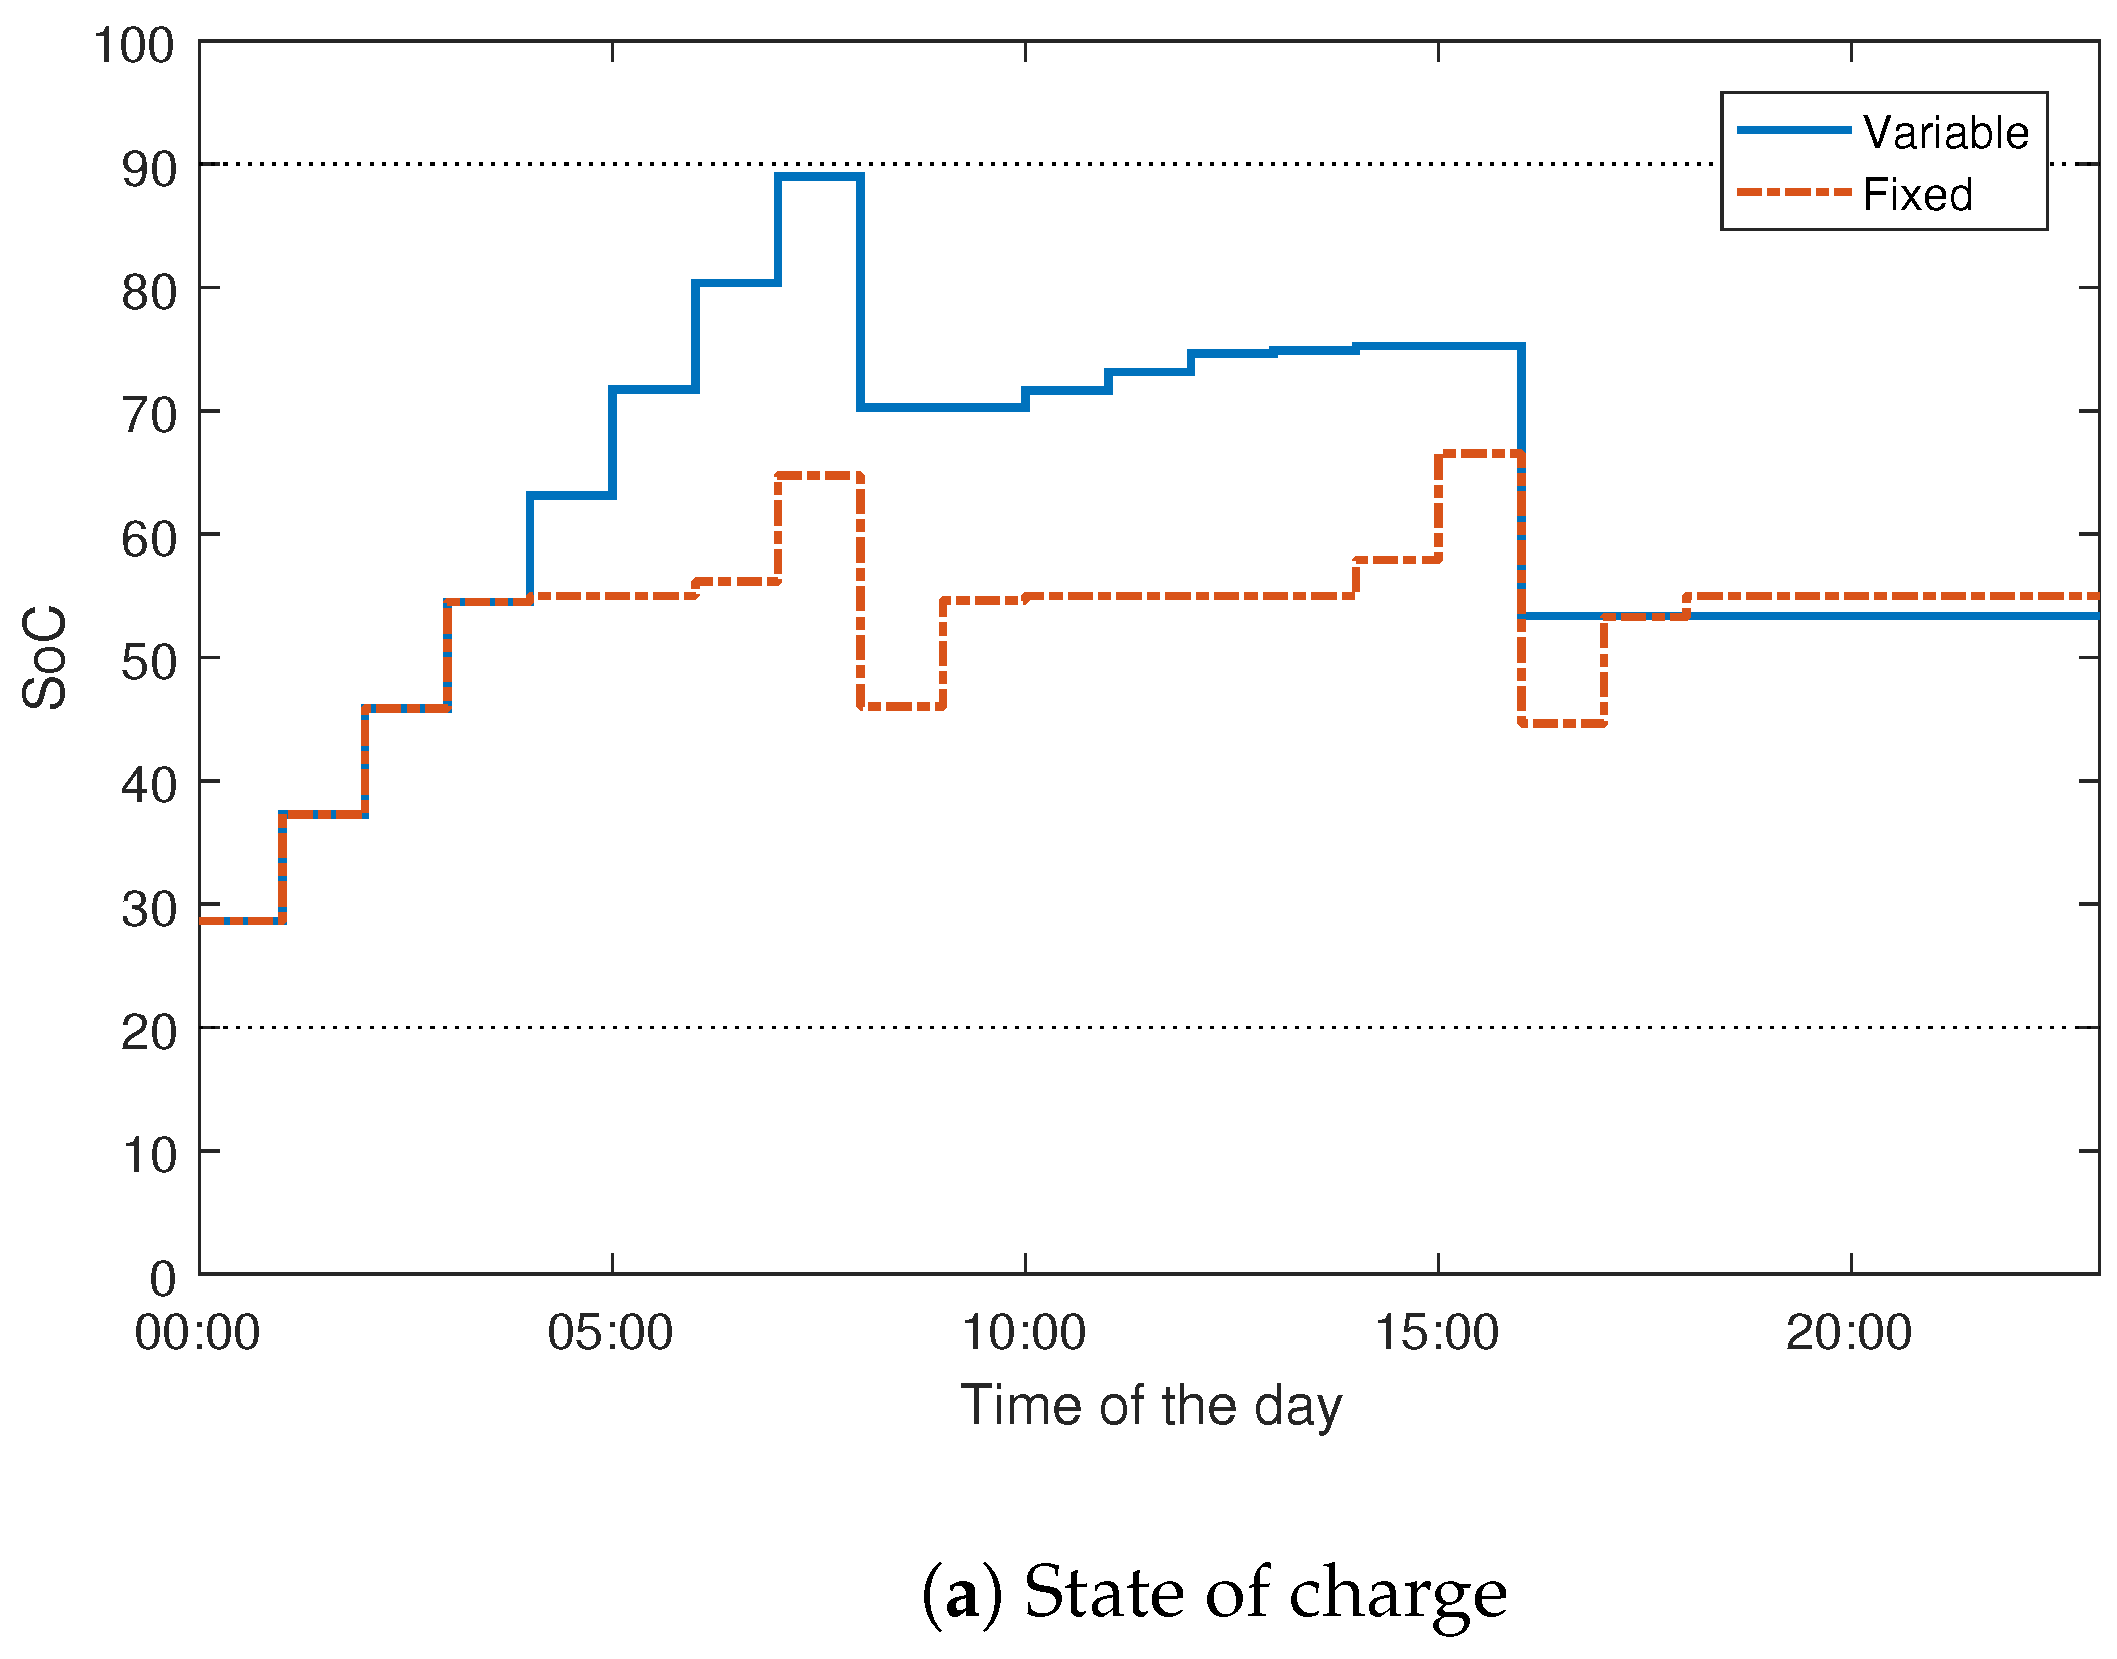
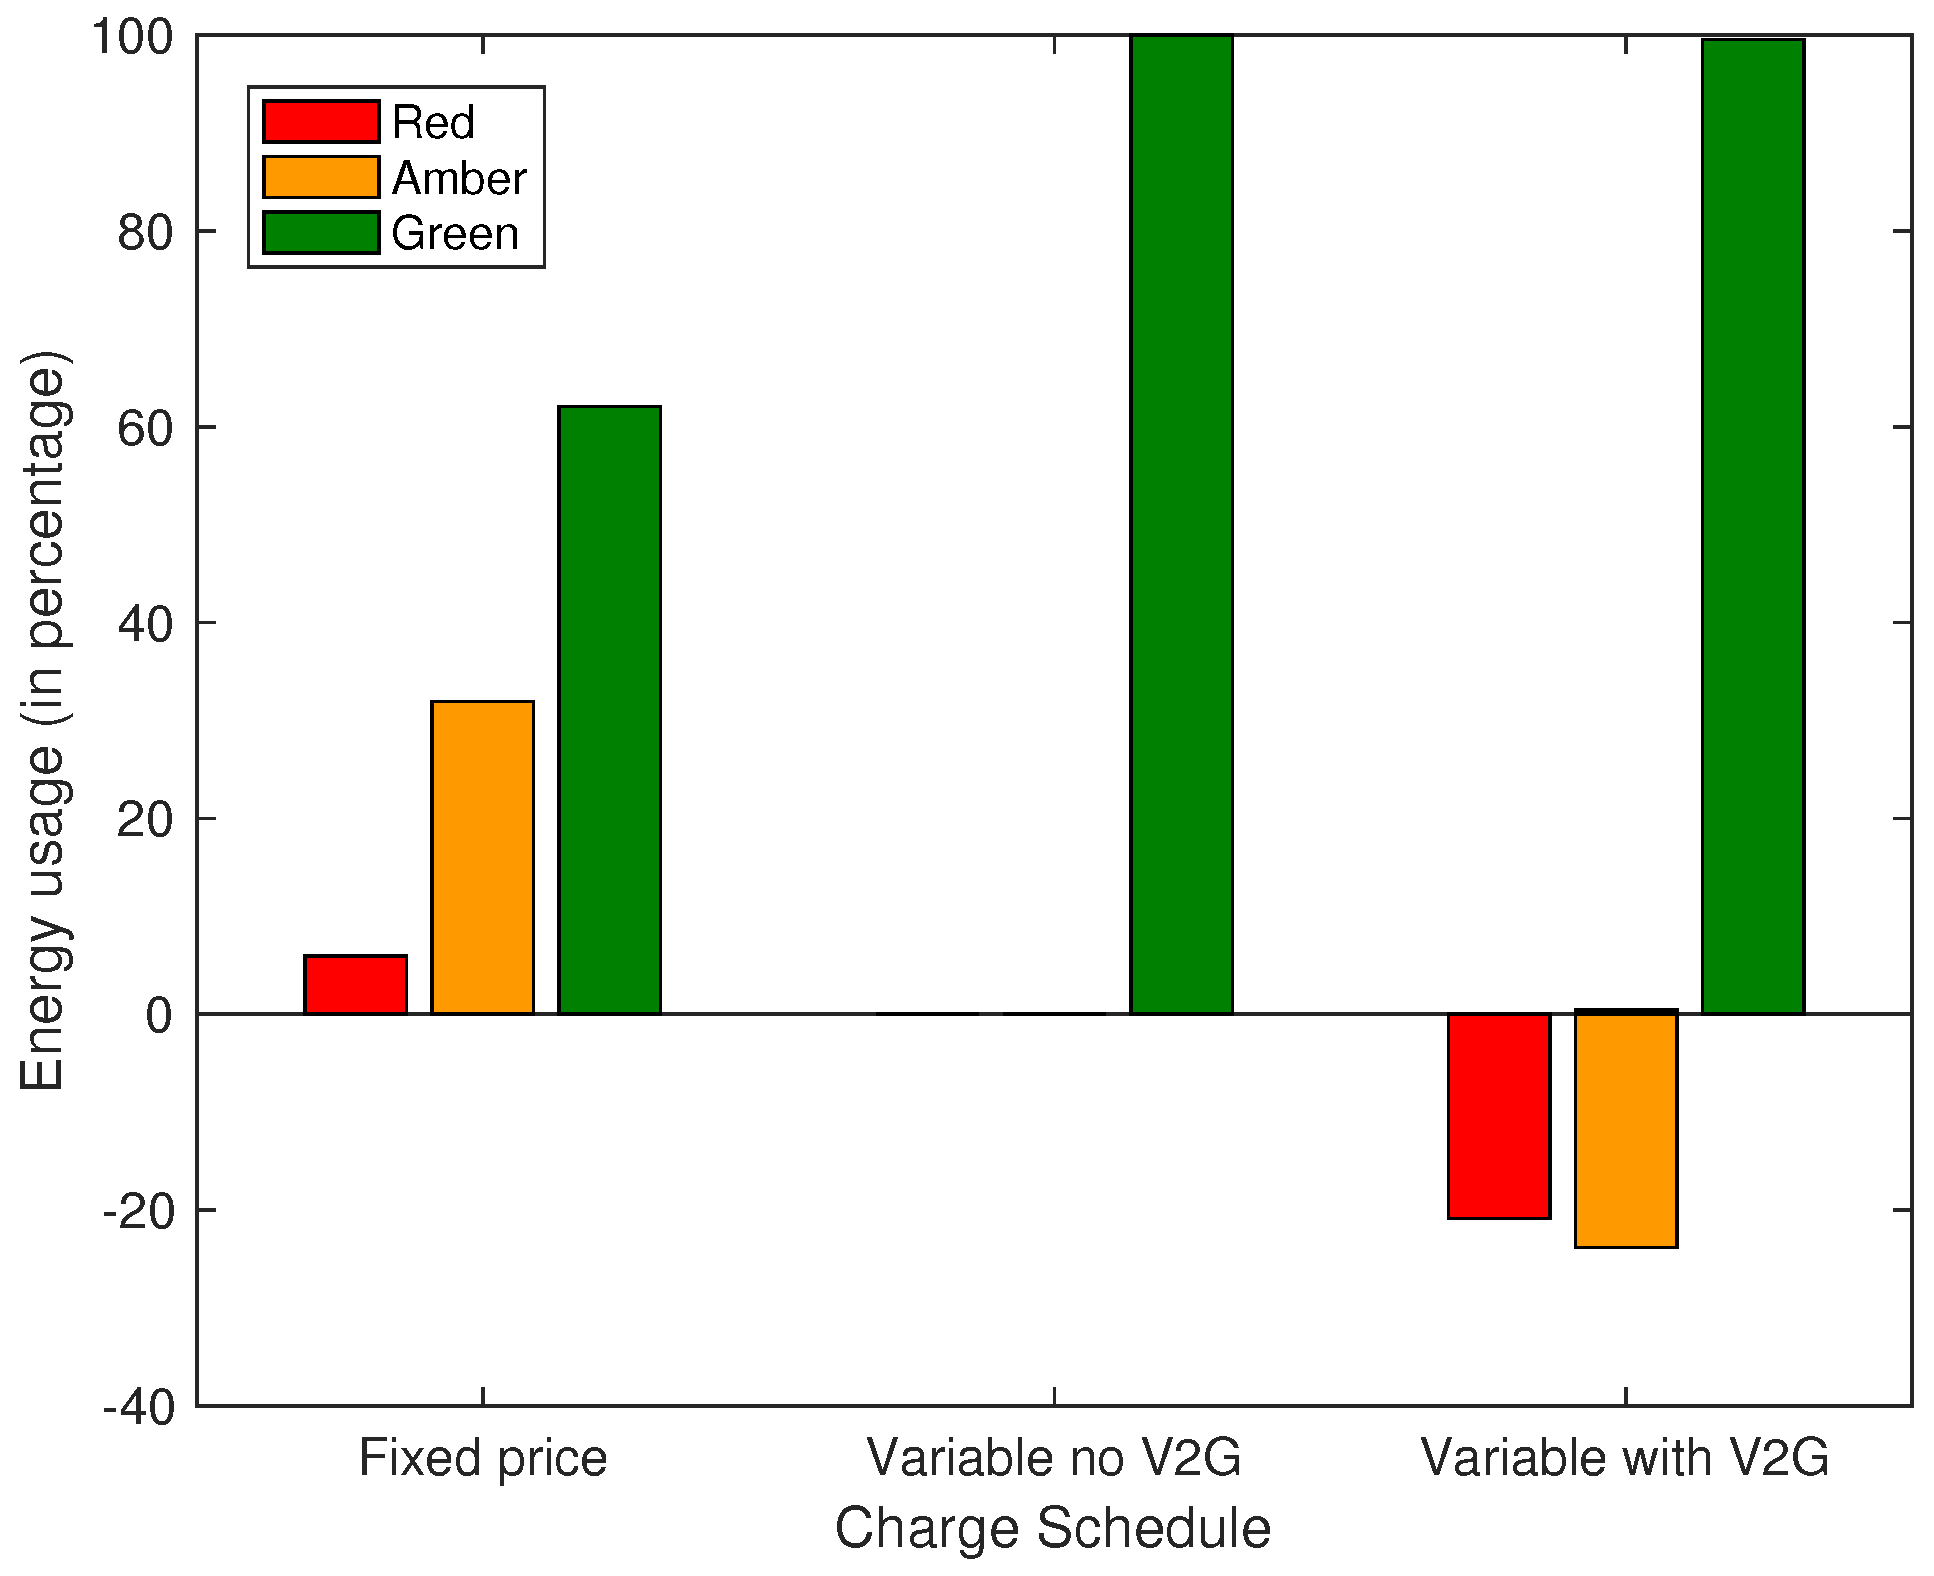
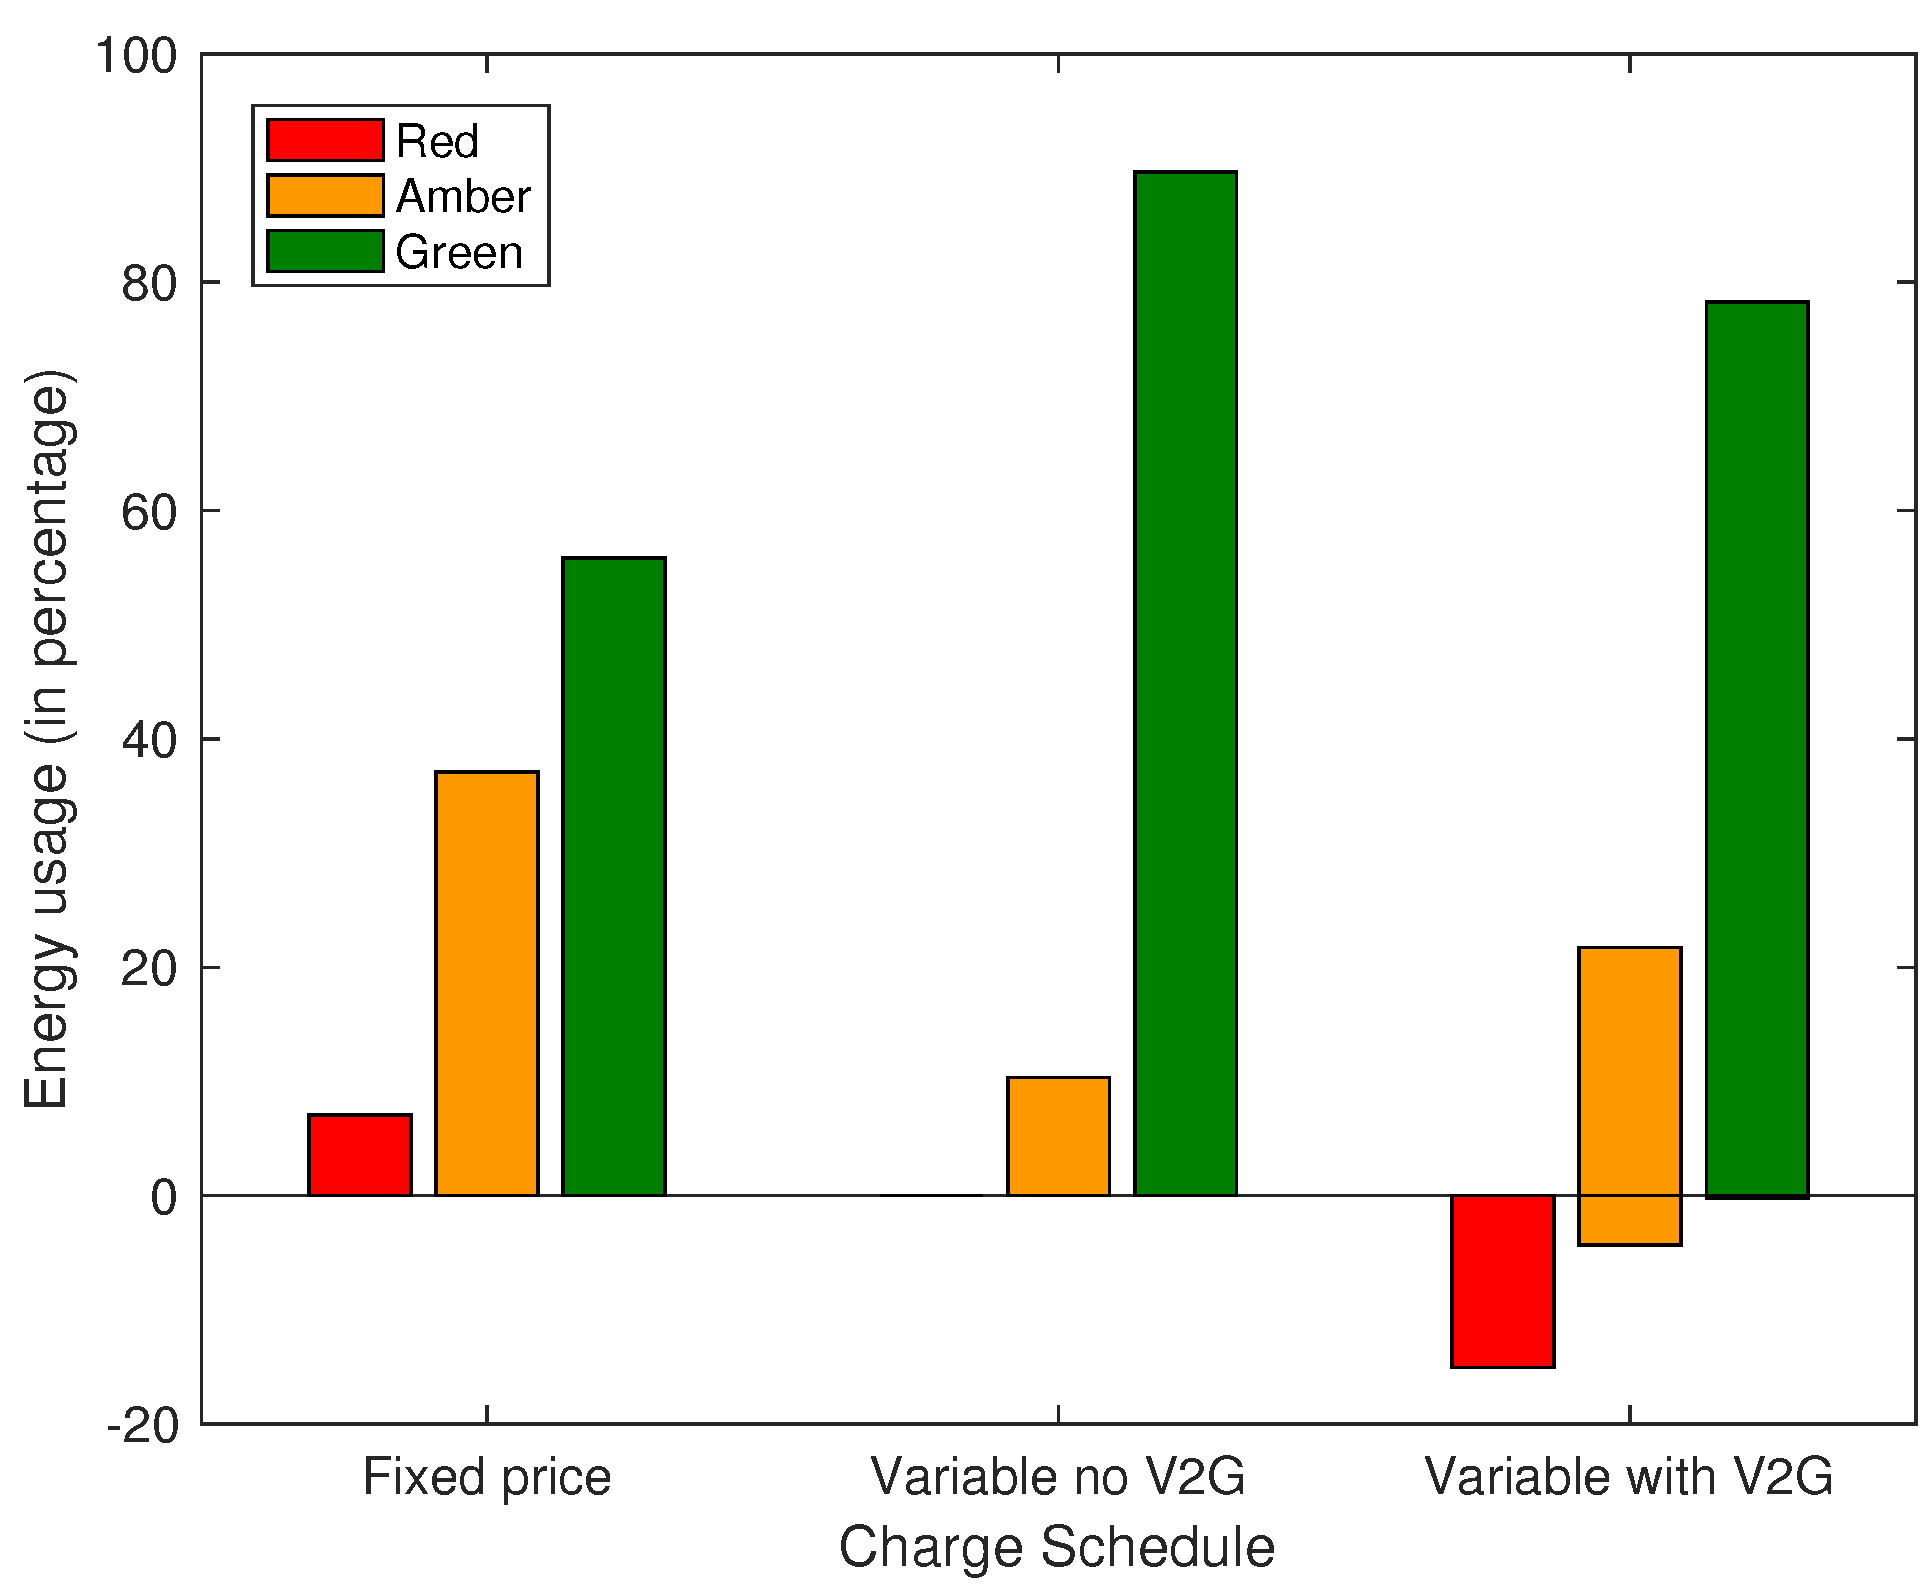
  • Fixed price: For this scenario, the charging schedule was developed using a fixed price of electricity throughout the day.
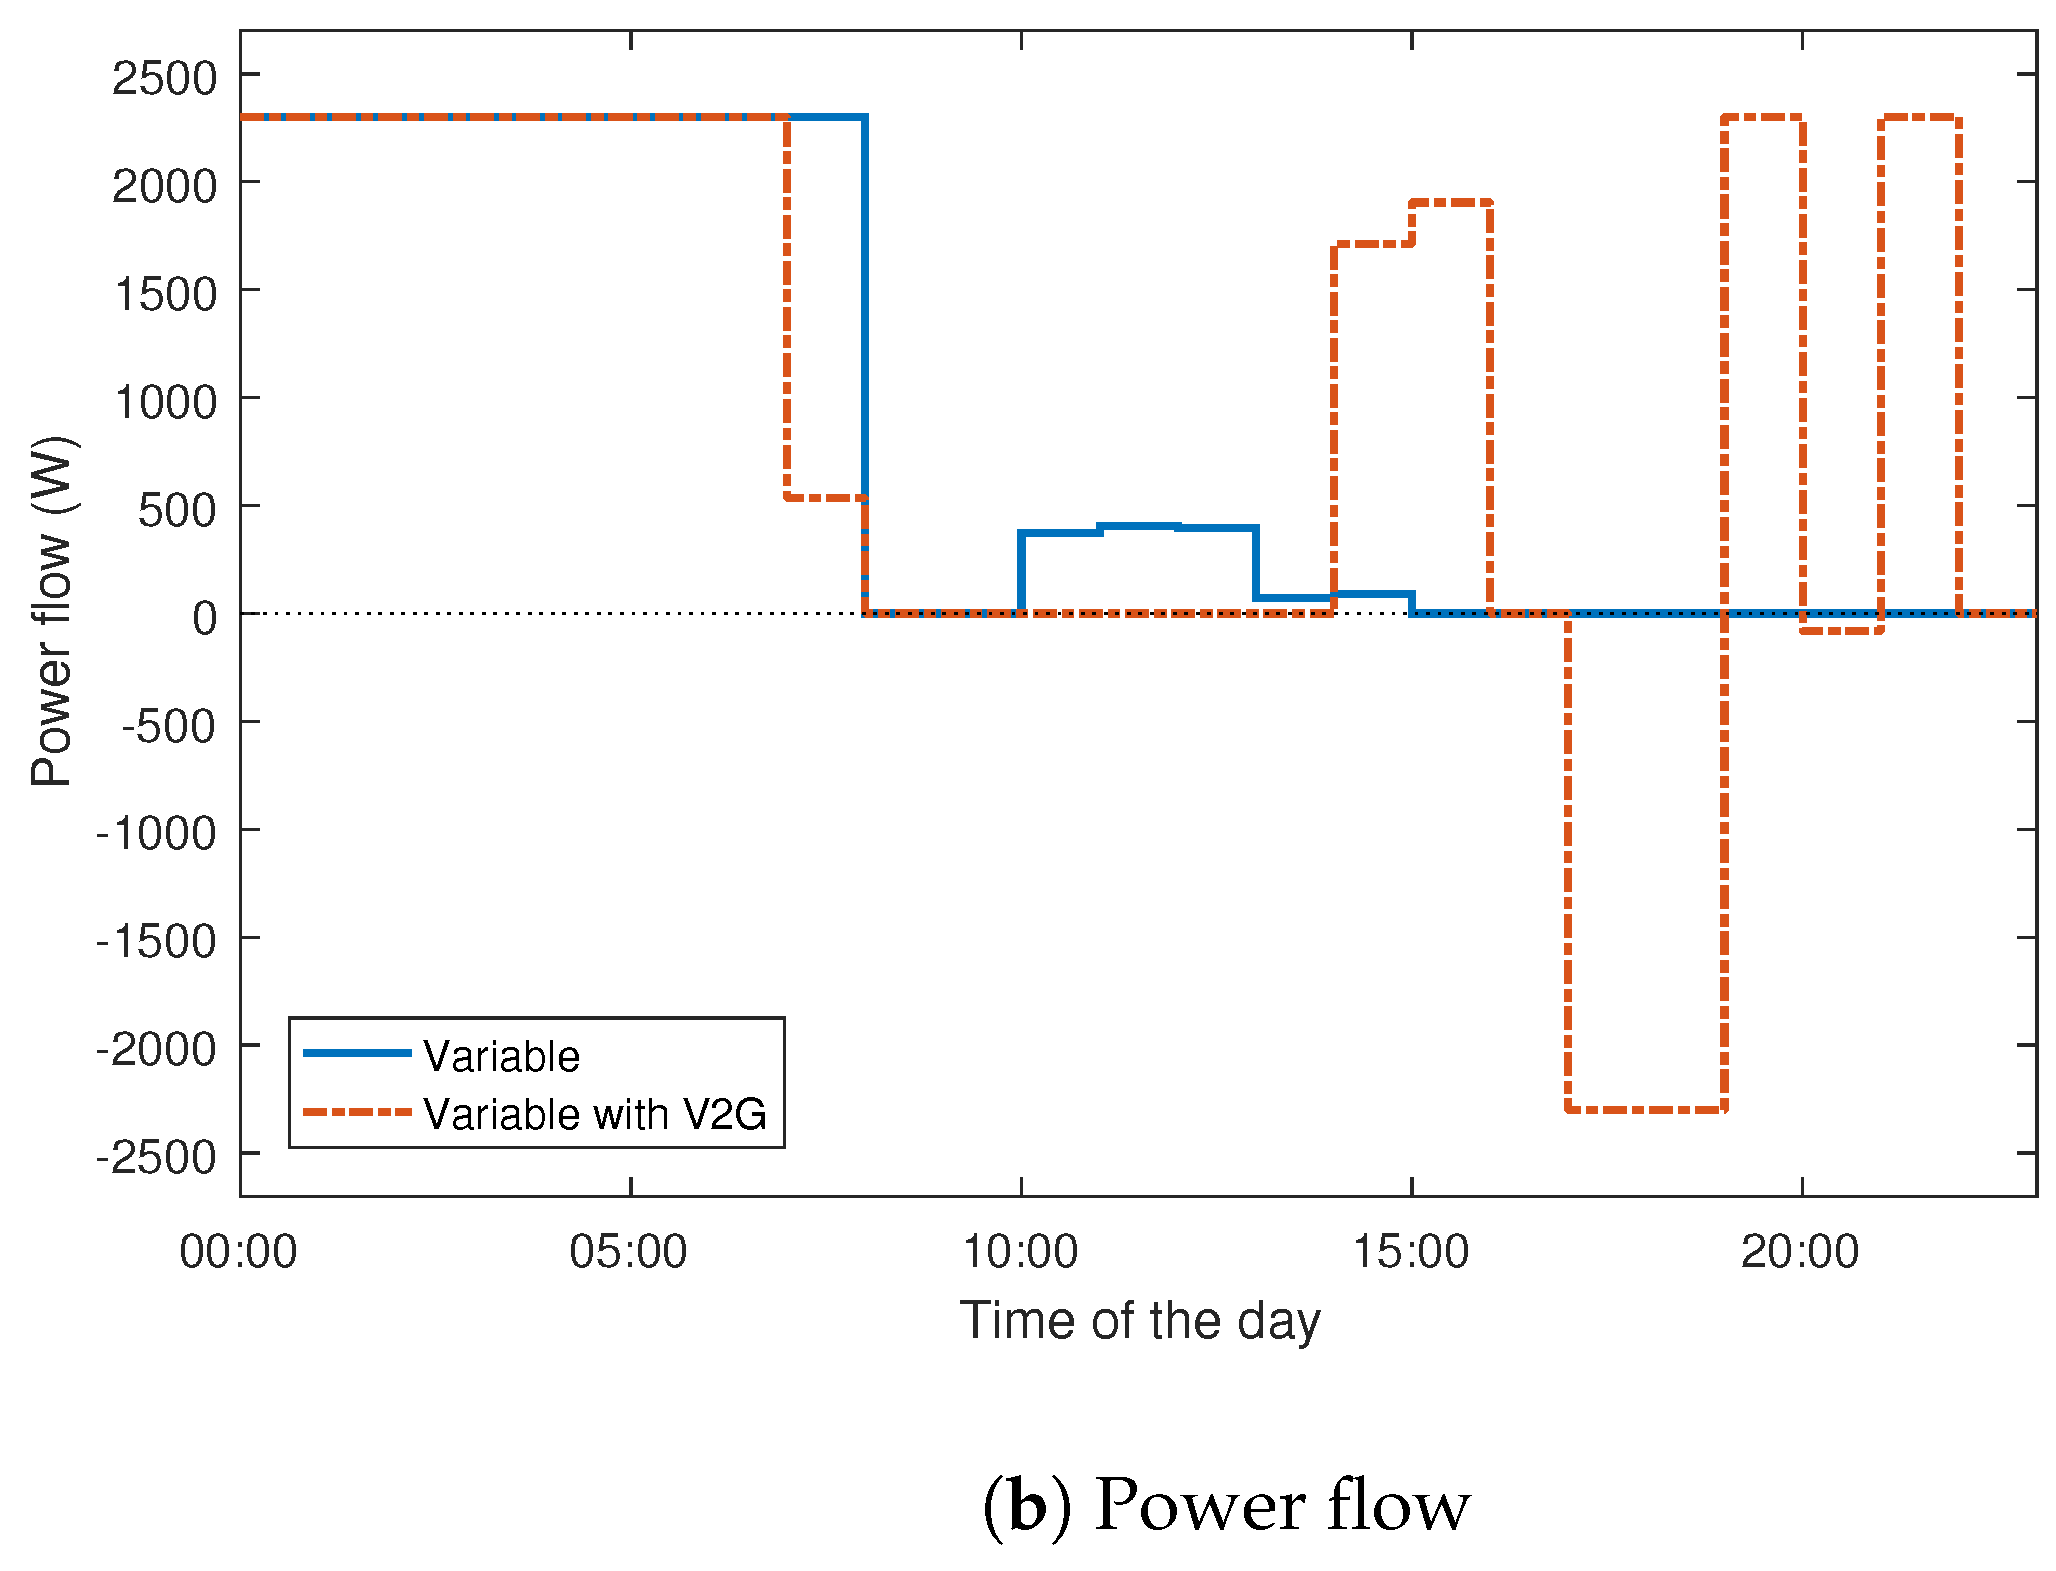
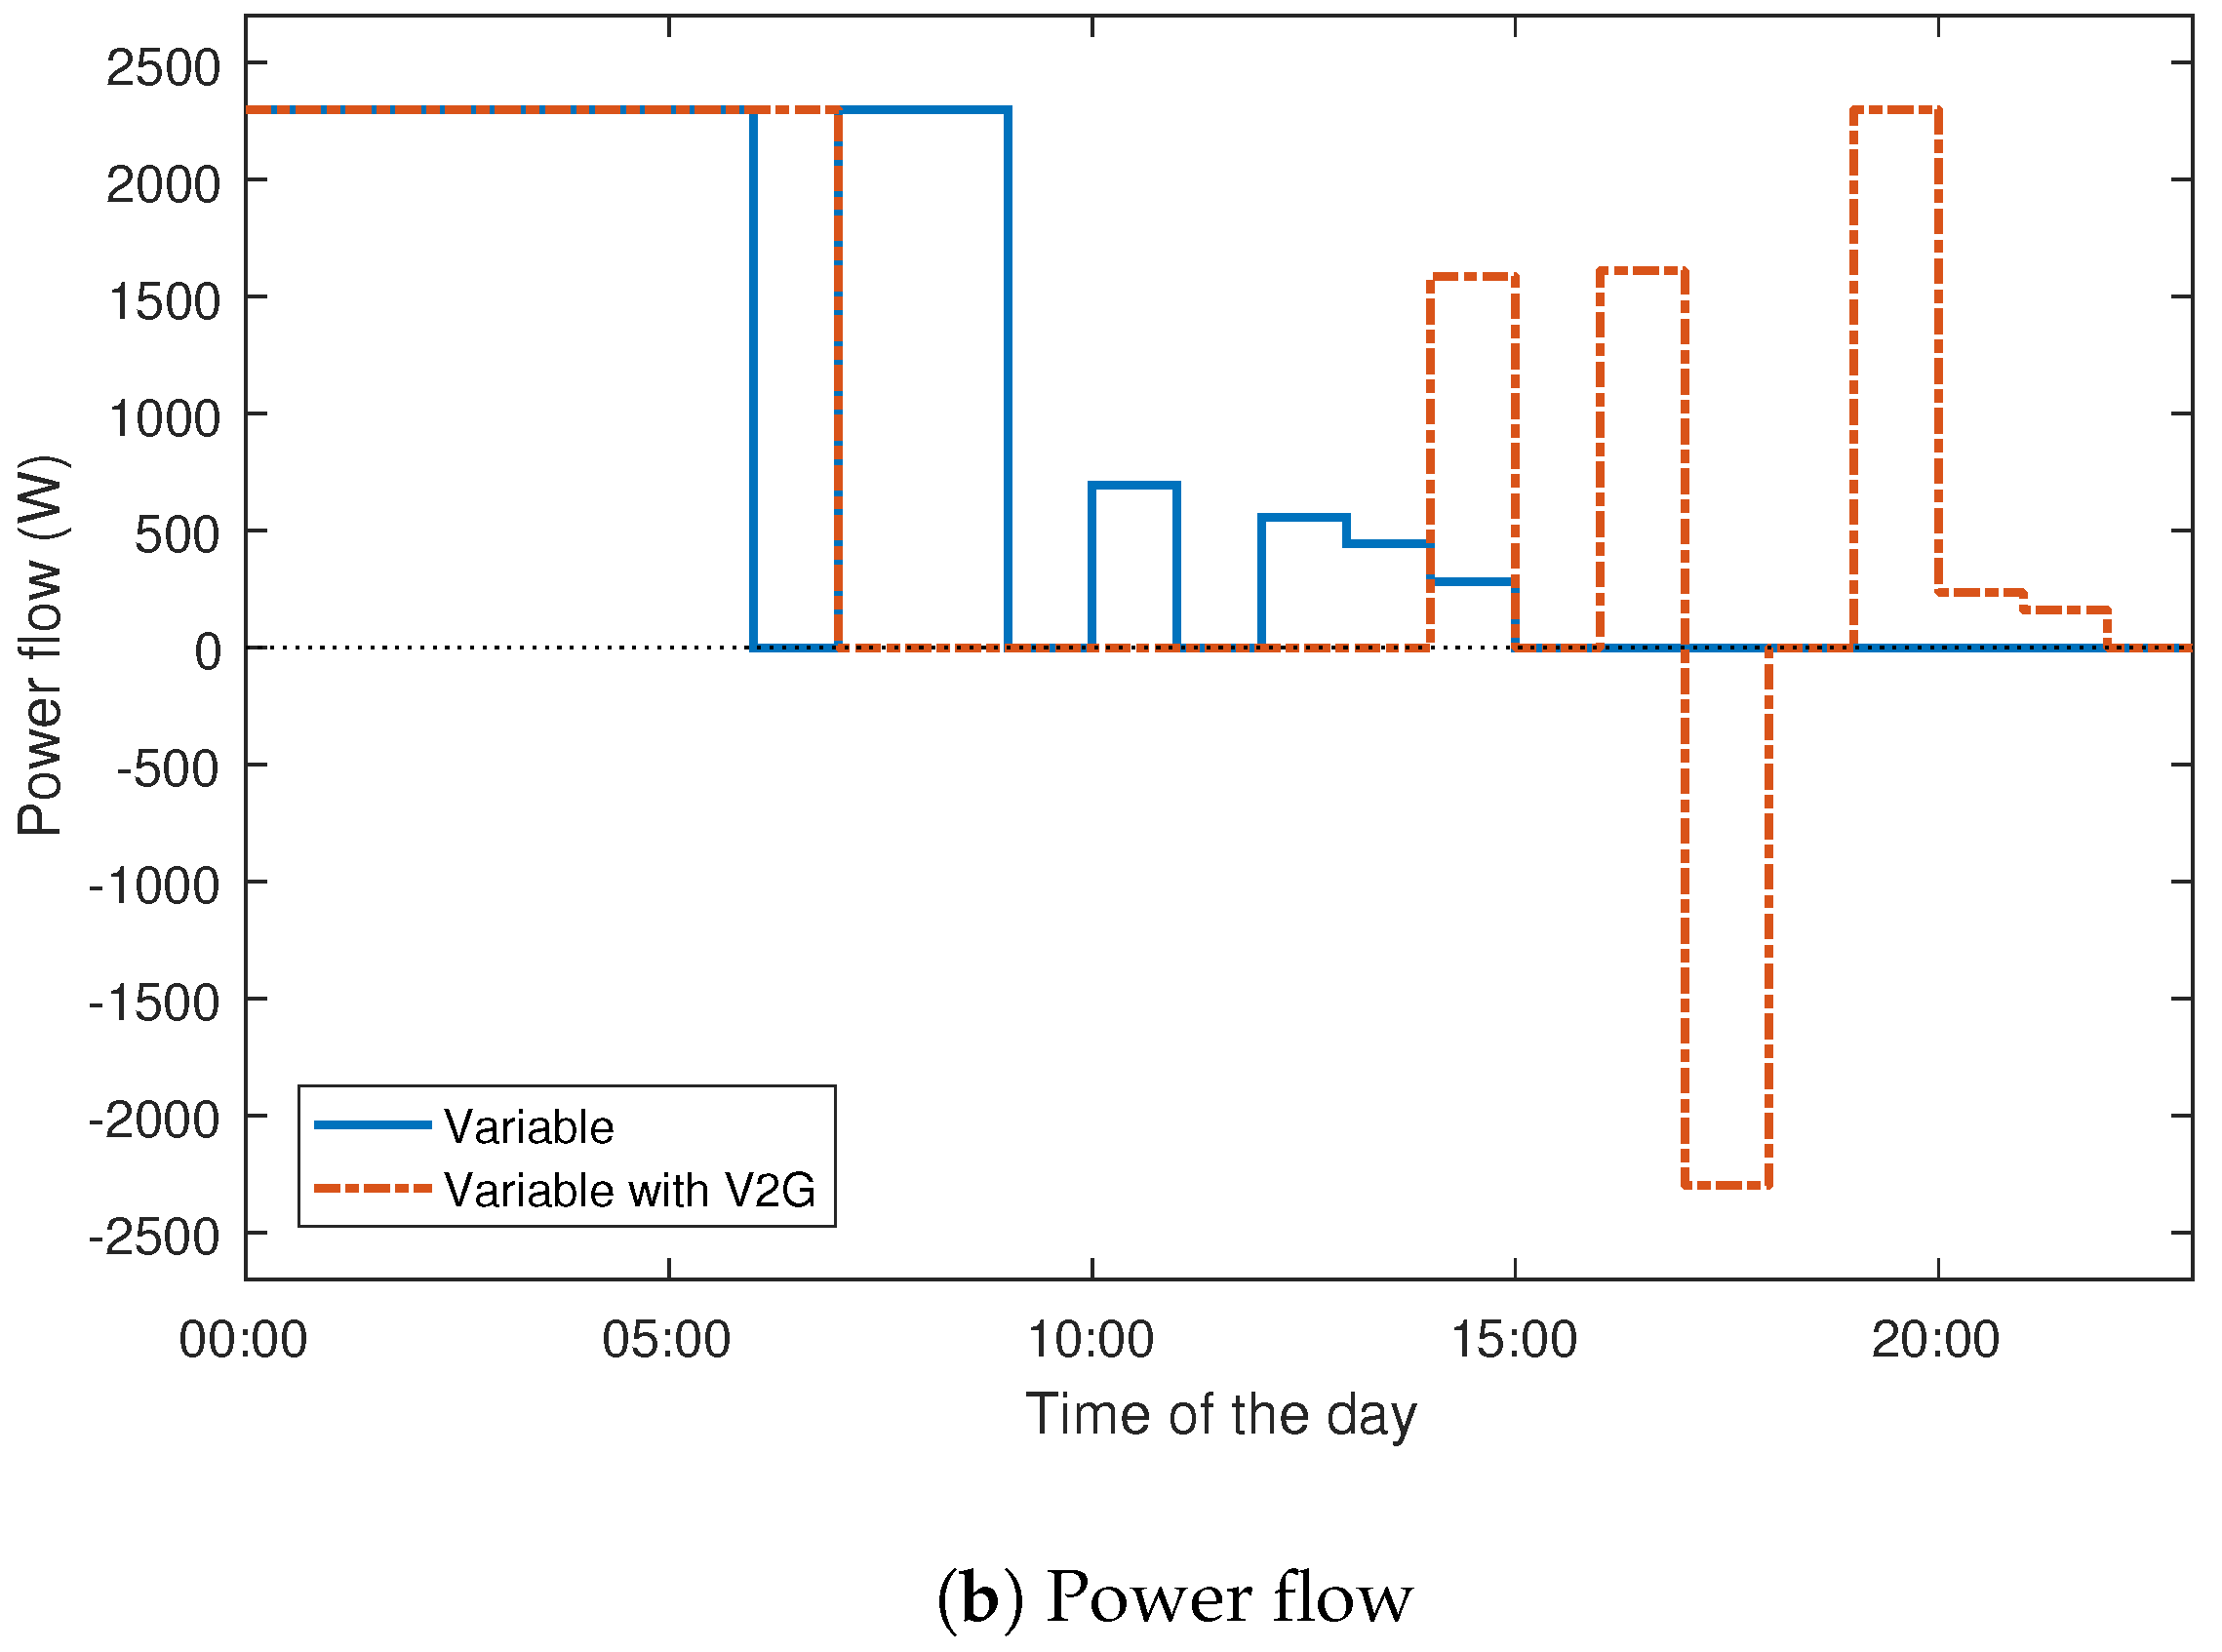
  • Variable price without V2G.
  • Variable price with V2G.

4. Simulations and Results

The results discussed in this section broadly cover two scenarios; basic and optimised charging. Both scenarios are investigated in the three categories of PEVs outlined in Section 2.3. A fixed-tariff is employed in the basic charging scheme such that PEVs are expected to start charging immediately once they are connected to the grid. In this scheme, PEVs are uncoordinated and have no recourse to an optimisation protocol. This is logical given that the price is the same for all the hours of the day; hence, there is neither incentive to shift the charging nor opportunity for arbitrage. On the other hand, the optimised charging scheme employs an optimisation protocol to coordinate the charging and discharging of PEVs relative to the grid in the most economically-efficient manner.

4.1. Personal Vehicles

This section considers a worker who commutes to work in the morning and returns back after work. The plots of daily electricity tariff and energy demand for the trips are presented in Figure 5. The plots show that the period of energy demand corresponds to times of the day in which the electricity tariff is high (amber period), and the journey back from work in the evening is typically completed just before the peak tariff period.
The plots showing the SoC of the vehicle battery and energy consumption during the day for the fixed tariff (i.e., without optimisation) and actual tariff without V2G are presented in Figure 6. The results show that for the algorithm with a fixed tariff, charging occurred even during the peak period. However, for the algorithm with a varying tariff, charging occurred only during periods of low tariff (mostly before 9:00 a.m.). This will ensure a reduction in energy cost for vehicle charging.
The optimal SoC and energy usage curves for a typical day with and without V2G are shown in Figure 7. The plots illustrate that charging mostly occurred during the green tariff period for both schedules. However, for the schedule with V2G, charging also occurred during the amber tariff period, while V2G operation occurred during the red tariff period. This ensures that the cost of energy for battery charging was minimised while the revenue from V2G was maximised. The use of PEVs in V2G/G2V operations encourage prosumers’ participation in the energy value chain, but with different objectives from other actors [45,46]. This is desirable because it also ensures that the user contributes to the grid when electricity is needed the most, thereby maximizing the economic benefits while contributing to the power balance. For optimisation with a fixed tariff, charging operation occurred irrespective of energy prices. This will result in non-optimal charging, allowing the battery to charge even when energy price is highest. This may also result in more demand from the grid when the effect of a large parc of vehicle is consolidated.
To account for non-work-related journeys (e.g., shopping and leisure), it was further assumed that the PEVs embarked on longer trips once every month on weekends. The schedule for weekends is different. Moreover, the availability of charging stations in shopping and other leisure areas is not always guaranteed. However, for easier analysis and to allow for some allowance, the same schedule is assumed during weekends. A breakdown of energy usage for vehicle charging across the tariff regimes is presented in the bar chart presented in Figure 8. The positive bars show the percentage distribution of total energy usage for the different charge schedules. The negative bars on the other hand show the energy transferred to the grid as a percentage of the total energy used in battery charging. For the fixed price schedule (without optimisation), the red, amber and green tariff periods accounted for 14%, 27% and 59% of PEV charging energy. This is similar to the usage of vehicles (such as Oak, Holly, larch, Sec van and Crewe) in the Triangulum fleet as shown in Figure 4. For the optimised scheme with actual variable electricity price without V2G (variable, no V2G), no charging occurred during the red tariff period. The amber and green tariff periods accounted for 7% and 93% of the PEV charging duration, respectively. For the optimised scheme with V2G, no charging occurred during the red tariff period. The amber and green charging periods accounted for 24% and 76% of the charging energy. V2G operation occurred only during the red tariff period, and 19% of the energy used in charging was transferred back to the grid. This resulted in average savings of 63% and 55% in the cost of PEV charging for the optimised charging with and without V2G, respectively.

4.2. Pool Vehicles

In the case of pool vehicles, Monte Carlo simulation was applied. To achieve this, 1000 different coordinating unit patterns uniformly distributed between distances of 20 km and 42 km, i.e., U ( 20 , 42 ) , were generated. The timings for driving out and back to the station were also generated (also uniformly distributed between 9:00 a.m. and 4:00 p.m.), i.e., U ( 9 , 16 ) , to reflect the collected data in Section 2.3. For this class of vehicles, usage was restricted to weekdays. Using a fixed price, a variable price without V2G and a variable price with V2G, an algorithm was developed for each scheme to charge the PEVs. Each of the charging schemes was applied to the 1000 samples of vehicle usage patterns. Average energy usage for the three charging schemes (fixed, optimal without V2G and optimal with V2G) across the three tariff periods is shown in Figure 9.
A large penalty was used in the formulation of the optimisation to discourage charging during peak tariff. The results show that for the fixed-tariff scheme, green, amber and red tariff periods accounted for 62%, 32% and 6% of the total PEV charging energy, whereas in the variable-tariff schemes, 100% of the charging occurred when electricity was the least expensive. The variable scheme with V2G further transferred 45% of the energy back to the grid, of which 21% was during the peak (red) period and 24% during the amber period. This resulted in average savings of about 38% and 14% of PEV charging cost for the charging scheme with and without V2G, respectively.

4.3. Utility Vehicles

Similar to the pool vehicles, the utility vehicles also employed Monte Carlo simulation by generating 1000 distances, uniformly distributed, i.e., U ( 50 , 70 ) . This comprised several short trips without the opportunity for connection to the charging stations. To capture short trips within the campus where connection to the charging station is still possible, a second set of distances distributed over U ( 5 , 7 ) was also generated. The timings for the burst of short trips (external and intra-campus) were also generated both according to a uniform distribution U ( 7 , 24 ) , i.e., between 7:00 a.m. and midnight (here, 24 represents midnight). Utility vehicles differ from other PEVs in the sense that they are subject to more intensive use (including weekends). The trips by these vehicles are more frequent, but over shorter distances. Overall, the utility vehicles cover more mileage than personal and pool vehicles. These characteristics were considered by applying uniformly-distributed usage patterns. The energy usage distribution across tariff period for the developed charge scheme is shown in Figure 10.
The results show that the red, amber and green tariff periods account for 7%, 37% and 56% of total PEV charging energy respectively, with a fixed electricity price. For a variable price without V2G, the amber and green tariff periods accounted for 10% and 90% of the PEV charging, respectively. Finally, the amber and green tariff periods respectively accounted for 22% and 78% of charging for the scheme with V2G. In addition, 15% and 4% of the energy was transferred back to the grid during the red and amber tariff periods, respectively. A look at the SoC in the battery reveals that the charging algorithm maintains the PEV battery charge to a value around 50% of total charge capacity. This means that there is always enough energy to cater to any emergency use of a vehicle that may arise as shown in Figure 11.
According to Figure 11, V2G only occurred during the peak price. The average savings in the cost of PEV charging due to optimised charging with and without V2G was 31% and 14%, respectively.

5. Conclusions

This paper investigated the optimal scheduling of PEVs in the V2G and G2V operations. Using the EMPC formulation, an optimisation algorithm was developed that ensures that G2V and V2G occur at optimal times of the day. This work employs the data from MMU’s PEV infrastructure within the Triangulum project, and the result has shown that employing the proposed scheme can result in significant benefits to the prosumers. The developed scheme ensured that charging was scheduled when the tariff was least expensive, and V2G operation occurred during peak prices. Savings of up to 63% in electricity costs can be realised for the scheme with V2G, and up to 38% is achievable without V2G. The inclusion of feedback in the optimisation algorithm means that the real-time changing tariff is easily accommodated. The decentralised approach applied in this work also lends itself to easy adoption in larger VPP with multiple DERs, and this is one of the objectives of ongoing research. Future work will investigate the effect of changing customer behaviour and the effect of the renewable contribution on the tariff. The aggregated effects of prosumers on grid stability and constraints are also investigated as part of ongoing research.

Acknowledgments

This work was carried out within the Triangulum project, funded by the European Union under the Horizon 2020 Smart Cities and Communities programme (Grant Agreement 646578-Triangulum-H2020-2014-2015/H2020-SCC-2014). The authors would also like to thank John Hindley, Andrew Taylor, Jason Smith, Callum Donelly and Helena Tinker, all of The Estates and Energy Directorate of MMU, for providing the required data and other forms of support during the study.

Author Contributions

All the authors contributed to the paper in different ways. Yusuf A. Sha’aban and Augustine Ikpehai conceived of and designed the model with the support of the other authors. All the authors wrote, reviewed and commented on the manuscript. All the authors have read and approved the final manuscript.

Conflicts of Interest

The authors declare no conflict of interest.

Abbreviations

The following abbreviations are used in this manuscript:
DNOdistribution network operator
EMPCeconomic model predictive control
EUEuropean Union
DERdistributed energy resources
DGdistributed generation
DRdemand response
DSdistributed storage
G2Vgrid-to-vehicle
ISOindependent system operator
PEVplug-in electric vehicle
RTPreal-time pricing
SoCstate of charge
TOUtime-of-use
LTIlinear time-invariant
MPCmodel predictive control
UNEPUnited Nations Environmental Program
V2Gvehicle-to-grid
VPPvirtual power plant

References

  1. David, B.R. Electric vehicles and the electric grid: A review of modeling approaches, Impacts, and renewable energy integration. Renew. Sustain. Energy Rev. 2013, 19, 247–254. [Google Scholar]
  2. UN. District Energy in Cities. Available online: http://www.unep.org/energy/districtenergyincities (accessed on 22 December 2016).
  3. Sittoni, A.; Brunelli, D.; Macii, D.; Tosato, P; Petri, D. Street lighting in smart cities: A simulation tool for the design of systems based on narrowband PLC. In Proceedings of the 2015 IEEE First International Smart Cities Conference (ISC2), Guadalajara, Mexico, 25–28 October 2015; pp. 1–6. [Google Scholar]
  4. Ikpehai, A.; Adebisi, B.; Kharel, R. Smart street lighting over narrowband PLC in a smart city: The Triangulum case study. In Proceedings of the 2016 IEEE 21st International Workshop on Computer Aided Modelling and Design of Communication Links and Networks, Toronto, ON, Canada, 23–25 October 2016; pp. 242–247. [Google Scholar]
  5. Ikpehai, A.; Adebisi, B.; Rabie, K.M.; Haggar, R.; Baker, M. Experimental Study of 6LoPLC for Home Energy Management Systems. Energies 2016, 9, 1026. [Google Scholar] [CrossRef]
  6. Wang, H.; Huang, J. Cooperative Planning of Renewable Generations for Interconnected Microgrids. IEEE Trans. Smart Grid 2016, 7, 2486–2496. [Google Scholar] [CrossRef]
  7. Di Giorgio, A.; Liberati, F.; Canale, S. Electric vehicles charging control in a smart grid: A model predictive control approach. Control Eng. Pract. 2014, 22, 147–162. [Google Scholar] [CrossRef]
  8. Su, W.; Wang, J.; Zhang, K.; Huang, A.Q. Model predictive control-based power dispatch for distribution system considering plug-in electric vehicle uncertainty. Electr. Power Syst. Res. 2014, 106, 29–35. [Google Scholar] [CrossRef]
  9. Halvgaard, R.; Poulsen, N.K.; Madsen, H.; Jorgensen, J.B.; Marra, F.; Bondy, D.E.M. Electric vehicle charge planning using Economic Model Predictive Control. In Proceedings of the 2012 IEEE International Electric Vehicle Conference, Greenville, SC, USA, 4–8 March 2012; pp. 1–6. [Google Scholar]
  10. Marcacci, S. Electric Vehicles Speeding Toward 7% of all Global Sales by 2020. Available online: https://cleantechnica.com (accessed on 22 December 2016).
  11. Conn, I.C. Energy, Transport and the Environment: Providing Energy Security; Springer Energy, Transport and the Environment Addressing the Sustainability Mobility Program; Springer: London, UK, 2012; Volume VIII 713, p. 195. [Google Scholar]
  12. Cluzel, C.; Lane, B.; Standen, E. Pathways to High Penetration of Electric Vehicles; Techreport, Element Energy Limited: Cambridge, UK, 2013. [Google Scholar]
  13. Aston University Commissions the UK’S First Permanent Electric Vehicle to Grid Charging System. News Report. Aston University, 2016. Available online: http://www.aston.ac.uk/news/releases/2016/february/aston-commissions-uks-first-electric-vehicle-to-grid-charging-system (accessed on 30 December 2016).
  14. Guille, C.; Gross, G. A conceptual framework for the vehicle-to-grid (V2G) implementation. Energy Policy 2009, 37, 4379–4390. [Google Scholar] [CrossRef]
  15. Tan, L.; Liu, H.; Liu, Z.; Guo, J.; Yan, C.; Wang, W.; Huang, X. Power Stabilization Strategy of Random Access Loads in Electric Vehicles Wireless Charging System at Traffic Lights. Energies 2016, 9, 811. [Google Scholar] [CrossRef]
  16. Jiang, C.; Chau, K.T.; Liu, C.; Lee, C.H.T. An Overview of Resonant Circuits for Wireless Power Transfer. Energies 2017, 10, 894. [Google Scholar] [CrossRef]
  17. Alvaro Hermana, R.; FraileArdanuy, J.; Zufiria, P.J.; Knapen, L.; Janssens, D. Peer to Peer Energy Trading with Electric Vehicles. IEEE Intell. Transp. Syst. Mag. 2016, 8, 33–44. [Google Scholar] [CrossRef]
  18. Making the Connection: The Plug-In Vehicle Infrastructure Strategy. Techreport; Office for Low Emission Vehicles: United Kingdom, 2011. Available online: https://www.gov.uk/government/publications/making-the-connection-the-plug-in-vehicle338infrastructure-strategy (accessed on 1 September 2016).
  19. Aziz, M.; Oda, T.; Mitani, T.; Watanabe, Y.; Kashiwagi, T. Utilization of Electric Vehicles and Their Used Batteries for Peak-Load Shifting. Energies 2015, 8, 3720–3738. [Google Scholar] [CrossRef]
  20. Han, S.; Han, S. Economic feasibility of V2G frequency regulation in consideration of battery wear. Energies 2013, 6, 748–765. [Google Scholar] [CrossRef]
  21. Noel, L.; McCormack, R. A cost benefit analysis of a V2G-capable electric school bus compared to a traditional diesel school bus. Appl. Energy 2014, 126, 246–255. [Google Scholar] [CrossRef]
  22. Saber, A.Y.; Venayagamoorthy, G.K. Plug-in Vehicles and Renewable Energy Sources for Cost and Emission Reductions. IEEE Trans. Ind. Electron. 2011, 58, 1229–1238. [Google Scholar] [CrossRef]
  23. Bhattarai, B.P.; Myers, K.S.; Bak-Jensen, B.; Paudyal, S. Multi-time scale control of demand flexibility in smart distribution networks. Energies 2017, 10, 37. [Google Scholar] [CrossRef]
  24. Du, Y.; Zhou, X.; Bai, S.; Lukic, S.; Huang, A. Review of non-isolated bi-directional DC-DC converters for plug-in hybrid electric vehicle charge station application at municipal parking decks. In Proceedings of the 2010 Twenty-Fifth Annual IEEEApplied Power Electronics Conference and Exposition (APEC), Palm Springs, CA, USA, 21–25 February 2010; pp. 1145–1151. [Google Scholar]
  25. Tulpule, P.J.; Marano, V.; Yurkovich, S.; Rizzoni, G. Economic and environmental impacts of a PV powered workplace parking garage charging station. Appl. Energy 2013, 108, 323–332. [Google Scholar] [CrossRef]
  26. Xing, H.; Fu, M.; Lin, Z.; Mou, Y. Decentralized Optimal Scheduling for Charging and Discharging of Plug-In Electric Vehicles in Smart Grids. IEEE Trans. Power Syst. 2016, 31, 4118–4127. [Google Scholar] [CrossRef]
  27. Dabbagh, S.R.; Sheikh-El-Eslami, M.K. Risk Assessment of Virtual Power Plants Offering in Energy and Reserve Markets. IEEE Trans. Power Syst. 2016, 31, 3572–3582. [Google Scholar] [CrossRef]
  28. Un-Noor, F.; Padmanaban, S.; Mihet-Popa, L.; Mollah, M.N.; Hossain, E. A Comprehensive Study of Key Electric Vehicle (EV) Components, Technologies, Challenges, Impacts, and Future Direction of Development. Energies 2017, 10, 1217. [Google Scholar] [CrossRef]
  29. Mwasilu, F.; Justo, J.J.; Kim, E.K.; Do, T.D.; Jung, J.W. Electric vehicles and smart grid interaction: A review on vehicle to grid and renewable energy sources integration. Renew. Sustain. Energy Rev. 2014, 34, 501–516. [Google Scholar] [CrossRef]
  30. Battistelli, C.; Baringo, L.; Conejo, A. Optimal energy management of small electric energy systems including V2G facilities and renewable energy sources. Electr. Power Syst. Res. 2012, 92, 50–59. [Google Scholar] [CrossRef]
  31. Zhu, Z.; Lambotharan, S.; Chin, W.H.; Fan, Z. AMean Field Game Theoretic Approach to Electric Vehicles Charging. IEEE Access 2016, 4, 3501–3510. [Google Scholar] [CrossRef]
  32. Zhang, S.; Zhang, C.; Xiong, R.; Zhou, W. Study on the Optimal Charging Strategy for Lithium-Ion Batteries Used in Electric Vehicles. Energies 2014, 7, 6783–6797. [Google Scholar] [CrossRef]
  33. Liu, D.; Wang, Y.; Shen, Y. Electric Vehicle Charging and Discharging Coordination on Distribution Network Using Multi-Objective Particle Swarm Optimization and Fuzzy Decision Making. Energies 2016, 9, 186. [Google Scholar] [CrossRef]
  34. Guo, Y.; Liu, W.; Wen, F.; Salam, A.; Mao, J.; Li, L. Bidding Strategy for Aggregators of Electric Vehicles in Day-Ahead Electricity Markets. Energies 2017, 10, 144. [Google Scholar] [CrossRef]
  35. An, K.; Song, K.-B.; Hur, K. Incorporating Charging/Discharging Strategy of Electric Vehicles into Security-Constrained Optimal Power Flow to Support High Renewable Penetration. Energies 2017, 10, 729. [Google Scholar] [CrossRef]
  36. Zeng, M.; Leng, S.; Maharjan, S.; Gjessing, S.; He, J. An incentivized auction-based group-selling approach for demand response management in V2G systems. IEEE Trans. Ind. Inform. 2015, 11, 1554–1563. [Google Scholar] [CrossRef]
  37. Paudyal, S.; Dahal, S. Impact of plug-in hybrid electric vehicles and their optimal deployment in smart grids. In Proceedings of the 21st Australasian Universities Power Engineering Conference (AUPEC), Brisbane, Australia, 5–28 September 2011; pp. 1–6. [Google Scholar]
  38. Fotouhi, A.; Auger, D.J.; Propp, K.; Longo, S.; Wild, M. A review on electric vehicle battery modelling: From Lithium-ion toward Lithium-Sulphur. Renew. Sustain. Energy Rev. 2016, 56, 1008–1021. [Google Scholar] [CrossRef]
  39. 1547.4-2011-IEEE Guide for Design, Operation, and Integration of Distributed Resource Island Systems with Electric Power Systems. Available online: http://ieeexplore.ieee.org/document/5960751/ (accessed on 31 December 2016).
  40. Kroposki, B.; Basso, T.; Madsen, H.; DeBlasio, R. Microgrid standards and technologies. In Proceedings of the 2008 IEEE Power and Energy Society General Meeting-Conversion and Delivery of Electrical Energy in the 21st Century, Pittsburgh, PA, USA, 20–24 July 2008; pp. 1–4. [Google Scholar]
  41. Strategies for the Uptake of EVs in Associated Infrastructure Implications. Techreport. Element Energy Limited, 2009. Available online: http://www.element-energy.co.uk/case-study/electric-vehicles-in-the-uk/ (accessed on 19 December 2016).
  42. Sha’aban, Y.; Lennox, B.; Laurí, D. PID versus MPC Performance for SISO Dead-time Dominant Processes. IFAC Proc. Vol. 2013, 46, 241–246. [Google Scholar] [CrossRef]
  43. Maciejowski, J.M. Predictive Control: With Constraints; Pearson Education: Upper Saddle River, NJ, USA, 2002. [Google Scholar]
  44. Qin, S.; Badgwell, T.A. A survey of industrial model predictive control technology. Control Eng. Pract. 2003, 11, 733–764. [Google Scholar] [CrossRef]
  45. Bhattarai, B.P.; Lévesque, M.; Bak-Jensen, B.; Pillai, J.R.; Maier, M.; Tipper, D.; Myers, K.S. Design and cosimulation of hierarchical architecture for demand response control and coordination. IEEE Trans. Ind. Inform. 2017, 4, 1806–1816. [Google Scholar] [CrossRef]
  46. Bhattarai, B.; Kouzelis, K.; Mendaza, I.; Bak-Jensen, B.; Pillai, J.; Myers, K. Smart Grid Constraint Violation Management for Balancing and Regulating Purposes. IEEE Trans. Ind. Inform. 2017, PP, 1. [Google Scholar] [CrossRef]
Figure 1. A model of bi-directional coordination of PEVs and their interactions with the network.
Energies 10 01507 g001
Figure 2. Integration of DERs and loads within the Triangulum project.
Energies 10 01507 g002
Figure 3. Charging distribution according to the tariff.
Energies 10 01507 g003
Figure 4. PEV charging by vehicle.
Energies 10 01507 g004
Figure 5. Electricity tariff and energy demand.
Energies 10 01507 g005
Figure 6. Charge schedule with fixed and variable tariffs.
Energies 10 01507 g006aEnergies 10 01507 g006b
Figure 7. Charge schedule with and without V2G.
Energies 10 01507 g007aEnergies 10 01507 g007b
Figure 8. Energy usage across tariff regimes for personal PEV.
Energies 10 01507 g008
Figure 9. Energy usage across tariff regimes for pool PEVs.
Energies 10 01507 g009
Figure 10. Energy usage across tariff regimes for utility PEVs.
Energies 10 01507 g010
Figure 11. Charge schedule with and without V2G for utility vehicles.
Energies 10 01507 g011aEnergies 10 01507 g011b
Table 1. PEV charge and mileage summary.
CarBatteryRangeRange/kWRange perCost per
Name(kW)(km)(km/kW)Charge (km)Charge
Maple (Pool)248406.44962.4
Oak (Pool)247376.44962.4
Willow (Pool)304946.441233.0
Holly (Pool)248136.761293.0
Larch (Pool)304026.441233.0
Sec1 (Security)2416224.83742.4
Mail (Mail)2419315.47822.4
Crewe (Van)248225.15772.4
Repro (Van)247134.51672.4
Table 2. Electricity tariff schedule.
TimeWeekdayWeekend
Price (£/kWh)Tariff PeriodPrice (£/kWh)Tariff Period
21:00–09:000.08–0.10Green0.07–0.08Green
09:00–16:300.10–0.11Amber0.09–0.10Green
16:30–18:300.19–0.24Red0.10–0.11Amber
19:00–21:000.10–0.11Amber0.09–0.10Green
Table 3. Tariff period of charging by vehicle.
VehicleCharging Duration
RedAmberGreenTotal (hrs)
hrs%hrs%hrs%
Maple15.9612.2895.7873.6718.2714.05130.01
Oak69.058.63280.2035.01451.1456.37800.39
Willow20.7413.9675.6950.95277.4135.09148.56
Holly48.129.11201.8338.39277.4152.50528.36
Larch49.499.00204.4437.16296.5453.84550.13
Security92.217.96444.3538.33622.5453.711159.1
Mail119.2322.41261.1149.07151.7328.51532.07
Crewe27.358.88112.4536.52168.1254.60307.92
Repro44.3212.43104.2129.25207.8058.32356.33
Table 4. Model and optimisation parameters.
SymbolParameterValue (Unit)
V g Grid voltage230 (V)
xSoC [ 0 , 1 ]
i m a x Maximum charge current10 (A)
i m i n Minimum charge current 10 (A)
Q m a x Nominal battery capacity 24 / 30 (kWh)
T s Sample time1 (h)
N p Prediction horizon24 (Samples)
η e v Battery efficiency150/205 (Wh/km)
η Charging/discharging efficiency90 (%)
pElectricity pricevariable (£/kWh)

