1. Introduction
Climate change is recognised as one of the key challenges humankind is facing. The recent international Paris agreement aims at limiting the temperature increase to no more than 2 °C compared to the period before the industrial revolution [
1]. Among the measures to mitigate the impact of climate change, energy efficiency is highlighted as a key component [
2]. In addition to mitigation of CO
2 emissions, energy efficiency will reduce the energy consumption compared to a “business as usual” approach and therefore contributes to the security of energy supplies and to the competitiveness of business [
3]. Energy efficiency is a key part of the European energy policies and the 2020 and 2030 energy and climate targets include a specific part for energy efficiency [
4]. In the EU, as well as in other major economies, policies and measures have been introduced to improve energy efficiency in every sector of the economy, including ICT and data centres [
5].
According to Rong et al. [
6], data centres are computer warehouses that store large amounts of data that meet the daily transaction processing needs of different businesses. They contain servers for the collection of data and network infrastructure for the utilisation and storage of the data. Data centres usually run 24/7 all year round [
7], and they are very energy intensive with typical power densities of 538–2153 W/m
2 that sometimes can reach up to 10 KW/m
2 [
8]. High energy consumption can be attributed primarily to the IT demands and cooling equipment, as well as lighting, power distribution and other requirements. The cooling system alone may account for up to 40% in average of the energy demands of a data centre [
9,
10], with the most efficient systems using 24% of the total energy and the least efficient 61% [
10]. The power is distributed to chillers, cooling towers and water pumps [
9]. Water chillers are the most energy-consuming since they supply chilled water to the cooling coil in order to keep the indoor temperature low enough to remove the heat emitted by the servers and other equipment [
9].
The ICT (Information and Communication Technology) sector including data centres generates up to 2% of the global CO
2 emissions, a number on par to the aviation sector contribution [
11,
12], and data centres are estimated to have the fastest growing carbon footprint from across the whole ICT sector [
12]. The energy consumption in the ICT sector has increased exponentially over the last years, mainly due to technological advances such as the cloud computing and the rapid growth of the use of Internet services [
2]. In general, the information technology (IT) sector nowadays consumes approximately 7% of the global electricity, and it is forecasted that the share will rise up to 13% by 2030 [
13]. Real-time video streaming, online gaming as well as mobile devices already account for 60% of all data traffic, and it is predicted that this will rise to 80% by 2020 [
14]. The data centre (DC) sector in particular is estimated to account for 1.4% of the global electricity consumption (1.1–1.5% for 2011 specifically [
6,
15]), and the compound annual growth rate (CAGR) of this consumption in the period between 2007 and 2012 has been estimated as 4.4%, much higher that the projected 2.1% increase in global demand from 2012 to 2040 [
16].
Table 1 shows the total energy consumption in data centres over different years from a European, American and global perspective. It must be noted that Van Heddeghem [
17] calculated the global consumption taking into consideration Koomey’s methodological approach (12% annual growth) [
15] albeit including orphaned servers (servers that use electricity but not delivering services). However, thus far, there is little evidence to support the data centre energy consumption estimations, especially those that include the infrastructure energy as well. This is mainly due to the lack of energy use monitoring, changing technologies and growing densities and, finally, rare disclosure of the companies’ energy data [
12].
Data centres have been designed to allow operational and capacity changes and expansions and in conjunction with the fact that many of them run redundant power and cooling systems to provide better reliability, the energy consumption inefficiency is quite high [
14,
19]. However, there is no appropriate legislative framework and policies to limit the negative impact of data centres’ energy consumption to CO
2 emissions.
There are European policy actions for buildings such as the 2010 European Energy Performance of Building Directive (EPBD) [
20] which imposes on the EU Member States to adopt minimum efficiency requirements for buildings based on cost-optimality in their building codes. In addition to that Directive, there is an agreement between the EU and the US on the shared use of the Energy Star labelling programme, whose equipment is available in Europe and promoted by public authorities and their procurement practices. Furthermore, the Eco-design Directive introduces minimum efficiency standards for energy related equipment such as refrigerators, lamps, washing machines, television, etc. [
14].
Thus, even though the Directive covers individual equipment that is used in data centres, the overall efficiency of the facility is not guaranteed [
14]. Generally, there are no European policies that introduce specific mandatory efficiency requirements for data centres.
There are no recent estimations of the total energy consumption of the European data centre or of their energy efficiency. There are not many studies that investigate the energy performance and efficiency of data centres based on real data, and the existing ones have used much smaller datasets, estimations or are solely based on Koomey’s research in 2008 [
21]. Ni and Bai presented a review of different reports investigating the air conditioning energy performance of 100 data centres. Indicatively, one of the reports included in the review assessed 44 data centres around the world and presented an average Power Usage Effectiveness (PUE) of 2.29, whereas a second one assessed 23 facilities in Singapore of average PUE 2.07 [
10].
The aim of this paper is to evaluate, analyse and present the current trends in energy efficiency in data centres in the European Union using the data submitted by companies participating in the European Code of Conduct for Data Centre Energy Efficiency initiative.
The paper is organised as follow. Firstly, the Code of Conduct for Data Center programme is presented in
Section 2. Then, in
Section 3, the methodology is described.
Section 4 reports the main findings and results. Finally,
Section 5 presents the conclusion and the future work.
2. European Code of Conduct for Data Centre Energy Efficiency
To address complex energy efficiency issues, policy makers can establish either mandatory regulations or voluntary agreements. However, there are sectors that are especially difficult to regulate with many decision makers involved, thus the voluntary approach is generally preferred, especially between public authorities and private enterprises [
22].
The Codes of Conduct (CoC) are European voluntary programmes for the ICT sector that have been introduced since 2000. Currently, there are four CoC for ICT products in place: External Power Supplies, Digital TV Systems, Broadband Equipment and UPS. All the aforementioned Codes set specific efficiency requirements for specific products on a voluntary basis, but once a company participates, they have to meet the performance levels and report the energy consumption of their products annually. The fifth and most recent CoC for Data Centres employs the same strategy [
14]; however, it is not possible to set a minimum efficiency requirement for data centres, given the diversity of data centres and the different level of responsibilities; for example, some companies are only responsible for the infrastructure, while others are responsible for the IT equipment selection and operation [
14]. Therefore, it was decided that the key criteria for the Data Centre CoC was to ask participating companies to monitor their energy consumption and to adopt a set of established best practices [
19].
The EU Data Centre Code of Conduct is a voluntary initiative created in 2008 to limit the increase in energy consumption in data centres and thus to reduce the environmental, economic and energy security impacts [
23]. It is managed by the Joint Research Centre (JRC), the European Commission’s in-house science service. The aim is to inform data centre operators and owners to reduce energy consumption in a cost-effective manner and without hampering the critical function of data centres. In addition, it provides the platform to bring together European stakeholders to discuss and agree voluntary actions which will improve energy efficiency following European conditions such as the climate and energy markets regulations [
19].
The energy saving focus of the CoC covers the IT load, related to the IT equipment consumption in the facility, and the Facilities load, related to the mechanical and electrical systems that support the IT electrical load [
19]. Every year, data centres that have adopted innovative technologies to improve their energy efficiency and have demonstrated outstanding improvements are given the Code of Conduct Data Centre Award. The criteria for the winners are the reduced need for mechanical cooling of the data centre for most of the time and raised indoor temperature. These are among the most important measures to improve efficiency and reduce energy consumption.
The core of the programme is a registration form, signed by the Participant, through which they commit to conduct an initial energy audit to identify the major energy saving opportunities, prepare and submit an action plan and implement this plan according to the agreed timetable. Energy consumption must be monitored regularly to see overtime progress in the energy efficiency indicator related to the data centre. All Participants have the obligation to continuously monitor energy consumption and adopt energy management in order to look for continuous improvement in energy efficiency [
24]. One of the key objectives of the CoC is that each participant benchmark their efficiency overtime, using the CoC metric in order to produce evidence of continuous improvement in efficiency.
Each applicant completes a Reporting Form for each data centre; this form contains information about the data centre technical characteristics such as the capacity, size and construction year, energy and IT consumption data and the Best Practices that are already in place or that will be implemented in the near future. At least one-month measurements of energy consumption and IT data should be submitted for the extrapolation of the annual consumption of the facility [
24].
As stated in the CoC guidelines [
19], the facility energy shall be measured at the utility for a stand-alone data centre, or the data centre sub meter. IT energy consumption is measured at the UPS outputs, excluding Computer Room Air Conditioning (CRAC) units, etc. In addition to the energy consumption, optional reporting criteria are also included in the reporting form such as meters on individual parts of the data centre such as the chiller systems and the CRAC units. In addition, meters allowing the efficiency devices to be measured such as power to and from the UPS system [
19].
4. Results and Analysis
4.1. Findings
As shown in
Table 2, with the average statistical results of our study, the average PUE of the all approved sites is 1.80. All of them have submitted their electricity consumption and IT data, reported either on an annual or monthly basis (all the DC analysed have as input only electricity). In many cases, the energy entries do not cover the required 12-month reporting period, so the annual consumption was extrapolated based on the available data in order to calculate the PUE. Comparing to the previous analysis presented by Bertoldi in 2014 [
14], the total reported annual electricity consumption has risen by 0.5 TWh reflecting the larger number of data centres participating in the programme. The average floor area of the facilities as well as the average rated IT load has not changed significantly, indicating a general homogeneity of the sites throughout the reporting years. Interestingly, the average annual electricity consumption has decreased by more than 700 MWh, suggesting the adoption of better practices and more energy efficient systems.
As for the temperature and relative humidity (RH) set points, they have not changed greatly comparing to the 2014 analysis; the temperature set point range has become slightly wider, whereas the relative humidity window is now narrower. However, it was impossible to correlate those changes with the average PUE. In a future research, it would be interesting to monitor if the data centre operators comply with the ASHRAE thermal guidelines for higher operating temperatures within the facility.
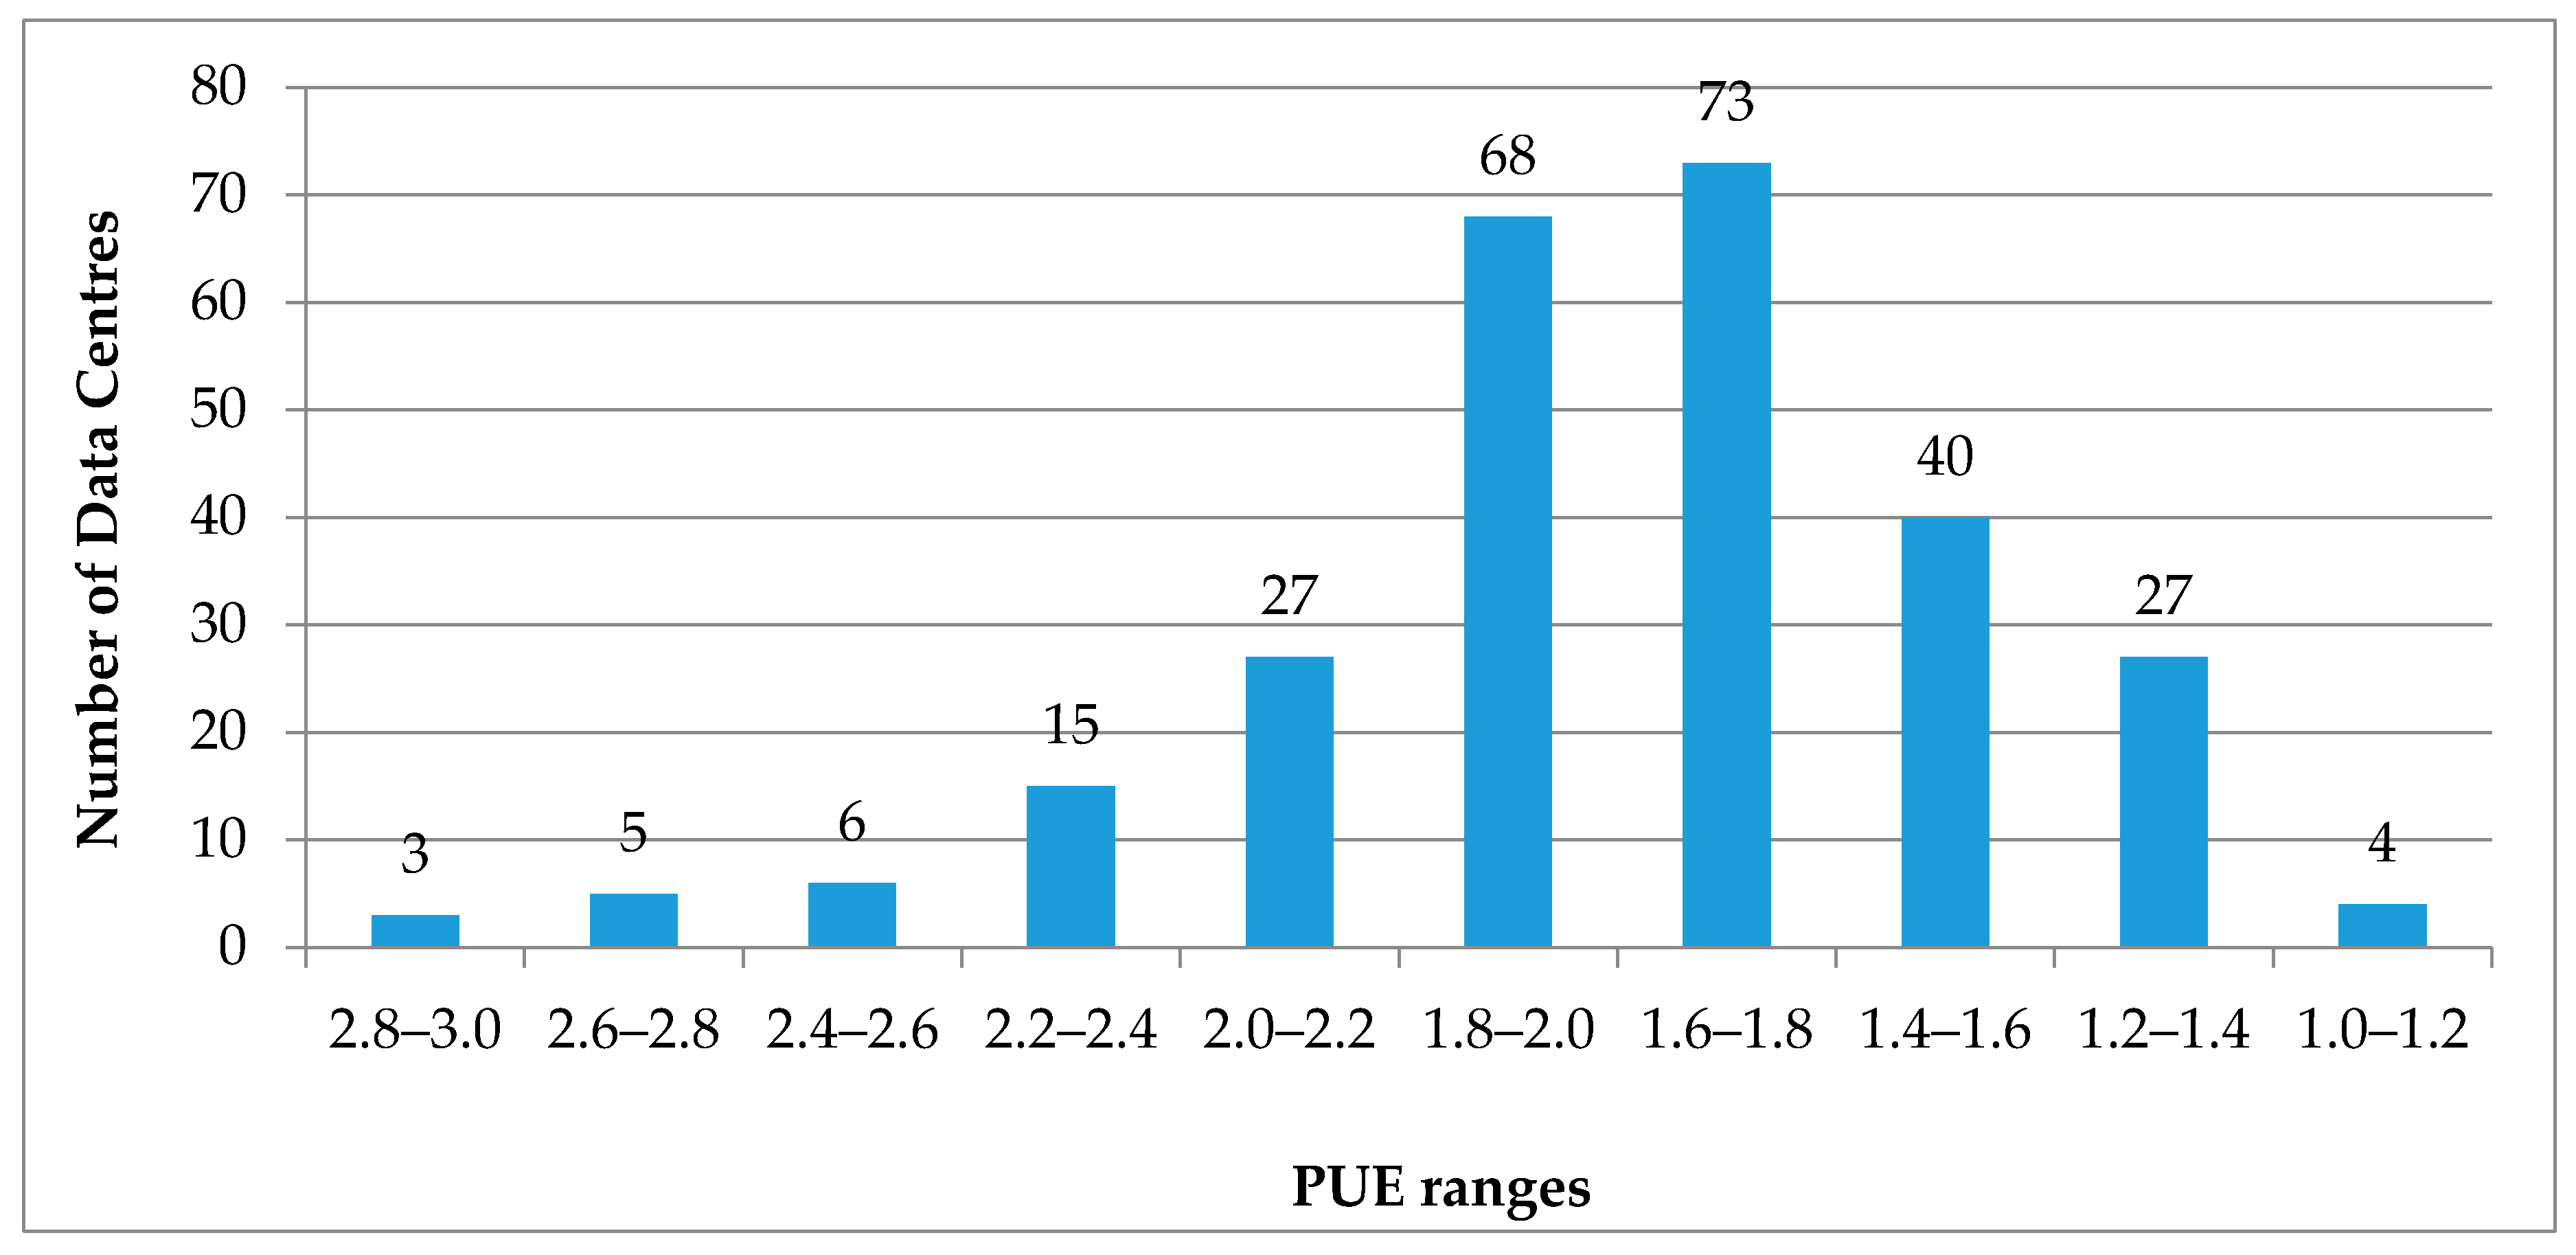
Figure 2 depicts the distribution of the PUE values, excluding the outliers; these are PUE values less than 1.0 and over 3.0. A value less than 1.0 is impossible and indicates higher IT consumption that the overall energy consumption of the facility, therefore incorrect data. On the other hand, values over 3.00, even though considered outliers to maintain cohesion in the dataset, may indicate newly-constructed facilities or old data centres with inadequately implemented or not yet in place energy efficient technologies and management. Therefore, the PUE values of 268 facilities were taken into consideration. There were 12 outliers in total: three incorrect entries with PUE < 1, and nine entries with PUE > 3. The remaining nine entries were reporting incorrectly, either with missing data or in a wrong way, for example energy and IT data from different reporting periods.
Overall, most of the facilities have reported an average PUE of 1.6–1.8, followed by the 1.8–2.0 range. In addition, there are four sites that reported excellent efficiencies between 1.1 and 1.2. All four of them are located in the UK and Northern Europe, and were constructed between 1986 and 2012. There does not seem to be a pattern, since all facilities have different technical and operational characteristic such as data centre type, size, capacity, and economizer systems.
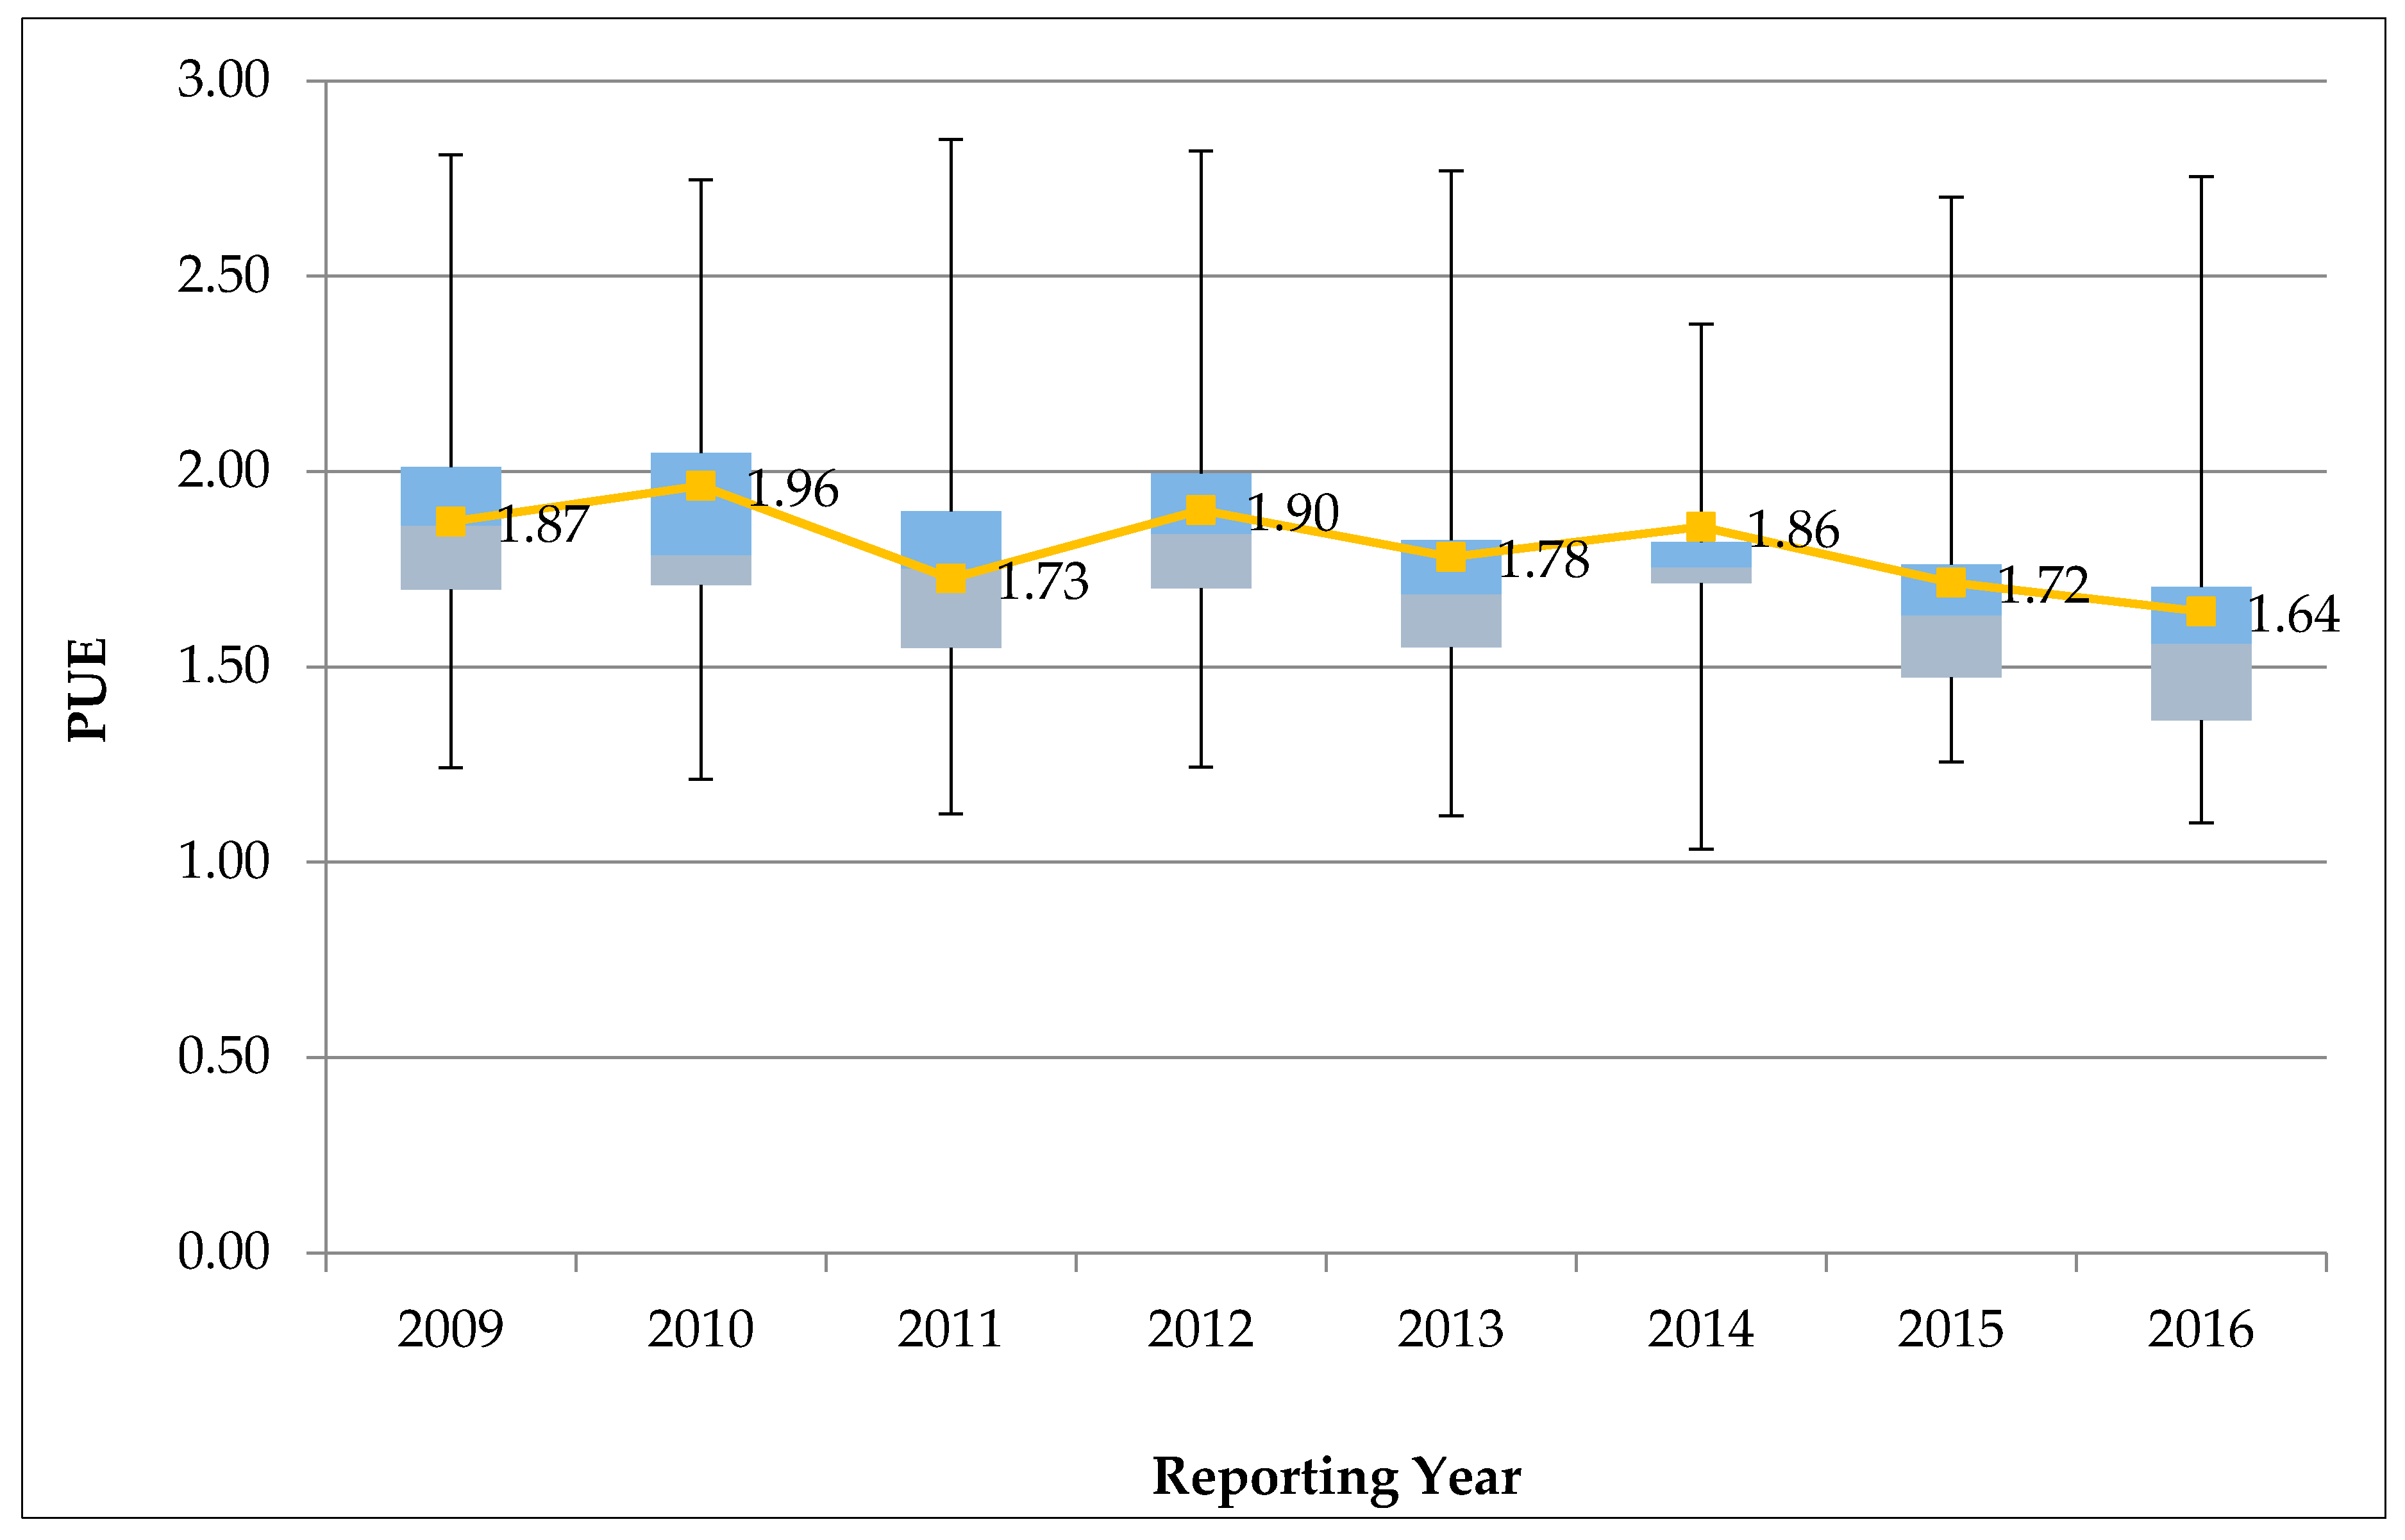
Figure 3 illustrates the fluctuations of the average PUE annual estimations throughout the reporting years, from 2009 when the first data centres were approved and submitted their energy data until the time of writing, end of 2016. The chart also shows the range of values that were calculated for each year.
There is a clear declining trend ranging from the 1.96 which is the higher average PUE in 2010 to 1.64 in 2016. However, not all facilities have submitted reliable energy data, so the average PUE was estimated taking into account a slightly reduced sample of data centres. To be precise, out of the approved data centres, there were very few that submitted contradicting energy data, and these were not taken into account for the PUE calculation. It is noteworthy that all the average PUE values throughout the years are less than 2.00. All data are self-reported by the site operators, and, in some cases, there are either missing figures or figures that indicate a PUE less than 1, which is impossible by definition according to [
28,
30,
32]. The declining PUE trend can be attributed to more efficient and advanced cooling technologies and will be investigated in comparison to the types of economisers used and other parameters such as the location of the data centres.
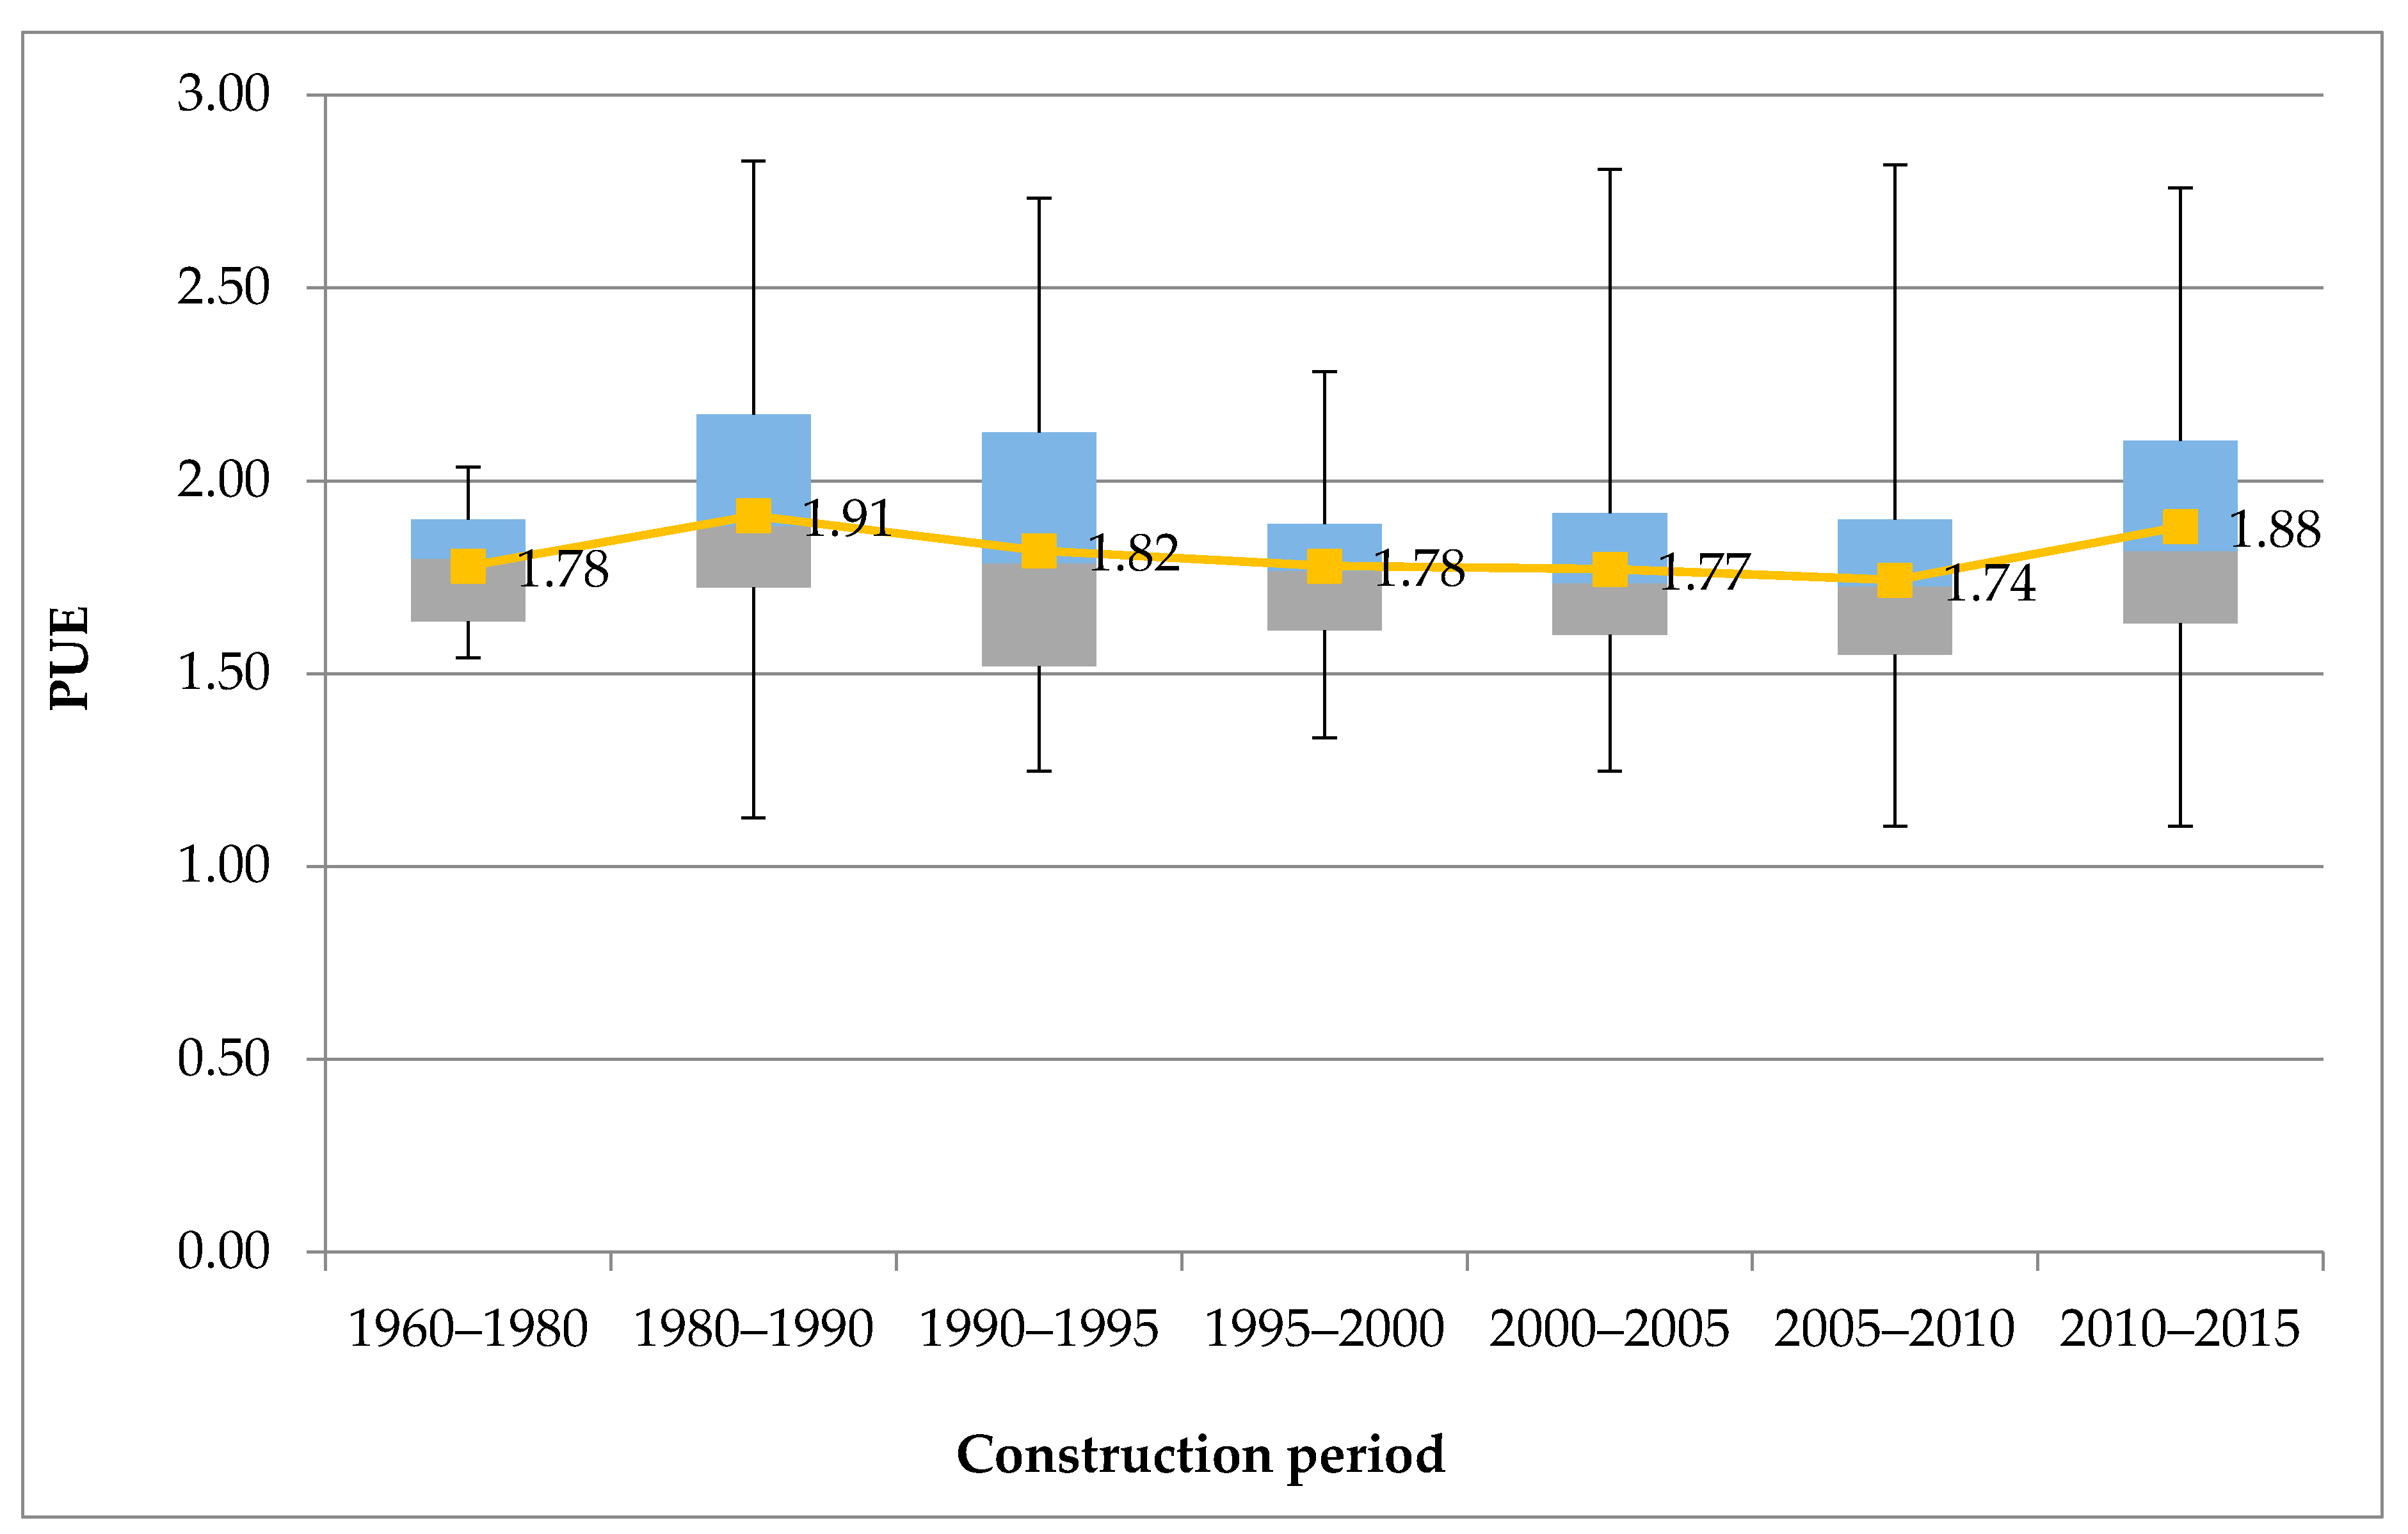
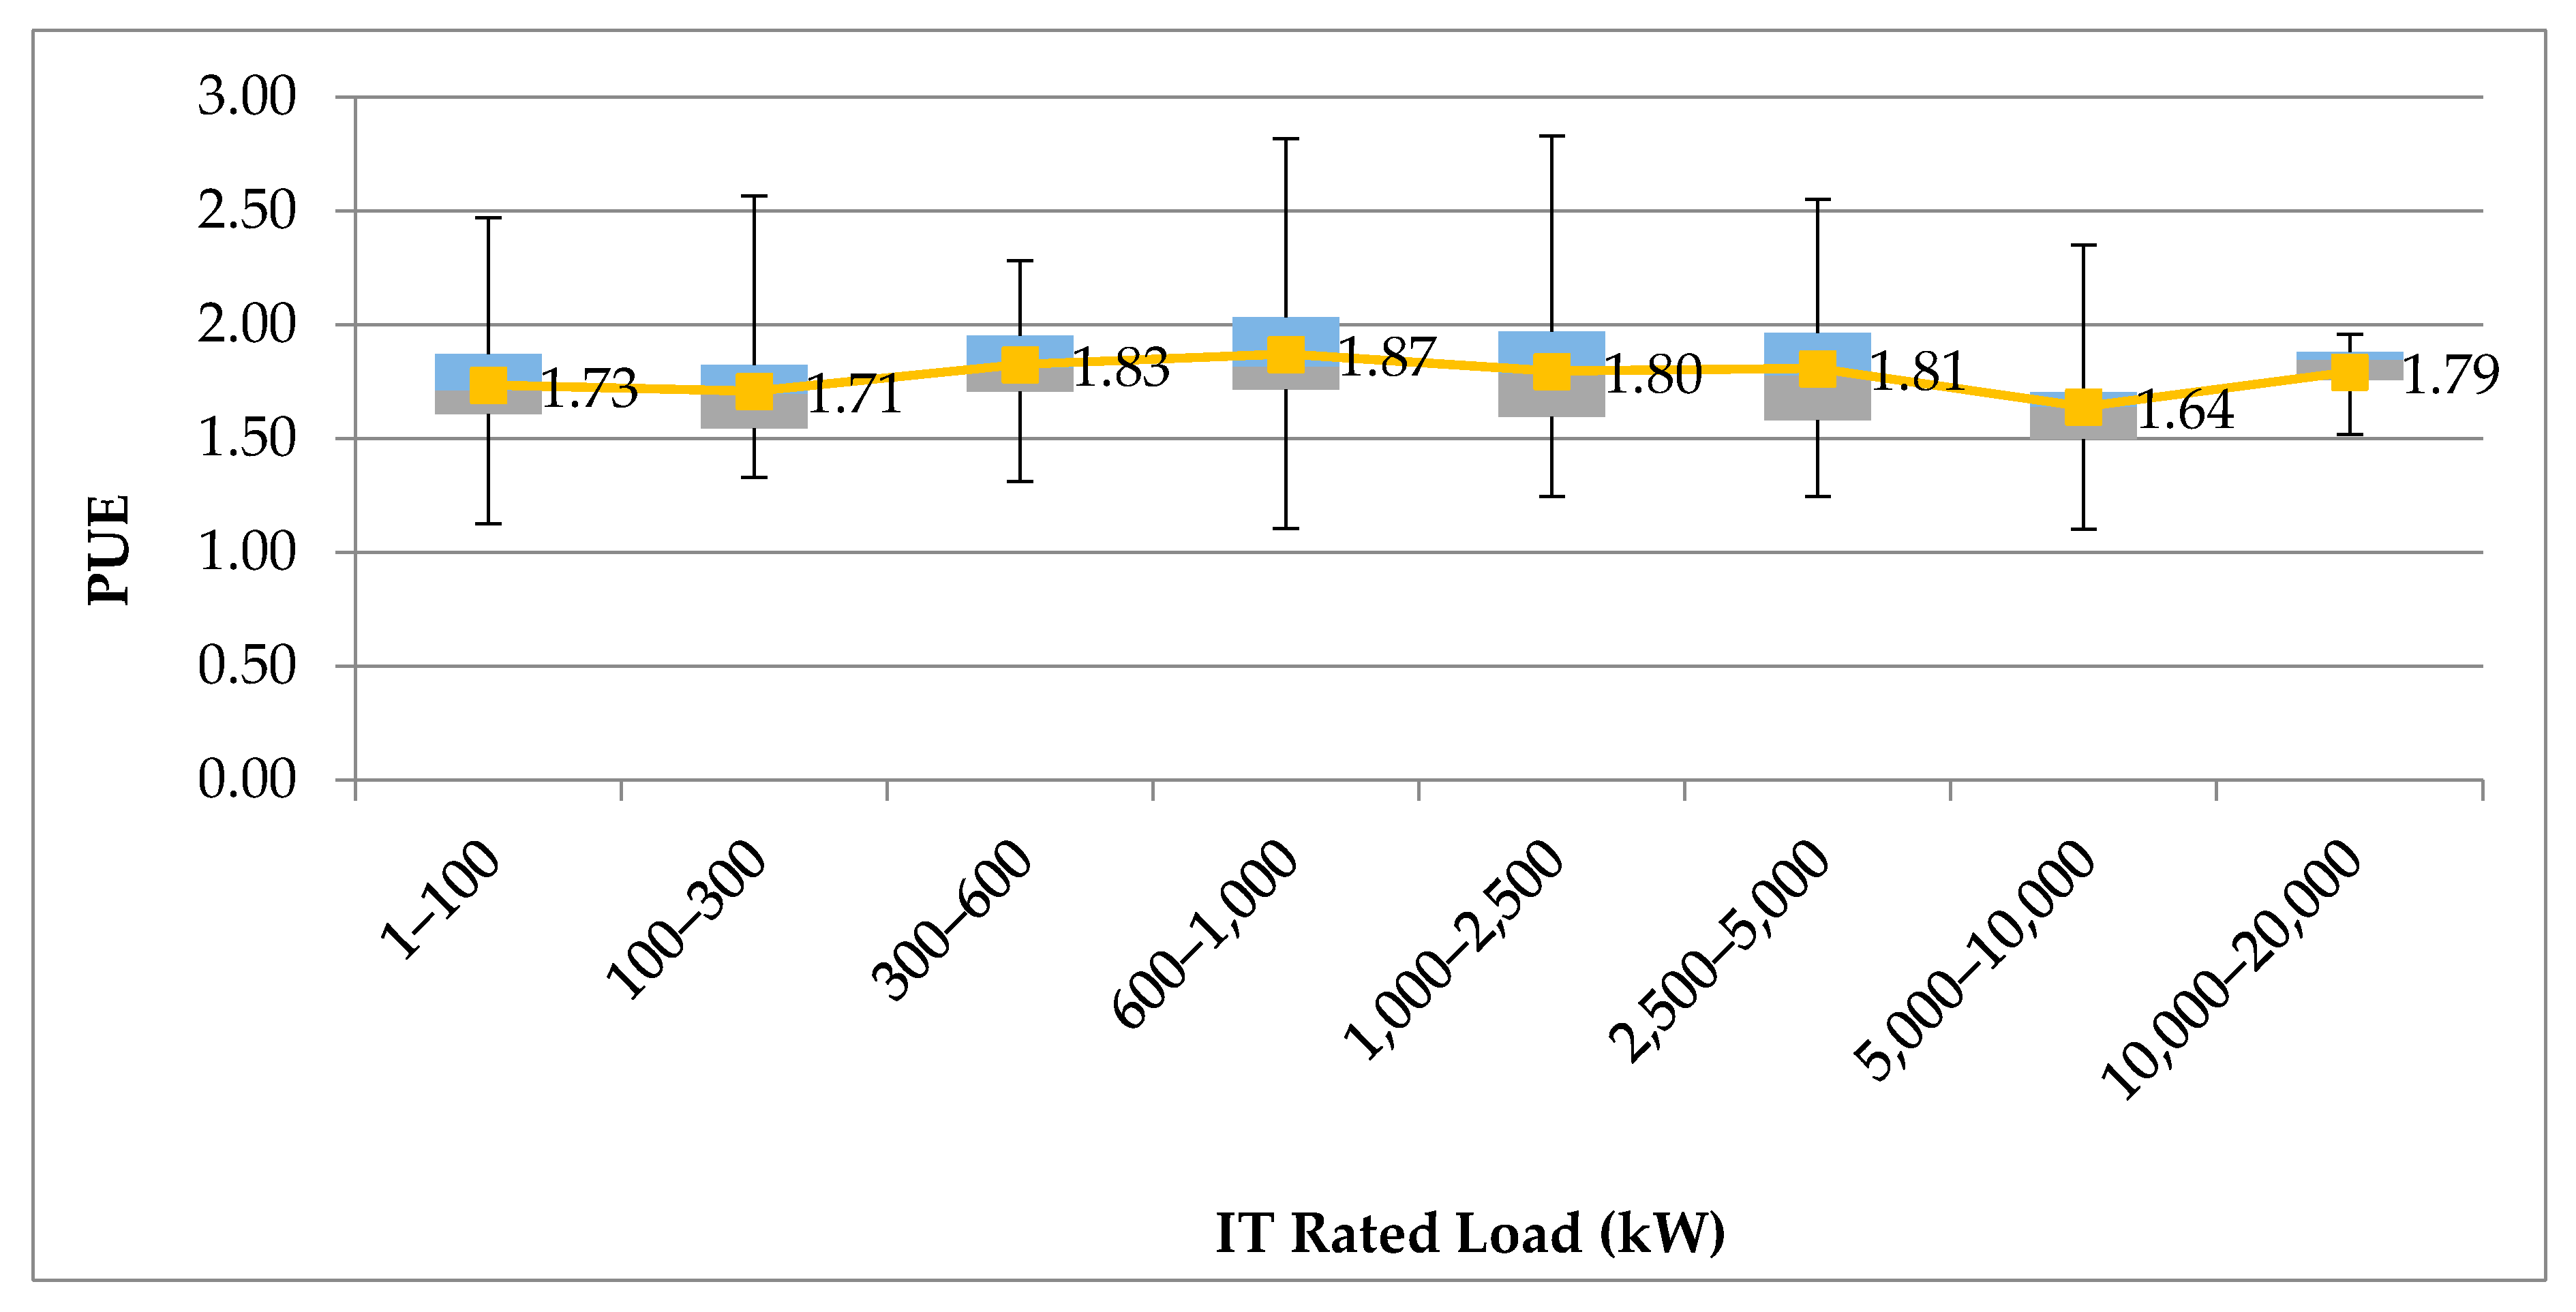
Figure 4,
Figure 5 and
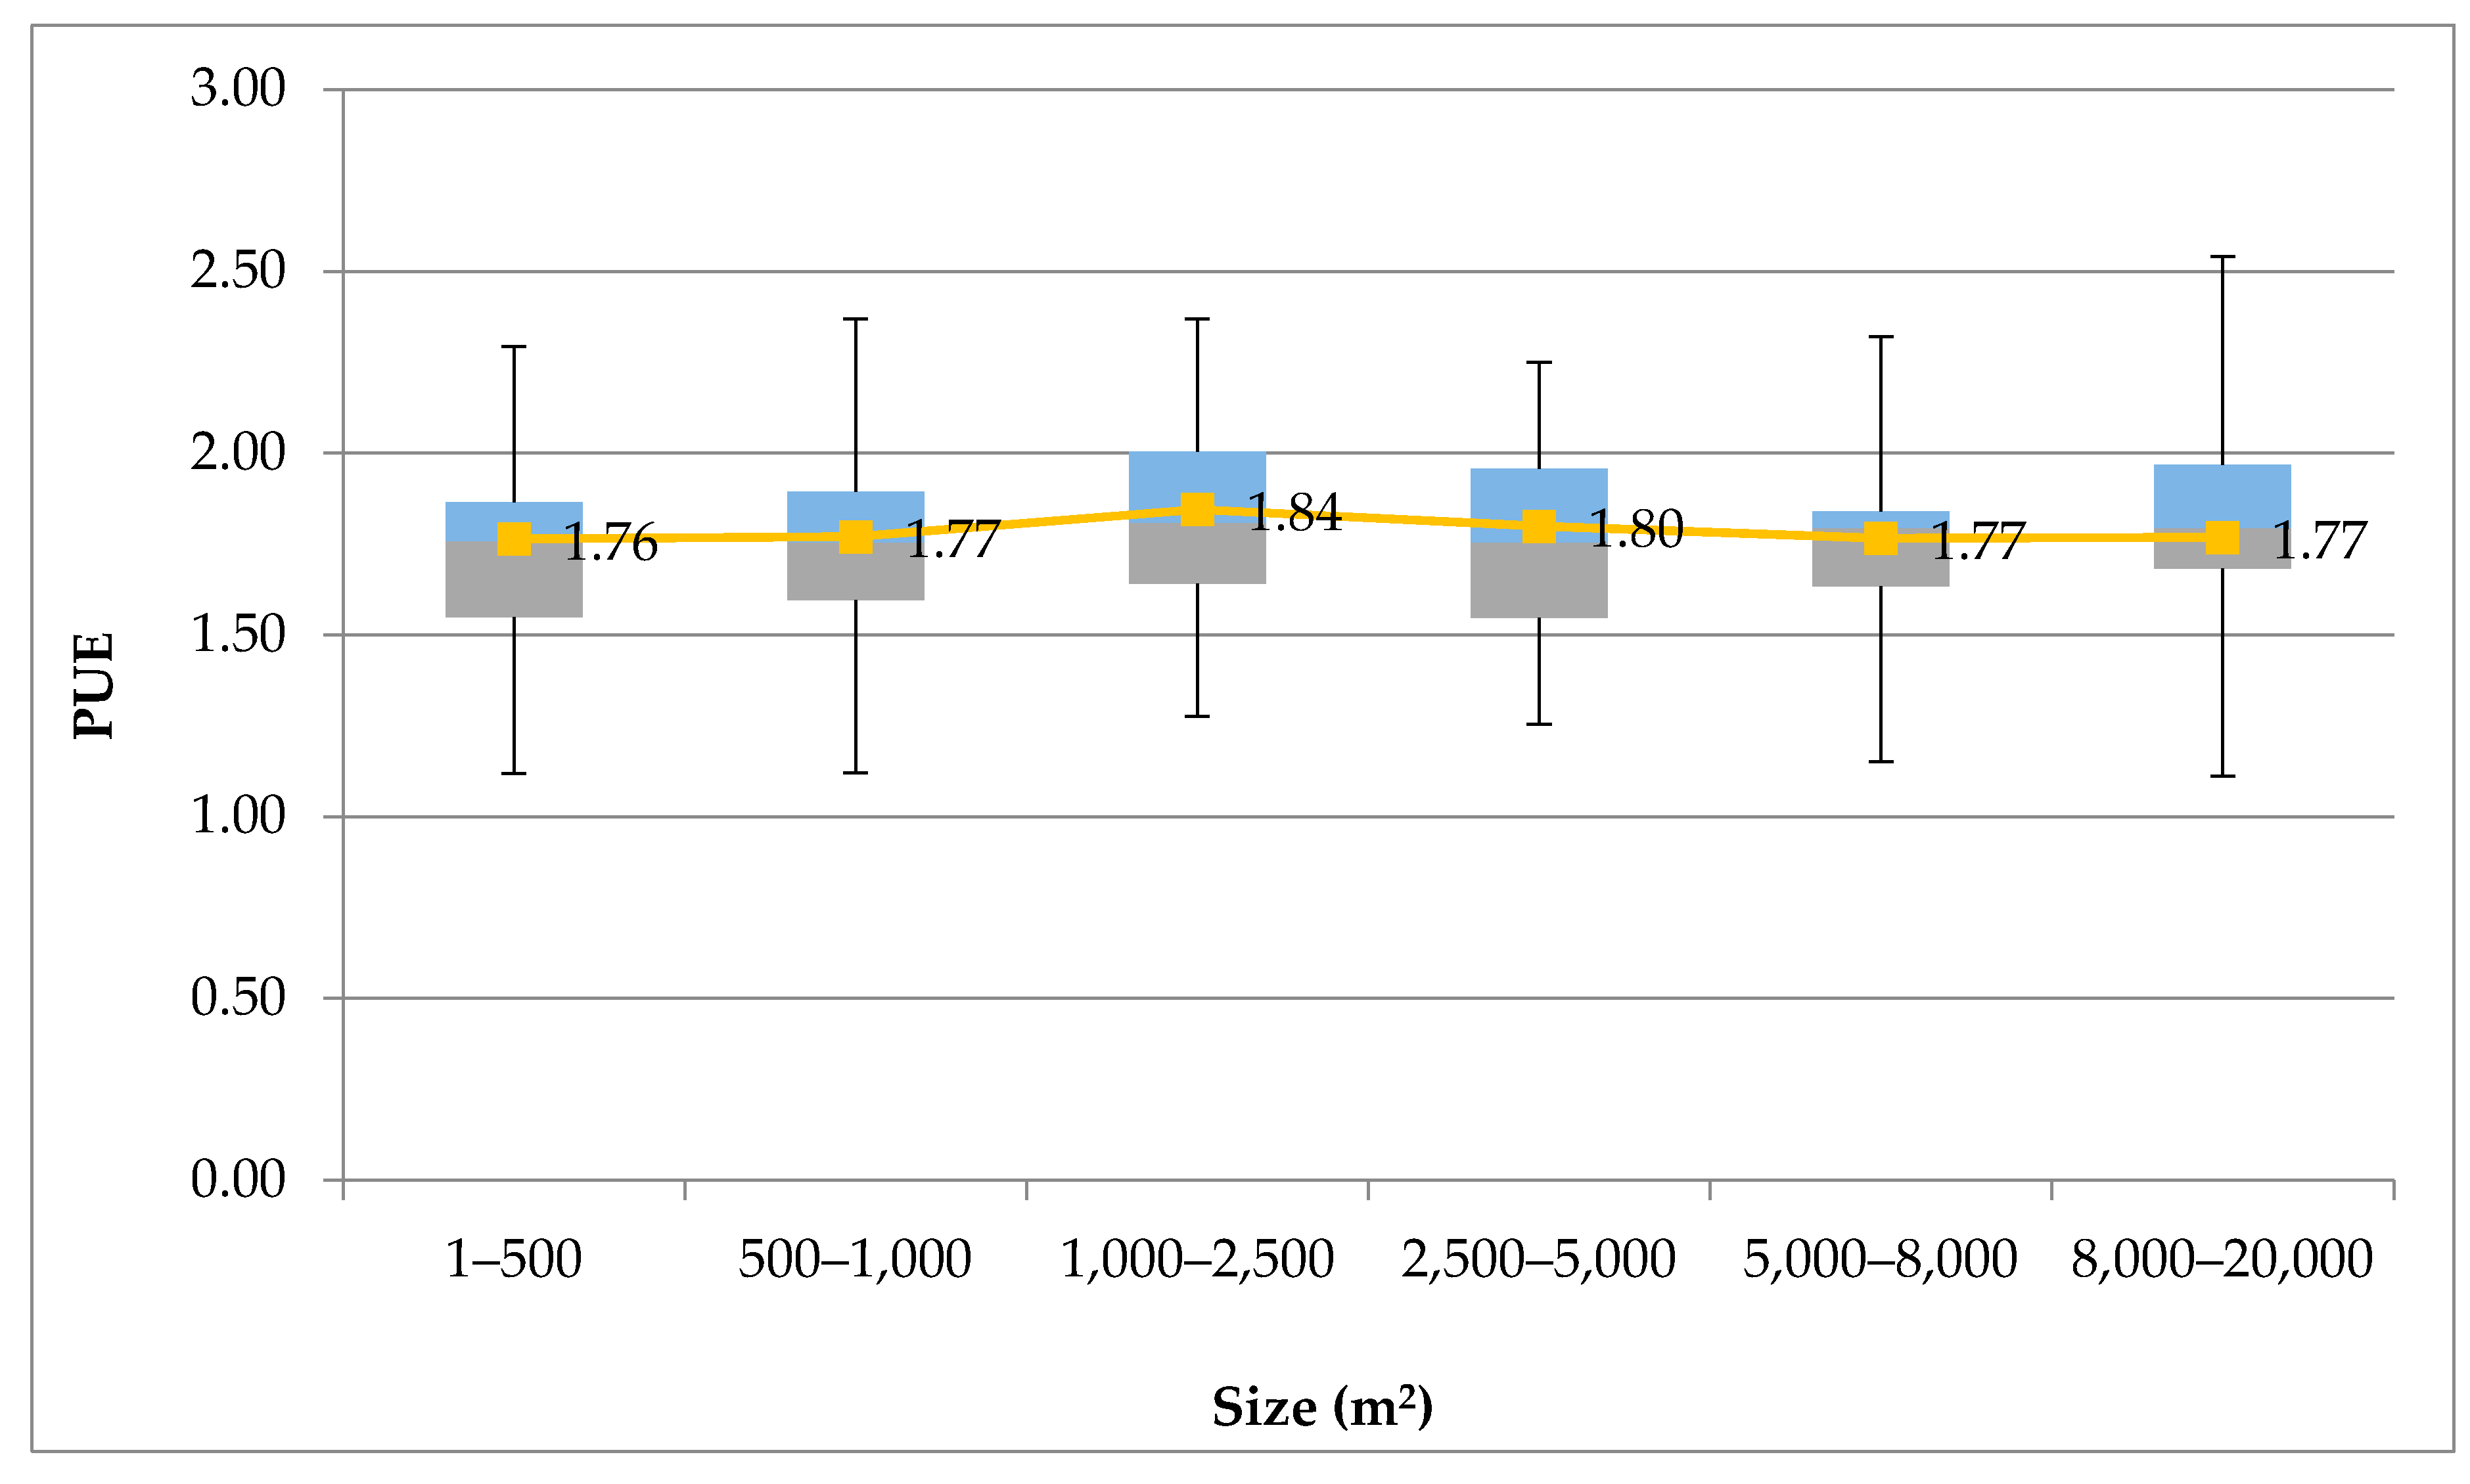
Figure 6 below demonstrate the correlation between average PUE and the data centre size, age of the facility and IT capacity, respectively.
More than half of the data centres participating in the CoC contain server room between 1000 and 5000 m
2, each and can be classified as medium sized. However, the statistical analysis shows (see
Figure 4) that the medium sized sites perform slightly worse that the smaller or bigger facilities, reaching a PUE value of 1.84, comparing 1.77 of the other size categories.
In addition, as indicated in
Figure 5, the facilities that were built between 2005 and 2010 appear to be more efficient, comparing to older buildings or even those build within the last five-year period that show an important decline in efficiency. It is interesting to note that most of the participating facilities fall under this age category. The low PUE values of the older data centres are not statistically reliable due to the very small number of facilities that were constructed during that period. Since the 1980s, the PUE has improved due to the energy efficiency measures.
Finally, IT rated load is the peak power that can be provided to the IT equipment, measured in kW. The analysis shows that sites with 5–10 MW IT rated load appear to perform better than the rest, followed by the 0.1–0.3 MW sites. However, the intense fluctuations suggest that the IT capacity has no actual impact on the efficiency of the facility.
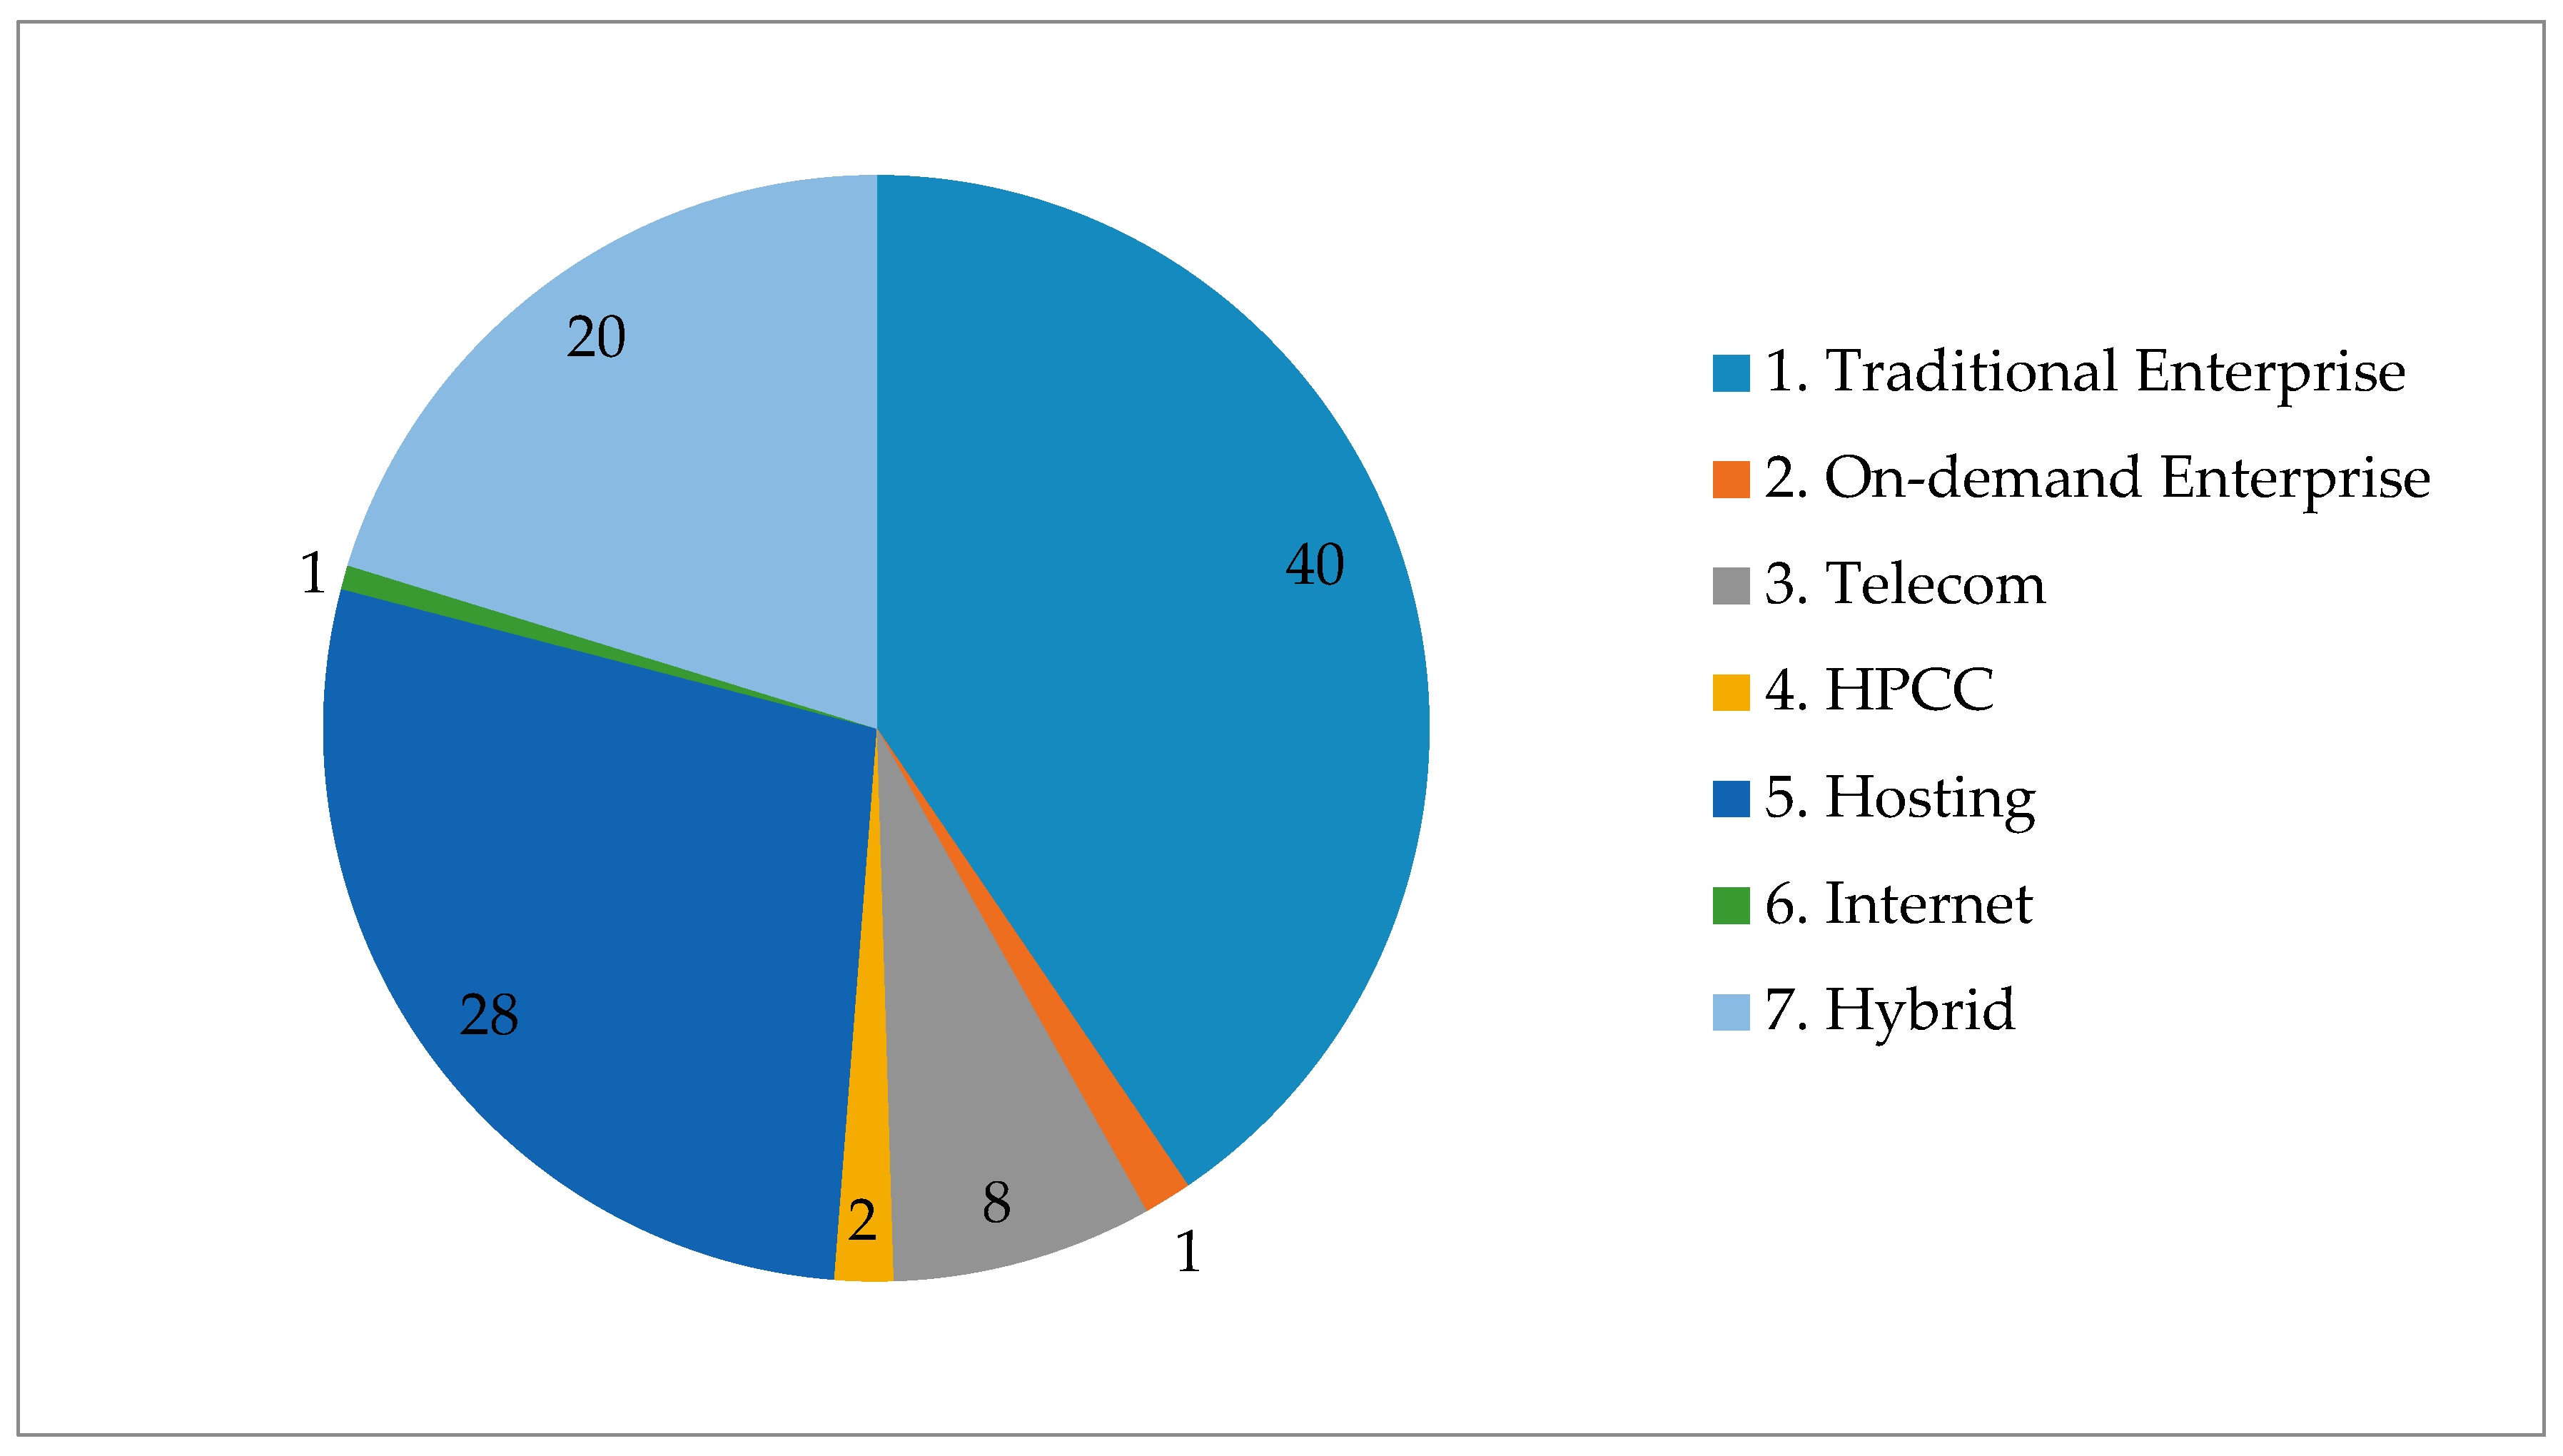
4.2. Sector Distribution Analysis
The Code of Conduct distinguishes between seven different types of data centres [
25], as already described in
Section 3.1: traditional enterprise, on demand enterprise, telecom switching centre, high performance computing, hosting, internet providers and hybrid DC (combination of two or more types).
Figure 7 illustrates the distribution of the data centres by the types of sectors. It is observed that more than one third of the reporting facilities belong to the Traditional Enterprise type. In this type of business model, the ownership of the facility, IT equipment and software systems are common [
7]. The hosting sector comes second followed by the hybrid. In a hosting type of facility, the ownership and the IT equipment is common but the software systems are run by others [
7]. In addition, the majority of the data centres (approximately 61%) are stand-alone facilities.
4.3. Geographical Distribution Analysis
Weather parameters such as the ambient temperature and relative humidity can have a significant impact on the energy consumption. A data centre located in an area with high temperatures and humidity is expected to consume more energy, as the cooling system will be working harder to maintain stable operating conditions within the facility.
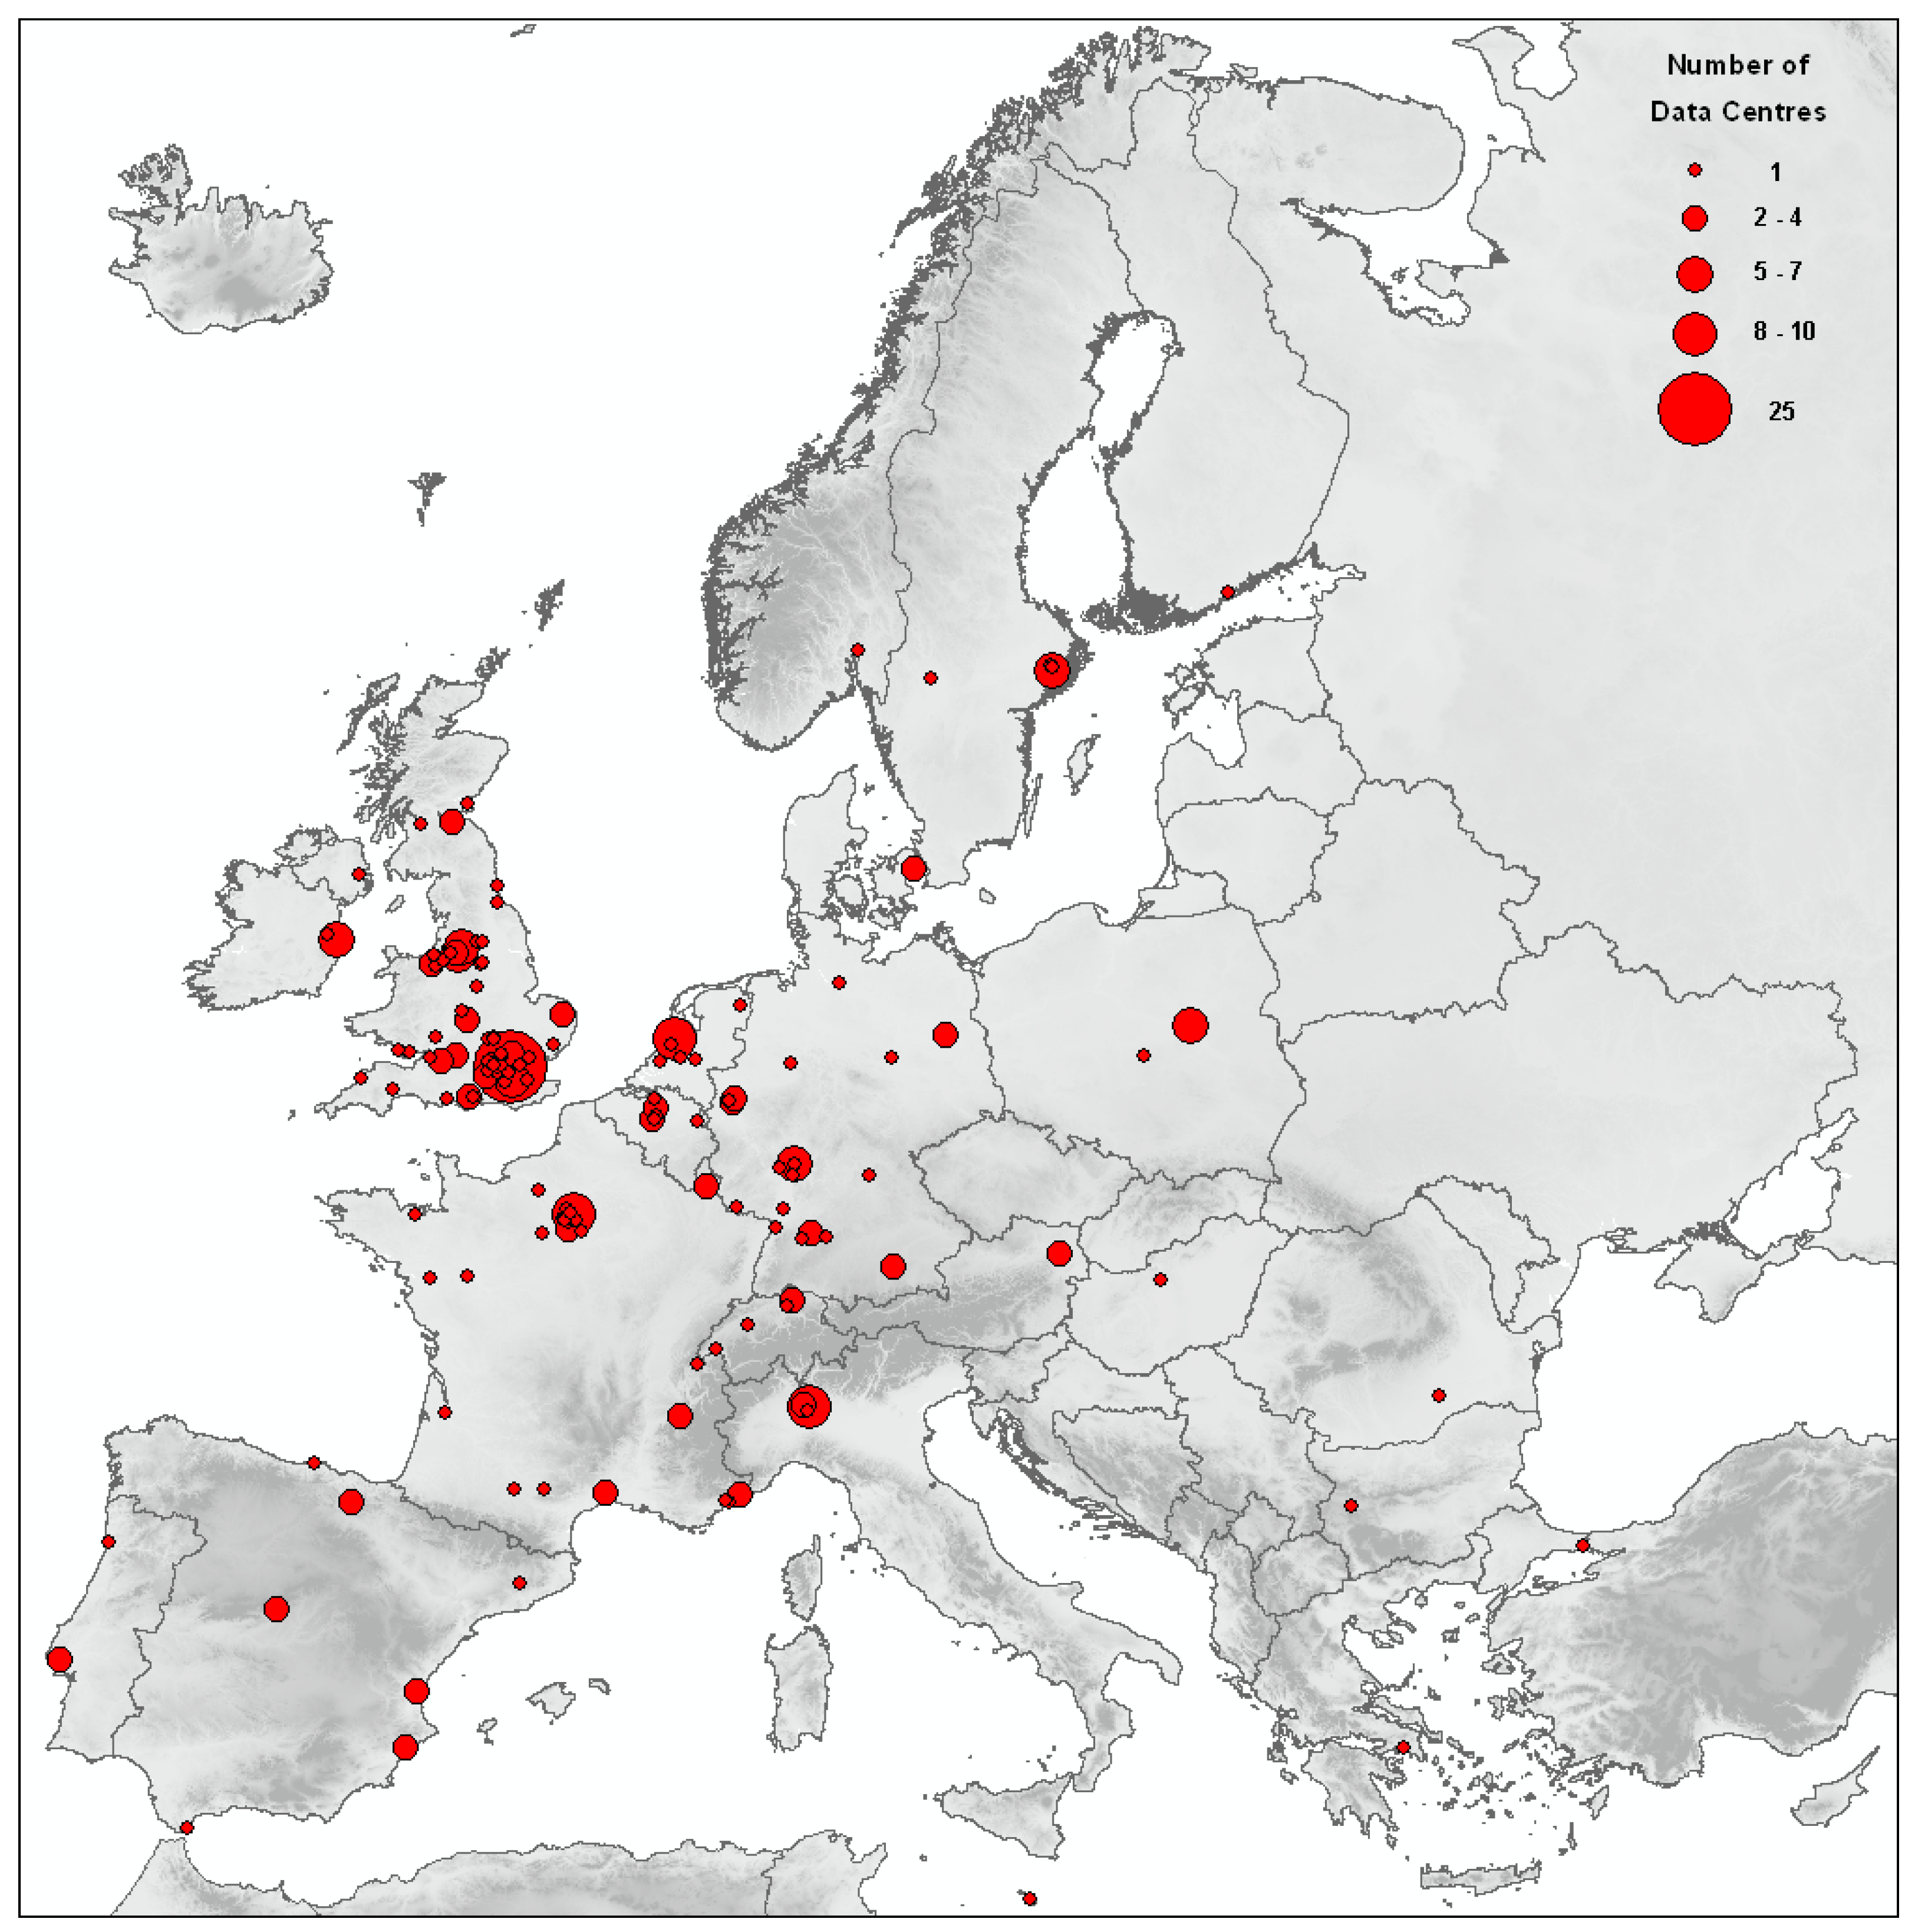
Table 3 shows the distribution of the data centres of our database in Europe by geographical location. The results were split into five different zones: The Nordic zone, the UK and Ireland zone, the Northern/Central European zone, the Southern European/Mediterranean zone and finally the Non-European zone. The last one is not assessed against the others or included further into the analysis, since the available data are not adequate and comparable.
The Nordic countries and the countries of Continental Europe appear to be the most efficient in terms of power effectiveness. This can be explained by the advanced technological progress in the sector as well as by the cold climate conditions that reduce the cooling energy demands of the facilities. The Nordic market, comprising Norway, Sweden, Denmark, Finland and Iceland, takes advantage of the plentiful renewable energy sources such as hydropower and thermal power [
34].
On the other hand, the data centres located in countries of the European South have an average PUE value of 2.0, a figure that can be attributed to the warmer and humid climate.
The countries in Northern and Central Europe achieve low PUE values similar to the Nordic countries. Considering that three out of the four biggest data centre markets are located in Frankfurt, Paris and Netherlands, and the high number of sites in the Central European category, there are more data to support this assumption comparing to the lower number of sites in Scandinavia and Mediterranean countries. Finally, London is the biggest data centre market in Europe and Dublin is one of the newly emerging markets, with many US companies building data centres there. This fact explains the high number of data centres in that zone.
Depoorter et al. [
35] claim that the ideal climate zones are the mixed-humid and warm-marine zones, in comparison to zones with lower dew point temperatures such as the very cold or cold dry zones, since the power and water consumed by the humidification system in sites in such locations are not insignificant. A specific analysis, normalising the DC efficiencies (PUE) in relation to their location climatic conditions (e.g., Degree Days), will be conducted in a future study in order to quantify the impact this geographical factor on DC energy consumption.
4.4. Free Cooling Technologies
Free cooling, also known as economizer cycle, takes advantage of the outside dry and cool climate conditions in order to reduce cooling costs through the refrigeration compressor workload reduction required to operate the chillers [
9]. When the ambient temperature is sufficiently lower than the facility temperature, the heat naturally flows to the outside without the use of vapour-compression refrigeration system, offering significant energy savings [
30]. Economised cooling can be retrofitted to some facilities. Where refrigeration plant can be reduced in size (or eliminated), operating and capital costs are reduced, including that of supporting electrical infrastructure [
36]. Generally, the air-side economizers are used in data centres located in places with cold and dry weather conditions but are not suitable for hot and humid areas [
9].
Newcombe et al. [
37] present the four prevailing types of free cooling technologies that operate in the facilities, either individually or, more often, combined. These are also described in the CoC Best Practices supplementary document [
23] that is discussed in
Section 4.5.
Direct Air (DA) free cooling: External air is used to cool the facility. Refrigeration systems are present to deal with humidity and high external temperatures if necessary. Exhaust air is re-circulated and mixed with intake air to control supply air temperature and humidity.
Indirect Air (IA) free cooling: Re-circulated air within the facility is primarily passed through an air to air heat exchanger against external air (may have adiabatic cooling) to remove heat to the atmosphere.
Direct Water (DW) free cooling: Chilled water cooled by the external ambient air via a free cooling coil. This may be achieved by dry coolers or by evaporative assistance through spray onto the dry coolers.
Indirect Water (IW) free cooling: Chilled water is cooled by the external ambient conditions via a heat exchanger which is used between the condenser and chilled water circuits. This may be achieved by cooling towers or dry coolers, the dry coolers might have evaporative assistance through spray onto the coolers.
It is worth mentioning that some of the facilities use desiccant cooling techniques (i.e., Kyoto wheels) as an alternative mechanical system type apart from direct expansion (DX) and water chillers as an additional cooling technique in addition to the economizers. A desiccant cooling system includes a rotating wheel that can be up to six meters in diameter and picks up the heat from the data centre while rotating and releases it to the cooler outside environment as it completes the rotation. The warm air is evacuated with the use of fans [
38].
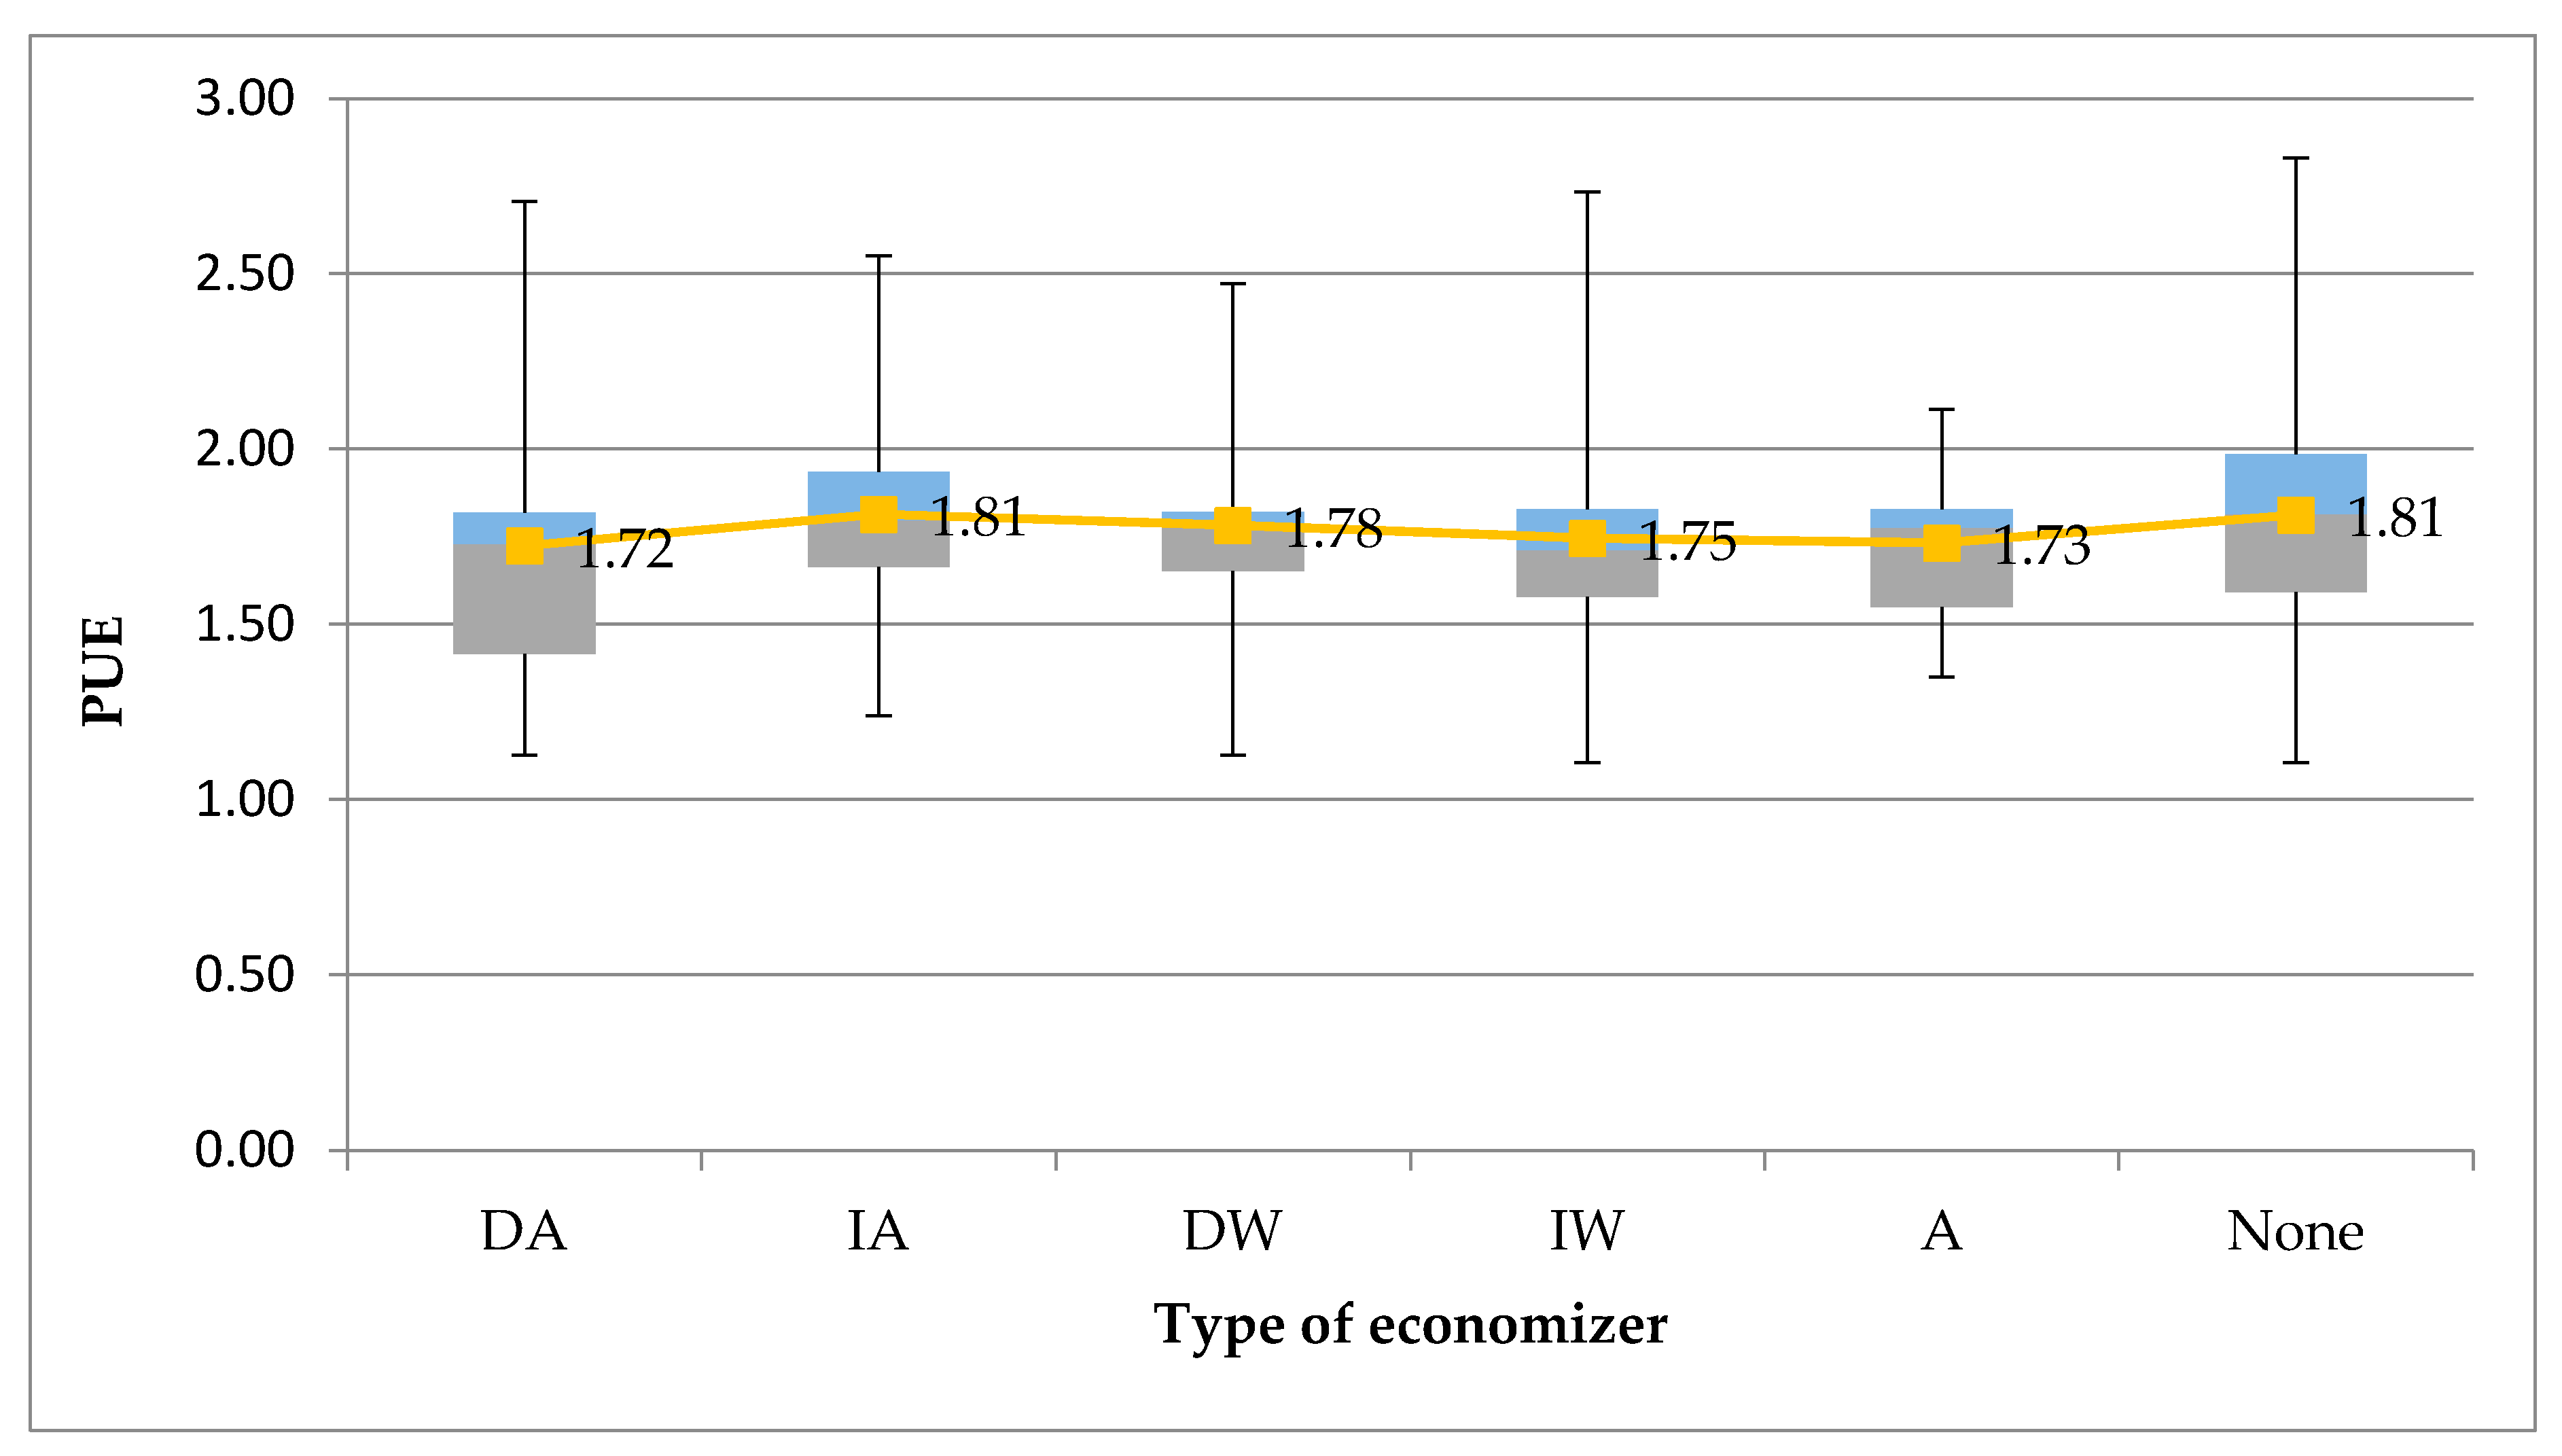
In total, 170 the data centres analysed in this report (59%) have no free cooling system in place. However, the use of a free cooling system is not mandatory. In addition, 41 data centres use a combination of at least two free cooling technologies, and 78 data centres make use of only one type.
Figure 8 shows that the facilities that use four out of five economiser technologies described in the CoC achieve an average PUE between 1.75 and 1.89. The fifth type, “adsorption and other sorption techniques” (A), has been reported by only one data centre, so it will not be taken into consideration as an outlier. The graph shows that the most efficient cooling technology is the Indirect Water (IW) type, since the average PUE is the lowest and the minimum PUE reported is 1.10 which is the closest to ideal of 1.0, but the range of PUE is wider comparing to the others. On the other hand, Direct Water (DW) technique shows a narrower range of PUE values. It is noted that even some of the data centres that do not use free cooling or have not reported such data, have achieved very low PUE. Generally the PUE range of this group of data centres is the widest, with a facility reporting a PUE as low as 1.1.
4.5. Best Practices
The Best Practices document is a supplement to the Code of Conduct that provides information and support for data centre operators regarding measures to improve the energy efficiency requirements of their facilities.
Although not directly related to energy efficiency improvements, this document underlines also the importance of the use of energy supplied from alternative and sustainable energy sources (e.g., photovoltaic, wind power, shared-generation using biomass/bio-fuel, etc.); the use of renewable energies, even though it does not improve the energy efficiency (i.e., PUE), helps to reduce the overall data centres carbon foot print (i.e., associated CO2 emissions) and improve their sustainability.
A subgroup of practices identifies the minimum expected level of energy saving activity that is required to be granted the Participant status. These practices are divided into five categories and each is signified by a different colour in the CoC registration form (see
Table 4). Not all operators are able to implement all the expected practices due to physical, financial and other kind of constraints. In these cases, an explanation is provided describing the type of constraint, and if possible, recommending alternative practices as replacements aiming to the same energy savings [
23]. A number of practices are implemented in the vast majority of the reporting sites, some of them up to 96–97% of the total number of the data centres. For instance, approximately 97.2% of the facilities publish periodic, automatically-produced reports on energy consumption and environmental ranges, including the determination of PUE over the reporting period. Most of these practices require low capital expenditure or minimal changes to business practices, thus are considered “low-hanging fruit”.
On the other hand, there are practices that are implemented by less than 1% of the total number of the data centres. In fact, most of them were introduced in the latest version of the Best Practices Guidelines, published by the JRC in 2016 [
23]. Thus, it remains to be seen in a future study if the new data centres will adopt the new practices. In addition, there are no practices that have been implemented by all 288 sites.
It is also worth mentioning that each of the new versions of the guidelines contains a few changes. In some cases the numbering has changed and depending on the year of reporting the wording might be different. More specifically,
Section 5 that refers to the cooling system demonstrates significant changes in the practices numbering between the 2014–2015 editions, along some crucial differences in the type of free-cooling technologies. It must also be taken into consideration that the free cooling best practices are not yet classified as mandatory or minimum expected, and none of the new technologies introduced in the 2015 version has been implemented so far by the reporting facilities.
The analysis shows that all 288 sites have implemented best practices since the beginning of the programme, albeit in different numbers. This is expected, since each version of the Best Practices guidelines contains a different number of mandatory or minimum-expected guidelines comparing to the previous one. The 2016 version incorporates 152 practices in total, 81 of which are characterised as minimum expected. New practices are added to the expected list in each version and others are replaced or amended.
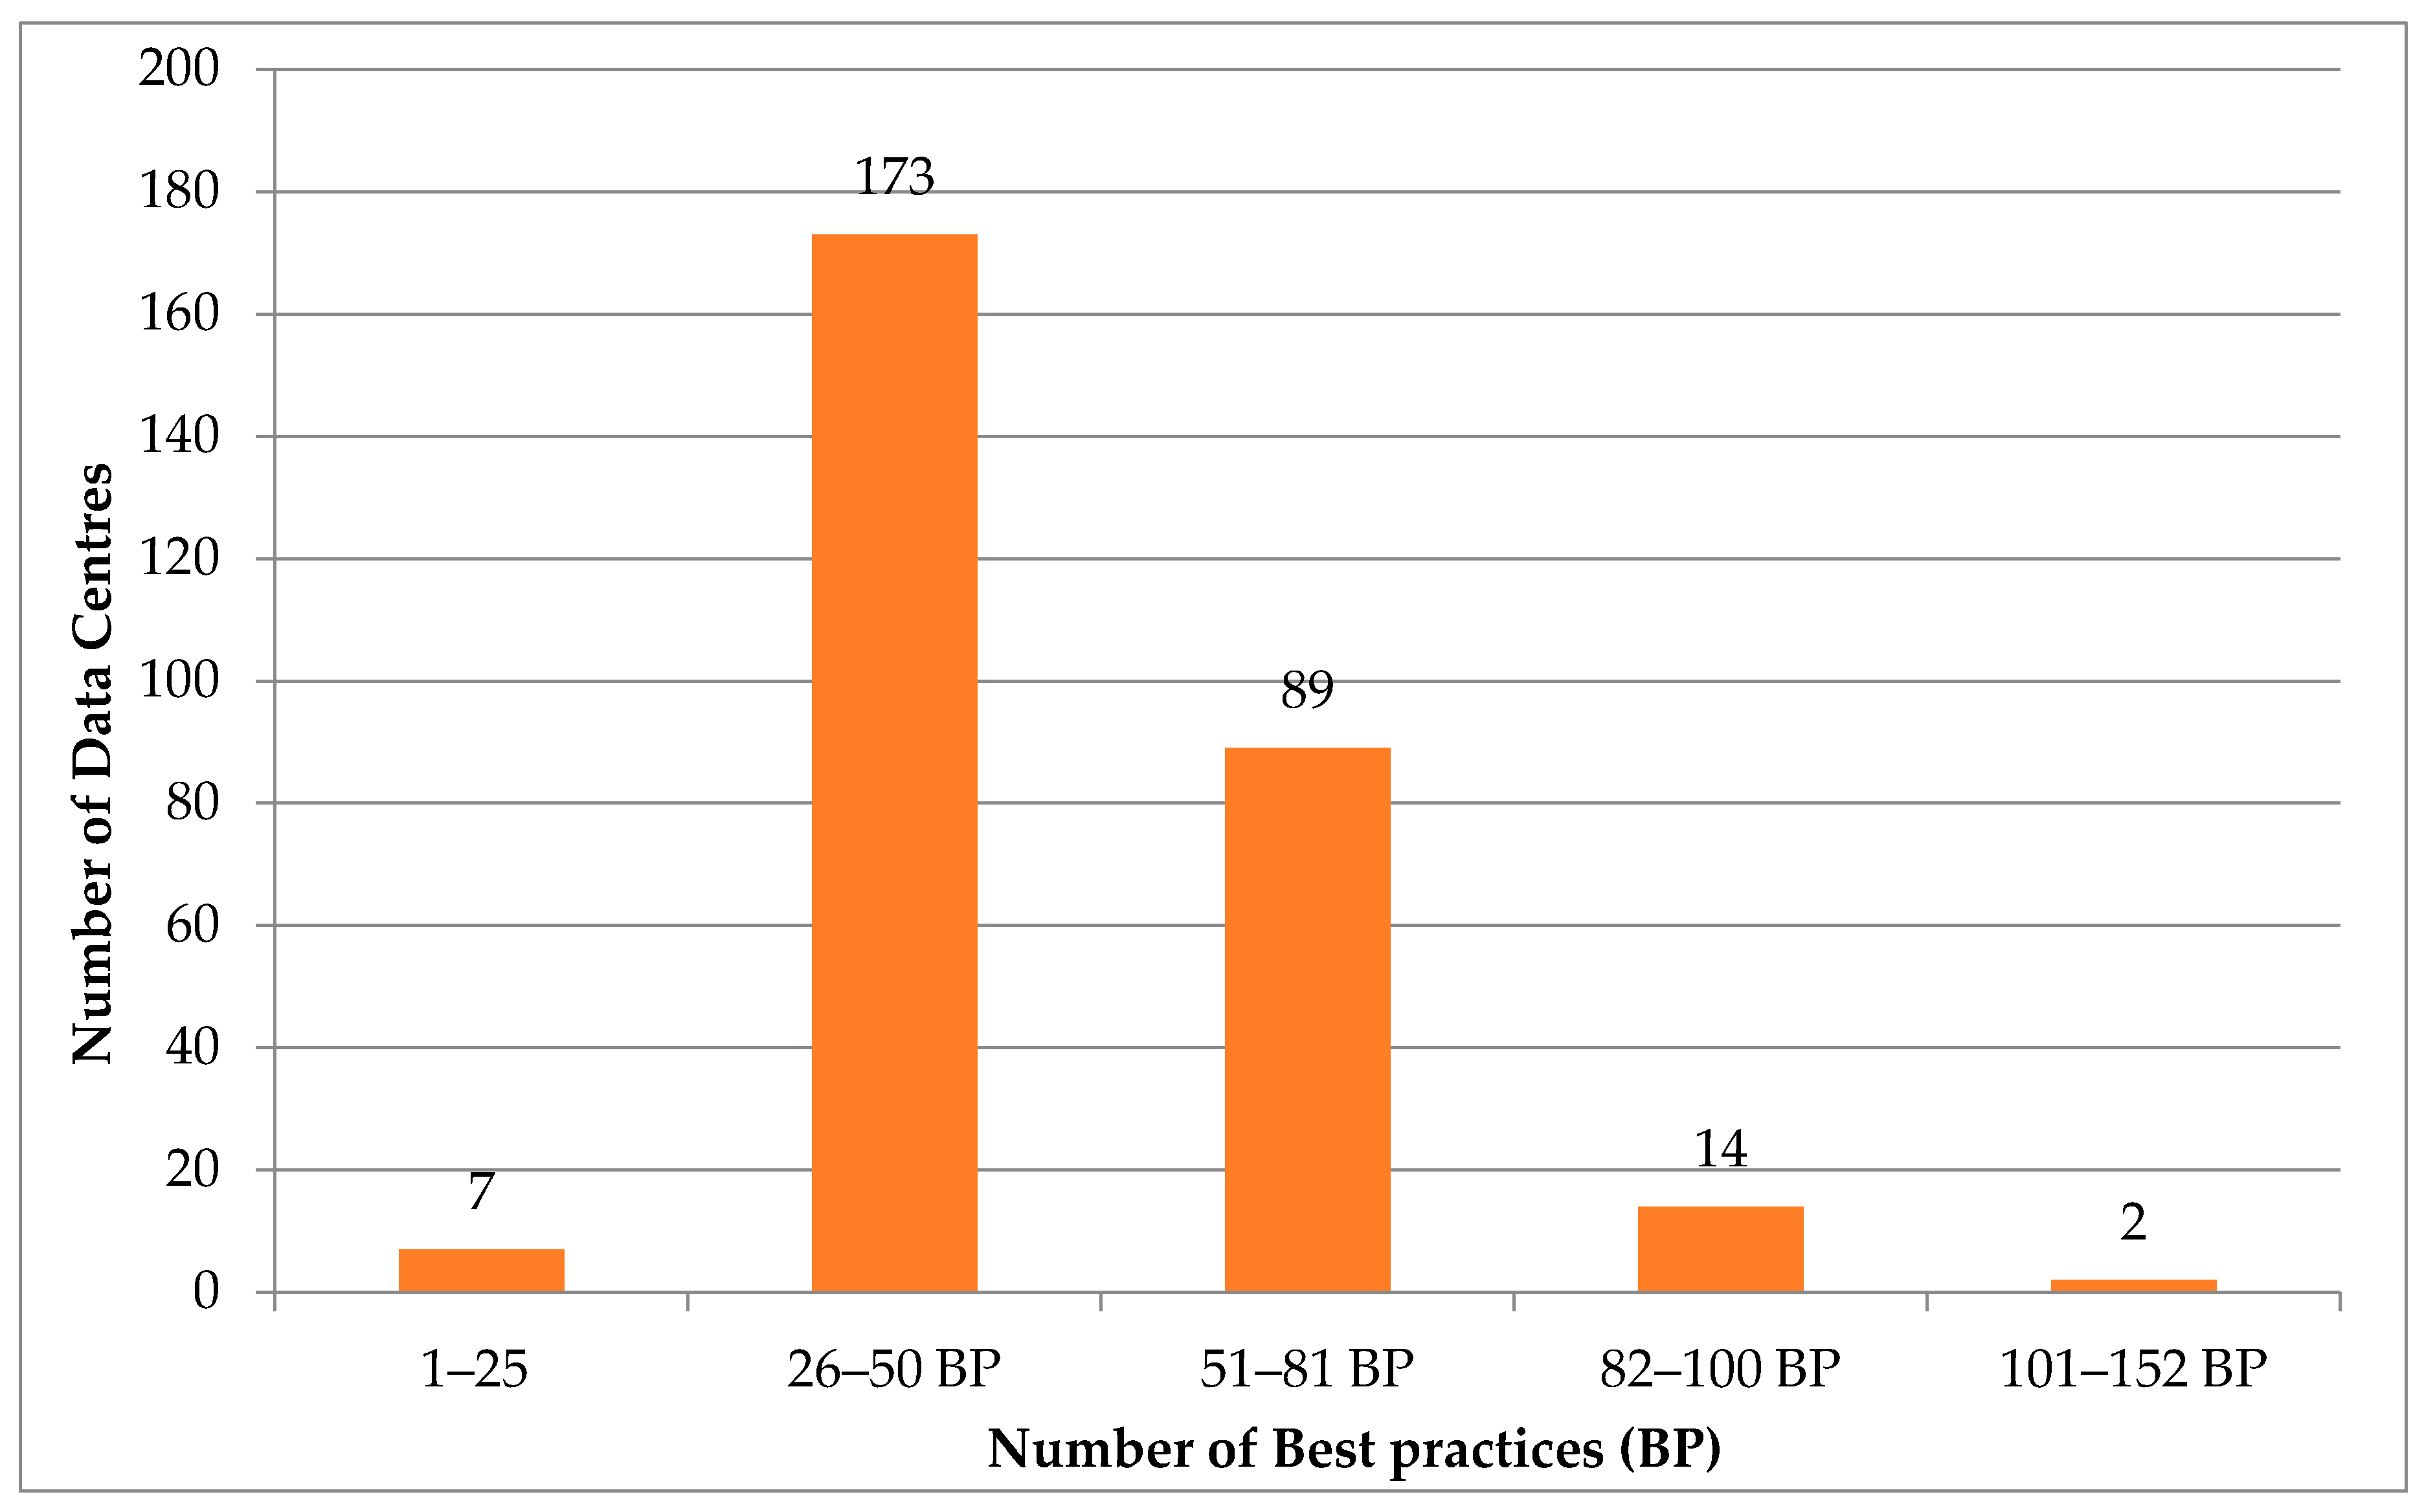
Figure 9 illustrates the frequency best practices are implemented by the companies. Each bar of the graph represents the number of data centres that implement certain number of practices indicated in the horizontal axis. This is a qualitative analysis, so the number of practices is evaluated rather than the type or category as referred in
Table 3. Indicatively, the majority of the participants implement between 26 and 50 best practices at the time of reporting, and approximately one-third of the participants implement between 51 and 81 practices. As mentioned before, the 2016 guidelines list 81 practices as mandatory, so it is concluded that there are only 16 sites that have implemented the minimum expected plus some optional practices, and 16 that have only implemented the 81 mandatory practices. It is important to specify that, since older versions are differentiated and contain fewer mandatory practices, it is expected that the 52–81 range is the most appropriate to describe the average number of data centres that comply with the practices criteria.
In general, the analysis shows that after 2015 the data centres that apply for the Code of Conduct Participant status already implement more practices than those that participated when the programme first started. This fact could be indicative of the technological trends towards a more energy efficient way of operating a facility, with more significant energy and financial savings.
5. Conclusions
The ICT and in particular data centres energy consumption is increasing globally and in the EU due to more Internet (including Internet of Things) and broadband communication. Against this trend, it is important to adopt policy actions to improve the energy efficiency of data centres and limits the energy consumption growth. The Code of Conduct for Data Centre Energy Efficiency is the only policy measure in the EU targeting data centres. It is complemented by important measures targeting the efficiency of data centres component in the frame of the Eco-design.
The study focuses on the emerging trends in energy efficiency in data centres, as evaluated using the data submitted voluntarily by various companies under the Code of Conduct for Data Centre Energy Efficiency programme. The number of participating data centres that have claimed the participant status is astounding, having reached the 345 applications so far. It must be noted that this is a unique study not only because of the size of the database but also in terms of reliability, as it is based on real data, instead of estimations.
The Code of Conduct is the only European independent programme that promotes data centres energy efficiency best practices and monitors the energy consumption. It is acknowledged as a successful example of a non-regulatory policy that has stimulated efficiency improvement in data centres. Every year, the number of companies applying for the participant status increases.
The analysis shows that the average Power Usage Effectiveness (PUE) of the facilities participating in the programme is declining year after year, reaching the value 1.64 in 2016. The total energy consumption so far of all the 289 approved Participants is approximately 3.7 TWh and the average annual electricity consumption has declined since the last survey in 2014. There is a number of facilities that already achieve PUE equal or below 1.2.
In addition, the PUE is compared against various parameters such as the facility size, the construction year and the Rrated IT electrical load. It is concluded that either the very small or very large size data centres of the sample achieve the best PUE. As for the other parameters, the facilities that were built in the period between 2005 and 2010 and have an average of 5–10 MW capacity perform the best.
Furthermore, as expected, the data centres located in Scandinavia and Northern Europe are more energy efficient, mainly due to the cooler ambient conditions that facilitate economizer use. It derives that the type of economizer that contributes the most to energy savings is the Indirect Water type, followed by the Direct Water.
Finally, regarding the best practices implementation, most data centre of the dataset implement between 26 and 50 practices, significantly less that the mandatory number of 81, as required by the latest guidelines. However, the participants of recent years appear to perform better and implement more practices comparing to the past participants, and most of those practices are the most cost-effective and with the shortest payback period.
The future research task linked to the dataset is to track the efficiency improvements of each data centre over time, examine the operational or infrastructure changes, consider the geographical and climatic zones distribution of DC, include in the analysis the water consumption and conduct a multiple regression to assess which are the factors and characteristics that contribute more to increase DC energy efficiency.
The Code of Conduct is one of the most successful policies to improve energy efficiency in data centres in the EU and it could easily be replicated in other countries and regions based on the EU experience, which confirms that voluntary approaches could be effective in addressing climate and energy issues.


