Article

Evaluating the Degradation Mechanism and State of Health of LiFePO4 Lithium-Ion Batteries in Real-World Plug-in Hybrid Electric Vehicles Application for Different Ageing Paths

1
Hubei Key Laboratory of Advanced Technology for Automotive Components, Wuhan University of Technology, Wuhan 430070, China
2
Hubei Collaborative Innovation Center for Automotive Components Technology, Wuhan University of Technology, Wuhan 430070, China
3
Mechanical Engineering Department, Ho Technical University, P.O. Box HP 217, Ho 036, Ghana
*
Author to whom correspondence should be addressed.
Energies 2017, 10(1), 110; https://doi.org/10.3390/en10010110
Submission received: 12 November 2016 / Revised: 27 December 2016 / Accepted: 9 January 2017 / Published: 17 January 2017

Abstract

:
Accurate determination of the performance and precise prediction of the state of health (SOH) of lithium-ion batteries are necessary to ensure reliability and efficiency in real-world application. However, most SOH offline studies were based on dynamic stress tests, which only reflect the universal rule of degradation, but are not necessarily applicable for real-world applications. This paper presents an experimental evaluation of two different operations of real-world plug-in hybrid electric vehicles with LiFePO4 batteries as energy-storage systems. First, the LiFePO4 batteries were subjected to a set of comparative experimental tests that consider the effects of charge depleting (CD) and charge sustaining (CS) operations. Then, different voltage analysis along with the close-to-equilibrium open circle voltage was utilized to evaluate the performance of the batteries in life cycles. Finally, a qualitative relationship between the external factors (the percentage of time of CD/CS operations during the entire driving range) and the degradation mechanism was built with the help of the proposed methods. Results indicated that the external factors affect the degree of the batteries degradation, but not up to the point when the capacity fading stage occurs. This relationship contributes to the foundation for plug-in hybrid electric vehicles’ (PHEVs’) energy management strategy or battery management system control strategy.

1. Introduction

Battery-powered electric vehicles (EVs) are considered to be the solution for the energy shortage and environmental pollution problems of the 21st century. Lithium-ion batteries are favored by researchers as one of the most promising candidates for their applications in hybrid and EVs owing to the high specific capacity, high rate capacity, good safety attributes, and cycle life [1,2,3]. To ensure reliability, efficiency, and capacity to deliver power and energy when required, an accurate determination of performance and a precise prediction of state of health (SOH) for lithium-ion batteries are necessary and crucial.
SOH is a metric to evaluate the ageing level of a battery, which reflects the ability of a battery to store and deliver energy relative to its initial conditions [4]. SOH estimation usually considers two aspects: capacity and power fades. Although battery ageing processes are inevitable in changing the characteristics of the electrolytes, anodes, cathodes and the other components in the battery, accurate SOH estimation has a significant effect on prolonging battery cycle life [5,6].
Methods for SOH prognosis of batteries have been proposed [7,8,9,10,11]. These methods can be divided into two categories: online monitors, which are used in real-world applications, such as EVs or plug-in hybrid electric vehicles (PHEVs), and offline tests, which are conducted in the laboratory. For online monitors, the SOH is determined through calculation using parameters that are related to the degradation of battery cells, such as cell voltage, current, and ambient temperature [12]. However, the data should be examined throughout the operation of the battery, which leads to signal noise problems caused by disturbances and poor qualities during signal acquisition. For offline tests, SOH is determined using the history data stored from the battery cycle test. Considering that the data are acquired through the battery test equipment, less noise problem occurs; however, this case may not be applicable to real-world applications.
In recent years, incremental capacity analysis (ICA) [13,14,15,16] and differential voltage analysis (DVA) [17,18,19] have attracted significant attention for battery SOH evaluation, considering the non-invasive and in situ method, which can reveal several chemical mechanisms [20]. The incremental capacity (IC) curve (dQ/dV-V) or the differential voltage (DV) curve (dV/dQ-Q) are the transitions that are derived from the charging or discharge voltage data. The main advantage of these two methods is to transform the voltage plateaus on the voltage curve into identifiable differential peaks that are associated with the phenomena of phase transition during the Li+ intercalation/de-intercalation process of the electrode. Dubarry et al. [21] was the first to propose ICA for degradation mechanism analysis. They used a 900 mAh LixNi0.8Co0.15Al0.05O2 (LNCAO) cell to illustrate the evaluation of the capacity fade and power degradation by using the ICA. Their results indicated that the proposed method can provide a powerful diagnosis tool for commercial cells. This achievement makes the offline SOH calculation relatively simple compared to a post-mortem analysis or a cyclic voltammogram (CV), in terms of ageing mechanism identification. Feng et al. [22] extended the ICA/DVA to probability density function (PDF); a comparison of the PDF and ICA/DVA method for SOH estimation is provided in their work, and the results acquired from PDF and ICA/DVA are quite similar. Therefore, the PDF method is more applicable for online SOH prognosis as it realizes the discretization of the ICA/DVA method, which provides two main advantages for online applications. On the one hand, the discretization of the voltage curve can be directly used for data deriving without curve fitting. On the other hand, it is easier to program in a microcontroller of a battery management system (BMS). Honkura et al. [23] applied the DVA to the full and single electrode voltage curves, and proposed a model to trace the changes of irreversible capacity and the usable positive and negative active material losses. The feasibility of using this methodology in a BMS has been discussed systematically by Weng et al. [13]. The authors proposed a battery SOH monitoring scheme based on partially charging data, and the ICA was used through a support vector model. Wang et al. [24] proposed a new method for estimating the SOH of LiFePO4 (LFP) through the use of the transformation parameter on a differential voltage curve. The SOH estimation error is within 2.5% in accordance with their new method. Torai et al. [25] proposed a model for LFP/graphite battery SOH estimation. The model is based on the deformed pseudo-Voigt peak function, and SOH is estimated by using a DVA of C/5 charging current; the evaluated SOH errors are within ±3%.
Although determining the SOH of battery in a vehicle energy storage system is crucial, efficient and accurate methods for SOH estimation are still lacking. An adequate understanding of the ageing process is the key for precise SOH estimation.
Ageing processes are complicated given that a lithium-ion battery is a highly nonlinear and complex system [26]. The degradation of lithium-ion batteries in real-world application does not originate from one single cause but from various processes and their interaction. Moreover, all of these processes nearly occur at the same timescales and affect the degradation synergistically, making it more challenging to investigate the ageing mechanism. Furthermore, the ageing rate is sensitive to stress factors, such as ambient temperature, discharging and charging rate, depth of discharge (DOD), and time interval between the two full charge cycles [27]. These external factors accelerate the ageing processes related to, but not limited to, solid electrolyte interphase (SEI) growth, active material loss, and lithium plating [28], leading to a decrease in battery capacity and an increase in resistance. In particular, PHEVs are usually operated in charge depleting (CD)/charge sustaining (CS) modes, and the weight of two modes also affect the ageing process. Nevertheless, few studies are focusing on the ageing mechanism through single stress factors. A good understanding of the effects of single stress factors on the ageing process and battery performance helps to improve the accuracy of SOH evaluation.
In this study, we propose a new method for investigating the effect of the factors on degradation with regard to the fading mechanism. This method is an offline method, which utilizes a specific experimental campaign to test cells involving different stress factors. Results obtained from ICA and close-to-equilibrium open circle voltage (cte-OCV) tests were then analyzed. Finally, a qualitative relationship between the stress factors and the degradation mechanism was built. This relationship may give some suggestions for the energy management strategy optimization in PHEVs and helps to prolong the cycle life for a battery system. LFP, which is one of the most commonly used materials for PHEV and EV applications in the Chinese market, was chosen for this study.
This study marks the beginning of our work, and, thus, only one factor (i.e., CD/CS) was discussed. Other factors, such as battery type, charging rate, DOD, SOC interval, and ambient temperature will be studied in future research.

2. Experimental

The batteries involved in the study are LFP cells supplied by the Chinese manufacture (CALB Co., Ltd., Luoyang, Henan, China). The anode was composed of ethylene carbonate (EC) and diethyl carbonate (DEC) with the proportion of 1:1. A NEWARE BTS-300 (NEWARE Co., Ltd., Shenzhen, China). Battery test station that has two channels with a maximum Charge/Discharge capacity of 5 V, 300 A was used for the testing. The main parameters of the cell are shown in Table 1.
In this study, a specific duty test procedure was used to evaluate the ageing of the cells, a method inspired by Cordoba-Arenas et al. [29].
CD and CS are two operation modes that are defined by the United States Advanced Battery Consortium (USABC) for PHEVs [30]. The schematics of a typical current profile for the two modes are shown in Figure 1. Definition of the ratio of CD time to the total operation time (TCD + TCS) is given in the Equation (1) as follows:
R a t i o   =   T CD T CD + T CS
In real-world applications, it is popular to use the rule-based energy management strategy for PHEVs [31]. The main idea of this strategy is to control the PHEVs by the following rules. (a) When the battery state of charge (SOC) is relatively high, the PHEVs shift to the CD mode and the motor is the main power source. Only when the demand torque is higher than the motor’s maximum torque does the engine start to work; (b) When the battery SOC decreases to a target threshold, the vehicles use the CS mode and the engine is the main power source. Therefore, we used the ratio factor to simulate the battery ageing process under a real-world vehicle cycle life scenario.

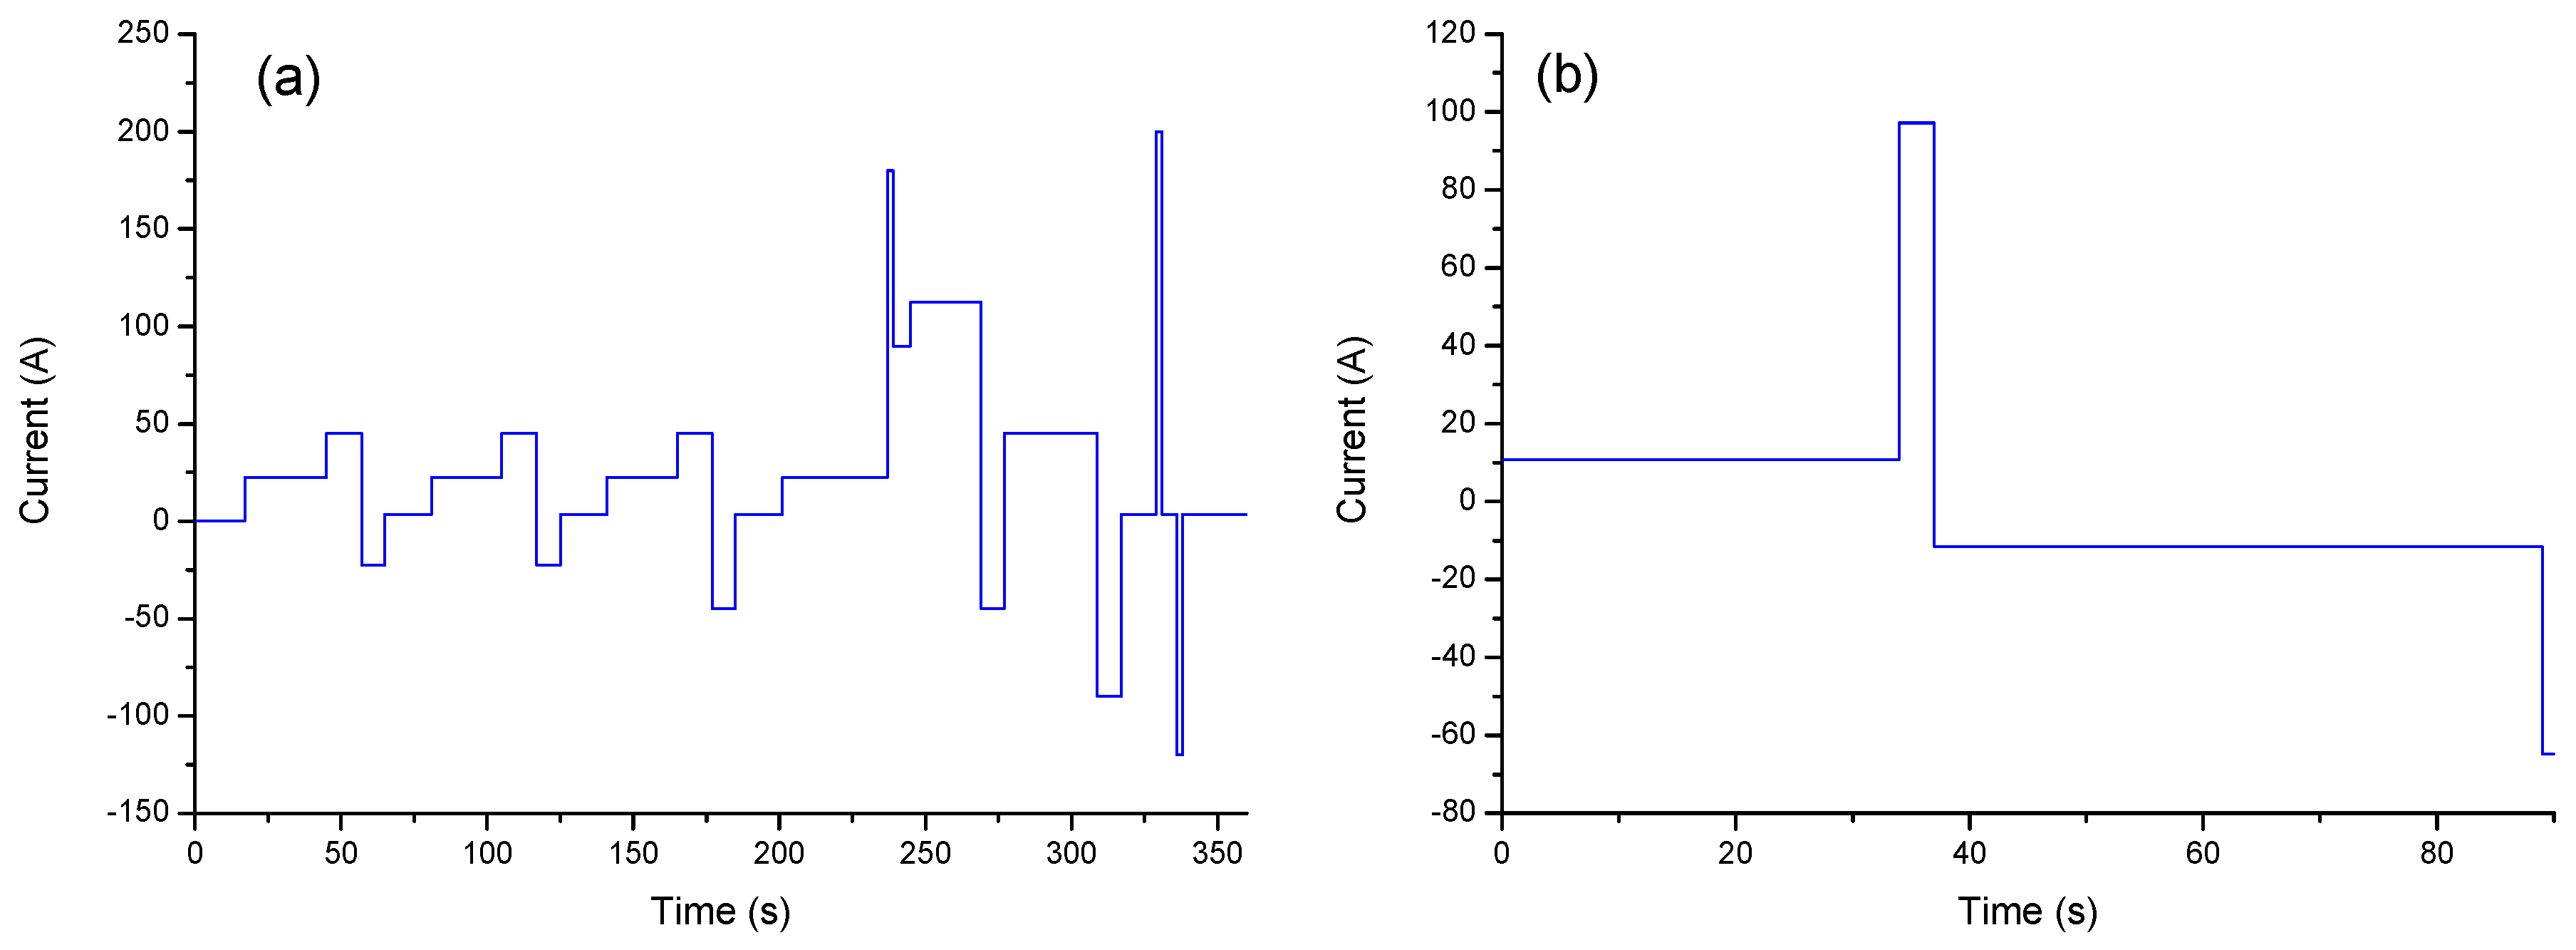
2.1. Duty Cycle Test Scheme

In order to understand the effect of the ratio, two comparative tests were carried out:
(1)
Label the cells into two groups as #1 and #2, respectively;
(2)
Charge the cells to a given voltage (in this case, at 3.4 V) to reach the 85% of SOC;
(3)
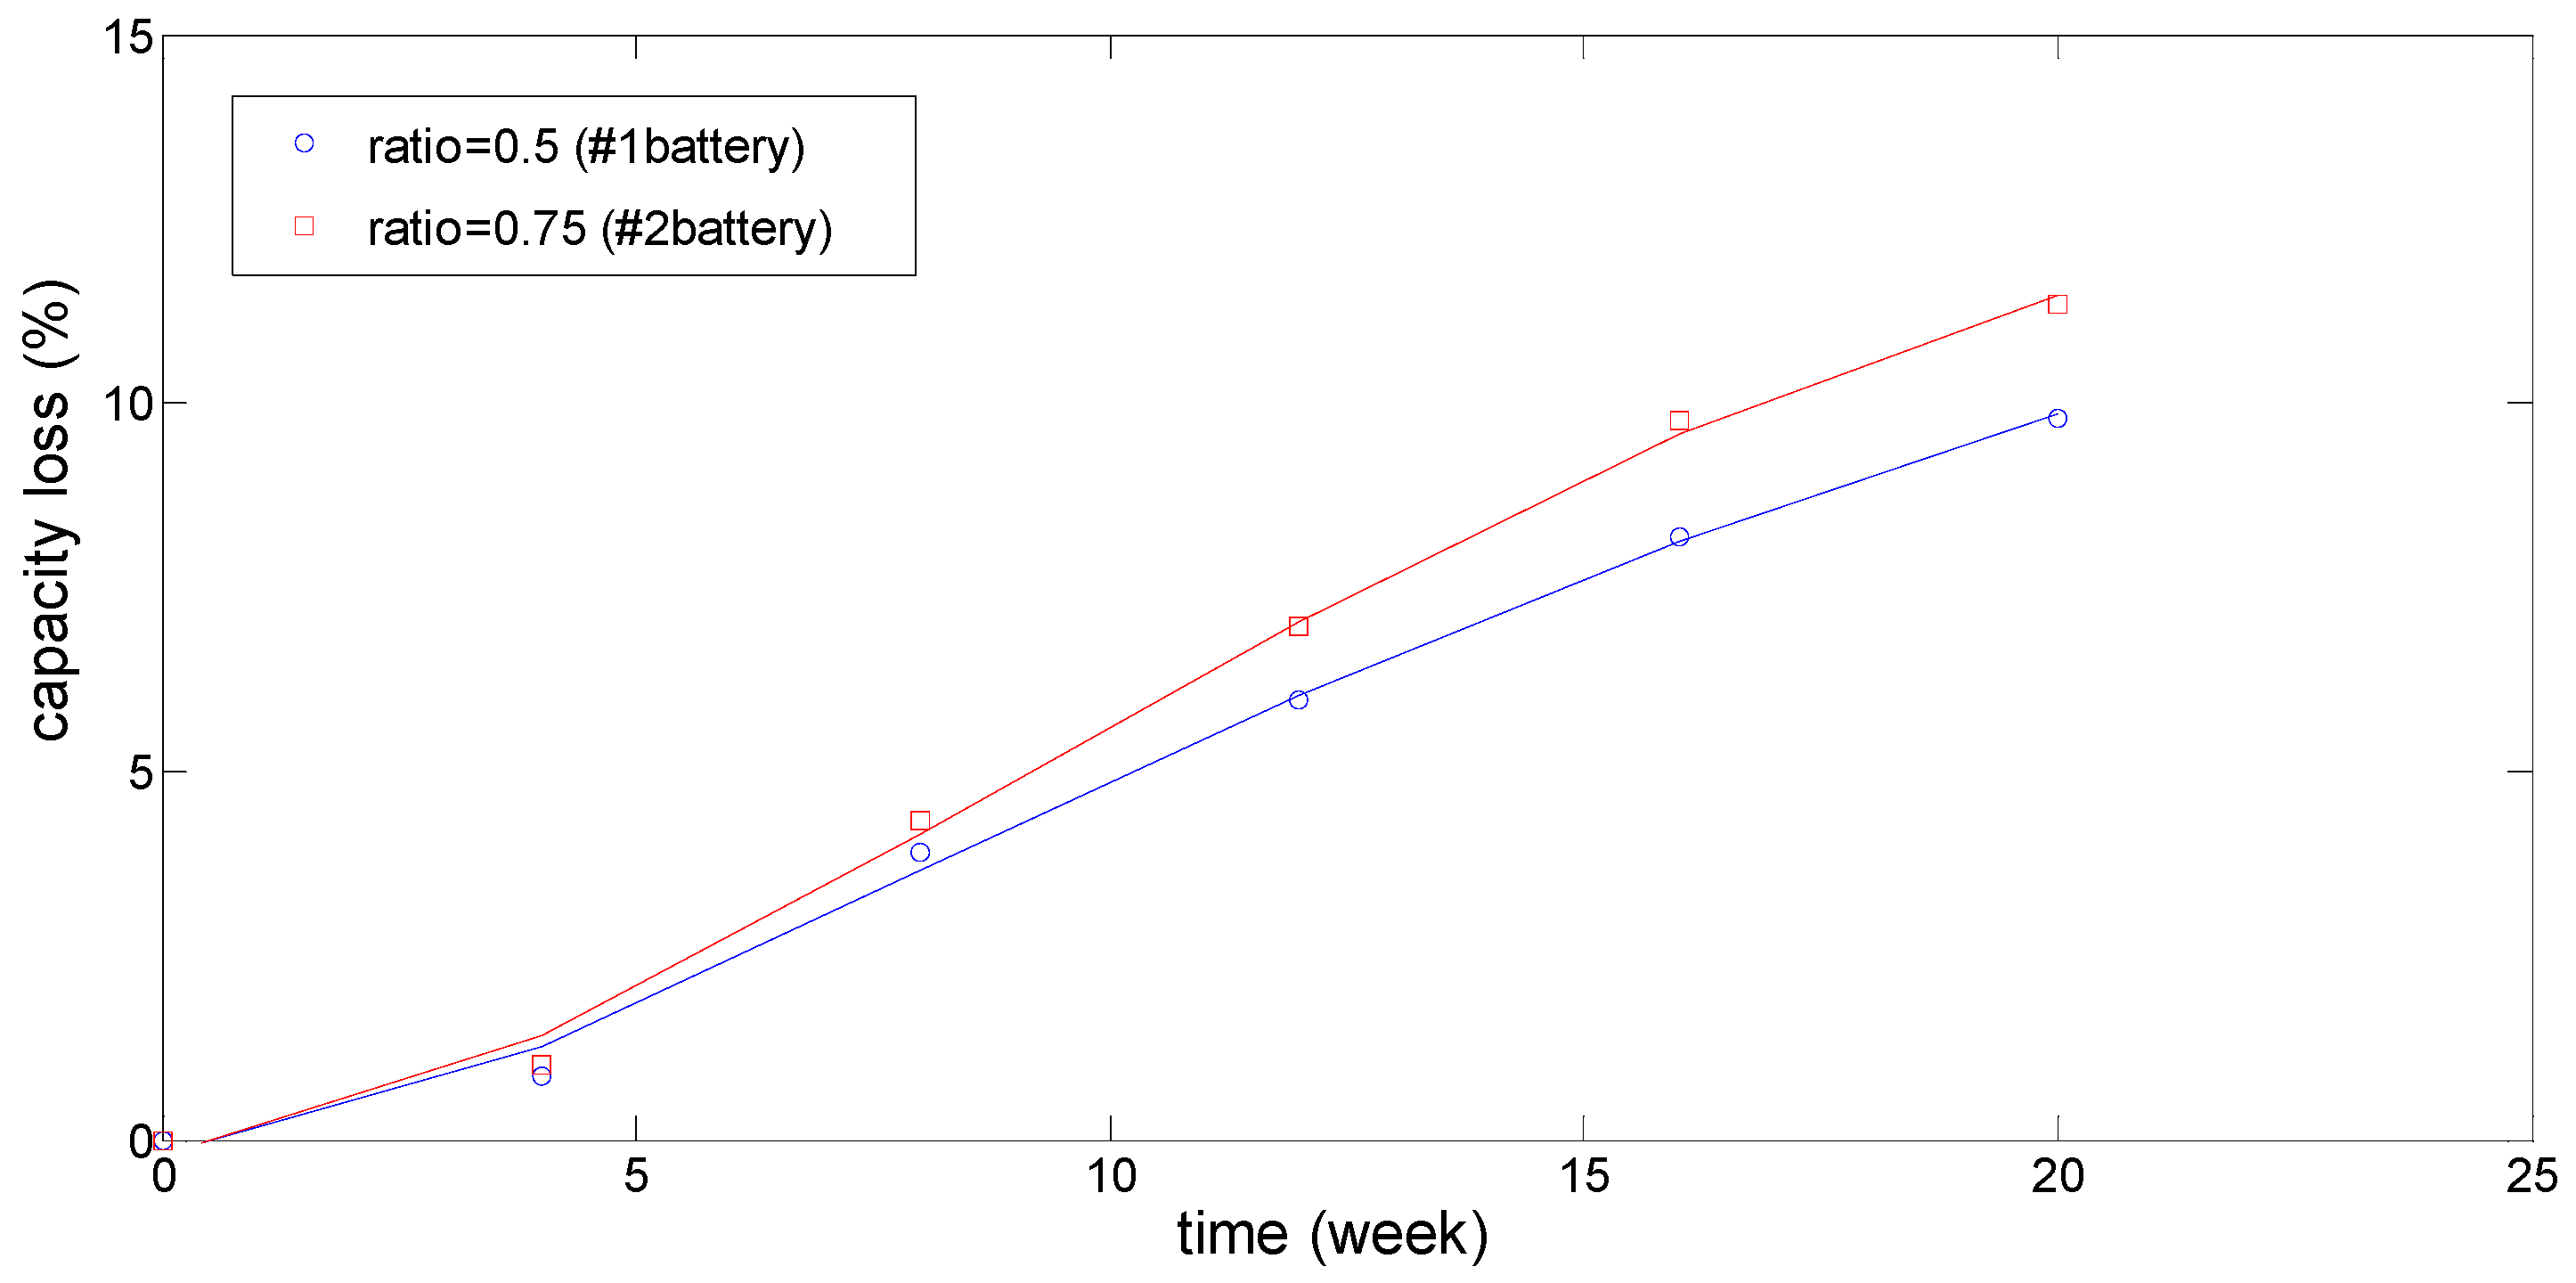
Set the cells under the duty cycle for ageing, where the duty cycle was a combination of the CD and CS modes with different ratios of 0.5 (5CD and 20CS mixed) and 0.75 (5CD and 7CS mixed) for cells #1 and #2, respectively;
(4)
After each duty cycle, use the constant current-constant voltage (CC-CV) protocol for recharging the batteries through 1C rate to 3.4 V;
(5)
Finally, there was 1 h of rest to allow the batteries to attain the chemical equilibrium.
The entire ageing process lasted for five months until the battery capacity loss reached 10%. It is worth identifying that the definition of the end-of-life (EOL) of a battery through the USABC [30] is the measured capacity of less than 80% of its rated capacity. However, the Chinese industrial standard is set at 90% of its rated capacity at EOL [32]. For the purpose of this study, 10% of the capacity was chosen, as the EOL indicator saves time and meets the local regulations.

2.2. Characterization and Reference Performance Tests

One of the characteristics of the DOD-voltage curves of LFP cells is that they show a long range of voltage plateaus, as shown in Figure 2. ICA can transform the plateaus zone to peak curves, which reflect the phase changes. In order to detect the changes of peaks in the IC curve, the test must be carried out at a low and constant rate (at C/3 in this case).
Consequently, each cell was stopped periodically during the cycle test and characterized using the following reference performance test (RPT) after the duty cycle test at a frequency for four weeks.
(1)
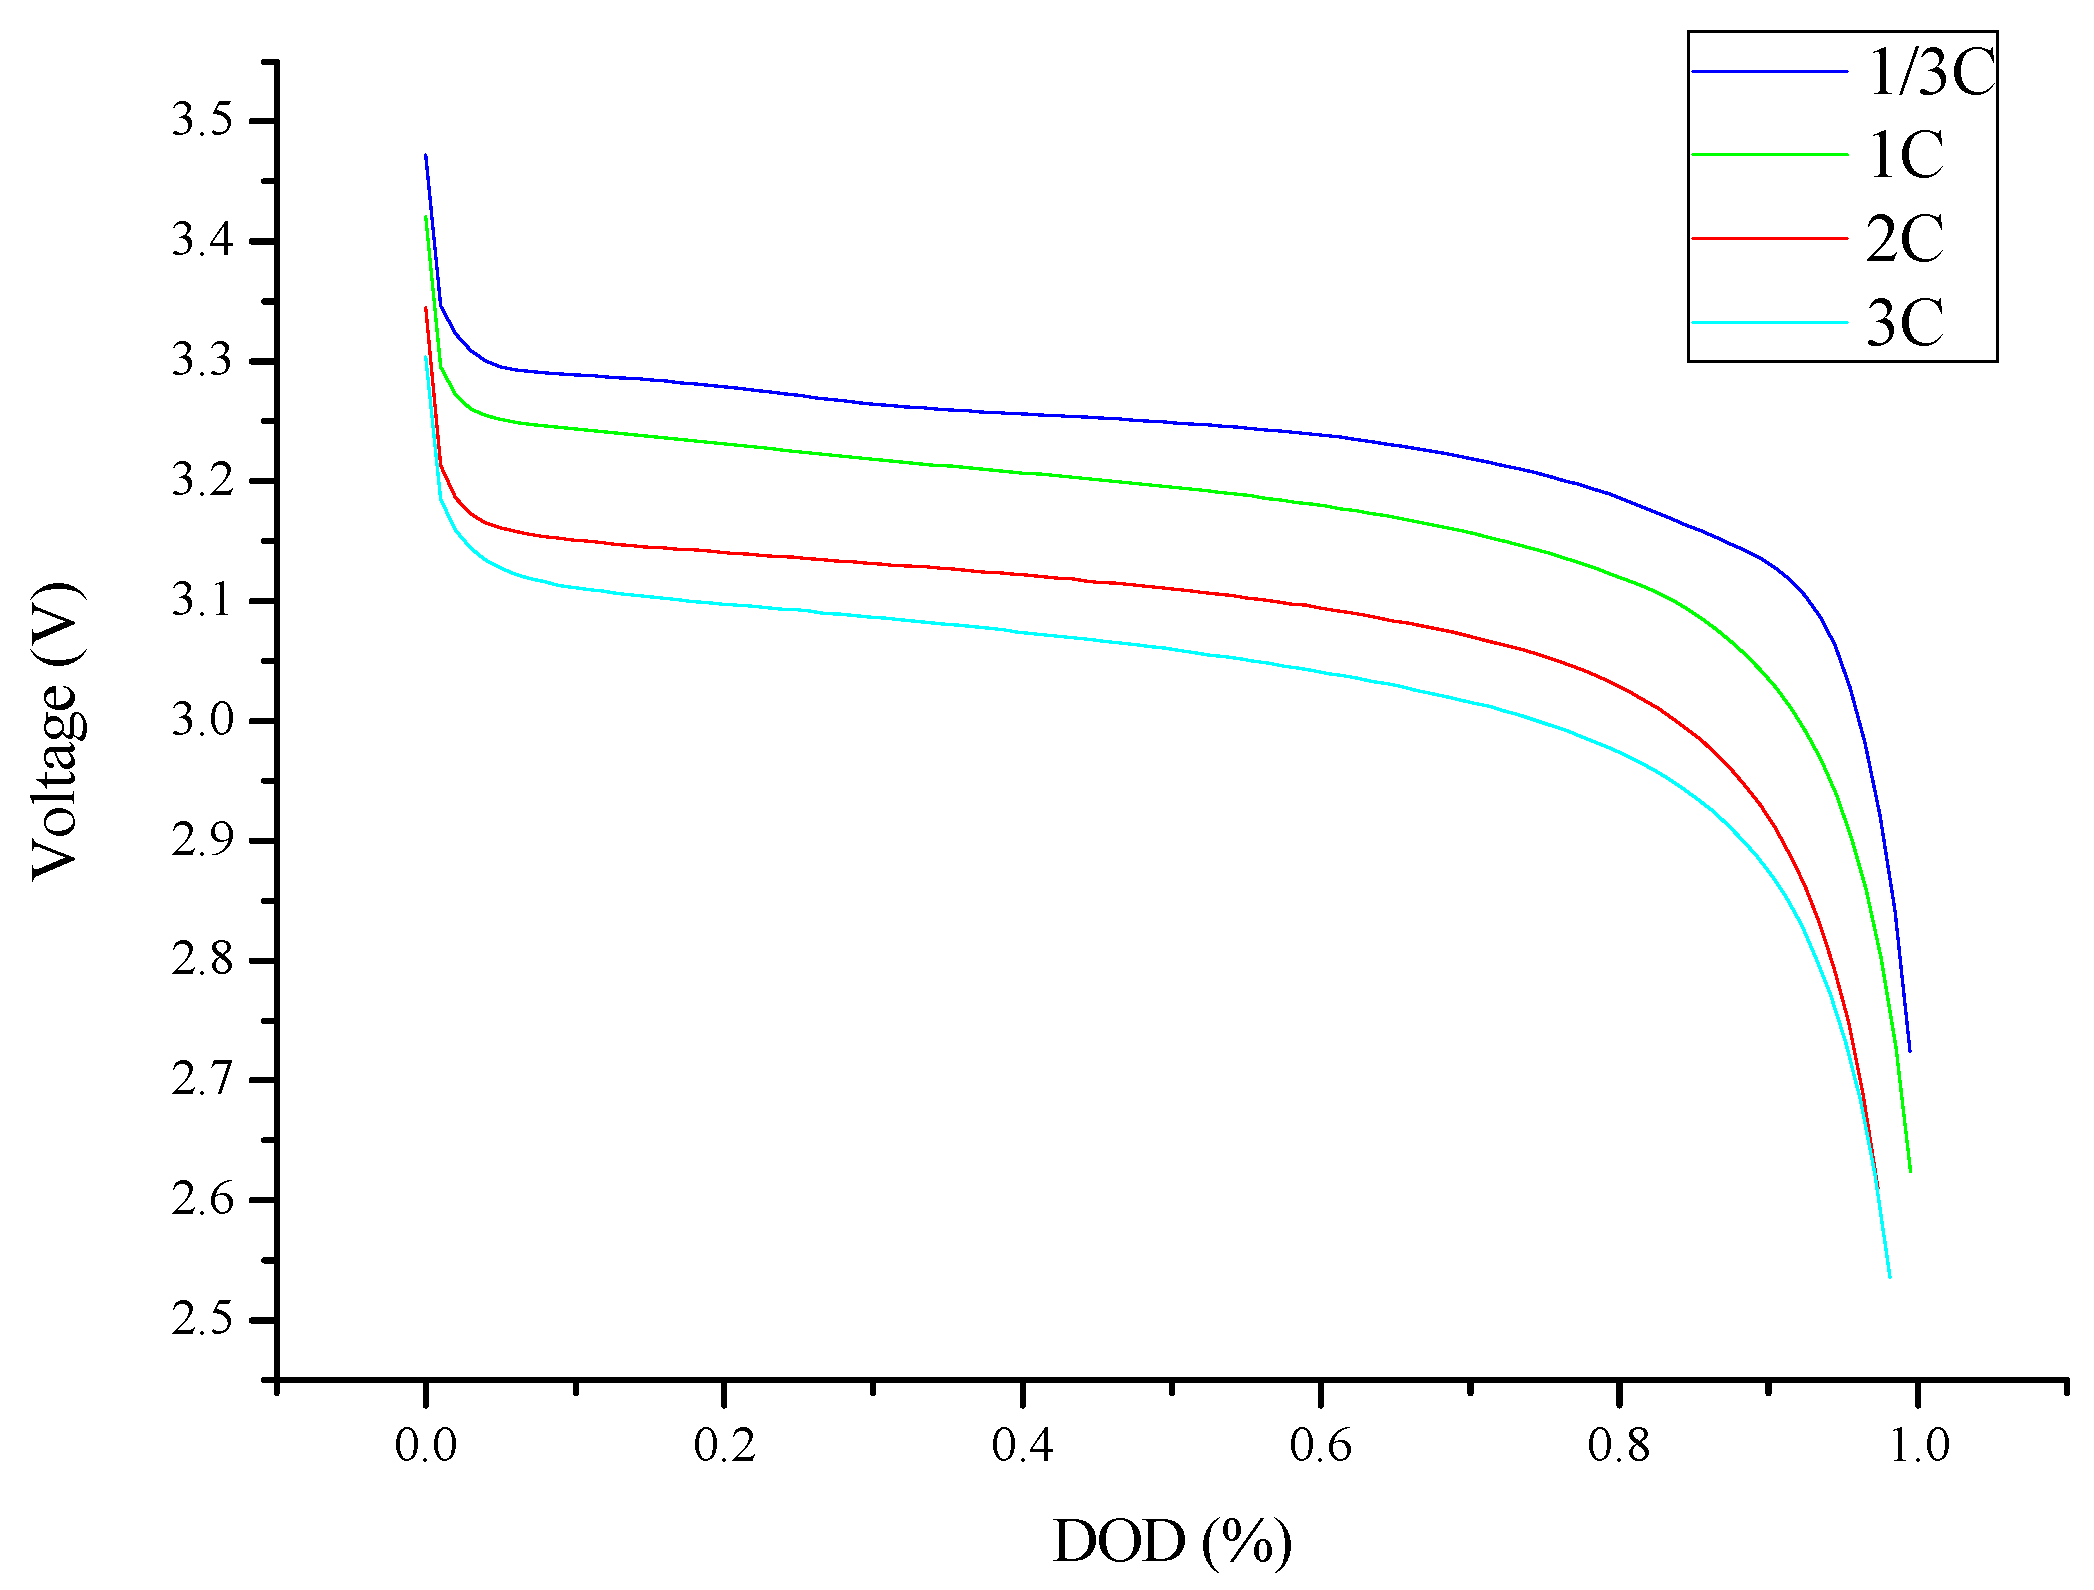
Standard capacity test;
(2)
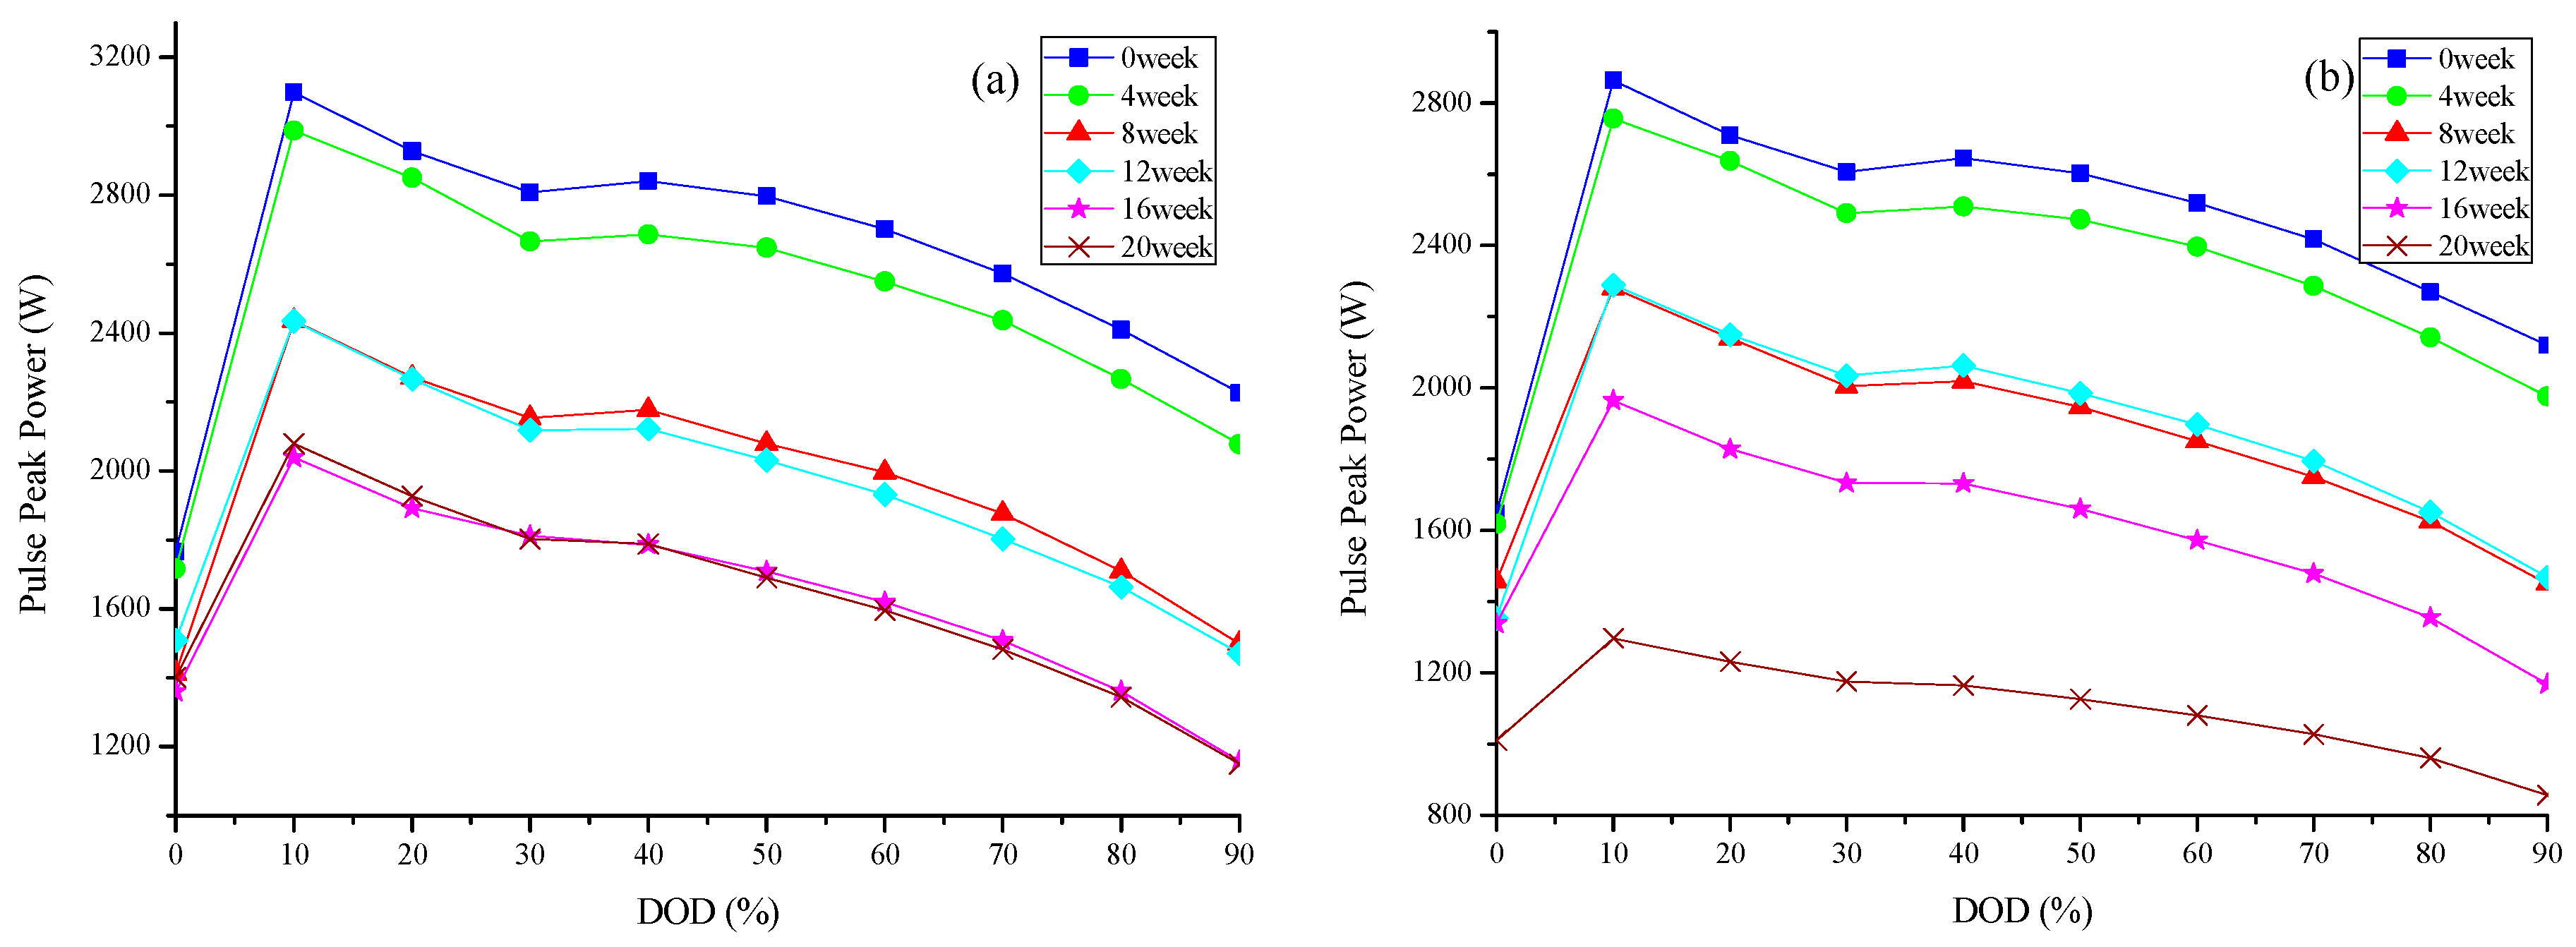
Hybrid power pulse characterization (HPPC) test;
(3)
C/25 constant-current discharge test.
For the standard capacity test, the cell was fully charged to the cut-off voltage of 3.65 V by 0.33C and then discharged by 0.33C to its discharge limit at the cut-off voltage of 2.50 V. The test was repeated three times to establish repeatability and the averaging capacity was used to calculate the real SOH.
The HPPC test profile was composed of a 10 s duration and high constant current inputs with a 40 s interval. After the pulse sequence, the cell discharge of 10% DOD to the next SOC range and a resting period of 1 h before the sequence was repeated [30]. This test was repeated nine times and 1C current pulse and 0.33C were used to traverse the SOC range.
All of the tests were conducted in a climate chamber at a controlled temperature of 25 °C.

3. Results and Discussion

Before the cycle test, we ensure that the two cells involved are in good consistency. Figure 2 shows the cell voltage versus DOD curves under different discharging rates before cycle testing. The nominal capacity of the two cells obtained by C/3 constant current discharge protocol are 60.996 Ah and 60.852 Ah, respectively, slightly higher than that of the nominal 60 Ah, which was declared by the battery manufacturer. The discharge curves of the two cells under a certain rate overlapped well and the resistances obtained through the HPPC test are nearly the same. Such results suggest that the cells are adequately consistent.

3.1. Degradation Menchanism

There is much published literature concerning the ageing mechanism [33,34,35,36]. It is common that the LFP degradation modes can be divided into the following types: (1) loss of Li+ inventory (LLI), mostly resulting from the consumption of the recyclable Li+ through side reactions, such as the generation and growth of solid electrolyte interphase (SEI) films on the graphite anode along with the electrolyte decomposition [35], in addition, LLI can be induced by plating [34]; (2) loss of active material (LAM), considering the exfoliation and isolation of positive and negative electrode particles through the mechanical failure with the electrodes; (3) under-charging (UC) and under-discharging (UD), mainly caused by polarization resistance and sequentially driving the charging or discharging process prematurely terminated [21]. In addition, retardation in the charge-transfer kinetics at the electrode surface, ionic conduction in the active materials, and increase of ohmic resistance due to degradation in electrode contact or electrolyte conduction were also commonly observed in the ageing processes.

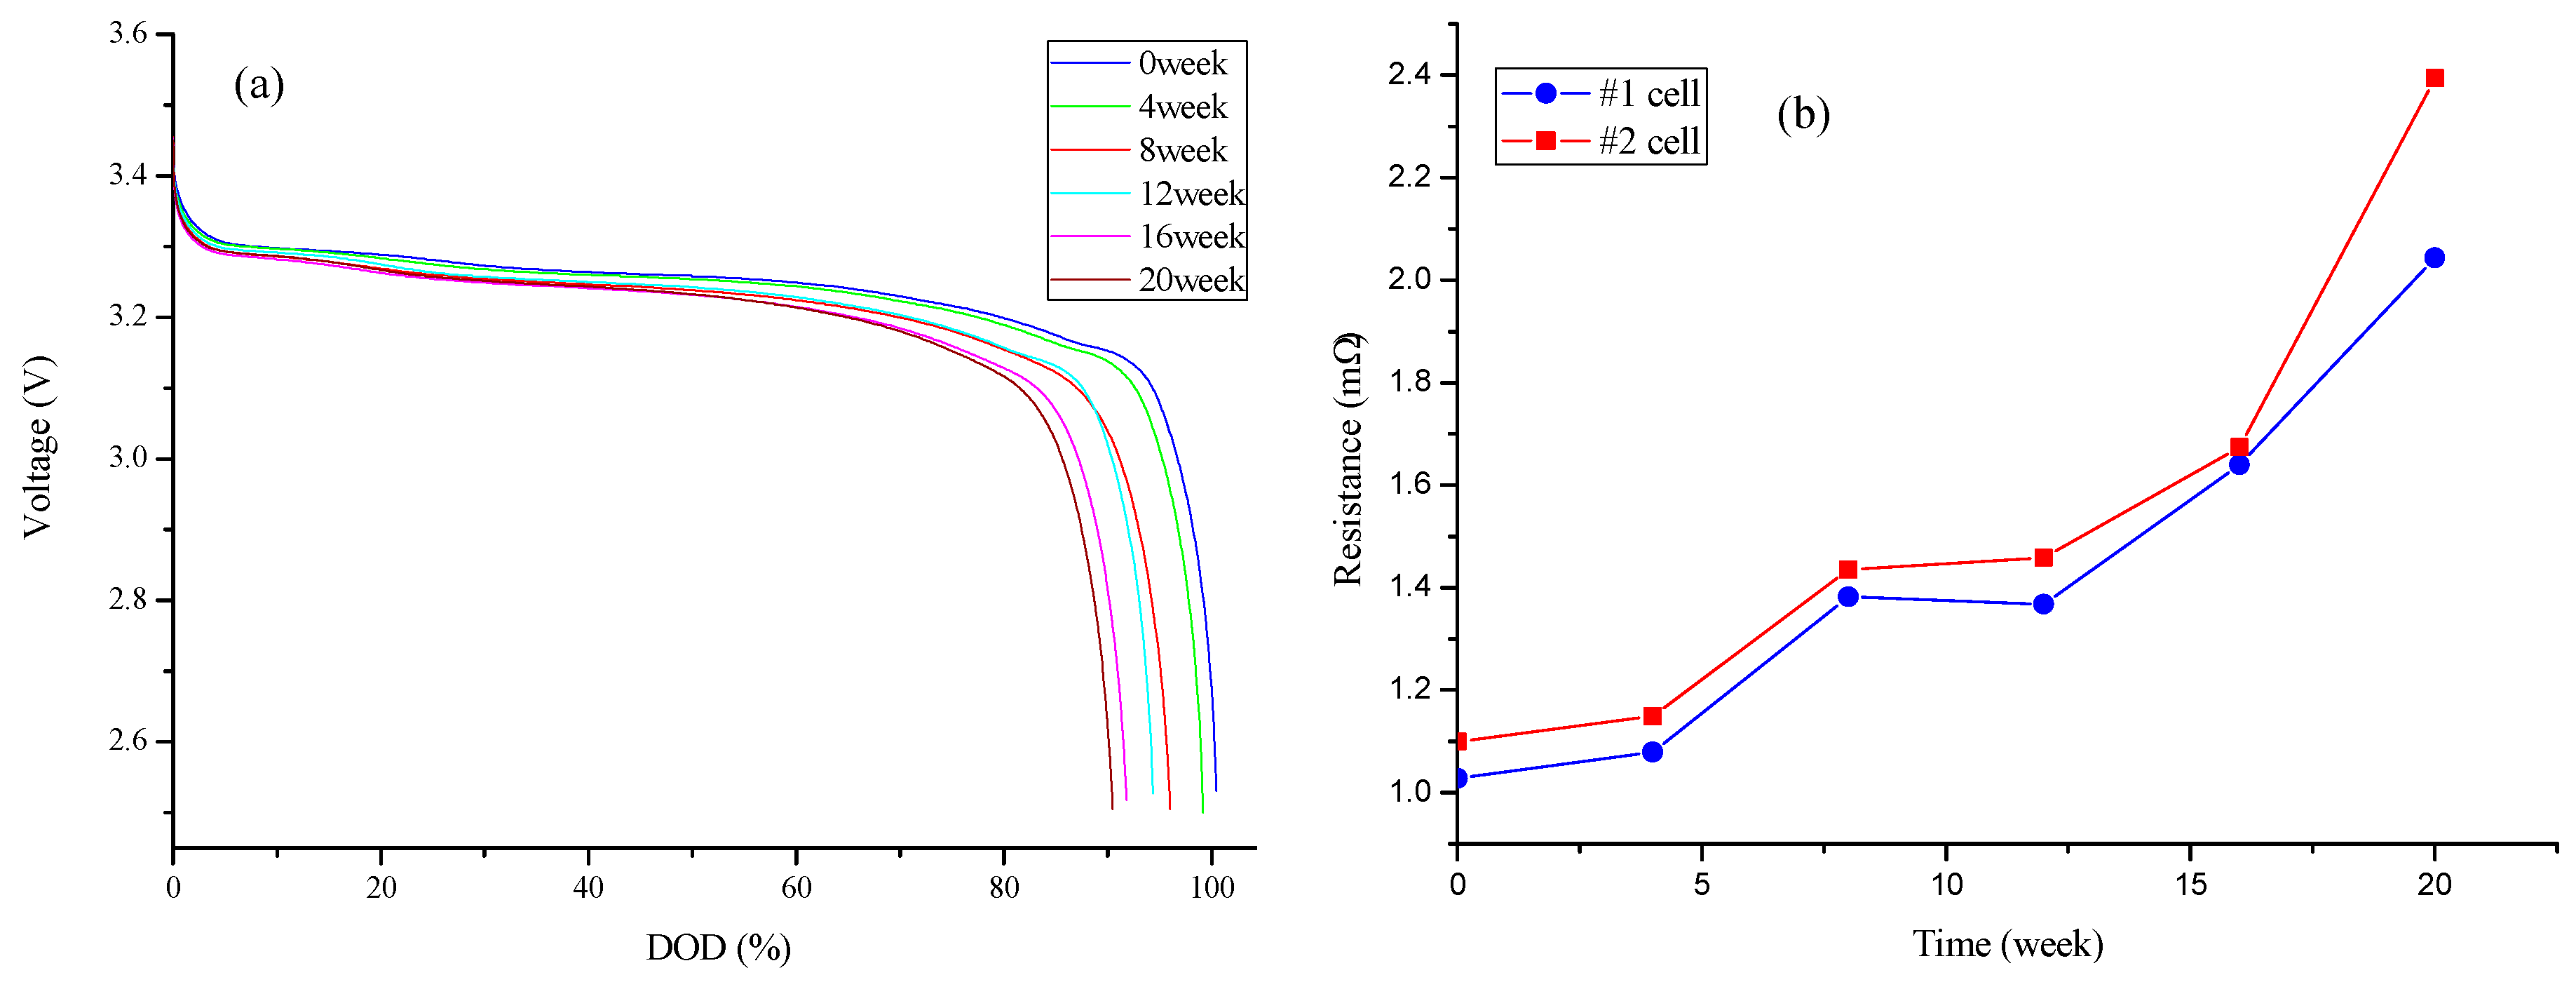
3.2. Degradation of Capacity and Power Capacity

After five months of the ageing test, the measured capacity decreased and reached the EOL. The coulombic efficiency of both cells did not change too much (approximately equal to 1). Figure 3 plots the capacity loss at each RPT and the corresponding fitting curves of it. It shows the capacity loss of each cell that follows the same trend. However, the #2 cell had a faster rate of capacity loss than that of the #1 cell. The difference in the capacity loss between the two cells becomes larger with time and is as large as 2% after 20 weeks of duty cycles. The capacity fade curves of #1 and #2 cells show two turning points. One occurred at around the 4th week and another at around the 16th week. The capacity loss curves having a two-stage rate are shown in Figure 3. The fading process is divided into two stages: the first stage is before the 4th week and the second stage is from the 4th to the 20th week.
Figure 4 shows the discharge curves of #1 cell at C/3 rate when the cell is under duty tested at different weeks and the cell resistance changes with ageing time. Figure 4a shows the plateau voltage that gradually decreases with the increment of the testing week revealing that the polarization resistance gradually increases. However, the increase of the resistance reflects the battery’s power fading. The resistance is derived through the HPPC test and calculates at each SOC with an interval of 0.1. The average value at each SOC is used to represent the cell resistance. This method is cited from reference [37]. Meanwhile, adopting resistance at a particular SOC range is another way to evaluate the entire cell’s resistance, which is also used by several scholars. Here, we choose the first method to calculate the resistance, since it is more comprehensive as a result of the consideration on the entire range of SOC. From Figure 4b, it is found that each resistance of #1 and #2 cell increases with time, as well as following the same trend. However, the resistance of #2 cell is slightly larger than that of the #1 cell while the difference is very close before the 16th week and the minimum is approximately 0.1–0.2 mΩ at the 16th week. There are two noticeable differences of the resistance between the two cells. One occurs between the 4th and 8th week from 1.079 to 1.382 mΩ for the #1 cell and 1.149 to 1.435 mΩ for the #2 cell, respectively. Another emerges between the 16th and 20th week from 1.640 to 2.043 mΩ for the #1 cell and 1.674 to 2.394 mΩ for the #2 cell, respectively. This phenomenon coincides with the capacity changes (Figure 3), which prove that the capacity and power decrease in the same two-stage trend.
Note that the cell’s resistances calculated through HPPC data is not a princely quantitative method to reflect the fading characteristics, considering that the resistance of the cells is very small and the data highly depends on the equipment precision. Therefore, the 0.1 mΩ difference between the #1 and #2 cells may be caused by the systematic error.
In understanding the power fading of the cell with cycle testing, an HPPC test is conducted to evaluate the power performance in the ageing process. The discharge pulse power capacity at each DOD is shown in Figure 5. Each cell’s pulse power capacity increases first and reaches the peak power capacity at 0.1DOD. Then, the pulse power capacity gradually decreases with the increment of DOD. Similar to the trend of the resistance, a large gap of power loss has appeared between the 4th and 8th weeks, up to the time point when the second stage of degradation starts. Many possible cell degradation modes have been reported in literature, and it appears common that power fade mainly enhanced due to the following reason [35,38]: (1) electrolyte decomposition; (2) decrease of accessible surface area due to continuous SEI growth; (3) changes in porosity due to volume changes; and (4) current collector corrosion. Due to the fact that the SEI mainly forms during the first charging process (the first one or several cycles) and stays relatively stable, and the electrolyte decomposition or volume changes of the anode will not appear so early [39], it is assumed that the sudden power loss at the second stage (typically from 4th to 8th week) is caused by continuous SEI growth and LAM. Moreover, the two cells show different fading rates between 16th and 20th week (the pink and brown line in Figure 5b). However, the #1 cell does not reach the fading tipping point when the power performance is evaluated at the 20th week, while the #2 cell does and its power decreases significantly at this very time.
Brief summary, for both the #1 and #2 cells, the capacity and power loss rate show the same trend. However, the ageing degree is larger for the #2 cell than that of the #1 cell when they are under tested for the same 20 weeks.

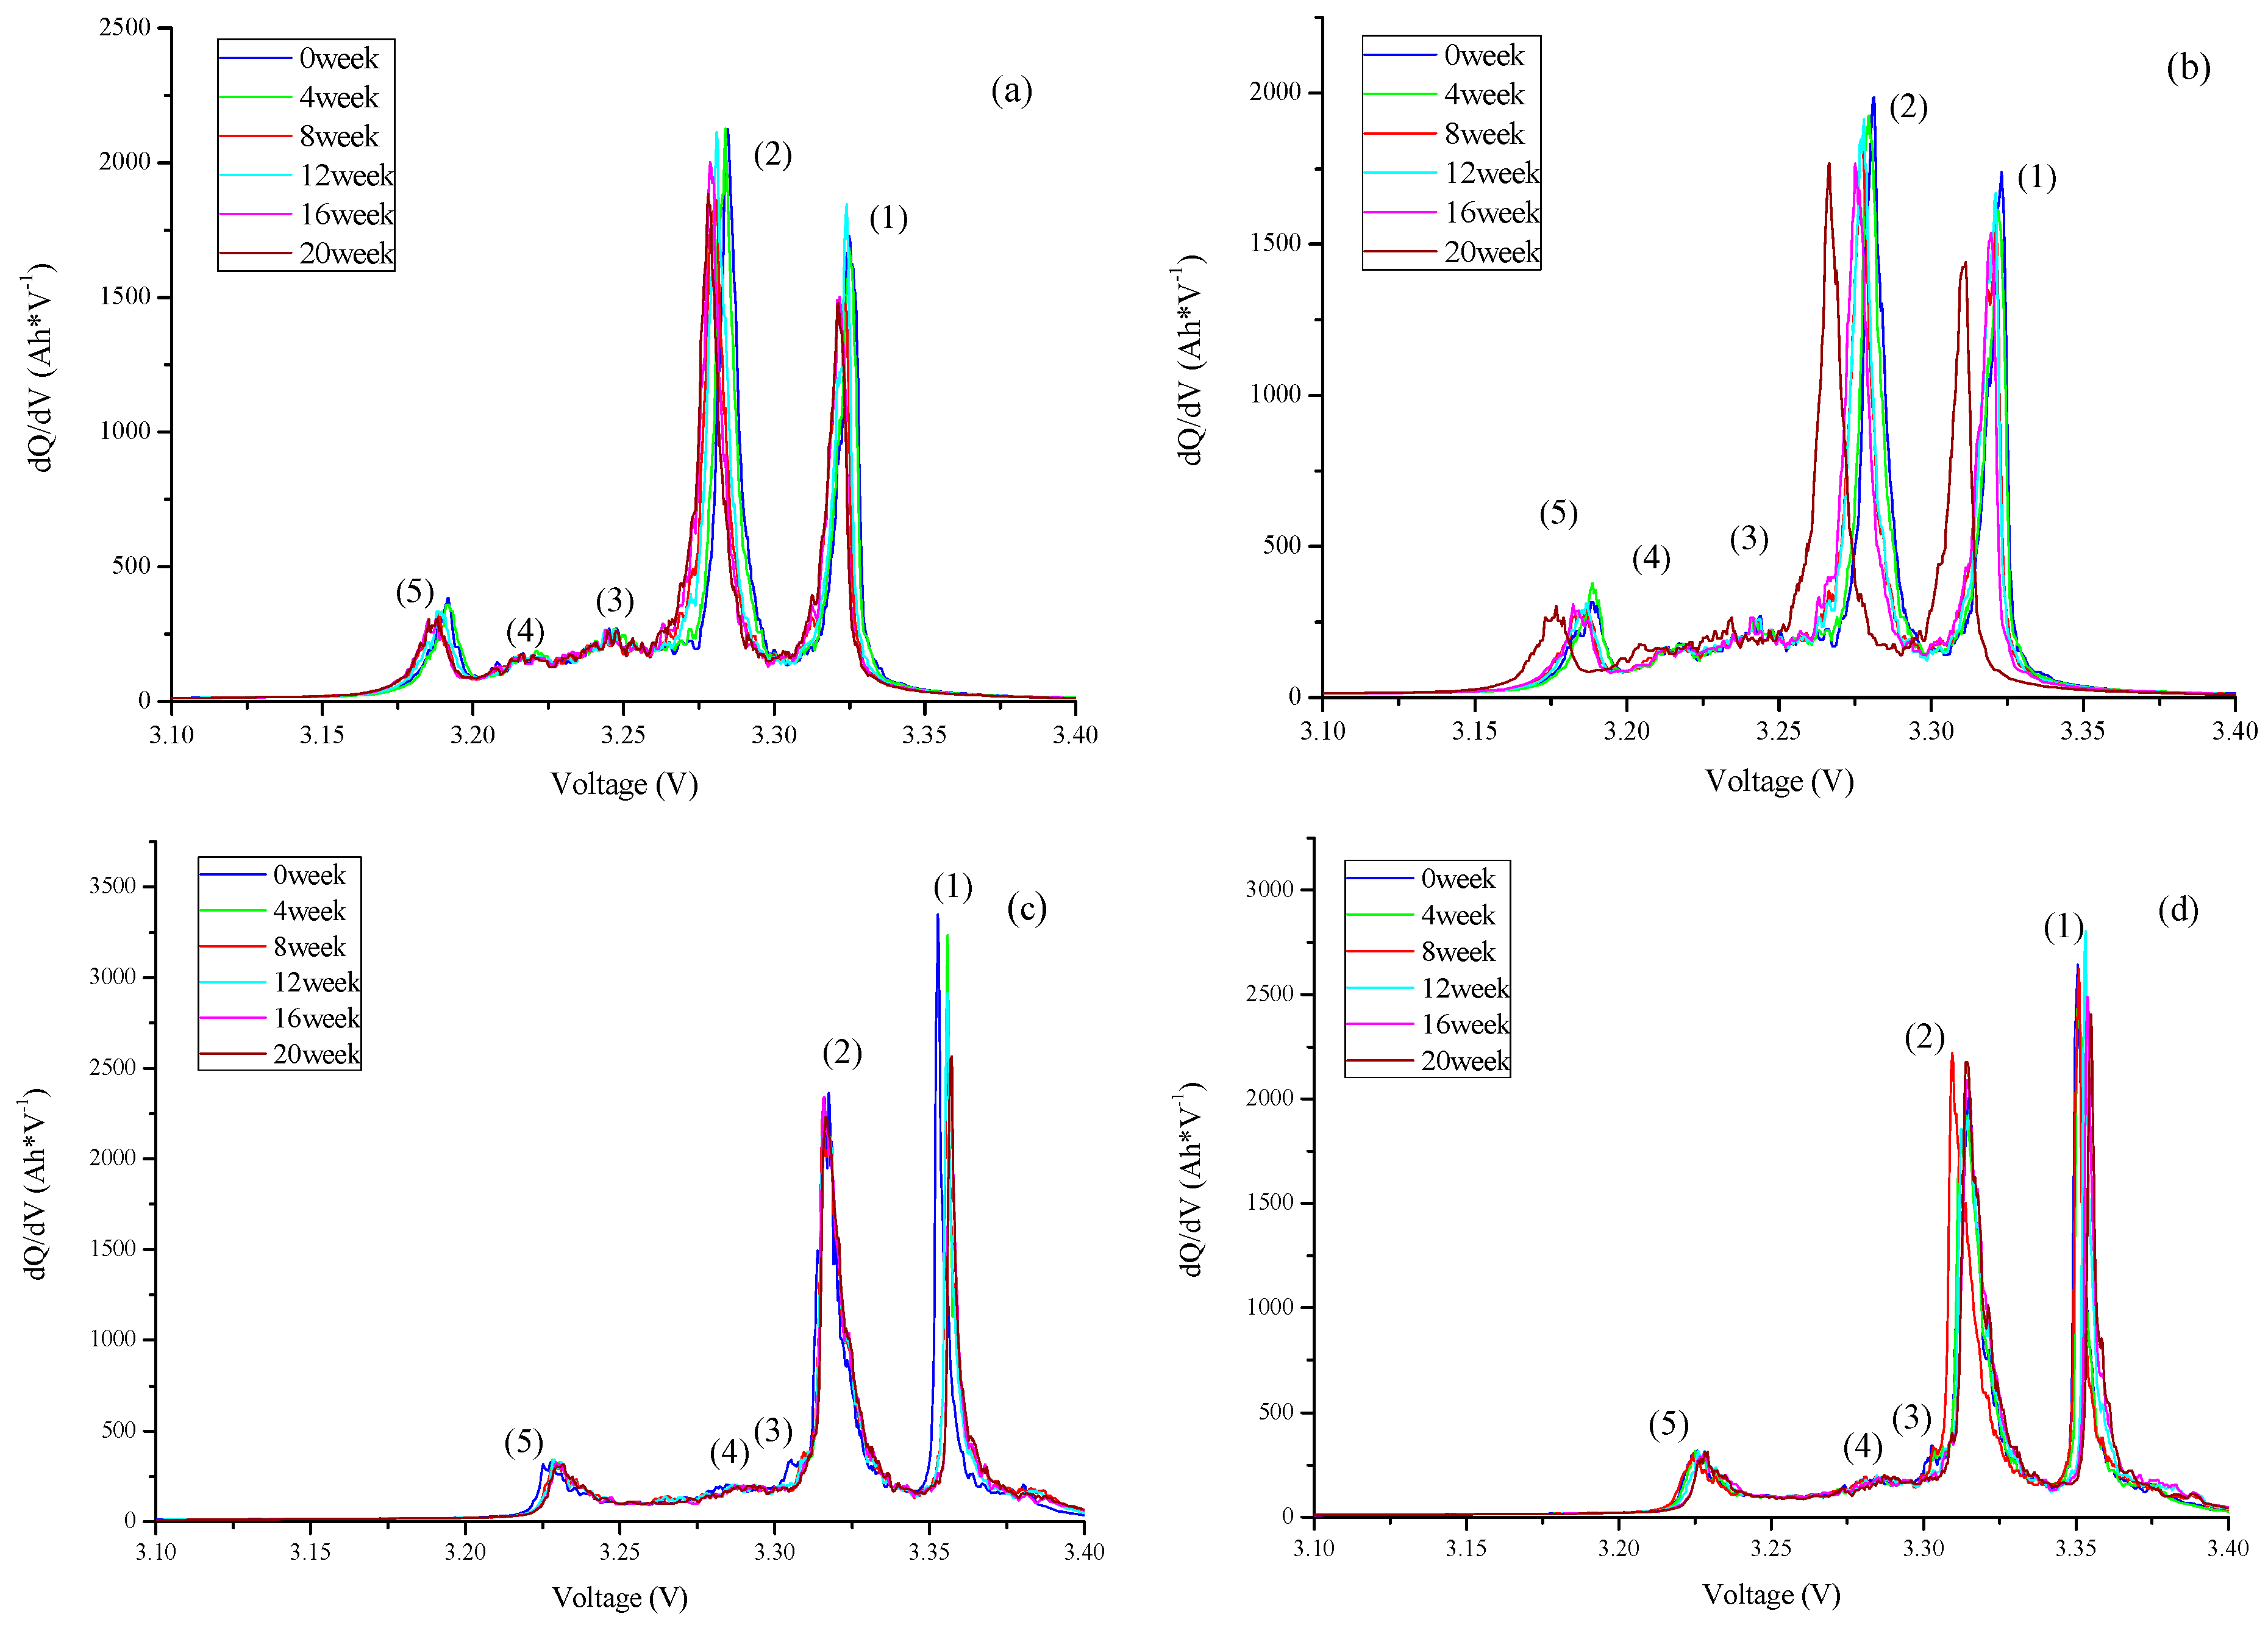
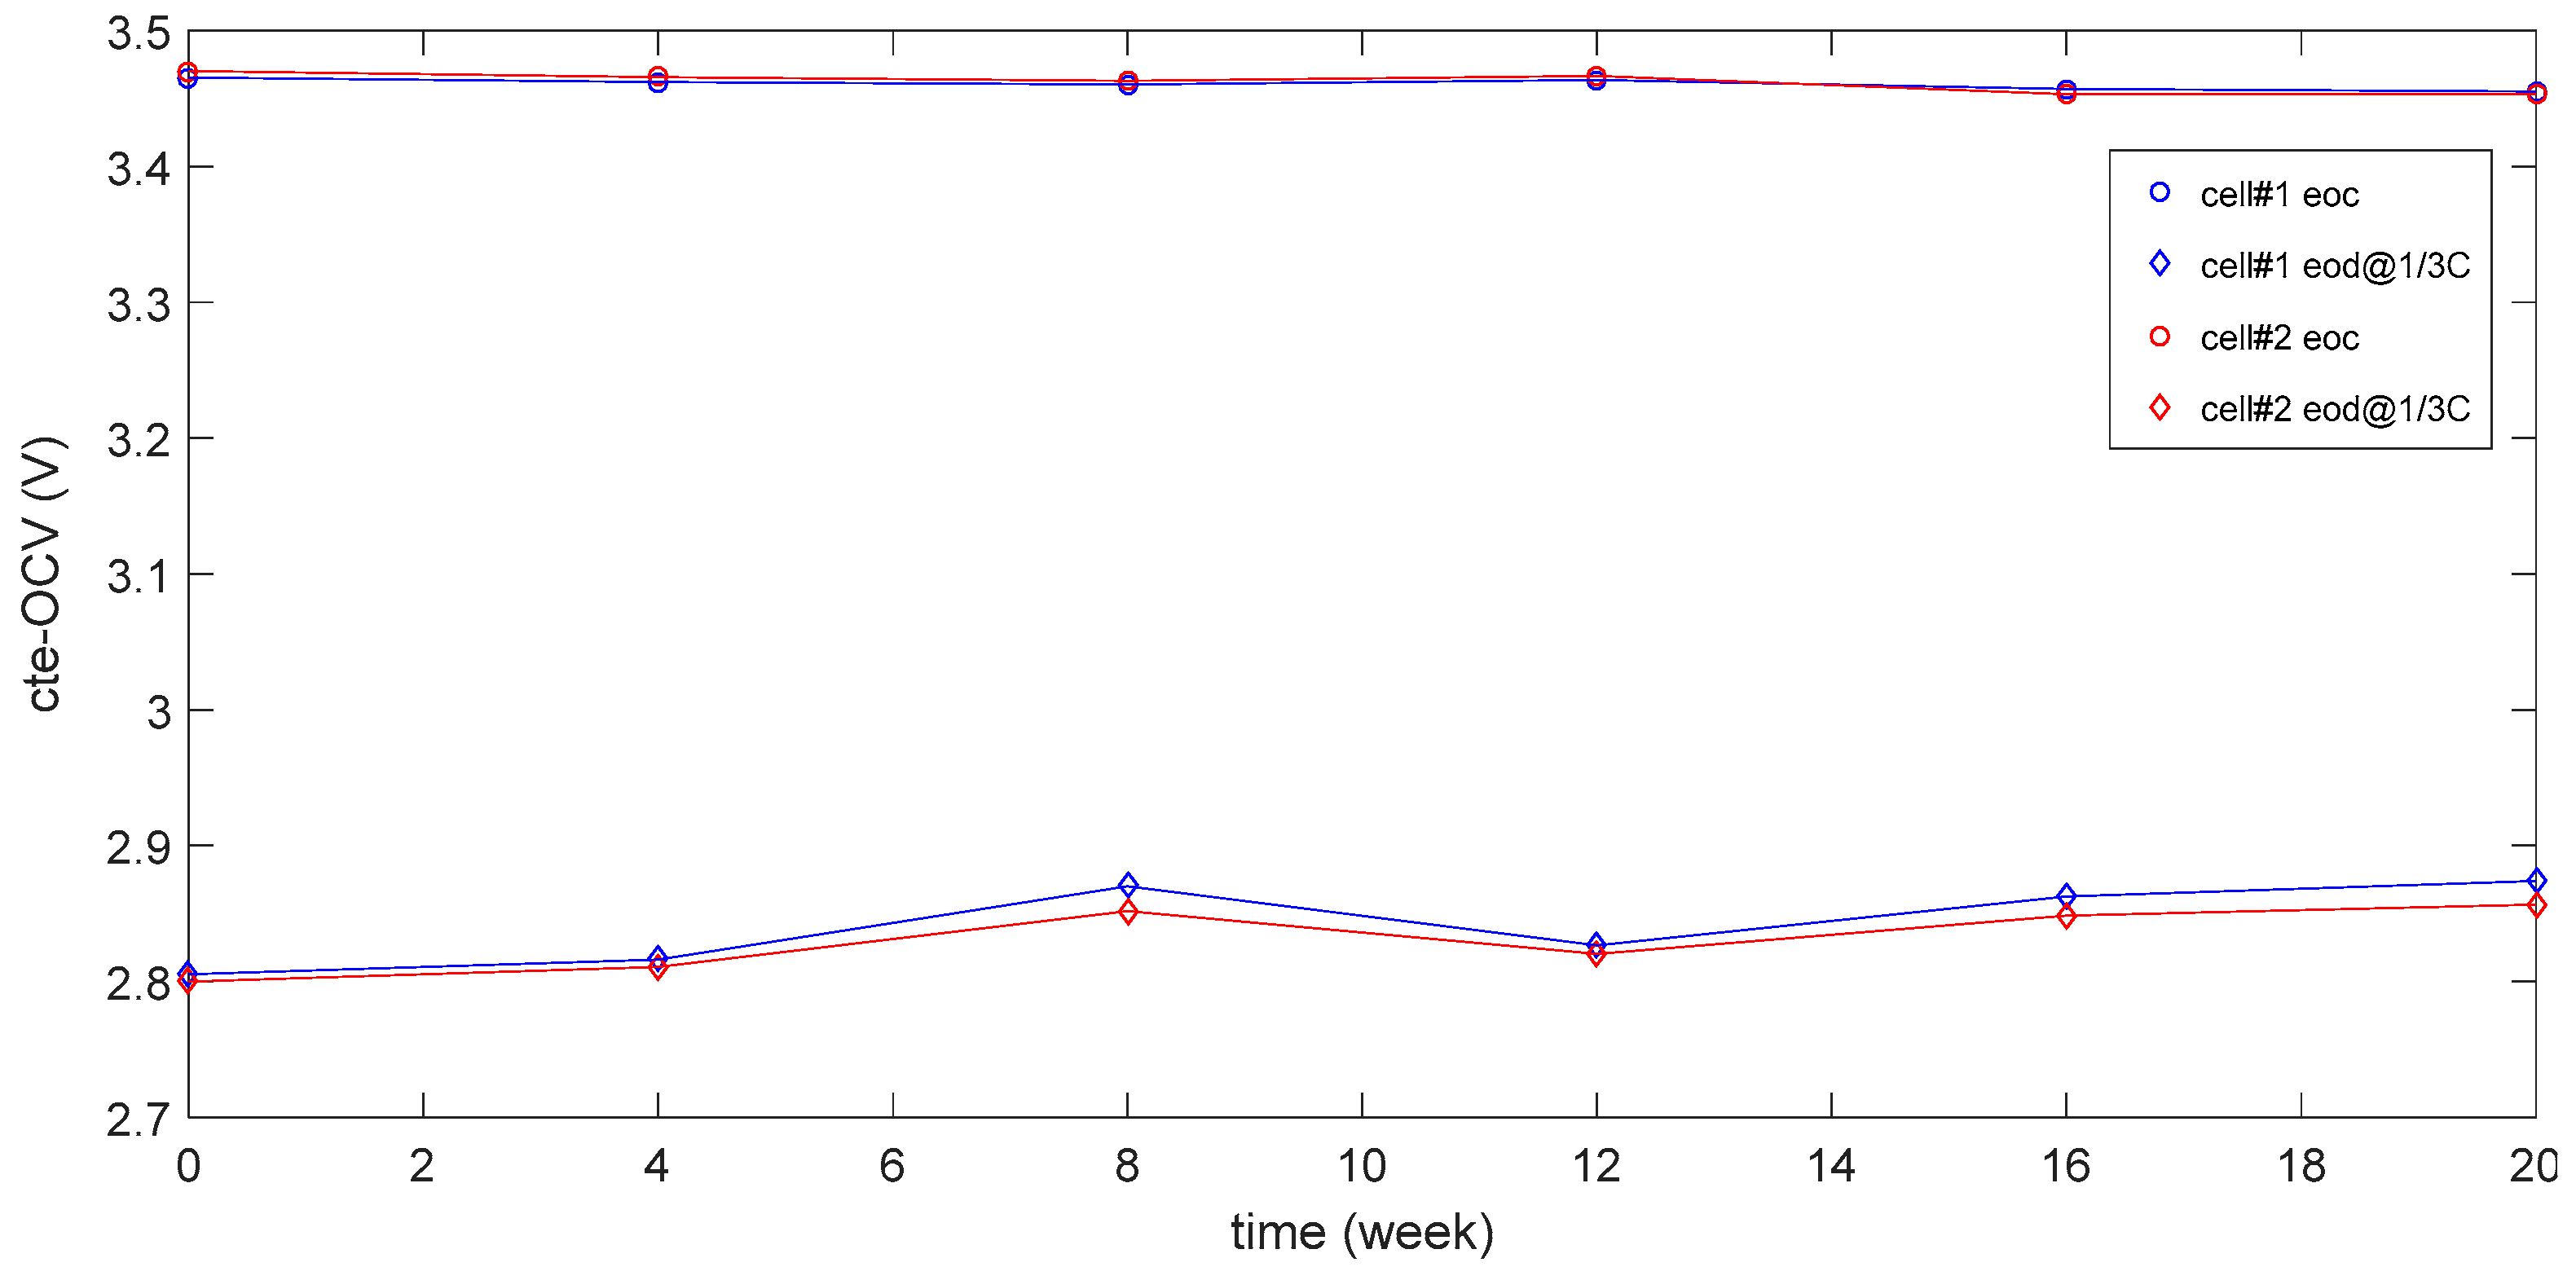
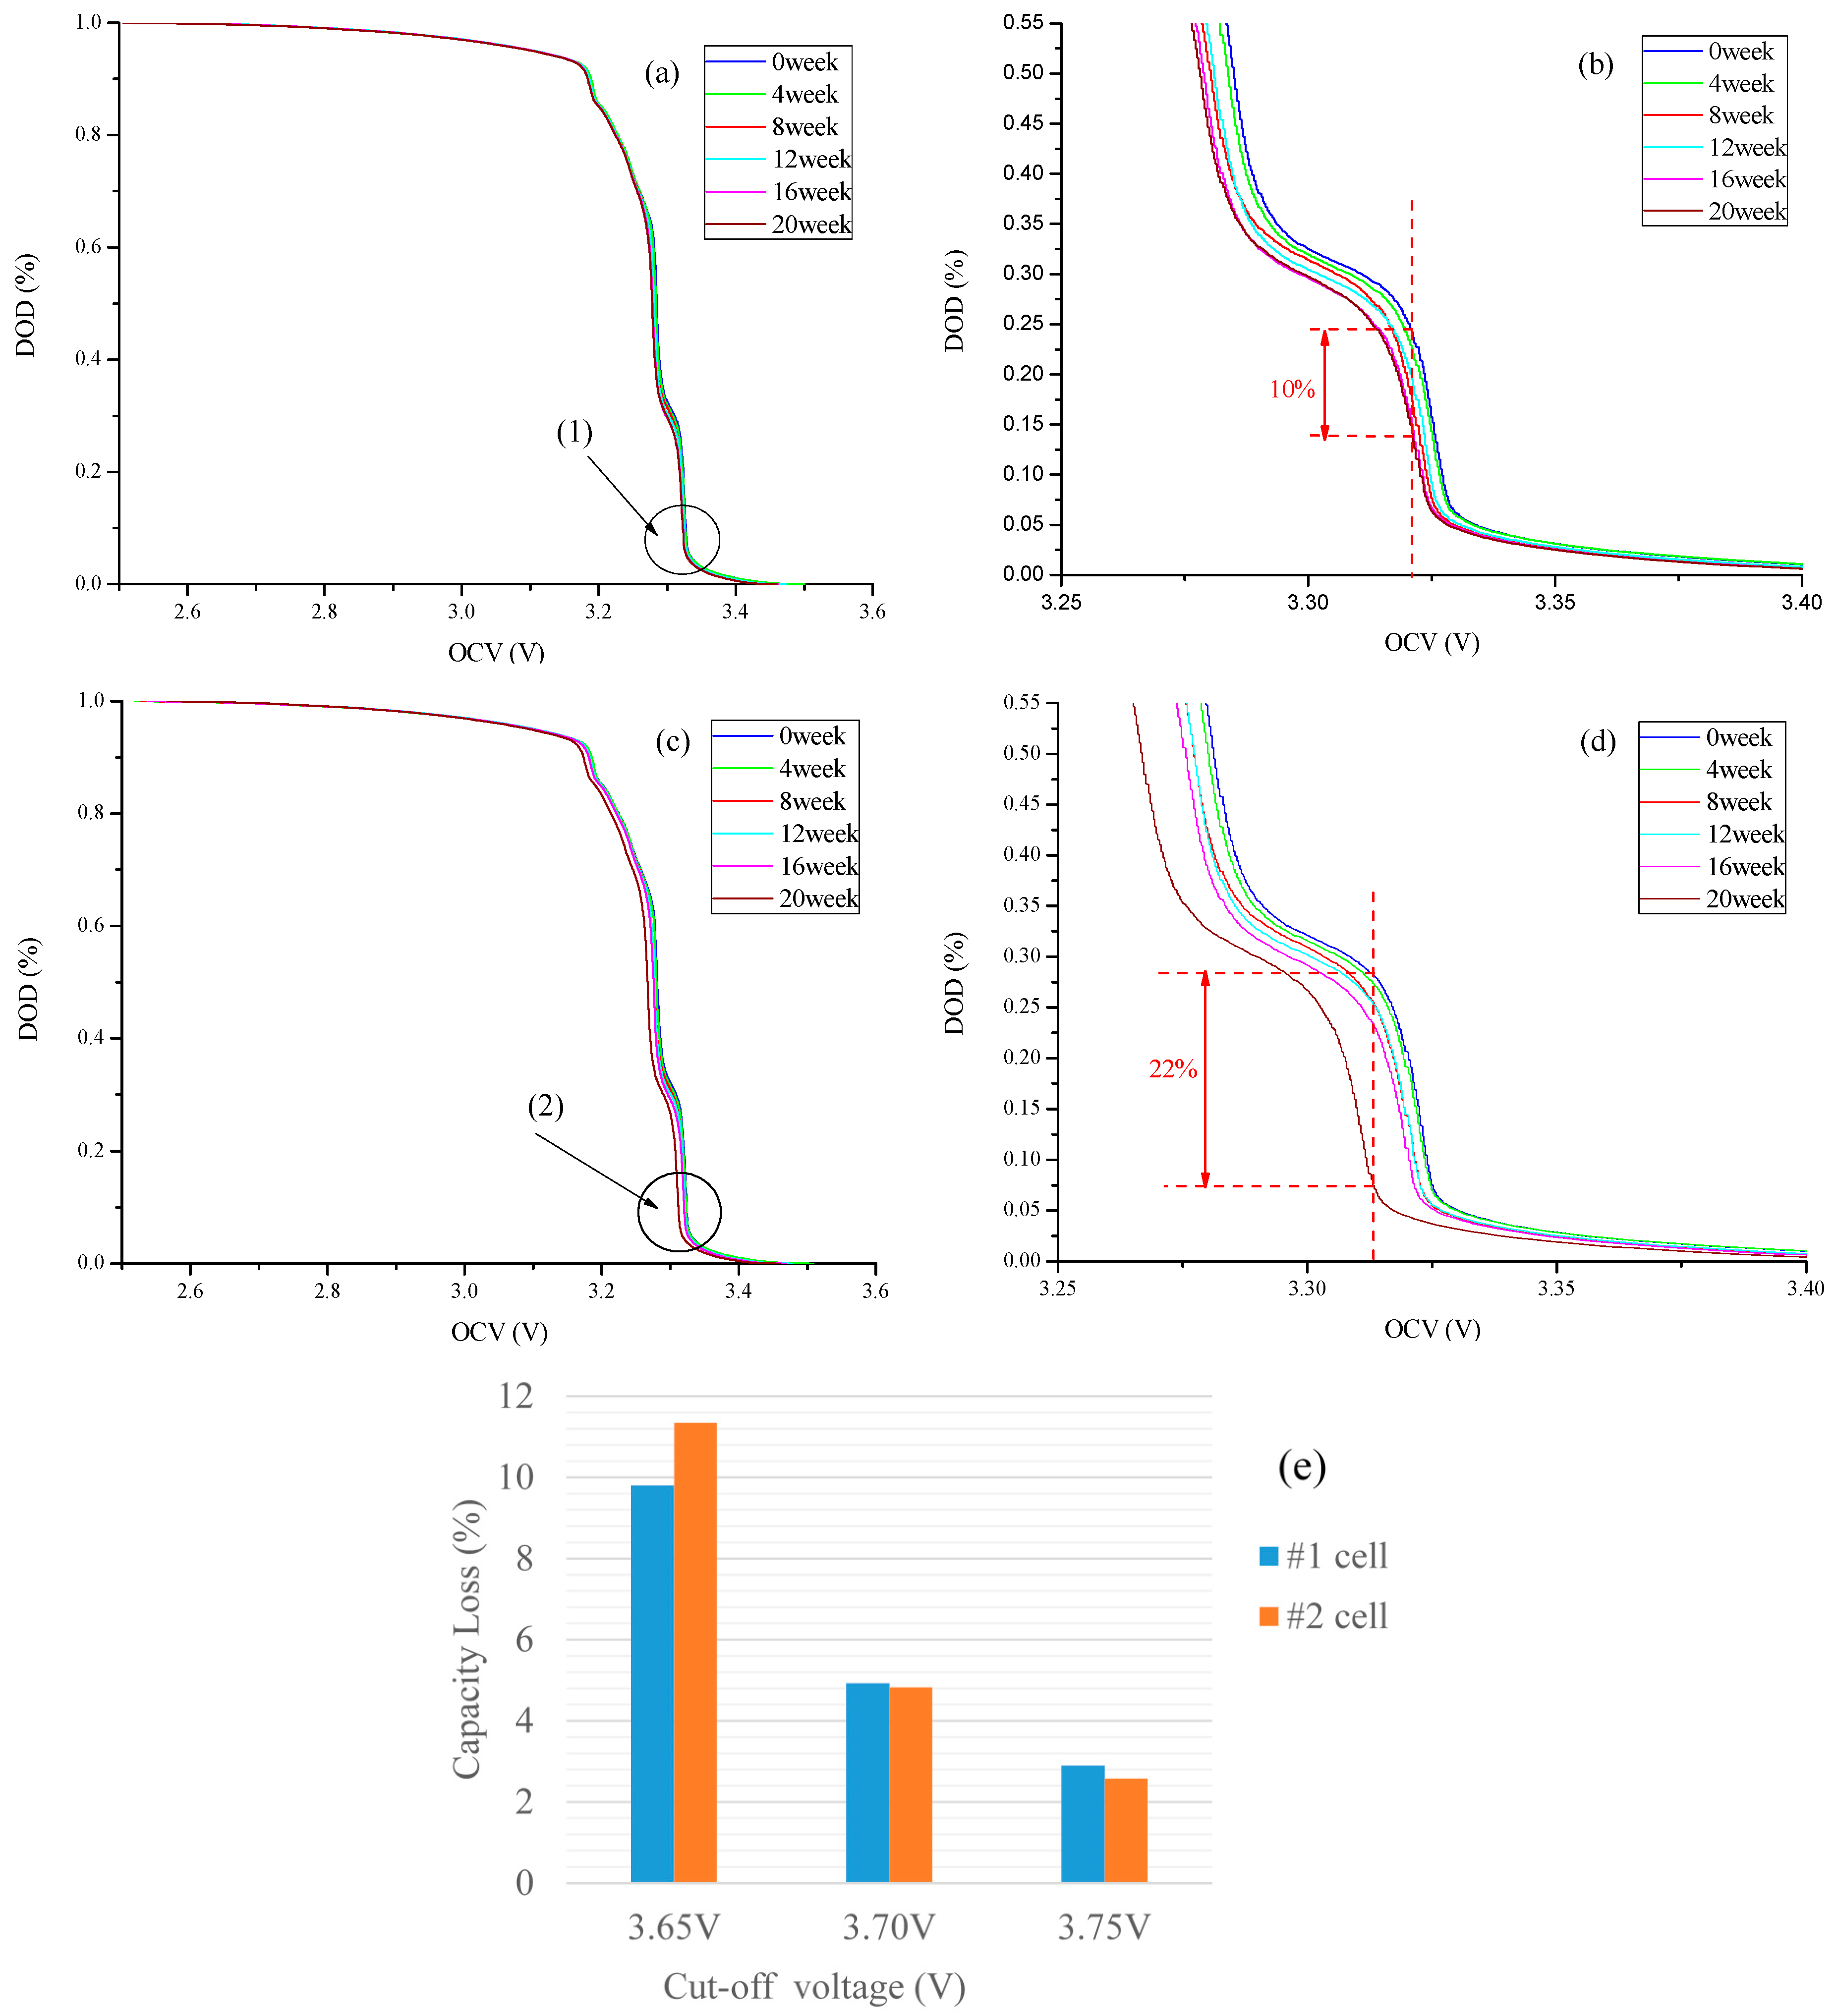
3.3. Analysis of the Degradation Mechanism

To further understand the degradation mechanism of two cells in the ageing process, an IC analysis is employed with the use of C/3 constant-current discharge data obtained at each RPT. ICA can trace the changes in the cell reaction, which provides the information of the battery mechanism inference. The ICV curves derived from discharging are displayed in Figure 6a,b. Generally, there are five peaks that correspond to the five stages of Li+ reactions in the discharge of DV curve labeled as (1–5). The differences in the shape and the intensity in peaks (1) and (2) are significant at approximately 3.27 and 3.34 V. These two peaks are critical in the analysis of capacity fading as these mainly related to the phenomena for Li+ intercalation stage of graphite that are usually being LiC12 and LiC6 [25,40]. As the cell’s capacity or power gradually decreases, the peak potential in (1) shifts to the left side from 3.33 to 3.32 V for the #1 cell and 3.33 to 3.30 V for the #2 cell, respectively. The (1) peak position slides with cycles, indicating that the polarization resistance rapidly increases when the cells’ voltages reach the cut-off limit, thus leading to the UC of the cell to become severe. The shift degree is larger for cell #2 than that of cell #1, suggesting that cell #2 suffers more UC than that of cell #1.
Meanwhile, the peak (2) also slides towards the lower potentials, meaning a progressive increase in the polarization resistance. This result corroborates the conclusion drawn from Figure 4a. Moreover, through integration of the area that is enclosed with the coordinate axes, it is found that the area of peaks (1) and (2) decrease from 17.306 to 7.68 and from 17.608 to 17.27, respectively, for the #1 cell after 20 weeks. The decrease of peak intensity revealed that the LLI takes place in this stage. Unfortunately, whether the LAM occurs or not is unclear. Note that the UC and progressive increase in the polarization resistance also lower the operating voltage, leading to the decrease in the pulse power. The extent of the offset is larger between the 16th and the 20th week than that of the others, coinciding to the phenomenon observed in Figure 4b.
Figure 6c,d display the charge DV curves of different weeks for two cells. Similar to the discharge curves, there are also five peaks in the charge curves. However, the main peak between 3.35 and 3.40 V slides to the right side with the time. This phenomenon leads to UC in every cycle and further results in the UD, thereby agreeing with the results stated above.
Although the #1 and #2 cells are set under different ratios, 0.5 and 0.75, respectively, it is found from capacity and power loss in Figure 3 and Figure 5 as well as the DVA result that there is no obviously quantitative relationship between the ratio and the decrease in capacity and power. The loss of capacity and power is more severe for the #2 cell than that of the #1 cell. However, it follows the same trend and significant changes occur nearly at the same week. In the initial four weeks, the capacity and power of both cells decrease monotonically and it is inferred that UC is the culprit in this stage. Moreover, further degradation is observed from the 4th to 8th week and from the 16th to 20th week, which are different from that of the initial four weeks, considering that the sigmoidal transitions are observed. The mechanism of degradation has changed and LLI has become the main reason that makes the cells fade. The different ratios only affect the degradation degree, but not the time when the LLI occurs. However, if the cells serve as a power source in PHEV, more CD mode operation causes the cell to suffer more capacity and power degradation, but the degradation degree is less than 10% (which will be discussed further later on) in 80% (16 of 20 weeks) of the entire lifespan. In the last 20% of the lifespan, the difference of degradation becomes severe.
The cte-OCV test is carried out by measuring the voltage vs. DOD curve under a 1/25 C rate. The polarization effect under this low rate is minute enough to be negligible [20]. This method can provide accurate estimates of SOC and trace the progression with ageing. The cte-OCV is employed to demonstrate the fading mechanism. Figure 7 shows the cte-OCV as a function of cycle time for 1/3 C rate at the end of the relaxation when the cell is at the end of charge (EOC) or end of discharge (EOD). It is noticed that the voltage at EOC remains constant with cycles. From the charging curves shown in Figure 1, it is found that EOC is located at the voltage plateau, which is especially flat for LFP. For EOD, cte-OCV remains stable at its first four weeks and gradually increases with cycles. Such phenomena indicate that the UC plays the main role for the degradation of both cells.
Note that the #2 cell’s voltage at EOD is lower than that of the #1 cell, suggesting that the #1 cell suffers more UD than that of the #2 cell. This reverse trend starts from the 4th week, when the second stage of the capacity fading occurs. In accordance with the former results, the #2 cell suffers more loss of capacity and power than the #1 cell. Therefore, the #2 cell should have more UD than the #1 cell. However, Figure 7 shows a discrepancy of the voltage at EOD. In stage two of capacity fading, LLI and LAM take place, but their attribution to the fading has a different proportion. The #1 cell suffers more destabilization of SEI and disorder of graphite surface, affecting the Li+ intercalation process at a low potential. More details of this phenomenon remain for further investigation.
In addition, we are interested on the capacity loss at the specific voltage when phase transition takes place. We utilized the DOD versus cte-OCV curves to analyze. As main degradation occurred at approximately 3.30 to 3.34 V, such a range is zoomed in on to take a closer look. Figure 8b,d showed that there is 10% capacity loss for the #1 cell and 22% capacity loss for the #2 cell, nearly at the peak voltage position from the 0th week to the 20th week. As the capacity loss due to UC can be restored [21], we did several additional tests through raising the cut-off voltage from 3.65 to 3.75 V with an increment of 0.05 V, and the capacity determined through C/3 were shown in Figure 8e. The capacity loss restored for both cells, especially for cell #2, nearly 8.7% out of the total 11.3% capacity loss, has been recovered. Thus, for LFP, there is approximately 77% of the total capacity loss that can be restored by simply raising the charging cut-off voltage, which is consistent with the conclusion from Dubarry et al. [21]. Based on this conclusion, there is 2.0% irreversible capacity loss for the #1 cell and 4.4% for the #2 cell, respectively. The difference of irreversible capacity loss is 2.4% between the two cells. Furthermore, 2.4% is an acceptable value for PHEV, while more energy can be saved and less exhaust can be reduced by raising the percentage of the CD mode.
In accordance with the above discussion, it is concluded that both cells show two stages of degradation behavior while the fading accelerates greatly in the second stage and remains relatively stable in other stages. Through the analysis of DOD vs. cte-OCV curves, it is found that the #1 and #2 cells lose 10% and 22% capacity, respectively, at approximately peak voltage position.

4. Conclusions

We proposed a method to study the ageing process of two cells. Two groups of cells were tested under a specific duty test cycle, in which the ratio factor was considered, and results were analyzed by ICA and cte-OCV. Several ageing rules for this particular chemistry were summarized and the effects of the ratio in the ageing process were demonstrated. The results of this study show that, although the increase in CD mode operation induces degradation of the cells, the two-stage ageing behavior occurs nearly at the same time. Moreover, we explained the degradation mechanism with the help of IC analysis. Results showed that LLI and LAM occurred at the second-stage capacity fading, and polarization resistance was the main reason for power fading. In addition, cte-OCV analysis showed that SEI stabilization on the graphite surface also influenced the UC and UD of the cell. Particularly, 10% and 22% capacity losses were observed for the two cells at the Li+ phase transition voltage (approximately 3.32 V in accordance with the DV peaks). In addition to the reversible capacity loss, the difference between the two cells was 2.4%. For real-world PHEV applications, CD and CS modes usually shift based on the preset SOC threshold. The larger range of SOC was set, and the higher ratio was obtained during one drive cycle. Based on the conclusion drawn above, the difference between the two modes in power and capacity degradation were relatively limited. However, the higher ratio was beneficial for saving more energy and reducing vehicle emissions for PHEVs.
In our next work, we will investigate other external factors of degradation and systematically summarize the influence of each factor. Considering the various factors that affect the degradation, the weight value of each factor will be discussed. Moreover, cells’ degradation becomes more severe in the battery pack due to their inconsistency characteristic. However, the proposed methodology has profound potential for analyzing the battery pack in different ageing scenarios.

Acknowledgments

This work was funded by the National Natural Science Foundation of China under Project Numbers 51275367 and 51106115, and the National Key Technology R&D Program (2013BAG09B00). The authors express special thanks to anonymous reviewers for their valuable suggestions in improving this paper.

Author Contributions

Changqing Du and Fuwu Yan conceived and designed the experiments; Chi Zhang performed the experiments and analyzed the data; all the test equipment and batteries involved in this paper are provided by Professor Fuwu Yan; Chi Zhang wrote the paper, Jianqiang Kang and Richard Fiifi Turkson help to revise this paper.

Conflicts of Interest

The authors declare no conflict of interest.

References

  1. Capasso, C.; Veneri, O. Experimental analysis on the performance of lithium based batteries for road full electric and hybrid vehicles. Appl. Energy 2014, 136, 921–930. [Google Scholar] [CrossRef]
  2. Scrosati, B.; Garche, J. Lithium batteries: Status, prospects and future. J. Power Sources 2010, 195, 2419–2430. [Google Scholar] [CrossRef]
  3. Zhang, W.-J. Structure and performance of LiFePO4 cathode materials: A review. J. Power Sources 2011, 196, 2962–2970. [Google Scholar] [CrossRef]
  4. Berecibar, M.; Gandiaga, I.; Villarreal, I.; Omar, N.; Van Mierlo, J.; Van den Bossche, P. Critical review of state of health estimation methods of Li-ion batteries for real applications. Renew. Sustain. Energy Rev. 2016, 56, 572–587. [Google Scholar] [CrossRef]
  5. Farmann, A.; Waag, W.; Marongiu, A.; Sauer, D.U. Critical review of on-board capacity estimation techniques for lithium-ion batteries in electric and hybrid electric vehicles. J. Power Sources 2015, 281, 114–130. [Google Scholar] [CrossRef]
  6. Neubauer, J.; Pesaran, A. The ability of battery second use strategies to impact plug-in electric vehicle prices and serve utility energy storage applications. J. Power Sources 2011, 196, 10351–10358. [Google Scholar] [CrossRef]
  7. Berecibar, M.; Devriendt, F.; Dubarry, M.; Villarreal, I.; Omar, N.; Verbeke, W.; Van Mierlo, J. Online state of health estimation on NMC cells based on predictive analytics. J. Power Sources 2016, 320, 239–250. [Google Scholar] [CrossRef]
  8. Dong, H.; Jin, X.; Lou, Y.; Wang, C. Lithium-ion battery state of health monitoring and remaining useful life prediction based on support vector regression-particle filter. J. Power Sources 2014, 271, 114–123. [Google Scholar] [CrossRef]
  9. Du, J.; Liu, Z.; Wang, Y.; Wen, C. An adaptive sliding mode observer for lithium-ion battery state of charge and state of health estimation in electric vehicles. Control Eng. Pract. 2016, 54, 81–90. [Google Scholar] [CrossRef]
  10. Zhou, Y.; Huang, M.; Chen, Y.; Tao, Y. A novel health indicator for on-line lithium-ion batteries remaining useful life prediction. J. Power Sources 2016, 321, 1–10. [Google Scholar] [CrossRef]
  11. Li, X.; Jiang, J.; Wang, L.Y.; Chen, D.; Zhang, Y.; Zhang, C. A capacity model based on charging process for state of health estimation of lithium ion batteries. Appl. Energy 2016, 177, 537–543. [Google Scholar] [CrossRef]
  12. Lu, L.; Han, X.; Li, J.; Hua, J.; Ouyang, M. A review on the key issues for lithium-ion battery management in electric vehicles. J. Power Sources 2013, 226, 272–288. [Google Scholar] [CrossRef]
  13. Weng, C.; Cui, Y.; Sun, J.; Peng, H. On-board state of health monitoring of lithium-ion batteries using incremental capacity analysis with support vector regression. J. Power Sources 2013, 235, 36–44. [Google Scholar] [CrossRef]
  14. Weng, C.; Feng, X.; Sun, J.; Peng, H. State-of-health monitoring of lithium-ion battery modules and packs via incremental capacity peak tracking. Appl. Energy 2016, 180, 360–368. [Google Scholar] [CrossRef]
  15. Dubarry, M.; Liaw, B.Y.; Chen, M.-S.; Chyan, S.-S.; Han, K.-C.; Sie, W.-T.; Wu, S.-H. Identifying battery aging mechanisms in large format Li ion cells. J. Power Sources 2011, 196, 3420–3425. [Google Scholar] [CrossRef]
  16. Han, X.; Ouyang, M.; Lu, L.; Li, J. Cycle life of commercial lithium-ion batteries with lithium titanium oxide anodes in electric vehicles. Energies 2014, 7, 4895–4909. [Google Scholar] [CrossRef]
  17. Berecibar, M.; Garmendia, M.; Gandiaga, I.; Crego, J.; Villarreal, I. State of health estimation algorithm of LiFePO4 battery packs based on differential voltage curves for battery management system application. Energy 2016, 103, 784–796. [Google Scholar] [CrossRef]
  18. Bloom, I.; Jansen, A.N.; Abraham, D.P.; Knuth, J.; Jones, S.A.; Battaglia, V.S.; Henriksen, G.L. Differential voltage analyses of high-power, lithium-ion cells. J. Power Sources 2005, 139, 295–303. [Google Scholar] [CrossRef]
  19. Liu, G.; Ouyang, M.; Lu, L.; Li, J.; Han, X. Online estimation of lithium-ion battery remaining discharge capacity through differential voltage analysis. J. Power Sources 2015, 274, 971–989. [Google Scholar] [CrossRef]
  20. Dubarry, M.; Liaw, B.Y. Identify capacity fading mechanism in a commercial LiFePO4 cell. J. Power Sources 2009, 194, 541–549. [Google Scholar] [CrossRef]
  21. Dubarry, M.; Svoboda, V.; Hwu, R.; Liaw, B.Y. Capacity and power fading mechanism identification from a commercial cell evaluation. J. Power Sources 2007, 165, 566–572. [Google Scholar] [CrossRef]
  22. Feng, X.; Li, J.; Ouyang, M.; Lu, L.; Li, J.; He, X. Using probability density function to evaluate the state of health of lithium-ion batteries. J. Power Sources 2013, 232, 209–218. [Google Scholar] [CrossRef]
  23. Honkura, K.; Takahashi, K.; Horiba, T. Capacity-fading prediction of lithium-ion batteries based on discharge curves analysis. J. Power Sources 2011, 196, 10141–10147. [Google Scholar] [CrossRef]
  24. Wang, L.; Pan, C.; Liu, L.; Cheng, Y.; Zhao, X. On-board state of health estimation of LiFePO4 battery pack through differential voltage analysis. Appl. Energy 2016, 168, 465–472. [Google Scholar] [CrossRef]
  25. Torai, S.; Nakagomi, M.; Yoshitake, S.; Yamaguchi, S.; Oyama, N. State-of-health estimation of LiFePO4/graphite batteries based on a model using differential capacity. J. Power Sources 2016, 306, 62–69. [Google Scholar] [CrossRef]
  26. Galeotti, M.; Cinà, L.; Giammanco, C.; Cordiner, S.; Di Carlo, A. Performance analysis and SOH (state of health) evaluation of lithium polymer batteries through electrochemical impedance spectroscopy. Energy 2015, 89, 678–686. [Google Scholar] [CrossRef]
  27. Bartlett, A.; Marcicki, J.; Rhodes, K.; Rizzoni, G. State of health estimation in composite electrode lithium-ion cells. J. Power Sources 2015, 284, 642–649. [Google Scholar] [CrossRef]
  28. Yan, D.; Lu, L.; Li, Z.; Feng, X.; Ouyang, M.; Jiang, F. Durability comparison of four different types of high-power batteries in HEV and their degradation mechanism analysis. Appl. Energy 2016, 179, 1123–1130. [Google Scholar] [CrossRef]
  29. Cordoba-Arenas, A.; Onori, S.; Guezennec, Y.; Rizzoni, G. Capacity and power fade cycle-life model for plug-in hybrid electric vehicle lithium-ion battery cells containing blended spinel and layered-oxide positive electrodes. J. Power Sources 2015, 278, 473–483. [Google Scholar] [CrossRef]
  30. Belt, J.R. Battery Test Manual for Plug-In Hybrid Electric Vehicles; INL/EXT-07-12536; United States Department of Energy: Washington, DC, USA, 2010.
  31. Banvait, H.; Anwar, S.; Chen, Y. A rule-based energy management strategy for plug-in hybrid electric vehicle. In Proceedings of the American Control Conference, St. Louis, MO, USA, 10–12 June 2009.
  32. Lithium-Ion Battery for Electric Road Vehicles; The Chinese National Development and Reform Commission: Beijing, China, 2006.
  33. Han, X.; Ouyang, M.; Lu, L.; Li, J.; Zheng, Y.; Li, Z. A comparative study of commercial lithium ion battery cycle life in electrical vehicle: Aging mechanism identification. J. Power Sources 2014, 251, 38–54. [Google Scholar] [CrossRef]
  34. Dubarry, M.; Truchot, C.; Liaw, B.Y. Synthesize battery degradation modes via a diagnostic and prognostic model. J. Power Sources 2012, 219, 204–216. [Google Scholar] [CrossRef]
  35. Vetter, J.; Novák, P.; Wagner, M.R.; Veit, C.; Möller, K.C.; Besenhard, J.O.; Winter, M.; Wohlfahrt-Mehrens, M.; Vogler, C.; Hammouche, A. Ageing mechanisms in lithium-ion batteries. J. Power Sources 2005, 147, 269–281. [Google Scholar] [CrossRef]
  36. Klett, M.; Eriksson, R.; Groot, J.; Svens, P.; Ciosek Högström, K.; Lindström, R.W.; Berg, H.; Gustafson, T.; Lindbergh, G.; Edström, K. Non-uniform aging of cycled commercial LiFePO4 graphite cylindrical cells revealed by post-mortem analysis. J. Power Sources 2014, 257, 126–137. [Google Scholar] [CrossRef]
  37. Liu, H. Study on SOC Estimation Method of Lithium-Ion Battery Based on EKF for Electric Vehicle; Beijing Jiaotong University: Beijing, China, 2010. [Google Scholar]
  38. Dubarry, M.; Truchot, C.; Liaw, B.Y.; Gering, K.; Sazhin, S.; Jamison, D.; Michelbacher, C. Evaluation of commercial lithium-ion cells based on composite positive electrode for plug-in hybrid electric vehicle applications. Part II. Degradation mechanism under 2C cycle aging. J. Power Sources 2011, 196, 10336–10343. [Google Scholar] [CrossRef]
  39. Verma, P.; Maire, P.; Novák, P. A review of the features and analyses of the solid electrolyte interphase in Li-ion batteries. Electrochim. Acta 2010, 55, 6332–6341. [Google Scholar] [CrossRef]
  40. Dubarry, M.; Truchot, C.; Cugnet, M.; Liaw, B.Y.; Gering, K.; Sazhin, S.; Jamison, D.; Michelbacher, C. Evaluation of commercial lithium-ion cells based on composite positive electrode for plug-in hybrid electric vehicle applications. Part I: Initial characterizations. J. Power Sources 2011, 196, 10328–10335. [Google Scholar] [CrossRef]
Figure 1. (a) Charge depleting (CD); and (b) charge sustaining (CS) current micro-cycles.
Energies 10 00110 g001
Figure 2. Voltage vs. depth of discharge (DOD) curves for different rates.
Energies 10 00110 g002
Figure 3. Proportion of capacity loss varying with time for ratio = 0.5 and 0.75, respectively.
Energies 10 00110 g003
Figure 4. (a) Discharge curve of different week range at C/3 rate; and (b) resistance increase with duty cycles time for the #1 and #2 cells.
Energies 10 00110 g004
Figure 5. Pulse power capacity vs. DOD for the #1 and #2 cells: (a) #1 cell; and (b) #2 cell.
Energies 10 00110 g005
Figure 6. Discharge and charge incremental capacity (IC) curve of different weeks for two cells: (a) #1 cell for discharge; (b) #2 cell for discharge; (c) #1 cell for charge; and (d) #2 cell for charge.
Energies 10 00110 g006
Figure 7. Relaxed cell voltage during constant current charge and discharge at C/3. cte-OCV: close-to-equilibrium open circle voltage.
Energies 10 00110 g007
Figure 8. (ad) DOD vs. cell voltage curve and the enlarged view of (1) and (2) place; and (e) capacity loss of cells #1 and #2 at different cut-off voltage determined by C/3C.
Energies 10 00110 g008
Table 1. Main parameters of cells.
ParameterDischarge ValueCharge Value
Rated Voltage3.2 V
Nominal Capacity60 Ah
Cut-off Voltage2.5 V3.65 V
Operation Temperature−20 °C–55 °C0 °C–45 °C

