
The Influence of Party Organization Involvements in Corporate Governance on Innovation: Evidence from China’s Private-Owned Enterprises

School of Economics, Beijing Technology and Business University, Beijing 100048, China
*
Author to whom correspondence should be addressed.
Sustainability 2022, 14(24), 16334; https://doi.org/10.3390/su142416334
Submission received: 20 October 2022
/
Revised: 27 November 2022
/
Accepted: 2 December 2022
/
Published: 7 December 2022
Abstract
:As the grassroots-party organizations of the Communist Party of China (CPC) are increasingly involved in the governance of private-owned enterprises (POEs), whether this new pattern promotes corporate innovation is still a research gap. Therefore, based on the data of 1357 POEs’ party-organization involvements and their patent applications from 2003 to 2017, this paper analyzes the impact of the party-organization involvements on corporate innovation by using the multiple regression model. The results include: (1) party-organization involvements including party organization activities and senior executives’ participation can significantly promote innovation, especially after 2012; (2) party-organization activities improve innovation by increasing research and development (R&D) investment and reducing operating risk, while the senior executives’ participation only influences on R&D investment; (3) the party-organization involvements have a stronger promotion on non-invention patent applications, especially for the utility-model-patent applications, than invention-patent applications; (4) the promotion is more pronounced for family businesses, technology-intensive and capital-intensive enterprises, as well as those located in the northern, Beijing-Tianjin-Hebei region and Yangtze River delta. After applying PSM sampling and difference-in-differences (DID) analyses, and substituting the dependent variables, the results remain robust. This paper provides Chinese evidence for party construction and corporate innovation, and also provides references about political connection and corporate innovation for other countries to some extent.
1. Introduction
Corporate innovation shoulders a major mission to promote the high-quality and sustainable development of a country’s economy, and is also a key factor determining the direction, scale, and speed of enterprise development [1,2]. Innovation, achieving an annual growth rate of 5–10% in recent years, exceeds the growth rate of global economy. Asia, especially China, plays an important role in the process of global innovation increase, and is also an important participant in international frontier innovation [3,4]. According to the Global Innovation Index Report released by the World Intellectual Property Organization in 2022, China’s ranking rose from 22nd in 2017 to 11th in 2022, ranking first among middle-income economies and one of the fastest improving countries in the world (https://www.globalinnovationindex.org/ (accessed on 29 September 2022)). According to the “World Intellectual Property Indicators Report 2022”, the number of patent applications in China in 2021 ranked first in the world, accounting for 45.7% of the world total (http://www.unism.org.cn/uploads/20220128/5b657dcb1195ca1aed3a726107efcf76.pdf (accessed on 23 November 2022). In addition, according to the report of Boston Consulting Group on “Top 50 Most Innovative Enterprises in the World in 2022”, there are seven Chinese enterprises on the list, accounting for 14%, a significant increase compared with 4% in 2019. For Chinese enterprises, private-owned enterprises (POEs) have become the main force of innovation. In terms of the number of innovation-subject enterprises with different ownership, POEs reached 1083 in 2017, accounting for 72.2% of the selected enterprises, while state-owned enterprises (SOEs) account for 20.06% (https://www.business.hsbc.com.cn/-/media/media/china/pdf/campaigns/2017-innovation-report-cn.pdf?download=1 (accessed on 6 November 2017). Appendix A Table A1 is a list of abbreviations.
Scholars pay close attention to factors influencing corporate innovation and hope to promote sustainable development of enterprises by exploring and grasping the rules and characteristics of corporate innovation. At present, research on factors influencing corporate innovation is mainly carried out from the macro and micro aspects. In terms of the macro-influencing factors, there are human-capital status [5,6], economic and financial environment [7,8,9], fair environment and the degree of regional corruption [10,11], legal and intellectual property system [12,13], environmental regulations [14], policy uncertainty [15,16,17], and so on. As for the micro-influencing factors, there are shareholders, board of directors, management and stakeholders, enterprise scale and its culture, external information disclosure [18], corporate social responsibility [19], and ESG constraints [20]. Among them, most are about how corporate governance affects corporate innovation [21,22,23,24,25,26,27]. From the perspective of shareholders, good shareholder coordination and owner concentration promote corporate innovation [28]. At the board level, well-connected boards and culturally diverse board have a positive effect on innovation’s activity and quality [27]. From the perspective of management, executives’ salary, CEOs with doctor’s degrees, overseas experience [29], and managers with science and engineering backgrounds can effectively promote firms’ investment in innovation [25,26]. From the perspective of enterprise’s stakeholders, employment stability and employee treatment that are positively associated with innovation output [30,31], institutional investors’ site visits, increase in shareholding [32,33], and long-term incentives [34] will have a significant positive effect on innovation. Moreover, retail-investor attention increases corporate green innovation by improving information transparency, alleviating financing constraints, and deterring agency costs [35]. Among these factors, corporate governance and system innovation dominate at the micro and macro levels, respectively [36].
Given that China has played an important role in global economy [37,38], the impact of new changes in China’s corporate governance on innovation has attracted scholars’ attention [39,40]. In September 2000, the Organization Department of the Central Committee of the CPC proposed a document titled “Views on reinforcing the Party Construction in Non-Public Enterprises including Individual and Private Enterprises (Trial Version)” that non-public enterprises should establish grassroots-party organizations. Since then, China has started to explore the pattern of grassroots-party-organization involvements in POEs’ governance [41]. This practice properly combines the macro factors and micro factors that affect corporate innovation, and links up internal spontaneous behavior and external traction behavior of corporate governance, forming a new pattern of party organization involvements in corporate governance [42]. The party organizations are involved in enterprises and play the effective roles in enterprise operation through indirect lead in guidance, supervision, rights protection, united front, coordination, and corporate culture construction [43,44]. The activities held by grassroots-party organizations in enterprises can lay a foundation for communication among members, facilitate mutual benefit and interaction through relationship embeddedness, as well as better utilize resources and improve innovation efficiency [45]. Additionally, when the board chairman or CEO of an enterprise participates in the activities (hereafter “senior executives’ participation”), members in the relationship network will be more closely connected [46]. With the deepening of relationship embeddedness, the degree of trust in the relationship network will further strengthen, which is conducive to promoting enterprise innovation [47].
In fact, the POEs have been growing stronger and their impact on China’s economy has become increasingly prominent. In 2021, China’s POEs reached 44.575 million, accounting for 92.1% of the whole enterprises, with a strong developmental trend [48]. Meanwhile, the party-organization involvements in POEs’ governance have become more and more common [49]. A total of 1.877 million non-public enterprises across the country established their party organizations in 2017, accounting for 73.1% of the whole non-public enterprises (http://dangjian.people.com.cn/n1/2018/0630/c117092-30097506.html (accessed on 30 July 2018)). Moreover, the average number of R&D investment and patent applications of private-owned listed enterprises with party-organization involvements in corporate governance are 41.7% and 24.2% higher than those of enterprises without the party-organization involvements in corporate governance during the same period, respectively. This shows that the pattern of the party-organization involvements in corporate governance may improve corporate innovation. Considering the convening of the 18th CPC National Congress, the “National Conference on Party Construction in Non-public Enterprises” in 2012 and the issuance of the document titled “Views on Reinforcing and Improving the Work of the Party Construction in Non-Public Enterprises (Trial Version)”, the impact of the party-organization involvements on POEs’ innovation may be different before and after 2012. Therefore, it is of great significance to discuss the impact of the party-organization involvements in corporate governance on innovation.
Referring party-organization involvements in corporate governance, it can more effectively supervise and constrain the managers’ behavior of listed enterprises [50], ensuring enterprise compliance, reducing enterprise corruption, enhancing communication with superior party organizations [51], and ensuring the implementation of long-term development plans. The party-organization involvements in corporate governance has increased corporate value [42], improved the coverage of POEs’ social insurance [52], enhanced corporate performance [53] and corporate social responsibility [54], restrained enterprises’ earnings management [55], and reduced the business decision-making risk [56,57]. On the other hand, party-organization involvements in SOEs cannot solve the efficiency problem [51], which may increase the policy burden of enterprises to some extent. Additionally, Yang et al. [58] find that after the CPC revised the Constitution in 2002, the phenomenon of party members becoming entrepreneurs was more prominent in regions with low degree of marketization, less legal protection, and more prone to corruption of local governments.
To sum up, although there are many studies on the factors influencing innovation and the party organization involvements in corporate governance, there are still some deficiencies in the research on the relationships between the party organization involvements in corporate governance and enterprises innovation. First, there are few studies on party-organization involvements in corporate governance and POEs’ innovation. The existing literature indicates that the new pattern of CPC grassroots-party-organization involvements in corporate governance has increased SOEs’ corporate value [42] and innovation [39,59,60]. The party organization’s role in promoting innovation is mainly achieved through the board of directors and senior management. However, Beladia et al. [61] find that SOEs with top executives who have got a Party school degree engaged in less innovative activities. Considering the party organizations in SOEs and POEs have different positioning and roles, the findings of SOEs cannot be directly applied to POEs [39,40]. Whether this new pattern promotes POEs’ innovation is still a research gap. Second, there still lacks studies on the mechanism of how party-organization involvements in corporate governance influences POEs’ innovation. Third, there lacks heterogeneity analyses about this effect.
Thus, based on relational embeddedness theory, we put forward the research hypothesis that party-organization involvements in corporate governance promotes POEs’ innovation. Then, based on the data of a manually retrieved 1357 POEs’ party-organization involvements (party-organization activities and senior executives’ participation to measure the existence or not and quality of party-organization involvements) and POEs’ patent applications from 2003 to 2017, we use the multiple regression model to discuss the impacts of party-organization involvements in corporate governance on innovation. The findings confirm that party-organization involvements in POEs’ governance can effectively promotes their innovation. This paper further takes 2012 as the dividing point for analysis since the development of party-organization involvements in POEs’ governance has accelerated after 2012 [62], and finds that the above mentioned positive effect only appears after 2012. After applying PSM sampling and DID analyses, and substituting the dependent variables, the results remain robust. Moreover, this paper finds that party-organization involvements improve innovation mainly by increasing R&D investment. In addition, party- organization activities can also improve innovation by reducing operational risks. Finally, this paper conducts heterogeneity analyses. We divide the patent applications into invention patent applications and non-invention patent applications according to Hou [63], and find that the party-organization involvements increase them, especially for the latter. In terms of non-invention applications, party-organization involvements have the greatest promoting effect on utility model patent applications, followed by invention patent applications and design patent applications. Moreover, the promotion effect of party-organization involvements is more significant in POEs under the actual control of natural persons or families, those located in the northern, Beijing-Tianjin-Hebei regions and Yangtze River delta, and those in technology-intensive and capital-intensive enterprises.
This paper provides three marginal contributions: First, to our knowledge, this paper puts forward the promotion effect of party-organization involvements in POEs’ governance on innovation for the first time. Based on a manually retrieved data of party-organization activities and senior executives’ participation in the activities, which are used to measure the existence and the quality of party-organization involvements, this paper finds that party-organization involvements have promoted POEs’ innovation. The conclusions enrich the analogous research [62], especially the segmented research around 2012. Second, this paper further proposes the acting mechanisms of party-organization involvements promoting POEs’ innovation. Based on the Sobel test model, this paper verifies that party-organization involvements improve innovation by increasing R&D investment and reducing operating risk, and the innovation driven by increased R&D investment is more prominent. Third, this paper further enriches the heterogeneity analysis of party-organization involvements promoting POEs’ innovation. The heterogeneity analyses are conducted from the perspectives of family and non-family businesses, with and without government subsidies, as well as factor-intensity industry classification and spatial distribution. This study will enlighten the POEs to adjust measures to local conditions and implement policies by category, optimizing the involvement pattern of the party organizations. And it also provides references about political connection and corporate innovation for other countries to some extent.
2. Theoretical Analysis and Research Hypothesis
2.1. The Party Organization Involvements in Corporate Governance and POEs’ Innovation
Innovation plays a prominent role in enterprises’ performance and development, and help to form core advantages in market competition. Innovation activities are characterized by high risk, high investment, and long cycle. In contrast, senior executives are usually more willing to adopt short-term methods to improve performance than to invest in high-risk R&D innovation projects. Therefore, corporate innovation should not only rely on the initiative of senior executives, but also reasonably use the governance mechanisms to encourage and constrain senior executives to assume the responsibility of promoting corporate innovation [64]. Party-organization involvements link up internal spontaneous behavior and external traction behavior of corporate governance, which promote enterprises by accelerating the implementation of innovation-driven development strategy, and thus, providing a new perspective for promoting corporate innovation [39,40].
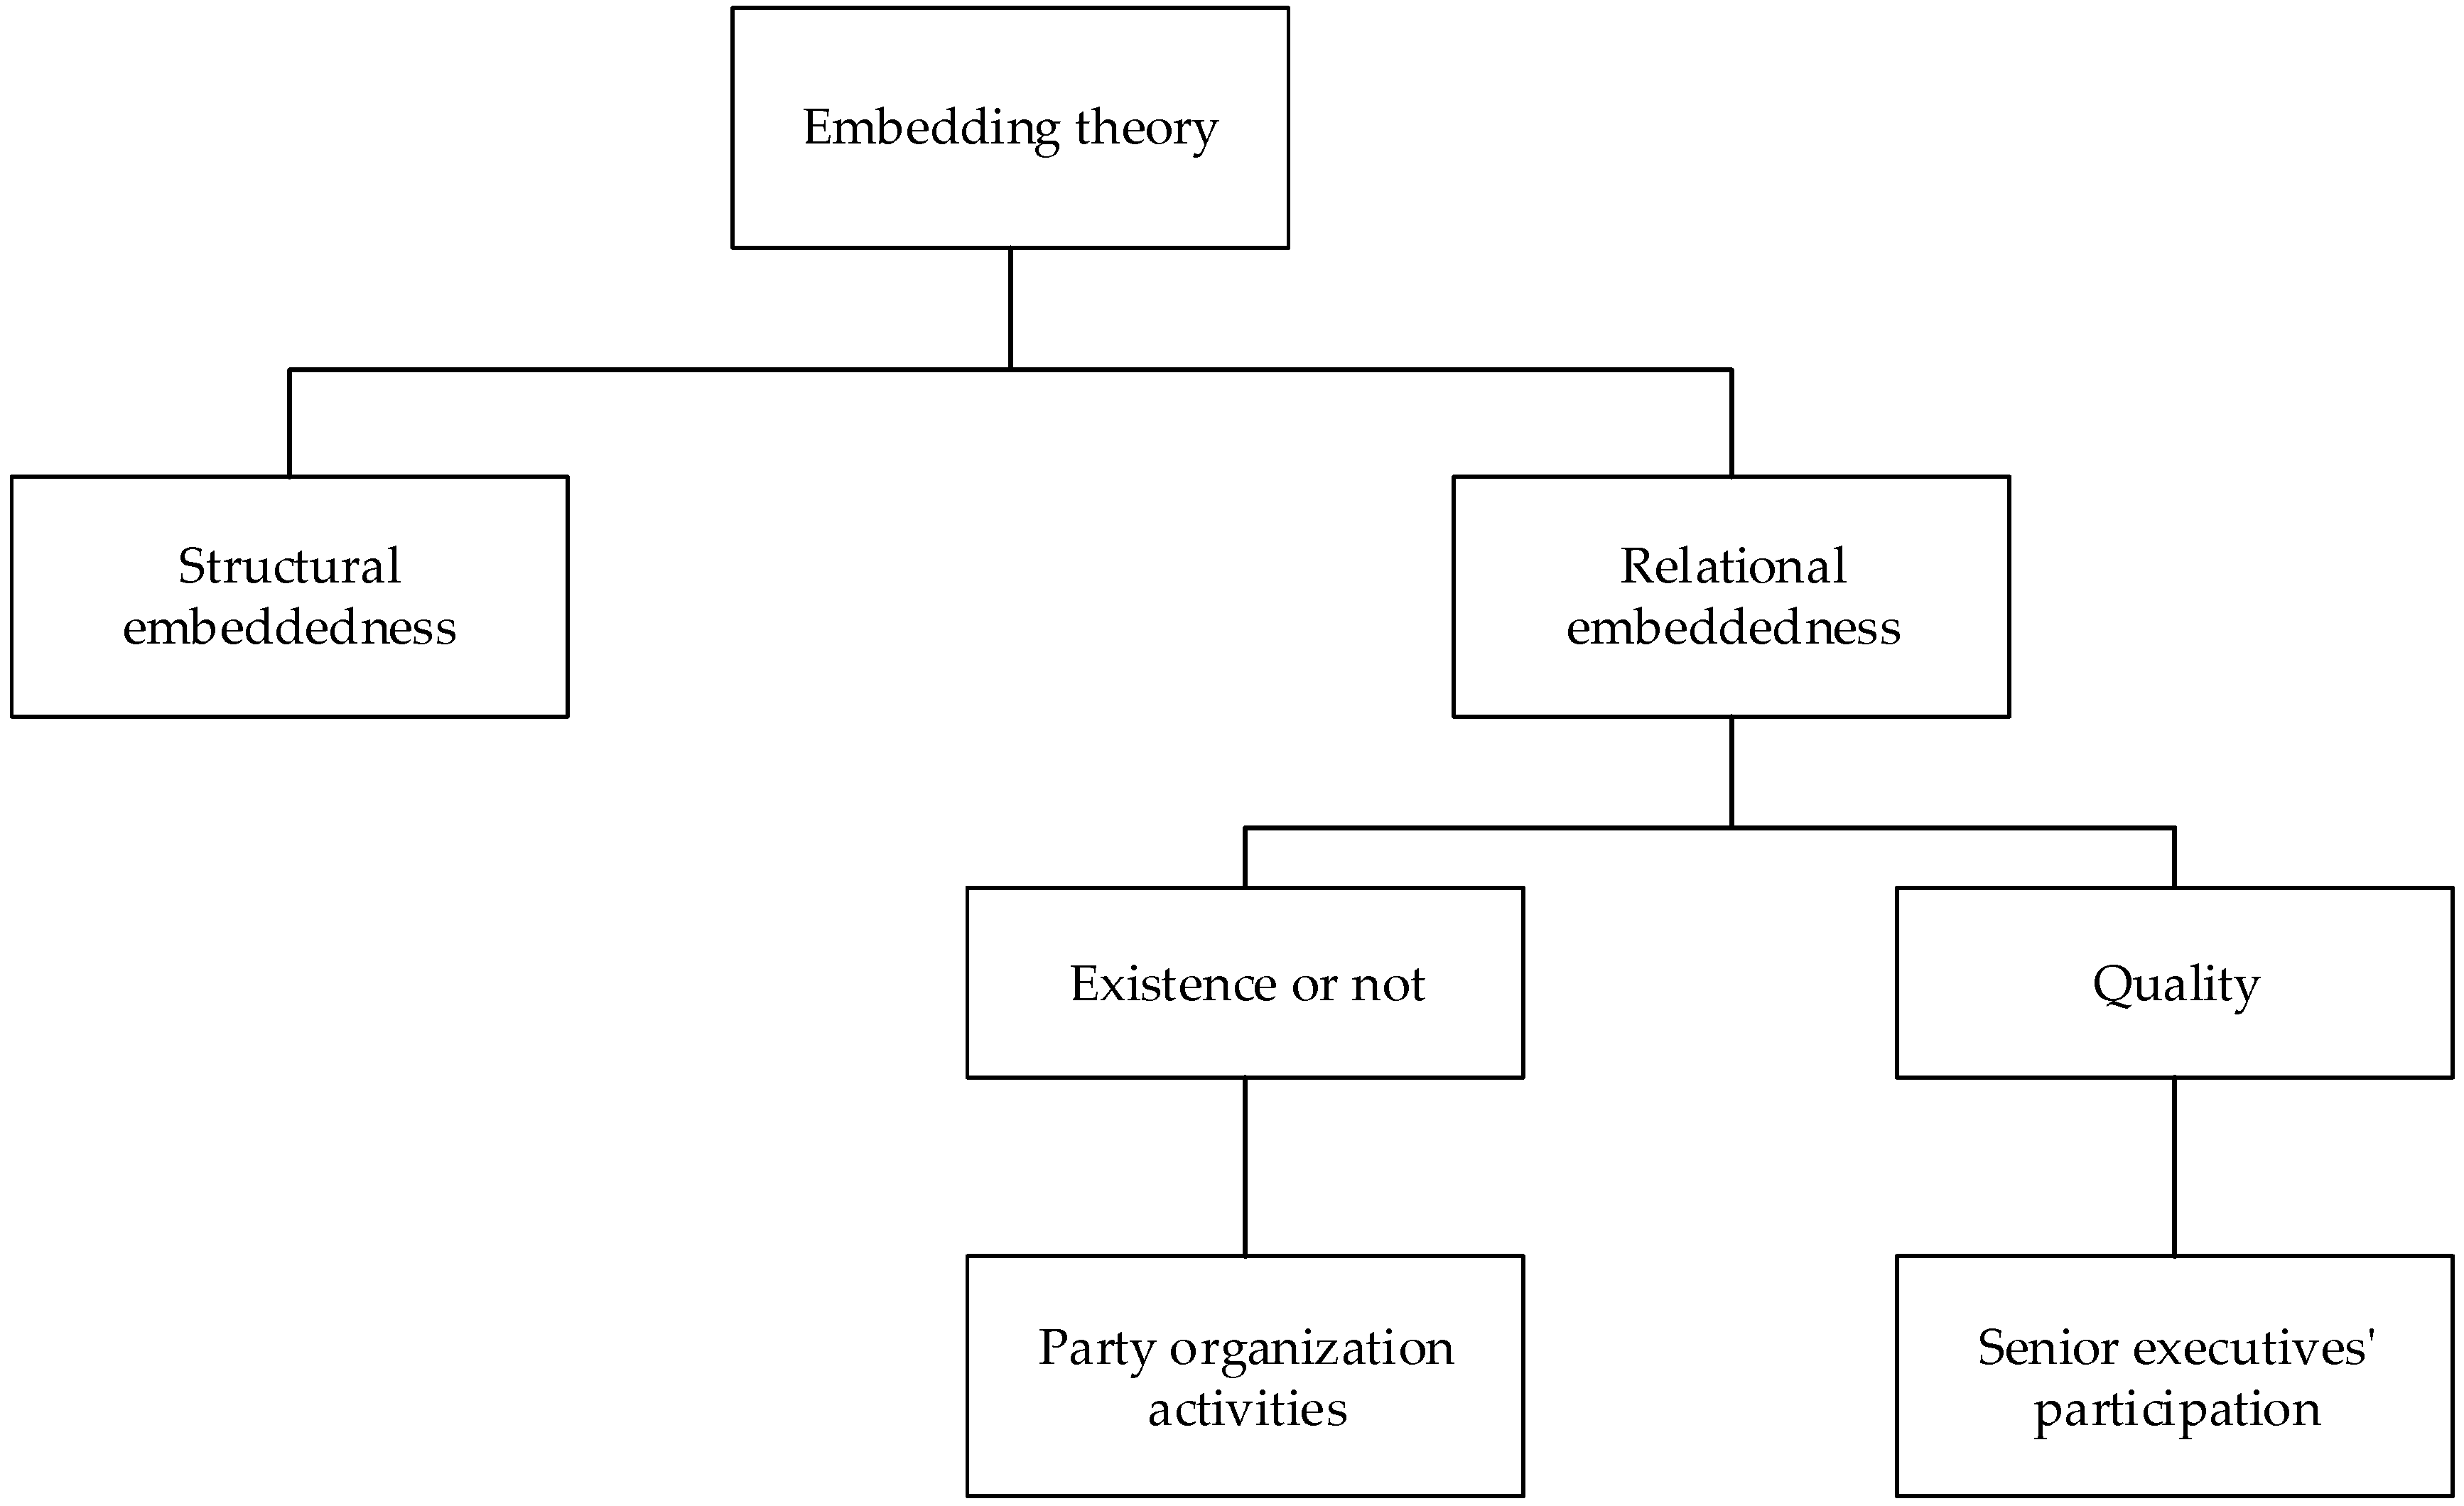
The existing literature mainly focuses on embedding theory and political-ties theory. The embedding theory is put forward by Polanyi, who believes that economy is involved in society, religion, and political systems [65]. Granovett further divides the embeddedness into structural embeddedness and relational embeddedness. Structural embeddedness emphasizes the stable structural position in the embeddedness network; relational embeddedness emphasizes the dynamic interactions in the network, and the degree of trust between members in the network [66,67,68]. Party-organization involvements, the new form of relational embeddedness, can build a relationship network between the grassroots-party organization, and the government, the superior-party organization and the internal relationship network of the enterprise. Grassroots-party-organization involvement in corporate governance can promote cooperation and mutual trust among organizations, facilitate mutual benefit and interaction, better utilize resources, and improve innovation efficiency [45]. Existing literature on political connection confirms that the enterprises with stronger political ties are more innovative [69,70]. Enterprises related to politics are more likely to be bailed out by the government, positively affecting corporate innovation [71]. Party-organization involvements in corporate governance have both the characteristics of relationship network and political embeddedness. This paper mainly focuses on the relationship network theory.
This paper uses party-organization activities and senior executives’ participation in the activities to measure party-organization involvements in corporate governance. From the perspective of relational embeddedness theory, party-organization activities measure the existence of the party organization’s relationship network, and senior executives’ participation in activities to measure the quality of the relationship network. These two indicators also reflect the extent (existence and the quality) to which party organizations are involved in corporate governance. When the senior executives participate in the activities, the form and influence will be greater, and the network relationship will be closer (Figure 1).
Party-organization involvements in POEs’ governance mainly cultivate the initiative consciousness of senior executives and limit the influence of improper behaviors on innovation. Grassroots-party organizations do not directly manage human resources, finance, and materials in POEs. Instead, they play an indirect role, which is reflected in guidance, supervision, rights protection, united front, coordination, and corporate-culture construction [43,44]. First, party-organization involvements cultivates the initiative consciousness of senior executives, functioning as policy and information channel. Through connection with superior-party organizations, party-organization involvements can help entrepreneurs better and faster grasp the information related to enterprises development, make full use of preferential policies and market supply-demand information for governance, and then carry out targeted corporate innovation. Enterprises’ grassroots-party organizations can understand the information transmitted by the government or superior-party organizations more clearly through activities. The party-organizations activities among POEs, especially those senior executives’ participation in the activities, can improve the quality of the relationship network between enterprises, realize the sharing of high-quality information and knowledge, and then improve the innovation performance [72]. Grassroots- party-organization activities in the enterprise enhance cooperation, mutual trust, and solidarity between employees and senior executives, and improve the understanding of innovation policies, and thus promoting cooperation and mutual trust, as well as better improving innovation efficiency [45]. Second party-organization involvements can attract excellent talents and utilize the advantages of human capital. Through senior executives’ participation in the activities, they will pay more attention is to the absorption of talented human capital, and get more opportunities to obtain outstanding talents. Human capital is a powerful driving force for corporate innovation. Third, party-organization involvements help curb misconduct. In the context of China’s anti-corruption campaign [73], party-organization involvements in POEs’ corporate governance can further strengthen the containment of excessive corruption of senior executives and create more value [42], injecting new vitality into innovation. The anti-corruption campaign aims to deter senior executives by investigating rent-seeking corruption, which not only curbs their profits from corruption, but also cuts off their funding channels for bribing officials [74]. By limiting senior executives’ political rent-seeking behavior and preventing managers from pursuing personal goals at the expense of enterprises development, the corresponding enterprises will adjust business strategies, which may reduce financing constraints and generate a positive impact on enterprise innovation.
Based on the above theories and deductions, we propose the following assumption:
Hypothesis 1.
Party-organization involvements in corporate governance can significantly promote POEs’ innovation.
Since 2012, the Central Commission for Discipline Inspection of the CPC has inspected SOEs whose property rights belong to the central government and whose senior executives’ appointment rights belong to the Organization Department of the Central Committee of the CPC, providing an innovative form for the party organization involvements in corporate governance.
For POEs, the “National Conference on Party Construction in Non-public Enterprises” in 2012 clearly emphasized that “the number and role of non-public enterprises determine that the party construction work in non-public enterprises is becoming more and more important in the whole party construction work, and must be done well with greater efforts”. Moreover, the conference has changed from the previous “suggesting enterprises to establish party organizations” to “the non-public enterprises’ party organizations should organize and lead the party members and the staffs to strive for excellence enterprise development goals, and urge enterprises to improve product quality, technological innovation and management level”. In fact, the number of party organizations of POEs’ accounted for 30.85% of the total number of POEs in 2012. Besides, the convening of the National Conference on Party Construction in Non-public Enterprises in 2012 and the issuance of “Views on Reinforcing and Improving the Work of the Party Construction in Non-public Enterprises (Trial Version)” had a significant impact on China’s non-public enterprises.
In addition, building and improving the national scientific and technological innovation capability has also become one of the focuses since the 18th National Congress of the CPC in 2012 [75]. The growth mode is gradually transformed into innovation-driven. Therefore, the impact of party-organization involvements on POEs’ innovation may be different before and after 2012. This paper thus proposes the following assumption:
Hypothesis 2.
After 2012, party-organization involvements in corporate governance has begun to play a significant role in promoting POEs’ innovation.
The measurement indicators of corporate innovation mainly include the number of patent applications and authorizations, and the proportion of R&D expenditure in operating revenue. The latest research tends to use the number of patent applications or authorizations [76,77,78]. The number of patent applications can directly reflect corporate innovation. Patent applications can be divided into invention applications and non-invention applications [63]. Non-invention patent applications include utility-model-patent applications and design-patent applications. Compared with non-invention patent applications, invention applications have a longer period, more complicated procedures, more demand materials, and are difficult to obtain. Non-invention applications are easier to obtain, but their protection time is shorter. Tong et al. [79] found that the second revision of the Patent Law in 2000 has significantly boosted non-invention patent applications of SOEs, but invention-patent applications have not significantly increased. The main reason is that invention-patent applications need to pass substantive examination, such as novelty, creative steps, and usability. The time interval for invention patents from application to approval is generally last for three to four years. Meanwhile, the grant rate of invention-patent applications is relatively low. Given the difference characteristics of invention applications and non-invention applications, this paper further propose the following assumption:
Hypothesis 3.
Party-organization involvements in POEs’ governance can strongly encourage non-invention patent applications.
2.2. The Mechanisms of the Party Organization Involvements Affecting POEs’ Innovation
The possible acting mechanisms for party-organization involvements in POEs’ governance to affect their innovation are shown in Figure 2.
As the construction of grassroots-party organizations in POEs’ governance improves, it is possible for enterprises to increase the level of innovation input [40]. According to the 2017 CPC Party Statistics Bulletin, 1.877 million non-public enterprises have established party organizations, accounting for 73.1% of the whole non-public enterprises, an increase of 5.2% from 2016. According to the 2017 Statistical Bulletin of National Science and Technology Investment, enterprises of all types spent 1366.02 billion RMB on science and technology, an increase of 12.5% from 2016. In 2017, the average R&D investment of each POE with party-organization involvements was 170 million RMB, while that without party-organization involvements was 120 million RMB. Meanwhile, the average number of patent applications per POE with party-organization involvements was 82.54, while that without party-organization involvements was 66.47. These directly indicate that POEs with party-organization involvements are more likely to increase R&D investment and patent applications.
After the party organizations are involved in corporate governance, enterprises may obtain more information and resources conducive to innovation by strengthening communication with the local government, and thus, enhance innovation’s information advantages. Moreover, party-organization involvements in corporate governance enhances the communication and sharing among enterprises, expands the demonstration effects of benchmarking enterprises’ innovation, and improves the enterprises’ innovation efficiency. Ovtchinnikov et al. [80] believe that political ties bring the knowledge and expertise in legislation and bureaucratic procedures, market information, industry development plans, foreign trade, energy policies, and patent legislations, which are the decisive factors in the process of innovation activities. Therefore, politically connected enterprises can obtain innovation information related to technology development and competition, etc. This is extremely beneficial when developing products or technologies may be needed or preferred by the market [81]. Additionally, in the case of weak intellectual-property protection, political ties positively impact corporate innovation by preventing imitation and unfair competition [82]. In short, enterprises are more likely to increase targeted R&D investment to ensure the success of innovation activities after obtaining more specific information resources and protection policies, so that enterprises can have a long-term competitive advantages.
The enterprises’ R&D investment has a direct positive impact on corporate innovation. The more R&D funds and personnel are invested, the better the innovation effect [83,84,85]. On the one hand, as a kind of financial supports, R&D funding plays an extremely important role in promoting innovation regardless of increasing funding or optimizing funding structure. On the other hand, the strategy of people-oriented innovation, strengthening the quantity and quality of R&D personnel and attaching importance to talents, can provide inexhaustible power for enterprises’ sustainable development. This paper thus proposes the following assumption.
Hypothesis 4.
Party-organization involvements in POEs’ governance will increase R&D investment, thereby promoting corporate innovation.
Effective corporate-internal governance is conducive to improving the decision-making quality of enterprises as well as the transparency and credibility of corporate information, reducing business risk [86]. According to the Statistical Bulletin (http://www.gov.cn/xinwen/2022-06/29/content_5698404.htm (accessed on 29 June 2022)), as of December 2021, the CPC has 4.936 million grassroots-party organizations, including 1.532 million grassroots-party organizations in enterprises, accounting for 31.0%. The grassroots-party organization involvements in corporate governance aim to achieve mutual promotion between the party organization involvements and the original corporate governance through enterprises’ political leadership, improving the grassroots-governance level, and jointly serve the modernization of national governance capacity. Party-organization involvements play an important role in policy communication and economic goals coordination between the government and POEs [87]. Moreover, party-organization involvements can also effectively improve enterprises’ governance and coordination capabilities, reducing business risks accordingly, which is supported by Yu [88].
For the enterprises with business difficulties, their resource constraints and operating pressures will increase. To reduce risks, they will tend to reduce corporate innovation [89]. If R&D investment continues to increase, it will deplete existing core resources. Based on the free-cash-flow hypothesis, Huang et al. [90] conclude that when the enterprise’s operating risks reduce, the creditors, as “risk averters”, will strengthen the supervision of senior executives in order to reduce the risk that cannot effectively recover the funds in the future due to investing funds to high-risk projects. Thus, the enterprise’s innovation will focus more on low-quality innovation with faster returns in the short term. It can be seen that the operating risk is an important factor affecting managers’ innovation willingness and enterprises’ innovation behavior. The higher the operating risk, the lower the enterprises’ innovation willingness and behavior. Therefore, reducing the operating risk can help to improve enterprises’ sustainable ability and provide a stable business environment for innovation.
Based on the above theories, this paper proposes the following assumption.
Hypothesis 5.
Party-organization involvements in POEs’ governance will reduce operating risk and eventually promote innovation.
3. Research Design
3.1. Sample Selection and Data Source
The subject of analysis for the present study was private-owned listed companies in China. The data were extracted from 2003 to 2017, which was selected as the time range for a specific reason. In September 2000, the Organization Department of the Central Committee of the CPC issued a document titled “Views on Reinforcing the Establishment of Party Committees in Non-Public Enterprises, Including Individual and Private Enterprises (Trial Version),” which specified that “non-public enterprises with more than three CPC members should establish a party committee”. It was assumed that, following the issuance of the decree, three years would be sufficient for the relevant companies to establish the necessary party committees, as well as organize regular party activities, and that its effect should be measurable.
The sample was then screened based on the following criteria and operationalizations. First, referring to the practice of Zheng et al. [91], party activities were defined as activities organized by the company’s party committee and participated by employees who are party members. On this basis, we further add the indicator of whether the board chairman or CEO participate in the activities (hereafter written as “senior executives’ participation”, or Participate), which can reflect the degree of attention paid to the activities of the party organization. Second, data from companies in the financial services industry were removed. Third, data from companies that have received special treatment (ST) status were removed. Fourth, companies with missing data were removed. Following the above screening process, 7414 observations were retained. In order to minimize the impact of extreme values, the data of all continuous variables were winsorized at the 1st and 99th percentile.
The data sources were as follows. The data for the party activities were manually collected using the method proposed by Zheng et al. [91]. Specifically, the official websites of the enterprises were referred to for the collection of information regarding the construction of the party committee and party-related news. In addition, a Baidu search was conducted with relevant keywords such as “dang (party)”, “dang huodong (party activities)”, “dongshizhang (chairman of the board)”, and “zongjingli (CEO)” to conduct full-text searches for any corresponding information. All the collected information was then screened manually. The other data were compiled by cross comparing the data extracted from the China Stock Market & Accounting Research (CSMAR) Database, Wind Economic Database, and RESSET Financial Research Database.
3.2. Model Setting and Variable Definition
A multiple regression model was constructed to test the relationship between the party involvements in corporate governance and enterprise innovation.
Innovate = β0 + β1Party + βiControls+Year + Ind + ε
Specifically, the dependent variable used was corporate innovation (Innovate), which was measured using enterprise patent applications (Apply), applications for invention patents (IApply), and applications for non-invention patents (InApply). The more the number of patent applications, the higher the company’s innovation capability. The number of patent applications is expressed by the number of applications in the current year. Apply was calculated using the logarithm of the total number of invention patent (IApply) and non-invention patent (InApply) applications in the year plus 1. IApply was calculated using the logarithm of the number of applications for a patent for an invention in the year plus 1. InApply was calculated using the logarithm of the sum of the applications for a patent based on utility (UApply) and design (DApply) in the year plus 1. UApply/DApply were calculated using the logarithm of the number of UApply/DApply applications plus 1. The regression-independent variables were party activities (Party) and senior executives’ participation in activities (Participate). If there were party activities held in the year, Party = 1; otherwise, Party = 0. If senior executives participate in the party-organization activities, Participate = 1; otherwise, Participate = 0. The control variables were determined from the perspectives of company characteristics and governance. Control variables (Controls) related to company characteristics included years of listing (Age), current ratio (CR), total assets (TA), debt-to-assets ratio (Lever), return on operating cash flow (OCF), and operating income growth rate (Growth). Control variables related to corporate governance included shareholding ratio of the largest shareholder (First), the number of board members (Bd), proportion of independent directors (Director), and CEO duality (Merge). The study also controlled for the fixed effects of year (Year) and industry (Ind), and the ε parameter was included to account for random variance. The variables are exhibited in Table 1.
4. Empirical Results
4.1. Descriptive Statistics of Variables
The descriptive statistics for the key variables are shown in Table 2. The mean Apply from 2003 to 2017 was 2.923, from 2003 to 2011 was 2.441, and from 2012 to 2017 was 3.081. Based on this finding, it can be inferred that the number of patent applications following 2012 noticeably increased. The mean IApply and InApply from 2003 to 2017 were 2.012 and 2.230, respectively; those from 2003 to 2011 were 1.538 and 1.757, respectively; and those from 2012 to 2017 were 2.166 and 2.385, respectively. These results revealed that the number of non-invention patent applications was greater than that of invention-patent applications. The mean UApply and DApply from 2003 to 2017 were 1.966 and 0.766, respectively; those from 2003 to 2011 were 1.416 and 0.672, respectively; and those from 2012 to 2017 were 2.145 and 0.797, respectively. This implies that design-patent applications were the least filed among the three types of patents. It was also revealed that the proportion of enterprises with the party-organization activities was 12.0% from 2003 to 2017, 6.1% from 2003 to 2011, and 13.9% from 2012 to 2017. The proportion of senior executives’ participation was 4.2% from 2003 to 2017, 2.6% from 2003 to 2011, and 4.7% from 2012 to 2017. It appears that more party committees were constructed, and activities held following 2012; the senior executives of enterprises are also more involved in the party organization activities. The statistical results of the other variables were generally consistent with the findings of existing studies.
The results of the difference test are shown in Table 3. The means of Age, TA, Lever, and Bd for the total sample and the subsample that engaged in party activities from 2012 to 2017 were greater than for the subsample that did not partake in party activities, while those of CR and Merge were smaller for the participating subsample. In addition, from 2012 to 2017, the companies that held party activities had a greater mean for OCF and a smaller mean for Director. From 2003 to 2011, only TA was significantly different between groups, where companies with party-organization activities had a larger mean TA than those without. The results of difference test on Participate were generally consistent with those on Party; while from 2003 to 2011, TA, Age, Bd, and Lever was significantly different between groups, where companies with senior executives’ participation had larger mean TA, Age, Bd, and Lever than those without (Table A2).
4.2. Results of Regression Analysis
The regression results are presented in Table 4. When controlling for other variables, it was found that party-organization involvements (Party and Participate) in POEs’ governance were found to have a significant positive impact on patent applications from 2003 to 2017. Thus, H1 was supported. However, further analysis showed no positive effect from 2003 to 2011 and that the positive effect was prominent only from 2012 to 2017. These findings suggest that, since 2012, party-organization involvements in POEs’ governance played a positive role in promoting patent applications. Hence, H2 was supported. Party-organization involvements effectively promoted corporate innovation, and the effect was prominent after 2012. This could be due to the fact that party-organization involvements in POEs is a gradual process; the influence of party-organization involvements on corporate innovation thus increases over time. In addition, during this period, the government also adopted active measures to guide corporate innovation, while enterprises that involved party organizations also pay more attention to innovation.
The regression results of party-organization involvements (Party and Participate) and IApply and InApply are shown in Panel A and Panel B of Table 5. When other variables were controlled for, Party and Participate were found to have a significant positive impact on IApply and InApply during 2003–2017 and 2012–2017. Although Party was found to have no significant impact on IApply from 2003 to 2011, it had a significant positive effect on InApply in the same period. The data revealed that party-organization involvements in corporate governance played a stronger role in promoting non-invention patent applications, which supported H3.
The regression results of party-organization involvement (Party and Participate) and InApply are exhibited in Panel C and Panel D of Table 5. It can be seen that Party had a significant positive impact on InApply, UApply, and DApply during 2003–2017 and 2012–2017. Party was found to have no significant impact on DApply from 2003 to 2011; however, it had positive effect on UApply over the same period. In addition, Participate had a significant positive impact on InApply, UApply during 2003–2017 and 2012–2017, and had no significant impact on DApply in each period. Therefore, utility-model-patent applications held a dominant proportion among non-invention patent applications, which party-organization involvements had the greatest effect on, followed by invention patents, and finally design patents (the smallest impact). A likely reason for such findings could be that utility model patents have the greatest practical value, and as such, the application process is easier and quicker. In addition, companies may pay more attention to practical new technology and its application efficiency to maximize benefits.
4.3. Robustness Test
4.3.1. PSM Sample Selection
To control for the systematic differences in party-organization involvements in the governance across companies, propensity score matching (PSM) was adopted. The results are presented in Table 6. Following nearest neighbor matching, radius matching, and kernel matching, party-organization involvements in corporate governance were found to have a significant positive impact on overall patent, and invention and non-invention patent applications in both the 2003–2017 and 2012–2017 periods. In addition, party-organization involvements in corporate government from between 2003 and 2011 maintained its significant positive impact on non-invention patent applications. These findings proved that the regression results were robust. The results on Participate are presented in Table A3, which is consistent with those on Party. These findings indicate that party-organization involvements can effectively promote corporate innovation, and the effect is prominent after 2012.
4.3.2. DID Analysis
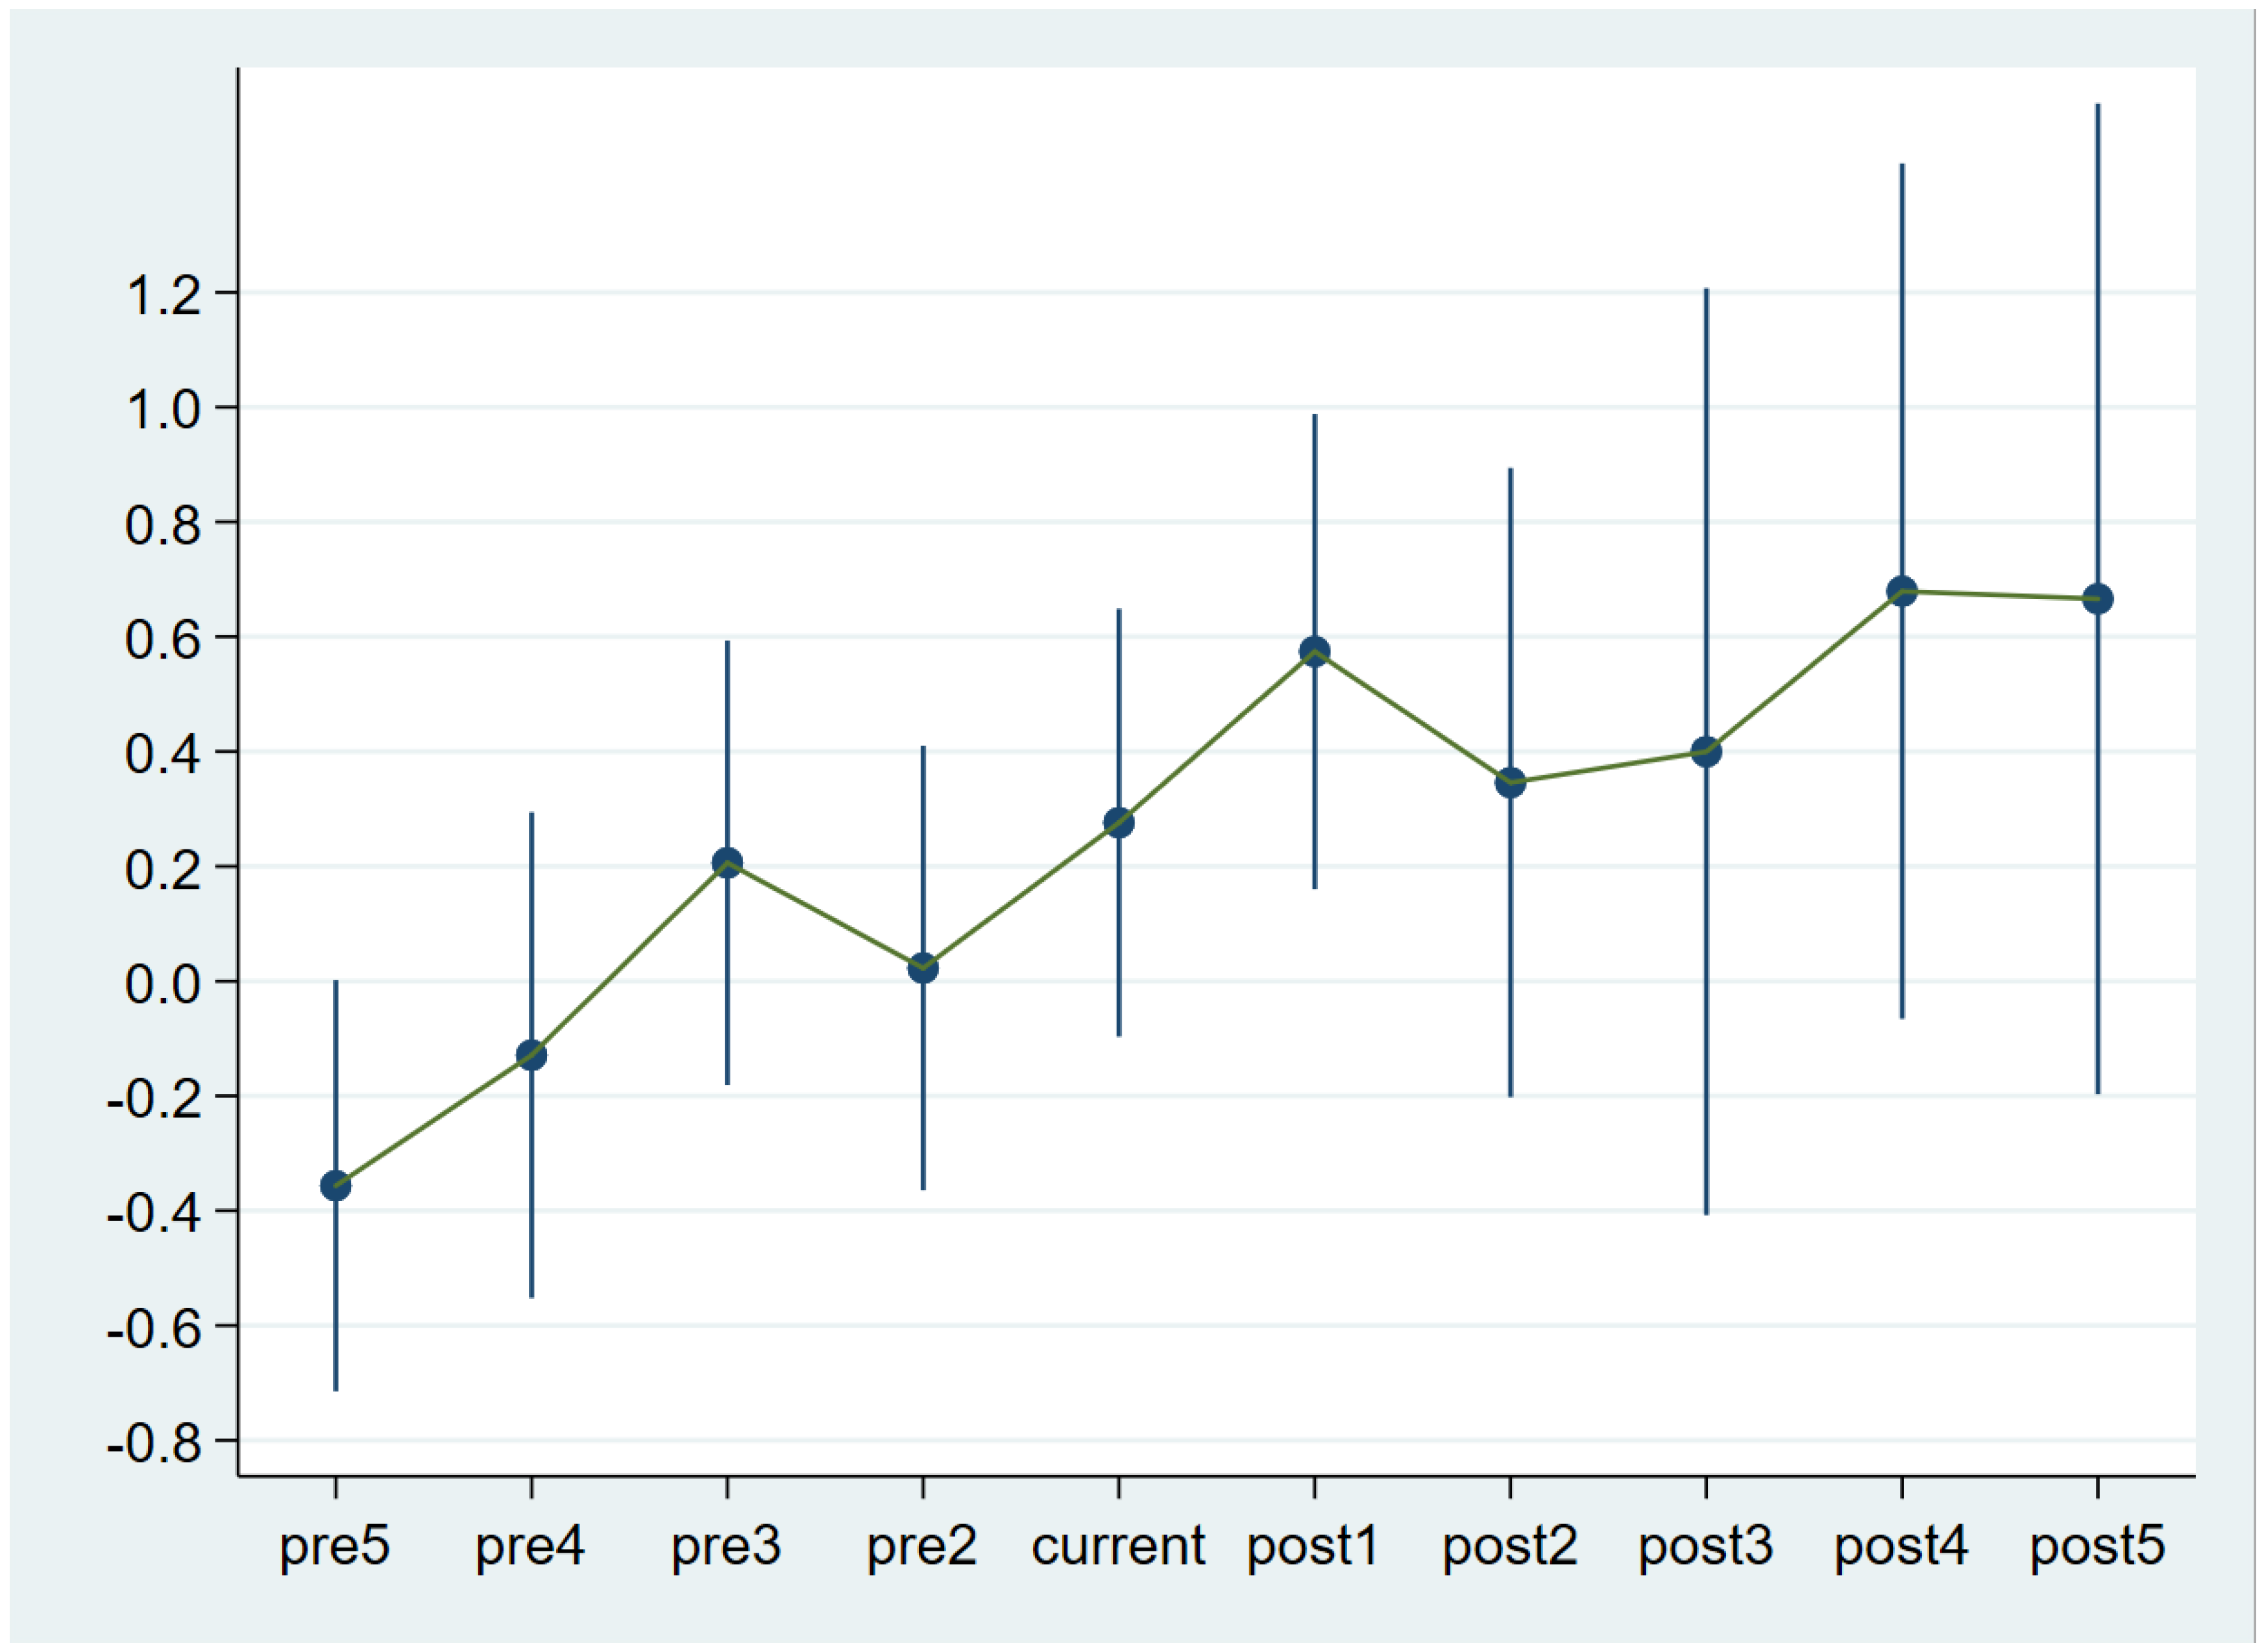
To eliminate the impact of other factors on corporate innovation and to investigate the net impact of the party organization involvements on corporate innovation, the difference-in-differences (DID) model was adopted, and a parallel trend was tested. Table 7 exhibits the regression results. When controlling for other variables, the interaction term between the control group and party organization involvement (Treat × Party and Treat × Participate) in 2003–2011 was not significant. However, Treat × Party and Treat × Participate in 2003–2012 was positively correlated with Apply; hence, the results passed the parallel trend test (Figure 3 and Figure 4). It can be seen that prior to 2012 (current), the coefficient of the interaction term fluctuated around 0; following 2012, the marginal effect line rapidly sloped upward to the right and the impact rose rapidly. These results suggest that party-organization involvements in POEs’ governance generated a positive impact on corporate innovation, which proved that the previous results were robust.
4.3.3. Substituting the Dependent Variable
To verify the robustness of the main conclusion, referring to the practice of Li and Cheng [40], this study reanalyzed the data using total number of patent applications and that for invention and non-invention patent applications for two consecutive years (the current year and the following year) and three consecutive years (the current year and the following two years) as a measure for corporate innovation. The results were consistent with the previous findings (Table 8); in other words, after adapting the corporate innovation measure, the results remained stable.
5. Further Exploration
5.1. Analysis of Probable Mechanisms
To validate the mediation effects, stepwise regression was adopted alongside the Sobel test [93].
5.1.1. R&D Investment
The mediating effect of R&D investment (Input) is shown in Panel A of Table 9. When the other variables were controlled for, the total effect of party-organization involvements in POEs’ governance (Party) on corporate innovation was 12.021; the effect of party-organization involvements (Party) on R&D investment was 0.090; and the effect following the introduction of Input was 18.632. Thus, the effect of R&D investment as a mediating variable was 1.677, which, as a mediating effect, accounted for 14.0% of the total effect. The results of the Sobel test are shown in Panel A of Table 10. p = 0.016 (<0.05), indicating that the mediating effect was statistically significant. The conclusions on Participate are consistent with those on Party. For Participant, the results of the Sobel test are presented in Table A4 and Table A5. p = 0.0237(<0.05), indicating that the mediating effect was statistically significant. It can be concluded that the effect of party-organization involvements on R&D investment was positive, and R&D investment played a mediating role; hence, H4 was supported. Opposing the conclusions drawn by Li and Cheng [40], this study determined that party-organization involvements in POEs’ governance effectively promoted their investment in R&D, thereby facilitating innovation. This finding provided support for the relationship between party- organization involvements in corporate governance and POEs’ innovation.
5.1.2. Operating Risk
Referring to Boubakri et al. [92], this study used volatility of return on assets (Roabd) to measure operating risk. Specifically, the industrial and annual averages were adjusted, and three-year overlapping periods covering the research period were used to calculate the standard deviation of the corresponding return on assets. The mediating effect of Roabd is shown in Panel B of Table 9. When the other variables were controlled for, the total effect of party-organization involvements (Party) in POEs’ governance on their innovation was 0.150, the effect of party-organization involvements (Party) on operating risk was −0.003, and the effect following the introduction of Roabd was −0.916. Thus, the effect of operating risk as a mediating variable was 0.003, and the mediating effect accounted for 2.0% of the total effect. The results of the Sobel test are shown in Panel B of Table 10. p = 0.028 (< 0.050), indicating that the mediating effect was statistically significant. The conclusions on Participate are not consistent with those on Party. For Participant, the results of the Sobel test are presented in Table A4 and Table A5. p = 0.1431(>0.05), indicating that the mediating effect was not statistically significant. It can be concluded that the effect of party-organization involvements in corporate governance (party) on operating risk was negative, while operating risk held a mediating role; hence, Hypothesis 5 was supported: the party-organization activities involved in corporate governance could reduce operating risk and thereby promote enterprise innovation. The conclusion on Participate was not supported.
5.2. Heterogeneity Analysis
To uncover the differences in the effect between samples of various characteristics, statistical tests for heterogeneity were performed. Specifically, the samples were analyzed from the perspectives of family/non-family businesses, with/without government subsidies, the factor-intensity industry classification, and spatial distribution. As was discovered in the previous sections, the effect of party-organization involvements in corporate governance began to significantly promote innovation following 2012. Therefore, the heterogeneity analysis focused on the period from 2012 to 2017.
5.2.1. Party Organization Involvements, Family Businesses, and Corporate Innovation
In this study, family businesses were defined as listed companies as natural persons or controlled by family members. The heterogeneity analysis results between family and non-family businesses are shown in columns 1–2 of Table 11. When controlling for other variables, the regression coefficients between Party and Apply of the family businesses were positive, while those for non-family businesses were statistically insignificant. The results of Participate and Apply are consistent with those of Party and Apply (Table A6). These results indicated that the effect of party-organization involvements in the governance on corporate innovation was stronger among family businesses.
5.2.2. Party Organization Involvements, Government Subsidies, and Corporate Innovation
The heterogeneity-analysis results between companies that received higher-than-average and lower-than-average subsidies are presented in columns 3–4 of Table 11. When other variables were controlled for, Party had a positive effect on Apply, regardless of the subsidies received; however, the effect on companies that received lower-than-average subsidies was stronger. The results of Participate are presented in Table A6. When other variables were controlled for, Participate had a positive effect on Apply when companies received higher-than-average subsides. These results suggest that party-organization involvements (Party and Participate) had a positive effect on Apply among enterprises receiving higher-than-average subsidies.
5.2.3. Party Organization Involvements, Factor Intensity, and Corporate Innovation
Next, the samples were divided into multiple groups based on capital, technology, and labor intensity. The results of the heterogeneity analysis by factor intensity are presented in columns 5–7 of Table 11 and Table A6. After controlling for other variables, it was found that party-organization involvements had a positive impact on the innovation of capital and technology-intensive enterprises; however, no significant impact was found on innovation in labor-intensive enterprises. A likely reason could be that technology and capital-intensive enterprises have greater R&D expenditure than labor costs and attach more importance to technological factors, which are more closely related to corporate innovation; hence, the positive effect of party-organization involvements in the governance of technology and capital-intensive enterprises on innovation was more direct.
5.2.4. Party Organization Involvements, Spatial Distribution, and Corporate Innovation
The results of the heterogeneity analysis between companies from the northern and southern regions are shown in columns 1–2 of Table 12 and Table A7. When other variables were controlled for, the impact of Party on Apply was positive among companies from both regions, with the effect more substantial in companies from the northern region. The impact of Participate on Apply was only statistically significance in companies from the northern region. The results of the heterogeneity analysis between companies from the eastern, central, and western regions are presented in columns 3–5. The positive effect of Party on Apply was significant among companies from the eastern and western regions, with the effect more notable among companies from the western region. However, the effect was not statistically significant in companies from the central region. The positive effect of Participate on Apply was only significant in companies from the eastern region. The results of the heterogeneity analysis between companies from the Yangtze River Delta, Pearl River Delta, Beijing-Tianjin-Hebei, and other regions are exhibited in columns 6–9. It can be seen that the positive effect of party-organization involvements was significant in companies from Beijing-Tianjin-Hebei, the Yangtze River Delta, and other regions. In addition, the effect was most significant in companies from Beijing-Tianjin-Hebei, followed by those from the Yangtze River Delta, and then other regions. However, the effect was not significant in companies from the Pearl River Delta. It can be concluded that party-organization involvements in the governance played a stronger role in promoting corporate innovation in the northern region, Beijing-Tianjin-Hebei regions, and the Yangtze River Delta. This could be due to governments prioritizing the establishment of party organizations more in these regions. Enterprises in these regions may also consciously intend to play leading roles in corporate innovation.
6. Conclusions and Implications
To explore the impact of party-organization involvements in Chinese POEs’ governance on innovation, this paper introduces the party- organization activities and senior executives’ participation in the activities to measure the party organization involvements based on relational-embeddedness theory. Then, this paper employs the multiple regression model to empirically discuss this issue by using the data of 1357 POEs’ party-organization involvements and their patent applications from 2003 to 2017. The results are as follows. First, party-organization involvements in corporate governance including party organization activities and senior executives’ participation have promoted POEs’ innovation, which further supports the view of Yuan et al. [62]. Moreover, this promotion effect only exists after 2012, which further improves the conclusions of existing literature [59,60,61]. Second, party-organization involvements are more likely to promote the non-invention patent applications than invention applications. This effect is greatest on utility patents, followed by invention patents and design patents, which is closely related to the different characteristics of each patent. Third, promoting R&D investment and reducing operational risk are two important channels for the impact of the party organization activities on innovation, while senior executives’ participation can only act on the increases in R&D investment. Fourth, this effect was more pronounced among companies defined as natural persons or controlled by family businesses; as well as in technology- and capital-intensive enterprises, and in companies located in the northern, Beijing-Tianjin-Hebei regions, and Yangtze River Delta. After applying PSM sampling and DID analyses, and substituting the dependent variables, our findings remain robust.
This study will enlighten the enterprises to adjust measures to local conditions and implement policies by category, optimizing the involvement mode of the party organization. In general, both party-organization activities and senior executives’ participation can promote POEs’ innovation. In the development process of POEs, we should make good use of this opportunity to reasonably organize and optimize party-organization activities, and encourage senior executives to attach great importance to and actively participate in POEs’ party organization activities. These practices help strengthen the close relationship between employees and managers in their enterprises, and promote POEs’ innovation mainly by increasing R&D investment. Especially for family enterprises, capital-intensive or technology-intensive enterprises, those in the northern region, Beijing-Tianjin-Hebei regions, and Yangtze River Delta, party-organization involvements are more important.
This paper has some shortcomings and limitations, and is worthy of further discussion. First, this paper analyzes the impact of party-organization involvements in corporate governance on innovation, but fails to measure its specific quantitative contributions, and the latter can obtain more interesting findings about this by using machine-learning methods. Second, this paper focuses on the impact of manually retrieved party-organization involvements on corporate innovation, which fails to reveal those behind-door activities which may have more sponsoring impact on corporate innovation. In the future, we can consider adding the measure indicators of behind-door activities, for example building an enterprise’s insider information attention indicators, using python to crawl POEs’ political ties, the activities highly related to enterprise innovation and the national innovation policies, and exploring the impact of the dynamic correlation between enterprise activities highly related to innovation, political ties, and the national innovation policies issued later on POEs’ innovation. Third, this paper only focuses on the impact of party-organization involvements on POEs’ innovation. We can further include the sample of SOEs, so as to conduct a more comprehensive exploration of all listed companies, and clearly compare the differences between POEs and SOEs.
Author Contributions
Conceptualization, methodology, project administration, writing-original draft and review, and editing, proofread, funding acquisition, X.L.; Data analysis, model construction, writing—original draft, and editing, J.Z.; Model construction, data curation, writing-review, visualization, Y.W.; Conceptualization, N.H. All authors have read and agreed to the published version of the manuscript.
Funding
This research is supported by the Research Foundation for Youth Scholars of Beijing Technology and Business University under No. QNJJ2020–36 and No. PXM2020_014213_000017.
Data Availability Statement
The data used to support the findings of this study are available from the corresponding author upon request.
Acknowledgments
Thanks to all the reviewers and editors for the publication of this paper.
Conflicts of Interest
The authors declare no conflict of interest.
Appendix A

Table A1.
Full term and the abbreviations.
| Number | Full Term | Abbreviation | Number | Full Term | Abbreviation |
|---|---|---|---|---|---|
| 1 | Private-owned enterprises | POEs | 16 | propensity score matching | PSM |
| 2 | State-owned enterprises | SOEs | 17 | difference-in-differences | DID |
| 3 | Research and development | R&D | 18 | Return on operating cash flow | OCF |
| 4 | Communist party of China | CPC | 19 | Growth rate of operating revenue | Growth |
| 5 | The board chairman or CEO of an enterprise participates in activities | Senior executives’ participation (Participate) | 20 | Current ratio | CR |
| 6 | Party organization activities | Party | 21 | Total assets | TA |
| 7 | Non-invention application | InApply | 22 | Debt to asset ratio | Lever |
| 8 | Utility model application | UApply | 23 | Proportion of independent directors | Director |
| 9 | Design application | DApply | 24 | Duality of the chairman of the board and CEO | Merge |
| 10 | Age of listed company | Age | 25 | Operating risk | Roabd |
| 11 | Shareholding of the largest shareholder | First | 26 | Family firm | Family |
| 12 | Number of directors | Bd | 27 | Government grants | dbGover |
| 13 | Control group | Treat | 28 | Factor industry classification | Factor |
| 14 | Eastern, central and western region | Fdzx | 29 | Northern, southern region | Fnb |
| 15 | Industry | Ind | 30 | Region | Area |
Table A2.
Difference test (Participate).
| Full Sample: 2003–2017 | |||||
| Non Participation of the Senior Executives | Participation of the Senior Executives | t-Value | |||
| Observed Value | Mean Value | Observed Value | Mean Value | ||
| Age | 7101 | 6.1917 | 313 | 8.5591 | −2.3674 *** |
| CR | 7101 | 0.0318 | 313 | 0.0224 | 0.0094 *** |
| TA | 7101 | 9.3956 | 313 | 9.6310 | −0.2430 *** |
| Lever | 7101 | 0.3657 | 313 | 0.4073 | −0.0416 *** |
| OCF | 7101 | 0.0443 | 313 | 0.0514 | −0.0071 * |
| Growth | 7101 | 0.3413 | 313 | 0.2183 | 0.1230 |
| First | 7101 | 0.3336 | 313 | 0.3134 | 0.0202 ** |
| Bd | 7101 | 10.4784 | 313 | 11.3003 | −0.8219 *** |
| Director | 7101 | 0.3849 | 313 | 0.3718 | 0.0132 ** |
| Merge | 7101 | 0.3725 | 313 | 0.2620 | 0.1105 *** |
| Subsample 1: 2003–2011 | |||||
| Non Participation of the Senior Executives | Participation of the Senior Executives | t-Value | |||
| Observed value | mean value | Observed value | mean value | ||
| Age | 1768 | 5.5764 | 48 | 6.8542 | −1.2778 ** |
| CR | 1768 | 0.0295 | 48 | 0.0186 | 0.0109 |
| TA | 1768 | 9.2434 | 48 | 9.4721 | −0.2288 *** |
| Lever | 1768 | 0.4139 | 48 | 0.4629 | −0.0489 * |
| OCF | 1768 | 0.0416 | 48 | 0.0601 | −0.0185 |
| Growth | 1768 | 0.3582 | 48 | 0.2395 | 0.1187 |
| First | 1768 | 0.3410 | 48 | 0.3123 | 0.0287 |
| Bd | 1768 | 11.0096 | 48 | 12.0833 | −1.0737 ** |
| Director | 1768 | 0.3584 | 48 | 0.3499 | 0.0086 |
| Merge | 1768 | 0.2777 | 48 | 0.2292 | 0.0485 |
| Subsample 2: 2012–2017 | |||||
| Non Participation of the Senior Executives | Participation of the Senior Executives | t-Value | |||
| Observed Value | Mean Value | Observed Value | Mean Value | ||
| Age | 5333 | 6.3956 | 265 | 8.8679 | −2.4723 *** |
| CR | 5333 | 0.0326 | 265 | 0.0231 | 0.0095 *** |
| TA | 5333 | 9.4461 | 265 | 9.6687 | −0.2226 *** |
| Lever | 5333 | 0.3498 | 265 | 0.3973 | −0.0475 *** |
| OCF | 5333 | 0.0452 | 265 | 0.0498 | −0.0046 |
| Growth | 5333 | 0.3357 | 265 | 0.2144 | 0.1213 |
| First | 5333 | 0.3311 | 265 | 0.3136 | 0.0175 ** |
| Bd | 5333 | 10.3023 | 265 | 11.1585 | −0.8562 *** |
| Director | 5333 | 0.3937 | 265 | 0.3757 | 0.0180 *** |
| Merge | 5333 | 0.4039 | 265 | 0.2679 | 0.1360 *** |
Note: ***, ** and * represent the significant levels of 1%, 5% and 10% respectively.
Table A3.
PSM sample selection (Participate).
| Full sample: 2003–2017 | |||||||||
| Apply | IApply | InApply | |||||||
| NNM | RM | KM | NNM | RM | KM | NNM | RM | KM | |
| ATT difference | 0.1920 * | 0.1940 *** | 0.2420 *** | 0.1180 | 0.1540 ** | 0.1920 ** | 0.2450 ** | 0.1730 ** | 0.2240 *** |
| (1.95) | (2.65) | (3.35) | (1.15) | (2.00) | (2.53) | (2.11) | (2.00) | (2.63) | |
| Controls | control | control | control | control | control | control | control | control | control |
| Year | control | control | control | control | control | control | control | control | control |
| Ind | control | control | control | control | control | control | control | control | control |
| Subsample 1: 2003–2011 | |||||||||
| Apply | IApply | InApply | |||||||
| NNM | RM | KM | NNM | RM | KM | NNM | RM | KM | |
| ATT difference | 0.0640 | 0.1750 | 0.2230 | 0.0260 | 0.0020 | −0.0490 | 0.0020 | 0.2130 | 0.3250 |
| (0.28) | (1.00) | (1.40) | (0.11) | (0.01) | (−0.28) | (0.01) | (0.99) | (1.64) | |
| Controls | control | control | control | control | control | control | control | control | control |
| Year | control | control | control | control | control | control | control | control | control |
| Ind | control | control | control | control | control | control | control | control | control |
| Subsample 2: 2012–2017 | |||||||||
| Apply | IApply | InApply | |||||||
| NNM | RM | KM | NNM | RM | KM | NNM | RM | KM | |
| ATT difference | 0.1500 | 0.1980 ** | 0.2150 *** | 0.2030 * | 0.1960 ** | 0.2150 *** | 0.0470 | 0.1590 * | 0.1760 * |
| (1.34) | (2.40) | (2.65) | (1.77) | (2.32) | (2.59) | (0.37) | (1.65) | (1.83) | |
| Controls | control | control | control | control | control | control | control | control | control |
| Year | control | control | control | control | control | control | control | control | control |
| Ind | control | control | control | control | control | control | control | control | control |
Note: (1) The values in brackets in the table are t values; ***, ** and * represent the significant levels of 1%, 5% and 10% respectively; (2) NNM: nearest neighbour matching; RM: radius matching; KM: Kernel matching.
Table A4.
Mechanism analysis results of the party organization involvements and corporation innovation.
Table A4.
Mechanism analysis results of the party organization involvements and corporation innovation.
| Panel A: The Intermediary Effect of R & D Investment | |||||||
| Variable Name | Coefficient | Estimation Standard Error | t-Value | p > |t| | 95% Confidence Interval | ||
| The effect of the Participate on Apply | Executive | 0.172 | 0.063 | 2.72 | 0.007 | 0.048 | 0.297 |
| The effect of the Participate on Input | Executive | 0.157 | 0.051 | 3.08 | 0.002 | 0.057 | 0.257 |
| The effect of the Participate on Input and Apply | Input | 0.352 | 0.015 | 23.10 | 0.000 | 0.322 | 0.382 |
| Executive | 0.117 | 0.061 | 1.92 | 0.055 | −0.002 | 0.236 | |
| Panel B: The Intermediary Effect of Operating Risk | |||||||
| Variable Name | Coefficient | Estimation Standard Error | t-Value | p > |t| | 95% Confidence Interval | ||
| The effect of the Participate on Apply | Executive | 0.211 | 0.098 | 2.16 | 0.031 | 0.020 | 0.403 |
| The effect of the Participate on operating risk | Executive | −0.004 | 0.003 | −1.54 | 0.125 | −0.010 | 0.001 |
| The effect of Participate on operating risk and Apply | Roabd | −2.377 | 0.488 | −4.87 | 0.000 | −3.334 | −1.420 |
| Executive | 0.201 | 0.098 | 2.06 | 0.040 | 0.009 | 0.392 | |
Table A5.
Sobel test of mechanism analysis results (Participate).
| Panel A: Sobel Test of the Intermediary Effect of R&D Investment | ||||
| Coefficient | Estimation Standard Error | Z-Value | p > |z| | |
| Sobel | 0.0541 | 0.0239 | 2.2620 | 0.0237 |
| Goodman-1 (Aroian) | 0.0541 | 0.0239 | 2.2610 | 0.0238 |
| Goodman-2 | 0.0541 | 0.0239 | 2.2640 | 0.0236 |
| Panel B: Sobel Test of Intermediary Effect of Enterprise Operating Risk | ||||
| Coefficient | Estimation Standard Error | Z-Value | p > |z| | |
| Sobel | 0.0106 | 0.0072 | 1.464 | 0.1431 |
| Goodman-1 (Aroian) | 0.0106 | 0.0073 | 1.437 | 0.1507 |
| Goodman-2 | 0.0106 | 0.0071 | 1.493 | 0.1353 |
Table A6.
Analysis results of heterogeneity of family enterprises, government subsidies and industries (Participate).
Table A6.
Analysis results of heterogeneity of family enterprises, government subsidies and industries (Participate).
| Family Enterprise | Non Family Enterprise | Government Subsidies Are above Average | Government Subsidies Are below Average | Labour- Intensive | Capital- Intensive | Technology-Intensive | |
|---|---|---|---|---|---|---|---|
| (1) | (2) | (3) | (4) | (5) | (6) | (7) | |
| Apply | Apply | Apply | |||||
| Participate | 0.1787 *** | 0.2418 | 0.2003 ** | 0.1388 | 0.1351 | 0.2128 * | 0.1584 * |
| (2.72) | (0.48) | (2.39) | (1.37) | (0.89) | (1.82) | (1.72) | |
| Controls | control | control | control | control | control | control | control |
| Intercept | −10.9400 *** | −11.1690 * | −11.4435 *** | −6.6425 *** | −6.7879 *** | −6.9829 *** | −12.9187 *** |
| (−22.85) | (−1.87) | (−15.58) | (−9.30) | (−6.73) | (−8.41) | (−25.05) | |
| Year | control | control | control | control | control | control | control |
| Ind | control | control | control | control | control | control | control |
| N | 5504 | 94 | 2841 | 2697 | 857 | 1450 | 3291 |
| Pseudo-R2 | 0.3461 | 0.564 | 0.3819 | 0.2495 | 0.3144 | 0.2466 | 0.3824 |
Note: The values in brackets in the table are t values; ***, ** and * represent the significant levels of 1%, 5% and 10%, respectively.
Table A7.
Analysis results of spatial feature heterogeneity (Participate).
| Northern Region | Southern Region | Eastern Region | Central Region | West Region | Yangtze River Delta | Pearl River Delta | Beijing Tianjin Hebei Region | Other Regions | |
|---|---|---|---|---|---|---|---|---|---|
| (1) | (2) | (3) | (4) | (5) | (6) | (7) | (8) | (9) | |
| Apply | Apply | Apply | |||||||
| Participate | 0.4426 *** | −0.0473 | 0.1547 * | 0.0729 | 0.2803 | 0.2588 *** | −0.1889 | 0.6897 ** | 0.1749 * |
| (4.63) | (−0.53) | (1.80) | (0.61) | (1.31) | (2.71) | (−0.79) | (2.04) | (1.74) | |
| Controls | control | control | control | control | control | control | control | control | control |
| Intercept | −12.6417 *** | −10.7056 *** | −12.5667 *** | −7.7520 *** | −12.0202 *** | −9.7860 *** | −14.7859 *** | −14.7667 *** | −9.7684 *** |
| (−18.31) | (−15.53) | (−22.47) | (−7.05) | (−7.06) | (−8.64) | (−11.41) | (−9.20) | (−13.35) | |
| Year | control | control | control | control | control | control | control | control | control |
| Ind | control | control | control | control | control | control | control | control | control |
| N | 2452 | 3146 | 4233 | 915 | 450 | 2139 | 1007 | 588 | 1864 |
| Pseudo-R2 | 0.3823 | 0.3749 | 0.3711 | 0.4057 | 0.4474 | 0.3850 | 0.4731 | 0.4825 | 0.3402 |
Note: The values in brackets in the table are t values; ***, ** and * represent the significant levels of 1%, 5% and 10%, respectively.
References
- Xiaoyang, J.; Sheng, L. A factor market distortion research based on enterprise innovation efficiency of economic kinetic energy conversion. Sustain. Energy Technol. Assess. 2021, 44, 101021. [Google Scholar] [CrossRef]
- Moshirian, F.; Tian, X.; Zhang, B.; Zhang, W. Stock market liberalization and innovation. J. Financ. Econ. 2020, 139, 985–1014. [Google Scholar] [CrossRef]
- Si, Y.; Zhang, Y.; Teng, T. R&D internationalization and innovation performance of Chinese enterprises: The mediating role of returnees and foreign professionals. Growth Chang. 2021, 52, 2194–2212. [Google Scholar] [CrossRef]
- Xiao, P.; Sun, X. Does internationalization strategy promote enterprise innovation performance?—The moderating effect of environmental complexity. Manag. Decis. Econ. 2021, 43, 1721–1733. [Google Scholar] [CrossRef]
- Kong, D.; Zhang, B.; Zhang, J. Higher education and corporate innovation. J. Corp. Finance 2022, 72, 102165. [Google Scholar] [CrossRef]
- Li, J.; Shan, Y.; Tian, G.; Hao, X. Labor cost, government intervention, and corporate innovation: Evidence from China. J. Corp. Finance 2020, 64, 101668. [Google Scholar] [CrossRef]
- He, J.; Tian, X. Finance and Corporate Innovation: A Survey. Asia-Pac. J. Financ. Stud. 2018, 47, 165–212. [Google Scholar] [CrossRef] [Green Version]
- Amore, M.D.; Schneider, C.; Žaldokas, A. Credit supply and corporate innovation. J. Financ. Econ. 2013, 109, 835–855. [Google Scholar] [CrossRef]
- Hsu, P.-H.; Tian, X.; Xu, Y. Financial development and innovation: Cross-country evidence. J. Financ. Econ. 2014, 112, 116–135. [Google Scholar] [CrossRef] [Green Version]
- Fu, T.; Jian, Z. Corruption pays off: How environmental regulations promote corporate innovation in a developing country. Ecol. Econ. 2021, 183, 106969. [Google Scholar] [CrossRef]
- Ellis, J.; Smith, J.; White, R. Corruption and corporate innovation. J. Financ. Quant. Anal. 2020, 55, 2124–2149. [Google Scholar] [CrossRef]
- Brown, J.R.; Martinsson, G.; Petersen, B.C. Law, stock markets, and innovation. J. Financ. 2013, 68, 1517–1549. [Google Scholar] [CrossRef] [Green Version]
- Fang, L.H.; Lerner, J.; Wu, C. Intellectual property rights protection, ownership, and innovation: Evidence from China. Rev. Financ. Stud. 2017, 30, 2446–2477. [Google Scholar] [CrossRef] [Green Version]
- Luo, Y.; Xiong, G.; Mardani, A. Environmental information disclosure and corporate innovation: The “Inverted U-shaped” regulating effect of media attention. J. Bus. Res. 2022, 146, 453–463. [Google Scholar] [CrossRef]
- Cui, X.; Wang, C.; Liao, J.; Fang, Z.; Cheng, F. Economic policy uncertainty exposure and corporate innovation investment: Evidence from China. Pacific-Basin Financ. J. 2021, 67, 101533. [Google Scholar] [CrossRef]
- Shen, H.; Hou, F. Trade policy uncertainty and corporate innovation evidence from Chinese listed firms in new energy vehicle industry. Energy Econ. 2021, 97, 105217. [Google Scholar] [CrossRef]
- Wen, H.; Lee, C.-C.; Zhou, F. How does fiscal policy uncertainty affect corporate innovation investment? Evidence from China’s new energy industry. Energy Econ. 2021, 105, 105767. [Google Scholar] [CrossRef]
- Chen, S.S.; Huang, C.W.; Hwang, C.Y.; Wang, Y. Voluntary disclosure and corporate innovation. Rev. Quant. Financ. Account. 2022, 58, 1081–1115. [Google Scholar] [CrossRef]
- Jia, Y.; Gao, X.; Billings, B.A. Corporate Social Responsibility and Technological Innovation. J. Manag. Account. Res. 2021, 34, 163–186. [Google Scholar] [CrossRef]
- Tan, Y.; Zhu, Z. The effect of ESG rating events on corporate green innovation in China: The mediating role of financial constraints and managers’ environmental awareness. Technol. Soc. 2022, 68, 101906. [Google Scholar] [CrossRef]
- Amore, M.D.; Bennedsen, M. Corporate governance and green innovation. J. Environ. Econ. Manag. 2016, 75, 54–72. [Google Scholar] [CrossRef]
- Valencia, V.S. Corporate Governance and CEO Innovation. Atl. Econ. J. 2017, 46, 43–58. [Google Scholar] [CrossRef]
- Asensio-López, D.; Cabeza-García, L.; González-Álvarez, N. Corporate governance and innovation: A theoretical review. Eur. J. Manag. Bus. Econ. 2018, 28, 266–284. [Google Scholar] [CrossRef] [Green Version]
- Li, Y.; Mbanyele, W.; Sun, J. Managerial R&D hands-on experience, state ownership, and corporate innovation. China Econ. Rev. 2022, 72, 101766. [Google Scholar] [CrossRef]
- Quan, X.; Ke, Y.; Qian, Y.; Zhang, Y. CEO Foreign Experience and Green Innovation: Evidence from China. J. Bus. Ethics 2021, 1–23. [Google Scholar] [CrossRef]
- Yuan, R.; Wen, W. Managerial foreign experience and corporate innovation. J. Corp. Financ. 2018, 48, 752–770. [Google Scholar] [CrossRef]
- Chang, C.-H.; Wu, Q. Board Networks and Corporate Innovation. Manag. Sci. 2021, 67, 3618–3654. [Google Scholar] [CrossRef]
- Mathers, A.M.; Wang, B.; Wang, X. Shareholder coordination and corporate innovation. J. Bus. Financ. Account. 2020, 47, 730–759. [Google Scholar] [CrossRef]
- Cao, X.; Wang, Z.; Li, G.; Zheng, Y. The impact of chief executive officers’ (CEOs’) overseas experience on the corporate innovation performance of enterprises in China. J. Innov. Knowl. 2022, 7, 100268. [Google Scholar] [CrossRef]
- Han, S.; Kim, C. Employment stability and corporate innovation. Appl. Econ. Lett. 2020, 27, 1722–1725. [Google Scholar] [CrossRef]
- Mao, C.X.; Weathers, J. Employee treatment and firm innovation. J. Bus. Finance Account. 2019, 46, 977–1002. [Google Scholar] [CrossRef]
- Jiang, X.Y.; Yuan, Q.B. Institutional investors’ corporate site visits and corporate innovation. J. Corp. Financ. 2018, 48, 148–168. [Google Scholar] [CrossRef]
- Aghion, P.; Reenen, J.V.; Zingales, L. Innovation and institutional ownership. Am. Econ. Rev. 2013, 103, 277–304. [Google Scholar] [CrossRef] [Green Version]
- Lerner, J.; Wulf, J. Innovation and Incentives: Evidence from Corporate R&D. Rev. Econ. Stat. 2007, 89, 634–644. [Google Scholar] [CrossRef]
- He, F.; Yan, Y.; Hao, J.; Wu, J. Retail investor attention and corporate green innovation: Evidence from China. Energy Econ. 2022, 115, 106308. [Google Scholar] [CrossRef]
- Belloc, F. Corporate governance and innovation: A survey. J. Econ. Surv. 2011, 26, 835–864. [Google Scholar] [CrossRef]
- Zhang, W. China’s government spending and global inflation dynamics: The role of the oil price channel. Energy Econ. 2022, 110, 105993. [Google Scholar] [CrossRef]
- Herrala, R.; Orlandi, F. Win-win? Assessing the global impact of the Chinese economy. Asia Glob. Econ. 2021, 1, 100006. [Google Scholar] [CrossRef]
- Wang, Y. The Influence of Party Organization’s Participation in External Governance on the Innovation of China’s State-Owned Enterprises. Open J. Political Sci. 2020, 10, 347–362. [Google Scholar] [CrossRef]
- Li, M.H.; Cheng, H.Y. Participation of communist party organizations in corporate governance and innovation: Empirical evidence from listed state-owned enterprises. J. Syst. Manag. 2021, 30, 401–422. (In Chinese) [Google Scholar]
- Yao, L.I. Chinese communist party’s grass-roots organizations in enterprises since the 1990s: Changes and challenges. East Asian Policy 2019, 11, 96–106. [Google Scholar]
- Xie, S.; Lin, B.; Li, J. Political Control, Corporate Governance and Firm Value: The Case of China. J. Corp. Financ. 2022, 72, 102161. [Google Scholar] [CrossRef]
- Opper, S.; Wong, S.M.L.; Hu, R.Y. Party power, market and private power: Chinese Communist Party persistence in China’s listed companies. Res. Soc. Stratif. Mobil. 2002, 19, 105–138. [Google Scholar] [CrossRef]
- Lu, J.; Li, M. How do Party organizations’ boundary-spanning behaviors control worker unrest? A case study on a Chinese resource-based state-owned enterprise. Empl. Relat. 2017, 39, 184–203. [Google Scholar] [CrossRef]
- Meek, W.R.; Davis–Sramek, B.; Baucus, M.S.; Germain, R.N. Commitment in Franchising: The Role of Collaborative Communication and a Franchisee’s Propensity to Leave. Entrep. Theory Pract. 2011, 35, 559–581. [Google Scholar] [CrossRef]
- Islam, M.N.; Furuoka, F.; Idris, A. Mapping the relationship between transformational leadership, trust in leadership and employee championing behavior during organizational change. Asia Pac. Manag. Rev. 2021, 26, 95–102. [Google Scholar] [CrossRef]
- Alinaghian, L.; Kim, Y.; Srai, J. A relational embeddedness perspective on dynamic capabilities: A grounded investigation of buyer-supplier routines. Ind. Mark. Manag. 2019, 85, 110–125. [Google Scholar] [CrossRef]
- Horbach, J.; Rennings, K. Environmental innovation and employment dynamics in different technology fields—An analysis based on the German Community Innovation Survey 2009. J. Clean. Prod. 2013, 57, 158–165. [Google Scholar] [CrossRef] [Green Version]
- Gimmon, E.; Teng, Y.; He, X. Political embeddedness and multi-layered interaction effects on the performance of private enterprises: Lessons from China. Chin. Manag. Stud. 2021, 16, 571–588. [Google Scholar] [CrossRef]
- Chang, E.C.; Wong, S. Political control and performance in China’s listed firms. J. Comp. Econ. 2004, 32, 617–636. [Google Scholar] [CrossRef]
- Beck, K.I.; Brødsgaard, K.E. Corporate Governance with Chinese Characteristics: Party Organization in State-owned Enterprises. China Q. 2022, 250, 486–508. [Google Scholar] [CrossRef]
- Dong, Z.; Luo, Z.; Wei, X. Social insurance with Chinese characteristics: The role of communist party in private firms. China Econ. Rev. 2016, 37, 40–51. [Google Scholar] [CrossRef]
- Li, H.; Meng, L.; Wang, Q.; Zhou, L.-A. Political connections, financing and firm performance: Evidence from Chinese private firms. J. Dev. Econ. 2008, 87, 283–299. [Google Scholar] [CrossRef]
- Yan, Y.; Xu, X. The role of communist party branch in employment protection: Evidence from Chinese private firms. Asia-Pacific J. Account. Econ. 2021, 29, 1518–1539. [Google Scholar] [CrossRef]
- Zheng, D.; Xie, J.D.; Yuan, W. The CPC Party organizations in privately-controlled firms and earnings management. China J. Account. Studies 2019, 7, 270–291. [Google Scholar] [CrossRef]
- Haveman, H.A.; Jia, N.; Shi, J. The dynamics of political embeddedness in China. Adm. Sci. Q. 2016, 62, 67–104. [Google Scholar] [CrossRef] [Green Version]
- Li, X.; Chan, K.C. Communist party control and stock price crash risk: Evidence from China. Econ. Lett. 2016, 141, 5–7. [Google Scholar] [CrossRef]
- Yang, J.; Huang, J.; Deng, Y.; Bordignon, M. The rise of red private entrepreneurs in China: Policy shift, institutional settings and political connection. China Econ. Rev. 2020, 61, 101431. [Google Scholar] [CrossRef]
- Lin, N.; Li, A.; Ke, J.; Yuan, J. The governance role of corporate party organization on innovation. Int. Rev. Econ. Financ. 2022. [Google Scholar] [CrossRef]
- Wang, Y.; Cao, C.; Liu, D. Political Party System and Enterprise Innovation: Is China Different? Emerg. Mark. Finance Trade 2022, 1–15. [Google Scholar] [CrossRef]
- Beladi, H.; Hou, Q.; Hu, M. The party school education and corporate innovation: Evidence from SOEs in China. J. Corp. Finance 2022, 72, 102143. [Google Scholar] [CrossRef]
- Yuan, D.L.; Shang, D.; Pan, L.L. Embedding of party organizations and innovation investment of private enterprises: Micro evidence from the national survey of private enterprises. J. Shanxi Univ. Financ. Econ. 2022, 44, 99–114. (In Chinese) [Google Scholar]
- Hou, J.R. Does the pay gap in the top management team incent enterprise innovation?—Based on property rights and financing constraints. Am. J. Ind. Bus. Manag. 2018, 8, 1290–1307. [Google Scholar] [CrossRef]
- Dang, L.; Yang, R.L.; Yang, J.D. Anti-corruption and firm’s innovations: An explanation from political connections. China Ind. Econ. 2015, 7, 146–160. [Google Scholar]
- Polanyi, K.; Stiglitz, J.E.; Block, F.L. The Great Transformation: The Political and Economic Origins of Our Time, 2nd ed.; Beacon Press: Boston, MA, USA, 2001. [Google Scholar]
- Gulati, R. Alliances and networks. Strateg. Manag. J. 1998, 19, 293–317. [Google Scholar] [CrossRef]
- Rowley, T.; Behrens, D.; Krackhardt, D. Redundant governance structures: An analysis of structural and relational embeddedness in the steel and semiconductor industries. Strat. Manag. J. 2000, 21, 369–386. [Google Scholar] [CrossRef]
- Uzzi, B. Social structure and competition in interfirm net-works: The paradox of embeddedness. Adm. Sci. Q. 1997, 42, 35–67. [Google Scholar] [CrossRef]
- Shi, Y.; Zhu, P. The impact of organisational ageing and political connection on organisation technology innovation: An empirical study of IT industry and pharmaceutical industry in China. Asian J. Technol. Innov. 2014, 22, 234–251. [Google Scholar] [CrossRef]
- Tsai, L.-C.; Zhang, R.; Zhao, C. Political connections, network centrality and firm innovation. Finance Res. Lett. 2019, 28, 180–184. [Google Scholar] [CrossRef]
- Faccio, M. Politically connected firms. Am. Econ. Rev. 2006, 96, 369–386. [Google Scholar] [CrossRef] [Green Version]
- Huang, J.; Li, M.; Mao, L.; Zhang, T.; Li, J. The impact of network embeddedness on radical innovation performance-intermediators of innovation legitimacy and resource acquisition. Int. J. Technol. Policy Manag. 2017, 17, 220–239. [Google Scholar] [CrossRef]
- Hope, O.; Yue, H.; Zhong, Q. China’s Anti-Corruption Campaign and Financial Reporting Quality. Contemp. Account. Res. 2019, 37, 1015–1043. [Google Scholar] [CrossRef]
- Cai, Y.; Sevilir, M. Board connections and M&A transactions. J. Financ. Econ. 2012, 103, 327–349. [Google Scholar] [CrossRef] [Green Version]
- Li, L. Building the Rule of Law in China; Social Sciences Academic Press: Beijing, China, 2017. [Google Scholar]
- Griliches, Z. Patent Statistics as Economic Indicators: A Survey. J. Econ. Lit. 1990, 28, 1661–1707. [Google Scholar]
- Cornaggia, J.; Mao, Y.; Tian, X.; Wolfe, B. Does banking competition affect innovation? J. Financ. Econ. 2015, 115, 189–209. [Google Scholar] [CrossRef]
- Wang, S. How does stock market liberalization influence corporate innovation? Evidence from Stock Connect scheme in China. Emerg. Mark. Rev. 2020, 47, 100762. [Google Scholar] [CrossRef]
- Tong, T.W.; He, W.; He, Z.L.; Lu, J. Patent regime shift and firm innovation: Evidence from the second amendment to China’s patent law. Acad. Manag. Annu. Meet. Proc. 2014, 2014, 14174. [Google Scholar] [CrossRef]
- Ovtchinnikov, A.V.; Reza, S.W.; Wu, Y. Political Activism and Firm Innovation. J. Financial Quant. Anal. 2019, 55, 989–1024. [Google Scholar] [CrossRef]
- Tsai, L.L.; Xu, Y. Outspoken Insiders: Political Connections and Citizen Participation in Authoritarian China. Political Behav. 2017, 40, 629–657. [Google Scholar] [CrossRef] [Green Version]
- Zhao, M. Conducting R&D in Countries with Weak Intellectual Property Rights Protection. Manag. Sci. 2006, 52, 1185–1199. [Google Scholar] [CrossRef] [Green Version]
- Bozi’c, L.; Rajh, E. The factors constraining innovation performance of SMEs in Croatia. Econ. Res.-Ekon. Istrazivanja 2016, 29, 314–324. [Google Scholar] [CrossRef] [Green Version]
- Koeller, C.T. Innovation, market structure and firm size: A simultaneous equations model. Manag. Decis. Econ. 1995, 16, 259–269. [Google Scholar] [CrossRef]
- Griliche, Z. Productivity, R&D, and basic research at the firm level in the 1970′s. Am. Econ. Rev. 1986, 76, 142–154. [Google Scholar]
- Wang, M.; Zhou, Z.; Xu, C. Can Bank Debt Governance and Internal Governance Promote Enterprise Innovation? Procedia Comput. Sci. 2018, 139, 9–16. [Google Scholar] [CrossRef]
- Lei, Z.; Nugent, J.B. Coordinating China’s economic growth strategy via its government-controlled association for private firms. J. Comp. Econ. 2018, 46, 1273–1293. [Google Scholar] [CrossRef]
- Yu, S. Research on Corporate Governance of Party Organizations Participating in the Reform of Mixed Ownership of State-owned Enterprises from the Perspective of Organization Structure—Based on the CSME Analysis Framework. 2019. Available online: https://webofproceedings.org/proceedings_series/article/artId/9871.html (accessed on 19 October 2022).
- Kacperczyk, A.; Beckman, C.M.; Moliterno, T.P. Disentangling risk and change: Internal and external social comperison in the mutual fund industry. Adm. Sci. Q. 2015, 60, 28–262. [Google Scholar] [CrossRef]
- Huang, Q.; Jiang, F.; Wu, S.-Y. Does short-maturity debt discipline managers? Evidence from cash-rich firms’ acquisition decisions. J. Corp. Finance 2018, 53, 133–154. [Google Scholar] [CrossRef]
- Zheng, D.J. Organization embedding and financial violation. Manag. Rev. 2020, 32, 228–243+253. (In Chinese) [Google Scholar]
- Boubakri, N.; Cosset, J.-C.; Saffar, W. The role of state and foreign owners in corporate risk-taking: Evidence from privatization. J. Financ. Econ. 2013, 108, 641–658. [Google Scholar] [CrossRef]
- Zhao, X.; Lynch, J.; Chen, Q. Reconsidering baron and kenny: Myths and truths about mediation analysis. J. Consum. Res. 2010, 37, 197–206. [Google Scholar] [CrossRef]
Figure 1.
Relational-embeddedness theory and party-organization involvement.

Figure 2.
The mechanisms of party-organization involvements in POEs’ governance affecting innovation.
Figure 2.
The mechanisms of party-organization involvements in POEs’ governance affecting innovation.

Figure 3.
DID parallel trend test (Party). Note: current in the figure represents 2012.
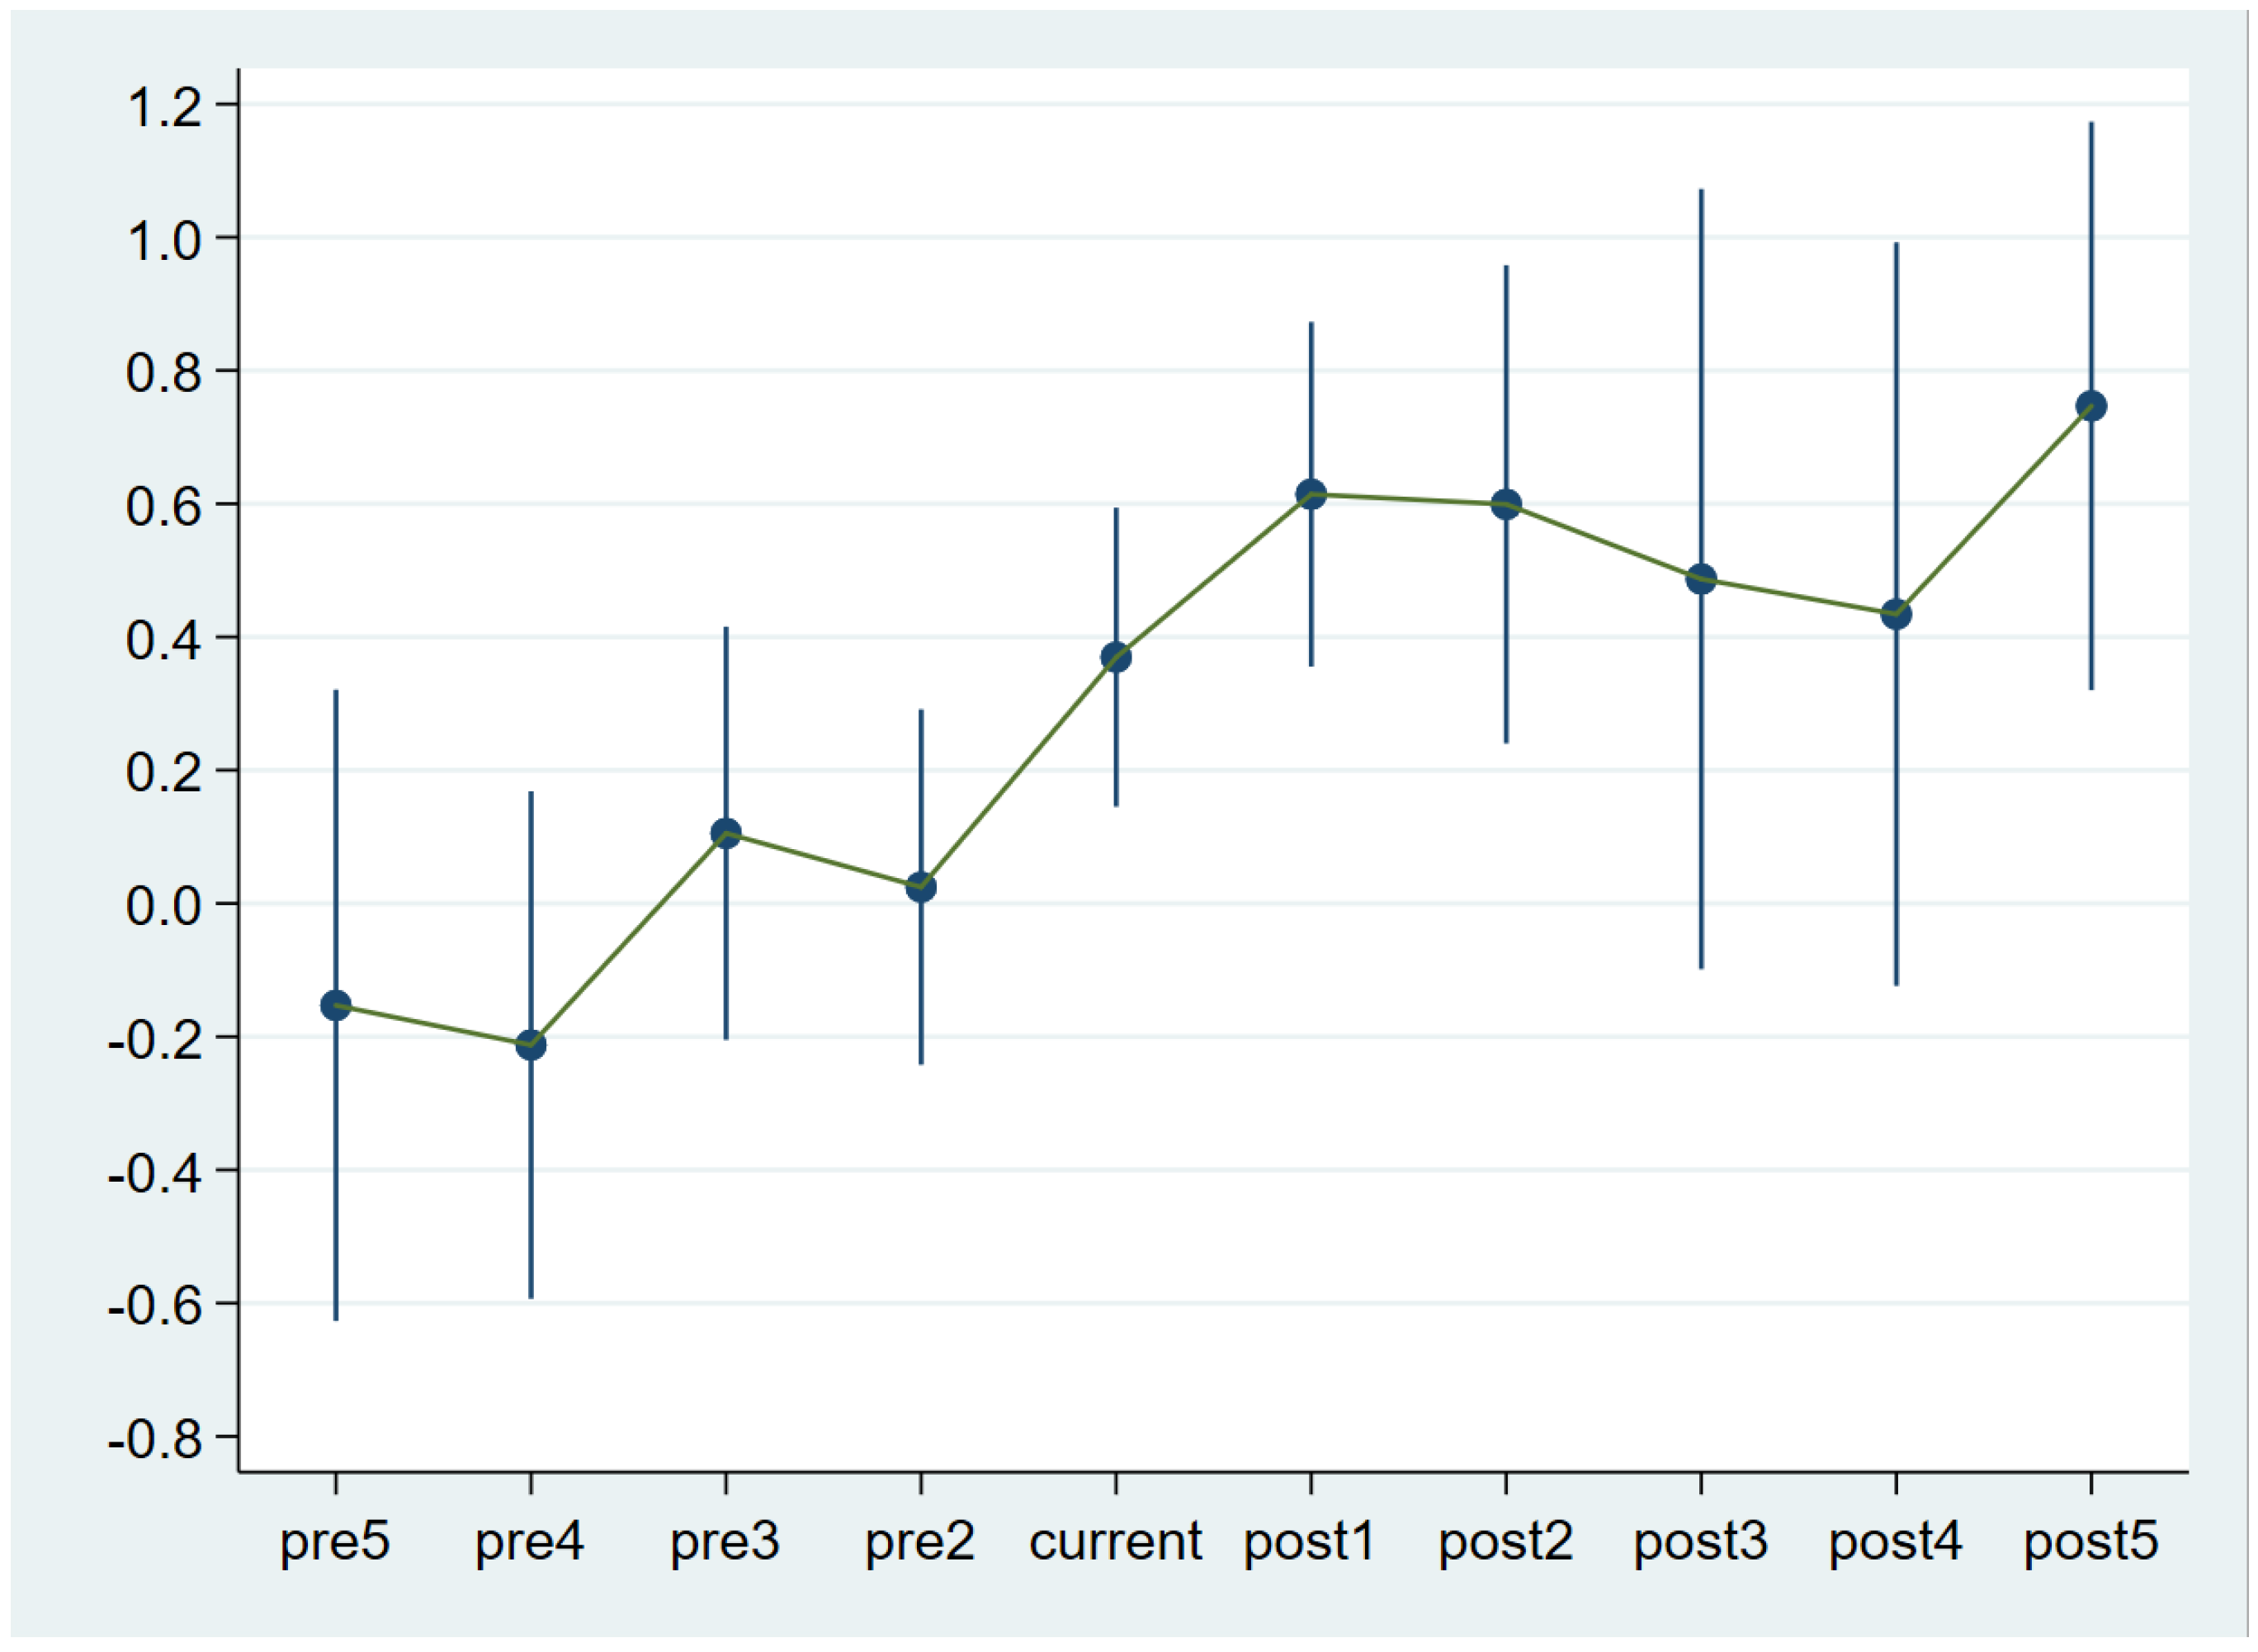
Figure 4.
DID parallel trend test (Participate). Note: current in the figure represents 2012.

Table 1.
Variable definition and calculation method.
| Variable Type | Definition | Code | Calculation Method | |
|---|---|---|---|---|
| Dependent variable | Patent application | Apply | Ln (Number of patent applications of the enterprise in the current year + 1) | |
| Invention application | IApply | Ln (Number of invention applications of the enterprise in the current year + 1) | ||
| Non-invention application | InApply | Ln (Total number of applications for utility models and designs of the enterprise in the current year + 1) | ||
| Utility model application | UApply | Ln (Number of utility model applications of the enterprise in the current year + 1) | ||
| Design application | DApply | Ln (Number of design applications of the enterprise in the current year + 1) | ||
| Independent variable | Party organization activities | Party | If the enterprise organizes party activities in that year, the value is 1; Otherwise, it is 0 | |
| Senior executives’ participation in activities | Participate | If the board chairman or CEO participates in the party organization activities, the value is 1; Otherwise, it is 0 | ||
| Control variable | Company fundamentals | Age of listed company | Age | Company listing age |
| Current ratio | CR | Current assets/current liabilities | ||
| Total assets | TA | Logarithm of total assets at the end of the year | ||
| Debt to asset ratio | Lever | Total liabilities/total assets | ||
| Return on operating cash flow | OCF | Net cash flow from operating activities/total assets | ||
| Growth rate of operating revenue | Growth | (main business income of this year–main business income of last year)/main business income of last year | ||
| Corporate governance | Shareholding of the largest shareholder | First | Shareholding of the largest shareholder/total shareholding of the enterprise | |
| Number of directors | Bd | Number of directors | ||
| Proportion of independent directors | Director | Number of independent directors/board of directors | ||
| Duality of the chairman of the board and CEO | Merge | If the chairman of the board and CEO of the enterprise are combined in one year, the value is 1; Otherwise, it is 0 | ||
| Other variables | Invention application_1 | IApply_1 | Ln (total invention applications of the enterprise in the current year and the next year + 1) | |
| Non-invention application_1 | InApply_1 | Ln (total non-invention applications of the enterprise in the current year and the next year + 1) | ||
| Patent application_2 | Apply_2 | Ln (total patent applications of the enterprise in the current year and the next two years + 1) | ||
| Invention application_2 | IApply_2 | Ln (total number of invention applications of the enterprise in the current year and the next two years + 1) | ||
| Non-invention application_2 | InApply_2 | Ln (total non-invention applications of the enterprise in the current year and the next two years + 1) | ||
| Control group | Treat | If Party organization activities have been held in the sample interval, 1; Party organization activities never held are 0 | ||
| R & D investment | Input | Ln (R & D investment of the enterprise in the current year) | ||
| Operating risk | Roabd | Referring to the research of Boubakri et al. [92], the standard deviation of return on assets obtained through industry and annual mean adjustment and rolling calculation with every three years as the observation window period is used as the variable to measure the volatility of return on enterprise risk assets. | ||
| Family firm | Family | If the actual controller of the enterprise is a natural person or family, the value is 1; Otherwise, it is 0 | ||
| Government grants | dbGover | If the government subsidy obtained by the enterprise in the current year is greater than the sample average value, the value is 1; Otherwise, it is 0 | ||
| Factor-industry classification | Factor | According to the proportion of fixed assets and R & D expenditure, all industries are divided into three categories. If they are labor-intensive, they are assigned as 1; Capital-intensive is assigned as 2; Technology-intensive is assigned a value of 3 | ||
| Northern, southern region | Fnb | If the enterprise belongs to the northern region, the value is 1; Otherwise, it is 0 | ||
| Eastern, central and western regions | Fdzx | If the enterprise belongs to the eastern region, the value is 1; 2 in the central region; 3 in the western region | ||
| Region | Area | If the enterprise belongs to the Yangtze River Delta, the value is 1; the Pearl River Delta is assigned as 2; Beijing Tianjin Hebei regions are assigned as 3; other regions are assigned as 4 | ||
| Year | Year | Dummy variable | ||
| Industry | Ind | Virtual variables are classified according to the industry category names of listed companies on the official website of the CSRC | ||
Note: (1) Patent application amount = application amount of invention patent in the current year + application amount of utility model in the current year and application amount of design in the current year; (2) Cumulative patent applications = patent applications in the current year + total patent applications in previous years.
Table 2.
Descriptive statistics of main variables.
| Full Sample: 2003–2017 | ||||||||
| Observed | Mean | Standard Deviation | min | max | p1 | p50 | p99 | |
| Apply | 7414 | 2.9230 | 1.2450 | 0.6930 | 6.0870 | 0.6930 | 2.9440 | 6.0870 |
| IApply | 7414 | 2.0120 | 1.2480 | 0.0000 | 5.2040 | 0.0000 | 1.9460 | 5.2040 |
| InApply | 7414 | 2.2300 | 1.4310 | 0.0000 | 5.6840 | 0.0000 | 2.3030 | 5.6840 |
| UApply | 7414 | 1.9660 | 1.4370 | 0.0000 | 5.3980 | 0.0000 | 1.9460 | 5.3980 |
| DApply | 7414 | 0.7660 | 1.1480 | 0.0000 | 4.5330 | 0.0000 | 0.0000 | 4.5330 |
| Party | 7414 | 0.1200 | 0.3250 | 0.0000 | 1.0000 | 0.0000 | 0.0000 | 1.0000 |
| Participate | 7414 | 0.0422 | 0.2011 | 0.0000 | 1.0000 | 0.0000 | 0.0000 | 1.0000 |
| Subsample 1: 2003–2011 | ||||||||
| Observed | Mean | Standard Deviation | min | max | p1 | p50 | p99 | |
| Apply | 1816 | 2.4410 | 1.1580 | 0.6930 | 5.4030 | 0.6930 | 2.3980 | 5.4030 |
| IApply | 1816 | 1.5380 | 1.1290 | 0.0000 | 4.6440 | 0.0000 | 1.3860 | 4.6440 |
| InApply | 1816 | 1.7570 | 1.3440 | 0.0000 | 4.9200 | 0.0000 | 1.7920 | 4.9200 |
| UApply | 1816 | 1.4160 | 1.3080 | 0.0000 | 4.6630 | 0.0000 | 1.0990 | 4.6630 |
| DApply | 1816 | 0.6720 | 1.0750 | 0.0000 | 4.0780 | 0.0000 | 0.0000 | 4.0780 |
| Party | 1816 | 0.0610 | 0.2400 | 0.0000 | 1.0000 | 0.0000 | 0.0000 | 1.0000 |
| Participate | 1816 | 0.0264 | 0.1605 | 0.0000 | 1.0000 | 0.0000 | 0.0000 | 1.0000 |
| Subsample 2: 2012–2017 | ||||||||
| Observed | Mean | Standard Deviation | min | max | p1 | p50 | p99 | |
| Apply | 5598 | 3.0810 | 1.2350 | 0.6930 | 6.2710 | 0.6930 | 3.0910 | 6.2710 |
| IApply | 5598 | 2.1660 | 1.2470 | 0.0000 | 5.3420 | 0.0000 | 2.0790 | 5.3420 |
| InApply | 5598 | 2.3850 | 1.4290 | 0.0000 | 5.8830 | 0.0000 | 2.4850 | 5.8830 |
| UApply | 5598 | 2.1450 | 1.4350 | 0.0000 | 5.5800 | 0.0000 | 2.1970 | 5.5800 |
| DApply | 5598 | 0.7970 | 1.1710 | 0.0000 | 4.6730 | 0.0000 | 0.0000 | 4.6730 |
| Party | 5598 | 0.1390 | 0.3460 | 0.0000 | 1.0000 | 0.0000 | 0.0000 | 1.0000 |
| Participate | 5598 | 0.0473 | 0.2124 | 0.0000 | 1.0000 | 0.0000 | 0.0000 | 1.0000 |
Note: (1) due to too much information, the control variables are not listed here. You can contact the corresponding author to obtain them; (2) P1, P50, and P99 represent the 1% quantile, 50% quantile, and 99% quantile, respectively.
Table 3.
Difference test (Party).
| Full Sample: 2003–2017 | |||||
| Activities of Non-Party Organizations | Organized Party Activities | t-Value | |||
| Observed Value | Mean Value | Observed Value | Mean Value | ||
| Age | 6524 | 6.0500 | 890 | 7.9720 | −1.9220 *** |
| CR | 6524 | 0.0300 | 890 | 0.0230 | 0.0070 *** |
| TA | 6524 | 9.3730 | 890 | 9.6310 | −0.2570 *** |
| Lever | 6524 | 0.3620 | 890 | 0.4070 | −0.0450 *** |
| OCF | 6524 | 0.0440 | 890 | 0.0470 | −0.0030 |
| Growth | 6524 | 0.2210 | 890 | 0.2410 | −0.0200 |
| First | 6524 | 0.3320 | 890 | 0.3340 | −0.0020 |
| Bd | 6524 | 10.4140 | 890 | 10.9200 | −0.5070 *** |
| Director | 6524 | 0.3850 | 890 | 0.3800 | 0.0050 |
| Merge | 6524 | 0.3730 | 890 | 0.3280 | 0.0450 *** |
| Subsample 1: 2003–2011 | |||||
| Activities of Non-Party Organizations | Organized Party Activities | t-Value | |||
| Observed Value | mean Value | Observed Value | Mean Value | ||
| Age | 1705 | 5.5740 | 111 | 5.8920 | −0.3180 |
| CR | 1705 | 0.0260 | 111 | 0.0260 | 0.0010 |
| TA | 1705 | 9.2380 | 111 | 9.4020 | −0.1640 *** |
| Lever | 1705 | 0.4130 | 111 | 0.4420 | −0.0290 |
| OCF | 1705 | 0.0420 | 111 | 0.0340 | 0.0080 |
| Growth | 1705 | 0.2230 | 111 | 0.2300 | −0.0070 |
| First | 1705 | 0.3390 | 111 | 0.3510 | −0.0120 |
| Bd | 1705 | 10.9830 | 111 | 11.2430 | −0.2600 |
| Director | 1705 | 0.3580 | 111 | 0.3590 | −0.0010 |
| Merge | 1705 | 0.2730 | 111 | 0.3330 | −0.0610 |
| Subsample 2: 2012–2017 | |||||
| Activities of Non-Party Organizations | Organized Party Activities | t-Value | |||
| Observed Value | Mean Value | Observed Value | Mean Value | ||
| Age | 4819 | 6.2120 | 779 | 8.2680 | −2.0560 *** |
| CR | 4819 | 0.0320 | 779 | 0.0230 | 0.0090 *** |
| TA | 4819 | 9.4210 | 779 | 9.6650 | −0.2430 *** |
| Lever | 4819 | 0.3440 | 779 | 0.4020 | −0.0580 *** |
| OCF | 4819 | 0.0450 | 779 | 0.0490 | −0.0040 * |
| Growth | 4819 | 0.2200 | 779 | 0.2440 | −0.0240 |
| First | 4819 | 0.3300 | 779 | 0.3320 | −0.0020 |
| Bd | 4819 | 10.2150 | 779 | 10.8690 | −0.6540 *** |
| Director | 4819 | 0.3940 | 779 | 0.3830 | 0.0120 *** |
| Merge | 4819 | 0.4090 | 779 | 0.3270 | 0.0810 *** |
Note: (1) due to too much information, the results of Participate are not listed here, please see Table A2; (2) *** and * represent the significant levels of 1% and 10%, respectively.
Table 4.
Party-organization involvements (Party and Participate) and corporate innovation.
| Panel A: Party and Patent Application | |||
| Apply | |||
| 2003–2017 | 2003–2011 | 2012–2017 | |
| Party | 0.2160 *** | 0.1580 | 0.2123 *** |
| (5.70) | (1.56) | (5.19) | |
| Intercept | −10.6480 *** | −8.7430 *** | −10.7850 *** |
| (−25.29) | (−10.29) | (−22.59) | |
| Controls | control | control | control |
| Year | control | control | control |
| Ind | control | control | control |
| N | 7414 | 1816 | 5598 |
| Pseudo-R2 | 0.3530 | 0.3210 | 0.3440 |
| Panel B: Participate and Patent Application | |||
| Apply | |||
| 2003–2017 | 2003–2011 | 2012–2017 | |
| Participate | 0.1770 *** | 0.1900 | 0.1820 *** |
| (2.97) | (1.28) | (2.79) | |
| Intercept | −10.8030 *** | −8.7740 *** | −10.9500 *** |
| (−25.69) | (−10.33) | (−22.96) | |
| Controls | control | control | control |
| Year | control | control | control |
| Ind | control | control | control |
| N | 7414 | 1816 | 5598 |
| Pseudo-R2 | 0.3510 | 0.3200 | 0.3420 |
Note: The values in brackets in the table are t values, *** represent the significant levels of 1%.
Table 5.
Party-organization involvements (Party and Participate) and classification of patent applications.
Table 5.
Party-organization involvements (Party and Participate) and classification of patent applications.
| Panel A: Party and Invention Patent Application, Non-Invention Patent Application | ||||||
| 2003–2017 | 2003–2011 | 2012–2017 | ||||
| IApply | InApply | IApply | InApply | IApply | InApply | |
| Party | 0.1430 *** | 0.2250 *** | −0.0350 | 0.1820 * | 0.1720 *** | 0.2110 *** |
| (3.61) | (5.26) | (−0.35) | (1.72) | (3.97) | (4.58) | |
| Intercept | −11.5750 *** | −9.4800 *** | −10.2260 *** | −5.9670 *** | −11.4930 *** | −10.1970 *** |
| (−26.28) | (−19.88) | (−12.03) | (−6.71) | (−22.73) | (−18.95) | |
| Controls | control | control | control | control | control | control |
| Year | control | control | control | control | control | control |
| Ind | control | control | control | control | control | control |
| N | 7414 | 7414 | 1816 | 1816 | 5598 | 5598 |
| Pseudo-R2 | 0.2960 | 0.3720 | 0.2850 | 0.4160 | 0.2790 | 0.3770 |
| Panel B: Participate and Invention Patent Application, Non-Invention Patent Application | ||||||
| 2003–2017 | 2003–2011 | 2012–2017 | ||||
| IApply | InApply | IApply | InApply | IApply | InApply | |
| Participate | 0.1340 ** | 0.1630 ** | −0.0230 | 0.2650 | 0.1820 *** | 0.1520 ** |
| (2.16) | (2.41) | (−0.15) | (1.55) | (2.64) | (2.07) | |
| Intercept | −11.6730 *** | −9.6450 *** | −10.2150 *** | −6.0400 *** | −11.6200 *** | −10.3670 *** |
| (−26.57) | (−20.26) | (−12.03) | (−6.18) | (−23.03) | (−19.29) | |
| Controls | control | control | control | control | control | control |
| Year | control | control | control | control | control | control |
| Ind | control | control | control | control | control | control |
| N | 7414 | 7414 | 1816 | 1816 | 5598 | 5598 |
| Pseudo-R2 | 0.2950 | 0.3710 | 0.2850 | 0.3310 | 0.2780 | 0.3750 |
| Panel C: Party and Non-Invention Patent Application | ||||||
| 2003–2017 | 2003–2011 | 2012–2017 | ||||
| UApply | DApply | UApply | DApply | UApply | DApply | |
| Party | 0.2290 *** | 0.1090 *** | 0.1820 * | 0.1530 | 0.2230 *** | 0.0870 ** |
| (5.58) | (2.74) | (1.72) | (1.50) | (4.97) | (2.00) | |
| Intercept | −9.5610 *** | −4.8830 *** | −5.9670 *** | −2.1830 ** | −9.9730 *** | −6.0730 *** |
| (−20.97) | (−11.04) | (−6.71) | (−2.54) | (−19.05) | (−11.98) | |
| Controls | control | control | control | control | control | control |
| Year | control | control | control | control | control | control |
| Ind | control | control | control | control | control | control |
| N | 7414 | 7414 | 1816 | 1816 | 5598 | 5598 |
| Pseudo-R2 | 0.4310 | 0.1610 | 0.4160 | 0.1920 | 0.4150 | 0.1770 |
| Panel D: Participate and Non-Invention Patent Application | ||||||
| 2003–2017 | 2003–2011 | 2012–2017 | ||||
| UApply | DApply | UApply | DApply | UApply | DApply | |
| Participate | 0.1570 ** | −0.0060 | 0.1730 | 0.1960 | 0.1680 ** | −0.0580 |
| (2.42) | (−0.09) | (1.72) | (1.11) | (2.35) | (−0.83) | |
| Intercept | −9.7310 *** | −4.9820 *** | −6.0130 *** | −2.2110 ** | −10.1500 *** | −6.1640 *** |
| (−21.37) | (−11.29) | (−6.76) | (−2.57) | (−19.41) | (−12.19) | |
| Controls | control | control | control | control | control | control |
| Year | control | control | control | control | control | control |
| Ind | control | control | control | control | control | control |
| N | 7414 | 7414 | 1816 | 1816 | 5598 | 5598 |
| Pseudo-R2 | 0.4290 | 0.1600 | 0.4150 | 0.1920 | 0.4130 | 0.1770 |
Note: The values in brackets in the table are t values; ***, ** and * represent the significant levels of 1%, 5% and 10%, respectively.
Table 6.
PSM sample selection.
| Full Sample: 2003–2017 | |||||||||
| Apply | IApply | InApply | |||||||
| NNM | RM | KM | NNM | RM | KM | NNM | RM | KM | |
| ATT difference | 0.2070 *** | 0.2190 *** | 0.2250 *** | 0.1330 ** | 0.1320 *** | 0.1430 *** | 0.2250 *** | 0.2330 *** | 0.2360 *** |
| (3.47) | (4.51) | (4.71) | (2.16) | (2.61) | (2.88) | (3.24) | (4.11) | (4.24) | |
| Controls | control | control | control | control | control | control | control | control | control |
| Year | control | control | control | control | control | control | control | control | control |
| Ind | control | control | control | control | control | control | control | control | control |
| Subsample 1: 2003–2011 | |||||||||
| Apply | IApply | InApply | |||||||
| NNM | RM | KM | NNM | RM | KM | NNM | RM | KM | |
| ATT difference | 0.0970 | 0.1440 | 0.2030 * | −0.2430 | −0.1320 | −0.0700 | 0.3320 * | 0.2540 * | 0.303 ** |
| (0.63) | (1.24) | (1.83) | (−1.47) | (−1.06) | (−0.59) | (1.75) | (1.71) | (2.14) | |
| Controls | control | control | control | control | control | control | control | control | control |
| Year | control | control | control | control | control | control | control | control | control |
| Ind | control | control | control | control | control | control | control | control | control |
| Subsample 2: 2012–2017 | |||||||||
| Apply | IApply | InApply | |||||||
| NNM | RM | KM | NNM | RM | KM | NNM | RM | KM | |
| ATT difference | 0.2120 *** | 0.2120 *** | 0.2180 *** | 0.1550 ** | 0.1670 *** | 0.1550 *** | 0.2260 *** | 0.2150 *** | 0.2190 *** |
| (3.30) | (4.02) | (4.17) | (2.32) | (3.11) | (2.84) | (3.05) | (3.49) | (3.61) | |
| Controls | control | control | control | control | control | control | control | control | control |
| Year | control | control | control | control | control | control | control | control | control |
| Ind | control | control | control | control | control | control | control | control | control |
Note: (1) due to too much information, the results of Participate are not listed here; (2) The values in brackets in the table are t values; ***, ** and * represent the significant levels of 1%, 5% and 10% respectively; (3) NNM: nearest neighbour matching; RM: radius matching; KM: Kernel matching.
Table 7.
Regression results of DID model.
| Apply | Apply | |||
|---|---|---|---|---|
| 2003–2011 | 2003–2012 | 2003–2011 | 2003–2012 | |
| Treat × Party | 0.1580 | 0.1720 ** | ||
| (1.56) | (2.08) | |||
| Treat × Participate | 0.1900 | 0.2214 * | ||
| (1.28) | (1.81) | |||
| Intercept | −8.7430 *** | −9.5310 *** | −8.7740 *** | −9.5696 *** |
| (−10.29) | (−12.91) | (−10.33) | (−12.97) | |
| Controls | control | control | control | control |
| Year | control | control | control | control |
| Ind | control | control | control | control |
| N | 1816 | 2511 | 1816 | 2511 |
| Pseudo-R2 | 0.3210 | 0.3280 | 0.3200 | 0.3274 |
Note: The values in brackets in the table are t values; ***, ** and * represent the significant levels of 1%, 5% and 10%, respectively.
Table 8.
Party-organization involvements and corporate innovation in different periods.
| Panel A: Party and Corporate Innovation | ||||||
| Apply_1 | IApply_1 | InApply_1 | Apply_2 | IApply_2 | InApply_2 | |
| Party | 0.1310 ** | 0.0300 | 0.1740 *** | 0.1420 *** | 0.0400 | 0.1740 *** |
| (2.54) | (0.52) | (2.70) | (2.87) | (0.70) | (2.73) | |
| Intercept | −10.2790 *** | −12.0150 *** | −9.4960 *** | −9.5760 *** | −11.5180 *** | −9.4620 *** |
| (−17.00) | (−17.62) | (−12.60) | (−16.50) | (−17.27) | (−12.67) | |
| Year | control | control | control | control | control | control |
| Ind | control | control | control | control | control | control |
| N | 4461 | 4461 | 4461 | 4461 | 4461 | 4461 |
| Pseudo-R2 | 0.3490 | 0.3080 | 0.3850 | 0.3680 | 0.3260 | 0.4000 |
| Panel B: Participate and Corporate Innovation | ||||||
| Apply_1 | IApply_1 | InApply_1 | Apply_2 | IApply_2 | InApply_2 | |
| Participate | 0.1480 * | 0.065 | 0.1550 | 0.1730 ** | 0.092 | 0.157 |
| (1.77) | (0.69) | (1.49) | (2.15) | (1.00) | (1.52) | |
| Intercept | −10.3350 *** | −12.0220 *** | −9.5770 *** | −9.6340 *** | −11.5250 *** | −9.5430 *** |
| (−17.10) | (−17.65) | (−12.71) | (−16.61) | (−17.31) | (−12.79) | |
| Year | control | control | control | control | control | control |
| Ind | control | control | control | control | control | control |
| N | 4461 | 4461 | 4461 | 4461 | 4461 | 4461 |
| Pseudo-R2 | 0.3490 | 0.3080 | 0.3840 | 0.3670 | 0.3260 | 0.4000 |
Note: The values in brackets in the table are t values; ***, ** and * represent the significant levels of 1%, 5% and 10%, respectively.
Table 9.
Mechanism analysis results of party-organization involvements and corporation innovation.
| Panel A: The Intermediary Effect of R & D Investment | |||||||
| Variable Name | Coefficient | Estimation Standard Error | T-Value | p > |t| | 95% Confidence Interval | ||
| The effect of the Party on Apply | Party | 12.0210 | 2.391 | 5.030 | 0.000 | 7.334 | 16.707 |
| The effect of the Party on Input | Party | 0.0900 | 0.030 | 2.950 | 0.003 | 0.030 | 0.150 |
| The effect of the Party on Input and Apply | Input | 18.6320 | 0.974 | 19.130 | 0.000 | 16.723 | 20.541 |
| Party | 10.3460 | 2.324 | 4.450 | 0.000 | 5.789 | 14.903 | |
| Panel B: The Intermediary Effect of Operating Risk | |||||||
| Variable Name | Coefficient | Estimation Standard Error | T-value | p > |t| | 95% Confidence Interval | ||
| The effect of the Party on Apply | Party | 0.1500 | 0.0550 | 2.7200 | 0.0070 | 0.0420 | 0.2570 |
| The effect of the Party on operating risk | Party | −0.0030 | 0.0020 | −1.5400 | 0.1230 | −0.0060 | 0.0010 |
| The effect of the Party on operating risk and Apply | Roabd | −0.9160 | 0.4760 | −1.9200 | 0.0540 | −1.8490 | 0.0170 |
| Party | 0.1470 | 0.0550 | 2.6800 | 0.0070 | 0.0390 | 0.2550 | |
Note: due to too much information, the results of Participate are not listed here (see Table A4).
Table 10.
Sobel test of mechanism-analysis results.
| Panel A: Sobel Test of the Intermediary Effect of R&D Investment | ||||
| Coefficient | Estimation Standard Error | Z-Value | p > |z| | |
| Sobel | 1.7580 | 0.7330 | 2.3990 | 0.0160 |
| Goodman-1 (Aroian) | 1.7580 | 0.7330 | 2.3970 | 0.0170 |
| Goodman-2 | 1.7580 | 0.7320 | 2.4010 | 0.0160 |
| Panel B: Sobel Test of Intermediary Effect of Enterprise Operating Risk | ||||
| Coefficient | Estimation Standard Error | Z-Value | p > |z| | |
| Sobel | 0.0100 | 0.0050 | 2.1910 | 0.0280 |
| Goodman-1 (Aroian) | 0.0100 | 0.0050 | 2.1550 | 0.0310 |
| Goodman-2 | 0.0100 | 0.0050 | 2.2290 | 0.0260 |
Note: due to too much information, the results of Participate are not listed here (see Table A4).
Table 11.
Analysis results of heterogeneity of family enterprises, government subsidies, and industries.
Table 11.
Analysis results of heterogeneity of family enterprises, government subsidies, and industries.
| Family Enterprise | Non Family Enterprise | Government Subsidies Are above Average | Government Subsidies Are below Average | Labour- Intensive | Capital- Intensive | Technology-Intensive | |
|---|---|---|---|---|---|---|---|
| (1) | (2) | (3) | (4) | (5) | (6) | (7) | |
| Apply | Apply | Apply | |||||
| Party | 0.2030 *** | 0.4640 | 0.1940 *** | 0.2200 *** | 0.0940 | 0.2000 *** | 0.2600 *** |
| (4.85) | (1.21) | (3.65) | (3.51) | (0.93) | (2.61) | (4.73) | |
| Controls | control | control | control | control | control | control | control |
| Intercept | −11.1120 *** | −8.6440 | −11.2800 *** | −6.4890 *** | −6.6970 *** | −6.7990 *** | −12.7580 *** |
| (−23.36) | (−1.43) | (−15.35) | (−9.08) | (−6.59) | (−8.17) | (−24.75) | |
| Year | control | control | control | control | control | control | control |
| Ind | control | control | control | control | control | control | control |
| N | 5504 | 94 | 2841 | 2697 | 857 | 1450 | 3291 |
| Pseudo-R2 | 0.3540 | 0.5700 | 0.3840 | 0.2530 | 0.3140 | 0.2480 | 0.3860 |
Note: The values in brackets in the table are t values; *** represents the significant levels of 1%.
Table 12.
Analysis results of spatial-feature heterogeneity.
| Northern Region | Southern Region | Eastern Region | Central Region | West Region | Yangtze River Delta | Pearl River Delta | Beijing Tianjin Hebei Region | Other Regions | |
|---|---|---|---|---|---|---|---|---|---|
| (1) | (2) | (3) | (4) | (5) | (6) | (7) | (8) | (9) | |
| Apply | Apply | Apply | |||||||
| Party | 0.3140 *** | 0.1110 ** | 0.2050 *** | 0.1250 | 0.4840 *** | 0.2690 *** | 0.0810 | 0.4390 *** | 0.2120 *** |
| (5.14) | (2.04) | (4.18) | (1.48) | (3.08) | (4.47) | (0.68) | (2.92) | (3.15) | |
| Controls | control | control | control | control | control | control | control | control | control |
| Intercept | −12.3500 *** | −9.9710 *** | −11.9470 *** | −7.5370 *** | −12.2330 *** | −9.7340 *** | −11.9290 *** | −14.7410 *** | −9.6180 *** |
| (−17.62) | (−14.43) | (−21.20) | (−6.73) | (−7.12) | (−8.56) | (−9.12) | (−9.04) | (−13.01) | |
| Year | control | control | control | control | control | control | control | control | control |
| Ind | control | control | control | control | control | control | control | control | control |
| N | 2452 | 3146 | 4233 | 915 | 450 | 2139 | 1007 | 588 | 1864 |
| Pseudo-R2 | 0.3810 | 0.3670 | 0.3640 | 0.4060 | 0.4610 | 0.3890 | 0.4430 | 0.4780 | 0.3410 |
Note: The values in brackets in the table are t values; *** and ** represent the significant levels of 1% and 5%, respectively.
Publisher’s Note: MDPI stays neutral with regard to jurisdictional claims in published maps and institutional affiliations. |
© 2022 by the authors. Licensee MDPI, Basel, Switzerland. This article is an open access article distributed under the terms and conditions of the Creative Commons Attribution (CC BY) license (https://creativecommons.org/licenses/by/4.0/).
Share and Cite
MDPI and ACS Style
Liu, X.; Zhou, J.; Wu, Y.; Hao, N. The Influence of Party Organization Involvements in Corporate Governance on Innovation: Evidence from China’s Private-Owned Enterprises. Sustainability 2022, 14, 16334. https://doi.org/10.3390/su142416334
AMA Style
Liu X, Zhou J, Wu Y, Hao N. The Influence of Party Organization Involvements in Corporate Governance on Innovation: Evidence from China’s Private-Owned Enterprises. Sustainability. 2022; 14(24):16334. https://doi.org/10.3390/su142416334
Chicago/Turabian StyleLiu, Xiaoxue, Jingyun Zhou, You Wu, and Na Hao. 2022. "The Influence of Party Organization Involvements in Corporate Governance on Innovation: Evidence from China’s Private-Owned Enterprises" Sustainability 14, no. 24: 16334. https://doi.org/10.3390/su142416334
Note that from the first issue of 2016, this journal uses article numbers instead of page numbers. See further details here.