
A Lower Serum Antioxidant Capacity as a Distinctive Feature for Women with HER2+ Breast Cancer: A Preliminary Study

 , , , , , ,
  and
and 
Abstract
Simple Summary
Abstract
1. Introduction
2. Materials and Methods
2.1. Study Design, Sample Size, and Eligibility Criteria
2.2. Data and Biological Material Collections
2.3. Infrared Spectrum Evaluation of Serum Samples by ATR-FTIR
2.4. Determination of Serum Redox Status Biomarkers
2.5. Statistical Analysis
3. Results
3.1. Characterization of the Study Population
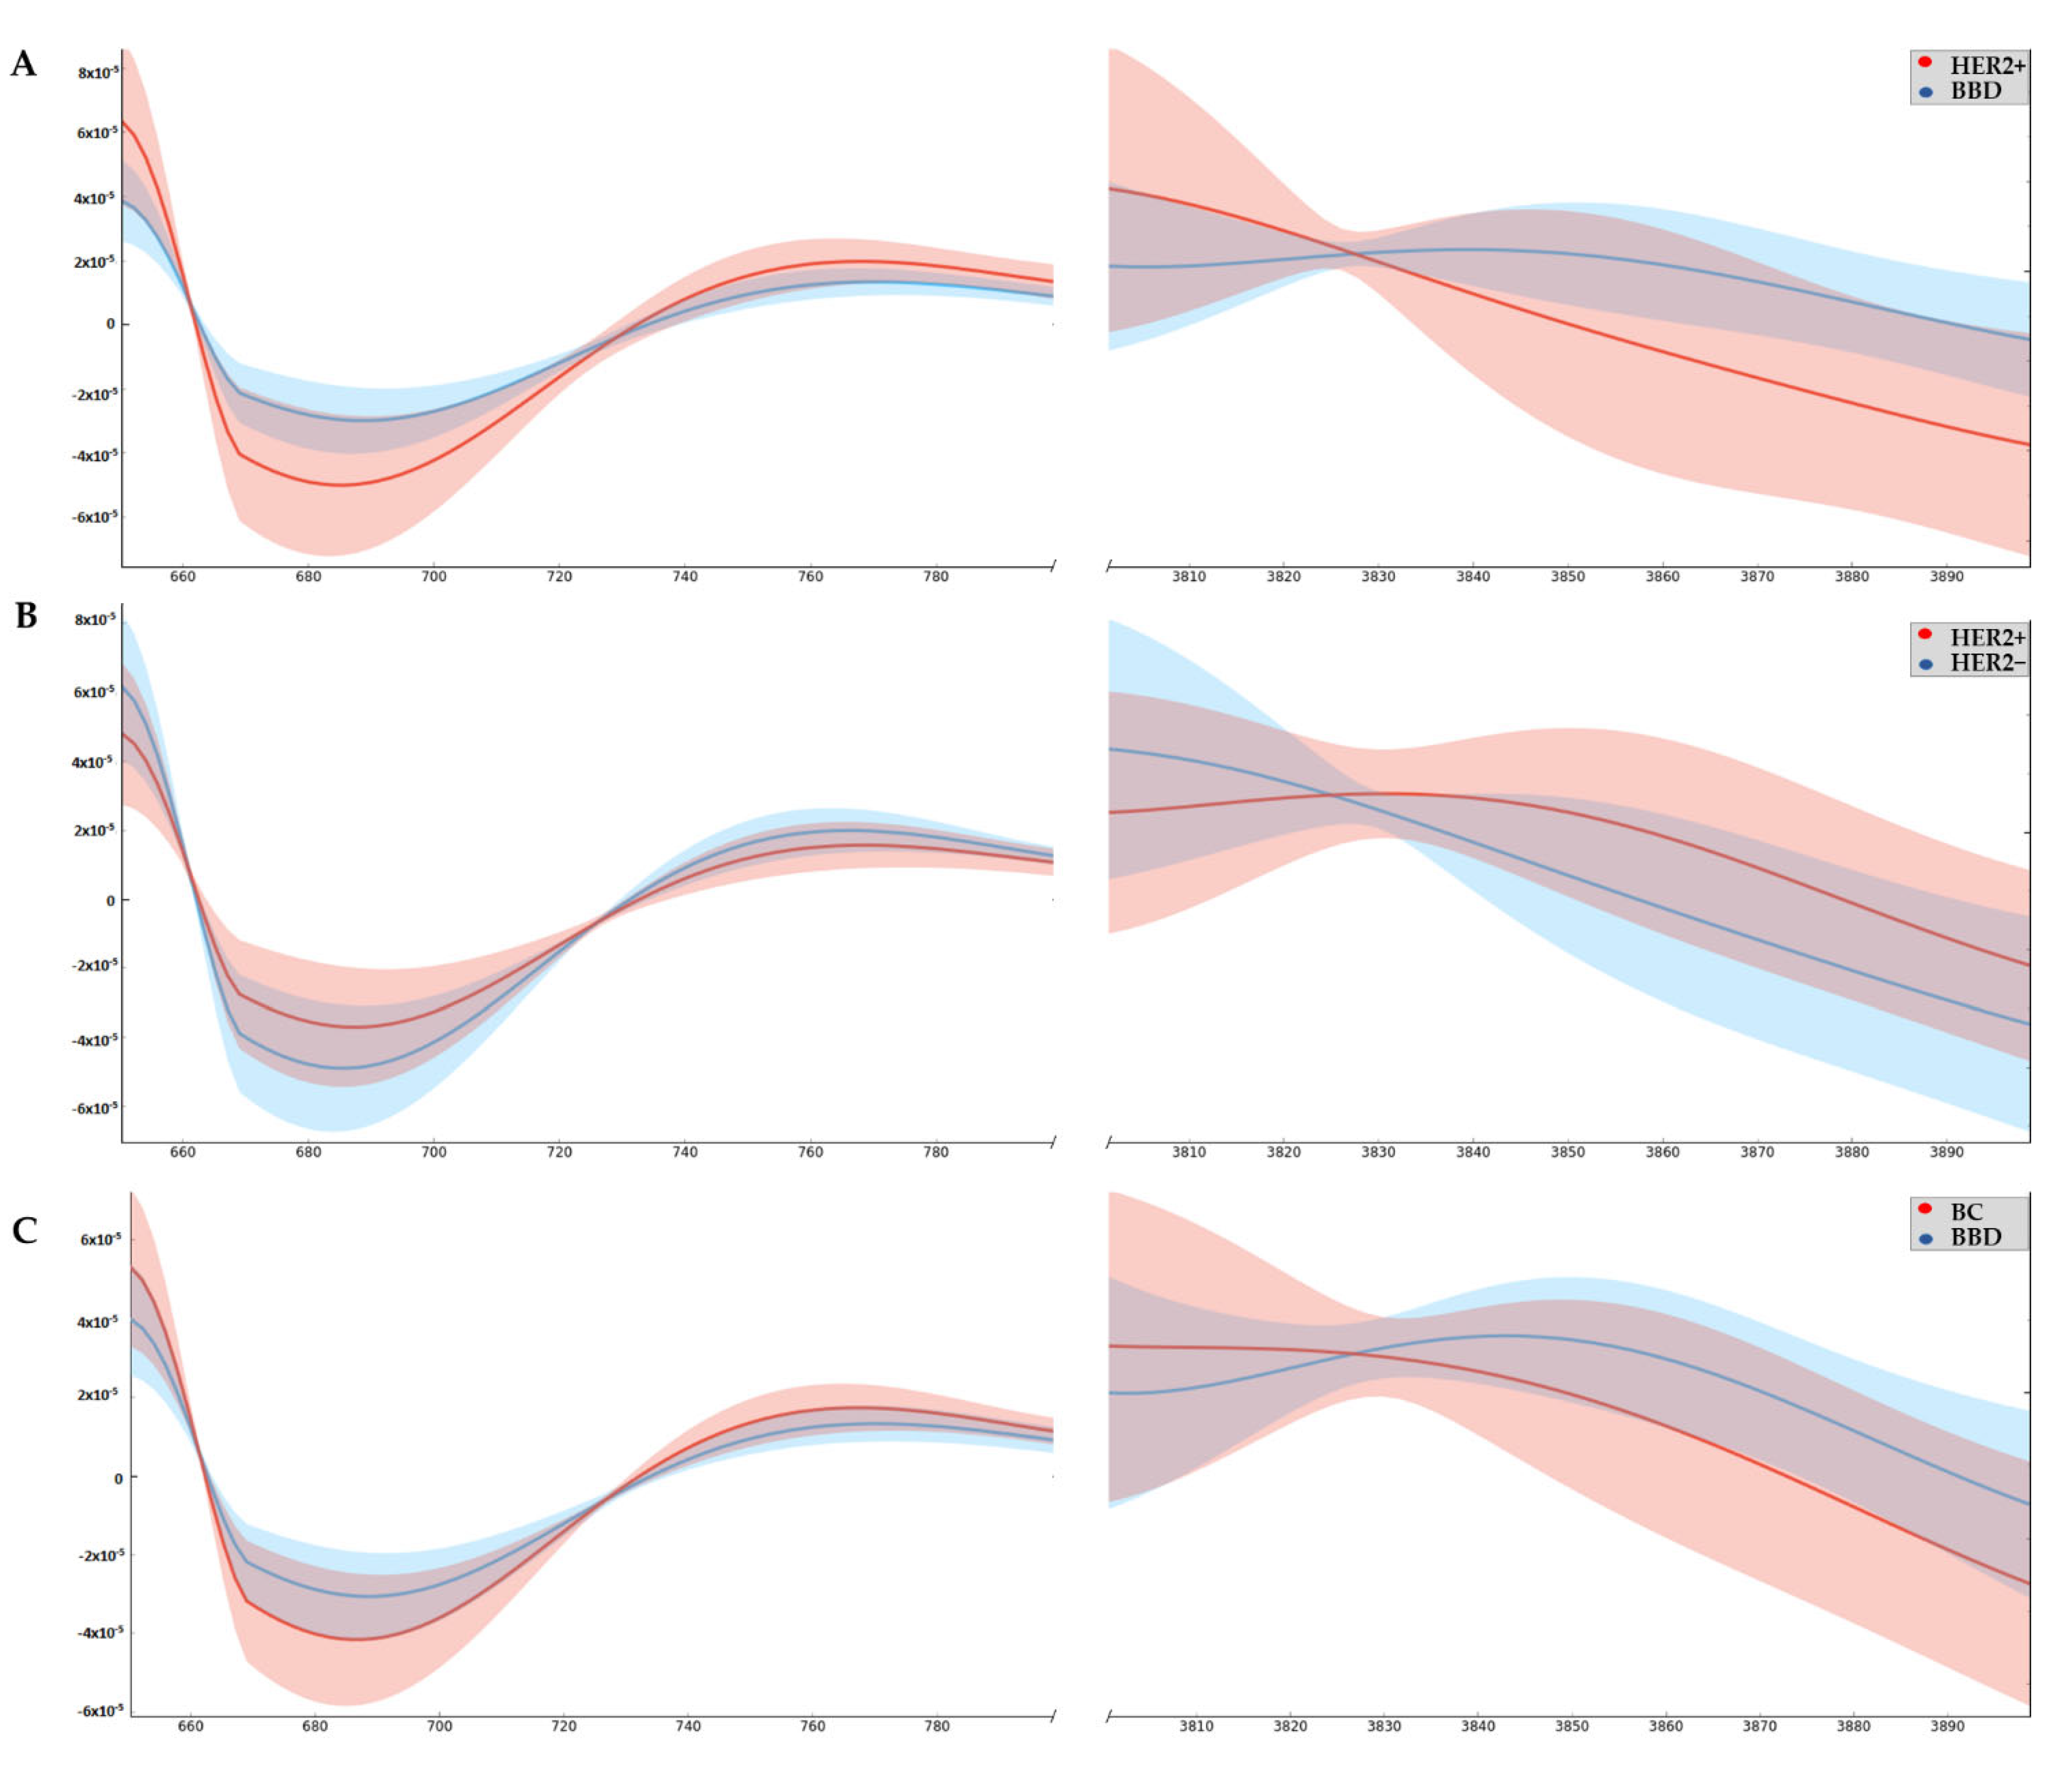
3.2. Wavenumbers Absorbance Related to Oxi-Reduction Differ between Groups Studied by ATR-FTIR
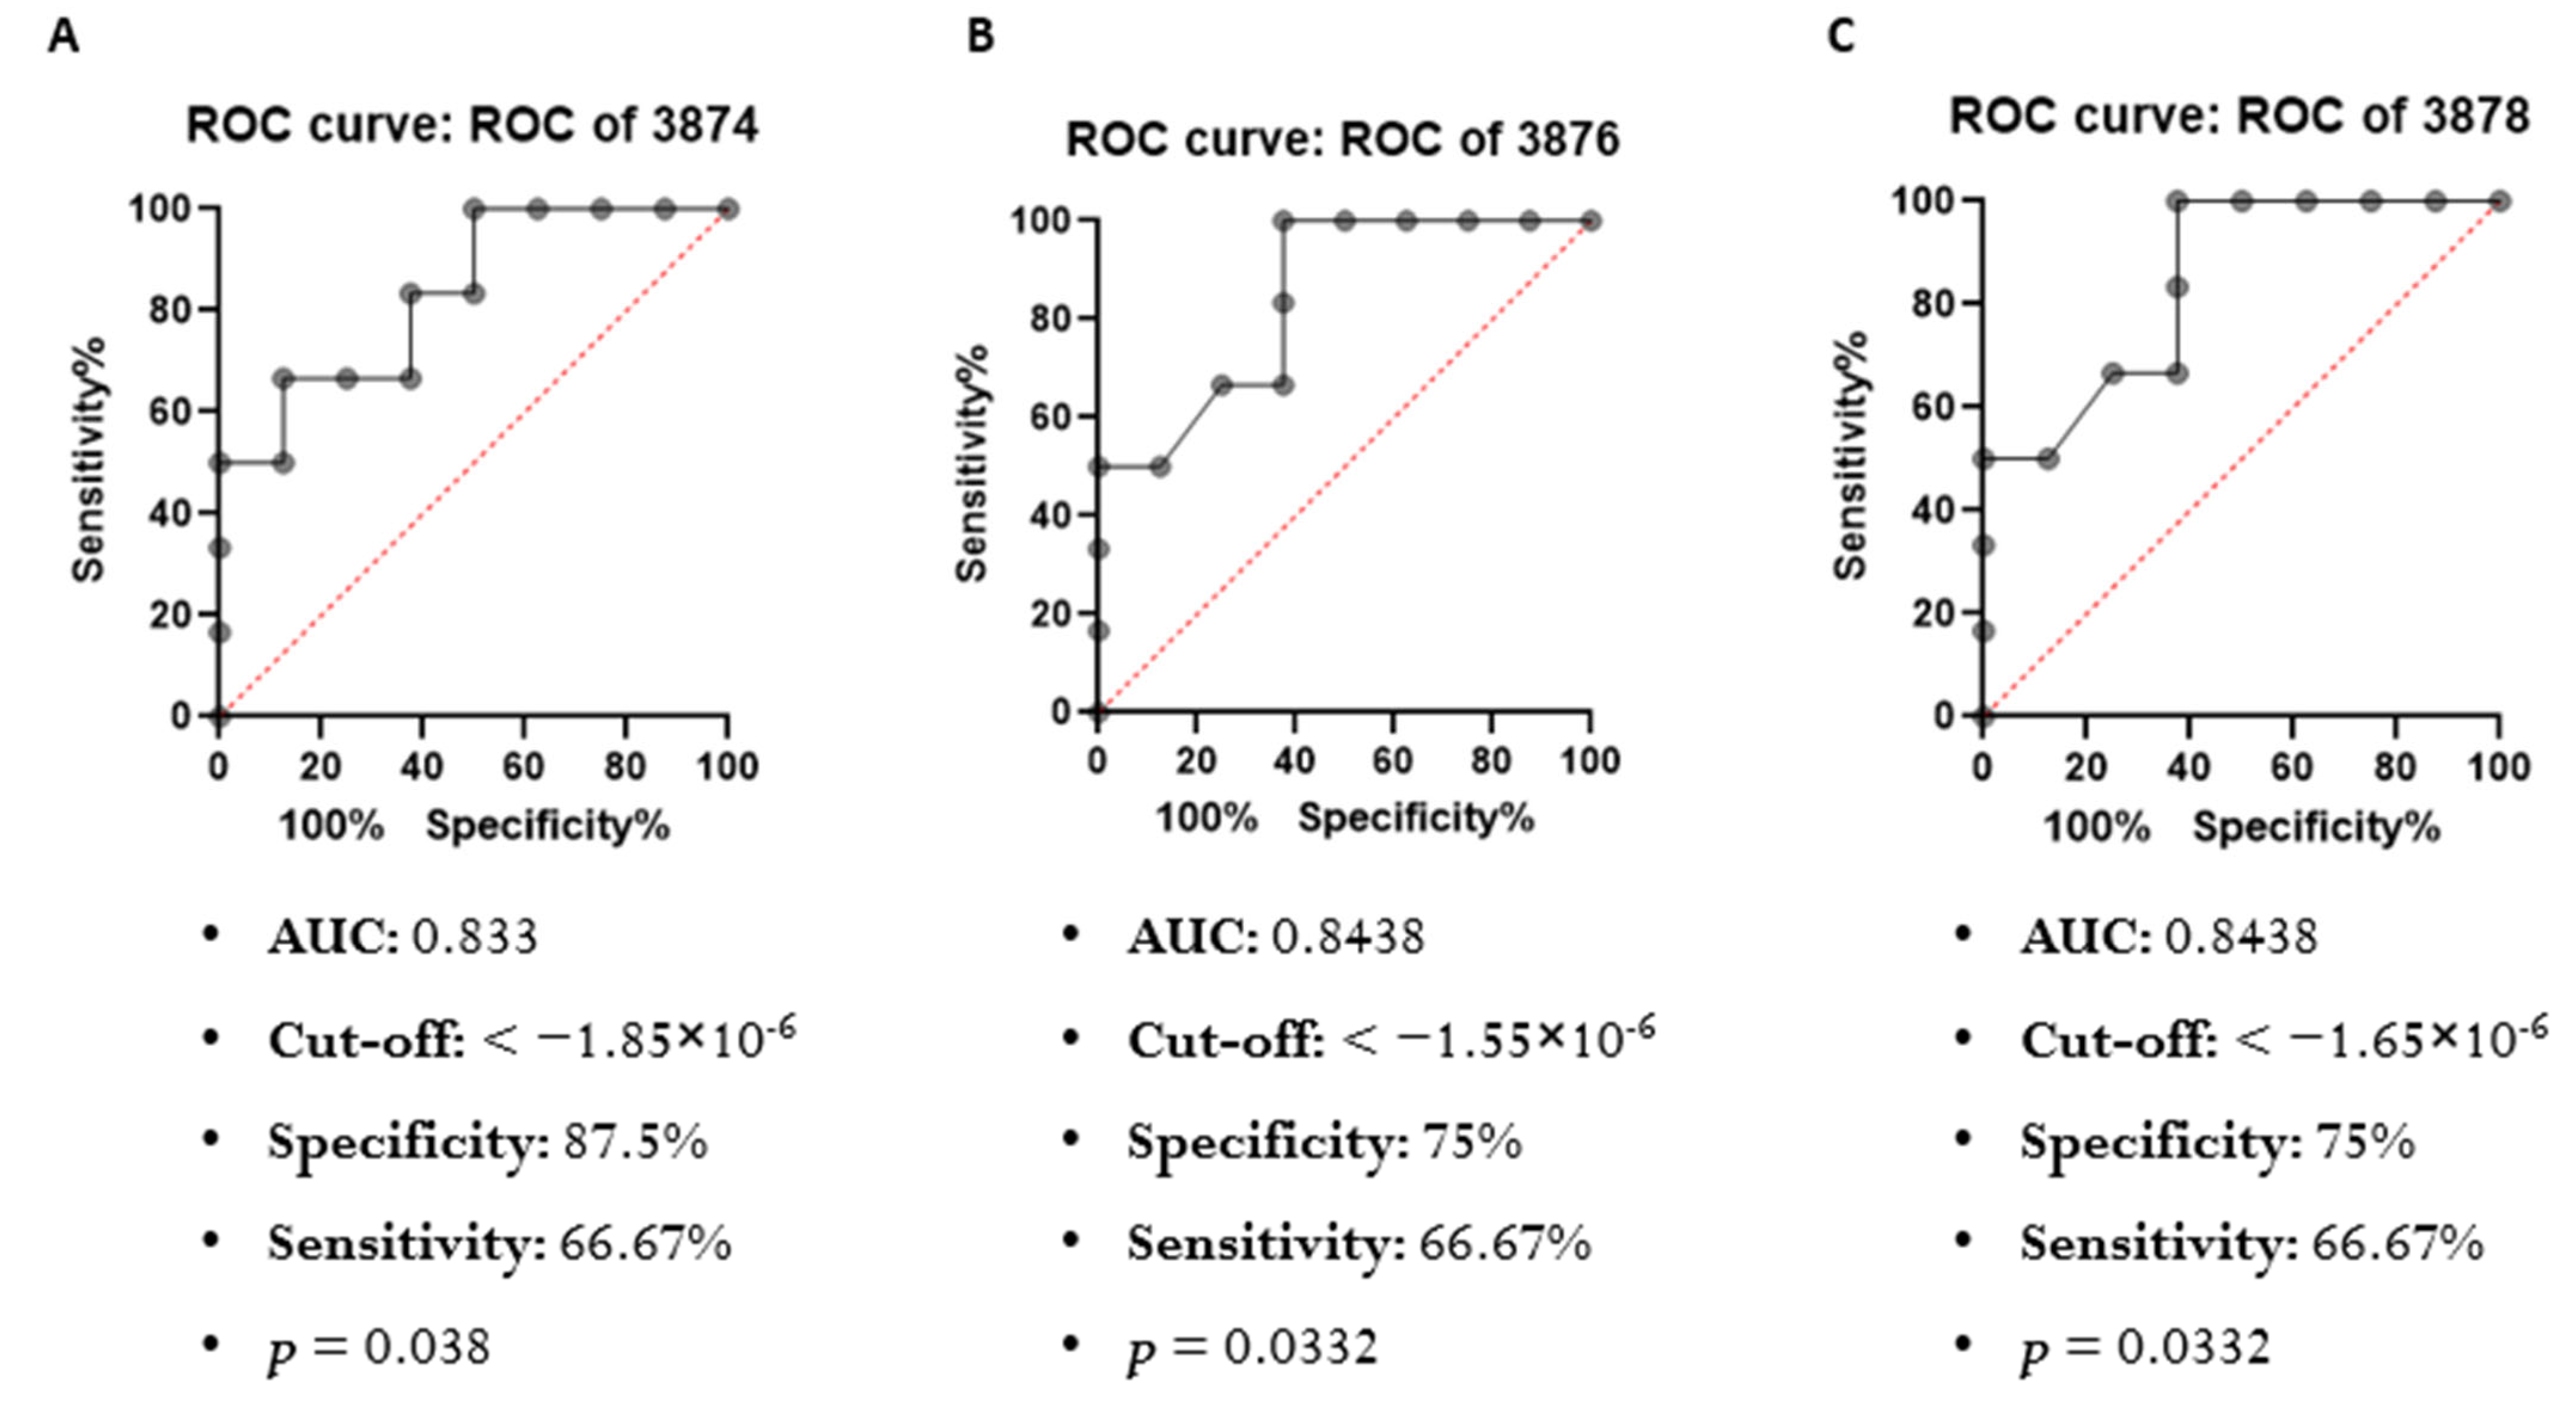
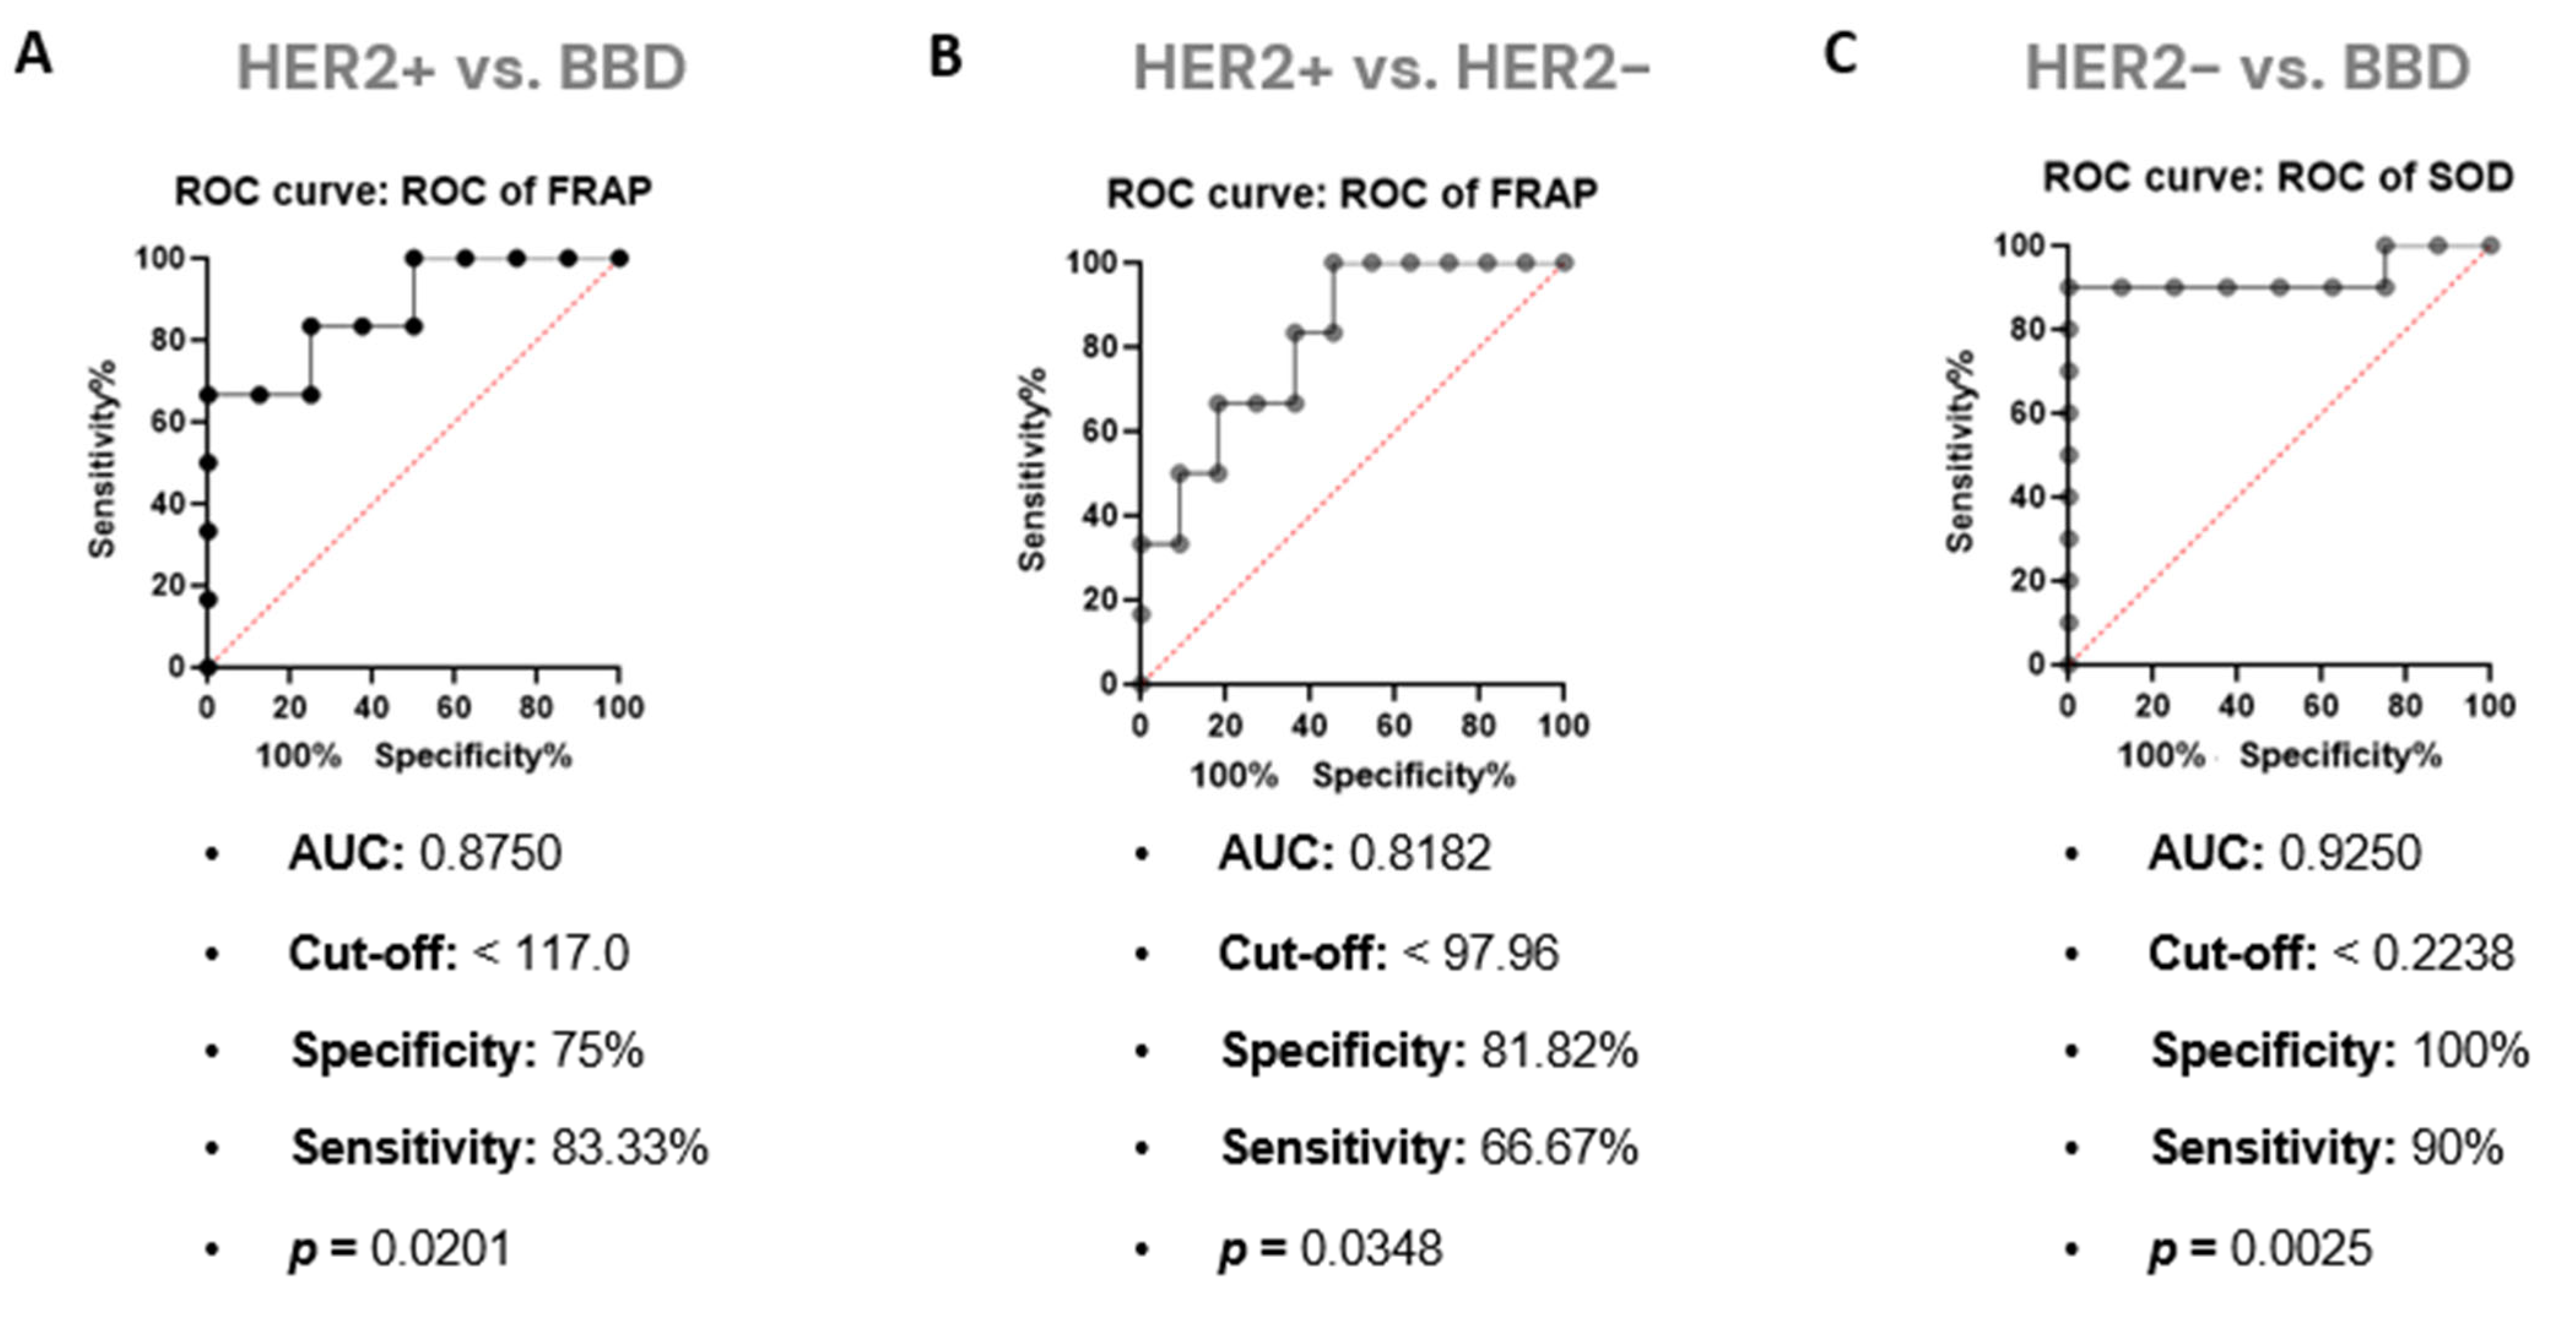
3.3. Differentiation of Sera Based on Redox Status
3.4. FRAP Strongly Correlates and Affects Results Obtained by ATR-FTIR in Serum Samples from Women with HER2+ BC
4. Discussion
5. Conclusions
Author Contributions
Funding
Institutional Review Board Statement
Informed Consent Statement
Data Availability Statement
Acknowledgments
Conflicts of Interest
References
- Sung, H.; Ferlay, J.; Siegel, R.L.; Laversanne, M.; Soerjomataram, I.; Jemal, A.; Bray, F. Global Cancer Statistics 2020: GLOBOCAN Estimates of Incidence and Mortality Worldwide for 36 Cancers in 185 Countries. CA Cancer J. Clin. 2021, 71, 209–249. [Google Scholar] [CrossRef] [PubMed]
- Li, J.; Chen, Z.; Su, K.; Zeng, J. Clinicopathological Classification and Traditional Prognostic Indicators of Breast Cancer. Int. J. Clin. Exp. Pathol. 2015, 8, 8500–8505. [Google Scholar] [PubMed]
- Polyak, K. Heterogeneity in Breast Cancer. J. Clin. Investig. 2011, 121, 3786–3788. [Google Scholar] [CrossRef]
- Siegel, R.L.; Miller, K.D.; Fuchs, H.E.; Jemal, A. Cancer Statistics, 2022. CA Cancer J. Clin. 2022, 72, 7–33. [Google Scholar] [CrossRef]
- DeSantis, C.E.; Ma, J.; Gaudet, M.M.; Newman, L.A.; Miller, K.D.; Goding Sauer, A.; Jemal, A.; Siegel, R.L. Breast Cancer Statistics, 2019. CA Cancer J. Clin. 2019, 69, 438–451. [Google Scholar] [CrossRef] [PubMed]
- Stival, R.S.M.; Prestes, A.L.d.O.; Mansani, F.P. Câncer de Mama Em Mulheres Jovens: Uma Análise Do Estadiamento Clínico Inicial e Dos Subtipos Moleculares Dos Tumores. Rev. Bras. Mastol. 2014, 24, 17–22. [Google Scholar] [CrossRef]
- Devi, G.R.; Allensworth, J.L.; Evans, M.K.; Sauer, S.J. The Role of Oxidative Stress in Breast Cancer. In Cancer; Elsevier: Amsterdam, The Netherlands, 2014; pp. 3–14. [Google Scholar]
- Smith, C.; Marks, A.; Lieberman, M. Marks’ Basic Medical Biochemistry: A Clinical Approach, 2nd ed.; Lippincott Williams & Wilkins: Philadelphia, PA, USA, 2007. [Google Scholar]
- Hecht, F.; Pessoa, C.F.; Gentile, L.B.; Rosenthal, D.; Carvalho, D.P.; Fortunato, R.S. The Role of Oxidative Stress on Breast Cancer Development and Therapy. Tumor Biology 2016, 37, 4281–4291. [Google Scholar] [CrossRef]
- Thannickal, V.J.; Fanburg, B.L. Reactive Oxygen Species in Cell Signaling. Am. J. Physiol. -Lung Cell. Mol. Physiol. 2000, 279, L1005–L1028. [Google Scholar] [CrossRef]
- Bhatti, J.S.; Sehrawat, A.; Mishra, J.; Sidhu, I.S.; Navik, U.; Khullar, N.; Kumar, S.; Bhatti, G.K.; Reddy, P.H. Oxidative Stress in the Pathophysiology of Type 2 Diabetes and Related Complications: Current Therapeutics Strategies and Future Perspectives. Free Radic. Biol. Med. 2022, 184, 114–134. [Google Scholar] [CrossRef]
- Chang, K.-C.; Liu, P.-F.; Chang, C.-H.; Lin, Y.-C.; Chen, Y.-J.; Shu, C.-W. The Interplay of Autophagy and Oxidative Stress in the Pathogenesis and Therapy of Retinal Degenerative Diseases. Cell Biosci. 2022, 12, 1. [Google Scholar] [CrossRef]
- Ali, S.S.; Ahsan, H.; Zia, M.K.; Siddiqui, T.; Khan, F.H. Understanding Oxidants and Antioxidants: Classical Team with New Players. J. Food Biochem. 2020, 44. [Google Scholar] [CrossRef] [PubMed]
- Barth, A. Infrared Spectroscopy of Proteins. Biochim. Biophys. Acta (BBA)—Bioenerg. 2007, 1767, 1073–1101. [Google Scholar] [CrossRef] [PubMed]
- Déléris, G.; Petibois, C. Applications of FT-IR Spectrometry to Plasma Contents Analysis and Monitoring. Vib. Spectrosc. 2003, 32, 129–136. [Google Scholar] [CrossRef]
- Mamede, A.P.; Santos, I.P.; Batista de Carvalho, A.L.M.; Figueiredo, P.; Silva, M.C.; Tavares, M.V.; Marques, M.P.M.; Batista de Carvalho, L.A.E. A New Look into Cancer—A Review on the Contribution of Vibrational Spectroscopy on Early Diagnosis and Surgery Guidance. Cancers 2021, 13, 5336. [Google Scholar] [CrossRef] [PubMed]
- Faul, F.; Erdfelder, E.; Lang, A.-G.; Buchner, A. G*Power 3: A Flexible Statistical Power Analysis Program for the Social, Behavioral, and Biomedical Sciences. Behav. Res. Methods 2007, 39, 175–191. [Google Scholar] [CrossRef]
- Browne, R.W.; Armstrong, D. Reduced Glutathione and Glutathione Disulfide. In Free Radical and Antioxidant Protocols; Humana Press: Totowa, NJ, USA, 1998; Volume 108, pp. 347–352. [Google Scholar]
- Fernandes, C.G.; Borges, C.G.; Seminotti, B.; Amaral, A.U.; Knebel, L.A.; Eichler, P.; de Oliveira, A.B.; Leipnitz, G.; Wajner, M. Experimental Evidence That Methylmalonic Acid Provokes Oxidative Damage and Compromises Antioxidant Defenses in Nerve Terminal and Striatum of Young Rats. Cell Mol. Neurobiol. 2011, 31, 775–785. [Google Scholar] [CrossRef]
- Aebi, H. Catalase in Vitro. Methods Enzymol. 1984, 105, 121–126. [Google Scholar]
- Benzie, I.F.F.; Strain, J.J. The Ferric Reducing Ability of Plasma (FRAP) as a Measure of “Antioxidant Power”: The FRAP Assay. Anal. Biochem. 1996, 239, 70–76. [Google Scholar] [CrossRef]
- Reznick, A.Z.; Packer, L. Oxidative Damage to Proteins: Spectrophotometric Method for Carbonyl Assay. Methods Enzymol. 1994, 186, 357–363. [Google Scholar]
- Coates, J. Interpretation of Infrared Spectra, A Practical Approach. In Encyclopedia of Analytical Chemistry; John Wiley & Sons, Ltd.: Chichester, UK, 2006. [Google Scholar]
- Kumar, S.; Chaudhary, S.; Jain, D.C. Vibrational Studies of Different Human Body Disorders Using FTIR Spectroscopy. Open J. Appl. Sci. 2014, 04, 103–129. [Google Scholar] [CrossRef]
- Movasaghi, Z.; Rehman, S.; ur Rehman, D.I. Fourier Transform Infrared (FTIR) Spectroscopy of Biological Tissues. Appl. Spectrosc. Rev. 2008, 43, 134–179. [Google Scholar] [CrossRef]
- Anastassopoulou, J.; Kyriakidou, M.; Kyriazis, S.; Mavrogenis, A.F.; Mamareli, V.; Mamarelis, I.; Petra, M.; Malesiou, E.; Kotoulas, C.; Kolovou, P.; et al. Oxidative Stress in Ageing and Disease Development Studied by FT-IR Spectroscopy. Mech. Ageing Dev. 2018, 172, 107–114. [Google Scholar] [CrossRef] [PubMed]
- Naumann, D. FT-Infrared and FT-Raman Spectroscopy in Biomedical Research. Appl. Spectrosc Rev. 2001, 36, 239–298. [Google Scholar] [CrossRef]
- Kepesidis, K.V.; Bozic-Iven, M.; Huber, M.; Abdel-Aziz, N.; Kullab, S.; Abdelwarith, A.; al Diab, A.; al Ghamdi, M.; Hilal, M.A.; Bahadoor, M.R.K.; et al. Breast-Cancer Detection Using Blood-Based Infrared Molecular Fingerprints. BMC Cancer 2021, 21, 1287. [Google Scholar] [CrossRef] [PubMed]
- Nakashima, F.; Shibata, T.; Kamiya, K.; Yoshitake, J.; Kikuchi, R.; Matsushita, T.; Ishii, I.; Giménez-Bastida, J.A.; Schneider, C.; Uchida, K. Structural and Functional Insights into S-Thiolation of Human Serum Albumins. Sci. Rep. 2018, 8, 932. [Google Scholar] [CrossRef]
- Elmi, F.; Movaghar, A.F.; Elmi, M.M.; Alinezhad, H.; Nikbakhsh, N. Application of FT-IR Spectroscopy on Breast Cancer Serum Analysis. Spectrochim. Acta A Mol. Biomol. Spectrosc. 2017, 187, 87–91. [Google Scholar] [CrossRef]
- Ghimire, H.; Garlapati, C.; Janssen, E.A.M.; Krishnamurti, U.; Qin, G.; Aneja, R.; Perera, A.G.U. Protein Conformational Changes in Breast Cancer Sera Using Infrared Spectroscopic Analysis. Cancers 2020, 12, 1708. [Google Scholar] [CrossRef]
- Aydiner, A.; Igci, A.; Cabioglu, N.; Ozer, L.; Sen, F. Breast Cancer; Aydiner, A., Igci, A., Soran, A., Eds.; Springer International Publishing: Cham, Swizerland, 2019; ISBN 978-3-319-96946-6. [Google Scholar]
- ELSTON, C.W.; ELLIS, I.O. Pathological Prognostic Factors in Breast Cancer. I. The Value of Histological Grade in Breast Cancer: Experience from a Large Study with Long-Term Follow-Up. Histopathology 1991, 19, 403–410. [Google Scholar] [CrossRef]
- Aune, D.; Keum, N.; Giovannucci, E.; Fadnes, L.T.; Boffetta, P.; Greenwood, D.C.; Tonstad, S.; Vatten, L.J.; Riboli, E.; Norat, T. Dietary Intake and Blood Concentrations of Antioxidants and the Risk of Cardiovascular Disease, Total Cancer, and All-Cause Mortality: A Systematic Review and Dose-Response Meta-Analysis of Prospective Studies. Am. J. Clin. Nutr. 2018, 108, 1069–1091. [Google Scholar] [CrossRef]
- Aune, D. Plant Foods, Antioxidant Biomarkers, and the Risk of Cardiovascular Disease, Cancer, and Mortality: A Review of the Evidence. Adv. Nutr. 2019, 10, S404–S421. [Google Scholar] [CrossRef]
- Bastide, N.; Dartois, L.; Dyevre, V.; Dossus, L.; Fagherazzi, G.; Serafini, M.; Boutron-Ruault, M.-C. Dietary Antioxidant Capacity and All-Cause and Cause-Specific Mortality in the E3N/EPIC Cohort Study. Eur. J. Nutr. 2017, 56, 1233–1243. [Google Scholar] [CrossRef] [PubMed]
- Parohan, M.; Anjom-Shoae, J.; Nasiri, M.; Khodadost, M.; Khatibi, S.R.; Sadeghi, O. Dietary Total Antioxidant Capacity and Mortality from All Causes, Cardiovascular Disease and Cancer: A Systematic Review and Dose–Response Meta-Analysis of Prospective Cohort Studies. Eur. J. Nutr. 2019, 58, 2175–2189. [Google Scholar] [CrossRef] [PubMed]
- Santos, L.L.D.; Custódio, I.D.D.; Silva, A.T.F.; Ferreira, I.C.C.; Marinho, E.C.; Caixeta, D.C.; Souza, A.V.; Teixeira, R.R.; Araújo, T.G.; Shivappa, N.; et al. Overweight Women with Breast Cancer on Chemotherapy Have More Unfavorable Inflammatory and Oxidative Stress Profiles. Nutrients 2020, 12, 3303. [Google Scholar] [CrossRef]
- Gorrini, C.; Harris, I.S.; Mak, T.W. Modulation of Oxidative Stress as an Anticancer Strategy. Nat. Rev. Drug Discov. 2013, 12, 931–947. [Google Scholar] [CrossRef] [PubMed]
- Espinosa-Diez, C.; Miguel, V.; Mennerich, D.; Kietzmann, T.; Sánchez-Pérez, P.; Cadenas, S.; Lamas, S. Antioxidant Responses and Cellular Adjustments to Oxidative Stress. Redox Biol. 2015, 6, 183–197. [Google Scholar] [CrossRef]
- Nikulina, M.A.; Andersen, H.U.; Karlsen, A.E.; Darville, M.I.; Eizirik, D.L.; Mandrup-Poulsen, T. Glutathione depletion inhibits IL-1β-stimulated nitric oxide production by reducing inducible nitric oxide synthase gene expression. Cytokine 2000, 12, 1391–1394. [Google Scholar] [CrossRef]
- Oberley, L.W.; Buettner, G.R. Role of Superoxide Dismutase in Cancer: A Review. Cancer Res. 1979, 39, 1141–1149. [Google Scholar]
- Katiyar, S.; Casimiro, M.C.; Dettin, L.; Ju, X.; Wagner, E.F.; Tanaka, H.; Pestell, R.G. C-Jun Inhibits Mammary Apoptosis In Vivo. Mol. Biol. Cell 2010, 21, 4264–4274. [Google Scholar] [CrossRef][Green Version]
- Robbins, D.; Zhao, Y. Manganese Superoxide Dismutase in Cancer Prevention. Antioxid. Redox Signal. 2014, 20, 1628–1645. [Google Scholar] [CrossRef]
- Dhar, S.K.; Tangpong, J.; Chaiswing, L.; Oberley, T.D.; St. Clair, D.K. Manganese Superoxide Dismutase Is a P53 -Regulated Gene That Switches Cancers between Early and Advanced Stages. Cancer Res. 2011, 71, 6684–6695. [Google Scholar] [CrossRef]
- Radenkovic, S.; Milosevic, Z.; Konjevic, G.; Karadzic, K.; Rovcanin, B.; Buta, M.; Gopcevic, K.; Jurisic, V. Lactate Dehydrogenase, Catalase, and Superoxide Dismutase in Tumor Tissue of Breast Cancer Patients in Respect to Mammographic Findings. Cell Biochem. Biophys. 2013, 66, 287–295. [Google Scholar] [CrossRef] [PubMed]
- Salman, R.A.; AlBairuty, G.A.A.; Abdul-Rasheed, O.F. Decreased Catalase Activity and Glutathione Concentration Levels in Women Patients with Breast Cancer. Ann. Trop Med. Public Health 2020, 23. [Google Scholar] [CrossRef]
- Kodydkova, J.; Vavrova, L.; Stankova, B.; Macasek, J.; Krechler, T.; Zak, A. Antioxidant Status and Oxidative Stress Markers in Pancreatic Cancer and Chronic Pancreatitis. Pancreas 2013, 42, 614–621. [Google Scholar] [CrossRef] [PubMed]
- Davison, C.A.; Durbin, S.M.; Thau, M.R.; Zellmer, V.R.; Chapman, S.E.; Diener, J.; Wathen, C.; Leevy, W.M.; Schafer, Z.T. Antioxidant Enzymes Mediate Survival of Breast Cancer Cells Deprived of Extracellular Matrix. Cancer Res. 2013, 73, 3704–3715. [Google Scholar] [CrossRef]
- Esme, H.; Cemek, M.; Sezer, M.; Saglam, H.; Demir, A.; Melek, H.; Unlu, M. High Levels of Oxidative Stress in Patients with Advanced Lung Cancer. Respirology 2008, 13, 112–116. [Google Scholar] [CrossRef] [PubMed]
- Glorieux, C.; Sandoval, J.M.; Dejeans, N.; Nonckreman, S.; Bahloula, K.; Poirel, H.A.; Calderon, P.B. Evaluation of Potential Mechanisms Controlling the Catalase Expression in Breast Cancer Cells. Oxid. Med. Cell Longev. 2018, 2018, 5351967. [Google Scholar] [CrossRef] [PubMed]
- Bujok, J.; Gąsior-Głogowska, M.; Marszałek, M.; Trochanowska-Pauk, N.; Zigo, F.; Pavľak, A.; Komorowska, M.; Walski, T. Applicability of FTIR-ATR Method to Measure Carbonyls in Blood Plasma after Physical and Mental Stress. Biomed. Res. Int. 2019, 2019, 2181370. [Google Scholar] [CrossRef]
- Dalle-Donne, I.; Rossi, R.; Giustarini, D.; Milzani, A.; Colombo, R. Protein Carbonyl Groups as Biomarkers of Oxidative Stress. Clin. Chim. Acta 2003, 329, 23–38. [Google Scholar] [CrossRef]
- Shacter, E. Quantification and significance of protein oxidation in biological samples. Drug Metab. Rev. 2000, 32, 307–326. [Google Scholar] [CrossRef]
- Ferrario, C.; Christofides, A.; Joy, A.A.; Laing, K.; Gelmon, K.; Brezden-Masley, C. Novel Therapies for the Treatment of HER2-Positive Advanced Breast Cancer: A Canadian Perspective. Curr. Oncol. 2022, 29, 2720–2734. [Google Scholar] [CrossRef]
- Eroles, P.; Bosch, A.; Alejandro Pérez-Fidalgo, J.; Lluch, A. Molecular Biology in Breast Cancer: Intrinsic Subtypes and Signaling Pathways. Cancer Treat Rev. 2012, 38, 698–707. [Google Scholar] [CrossRef] [PubMed]
- Ferreira, I.C.C.; Aguiar, E.M.G.; Silva, A.T.F.; Santos, L.L.D.; Cardoso-Sousa, L.; Araújo, T.G.; Santos, D.W.; Goulart, L.R.; Sabino-Silva, R.; Maia, Y.C.P. Attenuated Total Reflection-Fourier Transform Infrared (ATR-FTIR) Spectroscopy Analysis of Saliva for Breast Cancer Diagnosis. J. Oncol. 2020, 2020, 4343590. [Google Scholar] [CrossRef] [PubMed]
- Dong, L.; Sun, X.; Chao, Z.; Zhang, S.; Zheng, J.; Gurung, R.; Du, J.; Shi, J.; Xu, Y.; Zhang, Y.; et al. Evaluation of FTIR Spectroscopy as Diagnostic Tool for Colorectal Cancer Using Spectral Analysis. Spectrochim. Acta A Mol. Biomol. Spectrosc. 2014, 122, 288–294. [Google Scholar] [CrossRef] [PubMed]
- Backhaus, J.; Mueller, R.; Formanski, N.; Szlama, N.; Meerpohl, H.-G.; Eidt, M.; Bugert, P. Diagnosis of Breast Cancer with Infrared Spectroscopy from Serum Samples. Vib. Spectrosc. 2010, 52, 173–177. [Google Scholar] [CrossRef]
- Yang, X.; Wu, Z.; Ou, Q.; Qian, K.; Jiang, L.; Yang, W.; Shi, Y.; Liu, G. Diagnosis of Lung Cancer by FTIR Spectroscopy Combined With Raman Spectroscopy Based on Data Fusion and Wavelet Transform. Front. Chem. 2022, 10, 810837. [Google Scholar] [CrossRef] [PubMed]
- Sala, A.; Cameron, J.M.; Jenkins, C.A.; Barr, H.; Christie, L.; Conn, J.J.A.; Evans, T.R.J.; Harris, D.A.; Palmer, D.S.; Rinaldi, C.; et al. Liquid Biopsy for Pancreatic Cancer Detection Using Infrared Spectroscopy. Cancers 2022, 14, 3048. [Google Scholar] [CrossRef]
- Fadlelmoula, A.; Pinho, D.; Carvalho, V.H.; Catarino, S.O.; Minas, G. Fourier Transform Infrared (FTIR) Spectroscopy to Analyse Human Blood over the Last 20 Years: A Review towards Lab-on-a-Chip Devices. Micromachines 2022, 13, 187. [Google Scholar] [CrossRef] [PubMed]
- Benzie, I.F.F.; Devaki, M. The Ferric Reducing/Antioxidant Power (FRAP) Assay for Non-Enzymatic Antioxidant Capacity: Concepts, Procedures, Limitations and Applications. In Measurement of Antioxidant Activity & Capacity; John Wiley & Sons, Ltd.: Chichester, UK, 2017; pp. 77–106. [Google Scholar]
- Kundaktepe, B.P.; Sozer, V.; Durmus, S.; Kocael, P.C.; Kundaktepe, F.O.; Papila, C.; Gelisgen, R.; Uzun, H. The Evaluation of Oxidative Stress Parameters in Breast and Colon Cancer. Medicine 2021, 100, e25104. [Google Scholar] [CrossRef]


| Characteristics | HER2+ n (%) | HER2− n (%) |
|---|---|---|
| Age (years) mean (min–max ± SD) | 63 (58–71 ± 4.3) | 54.18 (29–75 ± 14.4) |
| Menopause | ||
| No | - | 4 (36.3) |
| Yes | 6 (100) | 7 (63.6) |
| Tumor Subtype | ||
| Ductal carcinoma | 5 (83.3) | 9 (81.8) |
| Lobular carcinoma | 1 (16.6) | 2 (18.1) |
| Clinical Stage | ||
| I | 2 (33.3) | 3 (27.2) |
| II | 1 (16.6) | 5 (45.4) |
| III | 3 (50) | 2 (18.1) |
| NR | - | 1 (9) |
| Histological Grade | ||
| G1 | - | 2 (18.1) |
| G2 | 2 (33.3) | 9 (81.8) |
| G3 | 4 (66.6) | - |
| Molecular Subtypes | ||
| ER+ and/or PR+, HER2− and Ki-67 < 14% | - | 9 (81.8) |
| ER+ and/or PR+, HER2− and Ki-67 ≥ 14% | - | 2 (18.1) |
| ER+ and/or PR+, HER2+ | 4 (66.6) | - |
| ER−, PR− and HER2+ | 2 (33.3) | - |
| Surgery | ||
| Radical Mastectomy | 1 (16.6) | 4 (36.3) |
| Conservative Surgery | 5 (83.3) | 6 (54.5) |
| Others | - | 1 (9) |
| 2nd Derivative Wavenumber/cm−1 | HER2+ vs. BBD p | HER2+ vs. HER2− p | BC vs. BBD p | Proposed Vibrational Mode | Molecular Source |
|---|---|---|---|---|---|
| 706–710 | 0.049 | 0.250 | 0.122 | OH out-of-plane bending; CH out-of-plane bending; NH bending | Hydroxyl group; Amide IV |
| 3874 | 0.042 | 0.207 | 0.125 | OH stretching; NH stretching | Hydroxyl group; Amino group |
| 3876 | 0.032 | 0.218 | 0.122 | ||
| 3878 | 0.032 | 0.219 | 0.015 | ||
| 3880 | 0.048 | 0.223 | 0.111 | ||
| 3882 | 0.048 | 0.227 | 0.115 | ||
| 3887 | 0.044 | 0.247 | 0.117 | ||
| 3889 | 0.045 | 0.247 | 0.120 | ||
| 3893 | 0.047 | 0.275 | 0.122 |
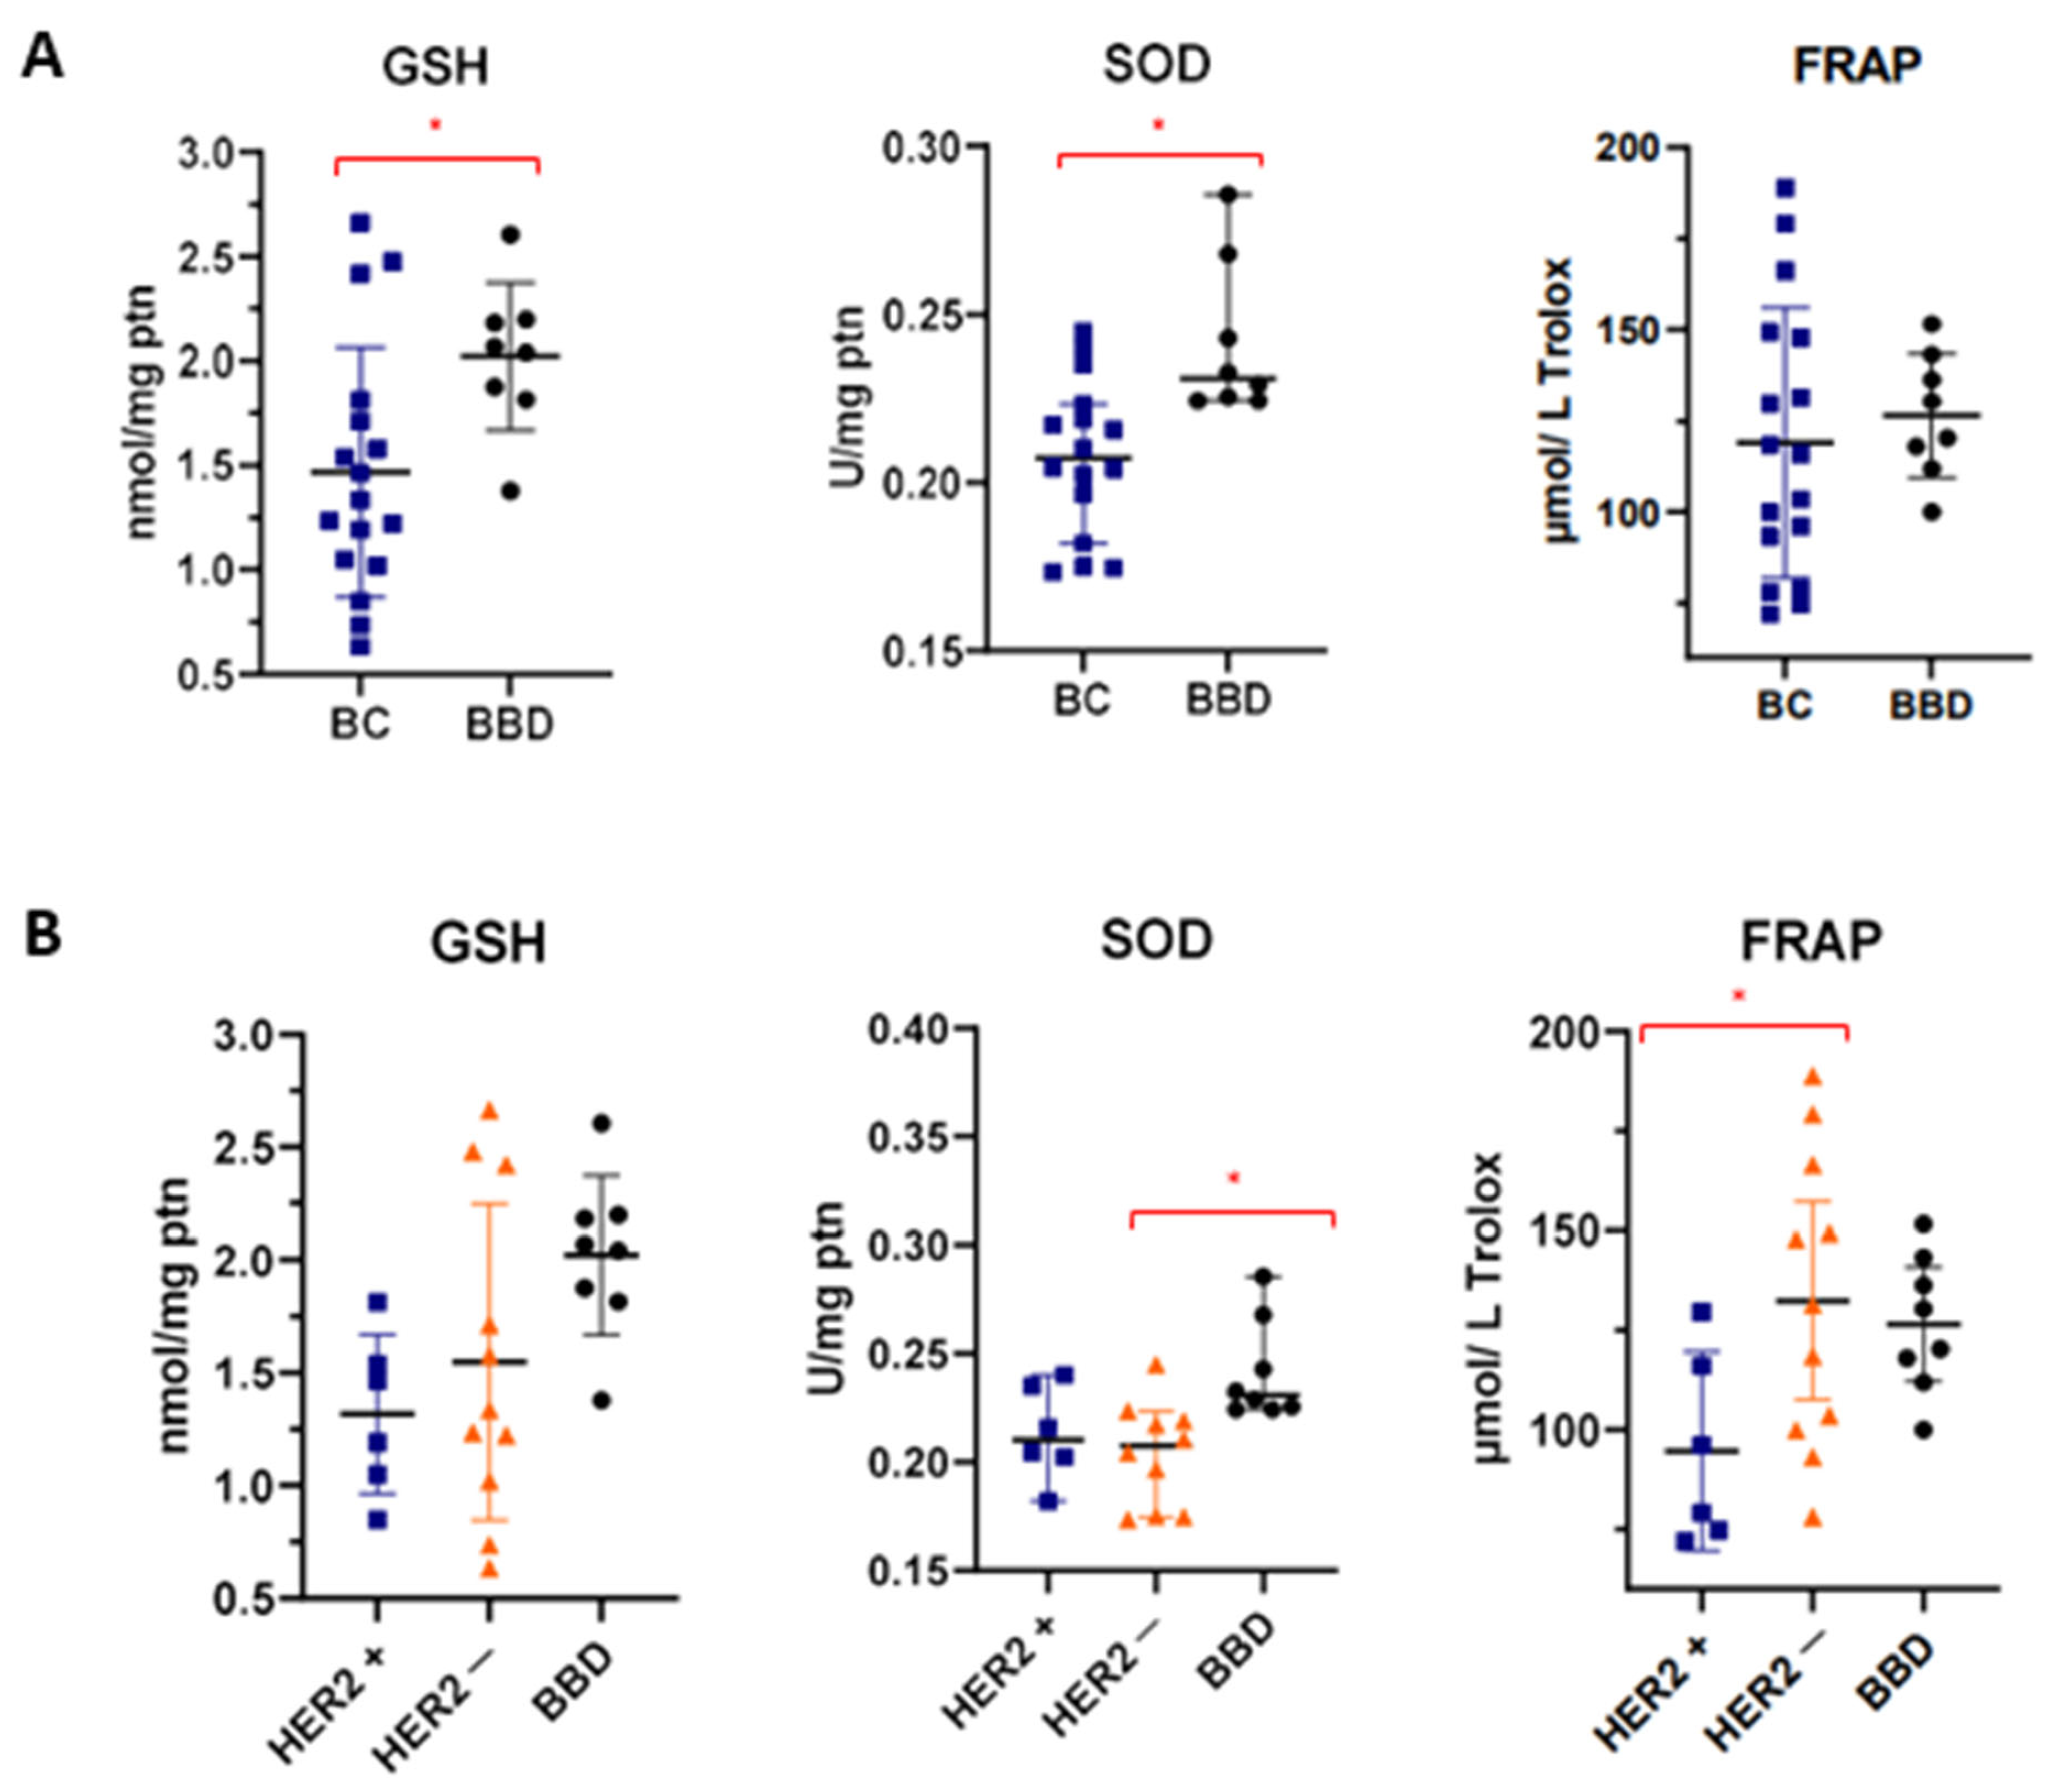
| Markers | BC (n = 17) | BBD (n = 8) | p | ||
|---|---|---|---|---|---|
| Mean ± SD | Median (p25–p75) | Mean ± SD | Median (p25–p75) | ||
| GSH | 1.467 ± 0.599 | 1.335 (1.034–1.763) | 2.021 ± 0.354 | 2.054 (1.831–2.195) | 0.024 θ |
| SOD | 0.207 ± 0.023 | 0.207 (0.185–0.222) | 0.241 ± 0.023 | 0.230 (0.224–0.261) | 0.002 σ |
| CATALASE | 0.114 ± 0.040 | 0.113 (0.089–0.136) | 0.082 ± 0.032 | 0.089 (0.057–0.098) | 0.068 θ |
| FRAP | 119.0 ± 37.06 | 116.0 (86.13–148.5) | 126.4 ± 17.08 | 125.2 (113.4–141.4) | 0.597 θ |
| CARBONYLPROTEIN | 4.681 ± 3.293 | 4.088 (2.213–5.181) | 3.309 ± 0.589 | 3.380 (2.865–3.650) | 0.215 σ |
| Markers | HER2+ (n = 6) | HER2− (n = 11) | BBD (n = 8) | p | |||
|---|---|---|---|---|---|---|---|
| Mean ± SD | Median (p25–p75) | Mean ± SD | Median (p25–p75) | Mean ± SD | Median (p25–p75) | ||
| GSH | 1.317 ± 0.353 | 1.328 (0.998–1.607) | 1.548 ± 0.701 | 1.335 (1.019–2.420) | 2.021 ± 0.354 | 2.054 (1.831–2.195) | 0.059 θ |
| SOD | 0.213 ± 0.021 | 0.210 (0.197–0.236) | 0.203 ± 0.023 | 0.207 (0.175–0.219) a | 0.241 ± 0.023 | 0.230 (0.224–0.261) b | 0.010 σ |
| CATALASE | 0.096 ± 0.031 | 0.101 (0.065–0.120) | 0.122 ± 0.042 | 0.122 (0.090–0.156) | 0.082 ± 0.032 | 0.089 (0.057–0.098) | 0.081 θ |
| FRAP | 94.59 ± 23.79 a | 87.63 (74.07–119.4) | 132.3 ± 36.91 b | 131.3 (99.79–166.3) | 126.4 ± 17.08 | 125.2 (113.4–141.4) | 0.049 θ |
| CARBONYL PROTEIN | 5.629 ± 4.107 | 4.641 (3.208–7.322) | 4.164 ± 2.844 | 3.991 (2.030–5.159) | 3.309 ± 0.589 | 3.380 (2.865–3.650) | 0.271σ |
Publisher’s Note: MDPI stays neutral with regard to jurisdictional claims in published maps and institutional affiliations. |
© 2022 by the authors. Licensee MDPI, Basel, Switzerland. This article is an open access article distributed under the terms and conditions of the Creative Commons Attribution (CC BY) license (https://creativecommons.org/licenses/by/4.0/).
Share and Cite
Santos, L.L.D.; Silva, A.T.F.; Ferreira, I.C.C.; Souza, A.V.; Justino, A.B.; Santos, D.W.; Goulart, L.R.; Paiva, C.E.; Espíndola, F.S.; Maia, Y.C.P. A Lower Serum Antioxidant Capacity as a Distinctive Feature for Women with HER2+ Breast Cancer: A Preliminary Study. Cancers 2022, 14, 5973. https://doi.org/10.3390/cancers14235973
Santos LLD, Silva ATF, Ferreira ICC, Souza AV, Justino AB, Santos DW, Goulart LR, Paiva CE, Espíndola FS, Maia YCP. A Lower Serum Antioxidant Capacity as a Distinctive Feature for Women with HER2+ Breast Cancer: A Preliminary Study. Cancers. 2022; 14(23):5973. https://doi.org/10.3390/cancers14235973
Chicago/Turabian StyleSantos, Letícia L. D., Alinne T. F. Silva, Izabella C. C. Ferreira, Adriele V. Souza, Allisson B. Justino, Donizeti W. Santos, Luiz Ricardo Goulart, Carlos Eduardo Paiva, Foued S. Espíndola, and Yara C. P. Maia. 2022. "A Lower Serum Antioxidant Capacity as a Distinctive Feature for Women with HER2+ Breast Cancer: A Preliminary Study" Cancers 14, no. 23: 5973. https://doi.org/10.3390/cancers14235973
APA StyleSantos, L. L. D., Silva, A. T. F., Ferreira, I. C. C., Souza, A. V., Justino, A. B., Santos, D. W., Goulart, L. R., Paiva, C. E., Espíndola, F. S., & Maia, Y. C. P. (2022). A Lower Serum Antioxidant Capacity as a Distinctive Feature for Women with HER2+ Breast Cancer: A Preliminary Study. Cancers, 14(23), 5973. https://doi.org/10.3390/cancers14235973