Article

Agro-Morphological, Yield and Biochemical Responses of Selected Wheat (Triticum aestivum L.) Genotypes to Salt Stress

by
Arpita Sen
1,2,
Md. Moshiul Islam
1,*,
Erin Zaman
1,
Uttam Kumar Ghosh
1,
Milia Bente Momtaz
3,
Md. Ariful Islam
4,
Tahmina Akter Urmi
5,
Md. Abdullah Al Mamun
1,
Md. Mamunur Rahman
6,
Mohammed Zia Uddin Kamal
7,
G. K. M. Mustafizur Rahman
7,
M. Moynul Haque
1 and
Yoshiyuki Murata
8
1
Department of Agronomy, Faculty of Agriculture, Bangabandhu Sheikh Mujibur Rahman Agricultural University, Gazipur 1706, Bangladesh
2
Bangladesh Institute of Neuclear Agriculture (BINA), Mymensingh 2202, Bangladesh
3
Cotton Research Training and Seed Multiplication Farm, Sreepur, Gazipur 1744, Bangladesh
4
Department of Agriculture, Bangabandhu Sheikh Mujibur Rahman Science and Technology University, Gopalganj 8100, Bangladesh
5
Department of Soil Science, Faculty of Agriculture, Bangladesh Agricultural University, Mymensingh 2202, Bangladesh
6
Department of Entomology, Faculty of Agriculture, Bangabandhu Sheikh Mujibur Rahman Agricultural University, Gazipur 1706, Bangladesh
7
Department of Soil Science, Faculty of Agriculture, Bangabandhu Sheikh Mujibur Rahman Agricultural University, Gazipur 1706, Bangladesh
8
Graduate School of Environmental and Life Science, Okayama University, 1-1-1 Tsushima-Naka, Okayama 700-8530, Japan
*
Author to whom correspondence should be addressed.
Agronomy 2022, 12(12), 3027; https://doi.org/10.3390/agronomy12123027
Submission received: 29 October 2022 / Revised: 24 November 2022 / Accepted: 28 November 2022 / Published: 30 November 2022

Abstract

:
Wheat is affected by various biotic and abiotic stresses, especially salinity, which reduces the growth and yield drastically. With this view, an experiment was conducted to observe genotypic differences in agro-morphological, yield, and biochemical responses to salinity. Experimental variables consisted of five salt-tolerant genotypes (G 13, G 20-1, G 9, G 22, G 20-2), one susceptible genotype (G 24) and one standard check variety (BARI ghom 25), which assigned to four levels of salinity with electrical conductivities 0, 4, 8 and 12 dS m−1. Irrespective of genotypes, salinity stress significantly decreased the yield and yield attributes. However, maximum total tillers plant−1, effective tillers plant−1, number of grains spike−1, and grain yield plant−1 was found in salt tolerant genotype G 20-2, followed by genotypes G 13, G 20-1, and the lowest was observed in salt-susceptible genotype G 24. The lowest reduction percentage of yield and yield attributes were also observed in salt tolerant genotype G 20-2 followed by genotypes G 13, G 20-2, and the maximum reduction percentage was found in salt-susceptible genotype G 24. Results showed that the highest amount of proline, glycinebetaine, soluble sugar and soluble protein content were observed in salt-tolerant genotype G 20-2, followed by genotypes G 13, G 20-1, and the minimum was found in salt-susceptible genotype G 24. On the other hand, the lowest hydrogen peroxide (H2O2) and melondealdehyde (MDA) accumulation was detected in the same salt-tolerant genotype G 20-2, followed by G 13, G 20-1, and the maximum was observed in salt-susceptible genotype G 24. Therefore, higher accumulations of compatible solute in the tolerant genotypes reduce the oxidative stress, and provide the higher yield.

1. Introduction

Wheat (Triticum aestivum L.) is an important cereal crop, and over 200 million hectares of land are cultivated for wheat in the world [1]. After rice, it ranks second in Bangladesh and contributes 7% to the total output of food cereals, which provide 20% of the total energy requirement in human food [2,3]. It comprises about 60–80% carbohydrate, 2–2.5% glucose, 1.5–2% fat and 2–3% mineral [4]. It delivers about 55% carbohydrates and 20% food calories [5]. Mostly, wheat is grown in the north and north-west part of Bangladesh. Still, a huge coastal area of southern Bangladesh remains fallow. Thus, to meet the food and nutritional deficit of the ever-increasing population of Bangladesh, these saline areas must be brought under intensive cultivation. Therefore, it is crucial to develop salinity-tolerant crop varieties to cope with this upcoming problem of food security.
Saline areas cover about 25–30% of the total arable land of Bangladesh [6]. These saline-affected areas of Bangladesh increase every year due to climate change. Due to salinity problems, the average crop yield is very low in that region. Due to high salinity, the cropping intensity is relatively low in saline areas of Bangladesh [7]. Crop production is limited and more than 50% of the yield of major crops is reduced due to salinity [8]. High levels of soil salinity badly affect the quality and quantity of crop production [9,10,11] by preventing seed germination, seedling growth and developmental phases, owing to the combined effects of high osmotic potential and ion toxicity [9,12]. Salinity affects physiological processes of crops, such as modification of ion balance, water status, mineral nutrition, stomatal behaviour and photosynthetic efficiency; it also causes oxidative damage due to overproduction of reactive oxygen species (ROS) and differences in the antioxidant enzymes’ activities [4,13,14,15,16,17]. It is reported that salinity reduces the crop growth more than any other noxious material and modifies several physiological and biochemical processes in crops [18,19].
Through increasing the osmotic strength, salt stress inhibits plants from accessing soil water. Munns et al. [20] stated that due to the presence of salt in soil solutions, the osmotic potential of soil is decreased, which creates water stress and makes it difficult for the plant to absorb adequate water for growth. Thus, reduced water uptake is the common response of plants under salt stress [21]. Reduced water status in the plant body slows the rate of cell division and expansion mainly due to loss of turgor [22]. To overcome this problem, plant cells need readjust their osmotic potential to prevent water loss through the uptake of inorganic ions from the external solution, or by de novo synthesis of a number of metabolites termed compatible solutes [23]. They mainly include proline [24,25,26,27,28], glycine betaine [29,30], sugar [23,31] and polyols [14,32].
Proline is one of the familiar osmoprotectants, and accumulation of proline in various organisms is widely observed under salt stress [32,33]. Shamsi and Kobraee [34] reported that with increasing salinity, proline and water-soluble carbohydrates were increased in wheat. Moreover, during stress, proline and other osmoprotectants act as a metal chelator, an antioxidative defence molecule and a signaling molecule [35]. Overproduction of reactive oxygen species, such as superoxide anions (O2), hydrogen peroxide (H2O2), and hydroxyl radicals (OH), occur due to salt stress [36]. Reactive oxygen species react with vital cellular metabolites and molecules including photosynthetic pigments, lipids, proteins and DNA [15]. The overproduction of ROS causes lipid peroxidation and results in a higher accumulation of malondialdehyde (MDA) [37].
As arable land of the saline-prone area remains fallow and the wheat production in the country is as yet much below the annual requirement, the increase of wheat production to keep up with the increasing demand of wheat in the next few decades will be a big challenge for Bangladesh. The cultivation of salt-tolerant wheat in the saline-prone area may become an important effort to utilize these lands to meet the food deficit of the ever-growing population of Bangladesh. This would be possible through the selection of wheat genotypes tolerant to soil salinity and by understanding biochemical mechanism of salinity tolerance. The present study was therefore undertaken to explore genotypic differences in the mechanism of salinity tolerance in wheat, and to identify promising wheat genotypes tolerant to soil salinity.

2. Results

2.1. Agro-Morphology and Yield of Wheat
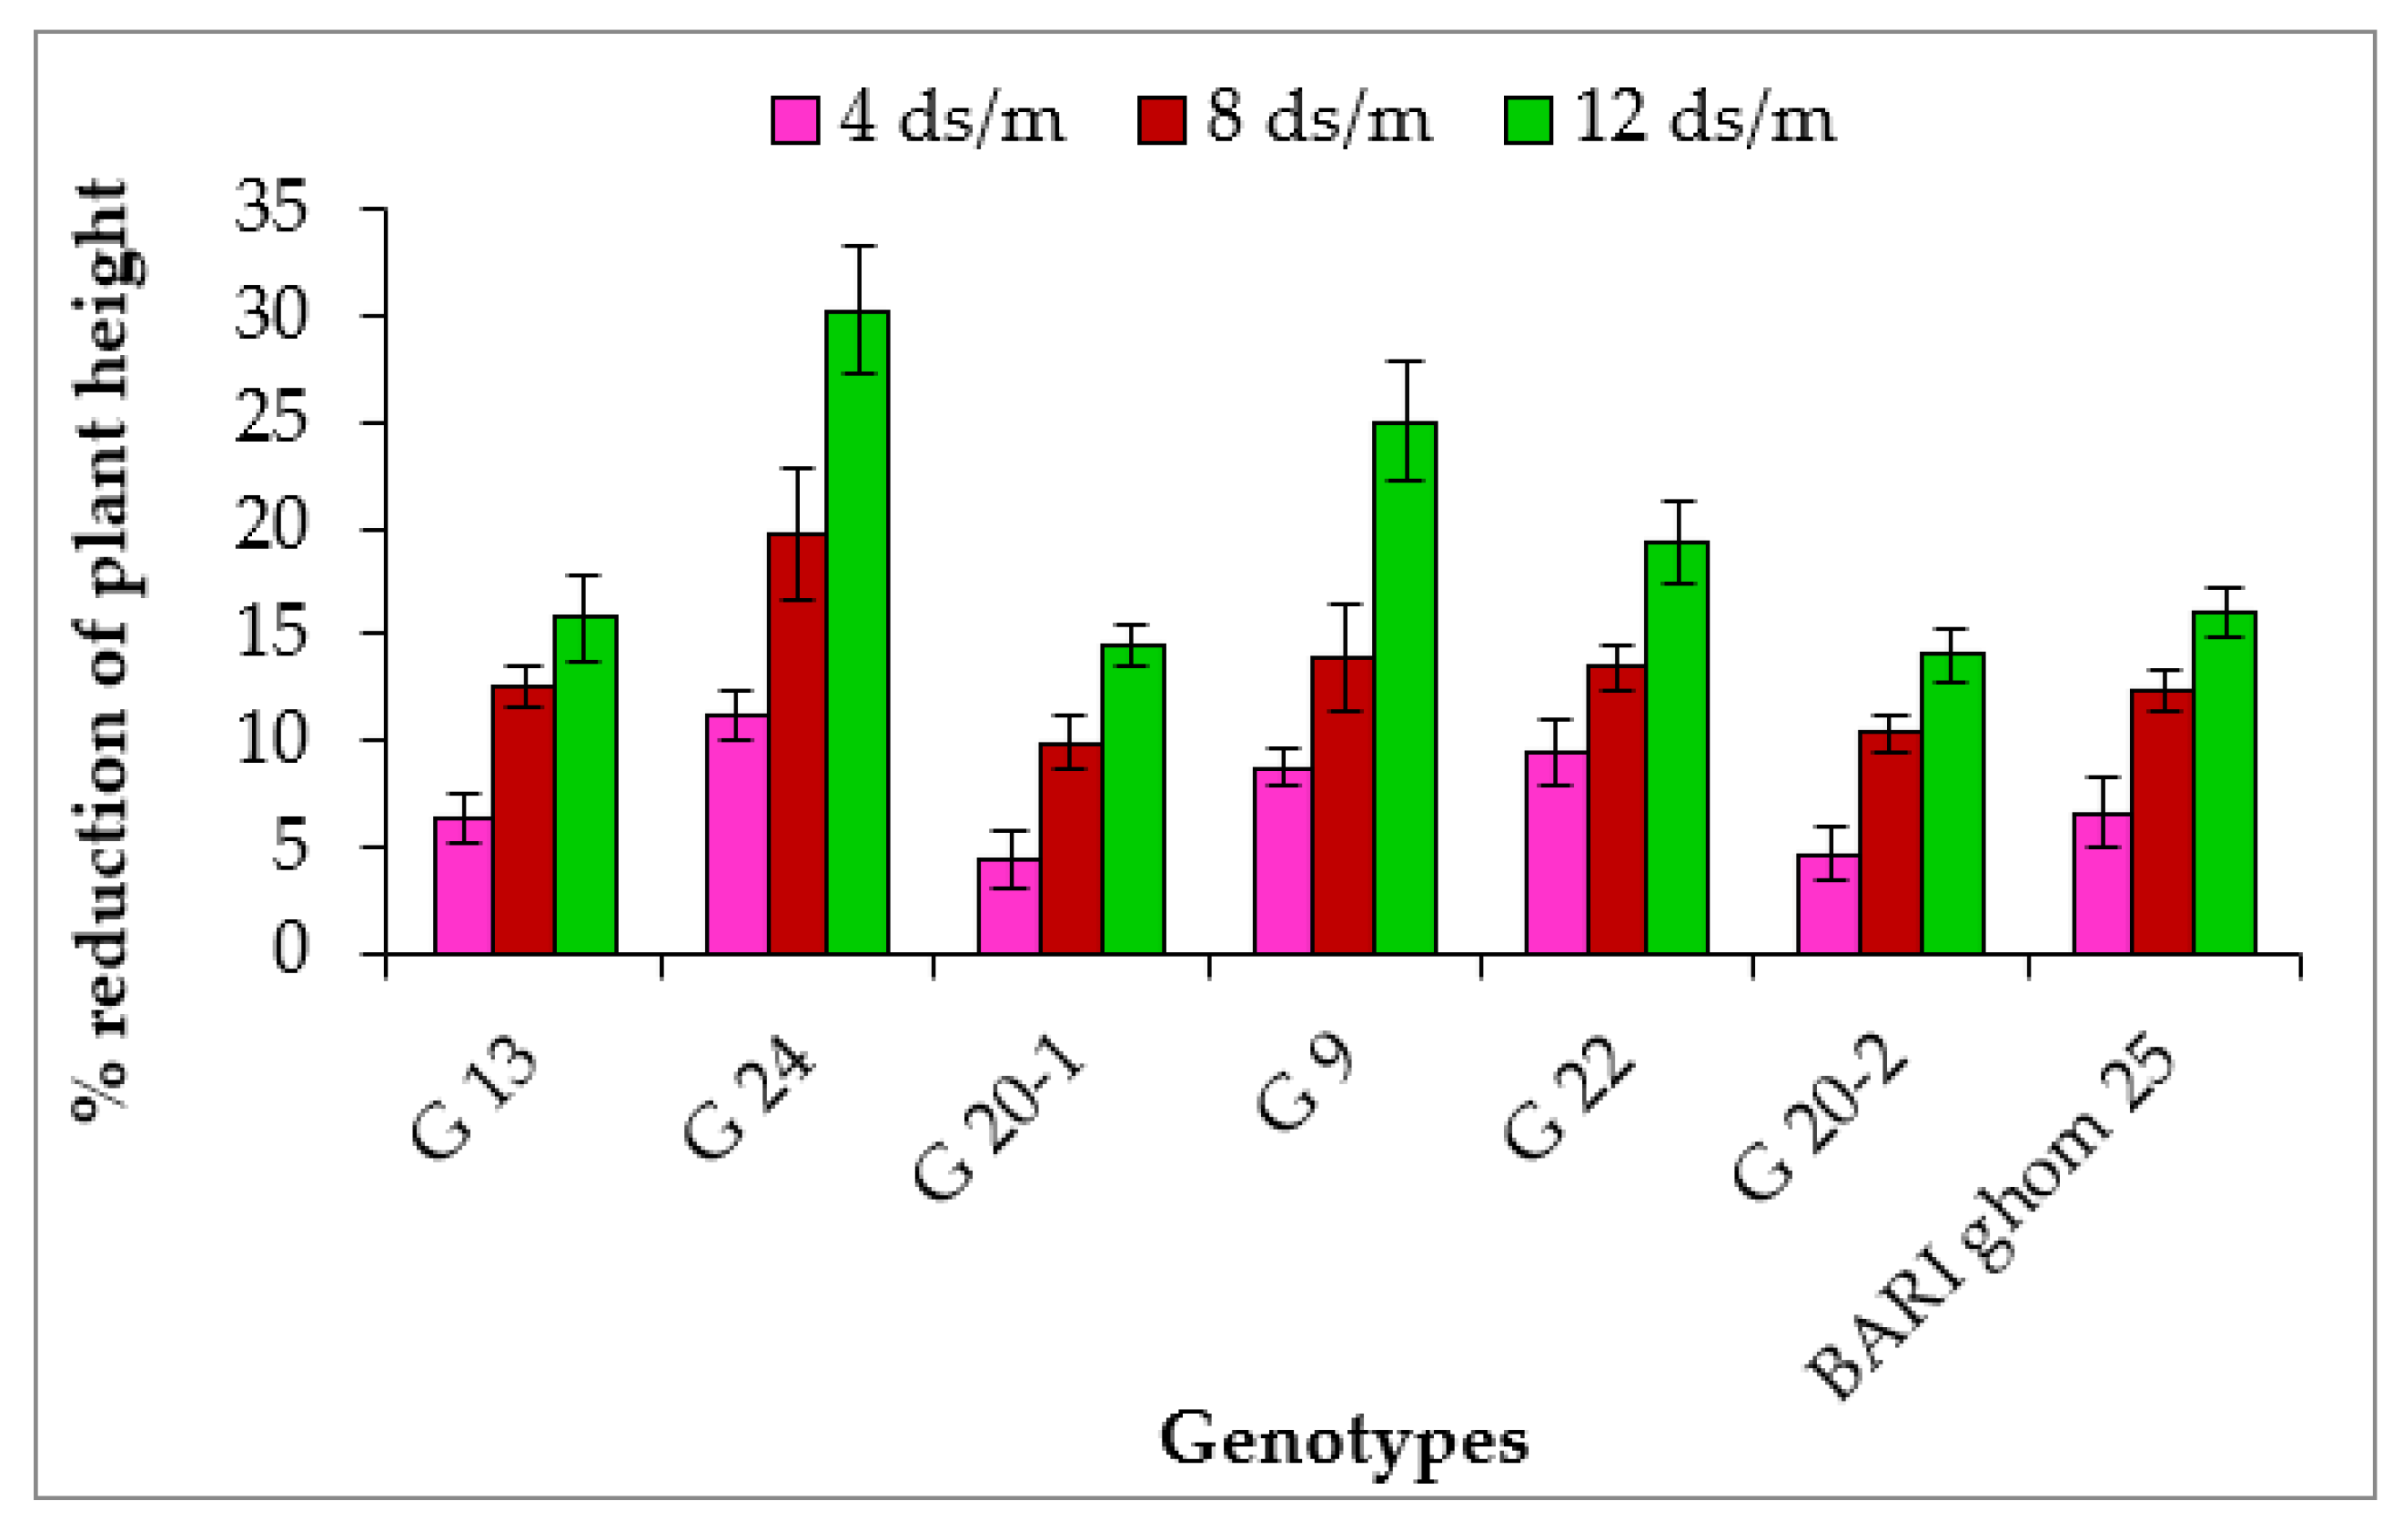
2.1.1. Plant Height

Different salinity levels significantly affect the plant height of wheat. Under control conditions, the highest plant height (90.9 cm) was observed in G 22 and the lowest (83.3 cm) was found in G 13 (Table 1). However, the highest plant height at 4, 8 and 12 dS m−1 was found in G 20-1 (85.3, 80.4 and 76.3 cm, respectively) and the lowest plant height was observed in G 24. The highest plant height reduction percent of different wheat genotypes was found at 12 dS m−1 than 4 and 8 dS m−1 salinity levels (Figure 1). The lowest plant height reduction at 4, 8 and 12 dS m−1 salinity level was found in genotype G 20-1 (4.42, 9.90 and 14.56%, respectively), followed by G 20-2 (4.68, 10.40 and 14.06%, respectively). At 4, 8 and 12 dS m−1 salinity level, the highest plant height reduction was found in genotype G 24 (11.17, 19.75 and 30.28%, respectively).

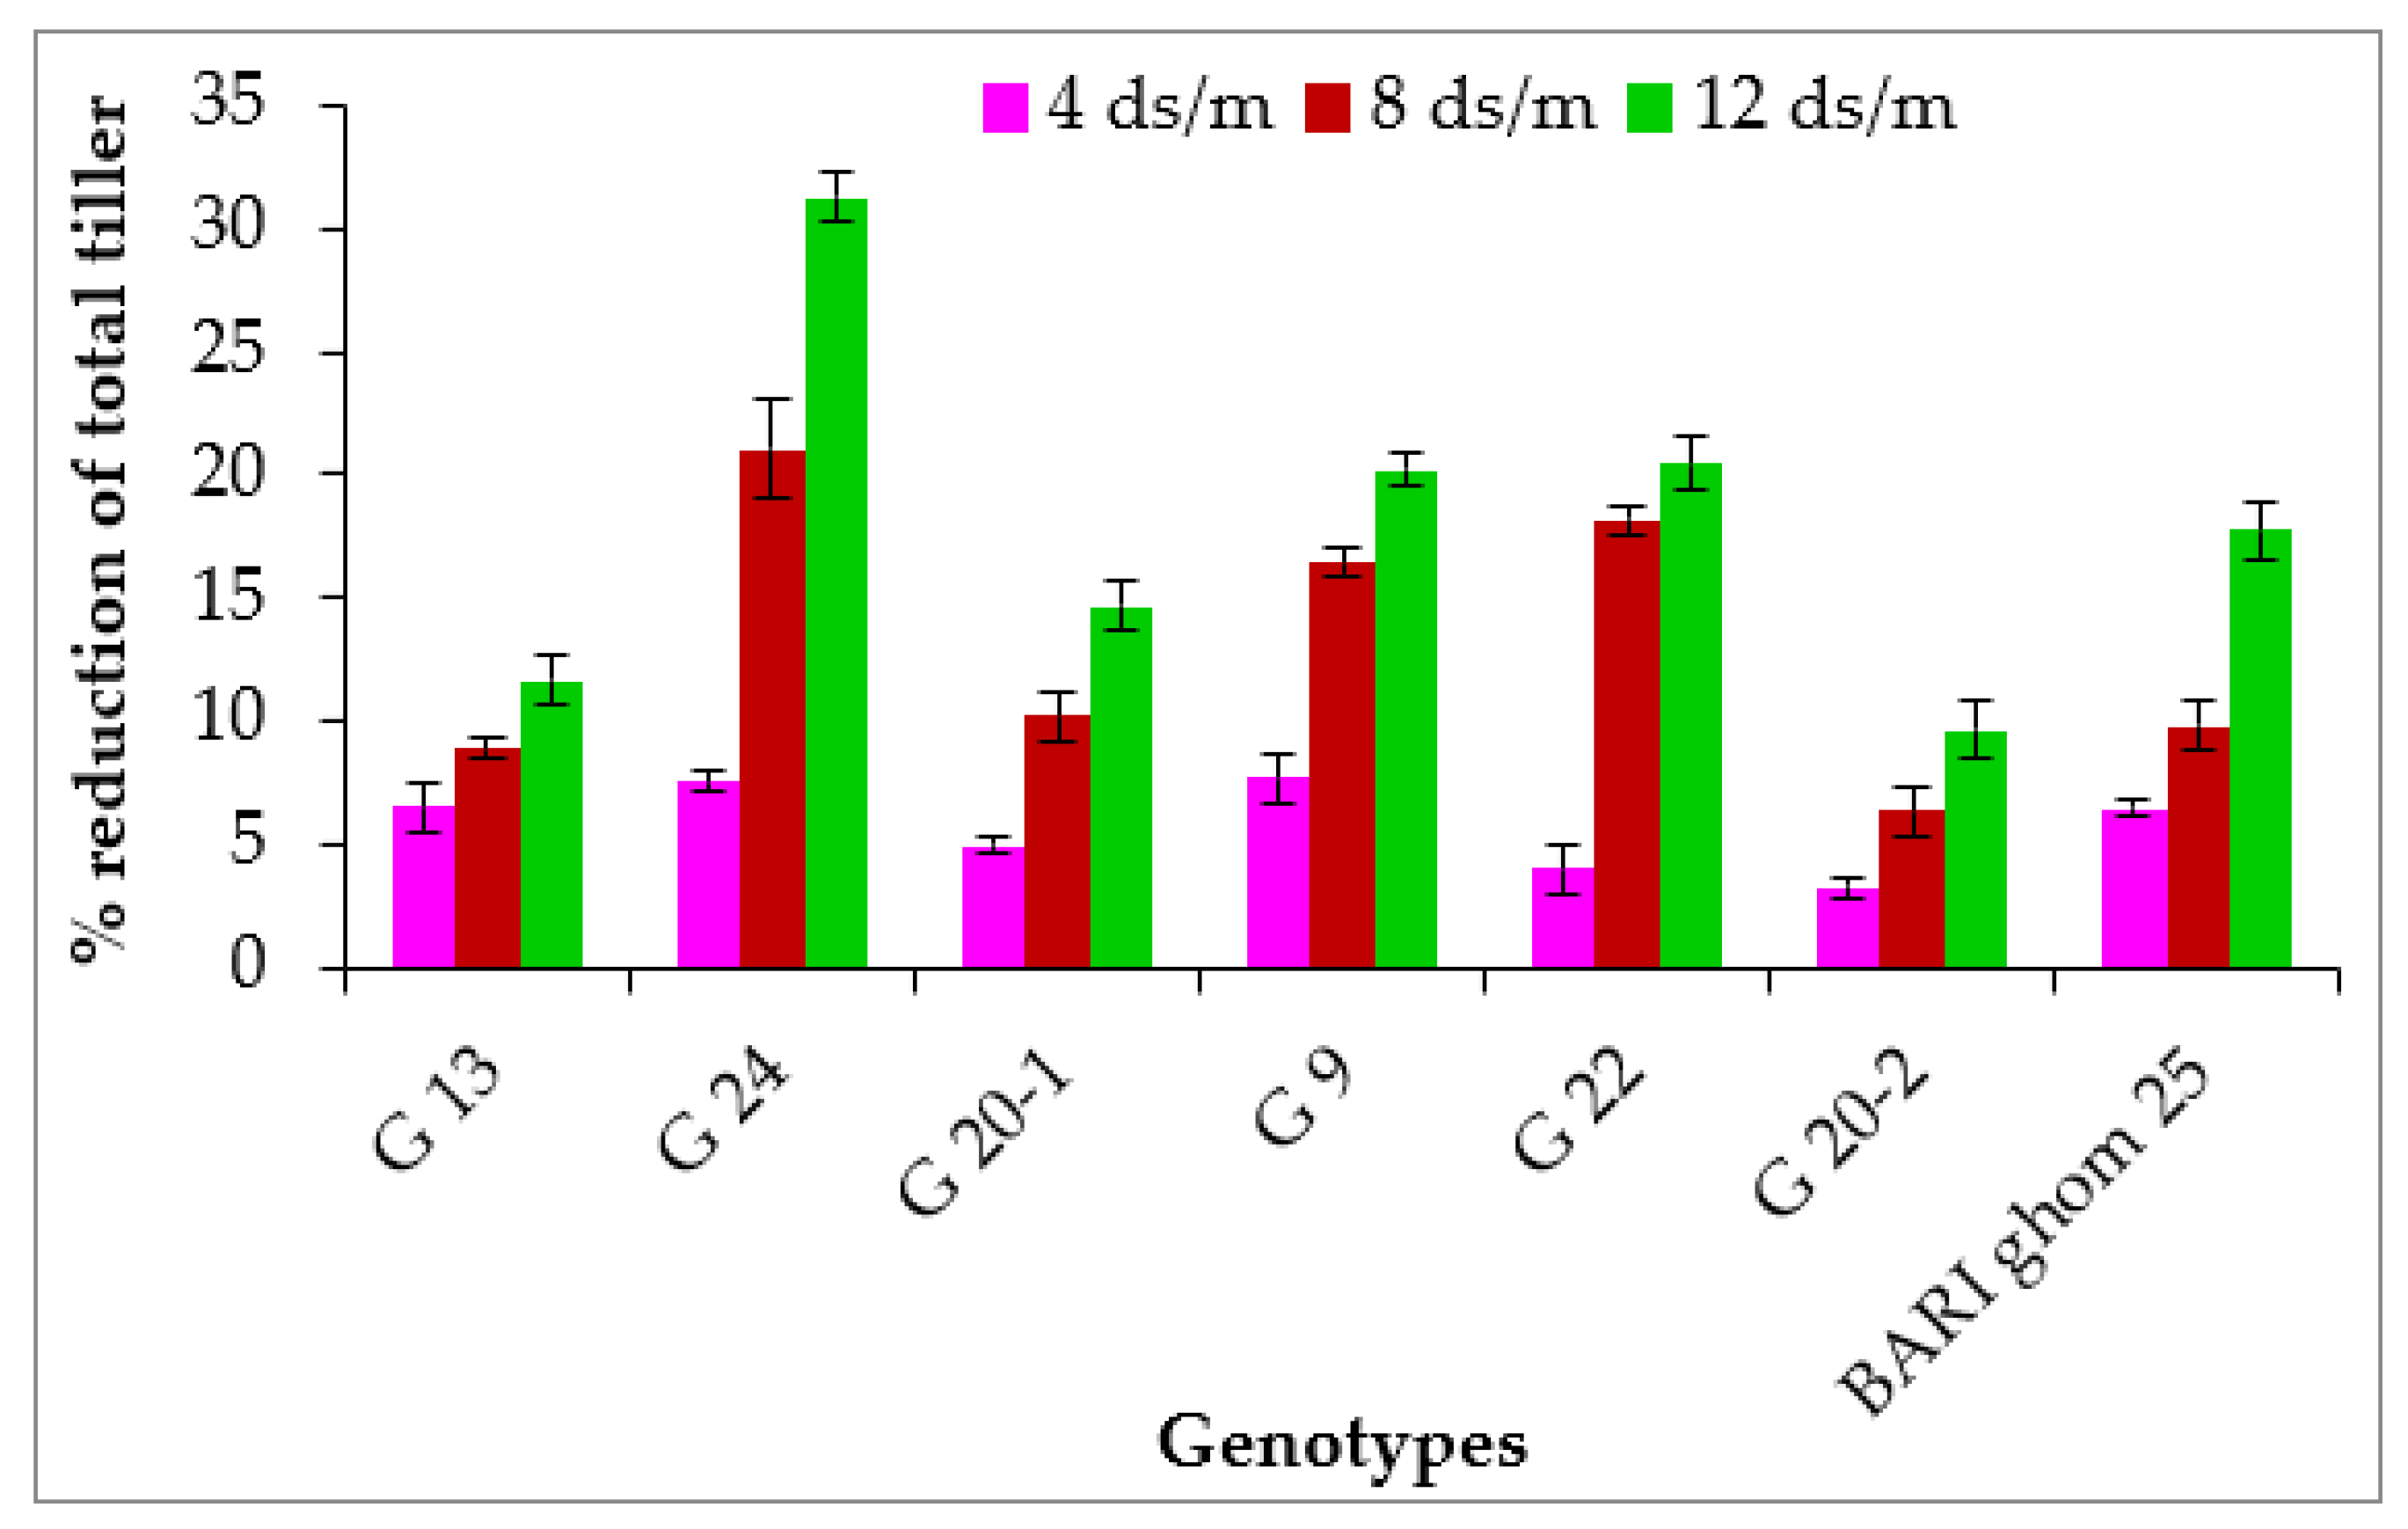
2.1.2. Total Tillers per Plant

Salinity stress significantly reduced the total tillers plant−1 at higher salinity levels in each wheat genotypes. Under control conditions, all wheat genotypes showed statistically similar results (Table 1). At 4, 8 and 12 dS m−1 salinity levels, the maximum number of total tillers plant−1 (6.1, 5.9 and 5.7, respectively) was found in genotype G 20-2, which was statistically similar to G 20-1, and the lowest total tillers plant−1 was observed in G 24 (5.3, 4.5 and 3.9, respectively), which was statistically dissimilar to other genotypes. At different salinities, the reduction of total tillers ranged from 3.24 to 31.23% (Figure 2). The minimum reduction of total tillers plant−1 at different salinity levels was observed in genotype G 20-2.

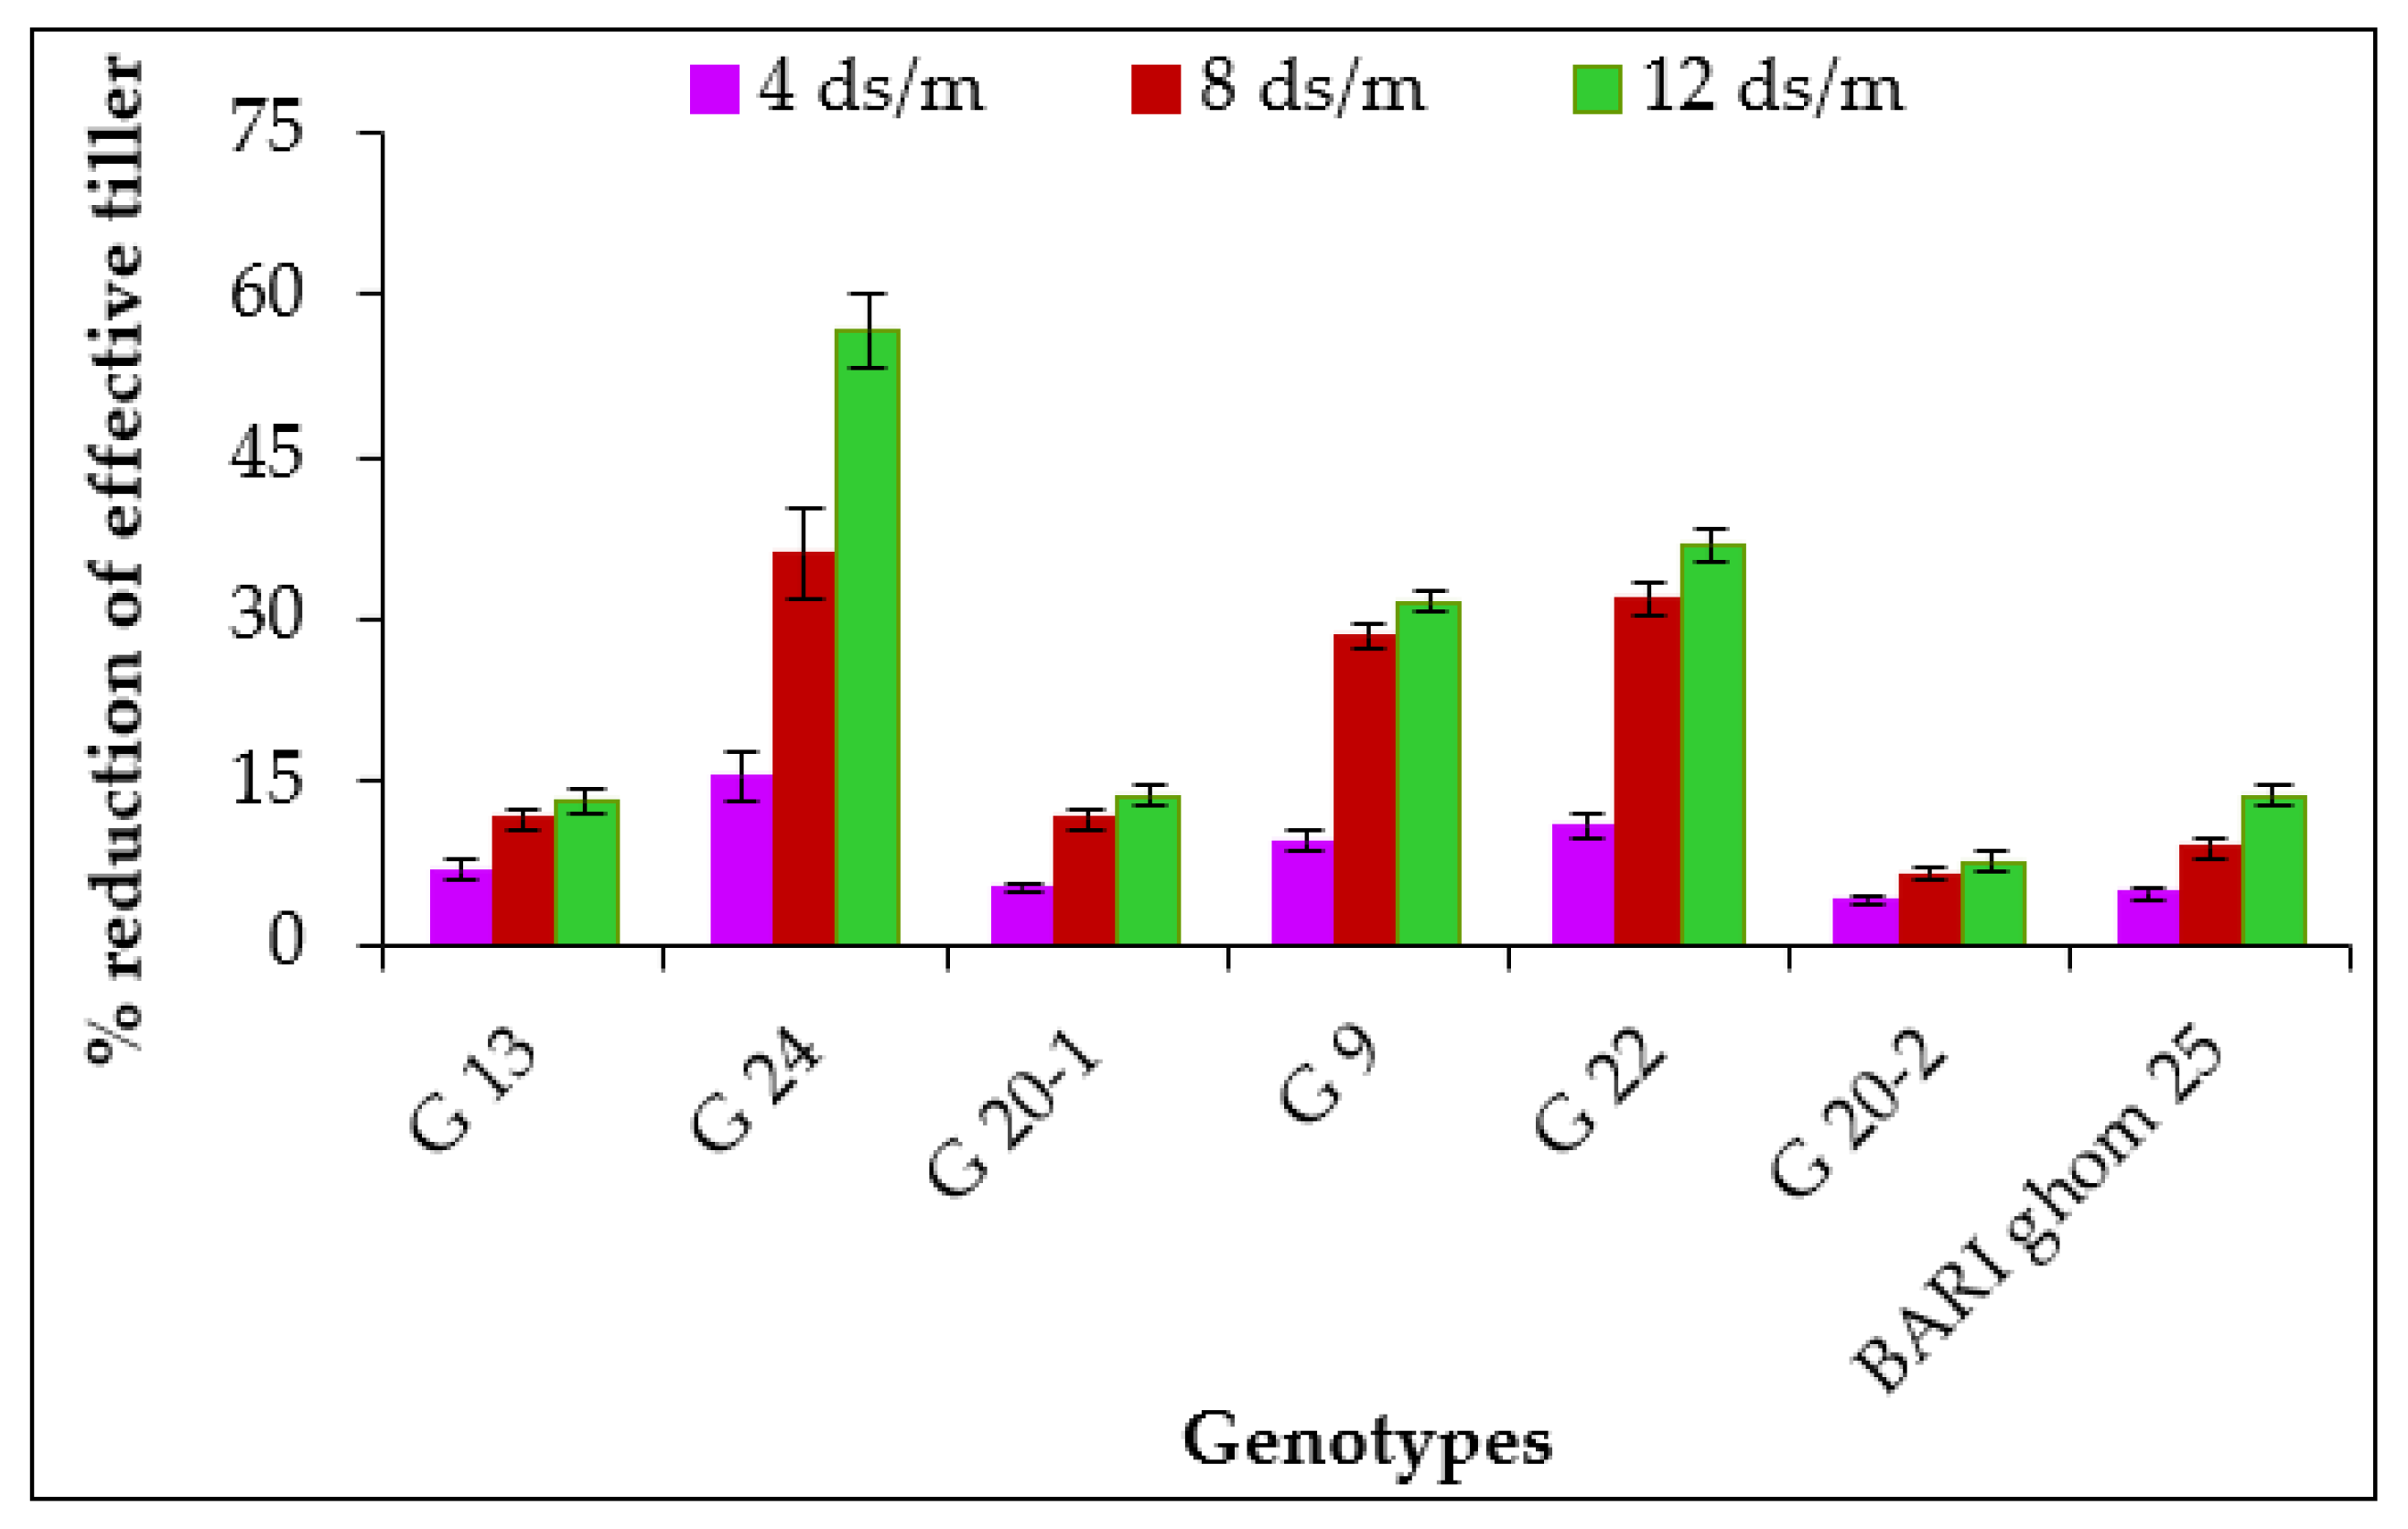
2.1.3. Effective Tillers per Plant
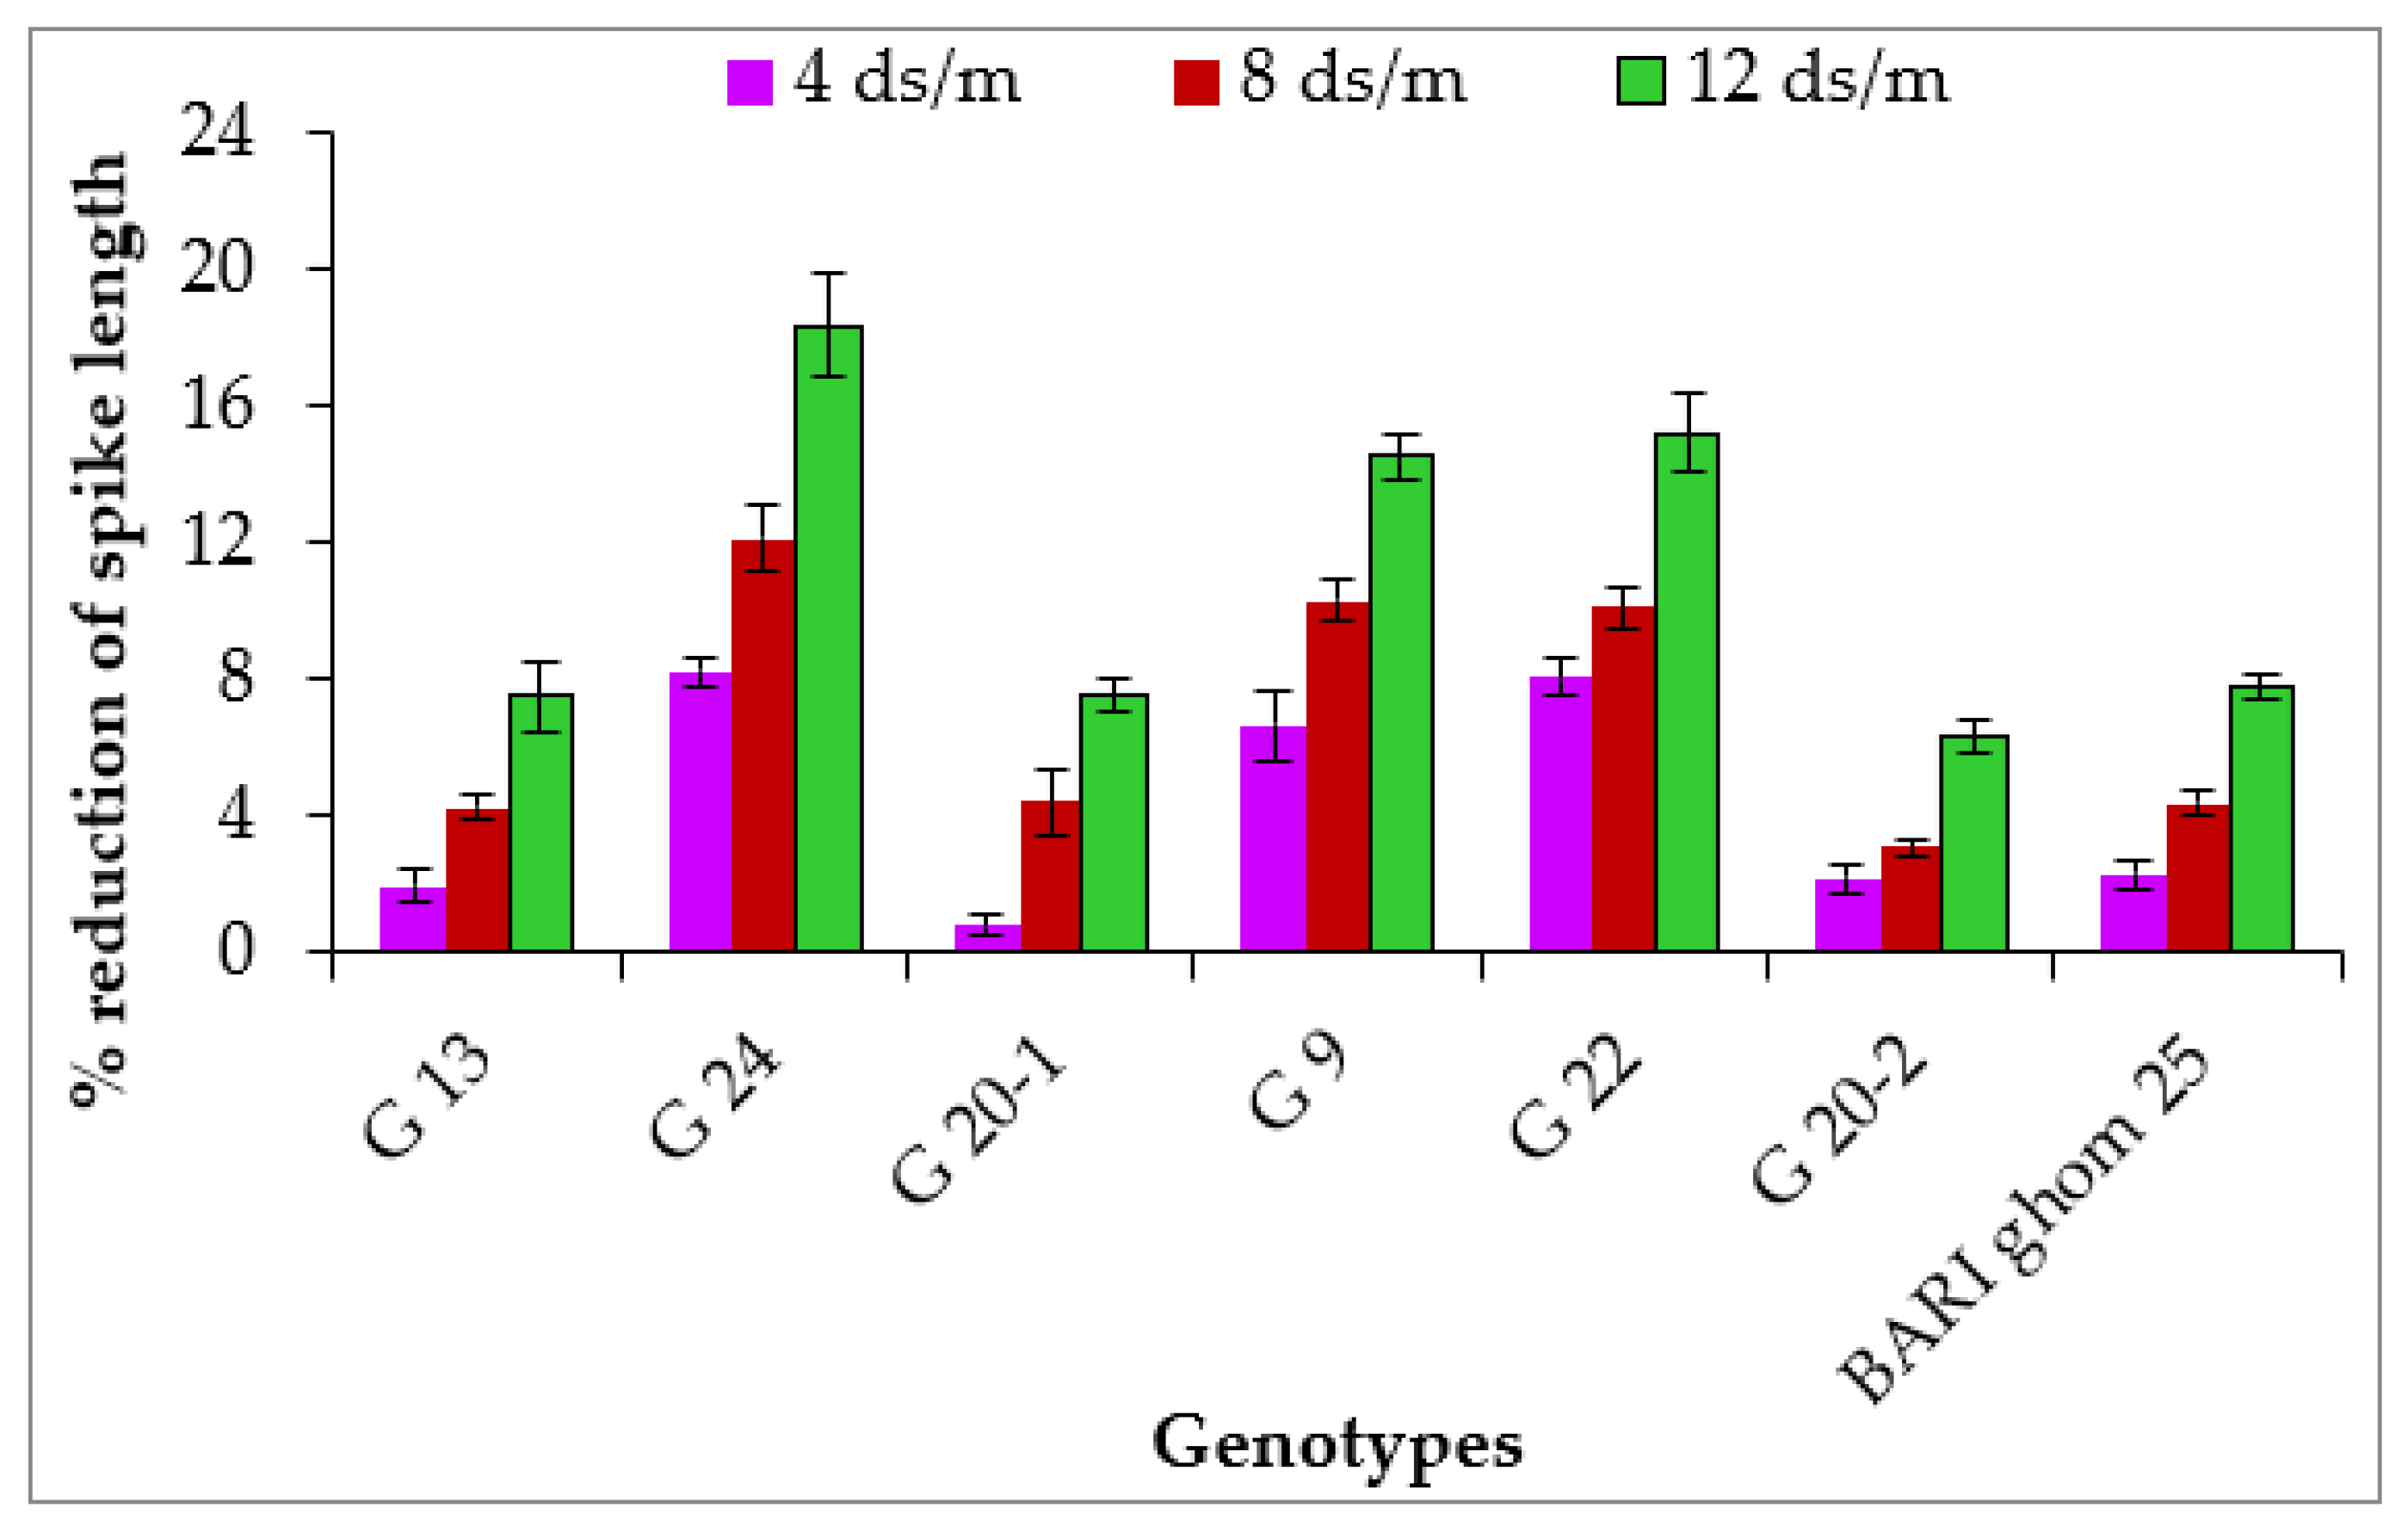
Increased salinity causes severe plant growth reduction. Therefore, all yield attributes were affected by salinity, and effective tiller number plant−1 reduced due to higher saline conditions (Table 2). Under control conditions, statistically similar results were found in all the genotypes. At all salinity levels, genotype G 20-2 showed the highest number of effective tillers plant−1 (5.31, 5.17 and 5.11, respectively), which was statistically similar to G 20-1, and the lowest effective tillers plant−1 was observed in G 24 (4.35, 3.30 and 2.23, respectively), which was statistically dissimilar to other genotypes. Genotype G 20-2 showed the lowest reduction (7.65%) of effective tillers plant−1 and genotype G 24 showed the highest reduction (56.70) (Figure 3) at 12 dS m−1 salinity level.

2.1.4. Spike Length

The spike length of all the wheat genotypes was significantly reduced due to salt stress and there were significant differences among the wheat genotypes (Table 2). The spike length of the wheat genotypes under control conditions ranged from 9.83 to 11.83 cm. Genotype G 24 showed the highest spike length under salinity levels of 4 and 8 dS m−1 (10.86 and 10.40 cm, respectively) but under salinity level 12 dS m−1, genotype G 20-1 showed the highest spike length (9.80 cm), and it is statistically similar to genotypes G 24 (9.66 cm) and G 20-2 (9.21 cm) (Table 2). Under the highest salinity level (12 dS m−1), the lowest reduction of spike length was observed in genotype G 20-2 (6.31%). Genotype G 13 (7.49%) and G 20-1 (7.50%) also showed better performance (Figure 4).

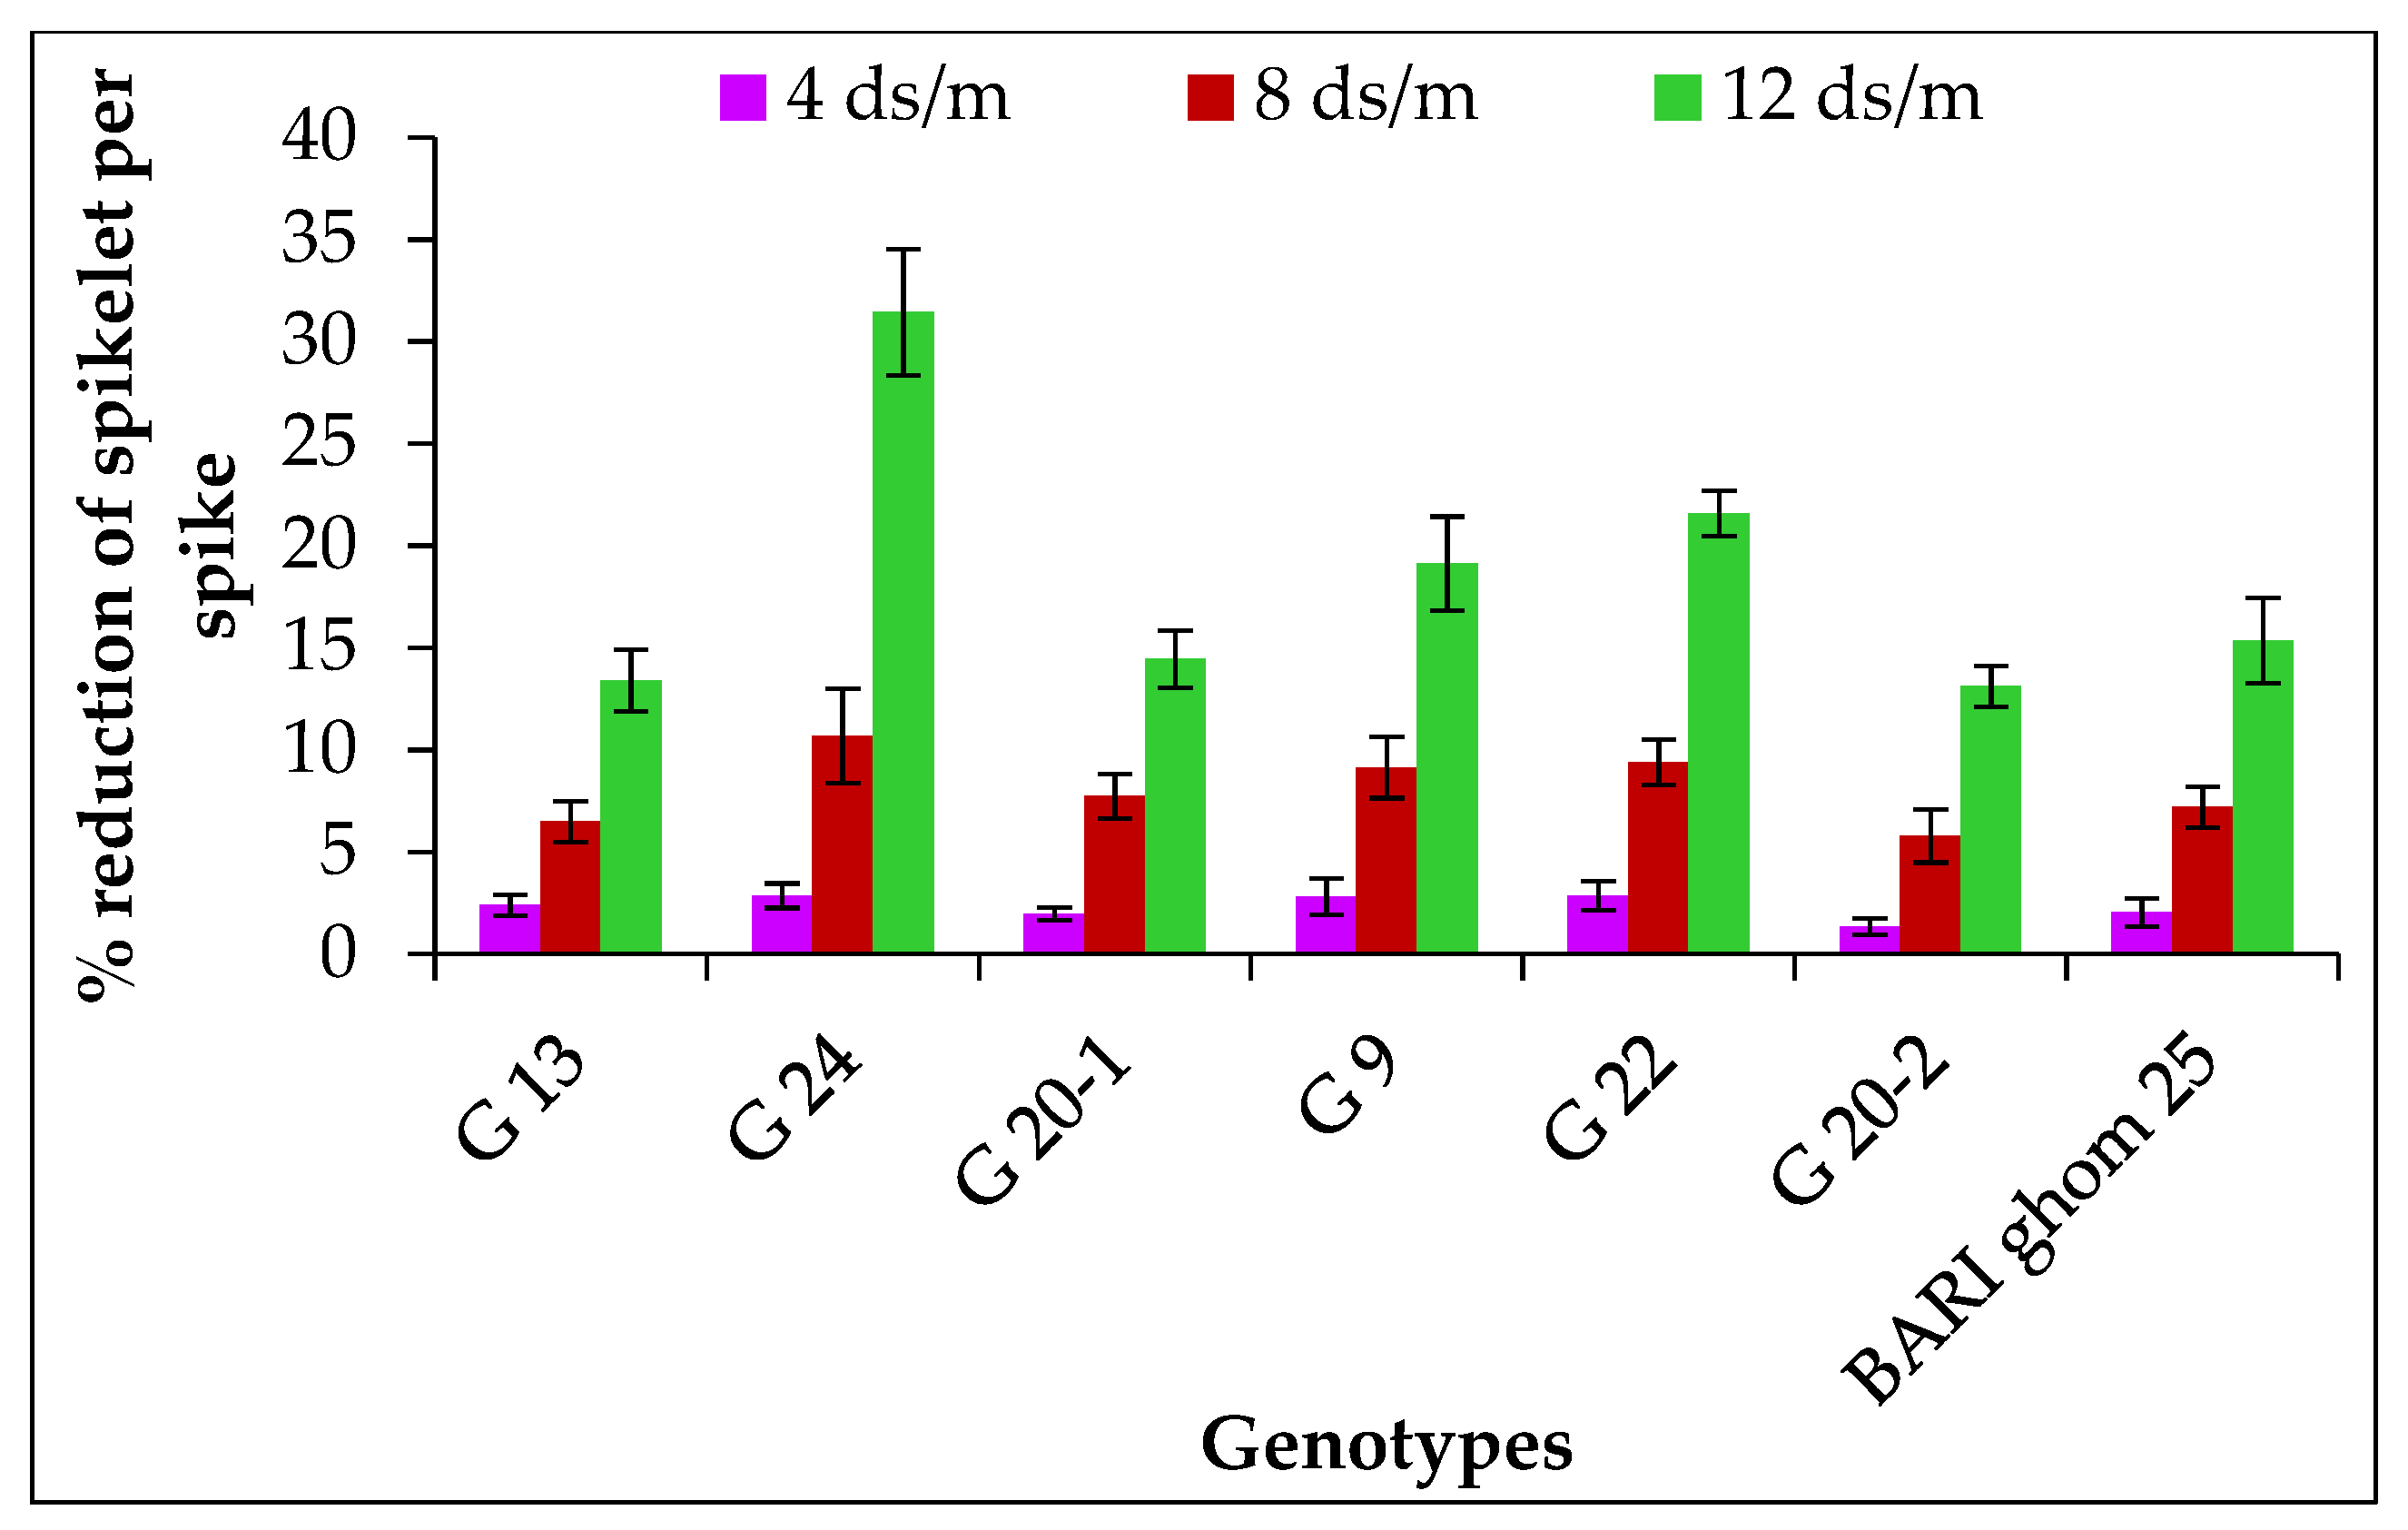
2.1.5. Spikelet Number per Spike

Salinity stress significantly reduced the spikelets number spike−1 of the studied wheat genotypes (Table 3). The highest spikelet number spike−1 at 4 dS m−1 salinity level was observed in genotype G 9 (18.88). The reduction percentage was higher in G 22 and G 24 (2.86%) and lowest in G 20-2 (1.33%) (Figure 5). At 8 dS m−1 salinity treatment, the highest spikelet number spike−1 was found in G 13 (18.01), followed by G 9 (17.65), and the lowest spikelet number spike−1 was found in G 24 (15.63). The reduction percentage of spikelet number spike−1 at 8 dS m−1 was higher in G 24 (10.69%) and the lowest reduction percentage was found in G 20-2 (5.78%) (Figure 5). The maximum spikelet number spike−1 at 12 dS m−1 was found in genotype G 13 (16.68) and the lowest was found in G 24 (12.00). Among all wheat genotypes and at all salinity levels, reduction percentage of spikelet number spike−1 was lower in G 20-2, whereas G 24 showed the highest reduction percentage (Figure 5).

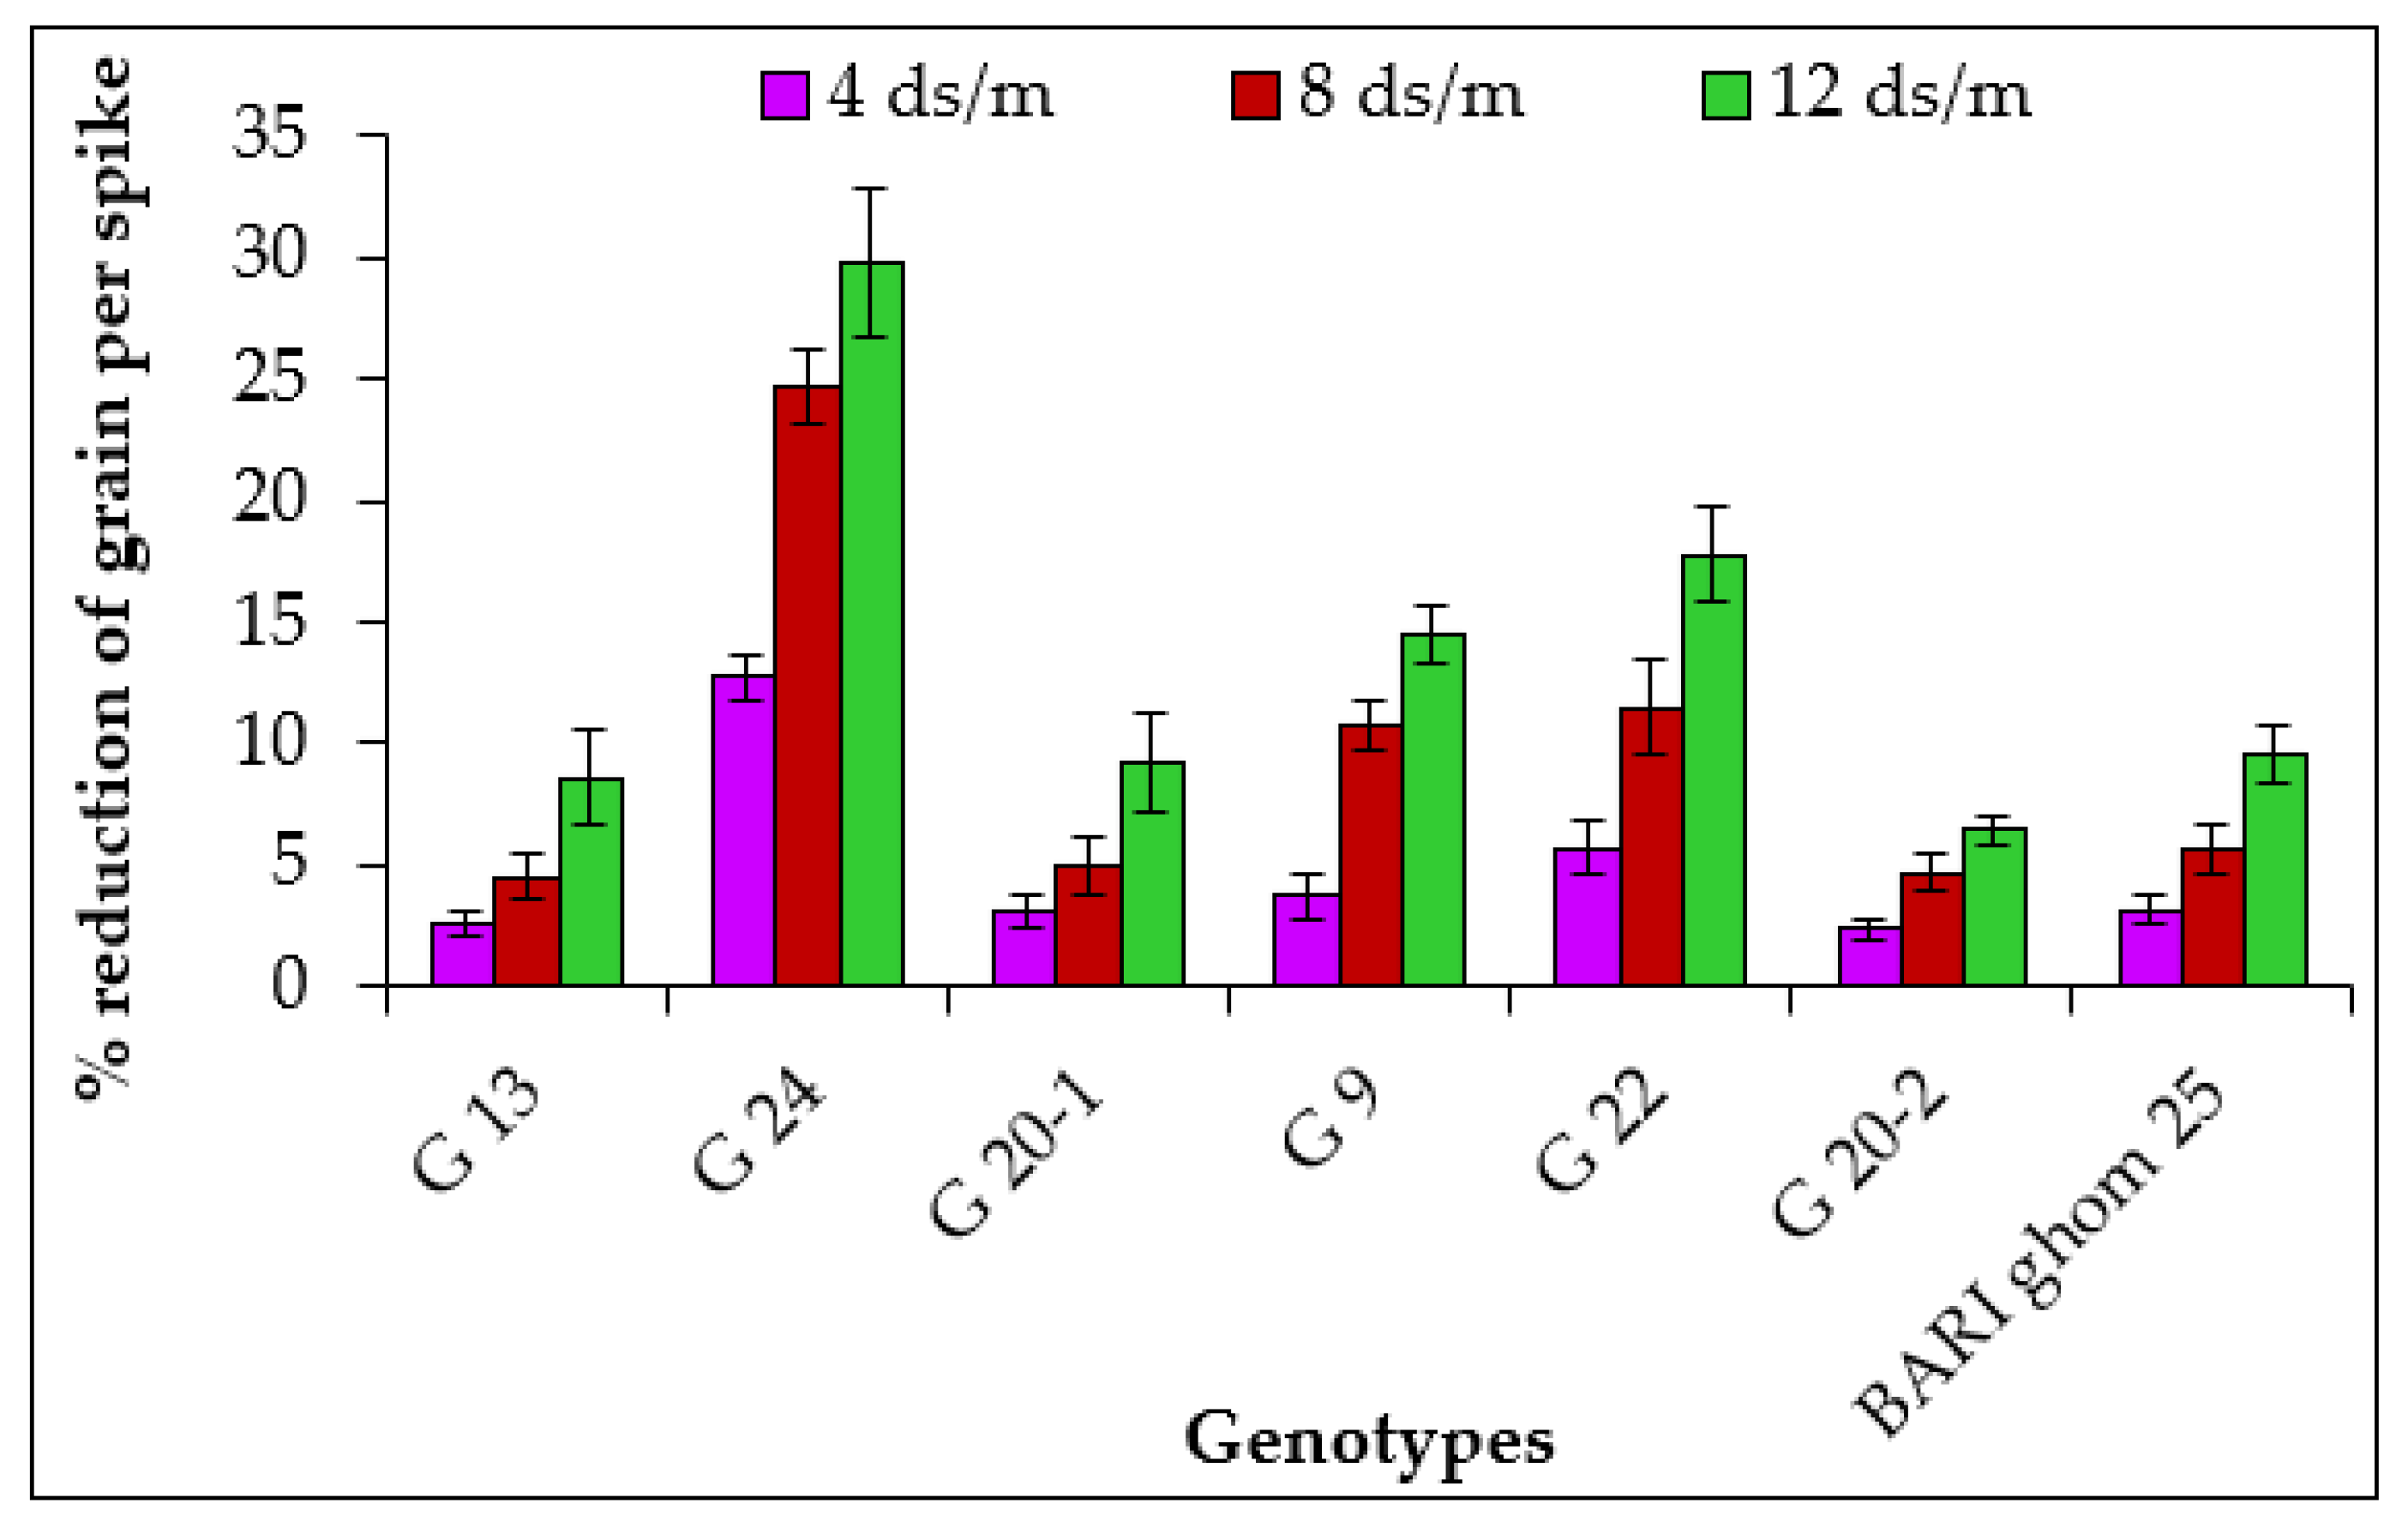
2.1.6. Grains per Spike

Number of grains spike−1 of different wheat genotypes was significantly influenced by salinity stress (Table 3). At salinity levels 4, 8 and 12 dS m−1, statistically the maximum grain spike−1 was observed in G 20-2 (58.10, 56.36 and 55.00, respectively), which was statistically similar to G 13, and the lowest grains number spike−1 was observed in genotype G 24 (46.91, 40.00 and 36.90, respectively). Due to salt stress, the reduction of grains number spike−1 was varied from 2.39 to 31.60% (Figure 6). At all salinity levels, the lowest reduction of grain number spike−1 was also observed in genotype G 20-2.

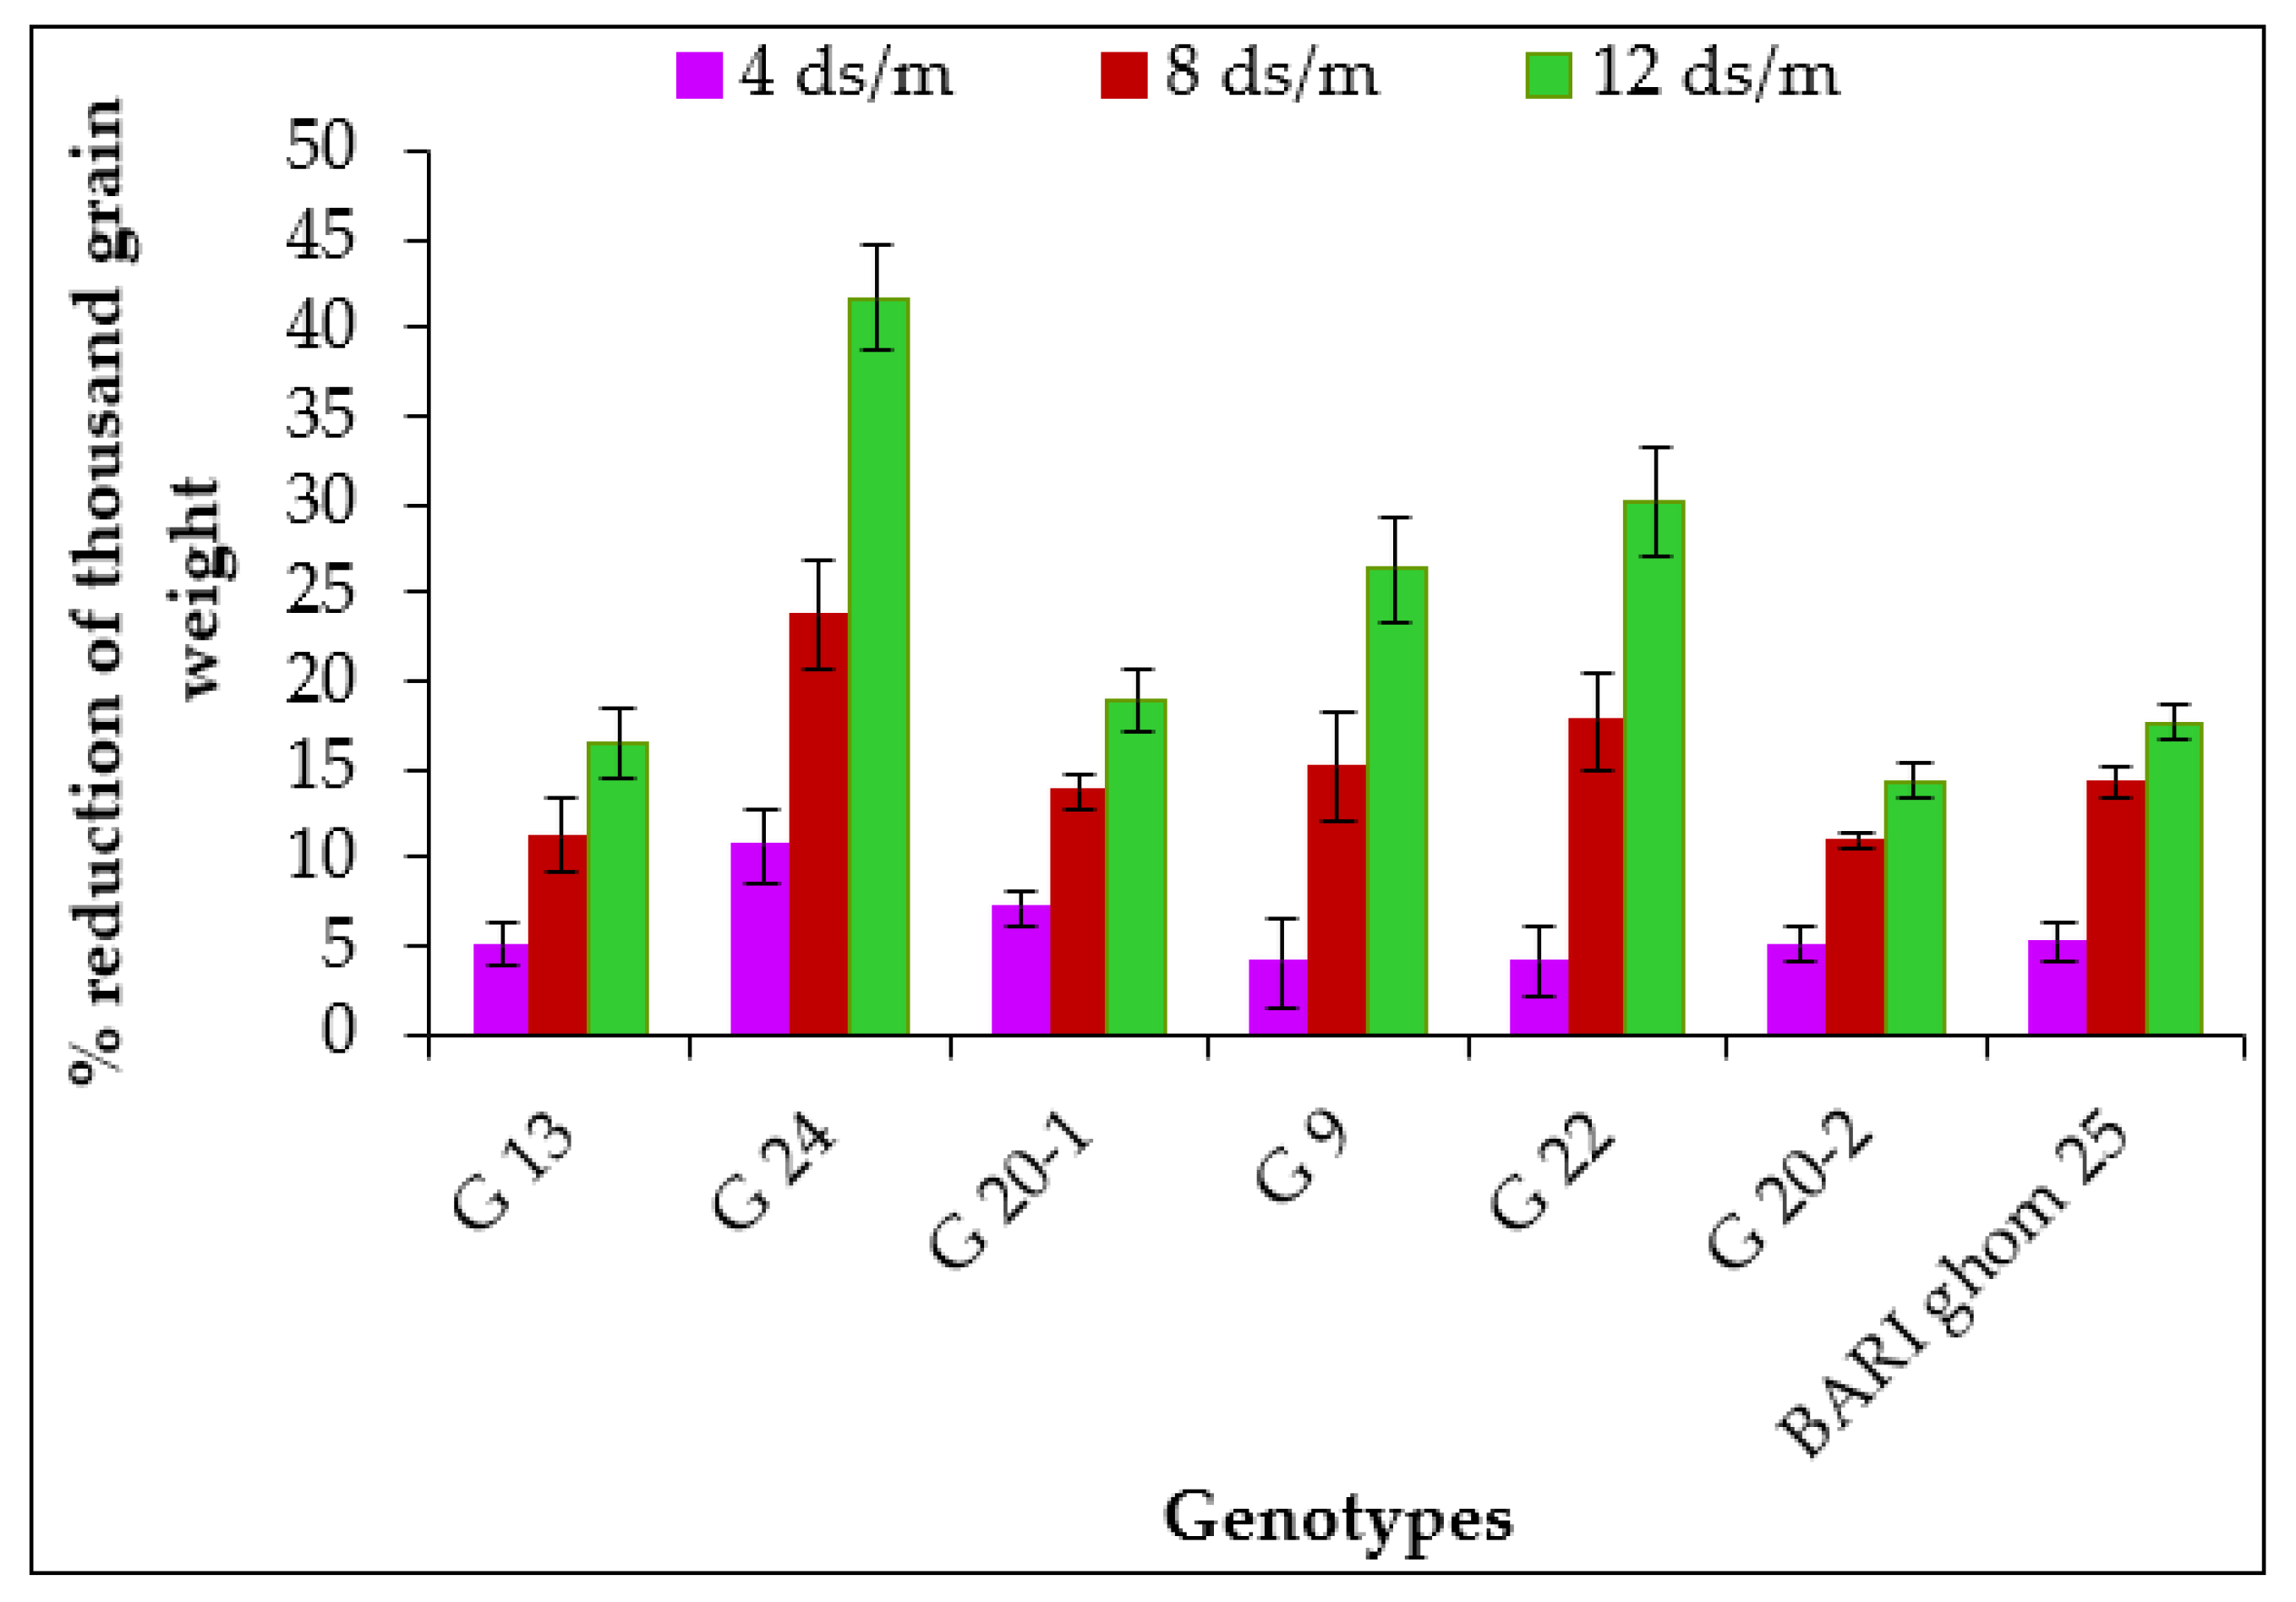
2.1.7. Thousand Grain Weight
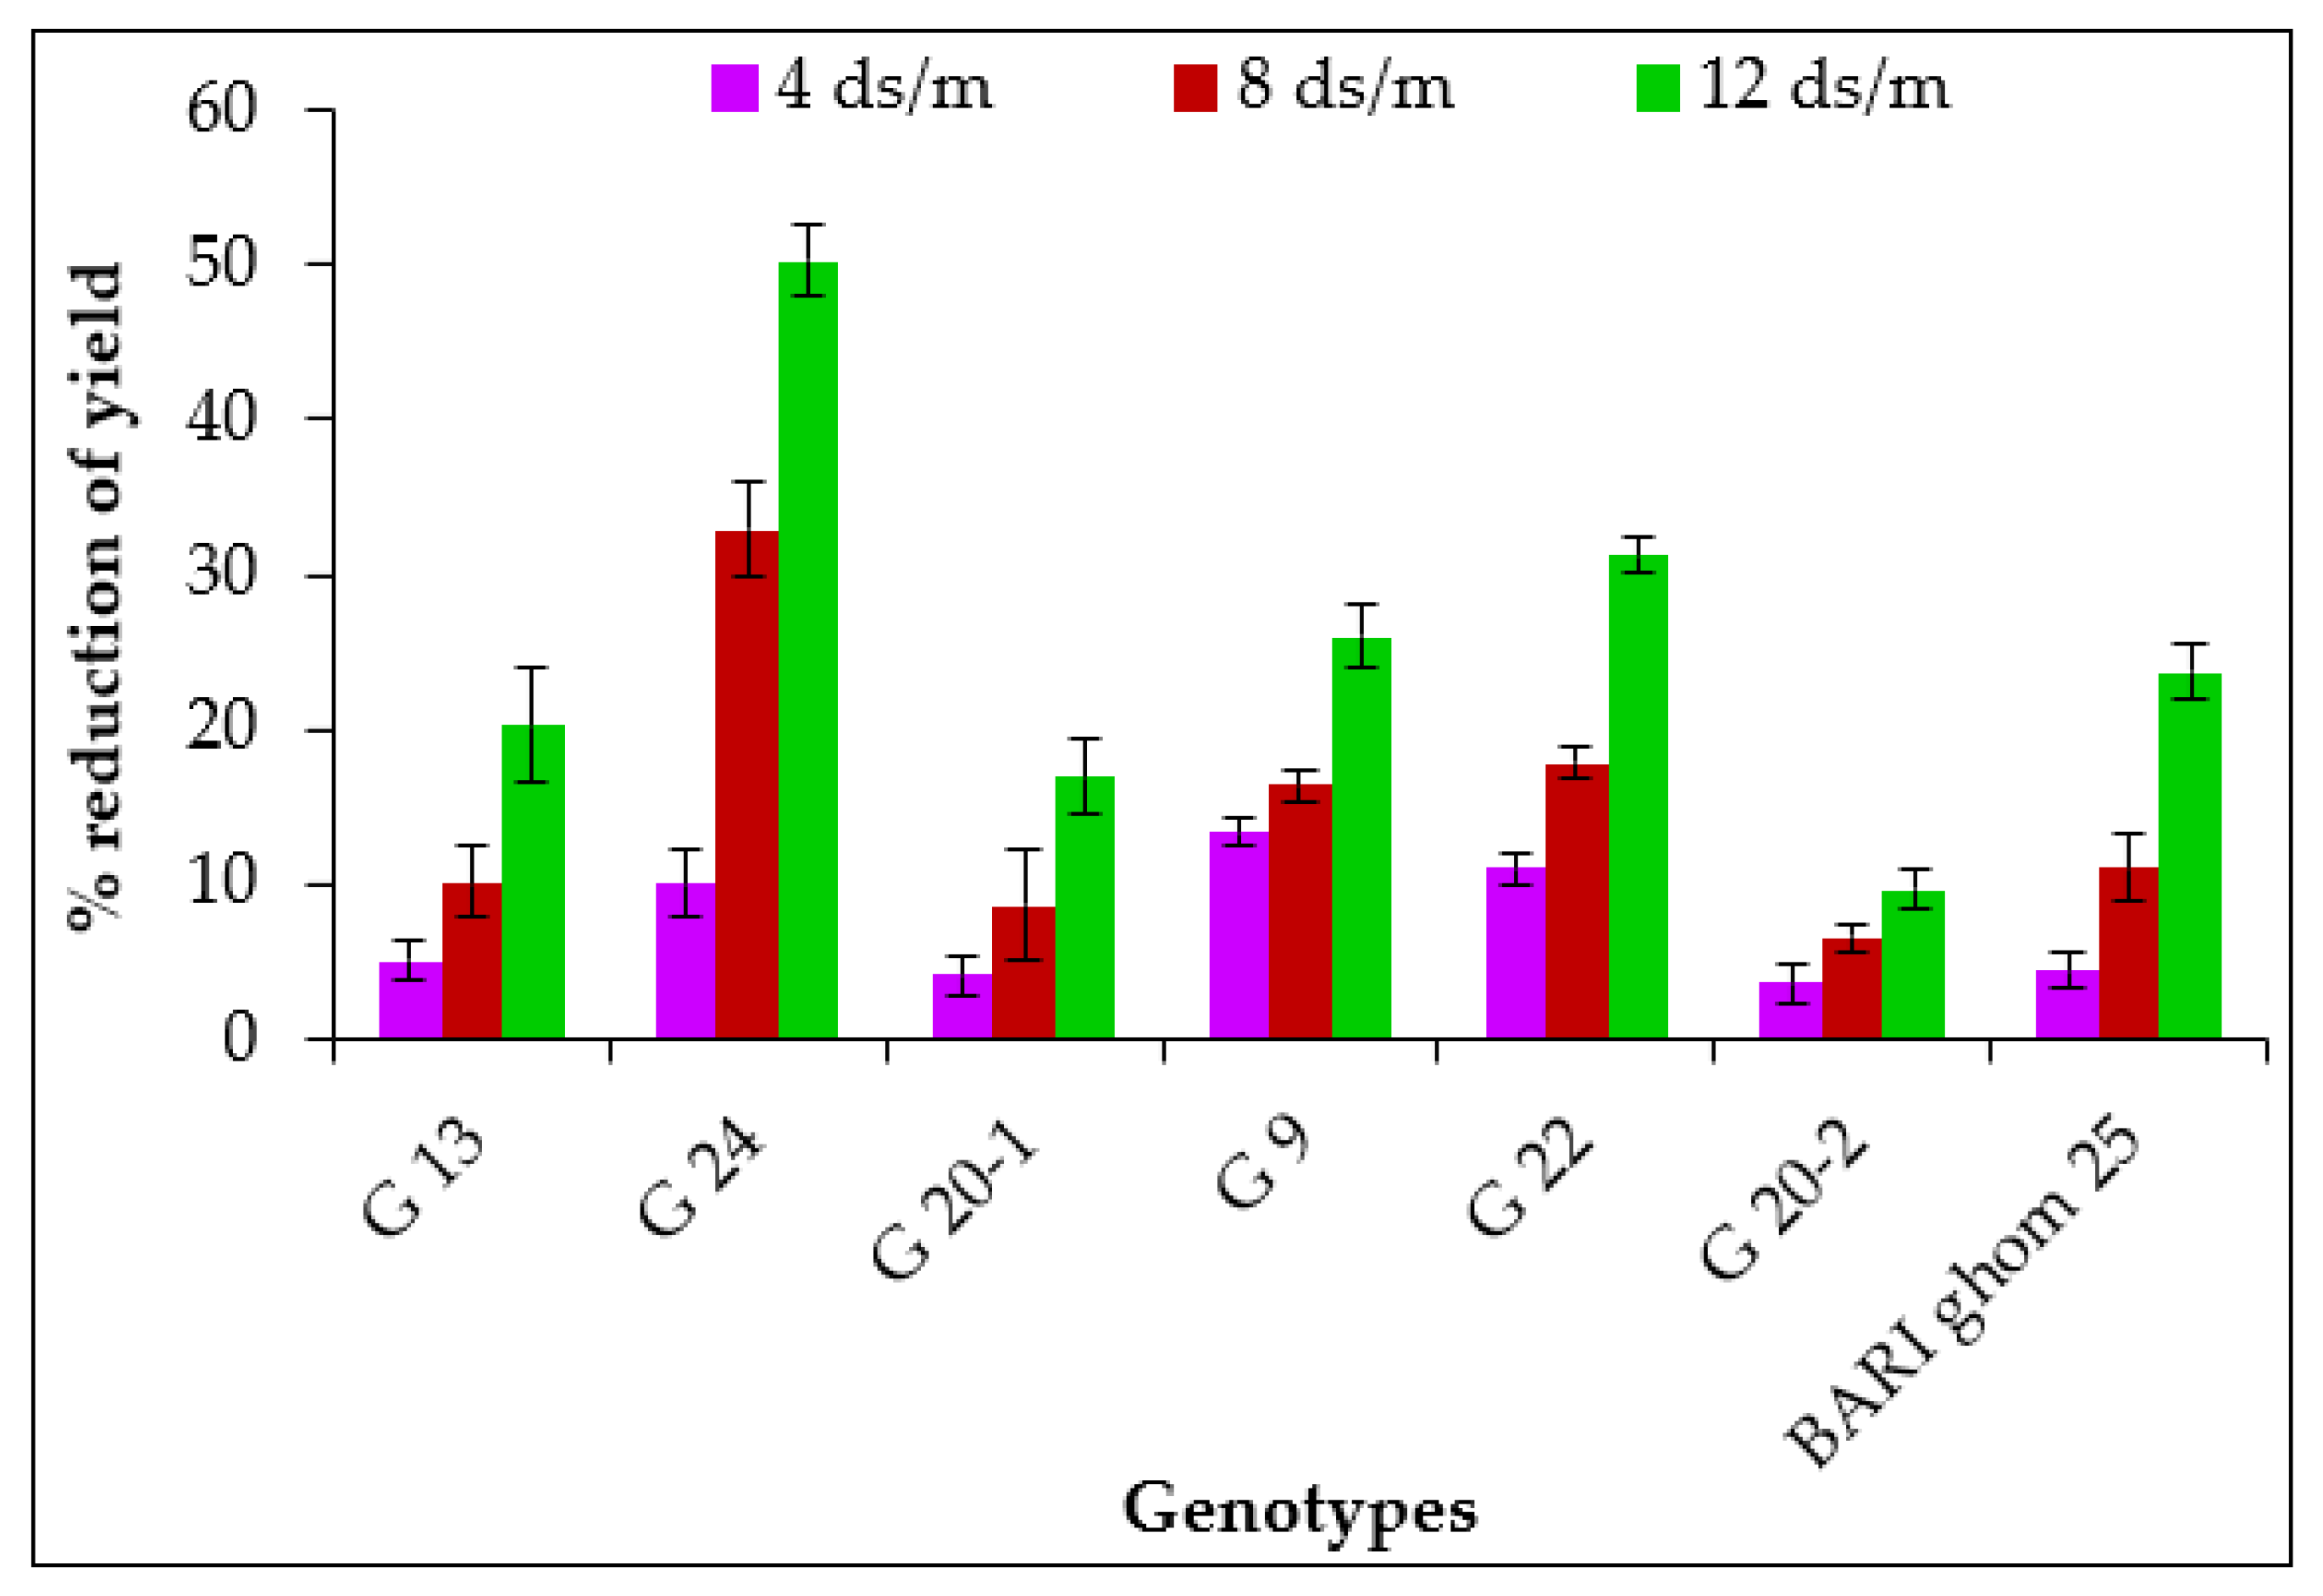
Thousand grain weight of different wheat genotypes was reduced significantly due to salt stress (Table 4). Thousand grain weight ranged from 26.09 to 51.25 g (Table 4). Under highest salt stress (12 dS m−1), genotype G 20-1 showed the highest 1000-grain weight (41.54 g) and genotype G 24 showed the lowest (26.09 g) 1000-grain weight. The reduction percent of 1000-grain weight was smallest at 4 and 8 dS m−1 than 12 dS m−1 salinity level (Figure 7). Under 4, 8 and 12 dS m−1 salinity, the lowest reduction of 1000-grain weight was found in genotype G 20-2 (5.05, 10.95 and 14.34%, respectively), and genotype G 24 showed the highest reduction (10.69, 23.71 and 41.69%, respectively).

2.1.8. Grain Yield

Yield is the total combination of many parameters, such as tiller number, spike number plant−1, grain number, grain size, grain weight, etc. Salt stress actually reduces these attributes when it occurs significantly. The present study showed a significant difference in yield among the different wheat genotypes due to the increase in salinity levels (Table 4). At 0 dS m−1 (control) salinity level, genotype G 13 showed the maximum grain yield (9.79 g plant−1), while at 8 and 12 dS m−1 salinity, genotype G 20-2 showed the highest grain yield (8.91 and 8.62 g plant−1, respectively). Genotype G 24 showed the lowest grain yield at all salinity levels. Genotypes G 13 (9.10 g plant−1) and G 20-1 (7.92 g plant−1) also showed better grain yield at 12 dS m−1 salinity level (Table 4). Genotype G 20-2 showed the lowest grain yield reduction (9.68%), while the highest was found in genotype G 24 (50.25%) at 12 dS m−1 salinity level (Figure 8).

2.2. Compatible Solutes Accumulation

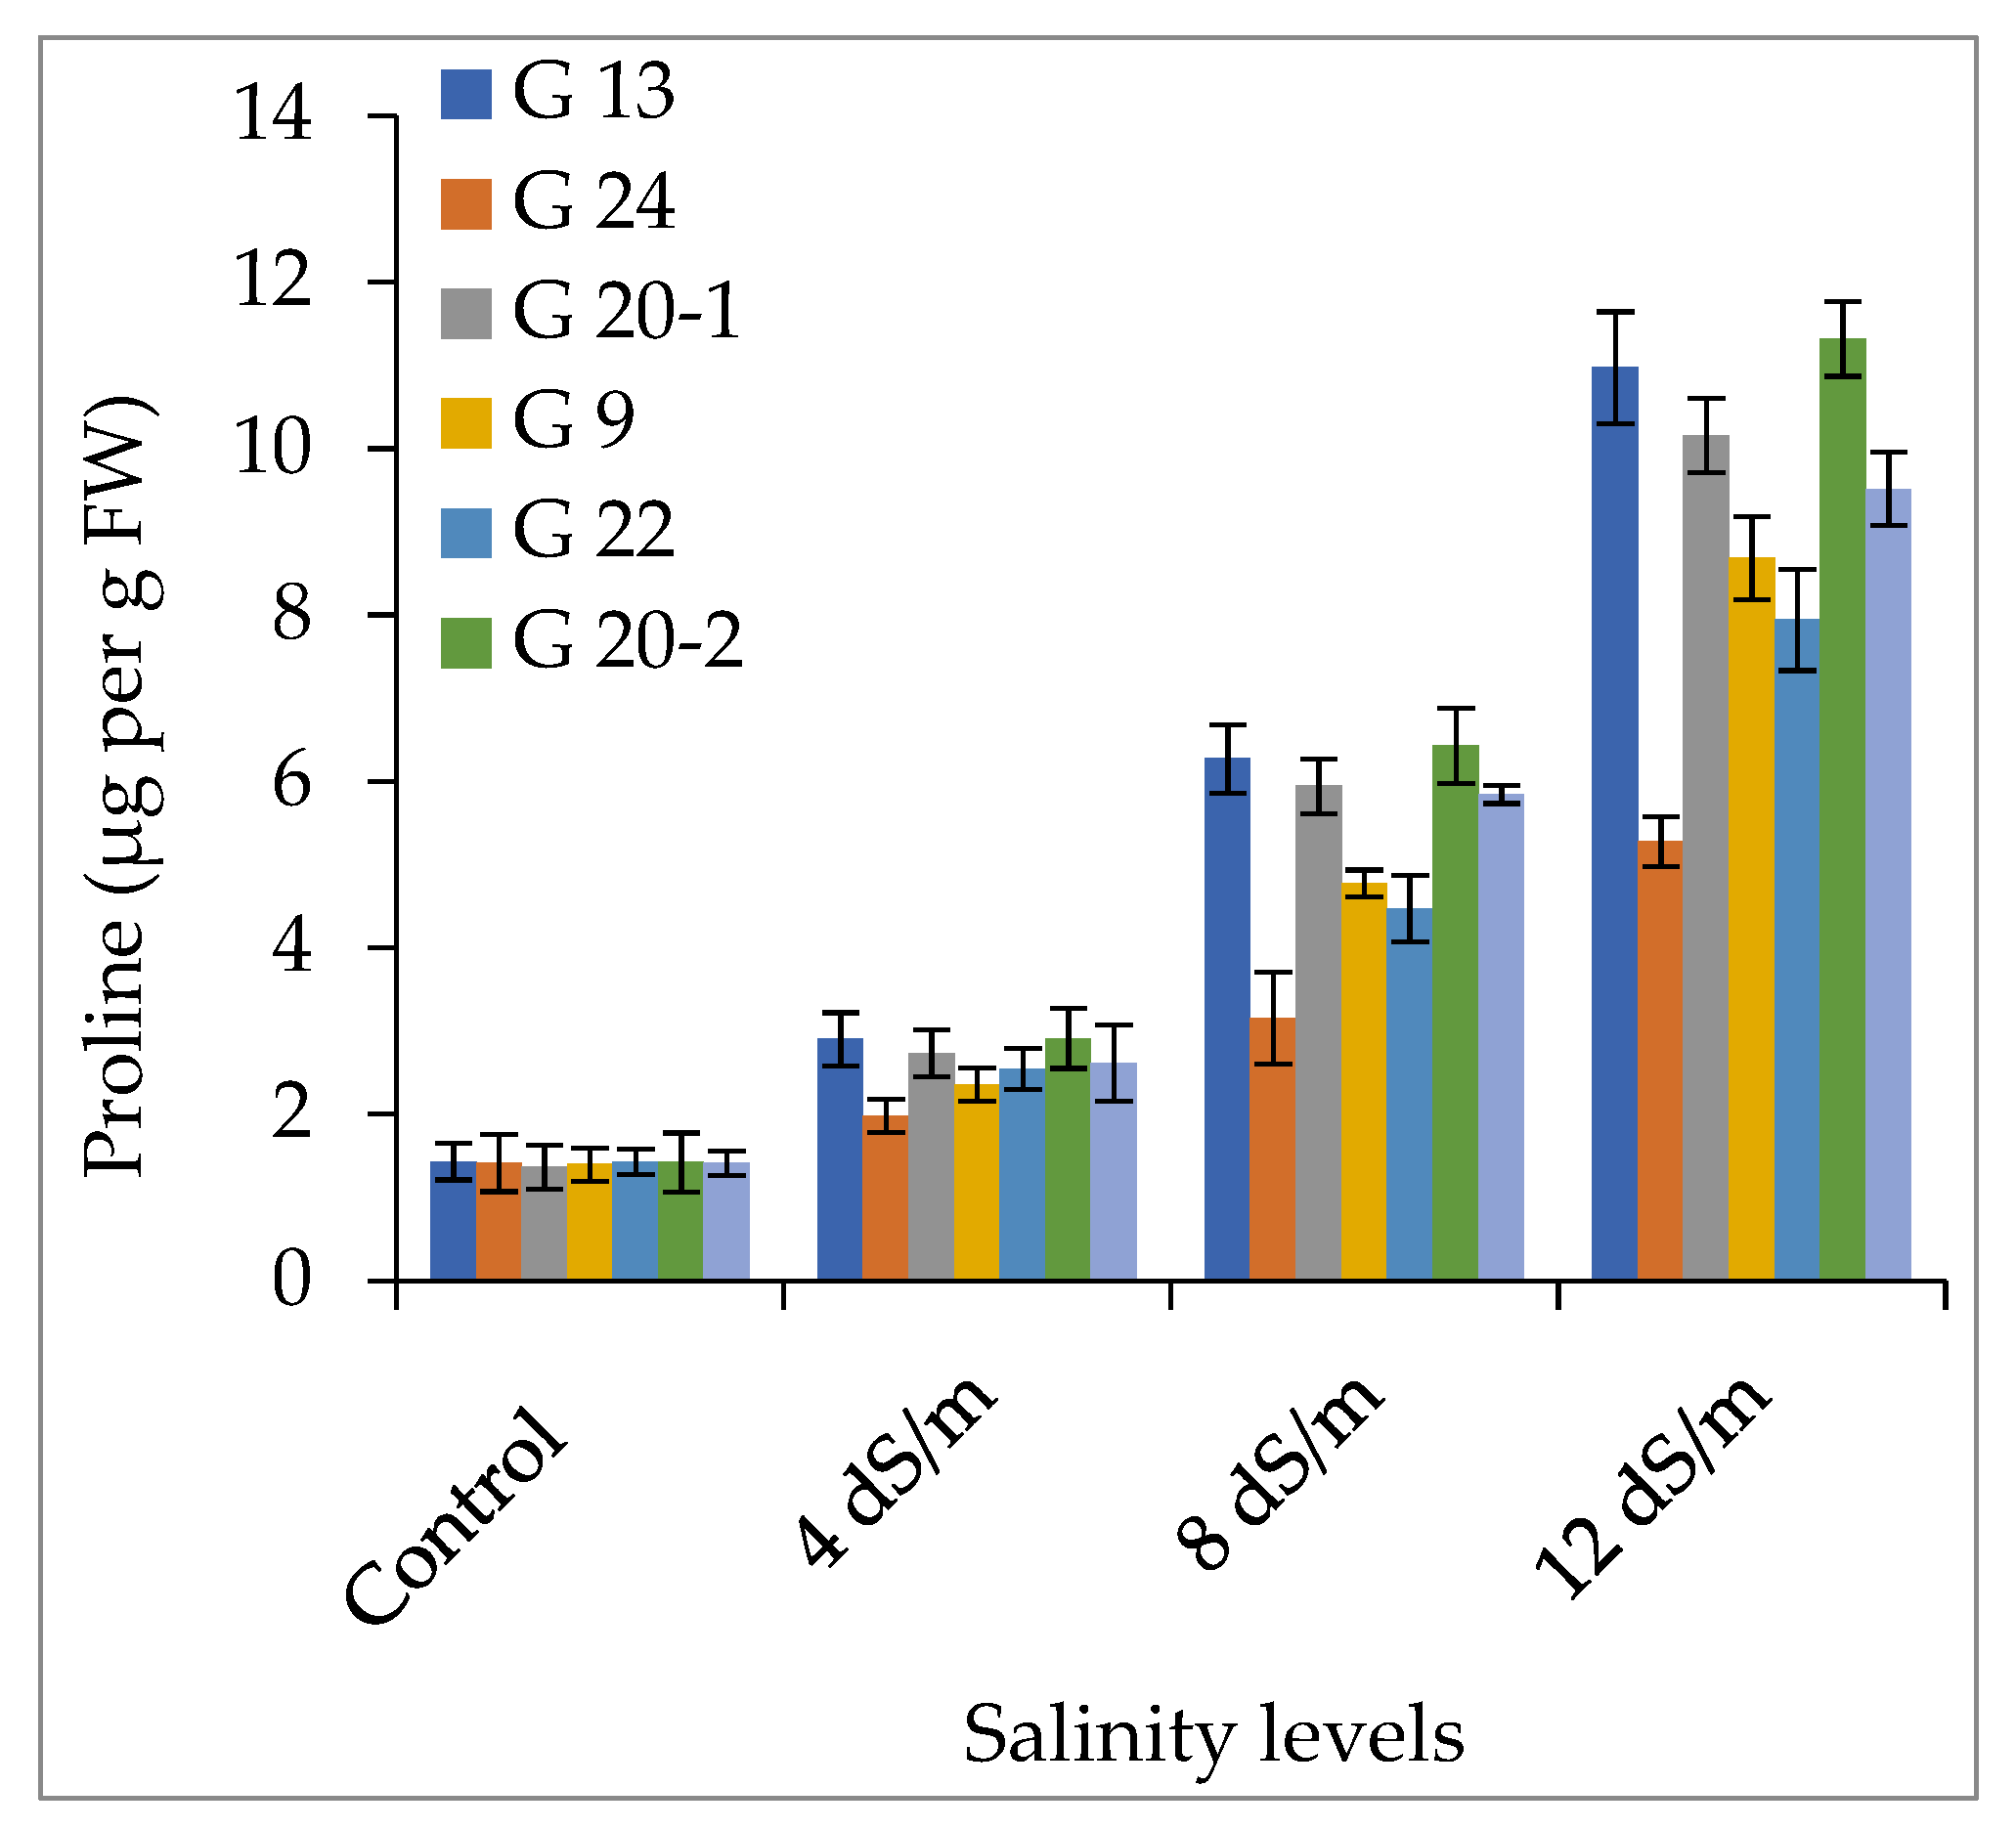
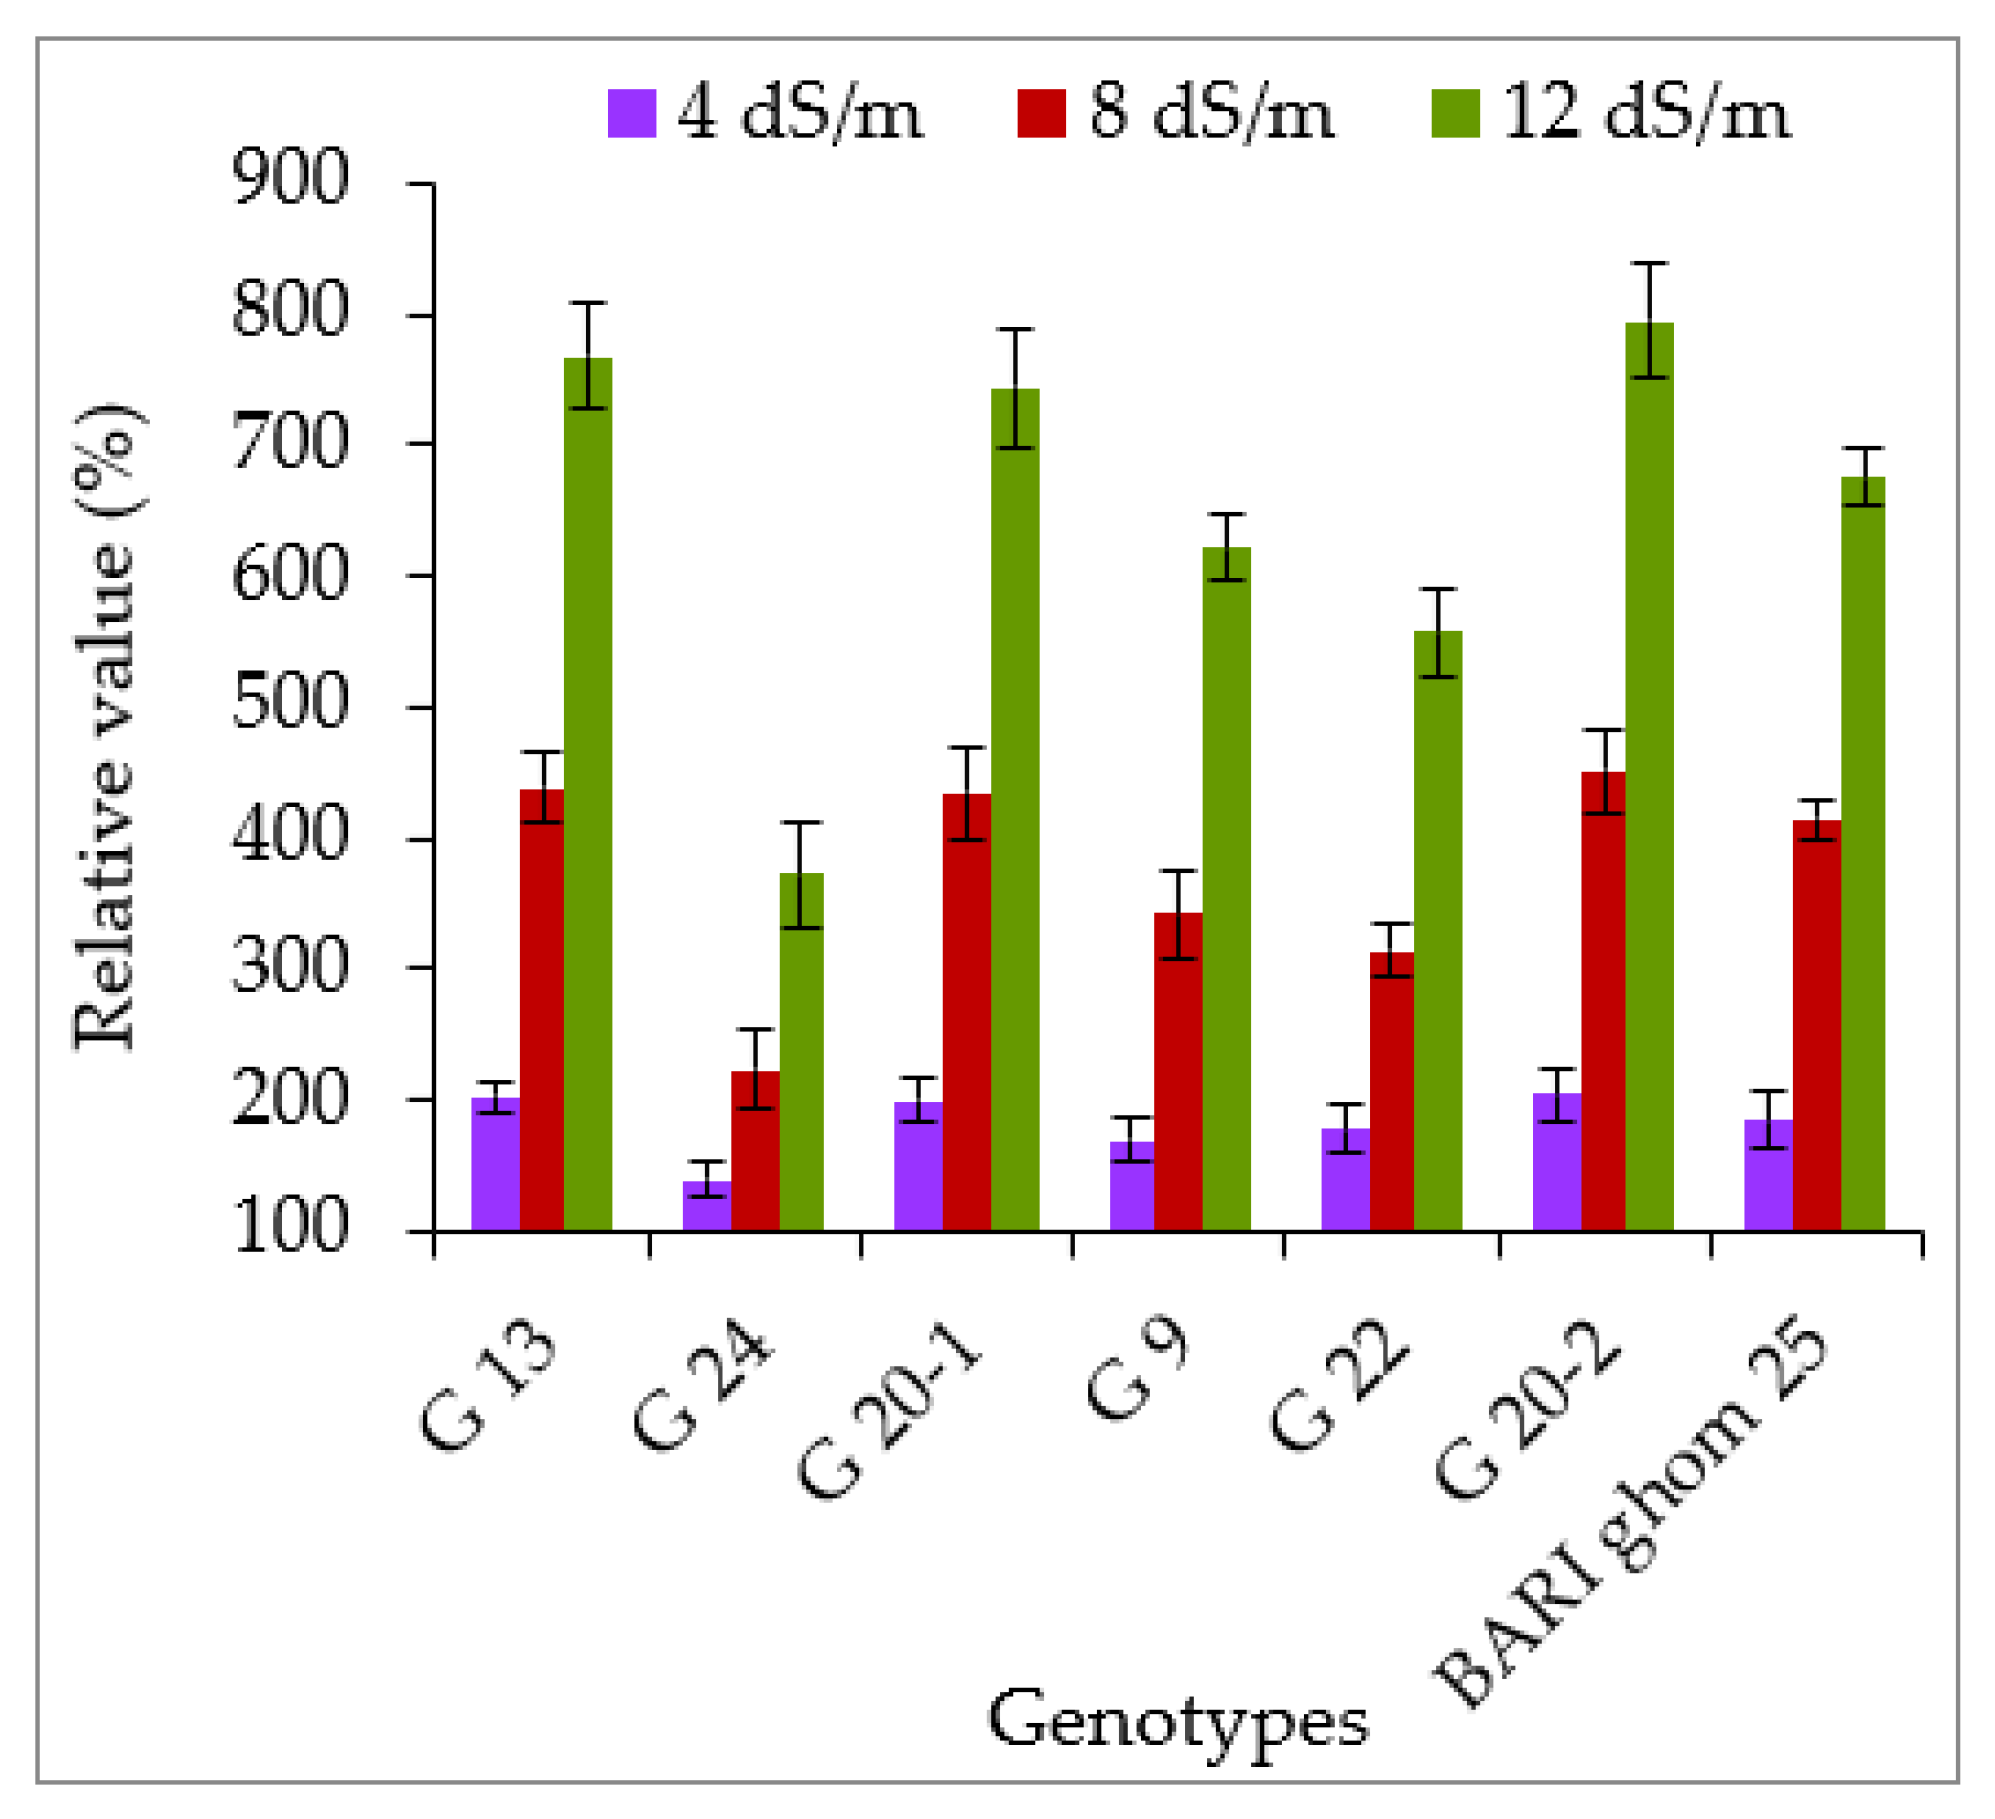
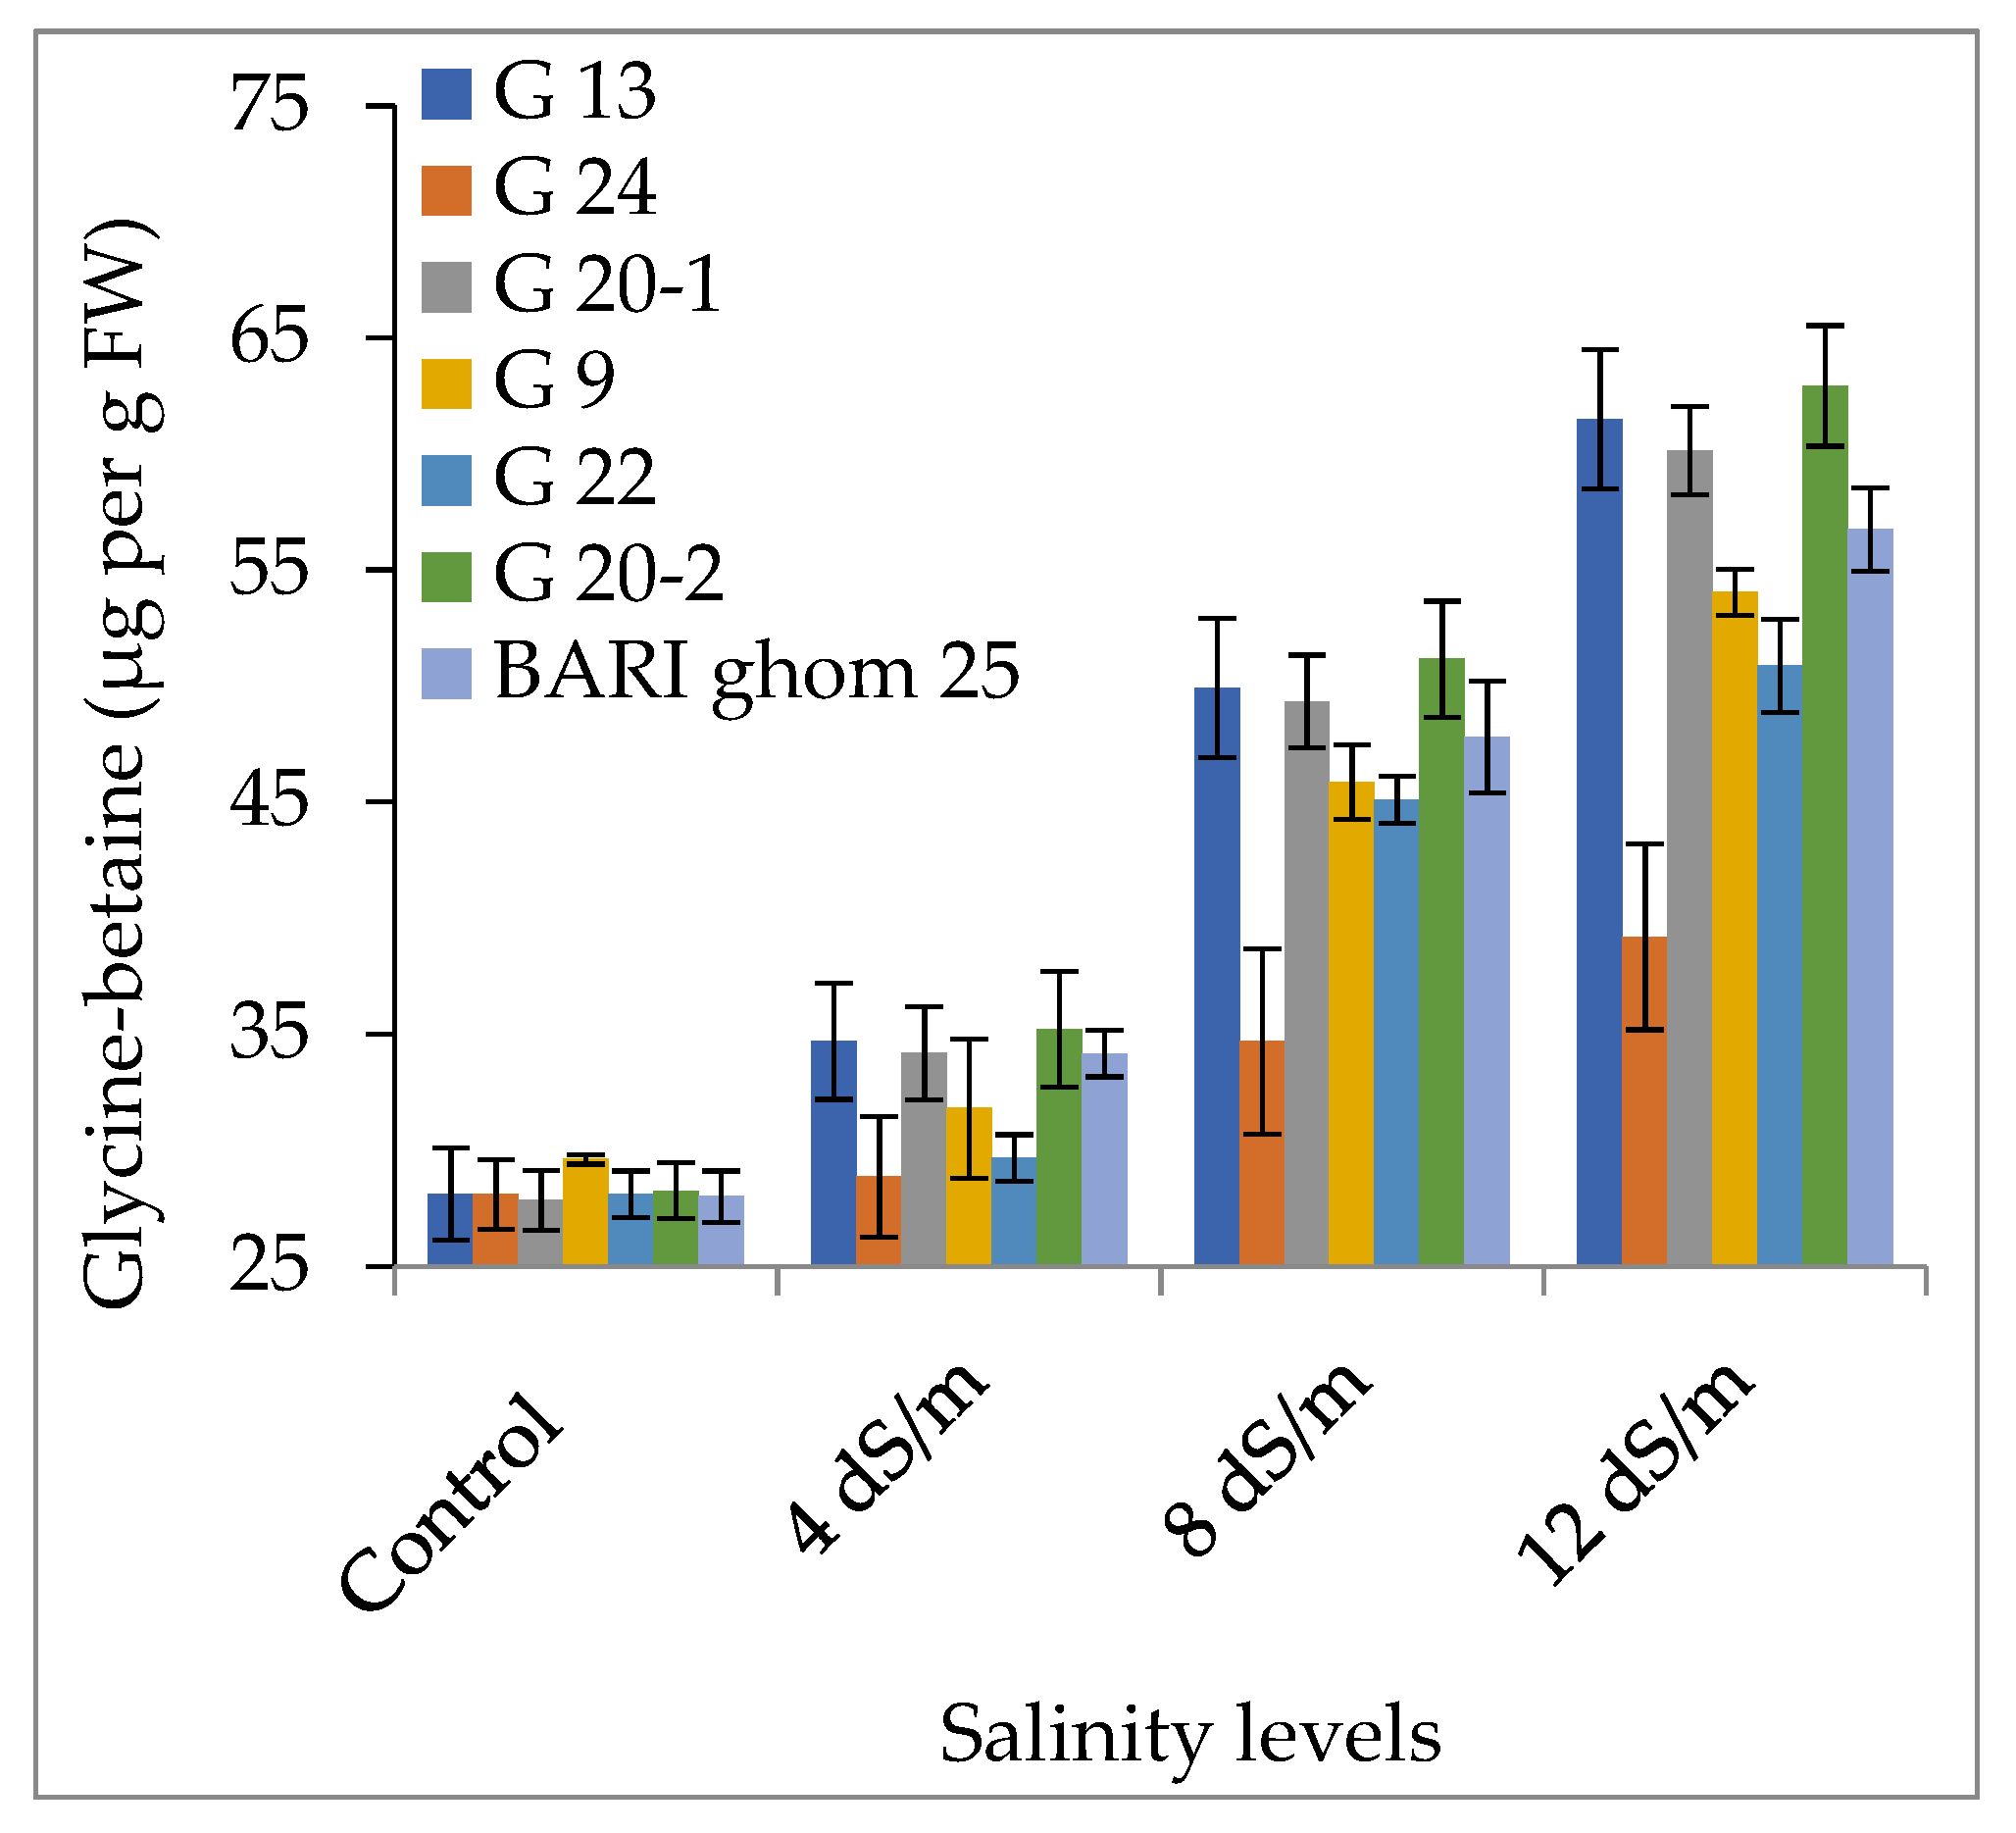
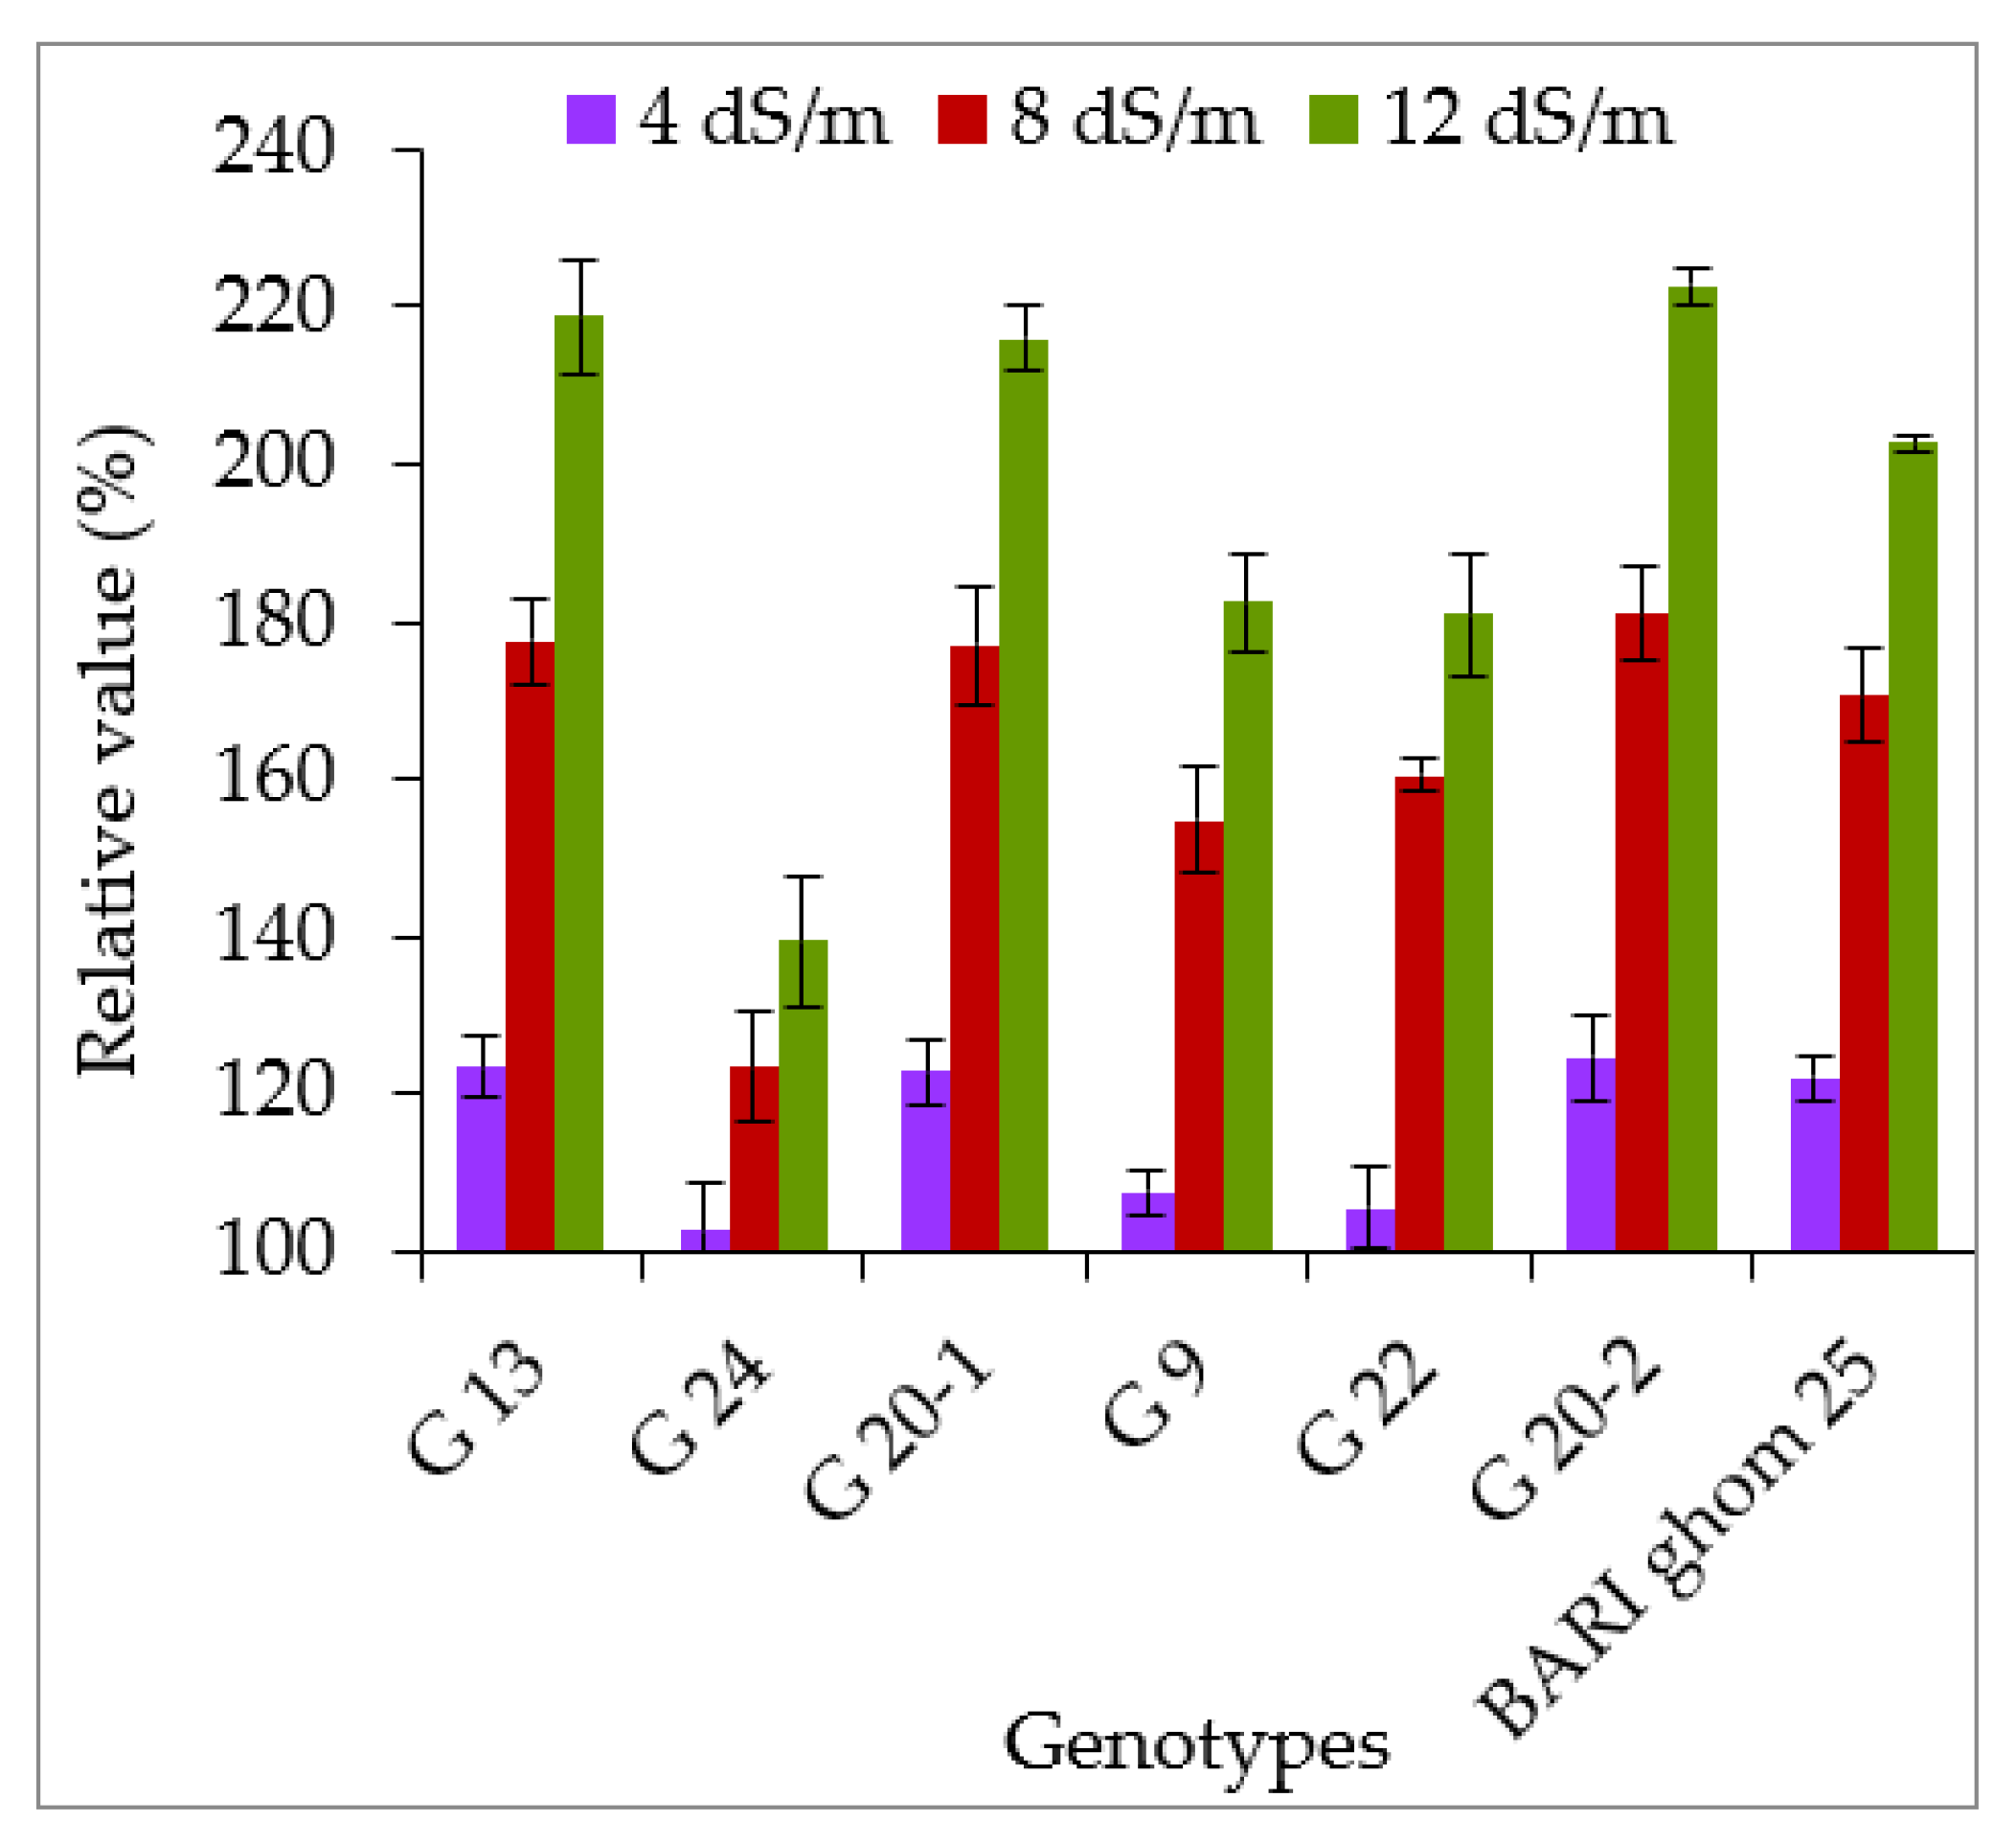
2.2.1. Accumulation of Proline and Glycinebetaine

Under non-saline conditions, the highest proline content was found in genotype G 13 (1.43 µg g−1) (Figure 9). Salt stress significantly increased the proline accumulation and genotype G 20-2 showed the highest accumulation of proline (2.91, 6.43 and 11.32 µg g−1 at 4, 8 and 12 dS m−1 salinity levels, respectively). Again, the lowest proline content was found in G 24 in both control and saline conditions. The relative value was higher in G 20-2 compared to the other genotypes at all the treatments. At all salinity levels, the lowest relative value was observed in G 24 genotype (Figure 10).
In this study, glycinebetaine (GB) content was significantly increased with the increase of salinity level (Figure 11). Under control conditions, GB content was statistically similar in all the genotypes. However, at 4, 8 and 12 dS m−1 salt stress, genotype G 20-2 showed the highest GB content (35.21, 51.15 and 62.93 µg g−1, respectively) which was statistically similar to G 13, while the genotype G 24 showed the lowest GB content (28.85, 34.70 and 39.20 µg g−1, respectively). In the case of relative value, genotype G 20-2 showed the highest relative value (124.68 181.04 and 222.73% at 4, 8 and 12 dS m−1, salinity levels, respectively) and genotype G 24 showed the lowest (Figure 12).

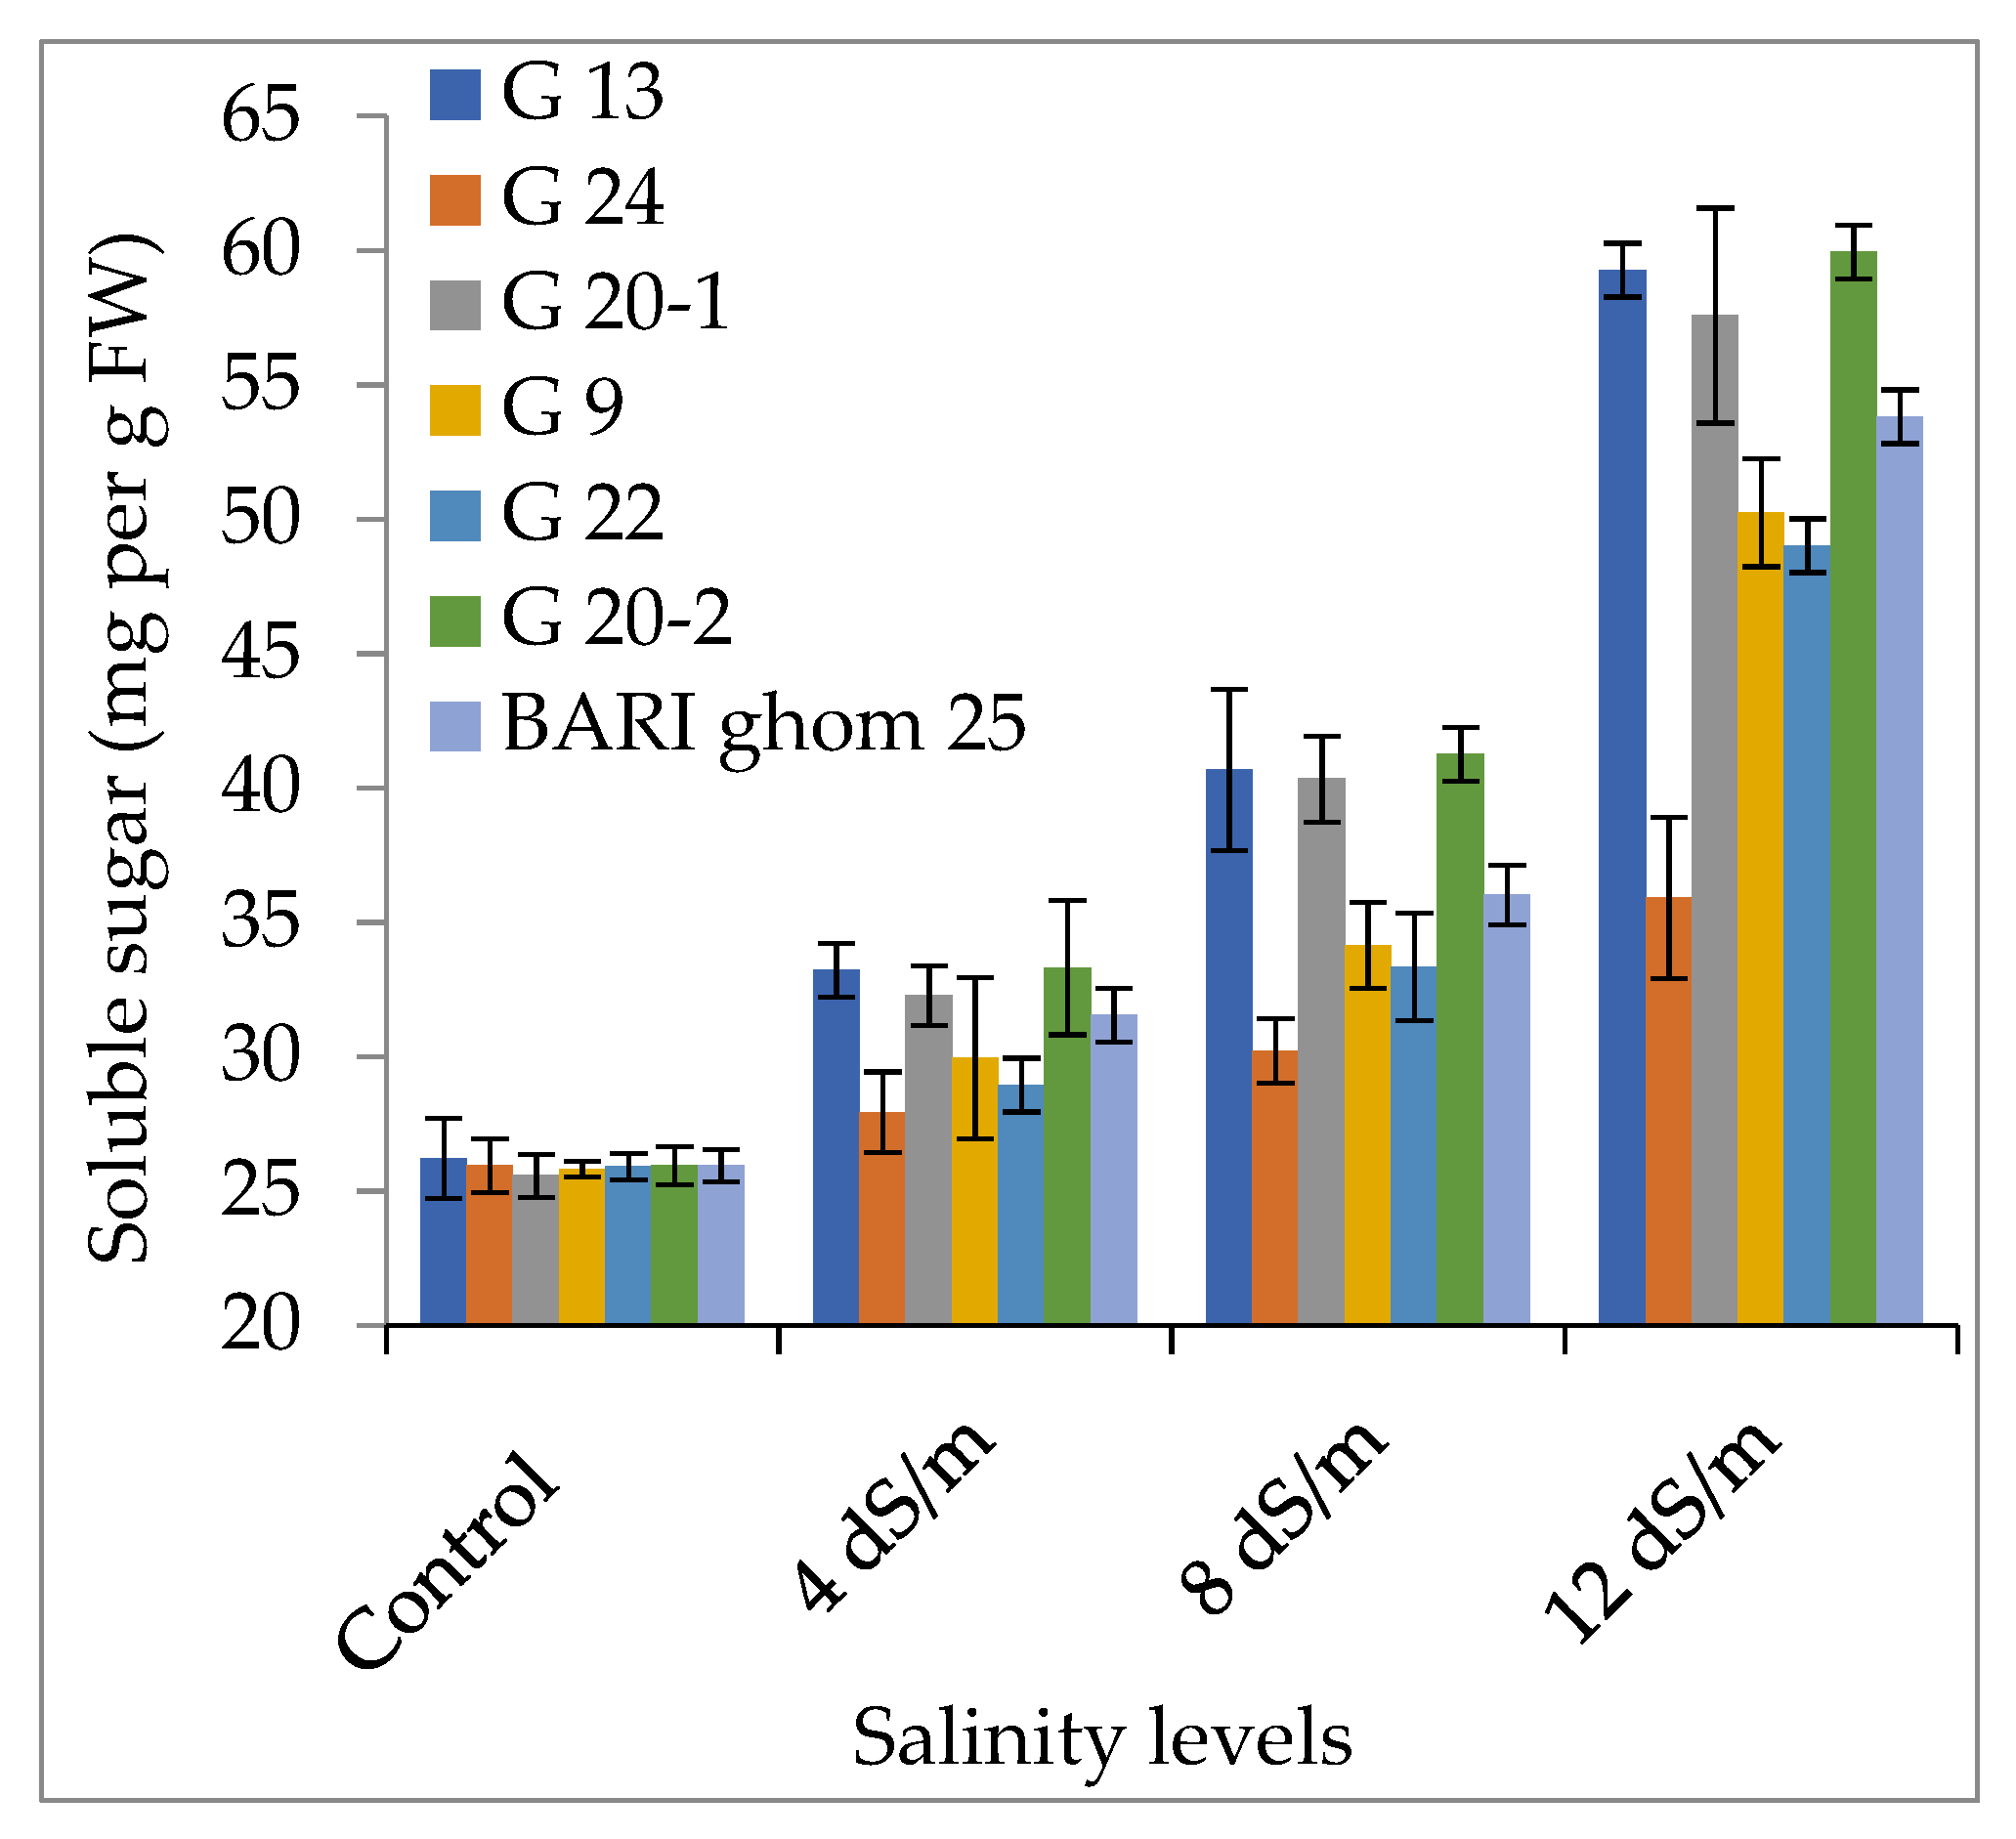
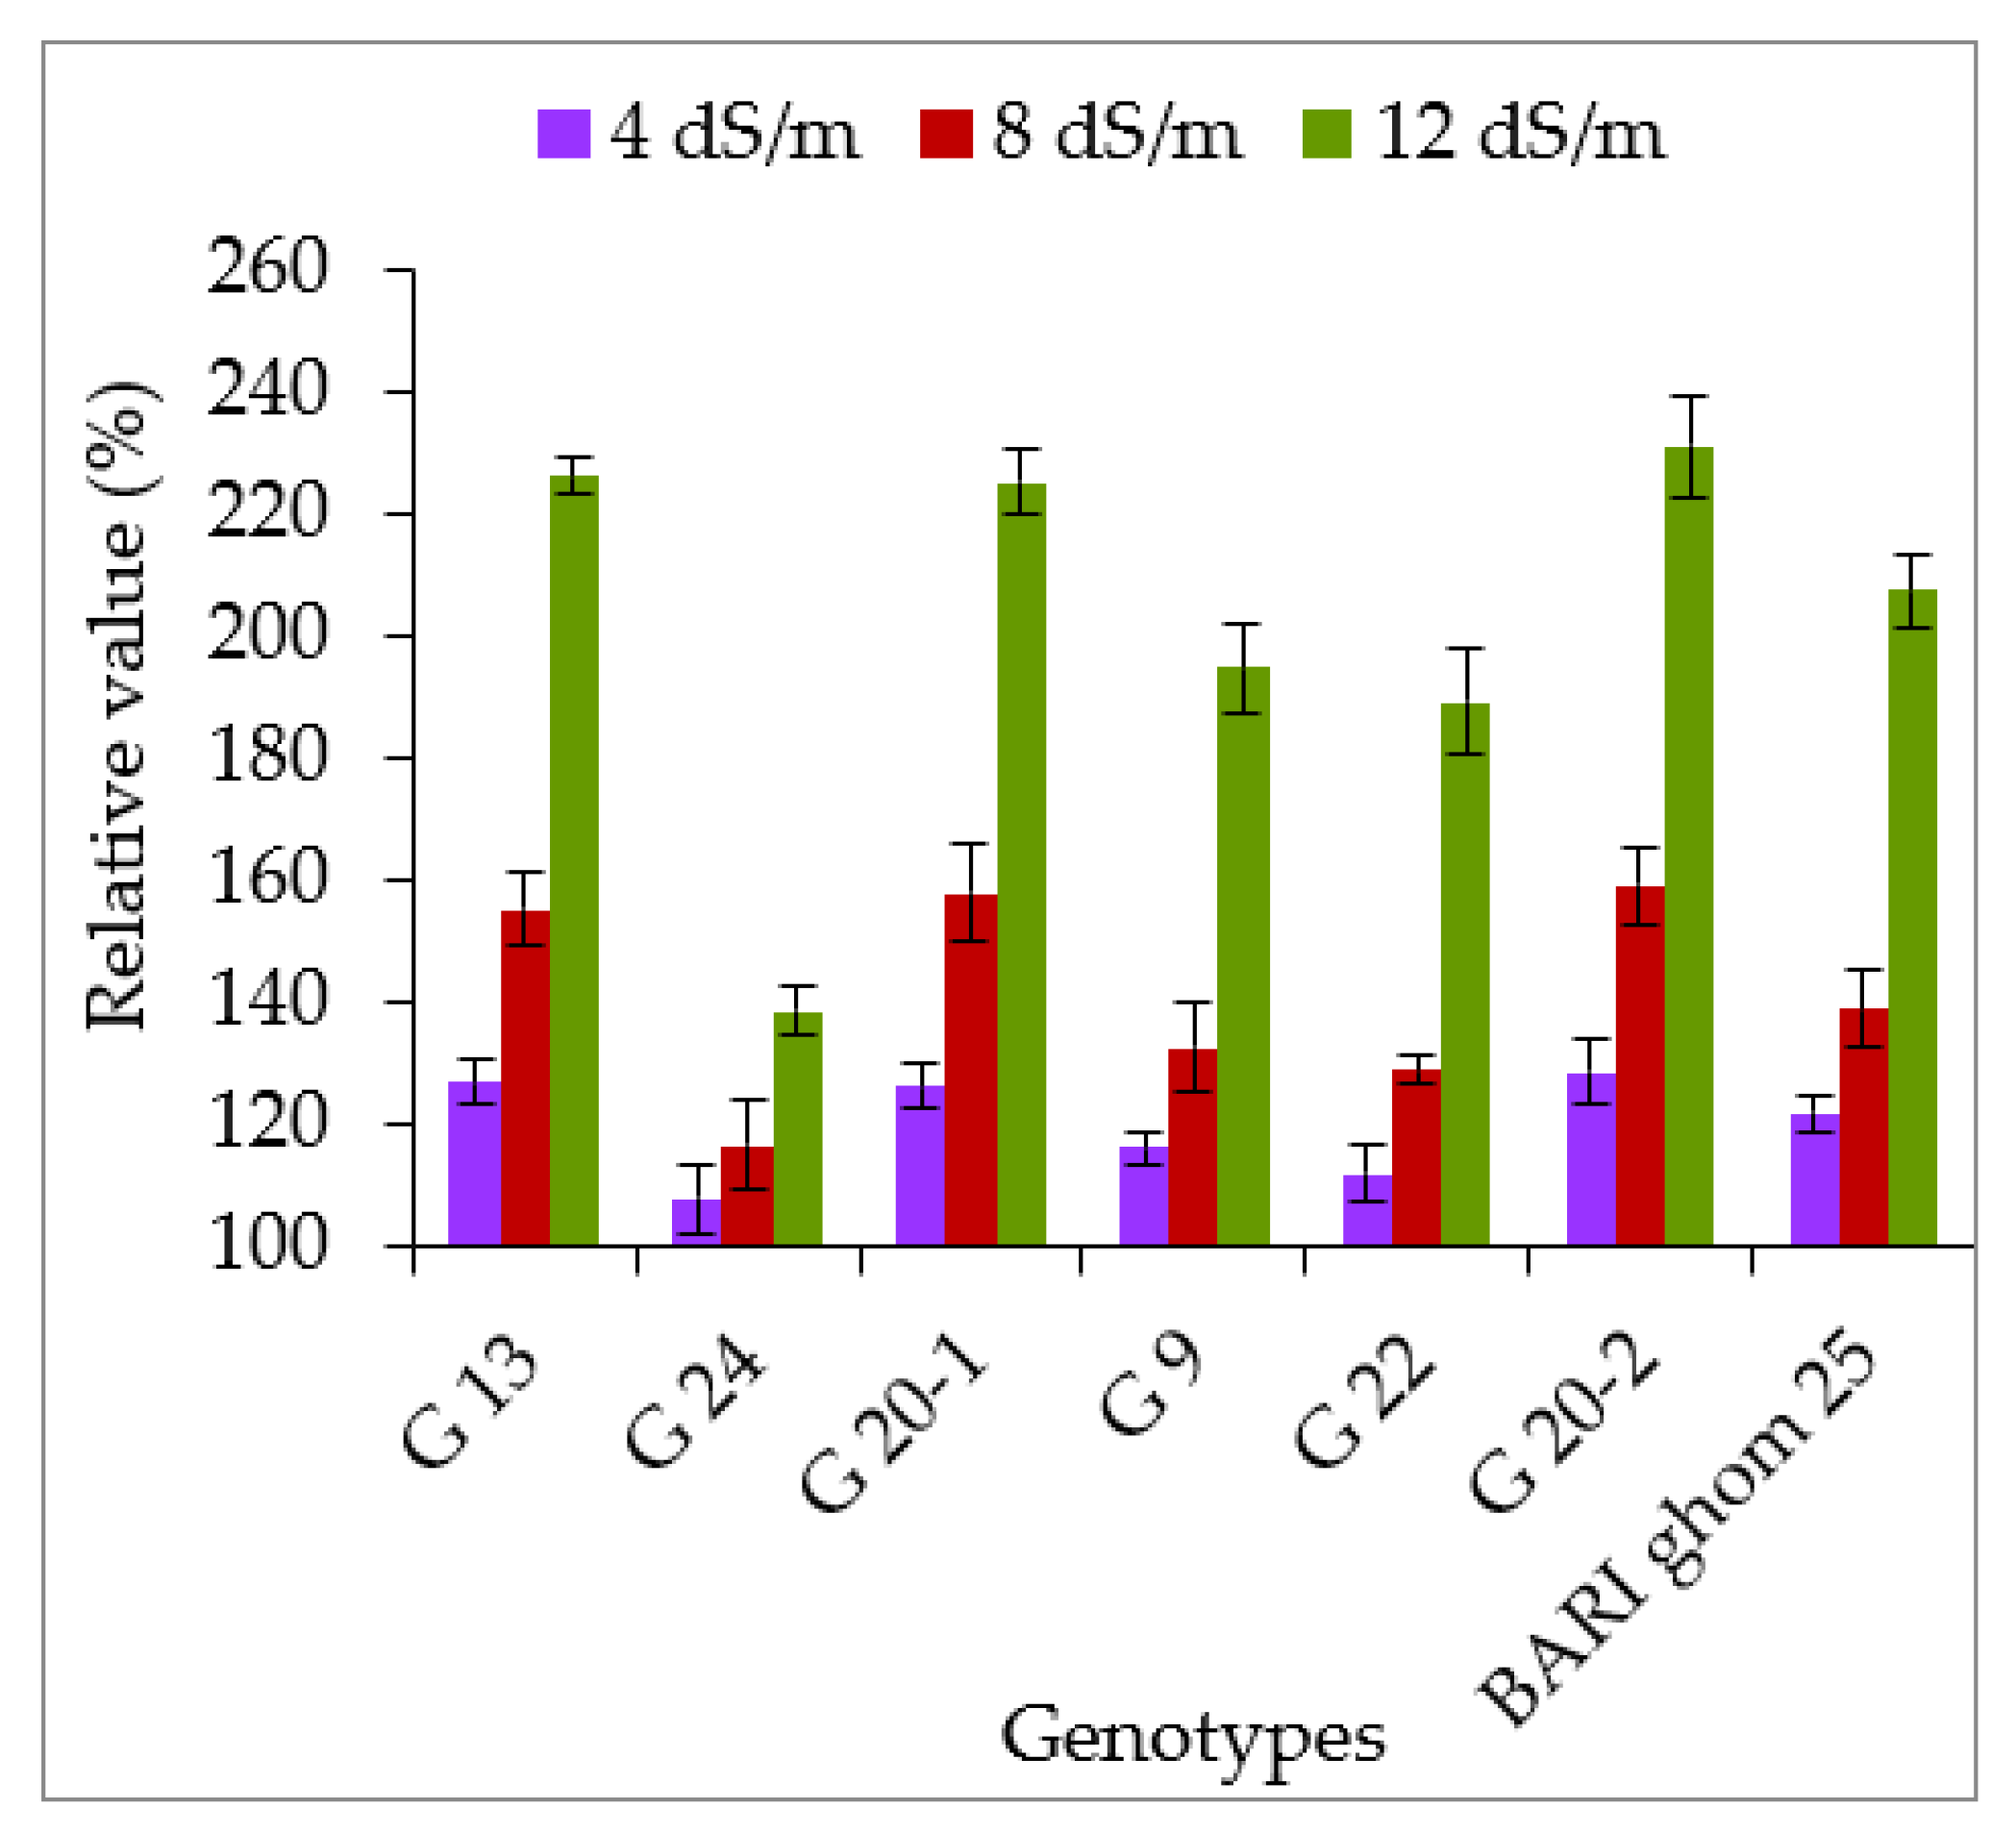
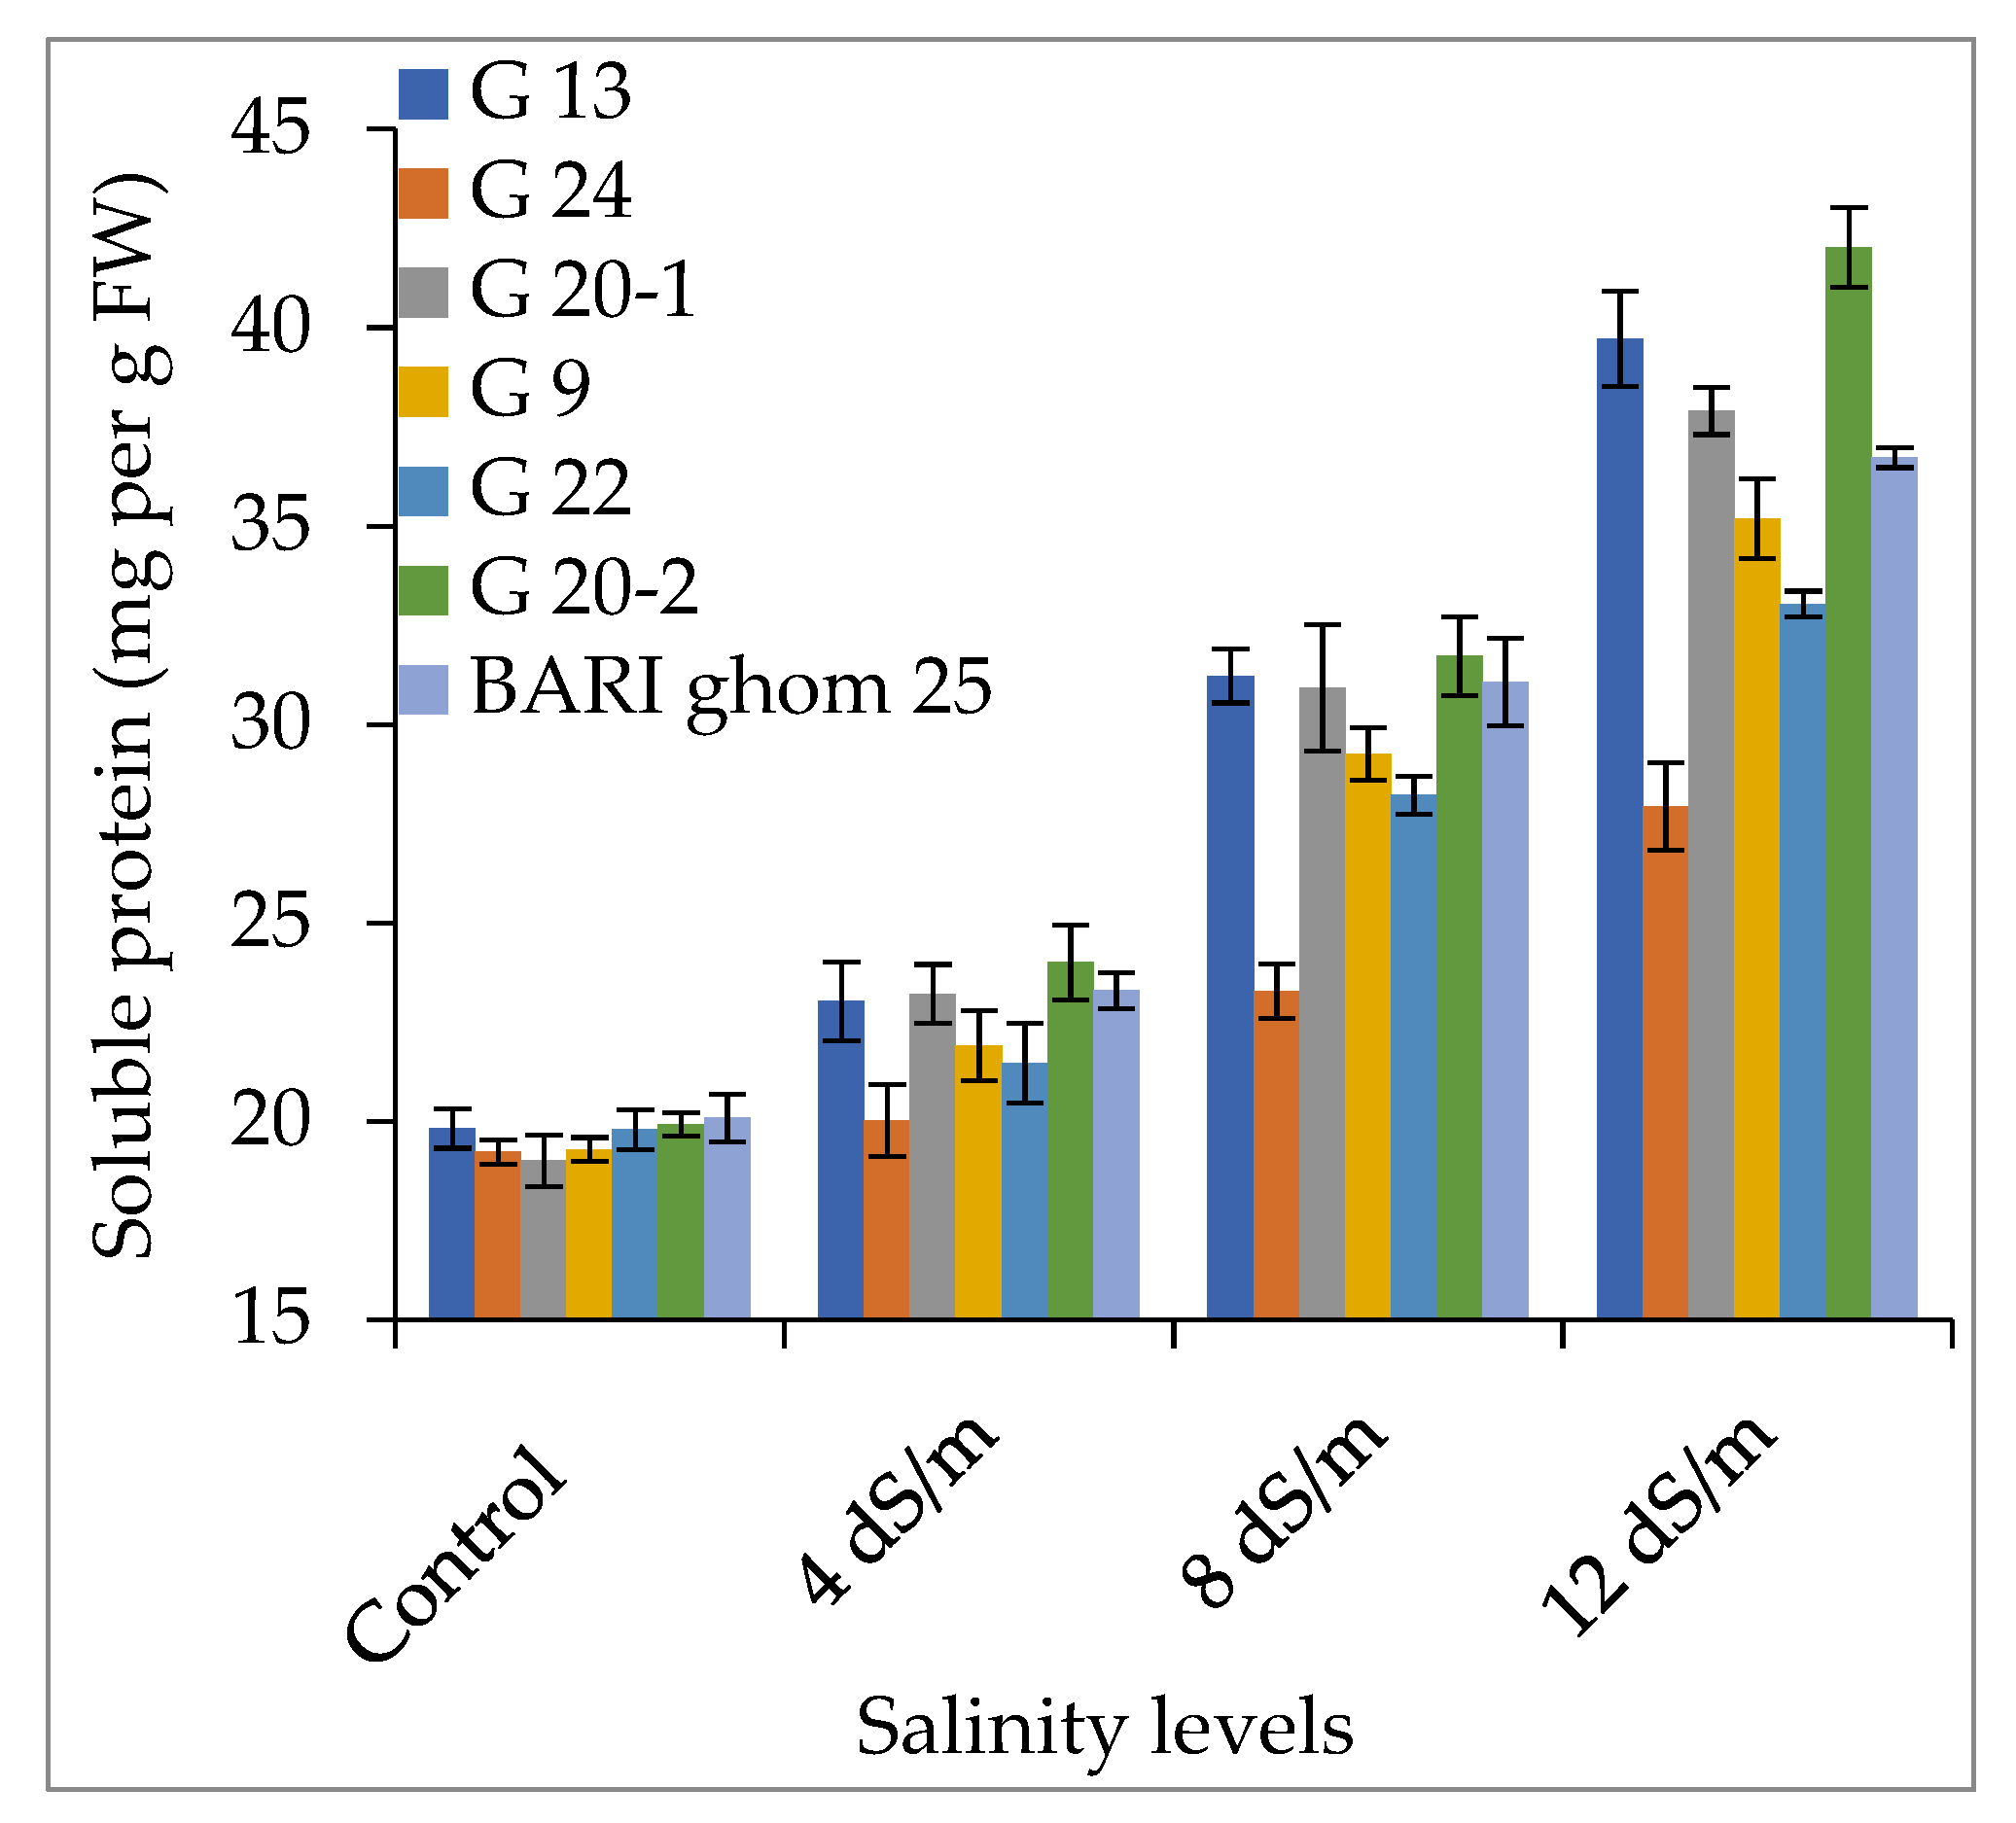
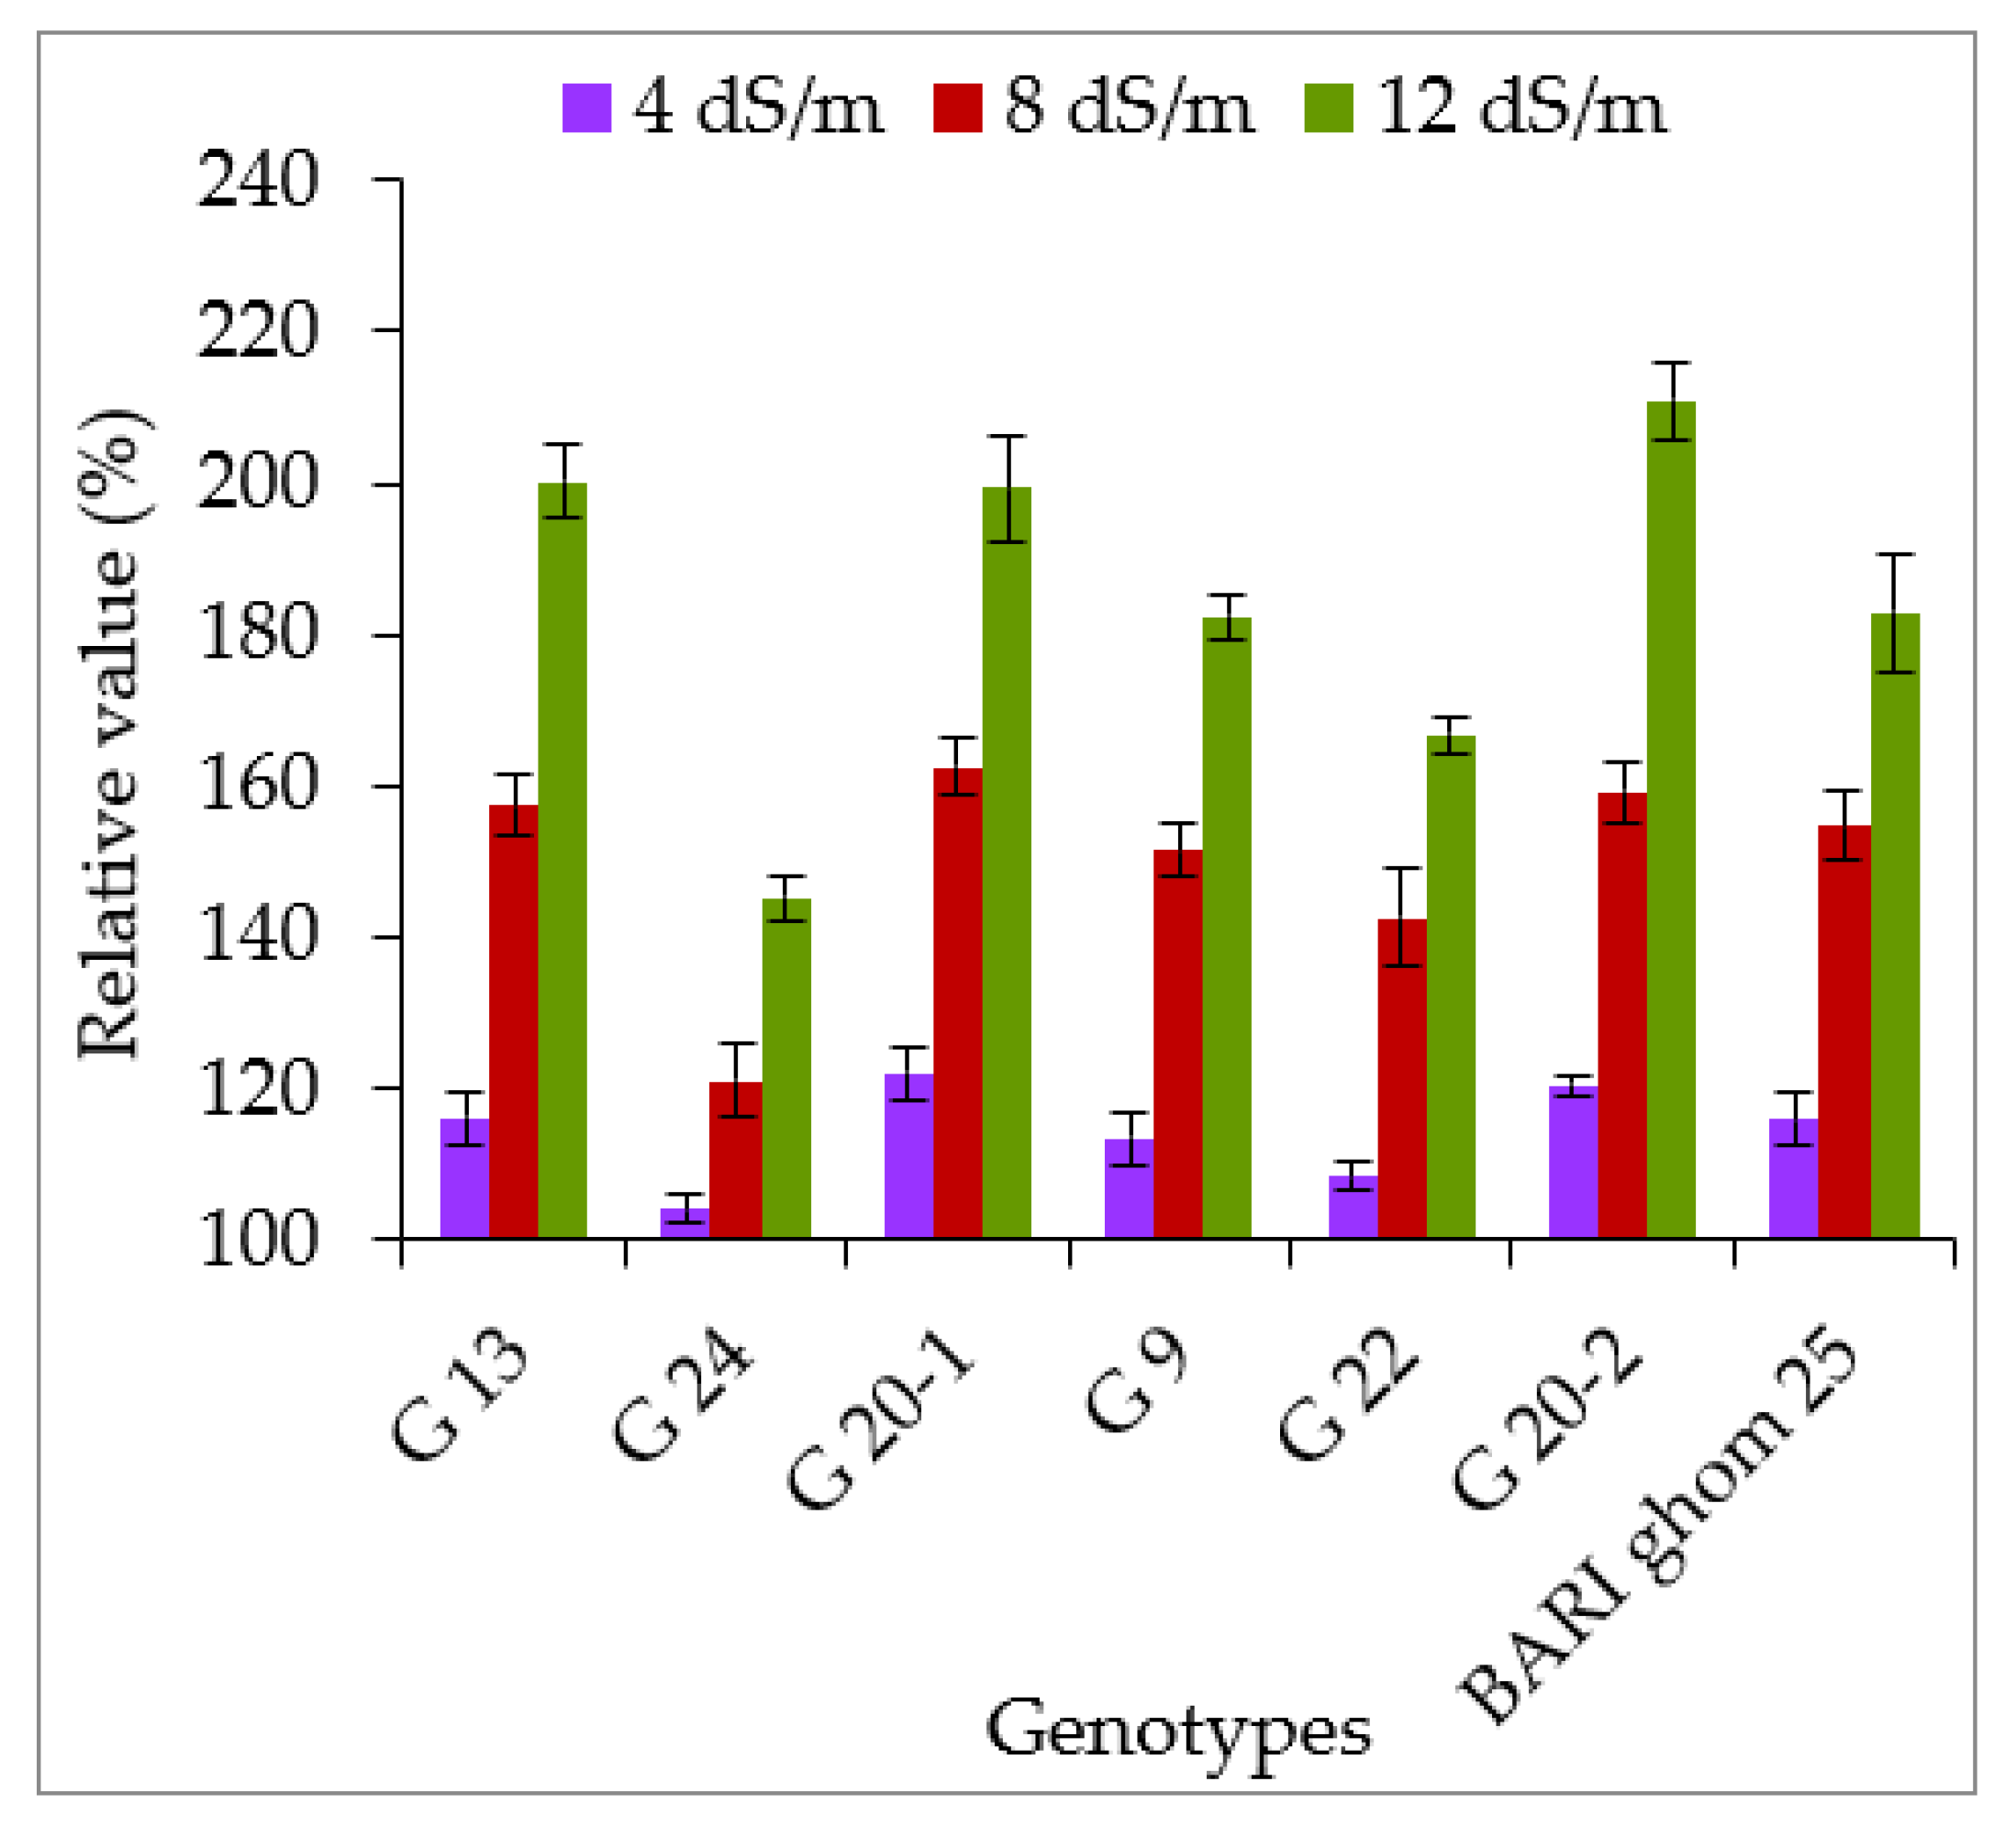
2.2.2. Soluble Sugar and Soluble Protein Accumulation

Salt stress significantly increased soluble sugar accumulation in all wheat genotypes (Figure 13). Under control conditions, soluble sugars accumulation was identical in all wheat genotypes. However, genotype G 20-2 showed the highest sugars accumulation 33.32, 41.25 and 59.95 mg g−1 under 4, 8 and 12 dS m−1 salt stress, respectively, and genotype G 24 showed the lowest accumulation. Genotype G 20-2 also showed the highest relative value of sugar accumulation (128.38, 158.94 and 231.01% at 4, 8 and 12 dS m−1, respectively), followed by G 13 and G 20-1, and the lowest was observed in genotype G 24 (Figure 14).
Soluble proteins also significantly increased by increasing salinity level in all wheat genotypes (Figure 15). However, under 4, 8 and 12 dS m−1 salt stress, genotype G 20-2 showed the highest protein accumulation (24.01, 31.73 and 42.02 mg g−1, respectively), and the lowest protein accumulation was recorded in G 24. The relative value showed a significant difference among the genotypes (Figure 16). The highest relative value was recorded in genotype G 20-2 and it was 210.82% under 12 dS m−1 salinity level. The lowest relative value was found in G 24 and it was 145.30% at 12 dS m−1 salinity level.

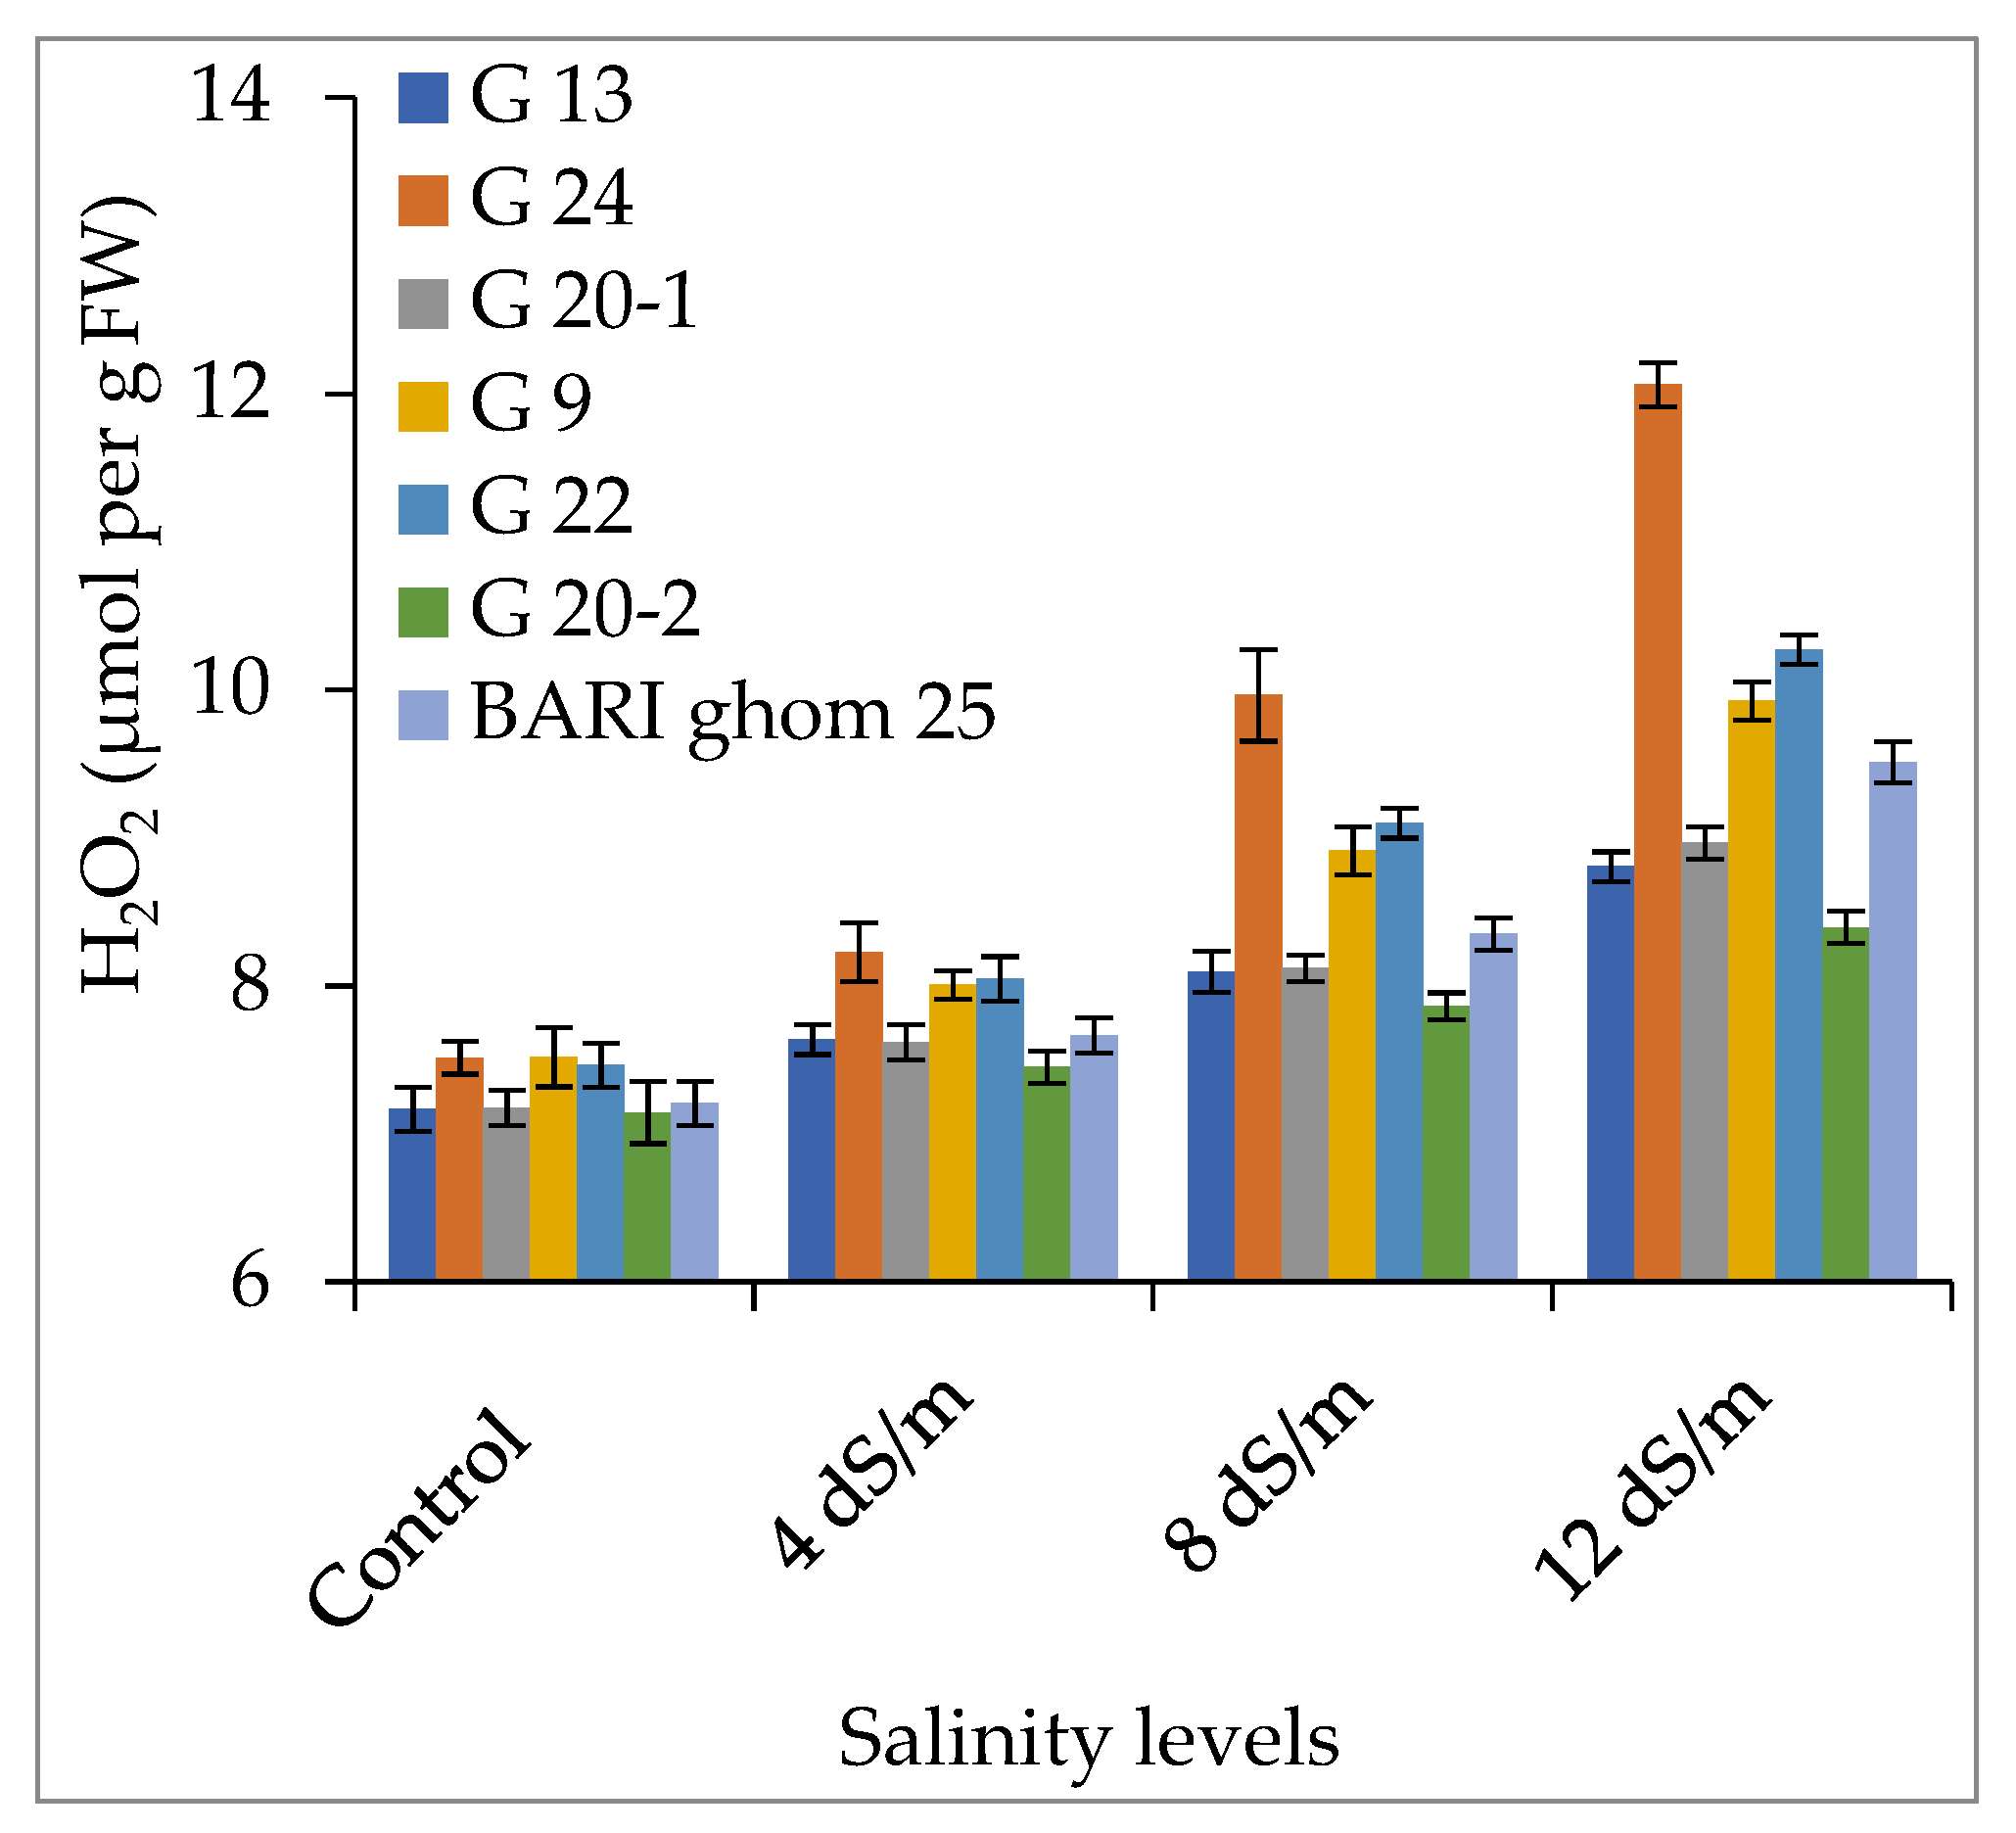
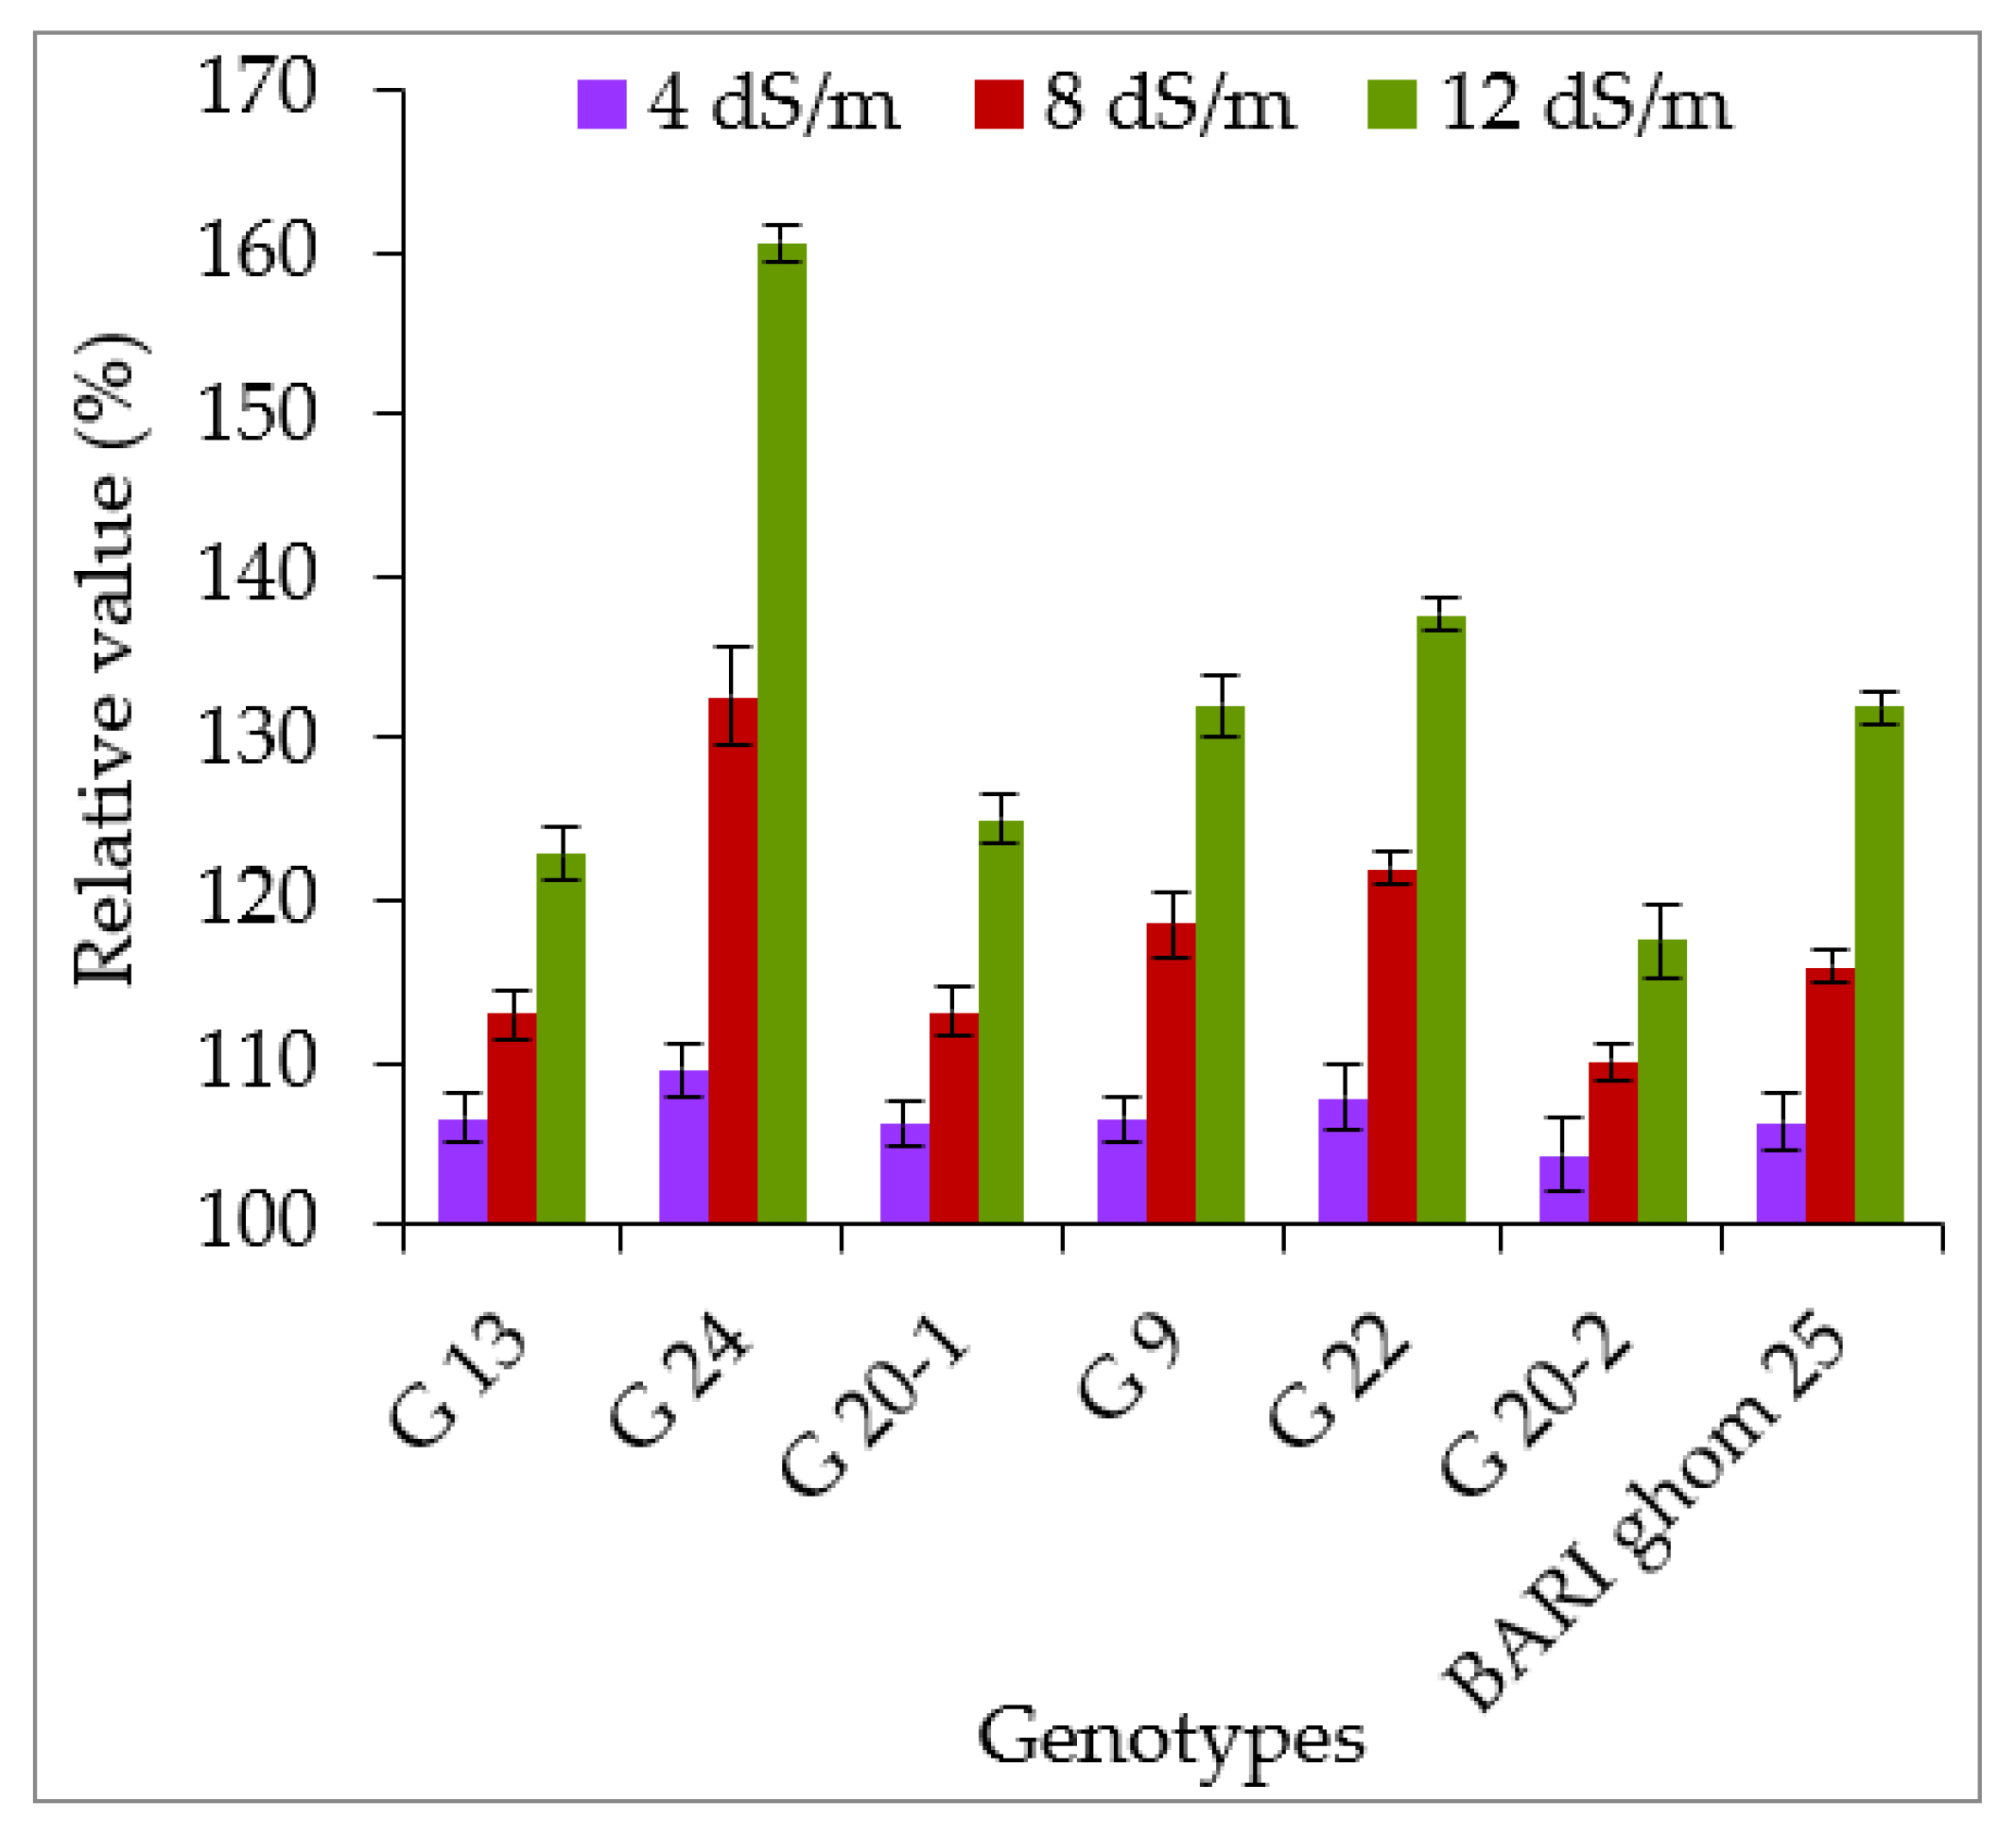
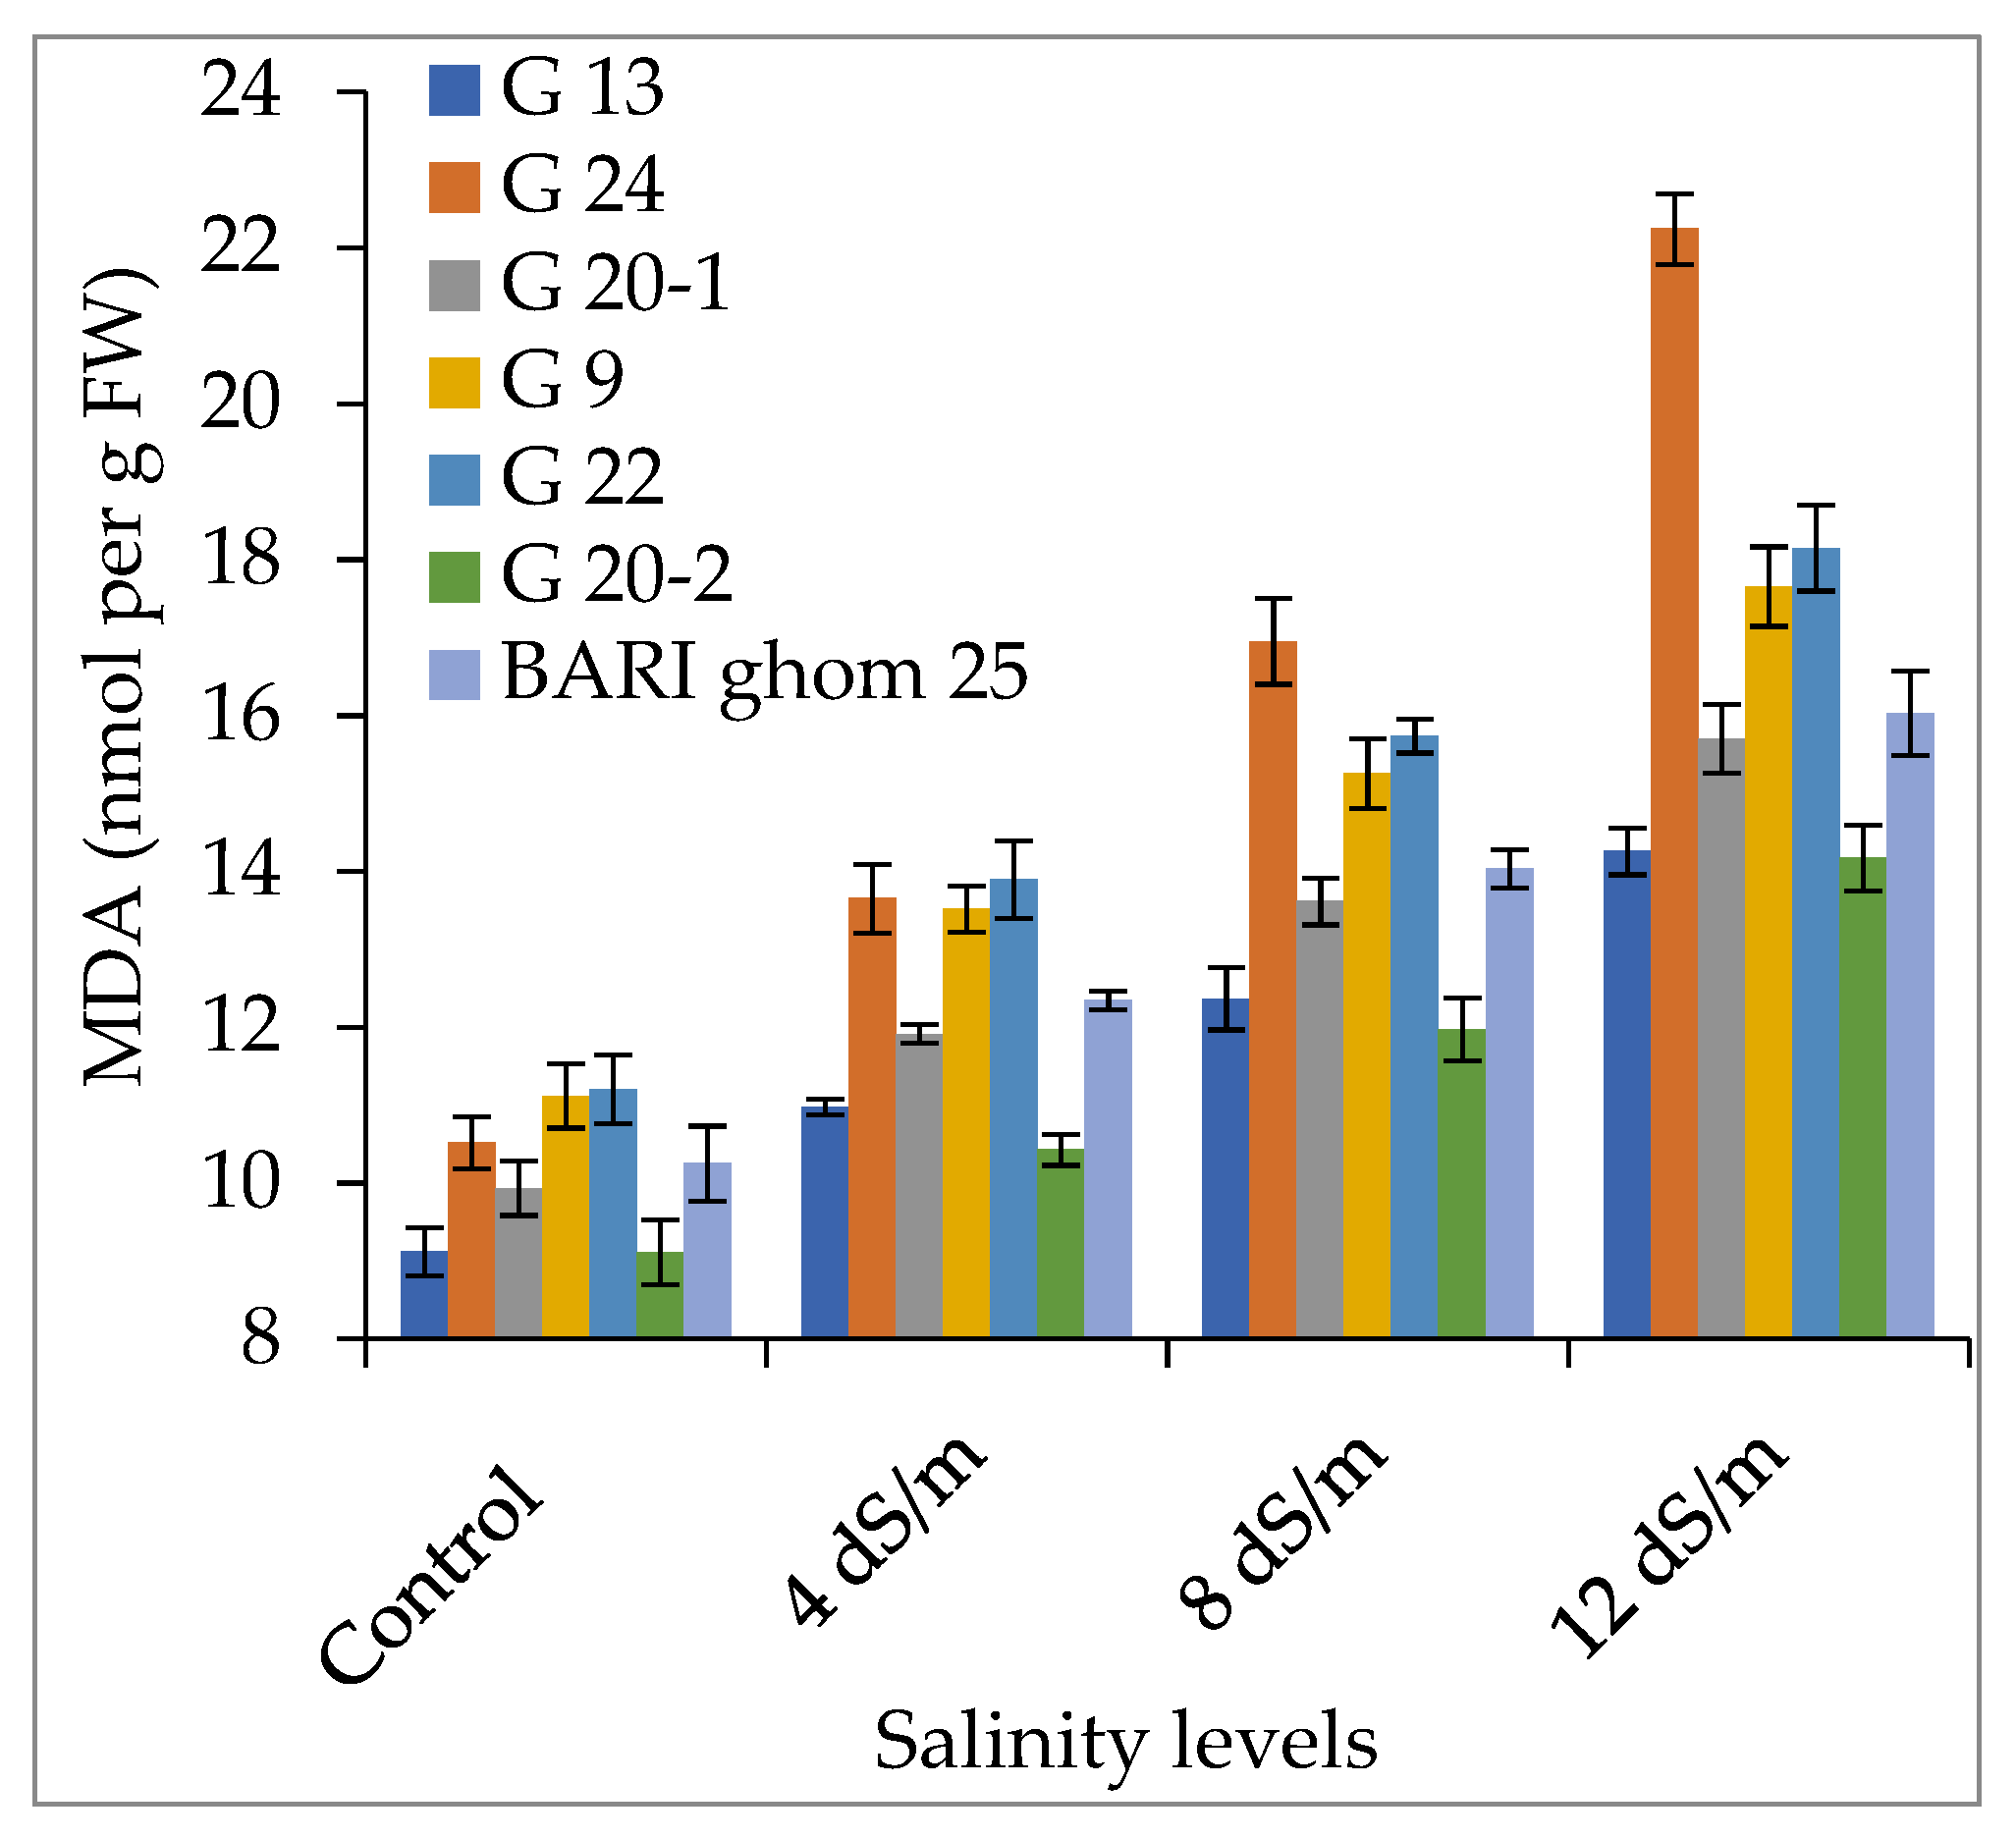
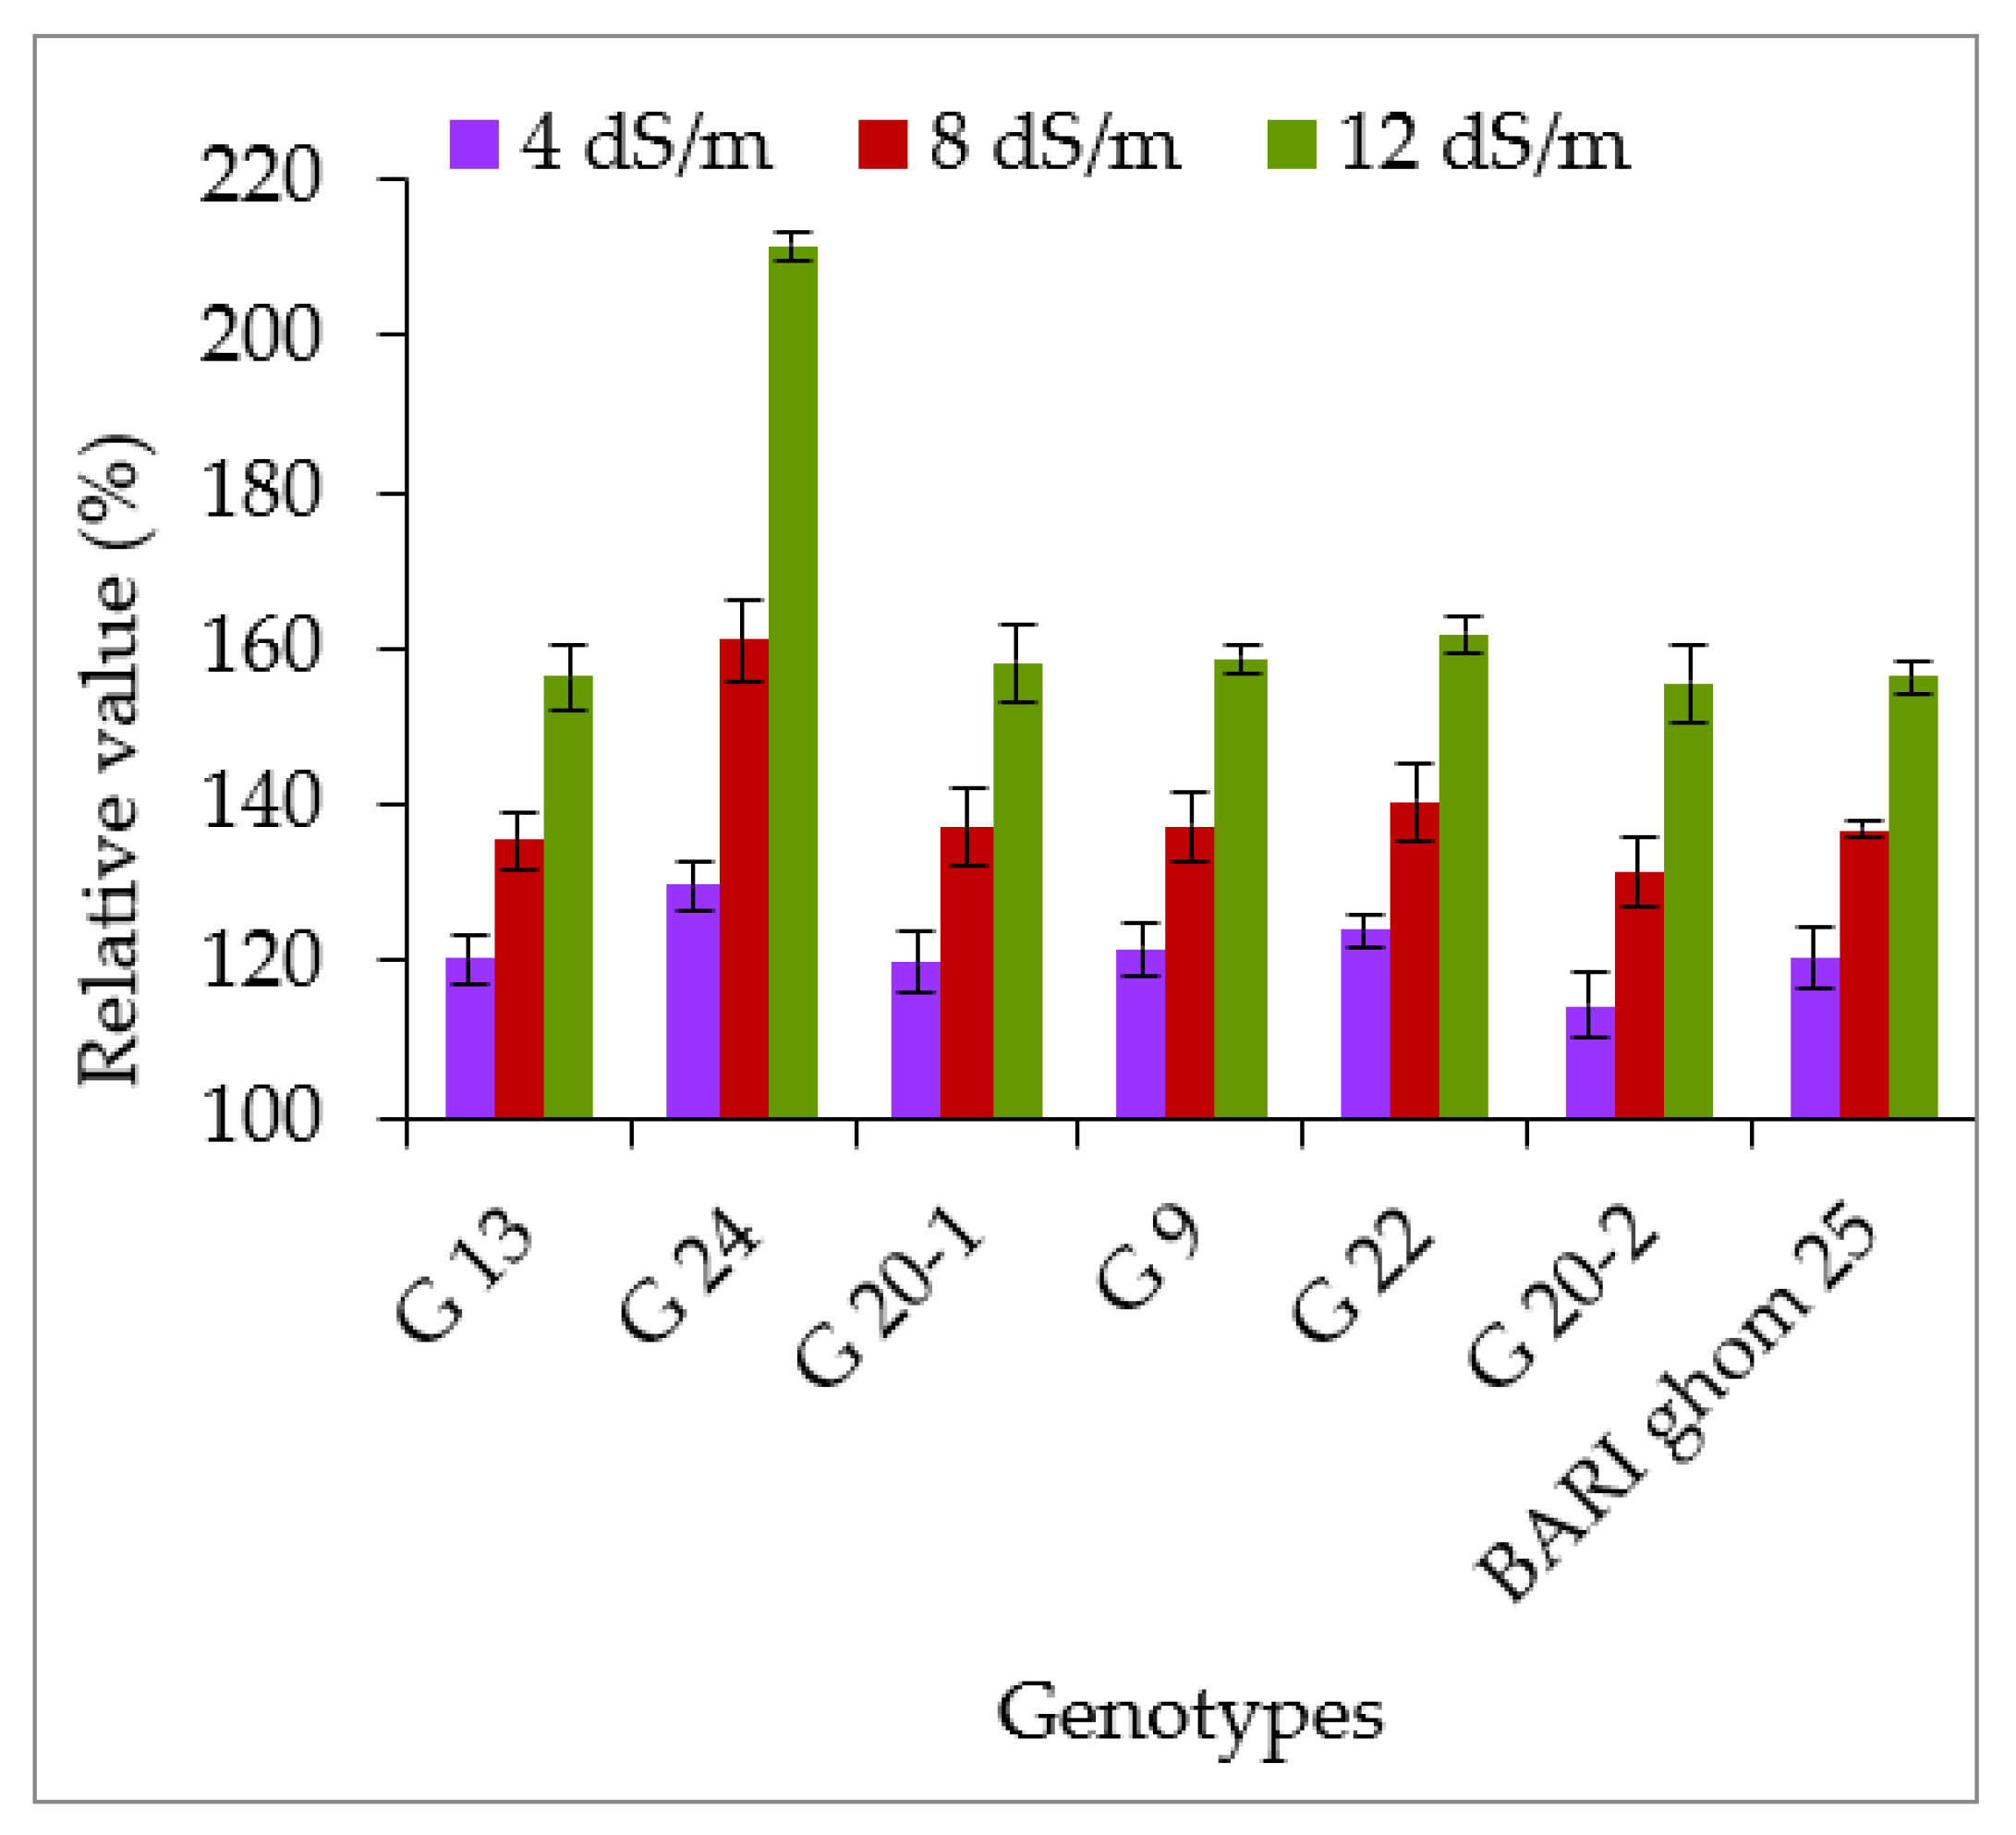
2.3. Accumulation of Hydrogen Peroxide and Malondialdehyde

Figure 17 shows that salt stress elevated hydrogen peroxide (H2O2) accumulation in all wheat genotypes. Genotype G 9 showed the highest accumulation of H2O2 (7.52) under control conditions, while genotype G 24 showed the highest accumulation of H2O2 (8.23, 9.96 and 12.06 µ mol g−1) under 4, 8, and 12 dS m−1 salt stress, respectively. However, genotype G 20-2 showed the lowest accumulation of H2O2 (7.45, 7.86 and 8.39 µ mol g−1) under 4, 8, and 12 dS m−1 salt stress, respectively. Genotype G 20-2 also showed the lowest relative value 117.52% at 12 dS m−1 salt stress and genotype G 24 showed the highest relative value 160.56% at 12 dS m−1 salt stress (Figure 18).
Melondealdehyde (MDA) is a widely used marker of oxidative stress. Salt stress significantly increased the MDA accumulation in all studied wheat genotypes (Figure 19). However, genotype G 20-2 showed the lowest accumulation of MDA (10.43, 11.97 and 14.17 nmol g−1) under 4, 8, and 12 dS m−1 salt stress, respectively, and genotype G 24 showed the highest accumulation of MDA. The relative value is another important indicator of salinity stress, which is shown in Figure 20. The highest relative value was found in G 24 in the case of all saline treatments and the lowest was found in G 20-2 genotype.

3. Discussion

3.1. Agro-Morphology and Yield of Wheat

Salt stress significantly reduced the plant height and spike length of wheat. Salinity stress inhibited the cell elongation, cell division, photosynthesis and nutrient uptake of plants and finally reduced plant height and spike length of wheat [38]. Ouhaddach et al. [39] reported that photosynthetic rate, transportation of compatible solutes and cell division decrease due to salinity limited the crop growth rate. Ibrahimova et al. [40] stated that total tillers and effective tillers are essential components of the yield. Salt stress significantly reduced the number of effective tillers at 12 dS m−1 salinity level. Asgari et al. [41] described the severe reduction in tiller numbers of wheat under salinity. This phenomenon is also supported by Asgari et al. [42], who reported that salinity stress critically influenced the development and viability of primary and secondary tillers. It was reported that salt stress inhibits the formation of tillers during their emergence and the rate of abortion increases at late stages [41]. The spike length of wheat genotypes was significantly reduced due to salinity stresses and there was significant difference among the wheat genotypes. Many researchers reported the high effectiveness of salinity on spike lengths of wheat [43,44,45,46]. Premature senescence of different plant parts occurs due to salt stress, which reduces the supply of assimilates to growing regions, ultimately reducing the length of the spikes [47]. Salinity stress significantly decreases the spikelet number spike−1 and grains spike−1 of all wheat genotypes. These results indicate that higher levels of salinity decrease filled grains spike−1 of wheat. Therefore, increased salinity resulted in an increased total number of empty grains spike−1, and hence decreased yield. Salinity stress causes early leaf senescence which causes assimilate shortage during grain filling stage and finally increase the number of empty grains [48]. It was reported that salinity reduces the translocation of soluble carbohydrates to primary and secondary spikelets, increases the accumulation of sodium and reduces the accumulation of potassium in all floral parts, inhibits the starch synthetase activity in grains of wheat, and finally reduces the seed set [49]. Ali et al. [50] also reported that ionic toxicity under salinity stress decreased pollen viability and finally reduced seed sets in the panicle. Spikelet numbers spike−1 declined with increasing salinity levels in different wheat genotypes and the salt-tolerant genotypes showed low reduction percentage (Table 3 and [41]). Thousand grain weight and grain yield of different wheat genotypes were significantly decreased with increasing salinity stress. Contents of photosynthetic pigments and soluble proteins in the ovaries might be reduced due to salt stress. As a result, ovary photosynthesis will be reduced and hence there is poor sugar production in the ovaries leading to lower yield [51]. It was reported that salinity stress reduces the number of fertile florets and inhibits the translocation of assimilate from shoot to panicles, consequently reducing grain weight [38]. It was also reported that salt stress causes retarded growth of the crops as a result of the low uptake of water and nutrients and reduces the yield and yield components [52,53]. Shamsi and Kobraee [54] reported that salinity significantly reduced 1000-grain weight in wheat, including lower reduction rates in tolerant genotypes compared to salt-susceptible ones.

3.2. Accumulation of Compatible Solutes

To alleviate the physiological damage under salt stress, plants accumulate osmolytic cytosolutes [44,55,56]. Proline is a well-known osmolyte which regulates the osmotic adjustment of plants under stress. Proline minimizes the production of ROS by scavenging free radicals, and hence plays a vital role in preventing salt stress-mediated oxidative damage and lowers the cell death. It stabilizes membrane structures, enzyme functions, and maintains water status, and as a result inhibits stress-induced damaging effects on cellular organelles [57,58,59]. Intercellular proline serves as an organic nitrogen reserve and provides tolerance towards stress. Figure 9 shows that compared to the control, proline accumulation was 2.0–2.5 times higher at lower salt stress and 3.0–5.5 times higher at higher salt stress conditions. Ouhaddach et al. [39] also stated that salt-tolerant variety accumulates more proline than salt-sensitive varieties, which is confirmed by the present study. They suggested that the proline content in wheat genotypes is probably a positive adaptive mechanism for overcoming the salt stress. Salinity stress significantly increased the accumulation of glycinebetaine (GB) in all wheat genotypes (Figure 11). Through osmoregulation or osmoprotection, GB reduced the intensity of abiotic stresses in plants [60]. In addition to other roles, GB activates some stress-related genes, inhibits ROS accumulation and protects photosynthetic machinery [61]. Proline and GB activate stress-related genes, regulate enzyme activity and buffer the photosynthetic machinery [62,63,64]. Both of these osmolytes neutralize and bring down the reactive oxygen species (ROS) and malondialdehyde (MDA) through increasing the enzyme activities associated with ROS scavenging [62,65].
The soluble sugar accumulation of all wheat genotypes was significantly increased due to salinity stress (Figure 13). Our results are also in agreement with Heshmat et al. [66], who stated that soil drenched with sea water significantly increased the total soluble sugars. Many other researchers also stated that salt stress increased the accumulation of carbohydrates such as sugars and starch [44,66,67]. Structural and functional changes of the membrane destruction of soluble proteins is prevented through accumulation of sugar under salt stress [49,68]. Shamsi and Kobraee [54] stated that there was more of an increase of soluble sugars in a tolerant variety than a salt sensitive variety. Soluble proteins also significantly increased with increasing salt stress conditions (Figure 15). Higher accumulation of proline and protein and higher peroxidase (POD) activity are the indicators of salinity tolerance [69,70]. Protein accumulations are particularly very much important for cell survival and cause membrane stabilization under salt stress conditions [69]. Due to salt stress, plants produce more proteins, which helps them to grow and develop under saline condition [71]. Salt-tolerant genotype (G 20-2) produced higher soluble proteins due to higher osmotic regulation mechanisms by reducing the sodium concentration in cell cytoplasm than the susceptible (G 24) genotype.

3.3. Hydrogen Peroxide and Malondialdehyde Accumulation

The accumulation of excess amounts of ROS and MDA are indicators of oxidative stress under salt stress [44,72,73]. Here, wheat genotypes were significantly different from each other regarding the accumulation of H2O2 (Figure 17). These results are similar to those found by Sairam et al. [74], who stated that salt-sensitive wheat cultivar accumulate significantly higher amounts of H2O2 and cause higher lipid peroxidation than the tolerant cultivar. Hasanuzzaman et al. [72] stated that a higher accumulation of ROS enhances the antioxidant defense. Therefore, ROS signaling is an important factor for stress tolerance in crops. In this study, increased amount of H2O2 accumulation was observed with increased salinity level in all wheat genotypes, which is similar to the results observed by Hasanuzzaman et al. [75]. However, at 12 dS m−1 salinity level, genotype G 20-2 showed the lowest accumulation of H2O2 and also the lowest relative value (117.52%) (Figure 18). Chunthaburee et al. [76] reported that higher H2O2 production was noted in the salt-susceptible cultivars and lower H2O2 production was noted in the salt-tolerant cultivars. In this study, a higher accumulation of MDA was observed in salt-sensitive wheat genotypes than the tolerant genotypes (Figure 19). Many researchers reported that less accumulation of MDA is a sign of stress tolerance [77,78,79]. ROS and MDA hamper cell membrane integrity in plants, which consequently increases electrolyte leakage. Furthermore, root damage under salt stress might be due to higher root electrolyte leakage resulting in osmotic suffering [80,81,82].

4. Materials and Methods

4.1. Plant Material and Treatment

On the basis of yield and yield contributing characters, five salt-tolerant genotypes (G 13, G 20-1, G 9, G 22, G 20-2), one susceptible (G 24) genotype and one check variety of wheat BARI ghom 25 (high yielding, salt-tolerant) were used as planting materials for this experiment. The experiments of this study were conducted at the Laboratory of Department of Agronomy, Bangabandhu Sheikh Mujibur Rahman Agricultural University (BSMRAU), Gazipur 1706, Bangladesh. Sodium hypochlorite @ 2.5% was used for seed sterilization. After being germinated on filter paper in Petri plates, four seedlings were transplanted to plastic pots (20 L). The seedlings were nourished with full strength Hoagland nutrient solution, as stated by Hoagland and Arnon [83]. Thirty days after sowing (DAS), different salt treatments (4, 8 and 12 dS m−1) were applied by a modified Hoagland solution during the whole period of study. Only Hoagland’s nutrient solution was provided to control plants. Therefore, the treatment combinations were: control (0 dS m−1); 4 dS m−1 NaCl; 8 dS m−1 NaCl and 12 dS m−1 NaCl. The experimental pots were positioned in a completely randomized design with five replications.

4.2. Assessment of Yield Contributing Parameters and Yield

The wheat was harvested at maturity. Yield data were recorded from each pot. Plant height was measured by scale after harvest. Total tillers and effective tiller number plant−1 were counted from five plants per replication of each genotype of all the treatments. Then the number was computed to per plant. Spikes from five harvested plants of each replication were taken and the total number of spikelets was counted and averaged per spike. Wheat grains yield was recorded on a 14% moisture basis.

4.3. Proline and Glycine Betaine (GB) Determination

Proline content was measured as described previously by Bates et al. [84].
Determination of glycinebetaine content was performed according to the method of Grieve and Grattan [85].

4.4. Soluble Sugar and Soluble Protein Determination

Soluble sugar content was measured according to Yoshida et al. [86].
Soluble protein content was determined as described previously by Lowry et al. [87].

4.5. Determination of Hydrogen Peroxide and Melondealdehyde

Hydrogen peroxide (H2O2) was estimated as described previously by Velikova et al. [88].
Malondialdehyde (MDA) was estimated as described previously by Madhava Rao and Sresty [89].

4.6. Statistical Analysis

Statistics 10 software was used for statistical evaluation of the collected data. The data were analyzed using the analysis of variance (ANOVA) technique and comparison of the mean difference was carried out by the least significant difference (LSD) test with a 5% level of significance.

5. Conclusions

In this study, we observed the agro-morphology, yield and biochemical response of different wheat genotypes under four salt concentrations. This study revealed that different wheat genotypes suffered differently from growth, yield and other yield related parameters from salt exposure. Salt stress significantly increased the accumulation of ROS, which causes lipid peroxidation (MDA). However, genotypes G 20-2 followed by G 13 and G 20-1 accumulated a significantly higher amount of proline, glycinebetain, soluble sugars, soluble proteins, and less H2O2 and MDA. Genotypes G 20-2 followed by G 13, G 20-1 also showed significantly higher yield. Based on the above results, genotypes G 20-2, G 13 and G 20-1 might be considered as potential for developing salt-tolerant wheat variety.

Author Contributions

Conceptualization, M.M.I., M.M.H. and A.S.; methodology, M.M.I., M.M.H., G.K.M.M.R. and A.S.; validation, M.M.I. and A.S.; formal analysis, A.S., E.Z., U.K.G., T.A.U., M.B.M. and M.A.A.M.; data curation: M.M.I., A.S., T.A.U., M.B.M. and E.Z.; writing—original draft preparation, A.S., M.M.I., U.K.G. and M.A.A.M.; writing—review and editing, M.M.H., G.K.M.M.R., M.M.R., M.Z.U.K., M.A.I. and Y.M.; visualization, M.M.I. and A.S.; supervision, M.M.I. and M.M.H.; project administration, M.M.I. and M.M.H.; funding acquisition, M.M.I. All authors have read and agreed to the published version of the manuscript.

Funding

This research received no external funding.

Institutional Review Board Statement

Not applicable.

Informed Consent Statement

Not applicable.

Data Availability Statement

The data are contained within the article.

Acknowledgments

Authors would like to extend their sincere appreciation to the Department of Agronomy, Bangabandhu Sheikh Mujibur Rahman Agricultural University, Bangladesh, for technical support of the research work.

Conflicts of Interest

The authors declare that they have no conflict of interest.

References

  1. Reynolds, N.P.; Martin, J.M.; Giroux, M.J. Increased wheat grain hardness conferred by novel puroindoline haplotypes from Aegilopstauschii. Crop Sci. 2010, 50, 1718–1727. [Google Scholar] [CrossRef]
  2. Shewry, P.R. Wheat. J. Exp. Bot. 2009, 60, 1537–1553. [Google Scholar] [CrossRef] [PubMed]
  3. Shahzad, A.; Iqbal, M.; Asif, M.; Hirani, A.H.; Goyal, A. Growing wheat on saline lands: Can a dream come true? Aust. J. Crop Sci. 2013, 7, 515–524. [Google Scholar]
  4. Munns, R.; Tester, M. Mechanisms of salinity tolerance. Annu. Rev. Plant Biol. 2008, 59, 651. [Google Scholar] [CrossRef] [Green Version]
  5. Breiman, A.; Graur, D. Wheat evolution. Isr. J. Plant Sci. 1995, 43, 85–98. [Google Scholar] [CrossRef]
  6. Haque, S.A. Salinity problems and crop production in coastal regions of Bangladesh. Pak. J. Bot. 2006, 38, 1359–1365. [Google Scholar]
  7. Ibrahim, M.; Zaman, M.A.U.; Mostafizur, A.B.M.; Shahidullah, S.M. Diversity of crops and land use pattern in Barisal region. Bangladesh Rice J. 2017, 21, 57–72. [Google Scholar] [CrossRef]
  8. Abdallah, M.S.; Abdelgawad, Z.A.; El-Bassiouny, H.M.S. Alleviation of the adverse effects of salinity stress using trehalose in two rice varieties. S. Afr. J. Bot. 2016, 103, 275–282. [Google Scholar] [CrossRef]
  9. Akbarimoghaddam, H.; Galavi, M.; Ghanbari, A.; Panjehkeh, N. Salinity effects on seed germination and seedling growth of bread wheat cultivars. Trakia J. Sci. 2011, 9, 43–50. [Google Scholar]
  10. Mbarki, S.; Sytar, O.; Cerda, A.; Zivcak, M.; Rastogi, A.; He, X.; Zoghlami, A.; Abdelly, C.; Brestic, M. Strategies to mitigate the salt stress effects on photosynthetic apparatus and productivity of crop plants. In Salinity Responses and Tolerance in Plants; Springer: New York, NY, USA, 2018; Volume 1, pp. 85–136. [Google Scholar]
  11. Safdar, H.; Amin, A.; Shafiq, Y.; Ali, A.; Yasin, R.; Shoukat, A.; Hussan, M.U.; Sarwar, M.I. A review: Impact of salinity on plant growth. Nat. Sci. 2019, 17, 34–40. [Google Scholar]
  12. Muhammad, Z.; Hussain, F. Effect of NaCl salinity on the germination and seedling growth of seven wheat genotypes. Pak. J. Bot. 2012, 44, 1845–1850. [Google Scholar]
  13. Munns, R. Physiological processes limiting plant growth in saline soils: Some dogmas and hypotheses. Plant Cell Environ. 1993, 16, 15–24. [Google Scholar] [CrossRef]
  14. Ashraf, M.F.M.R.; Foolad, M.R. Roles of glycine betaine and proline in improving plant abiotic stress resistance. Environ. Exp. Bot. 2007, 59, 206–216. [Google Scholar] [CrossRef]
  15. Ashraf, M. Biotechnological approach of improving plant salt tolerance using antioxidants as markers. Biotechnol. Adv. 2009, 27, 84–93. [Google Scholar] [CrossRef]
  16. Nawaz, K.; Hussain, K.; Majeed, A.; Khan, F.; Afghan, S.; Ali, K. Fatality of salt stress to plants: Morphological, physiological and biochemical aspects. Afr. J. Biotechnol. 2010, 9, 34. [Google Scholar]
  17. Rahnama, A.; James, R.A.; Poustini, K.; Munns, R. Stomatal conductance as a screen for osmotic stress tolerance in durum wheat growing in saline soil. Funct. Plant Biol. 2010, 37, 255–263. [Google Scholar] [CrossRef]
  18. Xiong, L.; Zhu, J.K. Molecular and genetic aspects of plant responses to osmotic stress. Plant Cell Environ. 2002, 25, 131–139. [Google Scholar] [CrossRef] [Green Version]
  19. Gupta, S.K.; Goyal, M.R.; Singh, A. Physiological and biochemical changes in plants under soil salinity stress: A review. In Engineering Practices Management Soil Salinity; Apple Academic Press: Palm Bay, FL, USA, 2018; pp. 159–200. [Google Scholar]
  20. Munns, R.; James, R.A.; Läuchli, A. Approaches to increasing the salt tolerance of wheat and other cereals. J. Exp. Bot. 2006, 57, 1025–1043. [Google Scholar] [CrossRef] [Green Version]
  21. Munns, R. Comparative physiology of salt and water stress. Plant Cell Environ. 2002, 25, 239–250. [Google Scholar] [CrossRef] [Green Version]
  22. Navarro, A.; Bañon, S.; Olmos, E.; Sánchez-Blanco, M.D.J. Effects of sodium chloride on water potential components, hydraulic conductivity, gas exchange and leaf ultrastructure of Arbutus unedo plants. Plant Sci. 2007, 172, 473–480. [Google Scholar] [CrossRef]
  23. Bohnert, H.J.; Nelson, D.E.; Jensen, R.G. Adaptations to environmental stresses. Plant Cell. 1995, 7, 1099. [Google Scholar] [CrossRef] [PubMed]
  24. Hoque, M.A.; Banu, M.N.A.; Okuma, E.; Amako, K.; Nakamura, Y.; Shimoishi, Y.; Murata, Y. Exogenous proline and glycinebetaine increase NaCl-induced ascorbate–glutathione cycle enzyme activities, and proline improves salt tolerance more than glycinebetaine in tobacco Bright Yellow-2 suspension-cultured cells. J. Plant Physiol. 2007, 164, 1457–1468. [Google Scholar] [CrossRef] [PubMed]
  25. Ahmad, P.; Jaleel, C.A.; Sharma, S. Antioxidant defense system, lipid peroxidation, proline-metabolizing enzymes, and biochemical activities in two Morusalba genotypes subjected to NaCl stress. Russ. J. Plant Physiol. 2010, 57, 509–517. [Google Scholar] [CrossRef]
  26. Hossain, M.A.; Munemasa, S.; Uraji, M.; Nakamura, Y.; Mori, I.C.; Murata, Y. Involvement of endogenous abscisic acid in methyl jasmonate-induced stomatal closure in Arabidopsis. Plant Physiol. 2011, 156, 430–438. [Google Scholar] [CrossRef] [PubMed] [Green Version]
  27. Nounjan, N.; Nghia, P.T.; Theerakulpisut, P. Exogenous proline and trehalose promote recovery of rice seedlings from salt-stress and differentially modulate antioxidant enzymes and expression of related genes. J. Plant Physiol. 2012, 169, 596–604. [Google Scholar] [CrossRef] [PubMed]
  28. Tahir, M.A.; Aziz, T.; Farooq, M.; Sarwar, G. Silicon-induced changes in growth, ionic composition, water relations, chlorophyll contents and membrane permeability in two salt-stressed wheat genotypes. Arch. Agron. Soil Sci. 2012, 58, 247–256. [Google Scholar] [CrossRef]
  29. Khan, M.A.; Ungar, I.A.; Showalter, A.M. Effects of sodium chloride treatments on growth and ion accumulation of the halophyte Haloxylonrecurvum. Commun. Soil Sci. Plant Anal. 2000, 31, 2763–2774. [Google Scholar] [CrossRef]
  30. Wang, Y.; Nii, N. Changes in chlorophyll, ribulosebisphosphate carboxylase-oxygenase, glycine betaine content, photosynthesis and transpiration in Amaranthus tricolor leaves during salt stress. J. Hortic. Sci. Biotechnol. 2000, 75, 623–627. [Google Scholar] [CrossRef]
  31. Kerepesi, I.; Galiba, G. Osmotic and salt stress-induced alteration in soluble carbohydrate content in wheat seedlings. Crop Sci. 2000, 40, 482–487. [Google Scholar] [CrossRef]
  32. Saxena, S.C.; Kaur, H.; Verma, P.; Petla, B.P.; Andugula, V.R.; Majee, M. Osmoprotectants: Potential for crop improvement under adverse conditions. In Plant Acclimation to Environmental Stress; Springer: New York, NY, USA, 2013; pp. 197–232. [Google Scholar]
  33. Ben Ahmed, C.; Ben Rouina, B.; Sensoy, S.; Boukhriss, M.; Ben Abdullah, F. Exogenous proline effects on photosynthetic performance and antioxidant defense system of young olive tree. J. Agric. Food Chem. 2010, 58, 4216–4222. [Google Scholar] [CrossRef]
  34. Shamsi, K.; Kobraee, S. Biochemical Responses of Three Iranian Bread Wheat Cultivars (Triticum aestivum L.) to Salinity Stress. Glob. J. Pure Appl. Sci. 2014, 2, 42–45. [Google Scholar]
  35. Hayat, S.; Hayat, Q.; Alyemeni, M.N.; Wani, A.S.; Pichtel, J.; Ahmad, A. Role of proline under changing environments: A review. Plant Signal. Behav. 2012, 7, 1456–1466. [Google Scholar] [CrossRef] [PubMed] [Green Version]
  36. Zheng, C.; Jiang, D.; Liu, F.; Dai, T.; Jing, Q.; Cao, W. Effects of salt and waterlogging stresses and their combination on leaf photosynthesis, chloroplast ATP synthesis, and antioxidant capacity in wheat. Plant Sci. 2009, 176, 575–582. [Google Scholar] [CrossRef]
  37. Ali, Q.; Javed, M.T.; Noman, A.; Haider, M.Z.; Waseem, M.; Iqbal, N.; Waseem, M.; Shah, M.S.; Shahzad, F.; Perveen, R. Assessment of drought tolerance in mung bean cultivars/lines as depicted by the activities of germination enzymes, seedling’s antioxidative potential and nutrient acquisition. Arch. Agron. Soil Sci. 2018, 64, 84–102. [Google Scholar] [CrossRef]
  38. Ashik, T.; Islam, M.M.; Rana, M.S.; Jahan, K.; Urmi, T.A.; Jahan, N.A.; Rahman, M.M. Evaluation of Salinity Tolerant Wheat (Triticum aestivum L.) Genotypes through Multivariate Analysis of Agronomic Traits. Agric. Sci. Dig. 2021. [Google Scholar] [CrossRef]
  39. Ouhaddach, M.; ElYacoubi, H.; Douaik, A.; Rochdi, A. Morpho-physiological and biochemical responses to salt stress in wheat (Triticum aestivum L.) at the heading stage. J. Mater. Environ. Sci. 2018, 9, 1899–1907. [Google Scholar]
  40. Ibrahimova, U.; Suleymanova, Z.; Brestic, M.; Mammadov, A.; Ali, O.M.; Abdel Latef, A.A.H.; Hossain, A. Assessing the Adaptive Mechanisms of Two Bread Wheat (Triticum aestivum L.) Genotypes to Salinity Stress. Agronomy 2021, 11, 1979. [Google Scholar] [CrossRef]
  41. Asgari, H.R.; Cornelis, W.; Damme, P.V. Effect of salinity on wheat (Triticum aestivum L.) grain yield, yield components and ion uptake. Desert 2012, 16, 169–175. [Google Scholar]
  42. Asgari, H.R.; Cornelis, W.; Damme, P.V. Salt stress effect on wheat (Triticum aestivum L.) growth and leaf ion concentrations. Int. J. Plant Prod. 2012, 195–208. [Google Scholar]
  43. Abbas, G.; Saqib, M.; Rafique, Q.; Rahman, A.U.; Akhtar, J.; Haq, M.A.; Nasim, M. Effect of salinity on grain yield and grain quality of wheat (Triticum aestivum L.). Pak. J. Bot. 2013, 50, 185–189. [Google Scholar]
  44. Sadak, M.S. Physiological role of trehalose on enhancing salinity tolerance of wheat plant. Bull. Natl. Res. Cent. 2019, 43, 1–10. [Google Scholar]
  45. Kalhoro, N.A.; Rajpar, I.; Kalhoro, S.A.; Ali, A.; Raza, S.; Ahmed, M.; Kalhoro, F.A.; Ramzan, M.; Wahid, F. Effect of salts stress on the growth and yield of wheat (Triticum aestivum L.). Am. J. Plant Sci. 2016, 7, 2257–2271. [Google Scholar] [CrossRef]
  46. Chamekh, Z.; Ayed, S.; Sahli, A.; Ayadi, S.; Hammemi, Z.; Jallouli, S.; Trifa, Y.; Amara, H.; Abidi, W.; Zeballos, J.L.; et al. Eff ect of salt stress on the flag leaf area and yield components in twenty five durum wheat genotypes (Triticum turgidum ssp. durum). J. New Sci. 2014, 6, 15–23. [Google Scholar]
  47. Islam, M.M.; Faruqe, M.H.; Rana, M.S.; Akter, M.; Karim, M.A. Screening of rice (Oryza sativa L.) genotypes at reproductive stage for their tolerance to salinity. Agriculturists 2018, 16, 65–77. [Google Scholar] [CrossRef] [Green Version]
  48. Aref, F.; Rad, H.E. Physiological characterization of rice under salinity stress during vegetative and reproductive stages. Indian J. Sci. Technol. 2012, 5, 2578–2586. [Google Scholar]
  49. Darko, E.; Gierczik, K.; Hudaak, O.; Forgoa, P.; Paal, M.; Tuerkoesi, E. Differing metabolic responses to salt strein wheat-barley addition lines containing different 7H chromosomal fragments. PLoS ONE 2017, 12, e0174170. [Google Scholar] [CrossRef] [Green Version]
  50. Ali, Q.; Daud, M.K.; Haider, M.Z.; Ali, S.; Rizwan, M.; Aslam, N.; Noman, A.; Iqbal, N.; Shahzad, F.; Deeba, F.; et al. Seed priming by sodium nitroprusside improves salt tolerance in wheat (Triticum aestivum L.) by enhancing physiological and biochemical parameters. Plant Physiol. Biochem. 2017, 119, 50–58. [Google Scholar] [CrossRef] [PubMed]
  51. Seleiman, M.F.; Aslam, M.T.; Alhammad, B.A.; Hassan, M.U.; Maqbool, R.; Chattha, M.U.; Khan, I.; Gitari, H.I.; Uslu, O.S.; Rana, R.; et al. Salinity stress in wheat: Effects, mechanisms and management strategies. Phyton 2022, 91, 667. [Google Scholar]
  52. Munns, R.; Schachtman, D.P.; Condon, A.G. The significance of a two-phase growth response to salinity in wheat and barley. Funct. Plant Biol. 1995, 22, 561–569. [Google Scholar] [CrossRef]
  53. Heshmat, S.A.; Zakaria, A.B.; Omar, A.E.S.; Hanan, E.G. Efficacy of seawater salinity on osmotic adjustment and solutes allocation in wheat (Triticum aestivum) flag leaf during grain filling. Int. J. Plant Physiol. Biochem. 2012, 4, 33–45. [Google Scholar]
  54. Shamsi, K.; Kobraee, S. Biochemical and physiological responses of three wheat cultivars (Triticum aestivum L.) to salinity stress. Ann. Biol. Res. 2013, 4, 180–185. [Google Scholar]
  55. Sun, K.; Hunt, K.; Hauser, B.A. Ovule abortion in Arabidopsis triggered by stress. Plant Physiol. 2004, 135, 2358–2367. [Google Scholar] [CrossRef] [PubMed] [Green Version]
  56. Per, T.S.; Khan, N.A.; Reddy, P.S.; Masood, A.; Hasanuzzaman, M.; Khan, M.I.R.; Anjum, N.A. Approaches in modulating prolinemetabolism in plants for salt and drought stress tolerance: Phytohormones, mineral nutrients and transgenics. Plant Physiol. Biochem. 2017, 115, 126–140. [Google Scholar] [CrossRef] [PubMed]
  57. Banu, M.N.A.; Hoque, M.A.; Watanabe-Sugimoto, M.; Matsuoka, K.; Nakamura, Y.; Shimoishi, Y.; Murata, Y. Proline and glycinebetaine induce antioxidant defense gene expression and suppress cell death in cultured tobacco cells under salt stress. J. Plant Physiol. 2009, 166, 146–156. [Google Scholar] [CrossRef]
  58. Ahanger, M.A.; Agarwal, R.M. Salinity stress induced alterations in antioxidant metabolism and nitrogen assimilation in wheat (Triticum aestivum L.) as influenced by potassium supplementation. Plant Physiol. Biochem. 2017, 115, 449–460. [Google Scholar] [CrossRef]
  59. Kibria, M.G.; Hossain, M.; Murata, Y.; Hoque, M.A. Antioxidant defense mechanisms of salinity tolerance in rice genotypes. Rice Sci. 2017, 24, 155–162. [Google Scholar] [CrossRef]
  60. Giri, J. Glycinebetaine and abiotic stress tolerance in plants. Plant Signal. Behav. 2011, 6, 1746–1751. [Google Scholar] [CrossRef]
  61. Chen, T.H.; Murata, N. Enhancement of tolerance of abiotic stress by metabolic engineering of betaines and other compatible solutes. Curr. Opin. Plant Biol. 2002, 5, 250–257. [Google Scholar] [CrossRef]
  62. Chen, T.H.; Murata, N. Glycinebetaine: An effective protectant against abiotic stress in plants. Trends Plant Sci. 2008, 13, 499–505. [Google Scholar] [CrossRef]
  63. Szabados, L.; Savouré, A. Proline: A multifunctional amino acid. Trends Plant Sci. 2010, 15, 89–97. [Google Scholar] [CrossRef]
  64. Reddy, P.S.; Jogeswar, G.; Rasineni, G.K.; Maheswari, M.; Reddy, A.R.; Varshney, R.K.; Kishor, P.K. Proline over-accumulation alleviates salt stress and protects photosynthetic and antioxidant enzyme activities in transgenic sorghum [Sorghum bicolor L. Moench]. Plant Physiol. Biochem. 2015, 94, 104–113. [Google Scholar] [CrossRef] [Green Version]
  65. Bhaskara, G.B.; Yang, T.H.; Verslues, P.E. Dynamic proline metabolism: Importance and regulation in water limited environments. Front. Plant Sci. 2015, 6, 484. [Google Scholar] [CrossRef] [PubMed] [Green Version]
  66. Parida, A.; Das, A.B.; Das, P. NaCl stress causes changes in photosynthetic pigments, proteins, and other metabolic components in the leaves of a true mangrove, Bruguiera parviflora, in hydroponic cultures. J. Plant Biol. 2002, 45, 28–36. [Google Scholar] [CrossRef]
  67. Krasensky, J.; Jonak, C. Drought, salt, and temperature stress-induced metabolic rearrangements and regulatory networks. J. Exp. Bot. 2012, 63, 1593–1608. [Google Scholar] [CrossRef] [PubMed] [Green Version]
  68. Ashraf, M.; Harris, P.J.C. Potential biochemical indicators of salinity tolerance in plants. Plant Sci. 2004, 166, 3–16. [Google Scholar] [CrossRef]
  69. Goudarzi, M.; Pakniyat, H. Evaluation of wheat cultivars under salinity stress based on some agronomic and physiological traits. J. Agric. Soc. Sci. 2008, 4, 35–38. [Google Scholar]
  70. Parida, A.K.; Das, A.B. Salt tolerance and salinity effects on plants: A review. Ecotoxicol. Environ. Saf. 2005, 60, 324–349. [Google Scholar] [CrossRef]
  71. Flowers, T.J.; Yeo, A.R. Breeding for salinity resistance in crop plants: Where next? Funct. Plant Biol. 1995, 22, 875–884. [Google Scholar] [CrossRef]
  72. Hasanuzzaman, M.; Alam, M.; Rahman, A.; Hasanuzzaman, M.; Nahar, K.; Fujita, M. Exogenous proline and glycine betaine mediated upregulation of antioxidant defense and glyoxalase systems provides better protection against salt-induced oxidative stress in two rice (Oryza sativa L.) varieties. BioMed Res. Int. 2014, 2014, 757219. [Google Scholar] [CrossRef] [Green Version]
  73. Manai, J.; Gouia, H.; Corpas, F.J. Redox and nitric oxide homeostasis are affected in tomato (Solanum lycopersicum) roots under salinity-induced oxidative stress. J. Plant Physiol. 2014, 171, 1028–1035. [Google Scholar] [CrossRef]
  74. Sairam, R.K.; Rao, K.V.; Srivastava, G.C. Differential response of wheat genotypes to long term salinity stress in relation to oxidative stress, antioxidant activity and osmolyte concentration. Plant Sci. 2002, 163, 1037–1046. [Google Scholar] [CrossRef]
  75. Hasanuzzaman, M.; Hossain, M.A.; Fujita, M. Nitric oxide modulates antioxidant defense and the methylglyoxal detoxifi cation system and reduces salinity-induced damage of wheat seedlings. Plant Biotechnol. Rep. 2011, 5, 353–365. [Google Scholar] [CrossRef]
  76. Chunthaburee, S.; Dongsansuk, A.; Sanitchon, J.; Pattanagul, W.; Theerakulpisut, P. Physiological and biochemical parameters for evaluation and clustering of rice cultivars differing in salt tolerance at seedling stage. Saudi J. Biol. Sci. 2016, 23, 467–477. [Google Scholar] [CrossRef] [PubMed] [Green Version]
  77. Liang, Y.; Chen, Q.I.N.; Liu, Q.; Zhang, W.; Ding, R. Exogenous silicon (Si) increases antioxidant enzyme activity and reduces lipid peroxidation in roots of salt-stressed barley (Hordeum vulgare L.). J. Plant Physiol. 2003, 160, 1157–1164. [Google Scholar] [CrossRef]
  78. Brankova, L.; Ivanov, S.; Alexieva, V.; Karanov, E. Salt-induced alteration in the levels of some oxidative parameters and unspecific defence compounds in leaves of two plant species (cotton and bean) with different sensitivity to salinity. Comptes Rendus-Acad. Bulg. Sci. 2005, 58, 1307. [Google Scholar]
  79. Ashraf, M.A.; Ashraf, M.U.H.A.M.M.A.D.; Ali, Q. Response of two genetically diverse wheat cultivars to salt stress at different growth stages: Leaf lipid peroxidation and phenolic contents. Pak. J. Bot. 2010, 42, 559–565. [Google Scholar]
  80. Rasool, S.; Ahmad, A.; Siddiqi, T.O.; Ahmad, P. Changes in growth, lipid peroxidation and some key antioxidant enzymes in chickpea genotypes under salt stress. Acta Physiol. Plant. 2013, 35, 1039–1050. [Google Scholar] [CrossRef]
  81. Ahmad, P.; Abdel Latef, A.A.; Abd Allah, E.F.; Hashem, A.; Sarwat, M.; Anjum, N.A.; Gucel, S. Calcium and potassium supplementation enhanced growth, osmolyte secondary metabolite production, and enzymatic antioxidant machinery in cadmium-exposed chickpea (Cicerarietinum L.). Front. Plant Sci. 2016, 7, 513. [Google Scholar] [CrossRef] [Green Version]
  82. Rahman, A.; Nahar, K.; Hasanuzzaman, M.; Fujita, M. Calcium supplementation improves Na+/K+ ratio, antioxidant defense and glyoxalase systems in salt-stressed rice seedlings. Front. Plant Sci. 2016, 7, 609. [Google Scholar] [CrossRef] [Green Version]
  83. Hoagland, D.R.; Arnon, D.I. The water-culture method for growing plants without soil. Circular. Calif. Agric. Exp. Stn. 1950, 347, 32. [Google Scholar]
  84. Bates, L.S.; Waldren, R.P.; Teare, I.D. Rapid determination of free proline for water-stress studies. Plant Soil. 1973, 39, 205–207. [Google Scholar] [CrossRef]
  85. Grieve, C.M.; Grattan, S.R. Rapid assay for determination of water soluble quaternary ammonium compounds. Plant Soil. 1983, 70, 303–307. [Google Scholar] [CrossRef]
  86. Yoshida, S.; Coronel, V. Nitrogen nutrition, leaf resistance, and leaf photosynthetic rate of the rice plant. Soil Sci. Plant Nutr. 1976, 22, 207–211. [Google Scholar] [CrossRef] [Green Version]
  87. Lowry, O.H. Protein measurement with the Folin phenol reagent. J. Biol. Chem. 1951, 193, 265–275. [Google Scholar] [CrossRef] [PubMed]
  88. Velikova, V.; Yordanov, I.; Edreva, A. Oxidative stress and some antioxidant systems in acid rain-treated bean plants: Protective role of exogenous polyamines. Plant Sci. 2000, 151, 59–66. [Google Scholar] [CrossRef]
  89. Madhava Rao, K.V.; Sresty, T.V. Antioxidative parameters in the seedlings of pigeonpea (Cajanus cajan (L.) Millspaugh) in response to Zn and Ni stresses. Plant Sci. 2000, 157, 113–128. [Google Scholar] [CrossRef]
Figure 1. Reduction (%) of plant height of wheat genotypes under various salinity levels. The vertical bar indicates average of five independent replicates (n = 5). Error bars represent standard error.
Agronomy 12 03027 g001
Figure 2. Reduction (%) of total tillers of wheat genotypes under various salinity levels. The vertical bar indicates average of five independent replicates (n = 5). Error bars represent standard error.
Agronomy 12 03027 g002
Figure 3. Reduction (%) of effective tillers of wheat genotypes under various salinity levels. The vertical bar indicates average of five independent replicates (n = 5). Error bars represent standard error.
Agronomy 12 03027 g003
Figure 4. Reduction (%) of spike length of wheat genotypes under various salinity levels. The vertical bar indicates average of five independent replicates (n = 5). Error bars represent standard error.
Agronomy 12 03027 g004
Figure 5. Reduction (%) of spikelets per spike of wheat genotypes under various salinity levels. The vertical bar indicates average of five independent replicates (n = 5). Error bars represent standard error.
Agronomy 12 03027 g005
Figure 6. Reduction (%) of grain per spike of wheat genotypes under various salinity levels. The vertical bar indicates average of five independent replicates (n = 5). Error bars represent standard error.
Agronomy 12 03027 g006
Figure 7. Reduction (%) of thousand grain weight of wheat genotypes under various salinity levels. The vertical bar indicates average of five independent replicates (n = 5). Error bars represent standard error.
Agronomy 12 03027 g007
Figure 8. Reduction (%) of grain yield of wheat genotypes under various salinity levels. The vertical bar indicates average of five independent replicates (n = 5). Error bars represent standard error.
Agronomy 12 03027 g008
Figure 9. Proline content in leaf of wheat genotypes under various salinity levels. The vertical bar indicates average data of five independent replicates (n = 5). Error bars represent standard error.
Agronomy 12 03027 g009
Figure 10. Relative value of proline content in leaf of wheat genotypes under various salinity levels. The vertical bar indicates average data of five independent replicates (n = 5). Error bars represent standard error.
Agronomy 12 03027 g010
Figure 11. Glycine-betaine content in leaf of wheat genotypes under various salinity levels. The vertical bar indicates average data of five independent replicates (n = 5). Error bars represent standard error.
Agronomy 12 03027 g011
Figure 12. Relative value of glycine-betaine content in leaf of wheat genotypes under various salinity levels. The vertical bar indicates average data of five independent replicates (n = 5). Error bars represent standard error.
Agronomy 12 03027 g012
Figure 13. Soluble sugar content in leaf of wheat genotypes under various salinity levels. The vertical bar indicates average data of five independent replicates (n = 5). Error bars represent standard error.
Agronomy 12 03027 g013
Figure 14. Relative value of soluble sugar content in leaf of wheat genotypes under various salinity levels. The vertical bar indicates average data of five independent replicates (n = 5). Error bars represent standard error.
Agronomy 12 03027 g014
Figure 15. Soluble protein content in leaf of wheat genotypes under various salinity levels. The vertical bar indicates average data of five independent replicates (n = 5). Error bars represent standard error.
Agronomy 12 03027 g015
Figure 16. Relative value of soluble protein content in leaf of wheat genotypes under various salinity levels. The vertical bar indicates average data of five independent replicates (n = 5). Error bars represent standard error.
Agronomy 12 03027 g016
Figure 17. Hydrogen peroxide (H2O2) accumulation in leaf of wheat genotypes under various salinity levels. The vertical bar indicates average data of five independent replicates (n = 5). Error bars represent standard error.
Agronomy 12 03027 g017
Figure 18. Relative value of hydrogen peroxide (H2O2) accumulation in leaf of wheat genotypes under various salinity levels. The vertical bar indicates average data of five independent replicates (n = 5). Error bars represent standard error.
Agronomy 12 03027 g018
Figure 19. Melondealdehyde (MDA) accumulation in leaf of wheat genotypes under various salinity levels. The vertical bar indicates average data five independent replicates (n = 5). Error bars represent standard error.
Agronomy 12 03027 g019
Figure 20. Relative value of melondealdehyde (MDA) accumulation in leaf of wheat genotypes under various salinity levels. The vertical bar indicates average data of five independent replicates (n = 5). Error bars represent standard error.
Agronomy 12 03027 g020
Table 1. Plant height and total tillers of wheat genotypes under different salinity levels.
GenotypesPlant Height (cm)Total Tillers Plant−1
Control4 dS m−18 dS m−112 dS m−1Control4 dS m−18 dS m−112 dS m−1
G 1383.3 c77.9 c72.8 c70.1 b5.9 a5.5 ab5.4 abc5.2 ab
G 2484.6 bc75.2 c67.9 d59.0 d5.7 a5.3 b4.5 d3.9 d
G 20-189.3 ab85.3 a80.4 a76.3 a6.2 a5.9 ab5.6 ab5.3 ab
G 989.0 ab81.2 b76.6 bc66.7 c5.9 a5.5 ab4.9 bcd4.8 bc
G 2290.9 a82.3 ab78.7 ab73.3 a5.7 a5.5 ab4.7 cd4.6 c
G 20-286.0 abc82.0 b77.1 ab73.9 a6.3 a6.1 a5.9 a5.7 a
BARI ghom 2589.3 ab83.4 ab78.3 ab74.9 a6.2 a5.8 ab5.6 ab5.1 bc
CV (%)3.452.242.782.475.615.966.786.16
Mean values in the same column with different letters are significantly different at 5% level of significance. Averages data are shown with mean values of five independent replicates (n = 5).
Table 2. Effective tiller number and spike length of wheat genotypes under different salinity levels.
GenotypesEffective Tiller No. Plant−1Spike Length (cm)
Control4 dS m−18 dS m−112 dS m−1Control4 dS m−18 dS m−112 dS m−1
G 135.29 a4.93 abc4.68 a4.59 a10.28 bcd10.08 bc9.84 abc9.51 ab
G 245.15 a4.35 c3.30 b2.23 c11.83 a10.86 a10.40 a9.66 ab
G 20-15.45 a5.17 ab4.82 a4.70 a10.60 bc10.51 ab10.13 ab9.80 a
G 95.11 a4.62 bc3.65 b3.49 b10.69 b9.98 bc9.59 bc9.14 b
G 225.06 a4.51 c3.45 b3.20 b10.95 b10.07 bc9.85 abc9.29 ab
G 20-25.53 a5.31 a5.17 a5.11 a9.83 d9.62 c9.53 bc9.21 ab
BARI ghom 255.49 a5.23 a5.00 a4.73 a9.96 cd9.73 c9.52 c9.18 b
CV (%)6.866.196.346.963.483.043.293.30
Mean values in the same column with different letters are significantly different at a 5% level of significance. Average data are shown with mean values of five independent replicates (n = 5).
Table 3. Spikelet number spike−1 and grains per spike of wheat genotypes under different salinity levels.
GenotypesSpikelets Number Spike−1Grains Spike−1
Control4 dS m−18 dS m−112 dS m−1Control4 dS m−18 dS m−112 dS m−1
G 1319.26 ab18.80 a18.01 a16.66 a57.53 ab 56.00 ab54.56 ab51.85 ab
G 2417.50 d17.00 c15.63 e12.00 d53.95 bc 46.91 c40.00 e36.90 e
G 20-117.36 d17.02 c16.02 de14.85 c54.84 abc53.10 b51.73 bc49.04 bc
G 919.43 a18.88 a17.65 ab15.71 b54.40 abc52.32 b48.10 cd45.72 c
G 2218.38 bcd17.85 bc16.65 cd14.41 c50.86 c47.88 c 44.56 d40.98 d
G 20-218.00 cd17.76 bc16.96 bc15.64 b59.53 a58.10 a56.36 a55.00 a
BARI ghom 2518.70 abc18.32 ab17.36 abc15.83 b54.66 abc52.88 b51.20 bc48.75 bc
CV (%)2.882.632.472.295.244.404.444.75
Mean values in the same column with different letters are significantly different at 5% level of significance. Averages data are shown with mean values of five independent replicates (n = 5).
Table 4. Thousand grain weight and grain yield of wheat genotypes under different salinity levels.
GenotypesThousand Grain Weight (g)Grain Yield (g plant−1)
Control4 dS m−18 dS m−112 dS m−1Control4 dS m−18 dS m−112 dS m−1
G 1347.85 ab 45.41 ab 42.45 ab40.00 a9.79 a9.29 a8.80 ab7.81 b
G 2444.75 b39.96 c34.14 c26.09 c9.76 a8.78 b6.55 d4.86 e
G 20-151.25 a47.58 a44.18 a41.54 a9.18 bc8.80 b8.39 ab7.62 b
G 946.43 b44.55 ab39.38 b34.19 b8.91 cd7.72 c7.45 c6.59 c
G 2248.45 ab46.40 ab39.87 b 33.89 b8.58 d7.64 c7.05 cd5.90 d
G 20-245.34 b 43.05 bc40.37 b38.84 a9.54 ab9.19 ab 8.91 a8.62 a
BARI ghom 2547.03 b44.60 ab40.32 b38.72 a9.29 abc8.87 ab8.26 b7.08 c
CV (%)4.804.634.715.373.293.133.864.01
Mean values in the same column with different letters are significantly different at 5% level of significance. Averages data are shown with mean values of five independent replicates (n = 5).
Publisher’s Note: MDPI stays neutral with regard to jurisdictional claims in published maps and institutional affiliations.

