
Enhancing Firm Value through the Lens of ESG Materiality: Evidence from the Banking Sector in OECD Countries
Center for Finance Governance and Sustainability, Yildiz Technical University, 34220 Istanbul, Turkey
*
Author to whom correspondence should be addressed.
Sustainability 2022, 14(22), 15302; https://doi.org/10.3390/su142215302
Submission received: 30 September 2022
/
Revised: 12 November 2022
/
Accepted: 14 November 2022
/
Published: 17 November 2022
(This article belongs to the Special Issue Governance and Sustainability: Future Perspective for Business, Economy and Society)
Abstract
:Momentous developments in the regulatory environment, increasing investor demand, and growing awareness of climate change and societal issues are leading banks to adopt a comprehensive approach beyond the traditional financial lens. Assessing performance towards sustainability issues, including environmental, social, and corporate governance (ESG), and its’ relevance in firm value in the banking sector offers a field of continuous interest for researchers. This paper investigates the role of ESG materiality in firm value, based on a sample of banks operating in OECD countries, for the period 2016–2020. Adopting the materiality classification for the banking sector provided by the Sustainability Accounting Standards Board (SASB), the study consists of a multi-layer methodology. In the first stage, a dynamic technique for order preference by similarity to ideal solution (TOPSIS) and entropy methods are utilized to calculate ESG score based on ESG materiality for 1115 bank-year observations while in the second stage, value relevance analyses are applied in order to reveal whether ESG materiality affects firm value. The results depict that ESG performance based on ESG materiality has a positive influence on the firm value for both models, price-to-book value ratio (PBV), and Tobin’s Q (TQ). Moreover, collected from the Refinitiv database, ESG combined has a low impact on PBR whereas there is no significant effect on TQ. The implication is that the firm value is influenced by the materiality-adjusted ESG performance than by the extended ESG spectrum.
1. Introduction
Undoubtedly, the drastic change in the global risk profile has a significant impact on both the business environment and the global economy. Companies have faced growing and escalating challenges in recent years against the backdrop of complex environmental, socioeconomic, and governance (ESG) issues in addition to economic ones [1]. The pandemic crisis, the climate crisis, the social justice crisis, and the global economic crisis are significant problems that organizations are currently confronting. They also demonstrate how systemic and interrelated risk is in a society that is really intertwined. It is now more important than ever to consider how growing risks may affect institutions’ business strategies and future financial results due to the shifting risk landscape. As a result, ESG risks, which have the largest potential to damage firms, must now be considered in business strategy beyond just compliance. As a result, ESG risks, which have the biggest potential to harm businesses, must now be included in corporate strategy rather than just being something that institutions should think about.
Additionally, a growing number of investors are asking institutions to find efficient strategies to recognize and manage ESG risks and opportunities across the short, medium, and long term. Established in 2006, the United Nations Principles for Responsible Investment (PRI) continues to grow with worldwide responsible investment momentum. The number of institutions that signed the PRI increased by more than 50% in 2021, reaching 4700, compared to the previous year. Finally, as of September 2022, the initiative surpassed 5000 signatories representing US$121 trillion in managed assets (AUM) [2]. At COP26, more than 450 financial institutions managing more than $130 trillion in assets from 45 countries committed to transforming the economy to net zero over the next three decades through Glasgow Financial Alliance for Net Zero (GFANZ) [3]. As a result, investors scrutinize organizations not just for what they produce now but also for how they do it and what specific efforts they have taken to protect their ability to generate value in the future. Beyond the numbers, the corporate value notion highlights the current profit maximization paradigm’s shortcomings. The expanding body of research demonstrating the beneficial effects of ESG materiality on financial performance is one of the primary factors behind the increasing importance of ESG integration among investment firms [4].
One of the main drivers behind the development of the ESG landscape is regulations. To improve stakeholder and investor communication and to promote corporate transparency and accountability, an increasing number of businesses are also using voluntary reporting. A total of 96% of the world’s 250 largest companies and 80% of the 5200 companies covering the top 100 companies in 52 countries disclose their sustainability performance [5]. According to theoretical viewpoints including legitimacy, stakeholder, and institutional theories, there are a number of reasons why businesses choose to freely share their sustainability information and implement sustainable policies. In the legitimacy procedures, ESG reporting becomes very important and helps to increase credibility with all stakeholders. A substantial contribution to reaching the goal of legitimacy in the corporate environment is made by engaging in not only the financial elements but also the ESG components and voluntary disclosures [6].
Although voluntary or required adoption and integration of ESG strategies into business models are becoming more common, this does not guarantee that they will meet investors’ needs and expectations. Stakeholders are unable to obtain the precise information they require if the relationship and interaction between the revealed environmental, social, and corporate governance indicators and financial performance are not considered. It is “complicated, confusing, and nuanced” how sustainability performance and firm value relate to one another [7]. On the academic front, there has been a great amount of work on the link between ESG and firm value since the 1970s. However, the number of specific studies on the relevance of ESG materiality to investment decision-making is scarce and much more recent. Khan et al. (2016) [8] generated materiality and immateriality ratings by adopting the SASB’s notion of materiality and the findings show that superior financial performance is not correlated with a strong performance on immaterial ESG issues [8]. Kotsantonis and Bufalari (2019) [9], working with the top 100 largest worldwide banks, achieved the same results by employing the technique of Khan, Serafeim, and Yoon (2016) [8]. Additionally, materiality is shown to increase the predictability of financial performance in contrast to total ESG or immateriality scores in the study by van Heijningen (2019) [10]. According to Consolandi et al. (2020), the concentration of ESG materiality operates as a concentration risk factor, and the market appears to favor companies that operate in sectors with high levels of ESG materiality concentration [11].
Moreover, due to their considerable power to choose investment projects, manage risks, determine who has access to capital, and determine which activities are financed, banks have always taken an active part in the economic and social development of nations. Banks significantly influence society and, in turn, sustainable development through carrying out this function. However, mostly due to their special characteristics—different accounting rules, reporting incentives, or risk exposures—compared to other institutions, as well as the fact that they operate under particular regulations, banks are frequently left out of samples in empirical research in this area. In this sense, it is necessary and vital to take into account the banking industry in terms of measuring both the value and ESG materiality performance.
Differentiated by the limited number of academic studies mentioned above in terms of the scope and methodology in this study, the relationship between the materiality-oriented ESG performance of the banking sector and firm value is tested with a multiple-layer methodology. In this paper, we generate a unique set of indicators for the ESG performance assessment which is aligned with SASB’s materiality map for the banking sector [12]. We use this indicator set to calculate the ESG materiality score as a measure of the level of ESG performance and concentration of ESG materiality for each bank. We also test the impact of the ESG materiality on firm value based on a sample of banks operating in OECD countries for a period of 5 years (2016–2020) estimating a linear regression model.
2. Literature Review and Hypotheses Development
For many years, financial accounting standards gave businesses and investors consistent language to discuss financial performance. However, standard accounting was created at a time when the majority of a company’s market valuation was made up of tangible assets. Considering the noteworthy switch in the market value components in almost half a century, the percentage of intangible assets grew from 17% to 90% [13]. As a result, a significant portion of the market value today is made up of intangible assets, such as corporate trust, reputation, business strategy, risk management strategy, human capital, operational legitimacy, and supply chain. The notable change in tangible and intangible assets shows that the worth of the businesses as a whole is not well represented by the financial statements taken on their own. Due to this historic change, businesses are now disclosing information beyond their financial results and supporting the expansion of the reporting framework to include ESG and sustainability disclosures.
Sustainable business practices have an effect on a company’s financial health, operational efficiency, and enterprise value in the modern economy. Since demand prices are discounted by potential buyers when there is doubt about the product’s quality, according to Brickley et al. (2002) [14]. A company can also distinguish its products and raise demand by credibly pledging to behave ethically. On the other side, a business that develops a bad reputation for unethical behavior would lose both present and potential new clients, as well as the revenue they would have brought in. According to Chami et al. (2002), a corporation should be concerned with ethics because this is a significant intangible asset that will influence the market value of its shares [15]. Companies in the software business place a lot of emphasis on data security, a social concern. A beverage producer must manage water effectively because it is an environmental concern. A governance issue, managing conflicts of interest is crucial for an investment bank. Long-term management of these problems successfully is expected to enhance business performance through lower operational costs, a better reputation, more risk tolerance, the possibility for competitive advantage, and higher long-term enterprise value [16].
According to the cost of capital theory, implementing sustainability measures would entail higher operating costs, which would eventually result in lower capital costs [17]. The findings of El Ghoul et al. (2011) [18], which showed that better sustainability ratings are connected with a lower cost of capital for a large sample of US enterprises, provide evidence in favor of this argument. According to research on the banking sector, improved financial performance and stable revenue would offset the costs associated with implementing ESG regulations. According to Buallay (2019) [17], who conducted a study on 235 European banks and found a favorable correlation between ESG and operational performance, each ESG component needs to be further examined. On the other hand, according to a different study by the same author [19], there is a negative correlation between ESG and the financial, operational, and market performance of 530 banks worldwide. Furthermore, Nguyen et al. (2021) [20] showed that CSR activities tend to offer risk-mitigating benefits in Vietnam however unconstrained banks, on the other hand, are more likely to invest in unnecessary CSR, thus reducing bank performance and increasing bank risk-taking. The reason for the negative results is that banks still need to take extra steps to incorporate sustainability policies into their operational activities [19] and should be focused on sustainability issues material for the industry.
In addition to ethical considerations, ESG Materiality Performance may be a useful tool for maintaining the reputation and ensuring financial sustainability [21]. Existing research indicates that default risk and bank sustainability performance seem to have a negative or insignificant relationship [22,23]. Bolton (2013) [24] discovers data pointing to the possibility that enhancing corporate sustainability quality could significantly boost bank performance and lower risk for US banks. As a result, it is reasonable to assume that banks’ ESG Materiality Performance will help them adjust to their new operating environment. However, there is scant evidence on the relationship between ESG and firm value in the banking industry; this research gap is what the current study will attempt to fill.
ESG data is available to investors from a variety of sources, including stock exchanges, data and index providers, and rating agencies. However, experts urge businesses to pay more attention to material ESG concerns that have the potential to significantly impact their bottom line [25]. Moreover, Madison and Schiehll (2021) revealed that financial materiality has an impact on how meaningful ESG scores and rankings are, allowing investment opportunities in companies with strong ESG ratings on business-critical issues to be identified [26]. Despite the fact that more and more rating agencies are evaluating the ESG performance of companies, studies have revealed that each agency uses a different assessment methodology [27]. Furthermore, to our knowledge, no rating agency has used a methodology designed particularly to take into account the financial materiality of ESG risks and opportunities, with the exception of Factset Truvalue Insight [28].
In order to assist companies and investors in establishing a common vocabulary regarding the financial effects of sustainability, SASB was established as a nonprofit organization in 2011. The corporate sustainability disclosure landscape becomes increasingly complicated over time. Clarity and simplification were demanded in this market by several multinational corporations and investors. In response, the Value Reporting Foundation (VRF), which was formally established in June 2021, was created by the merger of the International Integrated Reporting Council (IIRC) and SASB in November 2020 [29]. The merger represented a significant step toward simplification by joining two organizations that were committed to generating enterprise value. On 1 August 2022, the VRF formally merged with the IFRS Foundation [30].
The Sustainability Accounting Standards Board (SASB) aims to establish a connection between investors and institutions by considering the financial effects of sustainability. In this direction, SASB standards have been developed based on the feedback of market participants, especially investors. SASB’s mission is to help businesses worldwide identify, manage and report on the sustainability issues most material to their investors. In addition, SASB standards are industry-specific, allowing investors and companies to compare the performance of companies in an industry (Guidelines for 11 Sectors, 77 Industries have been published) [12]. The SASB notion of materiality, which highlights sustainability issues that are material from an investor’s standpoint, is the one we use in this paper.
The Impetus for our study stems from the mismatch of ESG scores and lack of materiality perspective for ESG performance assessment in the banking industry, which raises the following questions: Would ESG scores change if the Sustainability Accounting Standard Board’s (SASB’s) ESG financial materiality framework is taken into account? If so, how do the adjusted scores affect firm value?
Finally, we propose the following hypothesis in light of the more substantial empirical evidence and the applicability of the arguments in favor of a positive relationship between ESG Materiality and firm value:
Hypothesis 1.
ESG Materiality performance exerts positive effects on firm value.
Hypothesis 1a.
ESG Materiality performance exerts positive effects on PBV.
Hypothesis 1b.
ESG Materiality performance exerts positive effects on Tobin’s Q.
This study clarifies if the consideration of financial materiality as per the SASB’s materiality map has a substantial impact on the ESG performance scores of banks as reported by the data provider Refinitiv in its Eikon database. The importance of our analysis stems from the fact that investors, who are the main consumers of these ratings, do not exactly match the financial materiality standards used by the major ESG data providers and rating agencies.
3. Research Design and Methodology
3.1. Data and Sample
The Refinitiv ESG database served as the foundation for our sample. To select the sample, we use the following criteria. First, we select banks, operating in OECD countries for the 10-year period (2011–2020) according to Refinitiv industry classification, the GICS system. Second, we match the GICS with the industry classification proposed by the SASB’s financial materiality framework, the SICS system in order to apply the targeted SASB Materiality Map to our sample, representing the commercial bank industry. With this procedure, the sample includes 8050 bank-year observations. Third, given the availability of the data needed to calculate the ESG materiality scores, the time frame for 2016 to 2020 was selected. Fourth, the banks in the sample are those for which Refinitiv Eikon provides data regarding not only required ESG indicators but also required financial indicators. As a consequence, the intended sample, the number of banks that meet our criteria, includes 1115 bank-year observations. The balanced sample composition by country distribution can be seen in Table 1.
3.2. Methodology
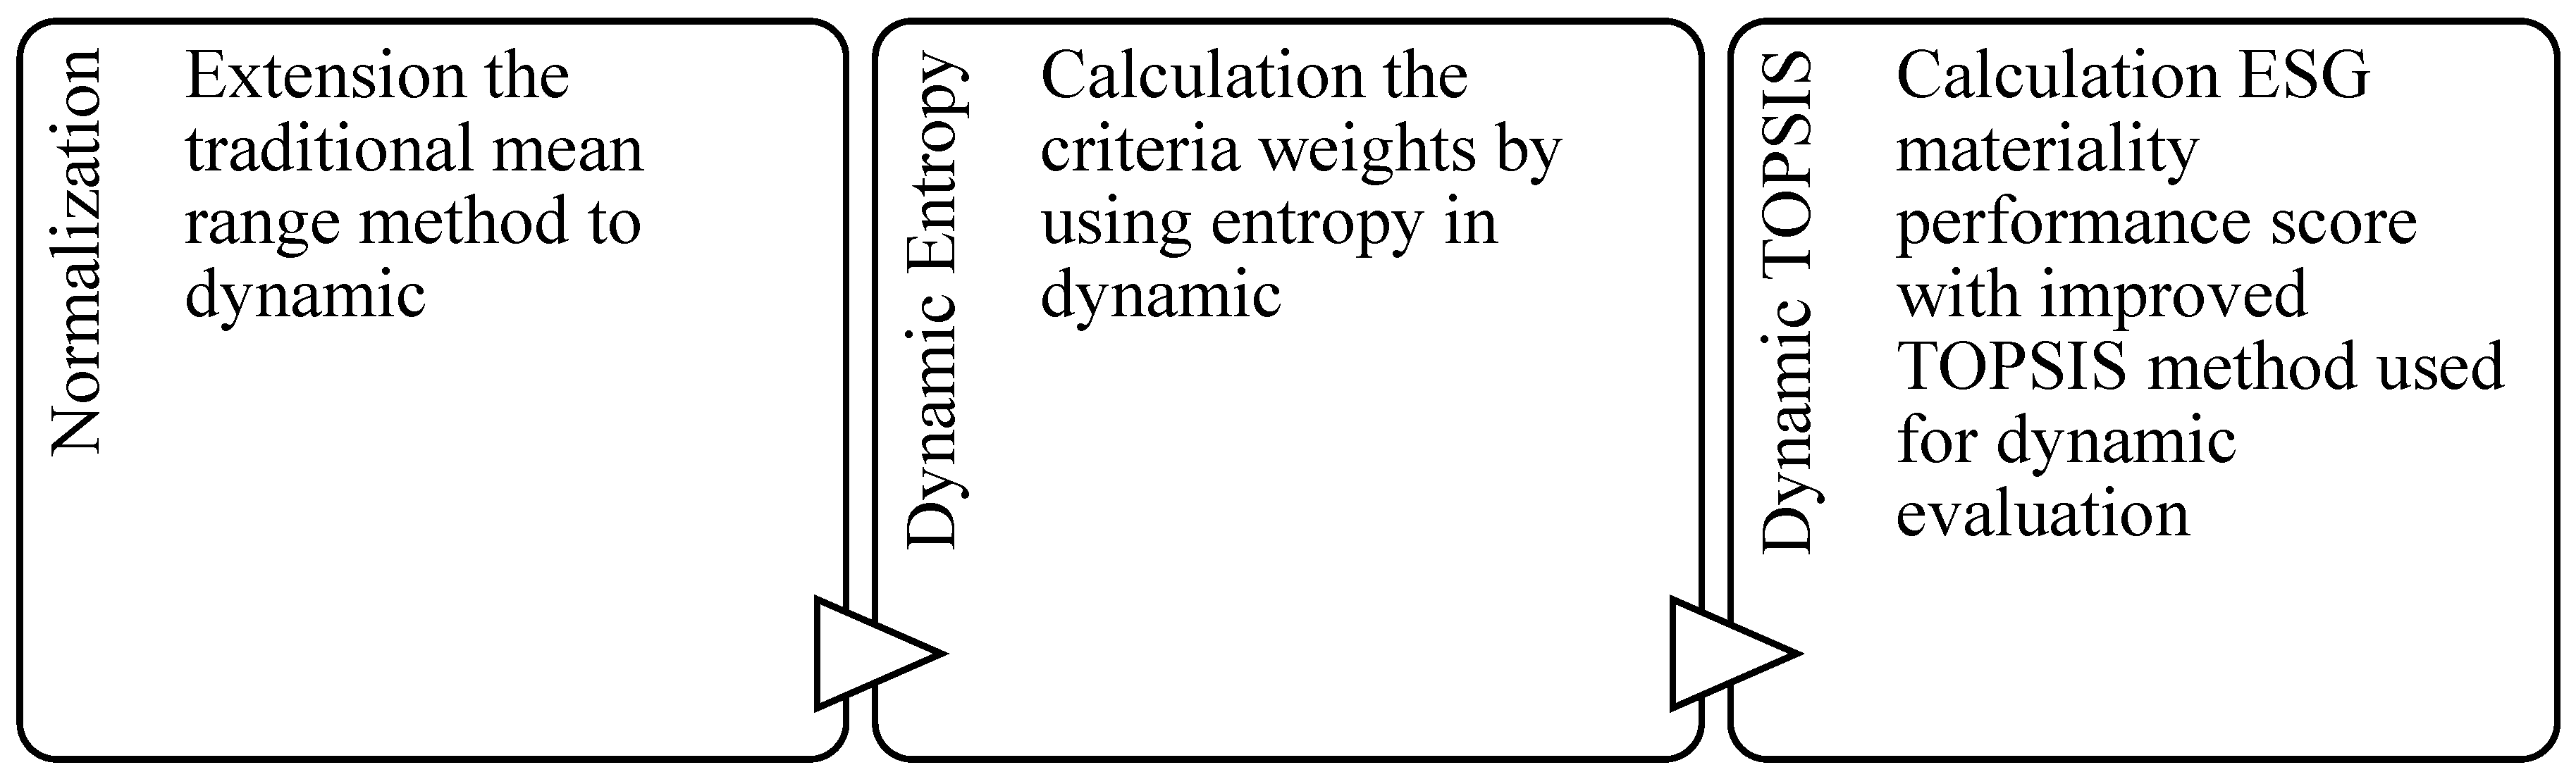
In the paper, we use a multi-stage methodology, adopting the Sustainability Accounting Standards Board’s (SASB) materiality classification for the banking industry. In the first step, we match Refinitiv ESG indicators with SASB’s General Issue Categories for the commercial banking industry. In the second step, we utilize a dynamic technique for order preference by similarity to ideal solutions (TOPSIS) and entropy methods to calculate materiality-adjusted ESG scores, namely the ESG Materiality score. Finally, in the third step, we apply value relevance analyses to reveal whether ESG materiality affects firm value.
3.2.1. Matching Refinitiv ESG Indicators Using SASB Materiality Map
One of the market’s ESG databases, provided by Refinitiv, has information dating back to 2002 and covers more than 630 different ESG criteria. In order to reformulate the three pillar scores and the ultimate ESG scores (ESG score, ESG controversies score, and ESG combined score), which is a representation of the company’s ESG performance, commitment, and effectiveness based on publicly-reported information. Based on the reported data related to the ESG pillars, Refinitiv provides ESG Combined (ESGC) scores aiming at a balanced and thorough rating of a company’s ESG performance. The ESG controversies overlay is taken from international media sources. This score’s primary goal is to undervalue the ESG performance score in light of unfavorable media coverage. To achieve this, it adjusts the total ESGC score to account for the effects of big, material ESG controversies [31].
In this stage, we establish the relevance map for financial material issues detected by SASB and the ESG data items, categories, and pillars provided by the Refinitiv Eikon ESG database. For the commercial banking industry identified by SASB as “business ethics”, “systematic risk management”, “financial inclusion and capacity building”, “data security”, and “incorporation of ESG factor in credit analysis”, five material topics are our reference point for the mapping [12]. Followed by, presented in detail in Appendix A, 76 data points from the Refinitiv ESG database are selected for the material indicators pool relevance with the five material topics. Consequently, to select the indicators to be used in ESG materiality performance measurement we identify five exclusion criteria as follows: (i). Datagap for observations >90% and datagap for indicators >90%, (ii). Datagap for observations >60% and then datagap for indicators >30%, (iii). Criterion has been deleted due to alternative criterion included, (iv). Excluded due to value of observations being mostly the same (which means that it does not provide qualified information), (v). Excluded due to many outliers observed for the criterion. After meeting this procedure, we determine the final ESG indicator with 34 indicators, presented in Table 2, for ESG materiality performance measurement. Moreover, in terms of the final ESG data set, the sample includes 1260 bank observations. The details of the selection process can also be followed in Appendix B.
3.2.2. Calculating Materiality-Adjusted ESG Score
In this section, we describe the steps in calculating the materiality-adjusted scores for the sample banks. To calculate ESG Materiality Score for each bank-year observation, we utilize dynamic TOPSIS and entropy methods as shown in Figure 1, where the key methods are depicted in the following subsections.
The TOPSIS method, created by Hwang and Yoon in its original form, is one of the best-known and most widely applied Multi-Criteria Decision Making (MCDM) techniques. It is based on the idea that the selected alternative should be the furthest away from the negative-ideal solution and the closest to the ideal solution. While the negative-ideal solution optimizes the cost criteria and minimizes the benefit criteria, the positive-ideal solution minimizes both the cost and benefit criteria. Since the TOPSIS technique does not presume that each criterion has equal weight, the decision-maker must assign a set of weights [32]. When there are a lot of criteria, there are several drawbacks to the direct assessment of weights. Additionally, this type of weighing procedure may be unstable, inefficient, and arbitrarily chosen [33]. Additionally, because many of the sustainability aspects’ requirements clash with one another, it can be challenging to meet all of them at once. From this point on, the weights of the criteria are assessed using the entropy approach. This makes it possible to calculate each criterion’s relative weight in an objective manner. In information theory, entropy assesses the anticipated information content of a particular message [34]. Entropy can be viewed as a measurement of actual or observational diversity. Entropy considers that messages or categories of events may occur with unequal frequency or probabilities, unlike the measure of selective information. Entropy is a nonparametric measure of diversity since it makes no assumptions about the nature of the frequency distribution or the probability distribution [35].
Entropy and TOPSIS methods are widely used Multi-Criteria Decision Making (MCDM) Techniques in the field of sustainability [36,37,38,39]. The majority of research, however, did not take into account an object’s total performance on a certain criterion over time. For instance, the criteria weights were often determined within a single year and varied between years. The comparability of the evaluation outcomes across years may be hampered as a result. Li et al. (2018) devised a dynamic TOPSIS-entropy technique to address this issue by extending the mean range normalization, entropy weighting method, and TOPSIS to dynamic situations [40]. This study follows a similar methodology in this step.
Dynamic Entropy Method for Weighting
The entropy weighting approach is chosen for its clarity, simplicity, and objectivity of the data provided. The fundamental step in the strategy is to calculate the weights for each criterion over all alternatives using the entropy sum. Smaller changes in the linked criterion values are indicated by larger entropy sums. This means that the criterion will be assigned little weight because it contributes little to the end result of the evaluation, and vice versa. The following formula is used to determine the entropy of the criterion :
is guaranteed by the constant , and is the normalization value of the original criterion values and , let .
The entropy total needs to account for changes in criterion values over time because the entropy weight is employed in the paper’s dynamic evaluation of banks’ ESG materiality performance. To do this, we expand the application of the entropy weighting technique to dynamic assessment issues as proposed by Li et al. (2018) [40], such as:
where , and represent the actual performance value of alternative (bank) with respect to criterion in the year .
In order to determine the entropy weight of criterion :
where and .
Dynamic TOPSIS
The fundamental steps of TOPSIS for involving dynamic evaluation are summarized as follows.
1st Step: Scaling the actual values of the criteria into a consistent range
where, respectively, and indicate the highest and lowest values of criterion across all assessment years while and .
2nd Step: Applying the related dynamic entropy weights to the normalized criterion values
where calculated by Equations (2) and (3).
3rd Step: Ascertaining the best and worst answers for each criterion
4th Step: Calculating the distance () between the evaluation values of alternatives and the best and the worst solutions.
5th Step: Evaluating the distance between the associated evaluation values and the two ideal solutions to determine the relative performance level of alternatives.
where and better sustainable performance of alternative (bank) is indicated when trends toward 1.
3.2.3. Evaluating Value Relevance of ESG Materiality
In order to examine the relationship between ESG materiality performance and the values it generates, our dependent variables are specifically defined as firms’ value from a financial standpoint. The future profitability of a company is typically used by the financial market to determine its value. Assuming a perfect capital market, the security’s price represents the most accurate and impartial estimate of the firm’s present value [41]. We evaluate firm value in this study using the Price to Book Value Ratio (PBV) and Tobin’s Q (TQ), which take price information into account and, as a result, take into account investors’ forward-looking estimates. In terms of evaluating the ESG materiality performance (ESG_Materiality) as an explanatory variable for firm value, we also investigate the relationship between the ESG Combined (ESG_Combined) score provided by the Refinitiv database. Thus, it guides us to make a more meaningful conclusion about the results.
We include three types of control variables (bank, industry and macro-specific) that may have an impact on the relation between ESG performance and value in line with the previous literature. Bank-specific control variables are included in four categories: profitability, measured by return on equity (ROE); size measured by logarithm of the total assets (Size); the Tier 1 Capital Ratio (T1C), which includes both market risk and operational risk components; and the Capital Adequacy Ratio (CAR). Profitability and company value are related, and this link is explained by the signaling theory. Investors and creditors pay great attention to profitability as a key performance metric. According to Wu et al. [42], it also predicts future revenues for the first group and indicates the potential to pay dividends (signaling theory). For the latter group, this displays the firm’s capacity to pay off debt and interest (signaling theory). Therefore, it is presumable that profitability affects business value. Furthermore, there are many studies have found a significant positive impact of profitability on firm value [43,44,45]. For this variable, we use return on equity (ROE) in the model.
We also include control for firm size, calculated as the natural log of total assets (Size). Most previous literature has found the firm size to be negatively related to firm value [43,44,45,46,47,48,49,50] which supports the predictions of agency theory. According to Jensen [51], managers are compelled to develop their companies above the ideal size since doing so gives them more power over the resources under their control. As a result, agency costs develop, which could negatively affect a firm’s value. On the other hand, fewer studies have revealed an insignificant relation for size and firm value [52,53].
As mentioned by Hafez (2015) [54], the capital adequacy ratio (CAR) is a specialized bank indicator that demonstrates compliance with regulatory capital requirements and calculates the financial risk associated with the responsibilities that banks have to their lenders and clients. Prior research in the banking industry employed capital adequacy as a control variable [55]. According to Siueia et al. (2019) [56], the capital adequacy ratio can be used to determine a bank’s capacity to support its current capital structure as well as a measure of the invisible risk of default. Furthermore, the Tier 1 capital ratio (T1C) as the proxy of balance sheet strength, is also crucial for bank value in terms of representing the bank’s core equity capital against its total risk-weighted-assets [57]. It has also been adopted as a crucial indicator of a bank’s financial stability as part of the Basel III Accord on bank regulation. In that regard, CAR and T1C are included as the remaining two bank-specific control variables in our study.
In line with the literature, for the industry-specific variable, representing assets of the five largest banks as a share of total commercial banking assets, the Concentration variable is included as a control for industry concentration [58,59].
Finally, we consider six macro and global-specific control variables: GDP per capita (GDPcap), GDP growth (GDPgr), inflation (Inf), country governance score (CGS), protecting minority investors score (PMIS) and global risk score (GEPU) as control to address the endogeneity problems that frequently manifest in economics-based sustainability research as correlated variables, reverse causality, and simultaneity [60,61]. In line with previous literature focused on the banking sector [55,61,62,63], we use the GDPcap, GDPgr and Inf as a sign of macroeconomic trends. Besides, as mentioned by Demirgüç-Kunt and Huizinga (1999) [61], lower profitability is associated with greater contract enforcement, a lack of corruption, and an effective legal system. Thus, in our study, in line with previous research [62,63], we also include country governance score (CGS) which consists of six sub-dimensions: “voice and accountability”, “rule of law”, “regulatory quality”, “political stability and absence of violence”, “government effectiveness”, and “control of corruption”. Moreover, as several studies [64,65] arguing that the institutional settings impact firms’ risk-taking behavior and firm’s managers are more probable to involve in risk-taking behaviour in countries having a low shareholder protection level, we also include the protecting minority investor score (PMIS) to measure the regulatory settings, in line with previous research [66]. Finally, in terms of affecting corporate performance, GEPU index, calculated by Davis (2016) [66], is used as a proxy of economic policy uncertainty is also taken into account in our study, as in Athari (2021) [63]. Table 3 presents definitions and data sources of variables included in our study.
In line with our research questions, specifically, the structural regression equations are as follows:
In the models above, PBV and TQ represents the banks’ value, measured by ESG Materiality or ESG _Combined scores, four bank-specific (ROE, Size, T1C, and CAR) for the bank (i), in year (t), one industry-specific (Concentration), and six macro and global-specific control variables (GDPcap, GDPgr, Inf, CGS, PMIS, and GEPU) in year (t) for the country (g); indicates the constant; are the coefficients of the predicotrs and control variables; and represents the estimation error.
Descriptive Statistics
The descriptive statistics of variables used in the analyses are provided in Table 4. For our sample, 1115 bank-observations, the mean value (standard deviation-std dev) of PBV is 1.19 (0.59), with the range of 3.77. The mean (std dev) value of TQ is 1.02 (1.16), with the range of 5.18. For the ESG Combined score, the average of our sample is 44.82 out of 100, while the ESG Materiality score is 42.36 out of 100. Our sample banks have an average ROE of 9%. Finally, the average (median) values of our control variables also appear to be reasonable, with natural log of size (Size) at around 24.71, concentration at 65.39, GDP capita at 48,353.63, GDP growth at 0.42, inflation at 1.97, country governance score at 1.07, protecting minority investors score at 70.62, and global economic policy uncertainty at 239.44.
4. Empirical Results and Discussion
We structure this section into four parts. In the first three subsections, we convey our empirical results for dynamic entropy, dynamic TOPSIS, and regression, respectively. Finally, in the last subsection, we discuss the results by relating them to the previous literature and the theoretical framework.
4.1. Dynamic Entropy Results
Before employing the dynamic TOPSIS method, the dynamic entropy method was used for evaluating the weights of the criteria, objectively. Based on the dynamic entropy method results, the main indicators of ESG materiality for the banking sector can be determined, as well as the superior aspects and differences of the bank’s ESG materiality were demonstrated.
On that basis, as shown in Table 5, for ESG materiality, “IESG_2: Environmental Assets Under Management Score”, “FICB_3: Product Access Low Price Score”, “SRM_6: Policy Environmental Supply Chain Score”, “SRM_2: Climate Change Commercial Risks Opportunities Score”, and “SRM_7: Environmental Supply Chain Management Score” were five leading indicators having weight range between 0.13 and 0.08. On the other hand, “BE_8: Product Responsibility Monitoring”, “BE_15: Policy Shareholder Engagement”, “BE_12: Audit Board Committee”, “FICB_2: Product Sales at Discount to Emerging Markets”, and “BE_7: Policy Responsible Marketing” were the least weighted five indicators with the weight range between (0.0022–0.0005). Table 5 also indicates the general and category order for all indicators.
4.2. Dynamic TOPSIS Results
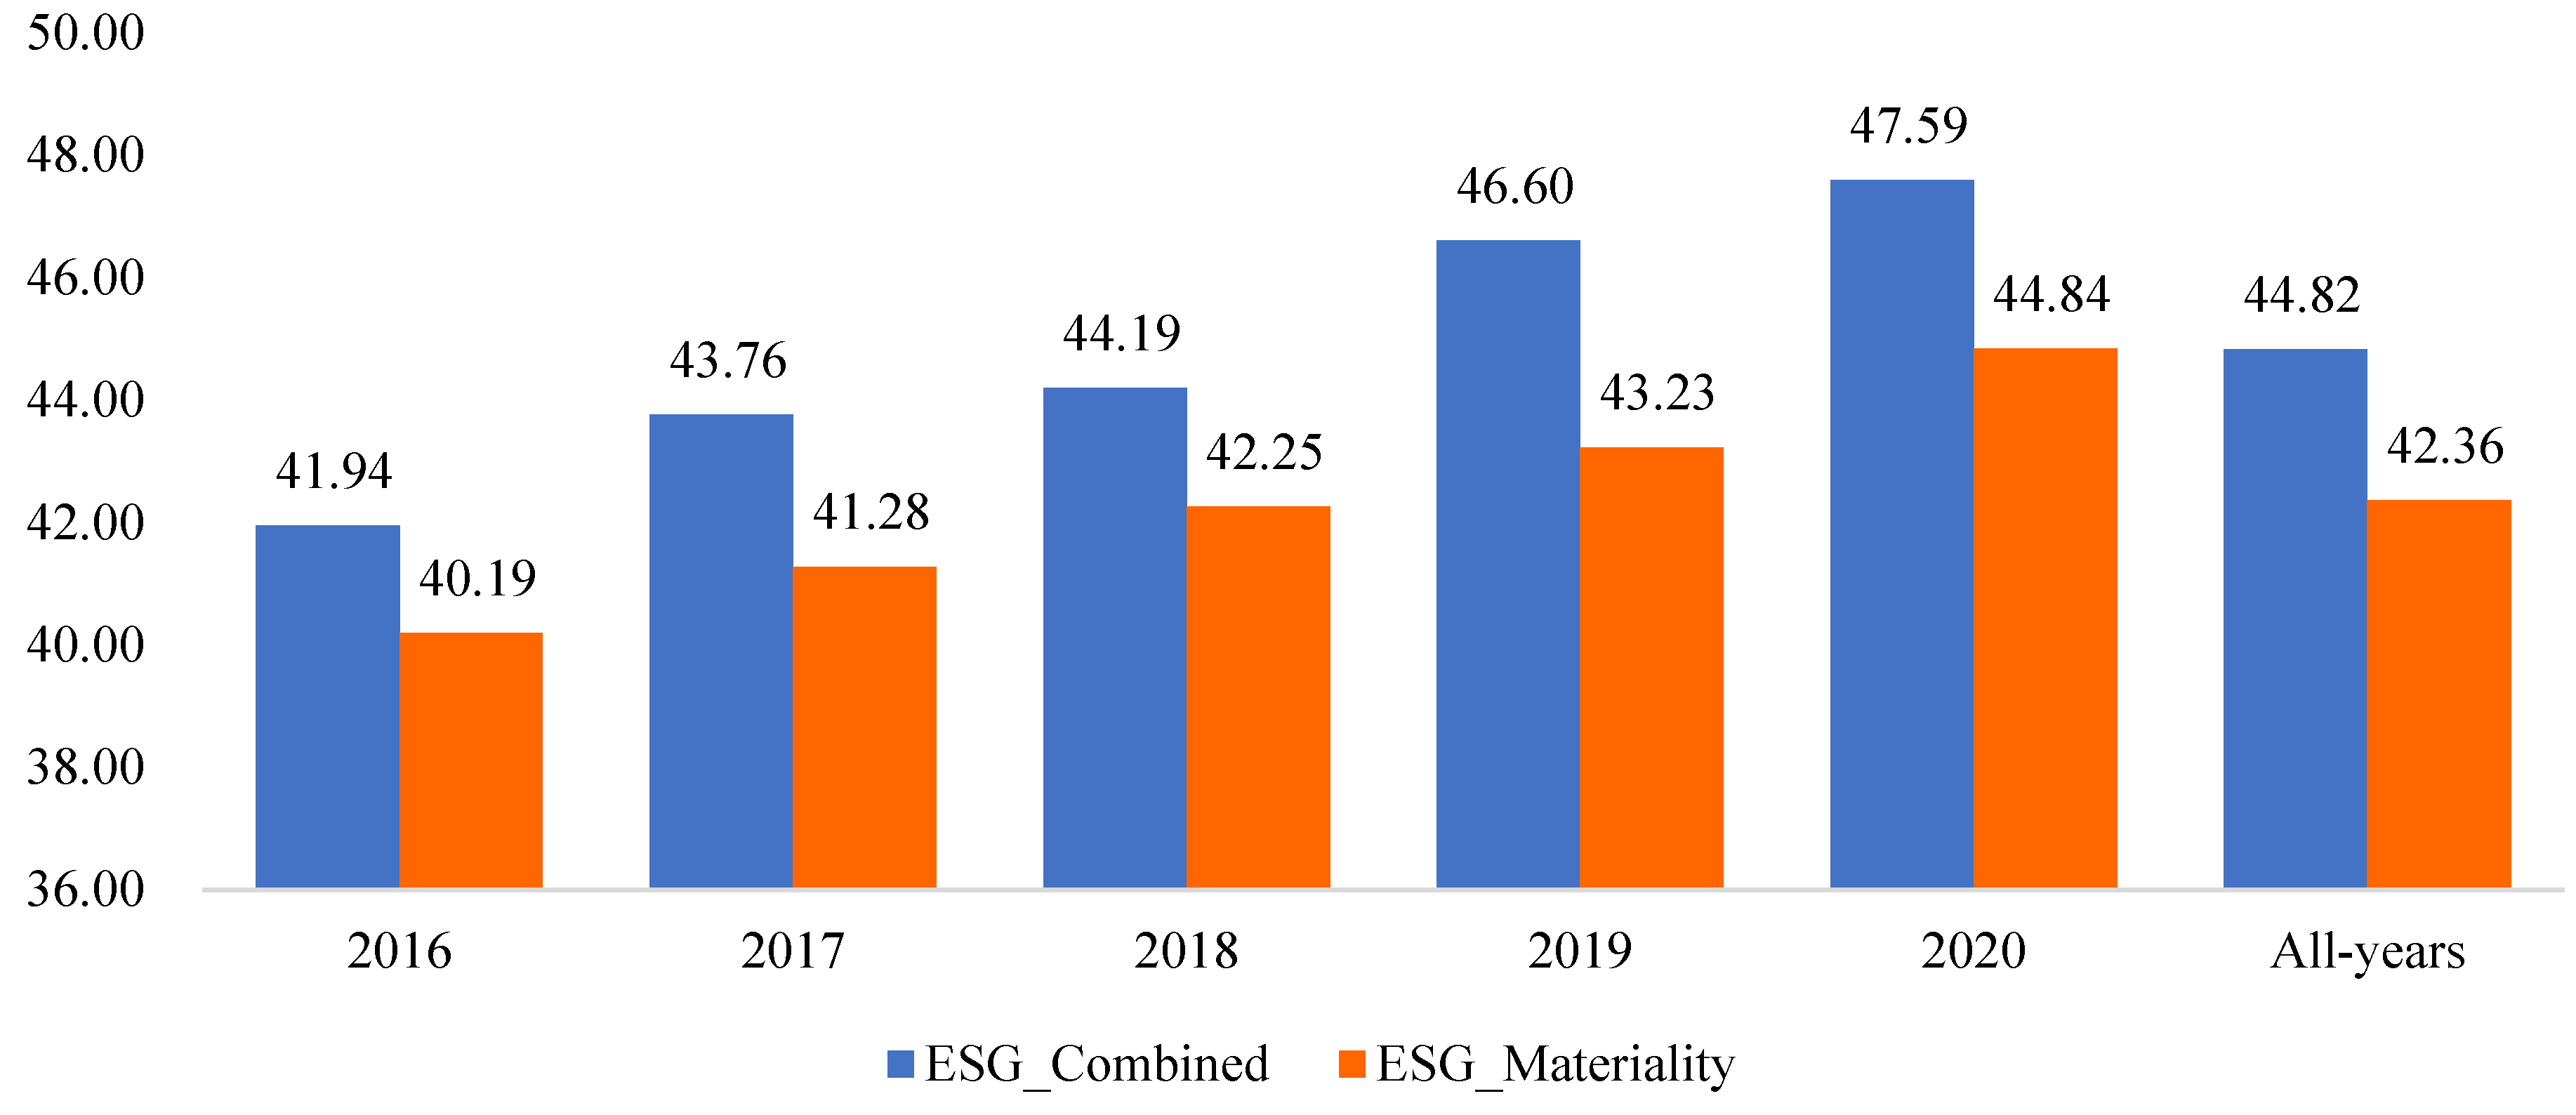
To evaluate the ESG materiality performance of the 1115 bank-year observations during the 2016–2020 period, we employed the dynamic TOPSIS method using objective weights calculated by the dynamic entropy method in order to avoid subjective judgments. In line with results obtained from the dynamic TOPSIS method, a performance score that lies between 0 and 1 was obtained for each observation. In order to examine the performance trend of banks over the years, we calculated the average score by year by filtering the scores. Also, to investigate the differentiation between the ESG Combined score calculated by Refinitiv and including an extended spectrum of ESG topics [31], and the ESG Materiality score calculated by us, we normalized ESG Materiality scores into 0–100. Figure 2 gives that the ESG performance of the sample tends to be increased over the years according to both scoring systems, while the ESG Materiality score is lower than ESG Combined score in all years and overall.
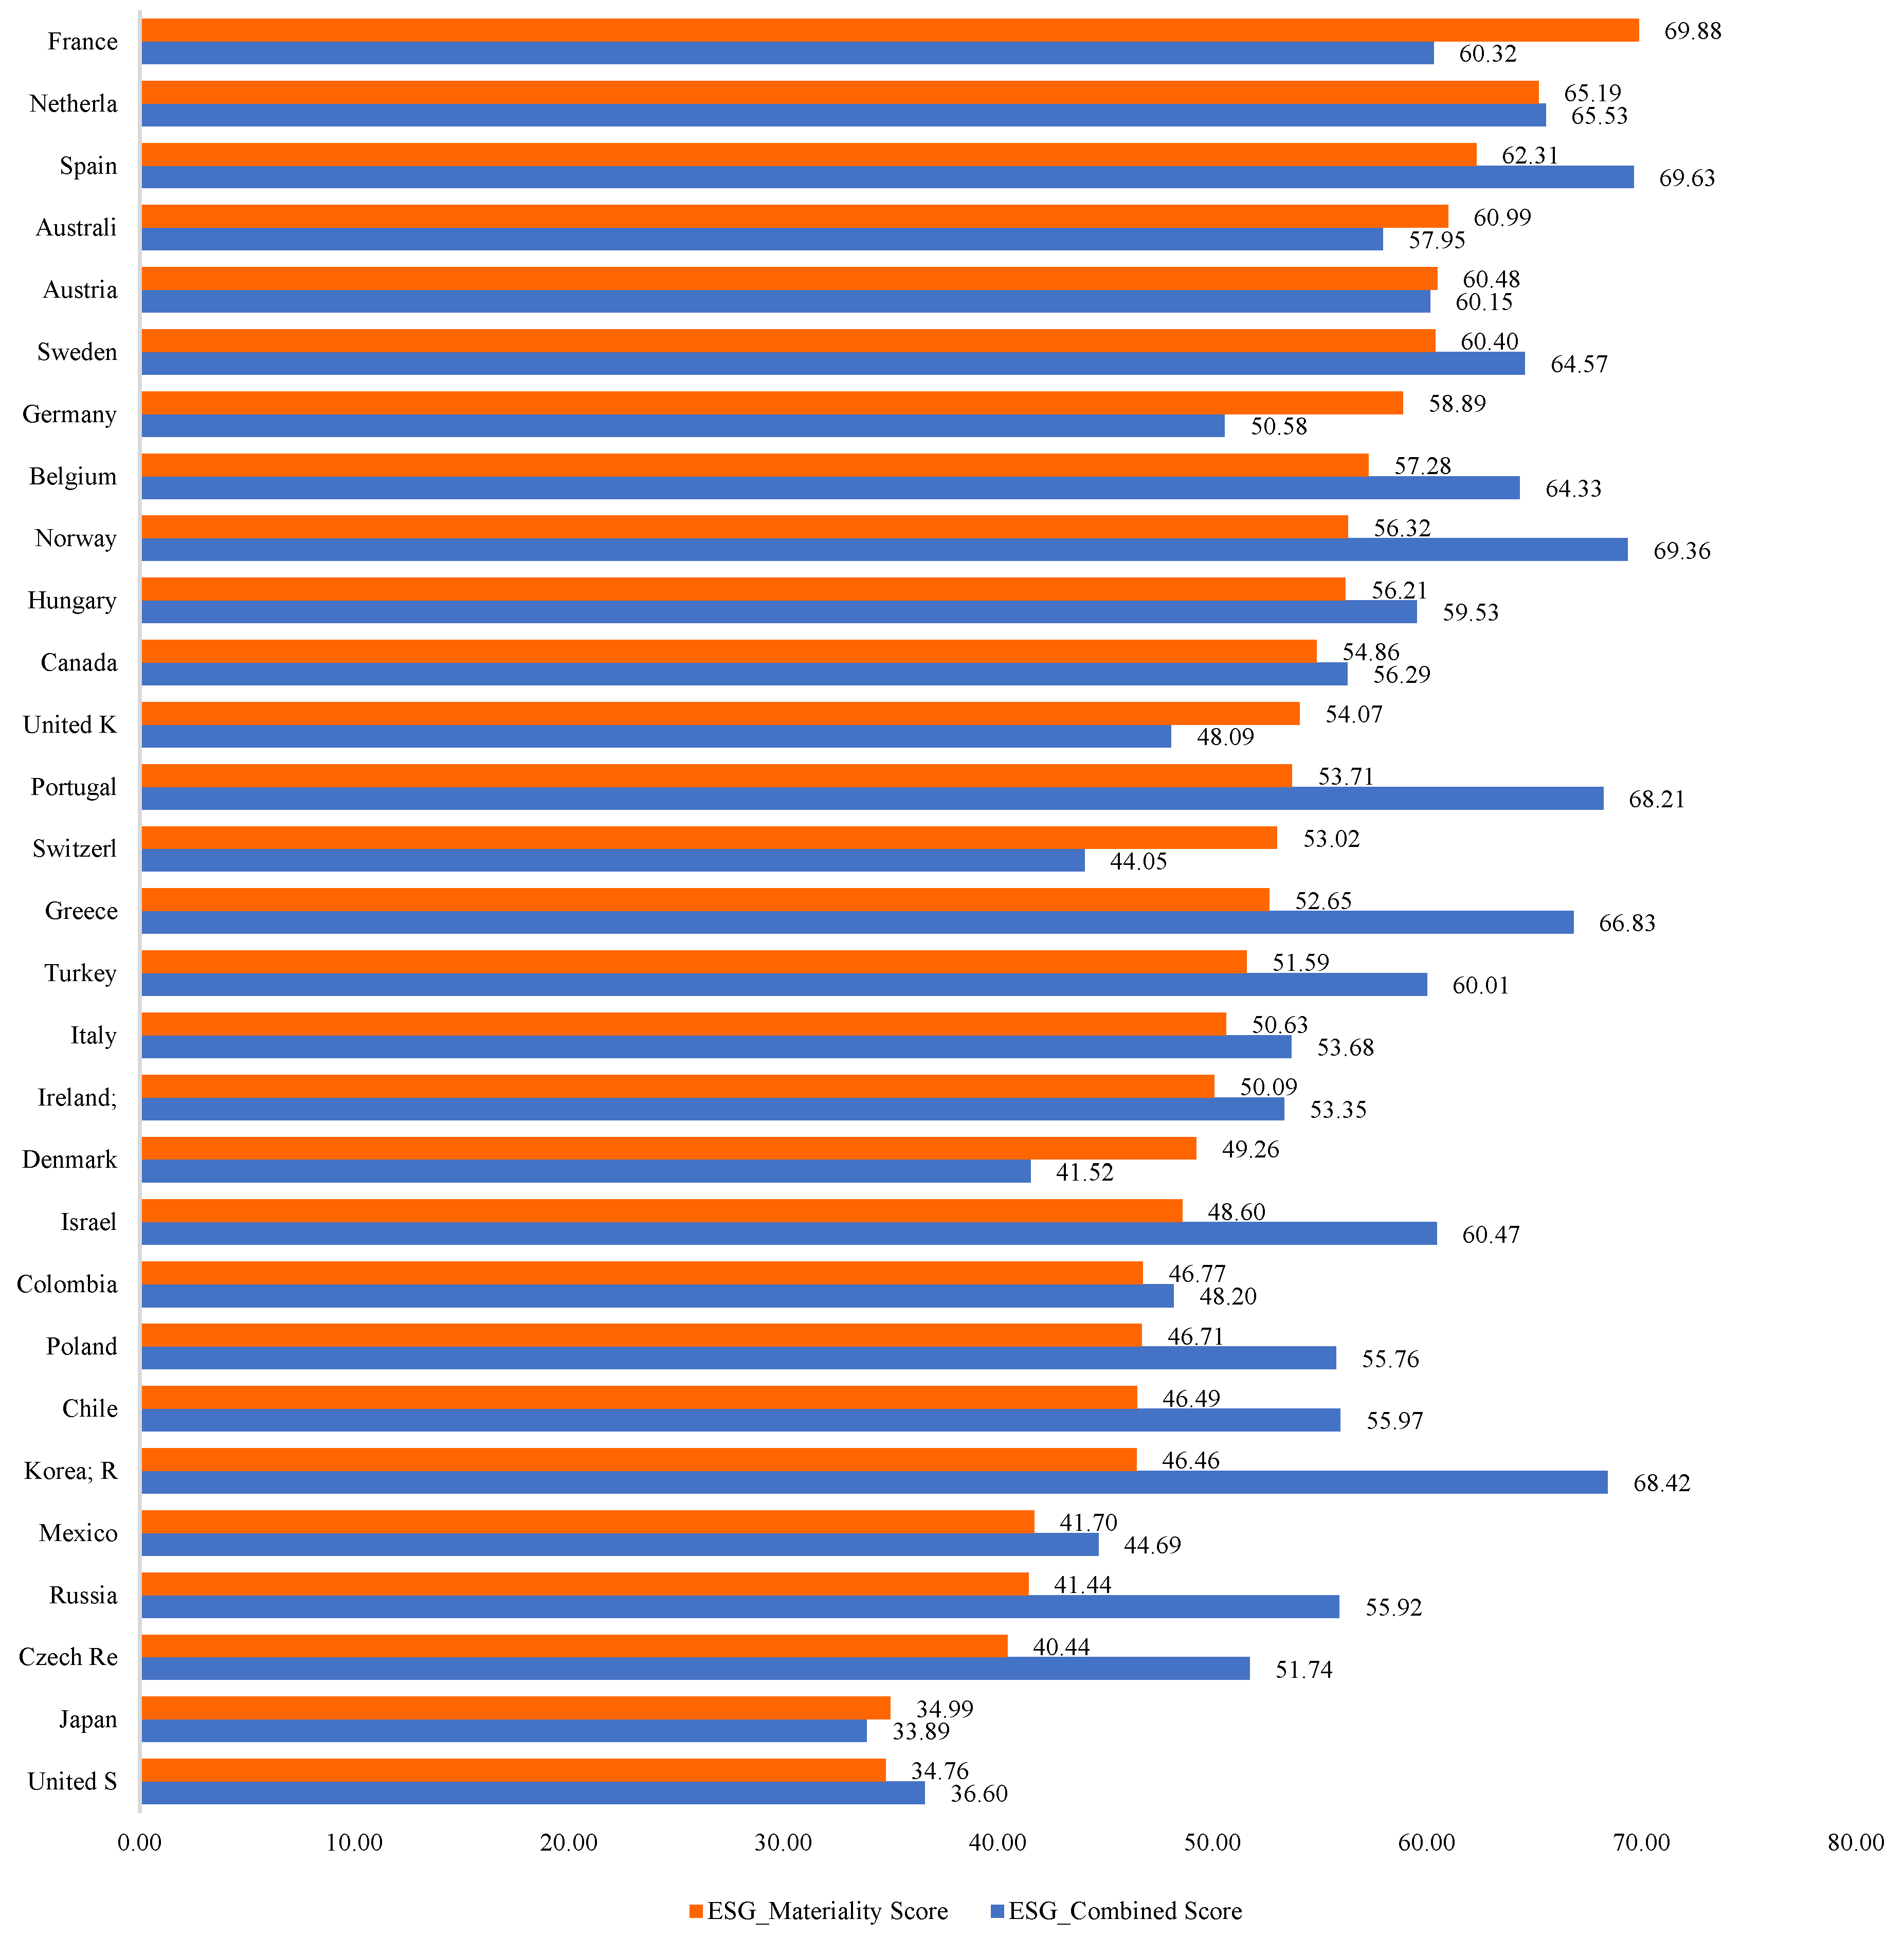
Figure 3 depicts the country-based average ESG performance scores of the sample. In terms of ESG Materiality performance, France (69.88), Netherlands (65.19), Spain (62.31), Australia (60.99) and Austria (60.48) are the five top countries (performance score) leading the banking sector, while United States (34.76), Japan (34.99), Czech Republic (40.44), Russia (41.44) and Mexico (41.70) are the five bottoms. From the Refinitiv point, country-based results differ substantially. Spain (69.63), Norway (69.36), Korean Republic (68.42), Portugal (68.21), and Greece (66.83) are the best performer countries (performance score) in terms of ESG Combined score, whereas Japan (33.89), United States (34.76), Denmark (41.52), Switzerland (44.05) and Mexico (44.69) are the five countries having the worst performance.
4.3. Correlations
The correlations between the dependent variables and the main predictors are presented in Table 6. The highest correlation is between the independent variables for different models, ESG_Materiality and ESG_Combined, with a 0.748 correlation coefficient (r). There are significant, but small negative correlations between the ESG_Materiality and T1C, CAR, Cons, GDPcap, GDPgr, Inf, and GEPU (r = −0.236, −0.428, 0.594, −0.293, −0.087, 0.135, and 0.081, respectively). On the other hand, the accounting-based measure of financial performance, ROE is significantly correlated with T1C (r = −0.067), and CAR (r = 0.107). The ESG_Combined score is also negatively but weakly correlated with CAR, GDPcap, GDPgr, and CGS (r = −0,311, −0.350, −0.038, and −0.191 respectively), while positively correlated with ROE, Conc, Inf, PMIS and GEPU. In general, the Correlation matrix reveals that there is no high correlation between the explanatory variables and shows that there is no serious multicollinearity problem in this study.
4.4. Regression Results
We processed the data by using SPSS software and R Studio. After testing the classical assumptions on the initial 1260 bank-year observations, we carried out data-gap and outlier analyses on the data. After the data preprocessing, 1115 bank-year observations remained for our sample. We performed multiple linear regression to investigate whether ESG Materiality enhances the firm value based on four models, formulated specifically in Equations (11)–(14). The results of the regression analyses were shown in Table 7 and Table 8.
As highlighted in Table 7, the overall results for all regression models were significant (Significance = 0.000). In Table 7 and Table 8, according to the adjusted R square value, in Model 1 and Model 3, the independent variables explained the variance in PBV (dependent variable) as of 53.1% and 52.6% respectively. Moreover, in Model 2 and Model 4, the variance of TQ (dependent variable) was explained by independent variables of 12.7% and 12.3%, respectively. Our results also show that the ESG_Materiality (in the same period) is a significant predictor of PBV and TQ at a significance level of 0.000 (B = 0.684, p = 0.000, fixed effects) and 0.01 (β = 0.127, p = 0.01, fixed effects), respectively. (Table 7). On the other hand, the ESG_Combined is also a significant predictor of PBV although having a lower impact relative to ESG Materiality. Moreover, Model 4 also shows that the ESG_Combined score did not contribute significantly to TQ (Table 8).
As seen in Table 7, ESG Materiality contributed significantly to the firm value represented by PBV (significant value = 0.033, <0.05) in Model 1 and TQ (significant value = 0.01, <0.05) as we expected. Moreover, the coefficient on the ESG Materiality is significantly positive at 0.684 and 0.127, implying a positive valuation effect of ESG materiality for the banking sector in OECD countries. In the Model 1, ROE, Size, T1C, Conc, GDPcap, Inf, and GEPU also contributed significantly to PBV. The results of the coefficient values revealed that ROE was the most prominent variable contributing to PBV with a positive value (6.073) and followed by T1C at 1.695. In Model 2, coefficient on the ESG Materiality is also positive at 0.127 (significant value = 0.01, <0.05). On the other hand, as shown in Table 8, Models 3 and 4 show that the ESG Combined scores contributed significantly to PBV, but not to TQ. Considering Models 1 and 3, the results depicted that the ESG Materiality score contributed higher than the ESG Combine score in terms of explaining PBV.
4.5. Discussion
This study first sheds light on whether the ESG performance scores of banks as provided by the data provider Refinitiv in its Eikon database are significantly impacted by the consideration of financial materiality as per the SASB’s materiality map. Our study’s relevance arises from the fact that investors, who are the primary consumers of such ratings, do not precisely correspond to the financial materiality criteria employed by the major ESG data suppliers and rating agencies. We showed that for the banking industry, incorporating financial materiality in the evaluation of ESG performance leads to appreciable score differences and makes it possible to differentiate between banks that address significant ESG issues and those that focus on issues that are mostly immaterial to the industry, though a broad spectrum of ESG relevance. As a result, we demonstrated how the inclusion of financial materiality can enhance the informative value of ESG scores, which could lead to more precise investment assessments and wiser investment choices, in alignment with the previous studies focused on ESG materiality.
A recent study by Madison and Schiehll (2021) [16] revealed that financial materiality has an impact on how relevant ESG scores and rankings are, making it possible to identify investment opportunities in companies that score highly on business-critical ESG concerns. Similarly, Consolandi et al. (2020) [11] also demonstrated that ESG materiality had a greater impact on stock performance when it came to financially significant concerns. In its analysis of investment strategies, Kaiser [67] found that adding ESG risk materiality investors to a portfolio improved its risk-adjusted performance. Moreover, align with the other studies [8,15,25,68], our study bolsters the notion that using SASB mapping to evaluate companies’ ESG materiality performance can greatly enhance the usefulness of ESG scores and rankings.
Our findings also revealed that the SASB-adjusted score “ESG materiality score” diverged significantly from the initial Refinitiv ESG Combined score for all years and nations included in our sample (ESGC). For all years and nations, it is noteworthy that the ESG materiality scores—as calculated by us using the dynamic entropy and TOPSIS methods—were lower than the ESGC. Our findings support Madison and Schiehll’s [16] findings in that the SASB-adjusted scores for their sample firms were also lower than the MSCI initial scores. According to the results of our entropy analysis, the topics of “systemic risk management”, “financial inclusion and capacity building”, and “incorporating ESG factors in credit analysis” and their key ESG indicators ‘environmental assets under management’, ‘product access at a low price’, ‘climate change commercial risks opportunities’, and ‘environmental supply chain management’ were primarily responsible for this difference.
Another notable finding relying on regression results in this study concerned that ESG Materiality had a positive valuation effect of ESG materiality for the banking sector in OECD countries. ESG Materiality score contributed significantly to the firm value represented by PBV and TQ while the ESG Combined score did merely for PBV with a lower contribution. This finding supports the value-enhancing theory, pointing to a positive ESG–value relationship. However, we would like to also point out that the results of the study assume that there is a linear relationship between ESG scores and dependent variables. We examined the relationship between ESG scores and dependent variables in our sample using scatter plots. Since there is no significant difference in the R-square values of linear and non-linear (quadratic, cubic, etc.) fitted lines, we studied linear models within the scope of this study as a starting point. In this regard, investigating the nonlinear relationship is pointing out the direction for further research.
5. Conclusions
The literature has yet to address the connection between ESG performance and firm value. However, a rising body of research suggests that a firm’s ESG performance, particularly when materiality is taken into account, has a beneficial impact on its market value. The value-enhancing theory contends that corporate sustainability initiatives can increase a firm’s market value, both directly and indirectly. However, this idea has not been put to the test yet using financial materiality-adjusted ESG ratings, but rather original ESG scores. Furthermore, research looking at ESG materiality has not focused on the banking sector. Thus, the dearth of thorough research on the value relevance of ESG Materiality in the banking industry served as the driving force behind our effort.
In addition, the banking sector is dealing with growing investor demand and business challenges associated with legislation such as EU Taxonomy, Sustainable Finance Disclosure Regulation (SFDR), and Corporate Sustainability Due Diligence (CSDD) Directive. These new issues offer a special circumstance that enables us to test an intriguing study hypothesis: the applicability of ESG Materiality-valuation impacts in the sector. We looked into the relationship between the ESG Materiality performance and the market value of banks doing business in OECD nations.
This study contributes to the literature on the evaluation of ESG materiality performance and its impact on valuation. Since stakeholders are requesting greater information about ESG risks and management practices, banks are increasingly sharing ESG-related data. Focusing on the informational requirements of investors, we demonstrate how SASB-oriented ESG rankings and scores differ from the original ESG scores and are therefore more likely to deliver pertinent data to investors. Investors want to be aware of the financial materiality of ESG concerns before making investment decisions since responsible investment is fundamentally based on the financial logic of profit maximization. We also contributed methodologically in terms of calculating ESG materiality performance by integrating deeper techniques, unlike previous studies.
We have two limitations in our study, as with any empirical investigation. First, and related to the scope of our analysis, the focus was narrowed to banks included in the Refinitiv Eikon ESG database. The creation of a map on ESG material issues between SASB and Refinitiv is another potential drawback. Although the descriptions of each business and the major ESG issues were thoroughly examined to create these equivalences, there is still some subjectivity at play.
Finally, we conclude by pointing out the direction for further research. Future research could pursue this direction by (1) extending our methodology to other industries, (2) examining the contribution of SASB-identified materiality in the relationship between ESG performance and financial performance, and (3) estimating firm value enhanced by ESG materiality using machine learning techniques, considering both linear and non-linear modeling. Finally, we hope that our findings would support additional studies into how ESG Materiality affects business value.
Author Contributions
Conceptualization, G.A. and E.H.K.; Formal analysis, E.H.K.; Investigation, G.A. and E.H.K.; Methodology, E.H.K.; Project administration, G.A.; Supervision, G.A.; Writing—original draft, E.H.K.; Writing—review & editing, G.A. All authors have read and agreed to the published version of the manuscript.
Funding
This study was supported by The Scientific and Technological Research Council of Turkey (TUBITAK), under the Project Number: 120K901.
Institutional Review Board Statement
Not applicable.
Informed Consent Statement
Not applicable.
Data Availability Statement
The data that support the findings of this study are available from Refinitiv Eikon but restrictions apply to the availability of these data, which were used under license from Yildiz Technical University and so are not publicly available. Data sharing is not applicable.
Conflicts of Interest
We declare no conflict of interest in this work.
Appendix A

Table A1.
Pool of ESG Indicators Mapped with GICs.
| SASB Material Topics for Commercial Banking Industry | Refinitiv Indicators | Refinitiv Categories | Refinitiv Pillars |
|---|---|---|---|
| Disclosure Topic: Business Ethics | Policy Business Ethics | Community | Social |
| Policy Business Ethics Score | Community | Social | |
| Business Ethics Controversies | Community-Controversies | Controversies | |
| Improvement Tools Business Ethics | Community | Social | |
| Improvement Tools Business Ethics Score | Community | Social | |
| Policy Bribery and Corruption | Community | Social | |
| Policy Bribery and Corruption Score | Community | Social | |
| Bribery, Corruption and Fraud Controversies | Community-Controversies | Controversies | |
| Bribery, Corruption and Fraud Controversies Score | Community-Controversies | Controversies | |
| Policy Fair Competition | Community | Social | |
| Policy Fair Competition Score | Community | Social | |
| Anti-competition Controversies | Community-Controversies | Controversies | |
| Anti-Competition Controversies Count | Community-Controversies | Controversies | |
| Anti-Competition Controversies Score | Community-Controversies | Controversies | |
| Whistleblower Protection | Community | Social | |
| Whistleblower Protection Score | Community | Social | |
| Tax Fraud Controversies | Community-Controversies | Controversies | |
| Policy Fair Trade | Product Responsibility | Social | |
| Policy Fair Trade Score | Product Responsibility | Social | |
| Policy Responsible Marketing | Product Responsibility | Social | |
| Policy Responsible Marketing Score | Product Responsibility | Social | |
| Controversies Responsible Marketing | Product Responsibility-Controversies | Controversies | |
| Responsible Marketing Controversies | Product Responsibility-Controversies | Controversies | |
| Product Responsibility Monitoring | Product Responsibility | Social | |
| Product Responsibility Monitoring Score | Product Responsibility | Social | |
| Human Rights Policy Score | Human rights | Social | |
| Ethical Trading Initiative ETI | Human rights | Social | |
| Ethical Trading Initiative ETI Score | Human rights | Social | |
| Board Functions Policy | Management | Governance | |
| Board Functions Policy Score | Management | Governance | |
| Corporate Governance Board Committee | Management | Governance | |
| Audit Board Committee | Management | Governance | |
| Audit Committee Independence Score | Management | Governance | |
| Shareholder Rights Policy | Shareholder | Governance | |
| Shareholder Rights Policy Score | Shareholder | Governance | |
| Policy Shareholder Engagement | Shareholder | Governance | |
| Disclosure Topic: Systemic Risk Management | Crisis Management Systems | Community | Social |
| Climate Change Commercial Risks Opportunities Score | Emissions | Environmental | |
| Policy Emissions | Emissions | Environmental | |
| Targets Emissions | Emissions | Environmental | |
| Emission Reduction Target Percentage | Emissions | Environmental | |
| Resource Reduction Policy | Resource use | Environmental | |
| Policy Water Efficiency Score | Resource use | Environmental | |
| Policy Energy Efficiency Score | Resource use | Environmental | |
| Policy Environmental Supply Chain Score | Resource use | Environmental | |
| Environmental Supply Chain Management Score | Resource use | Environmental | |
| Environmental Supply Chain Monitoring Score | Resource use | Environmental | |
| Disclosure Topic: Financial Inclusion & Capacity Building | Policy Community Involvement | Community | Social |
| Policy Community Involvement Score | Community | Social | |
| Community Lending and Investments | Community | Social | |
| Community Lending and Investments Score | Community | Social | |
| Donations / Million in Revenue $ | Community | Social | |
| Product Sales at Discount to Emerging Markets | Community | Social | |
| Product Sales at Discount to Emerging Markets Score | Community | Social | |
| Product Access Low Price | Product Responsibility | Social | |
| Product Access Low Price Score | Product Responsibility | Social | |
| Controversies Product Access | Product Responsibility-Controversies | Controversies | |
| Training and Development Policy | Workforce | Social | |
| Training and Development Policy Score | Workforce | Social | |
| Policy Skills Training | Workforce | Social | |
| Net Employment Creation | Workforce | Social | |
| Net Employment Creation Score | Workforce | Social | |
| Disclosure Topic: Data Security | Policy Data Privacy | Product Responsibility | Social |
| Policy Data Privacy Score | Product Responsibility | Social | |
| Controversies Privacy | Product Responsibility-Controversies | Social | |
| Policy Cyber Security | Product Responsibility | Social | |
| Disclosure Topic: Incorporation of ESG Factors in Credit Analysis | Environmental Products Score | Innovation | Environmental |
| Eco-Design Products | Innovation | Environmental | |
| Revenue from Environmental Products | Innovation | Environmental | |
| Percentage of green products | Innovation | Environmental | |
| Environmental Assets Under Mgt | Innovation | Environmental | |
| Environmental Assets Under Mgt Score | Innovation | Environmental | |
| ESG Assets Under Management | Innovation | Environmental | |
| Equator Principles or Env Project Financing | Innovation | Environmental | |
| Equator Principles or Env Project Financing Score | Innovation | Environmental | |
| Environmental Project Financing | Innovation | Environmental | |
| Integrated Strategy in MD&A | CSR Strategy | Governance | |
| Supplier ESG training | Workforce | Social | |
| Supplier ESG training Score | Workforce | Social |
Appendix B
Table A2.
ESG Indicator Selection Process and Data Gap Ratios by Year and Indicators.
| #Observation = 8050; #Bank = 805 | #Bank = 451 | #Bank = 451 | #Bank = 147 | #Bank = 252 | |||||||||||
|---|---|---|---|---|---|---|---|---|---|---|---|---|---|---|---|
| 2020 | 2019 | 2018 | 2017 | 2016 | 2015 | 2014 | 2013 | 2012 | 2011 | Panel10yr_1 | Panel5yr_1 | Panel10yr_2 | Panel5yr_2 | Inc/Exc | |
| Policy Business Ethics | 44% | 53% | 60% | 62% | 69% | 78% | 80% | 80% | 81% | 82% | 44% | 24% | 0% | 0% | Exc-alt |
| Policy Business Ethics Score | 44% | 53% | 60% | 62% | 69% | 78% | 80% | 80% | 81% | 82% | 44% | 24% | 0% | 0% | Inc |
| Business Ethics Controversies | 97% | 97% | 97% | 97% | 97% | 97% | 96% | 96% | 97% | 97% | exc1 | exc1 | - | - | Exc-1 |
| Improvement Tools Business Ethics | 44% | 53% | 60% | 62% | 69% | 78% | 80% | 80% | 81% | 82% | 44% | 24% | 0% | 0% | Exc-alt |
| Improvement Tools Business Ethics Score | 44% | 53% | 60% | 62% | 69% | 78% | 80% | 80% | 81% | 82% | 44% | 24% | 0% | 0% | Inc |
| Policy Bribery and Corruption | 44% | 53% | 60% | 62% | 69% | 78% | 80% | 80% | 81% | 82% | 44% | 24% | 0% | 0% | Exc-alt |
| Policy Bribery and Corruption Score | 44% | 53% | 60% | 62% | 69% | 78% | 80% | 80% | 81% | 82% | 44% | 24% | 0% | 0% | Inc |
| Bribery, Corruption and Fraud Controversies | 44% | 53% | 60% | 62% | 69% | 78% | 80% | 80% | 81% | 82% | 44% | 24% | 0% | 0% | Exc-alt |
| Bribery, Corruption and Fraud Controversies Score | 44% | 53% | 60% | 62% | 69% | 78% | 80% | 80% | 81% | 82% | 44% | 24% | 0% | 0% | Inc |
| Policy Fair Competition | 44% | 53% | 60% | 62% | 69% | 78% | 80% | 80% | 81% | 82% | 44% | 24% | 0% | 0% | Exc-alt |
| Policy Fair Competition Score | 44% | 53% | 60% | 62% | 69% | 78% | 80% | 80% | 81% | 82% | 44% | 24% | 0% | 0% | Inc |
| Anti-Competition Controversies | 44% | 53% | 60% | 62% | 69% | 78% | 80% | 80% | 81% | 82% | 44% | 24% | 0% | 0% | Exc-alt |
| Anti-Competition Controversies Count | 96% | 96% | 97% | 97% | 98% | 99% | 97% | 98% | 99% | 100% | exc1 | exc1 | - | - | Exc-1 |
| Anti-Competition Controversies Score | 44% | 53% | 60% | 62% | 69% | 78% | 80% | 80% | 81% | 82% | 44% | 24% | 0% | 0% | Inc |
| Whistleblower Protection | 55% | 62% | 68% | 71% | 78% | 86% | 89% | 89% | 90% | 90% | 61% | 41% | exc2 | 23% | Exc-alt |
| Whistleblower Protection Score | 55% | 62% | 68% | 71% | 78% | 86% | 89% | 89% | 90% | 90% | 61% | 41% | exc2 | 23% | Exc-5 |
| Tax Fraud Controversies | 97% | 97% | 99% | 99% | 100% | 100% | 100% | 100% | 100% | 100% | exc1 | exc1 | - | - | Exc-1 |
| Policy Fair Trade | 44% | 44% | 44% | 44% | 44% | 44% | 44% | 44% | 44% | 44% | 0% | 0% | 0% | 0% | Exc-4 |
| Policy Fair Trade Score | 100% | 100% | 100% | 100% | 100% | 100% | 100% | 100% | 100% | 100% | exc1 | exc1 | - | - | Exc-1 |
| Policy Responsible Marketing | 44% | 44% | 44% | 44% | 44% | 44% | 44% | 44% | 44% | 44% | 0% | 0% | 0% | 0% | Inc |
| Policy Responsible Marketing Score | 100% | 100% | 100% | 100% | 100% | 100% | 100% | 100% | 100% | 100% | exc1 | exc1 | - | - | Exc-1 |
| Responsible Marketing Controversies | 44% | 44% | 44% | 44% | 44% | 44% | 44% | 44% | 44% | 44% | 0% | 0% | 0% | 0% | Exc-alt |
| Responsible Marketing Controversies Score | 44% | 44% | 44% | 44% | 44% | 44% | 44% | 44% | 44% | 44% | 0% | 0% | 0% | 0% | Exc-5 |
| Product Responsibility Monitoring | 44% | 44% | 44% | 44% | 44% | 44% | 44% | 44% | 44% | 44% | 0% | 0% | 0% | 0% | Inc |
| Product Responsibility Monitoring Score | 100% | 100% | 100% | 100% | 100% | 100% | 100% | 100% | 100% | 100% | exc1 | exc1 | - | - | Exc-1 |
| Human Rights Policy Score | 44% | 53% | 60% | 62% | 69% | 78% | 80% | 80% | 81% | 82% | 44% | 24% | 0% | 0% | Inc |
| Ethical Trading Initiative ETI | 44% | 44% | 44% | 44% | 44% | 44% | 44% | 44% | 44% | 44% | 0% | 0% | 0% | 0% | Exc-4 |
| Ethical Trading Initiative ETI Score | 100% | 100% | 100% | 100% | 100% | 100% | 100% | 100% | 100% | 100% | exc1 | exc1 | - | - | Exc-1 |
| Board Functions Policy | 44% | 44% | 44% | 44% | 44% | 44% | 44% | 44% | 44% | 44% | 0% | 0% | 0% | 0% | Exc-alt |
| Board Functions Policy Score | 44% | 44% | 44% | 44% | 44% | 44% | 44% | 44% | 44% | 44% | 0% | 0% | 0% | 0% | Inc |
| Corporate Governance Board Committee | 44% | 44% | 44% | 44% | 44% | 44% | 44% | 44% | 44% | 44% | 0% | 0% | 0% | 0% | Inc |
| Audit Board Committee | 44% | 44% | 44% | 44% | 44% | 44% | 44% | 44% | 44% | 44% | 0% | 0% | 0% | 0% | Inc |
| Audit Committee Independence Score | 48% | 48% | 48% | 48% | 48% | 48% | 48% | 48% | 48% | 48% | 6% | 6% | 11% | 8% | Inc |
| Shareholder Rights Policy | 44% | 44% | 44% | 44% | 44% | 44% | 44% | 44% | 44% | 44% | 0% | 0% | 0% | 0% | Exc-alt |
| Shareholder Rights Policy Score | 44% | 44% | 44% | 44% | 44% | 44% | 44% | 44% | 44% | 44% | 0% | 0% | 0% | 0% | Inc |
| Policy Shareholder Engagement | 44% | 44% | 44% | 44% | 44% | 44% | 44% | 44% | 44% | 44% | 0% | 0% | 0% | 0% | Inc |
| Crisis Management Systems | 44% | 53% | 60% | 62% | 69% | 78% | 80% | 80% | 81% | 82% | 44% | 24% | 0% | 0% | Inc |
| Climate Change Commercial Risks Opportunities Score | 44% | 53% | 60% | 62% | 69% | 78% | 80% | 80% | 81% | 82% | 44% | 24% | 0% | 0% | Inc |
| Policy Emissions | 45% | 45% | 45% | 45% | 45% | 45% | 45% | 45% | 45% | 45% | 30% | 30% | 24% | 26% | Inc |
| Target Emissions | 45% | 45% | 45% | 45% | 45% | 45% | 45% | 45% | 45% | 45% | 30% | 30% | 24% | 26% | Inc |
| Emission Reduction Target Percentage | 88% | 88% | 88% | 88% | 88% | 88% | 88% | 88% | 88% | 88% | 83% | 83% | exc2 | exc2 | Exc-2 |
| Resource Reduction Policy Score | 44% | 53% | 60% | 62% | 69% | 78% | 80% | 80% | 81% | 82% | 44% | 24% | 0% | 0% | Inc |
| Policy Environmental Supply Chain Score | 44% | 53% | 60% | 62% | 69% | 78% | 80% | 80% | 81% | 82% | 44% | 24% | 0% | 0% | Inc |
| Environmental Supply Chain Management Score | 45% | 52% | 61% | 63% | 68% | 77% | 80% | 80% | 81% | 81% | 53% | 36% | 31% | 23% | Inc |
| Environmental Supply Chain Monitoring Score | 91% | 92% | 93% | 94% | 95% | 94% | 95% | 95% | 96% | 97% | exc1 | exc1 | - | - | Exc-1 |
| Policy Community Involvement | 44% | 53% | 60% | 62% | 69% | 78% | 80% | 80% | 81% | 82% | 44% | 24% | 0% | 0% | Exc-alt |
| Policy Community Involvement Score | 44% | 53% | 60% | 62% | 69% | 78% | 80% | 80% | 81% | 82% | 44% | 24% | 0% | 0% | Inc |
| Community Lending and Investments (USD) | 95% | 95% | 96% | 96% | 96% | 97% | 96% | 97% | 97% | 98% | exc1 | exc1 | - | - | Exc-1 |
| Community Lending and Investments Score | 95% | 95% | 96% | 96% | 96% | 97% | 96% | 97% | 97% | 98% | exc1 | exc1 | - | - | Exc-1 |
| Total Donations To Revenues in million | 80% | 82% | 86% | 87% | 88% | 89% | 89% | 89% | 90% | 91% | 77% | 73% | exc2 | exc2 | Exc-2 |
| Product Sales at Discount to Emerging Markets | 44% | 44% | 44% | 44% | 44% | 44% | 44% | 44% | 44% | 44% | 0% | 0% | 0% | 0% | Inc |
| Product Sales at Discount to Emerging Markets Score | 100% | 100% | 100% | 100% | 100% | 100% | 100% | 100% | 100% | 100% | exc1 | exc1 | - | - | Exc-1 |
| Product Access Low Price | 44% | 53% | 60% | 62% | 69% | 78% | 80% | 80% | 81% | 82% | 44% | 24% | 0% | 0% | Exc-alt |
| Product Access Low Price Score | 44% | 53% | 60% | 62% | 69% | 78% | 81% | 81% | 81% | 82% | 45% | 25% | 1% | 1% | Inc |
| Controversies Product Access | 100% | 100% | 100% | 100% | 100% | 99% | 99% | 100% | 100% | 100% | exc1 | exc1 | - | - | Exc-1 |
| Training and Development Policy | 44% | 44% | 44% | 44% | 44% | 44% | 44% | 44% | 44% | 44% | 0% | 0% | 0% | 0% | Exc-alt |
| Training and Development Policy Score | 44% | 44% | 44% | 44% | 44% | 44% | 44% | 44% | 44% | 44% | 0% | 0% | 0% | 0% | Inc |
| Policy Skills Training | 44% | 44% | 44% | 44% | 44% | 44% | 44% | 44% | 44% | 44% | 0% | 0% | 0% | 0% | Inc |
| Net Employment Creation | 49% | 49% | 49% | 49% | 49% | 49% | 49% | 49% | 49% | 49% | 9% | 9% | 7% | 9% | Exc-alt |
| Net Employment Creation Score | 49% | 49% | 49% | 49% | 49% | 49% | 49% | 49% | 49% | 49% | 9% | 9% | 7% | 9% | Inc |
| Policy Data Privacy | 44% | 53% | 60% | 62% | 69% | 78% | 80% | 80% | 81% | 82% | 44% | 24% | 0% | 0% | Exc-alt |
| Policy Data Privacy Score | 44% | 53% | 60% | 62% | 69% | 78% | 80% | 80% | 81% | 82% | 44% | 24% | 0% | 0% | Inc |
| Controversies Privacy | 100% | 98% | 98% | 99% | 99% | 99% | 100% | 99% | 100% | 100% | exc1 | exc1 | - | - | Exc-1 |
| Policy Cyber Security | 44% | 62% | 79% | 84% | 88% | 91% | 92% | 92% | 93% | 94% | 68% | 49% | exc2 | exc2 | Exc-2 |
| Environmental Products Score | 44% | 51% | 60% | 62% | 67% | 76% | 80% | 80% | 81% | 82% | 43% | 23% | 0% | 0% | Inc |
| Eco-Design Products | 44% | 44% | 44% | 44% | 44% | 44% | 44% | 44% | 44% | 44% | 0% | 0% | 0% | 0% | Exc-4 |
| Revenue from Environmental Products | 100% | 100% | 100% | 100% | 100% | 100% | 100% | 100% | 100% | 100% | exc1 | exc1 | - | - | Exc-1 |
| Percentage of green products | 98% | 98% | 98% | 98% | 98% | 98% | 98% | 98% | 98% | 98% | exc1 | exc1 | - | - | Exc-1 |
| Environment Assets Under Mgt | 44% | 53% | 60% | 62% | 69% | 78% | 80% | 80% | 81% | 82% | 44% | 24% | 0% | 0% | Exc-alt |
| Environmental Assets Under Mgt Score | 44% | 53% | 60% | 62% | 69% | 78% | 80% | 80% | 81% | 82% | 44% | 24% | 0% | 0% | Inc |
| ESG Assets Under Management(USD) | 95% | 98% | 100% | 100% | 100% | 100% | 100% | 100% | 100% | 100% | exc1 | exc1 | - | - | Exc-1 |
| Equator Principles or Env Project Financing | 44% | 44% | 44% | 44% | 44% | 44% | 44% | 44% | 44% | 44% | 0% | 0% | 0% | 0% | Exc-alt |
| Equator Principles or Env Project Financing Score | 44% | 44% | 44% | 44% | 44% | 44% | 44% | 44% | 44% | 44% | 0% | 0% | 0% | 0% | Inc |
| Environmental Project Financing | 44% | 53% | 60% | 62% | 69% | 78% | 80% | 80% | 81% | 82% | 44% | 24% | 0% | 0% | Inc |
| Integrated Strategy in MD&A | 57% | 66% | 71% | 72% | 79% | 88% | 91% | 91% | 91% | 91% | 64% | 45% | exc2 | 31% | Exc-4 |
| Supplier ESG training | 44% | 44% | 44% | 44% | 44% | 44% | 44% | 44% | 44% | 44% | 0% | 0% | 0% | 0% | Inc |
| Supplier ESG training Score | 100% | 100% | 100% | 100% | 100% | 100% | 100% | 100% | 100% | 100% | exc1 | exc1 | - | - | Exc-1 |
Note: “#Bank” stands for number of banks. “Inc” stands for the indicators included in the study. “Exc-1”, “Exc-2”, “Exc-alt”, “Exc-4” and “Exc-5” stand for excluded indicators as described below: Iteration1: “Exc-1”; datagap for observations > 90% and datagap for criteria >90%; Iteration2: “Exc-2”; datagap for observations > 60% and then datagap for criteria > 30%; Iteration3: “Exc-alt”; Criterion has been deleted due to alternative criterion included; Iteration4: “Exc-4”: Excluded due to value of observations is mostly same; Iteration5: “Exc-5”: Excluded due to many outliers observed for the criterion.
Appendix C
Table A3.
ESG Combined and ESG Materiality Scores by Country-Descriptives.
| Country | Measure | ESG_Combined Score | ESG_Materiality Score | ||
|---|---|---|---|---|---|
| Statistic | Std. Error | Statistic | Std. Error | ||
| Australia | Mean | 57.95 | 2.13 | 0.61 | 0.02 |
| Median | 56.19 | 0.62 | |||
| Std. Deviation | 11.65 | 0.12 | |||
| Austria | Mean | 60.15 | 4.54 | 0.60 | 0.03 |
| Median | 54.29 | 0.60 | |||
| Std. Deviation | 14.35 | 0.10 | |||
| Belgium | Mean | 64.33 | 0.78 | 0.57 | 0.02 |
| Median | 64.63 | 0.57 | |||
| Std. Deviation | 1.75 | 0.04 | |||
| Canada | Mean | 56.29 | 2.36 | 0.55 | 0.02 |
| Median | 56.77 | 0.61 | |||
| Std. Deviation | 15.84 | 0.14 | |||
| Chile | Mean | 55.97 | 4.06 | 0.46 | 0.04 |
| Median | 49.48 | 0.45 | |||
| Std. Deviation | 15.74 | 0.17 | |||
| Colombia | Mean | 48.20 | 3.86 | 0.47 | 0.02 |
| Median | 48.35 | 0.49 | |||
| Std. Deviation | 14.96 | 0.07 | |||
| Czech Re | Mean | 51.74 | 1.17 | 0.40 | 0.01 |
| Median | 51.65 | 0.40 | |||
| Std. Deviation | 2.61 | 0.02 | |||
| Denmark | Mean | 41.52 | 2.82 | 0.49 | 0.01 |
| Median | 41.38 | 0.49 | |||
| Std. Deviation | 10.92 | 0.05 | |||
| France | Mean | 60.32 | 2.74 | 0.70 | 0.01 |
| Median | 56.52 | 0.70 | |||
| Std. Deviation | 12.27 | 0.05 | |||
| Germany | Mean | 50.58 | 4.89 | 0.59 | 0.01 |
| Median | 47.71 | 0.59 | |||
| Std. Deviation | 10.93 | 0.02 | |||
| Greece | Mean | 66.83 | 3.74 | 0.53 | 0.02 |
| Median | 67.02 | 0.50 | |||
| Std. Deviation | 11.82 | 0.06 | |||
| Hungary | Mean | 59.53 | 3.97 | 0.56 | 0.04 |
| Median | 57.43 | 0.54 | |||
| Std. Deviation | 8.87 | 0.08 | |||
| Ireland; | Mean | 53.35 | 3.66 | 0.50 | 0.02 |
| Median | 56.66 | 0.51 | |||
| Std. Deviation | 11.56 | 0.07 | |||
| Israel | Mean | 60.47 | 2.45 | 0.49 | 0.01 |
| Median | 57.83 | 0.48 | |||
| Std. Deviation | 10.94 | 0.06 | |||
| Italy | Mean | 53.68 | 4.07 | 0.51 | 0.03 |
| Variance | 248.75 | 0.02 | |||
| Std. Deviation | 15.77 | 0.14 | |||
| Japan | Mean | 33.89 | 1.91 | 0.35 | 0.01 |
| Median | 26.09 | 0.32 | |||
| Std. Deviation | 20.87 | 0.14 | |||
| Korea; R | Mean | 68.42 | 3.36 | 0.46 | 0.01 |
| Median | 69.84 | 0.46 | |||
| Std. Deviation | 16.80 | 0.06 | |||
| Mexico | Mean | 44.69 | 8.47 | 0.42 | 0.04 |
| Median | 58.14 | 0.51 | |||
| Std. Deviation | 32.81 | 0.16 | |||
| Netherlandd | Mean | 65.53 | 3.97 | 0.65 | 0.03 |
| Median | 68.17 | 0.65 | |||
| Std. Deviation | 12.55 | 0.09 | |||
| Norway | Mean | 69.36 | 5.55 | 0.56 | 0.02 |
| Median | 71.05 | 0.57 | |||
| Std. Deviation | 12.40 | 0.04 | |||
| Poland | Mean | 55.76 | 2.29 | 0.47 | 0.02 |
| Median | 57.23 | 0.48 | |||
| Std. Deviation | 14.51 | 0.10 | |||
| Portugal | Mean | 68.21 | 4.86 | 0.54 | 0.01 |
| Median | 69.48 | 0.54 | |||
| Std. Deviation | 10.86 | 0.01 | |||
| Russia | Mean | 55.92 | 2.22 | 0.41 | 0.02 |
| Median | 55.23 | 0.43 | |||
| Std. Deviation | 7.03 | 0.06 | |||
| Spain | Mean | 69.63 | 2.11 | 0.62 | 0.01 |
| Median | 70.96 | 0.63 | |||
| Std. Deviation | 10.56 | 0.07 | |||
| Sweden | Mean | 64.57 | 2.56 | 0.60 | 0.01 |
| Median | 65.10 | 0.60 | |||
| Std. Deviation | 11.46 | 0.05 | |||
| Switzerland | Mean | 44.05 | 0.69 | 0.53 | 0.06 |
| Median | 43.39 | 0.54 | |||
| Std. Deviation | 2.18 | 0.18 | |||
| Turkey | Mean | 60.01 | 1.50 | 0.52 | 0.01 |
| Median | 59.69 | 0.49 | |||
| Std. Deviation | 8.87 | 0.09 | |||
| United K | Mean | 48.09 | 2.25 | 0.54 | 0.02 |
| Median | 45.51 | 0.57 | |||
| Std. Deviation | 12.32 | 0.12 | |||
| United S | Mean | 36.60 | 0.53 | 0.35 | 0.00 |
| Median | 35.32 | 0.33 | |||
| Std. Deviation | 12.38 | 0.09 | |||
Appendix D
Table A4.
ESG Combined and ESG Materiality Scores by Year-Descriptive.
| Year | ESG_Combined | ESG_Materiality | ||||
|---|---|---|---|---|---|---|
| Statistic | Std. Error | Statistic | Std. Error | |||
| 2016 | Mean | 41.94 | 1.23 | 0.40 | 0.01 | |
| 95% Confidence Interval for Mean | Lower Bound | 39.52 | 0.38 | |||
| Upper Bound | 44.37 | 0.42 | ||||
| 5% Trimmed Mean | 41.54 | 0.39 | ||||
| Median | 39.72 | 0.36 | ||||
| Variance | 338.51 | 0.02 | ||||
| Std. Deviation | 18.40 | 0.14 | ||||
| Minimum | 5.62 | 0.14 | ||||
| Maximum | 87.30 | 0.78 | ||||
| Range | 81.67 | 0.65 | ||||
| Interquartile Range | 26.93 | 0.20 | ||||
| Skewness | 0.37 | 0.16 | 0.80 | 0.16 | ||
| Kurtosis | −0.49 | 0.32 | −0.35 | 0.32 | ||
| 2017 | Mean | 43.76 | 1.22 | 0.41 | 0.01 | |
| 95% Confidence Interval for Mean | Lower Bound | 41.36 | 0.39 | |||
| Upper Bound | 46.17 | 0.43 | ||||
| 5% Trimmed Mean | 43.47 | 0.41 | ||||
| Median | 41.39 | 0.38 | ||||
| Variance | 332.06 | 0.02 | ||||
| Std. Deviation | 18.22 | 0.14 | ||||
| Minimum | 3.90 | 0.16 | ||||
| Maximum | 87.94 | 0.77 | ||||
| Range | 84.03 | 0.61 | ||||
| Interquartile Range | 26.40 | 0.23 | ||||
| Skewness | 0.31 | 0.16 | 0.61 | 0.16 | ||
| Kurtosis | −0.49 | 0.32 | −0.61 | 0.32 | ||
| 2018 | Mean | 44.19 | 1.24 | 0.42 | 0.01 | |
| 95% Confidence Interval for Mean | Lower Bound | 41.76 | 0.40 | |||
| Upper Bound | 46.63 | 0.44 | ||||
| 5% Trimmed Mean | 43.92 | 0.42 | ||||
| Median | 42.02 | 0.38 | ||||
| Variance | 341.21 | 0.02 | ||||
| Std. Deviation | 18.47 | 0.14 | ||||
| Minimum | 3.92 | 0.21 | ||||
| Maximum | 87.59 | 0.86 | ||||
| Range | 83.67 | 0.64 | ||||
| Interquartile Range | 25.38 | 0.23 | ||||
| Skewness | 0.30 | 0.16 | 0.62 | 0.16 | ||
| Kurtosis | −0.55 | 0.32 | −0.50 | 0.32 | ||
| 2019 | Mean | 46.60 | 1.20 | 0.43 | 0.01 | |
| 95% Confidence Interval for Mean | Lower Bound | 44.23 | 0.41 | |||
| Upper Bound | 48.96 | 0.45 | ||||
| 5% Trimmed Mean | 46.54 | 0.43 | ||||
| Median | 46.14 | 0.41 | ||||
| Variance | 321.22 | 0.02 | ||||
| Std. Deviation | 17.92 | 0.14 | ||||
| Minimum | 3.48 | 0.19 | ||||
| Maximum | 86.46 | 0.78 | ||||
| Range | 82.97 | 0.58 | ||||
| Interquartile Range | 28.25 | 0.23 | ||||
| Skewness | 0.07 | 0.16 | 0.45 | 0.16 | ||
| Kurtosis | −0.69 | 0.32 | −0.79 | 0.32 | ||
| 2020 | Mean | 47.59 | 1.14 | 0.45 | 0.01 | |
| 95% Confidence Interval for Mean | Lower Bound | 45.34 | 0.43 | |||
| Upper Bound | 49.83 | 0.47 | ||||
| 5% Trimmed Mean | 47.58 | 0.45 | ||||
| Median | 46.37 | 0.42 | ||||
| Variance | 289.01 | 0.02 | ||||
| Std. Deviation | 17.00 | 0.14 | ||||
| Minimum | 2.79 | 0.19 | ||||
| Maximum | 86.02 | 0.77 | ||||
| Range | 83.24 | 0.58 | ||||
| Interquartile Range | 23.57 | 0.23 | ||||
| Skewness | 0.03 | 0.16 | 0.37 | 0.16 | ||
| Kurtosis | −0.32 | 0.32 | −0.89 | 0.32 | ||
References
- WEF Global Risks Report 2022. Available online: https://www.weforum.org/reports/global-risks-report-2022 (accessed on 20 June 2022).
- UN PRI Signatory Directory. Available online: https://www.unpri.org/signatories/signatory-resources/signatory-directory (accessed on 5 September 2022).
- GFANZ. The Announcement of GFANZ at COP26. Available online: https://www.gfanzero.com/press/amount-of-finance-committed-to-achieving-1-5c-now-at-scale-needed-to-deliver-the-transition/ (accessed on 17 July 2022).
- Eccles, R.G.; Klimenko, S.; The Investor Revolution. Shareholders are Getting Serious about Sustainability. Harvard Business Review 2019, May–June. Available online: https://hbr.org/2019/05/the-investor-revolution (accessed on 20 September 2022).
- KPMG. The Time Has Come: The KPMG Survey of Corporate Sustainability Reporting. Available online: https://assets.kpmg/content/dam/kpmg/xx/pdf/2020/11/the-time-has-come.pdf (accessed on 20 September 2022).
- Aras, G. Finance, Sustainability, and Business Legitimacy. In Handbook of Business Legitimacy; Rendtorff, J.D., Ed.; Springer: Cham, Switzerland, 2020. [Google Scholar] [CrossRef]
- Perrini, F.; Russo, A.; Tencati, A.; Vurro, C. Deconstructing the Relationship Between Corporate Social and Financial Performance. J. Bus. Ethics 2011, 102, 59–76. [Google Scholar] [CrossRef]
- Khan, M.; Serafeim, G.; Yoon, A. Corporate Sustainability: First Evidence on Materiality. Account. Rev. 2016, 91, 1697–1724. [Google Scholar] [CrossRef] [Green Version]
- Kotsantonis, S.; Bufalari, V. Do Sustainable Banks Outperform? Driving Value Creation through ESG Practices. Report of the Global Alliance for Banking on Values (GABV). Available online: https://www.gabv.org/resources-research/do-sustainable-banks-outperform-2019/ (accessed on 12 September 2022).
- Van Heijningen, K. The Impact of ESG Factor Materiality on Stock Performance of Firms. Erasmus Platform for Sustainable Value Creation Working Paper. Available online: https://www.rsm.nl/fileadmin/Faculty-Research/Centres/EPSVC/The_impact_of_ESG_factor_materiality_on_stock_performance_of_firms_Heijningen.pdf (accessed on 21 June 2022).
- Consolandi, C.; Eccles, R.G.; Gabbi, G. How material is a material issue? Stock returns and the financial relevance and financial intensity of ESG materiality. J. Sustain. Financ. Investig. 2020, 12, 1045–1068. [Google Scholar] [CrossRef]
- SASB Standards Application Guidance for Commercial Banking Industry. Available online: https://www.sasb.org/standards/download/?lang=en-us (accessed on 18 August 2022).
- Ocean Tomo LLC. Intangible Asset Market Value Study. Available online: https://www.oceantomo.com/intangible-asset-market-value-study/ (accessed on 5 May 2022).
- Brickley, J.A.; Smith, C.W.; Zimmerman, J.L. Business Ethics and Organizational Architecture. J. Bank. Financ. 2002, 26, 1821–1835. [Google Scholar] [CrossRef]
- Steinbarth, E.; Bennett, S. Materiality Matters: Targeting the ESG Issues that Impact Performance. Harvard Law School Forum on Corporate Governance 2018. Available online: https://corpgov.law.harvard.edu/2018/05/10/materiality-matters-targeting-theesg-issues-that-impact-performance/ (accessed on 19 June 2022).
- Madison, N.; Schiehll, E. The Effect of Financial Materiality on ESG Performance Assessment. Sustainability 2021, 13, 3652. [Google Scholar] [CrossRef]
- Buallay, A. Is sustainability reporting (ESG) associated with performance? Evidence from the European banking sector. Manag. Environ. Qual. Int. J. 2019, 30, 98–115. [Google Scholar] [CrossRef]
- El Ghoul, S.; Guedhami, O.; Kwok, C.C.Y.; Mishra, D.R. Does corporate social responsibility affect the cost of capital? J. Bank. Financ. 2011, 35, 2388–2406. [Google Scholar] [CrossRef]
- Buallay, A. Sustainability reporting and firm’s performance: Comparative study between manufacturing and banking sectors. Int. J. Prod. Perform. Manag. 2019, 69, 431–445. [Google Scholar] [CrossRef]
- Nguyen, L.T.; Nguyen, K.V. The impact of corporate social responsibility on the risk of commercial banks with different levels of financial constraint. Asia Pac. J. Bus. Adm. 2021, 13, 98–116. [Google Scholar] [CrossRef]
- Bouslah, K.; Kryzanowski, L.; M’Zali, B.J. Social performance and firm risk: Impact of the financial crisis. J. Bus. Ethics 2018, 149, 643–669. [Google Scholar] [CrossRef] [Green Version]
- Scholtens, B.; Klooster, S. Sustainability and bank risk. Humanit. Soc. Sci. 2019, 5, 105. [Google Scholar] [CrossRef] [Green Version]
- Boutin-Dufresne, F.; Savaria, P.J.T. Corporate social responsibility and financial risk. J. Invest. 2004, 13, 57–66. [Google Scholar] [CrossRef]
- Bolton, B.J. Corporate social responsibility and bank performance. SSRN 2013. [Google Scholar] [CrossRef]
- Boffo, R.; Patalano, R. ESG Investing: Practices, Progress and Challenges OECD Paris. 2020. Available online: https://www.oecd.org/finance/ESG-Investing-Practices-Progress-Challenges.pdf (accessed on 28 May 2022).
- Factset Truvalue Insight. At a Glance: Factset Truevalue Insight360 Datafeed. Available online: https://insight.factset.com/resources/at-a-glance-factset-truvalue-insight360-datafeed (accessed on 15 September 2022).
- Chami, R.; Cosimano, T.F.; Fullenkamp, C. Managing Ethical Risk: How investing in ethics adds value. J. Bank. Financ. 2002, 26, 1697–1718. [Google Scholar] [CrossRef]
- Sustainability Accounting Standards Board. Available online: https://www.sasb.org/about/ (accessed on 15 September 2022).
- Value Reporting Foundation. Available online: https://www.valuereportingfoundation.org (accessed on 15 September 2022).
- IFRS International Sustainability Standards Board. Available online: https://www.ifrs.org/groups/international-sustainability-standards-board/ (accessed on 15 September 2022).
- LSEG Refinitiv. Environmental Social and Governance Scores from Refinitiv. 2020. Available online: https://www.refinitiv.com/content/dam/marketing/en_us/documents/methodology/refinitiv-esg-scores-methodology.pdf (accessed on 18 August 2022).
- Hwang, C.L.; Yoon, K. Multiple Attribute Decision Making Methods and Applications; Springer: New York, NY, USA, 1981. [Google Scholar]
- Zeleny, M.A. Concept of Compromise Solutions and Method of Displaced Ideal. Comput. Oper. Res. 1974, 1, 479–496. [Google Scholar] [CrossRef]
- Hwang, C.L.; Yoon, K. Methods for multiple attribute decision making. Mult. Attrib. Decis. Mak. 1981, 1, 58–191. [Google Scholar]
- Krippendorff, K. Information Theory: Structural Models for Qualitative Data, 62nd ed.; Sage: Thousand Oaks, CA, USA, 1986. [Google Scholar]
- Aras, G.; Tezcan, N.; Furtuna, O.K.; Kazak, E.H. Corporate Sustainability Measurement based on Entropy Weight and TOPSIS: A Turkish Banking Case Study. Meditari Account. Res. 2017, 25, 391–413. [Google Scholar] [CrossRef]
- Aras, G.; Tezcan, N.; Furtuna, O.K. Multidimensional comprehensive corporate sustainability performance evaluation model: Evidence from an emerging market banking sector. J. Clean. Prod. 2018, 185, 600–609. [Google Scholar] [CrossRef]
- Raut, R.; Cheikhrouhou, N.; Kharat, M. Sustainability in The Banking Industry: A Strategic Multi-Criterion Analysis. Bus. Strat. Envrion. 2017, 26, 550–568. [Google Scholar] [CrossRef]
- Li, Y.; Zhao, L.; Suo, J. Comprehensive Assessment on Sustainable Development of Highway Transportation Capacity Based on Entropy Weight and TOPSIS. Sustainability 2014, 6, 4685–4693. [Google Scholar] [CrossRef]
- Li, W.; Yi, P.; Zhang, D. Sustainability Evaluation of Cities in Northeastern China Using Dynamic TOPSIS-Entropy Methods. Sustainability 2018, 10, 4542. [Google Scholar] [CrossRef] [Green Version]
- Fama, E. Efficient Capital Markets: Review of Theory and Empirical Evidence. J. Financ. 1970, 25, 383–417. [Google Scholar] [CrossRef]
- Wu, H.; Fargher, N.; Wright, S. Accounting for investments and the relevance of losses to firm value. Int. J. Acc. 2010, 45, 104–127. [Google Scholar] [CrossRef]
- Pramborg, B. Derivatives hedging, geographical diversification, and firm market value. J. Multinatl. Financ. Manag. 2004, 14, 117–133. [Google Scholar] [CrossRef]
- Ammanna, D.; Oesch, M.; Schmid, M. Corporate governance and firm value: International evidence. J. Empir. Financ. 2011, 18, 36–55. [Google Scholar] [CrossRef] [Green Version]
- Bae, S.C.; Kwon, T.H.; Lee, J.W. Does corporate diversification by business groups create value? Evidence from Korean chaebols. Pac. Basin Financ. J. 2011, 19, 535–553. [Google Scholar] [CrossRef]
- Konijn, S.J.J.; Kräussl, R.; Lucas, A. Blockholder dispersion and firm value. J. Corp. Financ. 2011, 17, 1330–1339. [Google Scholar] [CrossRef] [Green Version]
- Mørck, R.; Shleifer, A.; Vashny, R. Management Ownership and Market Valuation, J. Financ. Econ. 1988, 20, 293–315. [Google Scholar] [CrossRef]
- Erickson, J.; Park, Y.W.; Reising, J.; Shin, H.-H. Board composition and firm value under concentrated ownership: The Canadian evidence. Pac. Basin Financ. J. 2005, 13, 387–410. [Google Scholar] [CrossRef]
- McConnell, J.; Servaes, H. Additional Evidence on Equity Ownership and Corporate Value. J. Financ. Econ. 1990, 27, 595–612. [Google Scholar] [CrossRef]
- Smith, C.; Watts, R. The Investment Opportunity Set and Corporate Financing, Dividend and Compensation Policies. J. Financ. Econ. 1992, 32, 263–292. [Google Scholar] [CrossRef]
- Jensen, M.C. Agency costs of free cash flow, corporate finance, and takeovers. Am. Econ. Rev. 1986, 76, 323–329. [Google Scholar]
- Connelly, J.T.; Limpaphayom, P.; Nagarajan, N.J. Form versus substance: The effect of ownership structure and corporate governance on firm value in Thailand. J. Bank. Financ. 2012, 36, 1722–1743. [Google Scholar] [CrossRef]
- Faleye, O. Classified boards, firm value, and managerial entrenchment. J. Financ. Econ. 2007, 83, 501–529. [Google Scholar] [CrossRef]
- Hafez, H.M. Corporate social responsibility and financial performance: An empirical study on Egyptian banks. Corp. Ownersh. Control 2015, 12, 107–127. [Google Scholar] [CrossRef] [Green Version]
- Bătae, O.M.; Dragomir, V.D.; Feleagă, L. The relationship between environmental, social, and financial performance in the banking sector: A European study. J. Clean. Prod. 2021, 290, 125791. [Google Scholar] [CrossRef]
- Siueia, T.T.; Wang, J.; Deladem, T.G. Corporate social responsibility and financial performance: A comparative study in the Sub-Saharan Africa banking sector. J. Clean. Prod. 2019, 226, 658–668. [Google Scholar] [CrossRef]
- Jin, J.Y.; Kanagaretnam, K.; Lobo, G. Ability of accounting and audit quality variables to predict bank failure during the financial crisis. J. Bank. Financ. 2011, 35, 2811–2819. [Google Scholar] [CrossRef]
- Menicucci, E.; Paolucci, G. ESG dimensions and bank performance: An empirical investigation in Italy. Corp. Gov. Int. J. Bus. Soc. ahead-of-print. 2022. [Google Scholar] [CrossRef]
- Wu, M.W.; Shen, C.H. Corporate social responsibility in the banking industry: Motives and financial performance. J. Bank. Financ. 2013, 37, 3529–3547. [Google Scholar] [CrossRef]
- Shen, C.H.; Wu, M.W.; Chen, T.H.; Fang, H. To engage or not to engage in corporate social responsibility: Empirical evidence from global banking sector. Econ. Modell. 2016, 55, 207–225. [Google Scholar] [CrossRef]
- Demirgüç-Kunt, A.; Huizinga, H. Determinants of commercial bank interest margins and profitability: Some international evidence. World Bank Econ. Rev. 1999, 13, 379–408. [Google Scholar] [CrossRef] [Green Version]
- Seifert, B.; Gonenc, H. The effects of country and firm level governance on cash management. J. Int. Financ. Mark. Inst. Money 2018, 52, 1–16. [Google Scholar] [CrossRef] [Green Version]
- Athari, S.A.; Bahreini, M. The impact of external governance and regulatory settings on the profitability of Islamic banks: Evidence from Arab markets. Int J. Fin Econ. 2021. [Google Scholar] [CrossRef]
- Shleifer, A.; Vishny, R.W. Large shareholders and corporate control. J. Political Econ. 1986, 94, 461–488. [Google Scholar] [CrossRef] [Green Version]
- Porta, R.L.; Lopez-de-Silanes, F.; Shleifer, A.; Vishny, R.W. Law and finance. J. Political Econ. 1988, 106, 1113–1155. [Google Scholar] [CrossRef]
- Davis, S.J. An Index of Global Economic Policy Uncertainty. Macroecon. Rev. 2016. NBER Working Paper No. 22740. Available online: http://www.nber.org/papers/w22740 (accessed on 4 November 2022).
- Kaiser, L. ESG integration: Value, growth and momentum. J. Asset Manag. 2020, 21, 32–51. [Google Scholar] [CrossRef]
- Schiehll, E.; Kolahgar, S. Financial materiality in the informativeness of sustainability reporting. Bus. Strategy Environ. 2021, 30, 840–855. [Google Scholar] [CrossRef]
Figure 1.
The framework of ESG Materiality performance measurement.

Figure 2.
Dynamic TOPSIS results (ESG_Materiality) by years and its comparison with ESG Combined Scores.
Figure 2.
Dynamic TOPSIS results (ESG_Materiality) by years and its comparison with ESG Combined Scores.

Figure 3.
Dynamic TOPSIS results (ESG_Materiality) by countries and its comparison with ESG Combined Scores.
Figure 3.
Dynamic TOPSIS results (ESG_Materiality) by countries and its comparison with ESG Combined Scores.

Table 1.
The sample composition by country distribution.
| Valid | Frequency | Percent | Cumulative Percent |
|---|---|---|---|
| Australia | 30 | 2.7 | 2.7 |
| Austria | 10 | 0.9 | 3.6 |
| Belgium | 5 | 0.4 | 4.0 |
| Canada | 45 | 4.0 | 8.1 |
| Chile | 15 | 1.3 | 9.4 |
| Colombia | 15 | 1.3 | 10.8 |
| Czech Republic | 5 | 0.4 | 11.2 |
| Denmark | 15 | 1.3 | 12.6 |
| France | 20 | 1.8 | 14.3 |
| Germany | 5 | 0.4 | 14.8 |
| Greece | 10 | 0.9 | 15.7 |
| Hungary | 5 | 0.4 | 16.1 |
| Ireland; Republic of | 10 | 0.9 | 17.0 |
| Israel | 20 | 1.8 | 18.8 |
| Italy | 15 | 1.3 | 20.2 |
| Japan | 120 | 10.8 | 30.9 |
| Korea; Republic (S. Korea) | 25 | 2.2 | 33.2 |
| Mexico | 15 | 1.3 | 34.5 |
| Netherlands | 10 | 0.9 | 35.4 |
| Norway | 5 | 0.4 | 35.9 |
| Poland | 40 | 3.6 | 39.5 |
| Portugal | 5 | 0.4 | 39.9 |
| Russia | 10 | 0.9 | 40.8 |
| Spain | 25 | 2.2 | 43.0 |
| Sweden | 20 | 1.8 | 44.8 |
| Switzerland | 10 | 0.9 | 45.7 |
| Turkey | 35 | 3.1 | 48.9 |
| United Kingdom | 30 | 2.7 | 51.6 |
| United States of America | 540 | 48.4 | 100.0 |
| Total | 1115 | 100.0 |
Table 2.
Descriptive statistics of the final ESG indicator set for ESG materiality performance measurement. Note. #bank = 252; 5 year; 1260 observations.
Table 2.
Descriptive statistics of the final ESG indicator set for ESG materiality performance measurement. Note. #bank = 252; 5 year; 1260 observations.
| SASB GIC | ESG Indicators | Type | Mean | Mod | Median | Std Dev | |
|---|---|---|---|---|---|---|---|
| Disclosure Topic: Business Ethics | BE_1 | Policy Business Ethics Score | Score | 51.75 | 60.19 | 59.95 | 21.37 |
| BE_2 | Improvement Tools Business Ethics Score | Score | 47.67 | 0.00 | 67.15 | 31.24 | |
| BE_3 | Policy Bribery and Corruption Score | Score | 49.84 | 0.00 | 64.70 | 27.98 | |
| BE_4 | Bribery, Corruption and Fraud Controversies Score | Score | 51.63 | 60.84 | 60.70 | 21.76 | |
| BE_5 | Policy Fair Competition Score | Score | 43.47 | 0.00 | 74.06 | 36.81 | |
| BE_6 | Anti-Competition Controversies Score | Score | 52.66 | 58.45 | 58.44 | 17.65 | |
| BE_7 | Policy Responsible Marketing | Binary/Boolean | 0.02 | 0.00 | 0.00 | 0.12 | |
| BE_8 | Product Responsibility Monitoring | Binary/Boolean | 0.08 | 0.00 | 0.00 | 0.26 | |
| BE_9 | Human Rights Policy Score | Score | 41.90 | 18.53 | 18.53 | 33.19 | |
| BE_10 | Board Functions Policy Score | Score | 31.69 | 0.00 | 0.00 | 34.59 | |
| BE_11 | Corporate Governance Board Committee | Binary/Boolean | 0.61 | 1.00 | 1.00 | 0.49 | |
| BE_12 | Audit Board Committee | Binary/Boolean | 0.92 | 1.00 | 1.00 | 0.27 | |
| BE_13 | Audit Committee Independence Score | Score | 50.30 | 54.76 | 54.76 | 19.13 | |
| BE_14 | Shareholder Rights Policy Score | Score | 49.40 | 50.25 | 50.25 | 12.86 | |
| BE_15 | Policy Shareholder Engagement | Binary/Boolean | 0.86 | 1.00 | 1.00 | 0.35 | |
| Disclosure Topic: Systemic Risk Management | SRM_1 | Crisis Management Systems | Binary/Boolean | 0.68 | 1.00 | 1.00 | 0.47 |
| SRM_2 | Climate Change Commercial Risks Opportunities Score | Score | 31.53 | 0.00 | 0.00 | 42.03 | |
| SRM_3 | Policy Emissions | Binary/Boolean | 0.55 | 1.00 | 1.00 | 0.50 | |
| SRM_4 | Target Emissions | Binary/Boolean | 0.35 | 0.00 | 0.00 | 0.48 | |
| SRM_5 | Resource Reduction Policy Score | Score | 45.98 | 74.08 | 74.08 | 33.67 | |
| SRM_6 | Policy Environmental Supply Chain Score | Score | 29.58 | 0.00 | 0.00 | 40.74 | |
| SRM_7 | Environmental Supply Chain Management Score | Score | 25.22 | 0.00 | 0.00 | 39.14 | |
| Disclosure Topic: Financial Inclusion and Capacity Building | FICB_1 | Policy Community Involvement Score | Score | 51.46 | 59.30 | 58.85 | 18.94 |
| FICB_2 | Product Sales at Discount to Emerging Markets | Binary/Boolean | 0.02 | 0.00 | 0.00 | 0.12 | |
| FICB_3 | Product Access Low Price Score | Score | 27.57 | 0.00 | 0.00 | 40.56 | |
| FICB_4 | Training and Development Policy Score | Score | 54.13 | 63.18 | 63.18 | 23.91 | |
| FICB_5 | Policy Skills Training | Binary/Boolean | 0.77 | 1.00 | 1.00 | 0.42 | |
| FICB_6 | Net Employment Creation Score | Score | 45.47 | 8.44 | 41.39 | 26.57 | |
| Disclosure Topic: Data Security | DS_1 | Policy Data Privacy Score | Score | 50.03 | 56.77 | 56.77 | 18.76 |
| Disclosure Topic: Incorporation of ESG Factors in Credit Analysis | IESG_1 | Environmental Products Score | Score | 38.48 | 0.00 | 0.00 | 40.63 |
| IESG_2 | Environmental Assets Under Mgt Score | Score | 20.84 | 0.00 | 0.00 | 38.99 | |
| IESG_3 | Equator Principles or Env Project Financing Score | Score | 40.33 | 0.00 | 0.00 | 41.97 | |
| IESG_4 | Environmental Project Financing | Binary/Boolean | 0.42 | 0.00 | 0.00 | 0.49 | |
| IESG_5 | Supplier ESG training | Binary/Boolean | 0.09 | 0.00 | 0.00 | 0.29 |
Table 3.
Definitions, abbreviations and sources of variables.
| Variable | Abbreviation | Explanation | Source |
|---|---|---|---|
| Dependent variables | |||
| Price to Book Value | PBV | Measures the excess of a company’s book value of equity over the market value of its shares, or share price. | Refinitiv |
| Tobin’s Q | TQ | The proportion of total book value of assets to total book value of (total market value of equity plus total book value of liabilities). The number of outstanding common shares multiplied by the closing price at the end of the year yields the total market value of equity. | Computed by the authors with data from Refinitiv |
| Independent variables | |||
| ESG Materiality Score | ESG_M | Calculated by authors based on SASB Materiality Map, materiality-adjusted ESG performance score aggregates indicators for the commercial banking industry of five material topics, including “business ethics”, “systematic risk management”, “financial inclusion and capacity building”, “data security”, and “incorporation of ESG factor in credit analysis”. | Computed by authors with Dynamic Entropy and TOPSIS methodology with data from Refinitiv |
| ESG Combined Score | ESG_C | Based on the reported data related to the ESG pillars, combined ESG scores offer a balanced and thorough rating of a company’s ESG performance. The ESG controversies overlay is taken from international media sources. | Refinitiv |
| Bank-specific control variables | |||
| Return on Equity | ROE | Defines as net income after taxes divided by total equity, and it illustrates the profitability of the invested equity from the accounting standpoint. | Refinitiv |
| Size | Size | The natural logarithm of total assets | Refinitiv |
| Tier 1 Capital Ratio | T1C | The Tier 1 capital ratio is the ratio of a bank’s core equity capital to its total risk-weighted assets | Refinitiv |
| Capital Adequacy Ratio | CAR | Measures the capacity of a bank to absorb losses using specified equity components. Total own funds minus total risk-weighted assets equals the calculation. | Computed by the authors with data from Refinitiv |
| Industry-specific control variables | |||
| Concentration | Conc | Five largest commercial banks’ assets as a percentage of all commercial banks’ assets. | World Bank- Global Financial Development Database |
| Country-specific control variables | |||
| GDP per capita | GDPcap | GDP is calculated as the total gross value added by all producers who are residents of the economy, plus any applicable product taxes, minus any unaccounted-for subsidies. | World Bank- World Development Indicators Database |
| GDP growth | GDPgr | It displays the GDP’s yearly percentage growth rate at market prices calculated using constant local currency. | World Bank- World Development Indicators Database |
| Inflation | Inf | The rate of price change in the economy as a whole is shown by inflation as calculated by the yearly growth rate of the GDP implicit deflator. The difference between GDP in current local currency and GDP in constant local currency is known as the GDP implicit deflator. | World Bank- World Development Indicators Database |
| Country Governance Score | CGS | The Worldwide Governance Indicators (WGI) creates aggregate indicators of six country governance (CG) dimensions, including voice and accountability, political stability and the absence of terrorism or acts of violence, government effectiveness, regulatory quality, rule of law, and corruption control. | World Bank- Worldwide Governance Indicators Database |
| Protecting Minority Investors Score | PMIS | The extent of disclosure index, extent of director liability index, extent of shareholder rights index, extent of shareholder claims index, extent of ownership and control index, and extent of corporate transparency index are used to calculate the annual score of protecting minority investors. | World Bank- Doing Business Database |
| Global Economic Policy Uncertainty | GEPU | Index of Global Economic Policy Uncertainty | www.policyuncertainity.com, (accessed on 17 October 2022) |
Table 4.
Descriptive Statistics.
| Variable | Mean | Std. Deviation | Range | Minimum | Maximum |
|---|---|---|---|---|---|
| PBV | 1.1913 | 0.5963 | 3.7699 | 0.1591 | 3.9290 |
| TQ | 1.0295 | 0.1635 | 5.1813 | 0.8727 | 6.0540 |
| ESG_M | 0.4236 | 0.1423 | 0.7181 | 0.1376 | 0.8557 |
| ESG_C | 44.8168 | 18.0931 | 85.1513 | 2.7865 | 87.9379 |
| ROE | 0.0933 | 0.0472 | 0.7847 | −0.5108 | 0.2739 |
| Size | 24.7097 | 1.7556 | 7.5367 | 21.2859 | 28.8226 |
| T1C | 0.1331 | 0.0270 | 0.2270 | 0.0600 | 0.2870 |
| CAR | 0.0991 | 0.0380 | 0.3490 | 0.0043 | 0.3533 |
| Conc | 65.1972 | 14.4937 | 48.5472 | 51.4528 | 100.0000 |
| GDPcap | 48,353.6291 | 18,071.2588 | 81,788.2163 | 5312.1986 | 87,100.4148 |
| GDPgr | 0.4204 | 2.8659 | 19.0137 | −11.2533 | 7.7604 |
| Inf | 1.9737 | 2.3684 | 20.0804 | −3.6046 | 16.4758 |
| CGS | 1.0737 | 0.4860 | 2.5576 | −0.7410 | 1.8166 |
| PMIS | 70.6278 | 5.8888 | 34.0000 | 50.0000 | 84.0000 |
| GEPU | 239.4484 | 51.2611 | 146.4095 | 148.6246 | 295.0341 |
Table 5.
Entropy weights.
| SASB GIC | Ind_Code | ESG Indicators | Weight | Materiality Order | |
|---|---|---|---|---|---|
| General | Category | ||||
| Business Ethics | BE_1 | Policy Business Ethics Score | 0.0139 | 17 | 7 |
| BE_2 | Improvement Tools Business Ethics Score | 0.0316 | 10 | 3 | |
| BE_3 | Policy Bribery and Corruption Score | 0.0242 | 13 | 5 | |
| BE_4 | Bribery, Corruption and Fraud Controversies Score | 0.0144 | 16 | 6 | |
| BE_5 | Policy Fair Competition Score | 0.0479 | 9 | 2 | |
| BE_6 | Anti-Competition Controversies Score | 0.0094 | 20 | 8 | |
| BE_7 | Policy Responsible Marketing | 0.0005 | 34 | 15 | |
| BE_8 | Product Responsibility Monitoring | 0.0022 | 30 | 12 | |
| BE_9 | Human Rights Policy Score | 0.0278 | 12 | 4 | |
| BE_10 | Board Functions Policy Score | 0.0675 | 6 | 1 | |
| BE_11 | Corporate Governance Board Committee | 0.0044 | 25 | 11 | |
| BE_12 | Audit Board Committee | 0.0010 | 32 | 14 | |
| BE_13 | Audit Committee Independence Score | 0.0075 | 21 | 9 | |
| BE_14 | Shareholder Rights Policy Score | 0.0054 | 22 | 10 | |
| BE_15 | Policy Shareholder Engagement | 0.0018 | 31 | 13 | |
| Systemic Risk Management | SRM_1 | Crisis Management Systems | 0.0038 | 27 | 7 |
| SRM_2 | Climate Change Commercial Risks Opportunities Score | 0.0904 | 4 | 2 | |
| SRM_3 | Policy Emissions | 0.0039 | 26 | 6 | |
| SRM_4 | Target Emissions | 0.0049 | 24 | 5 | |
| SRM_5 | Resource Reduction Policy Score | 0.0294 | 11 | 4 | |
| SRM_6 | Policy Environmental Supply Chain Score | 0.0942 | 3 | 1 | |
| SRM_7 | Environmental Supply Chain Management Score | 0.0836 | 5 | 3 | |
| Financial Inclusion and Capacity Building | FICB_1 | Policy Community Involvement Score | 0.0112 | 19 | 4 |
| FICB_2 | Product Sales at Discount to Emerging Markets | 0.0005 | 33 | 6 | |
| FICB_3 | Product Access Low Price Score | 0.1012 | 2 | 1 | |
| FICB_4 | Training and Development Policy Score | 0.0157 | 14 | 2 | |
| FICB_5 | Policy Skills Training | 0.0028 | 28 | 5 | |
| FICB_6 | Net Employment Creation Score | 0.0150 | 15 | 3 | |
| Data Security | DS_1 | Policy Data Privacy Score | 0.0116 | 18 | 1 |
| Incorporation of ESG Factors in Credit Analysis | IESG_1 | Environmental Products Score | 0.0663 | 7 | 2 |
| IESG_2 | Environmental Assets Under Mgt Score | 0.1332 | 1 | 1 | |
| IESG_3 | Equator Principles or Env Project Financing Score | 0.0650 | 8 | 3 | |
| IESG_4 | Environmental Project Financing | 0.0053 | 23 | 4 | |
| IESG_5 | Supplier ESG training | 0.0025 | 29 | 5 | |
Table 6.
Pearson correlations between the independent variables.
| ESG_M | ROE | T1C | CAR | Conc | GDPcap | GDPgr | Inf | CGS | PMIS | GEPU | |
|---|---|---|---|---|---|---|---|---|---|---|---|
| ESG_C | 0.748 ** | 0.108 ** | 0.098 ** | −0.311 ** | 0.524 ** | −0.350 ** | −0.038 | 0.175 ** | −0.191 ** | 0.059 * | 0.071 * |
| ESG_M | 0.034 | 0.236 ** | −0.428 ** | 0.594 ** | −0.293 ** | −0.087 ** | 0.135 ** | −0.049 | 0.047 | 0.081 ** | |
| ROE | −0.067 * | 0.107 ** | −0.021 | −0.051 | 0.229 ** | 0.255 ** | −0.124 ** | 0.202 ** | −0.100 ** | ||
| T1C | −0.115 ** | 0.297 ** | −0.097 ** | −0.062 * | −0.013 | 0.109 ** | −0.139 ** | 0.049 | |||
| CAR | −0.493 ** | 0.197 ** | 0.078 ** | 0.106 ** | −0.157 ** | 0.066 * | −0.020 | ||||
| Conc | −0.425 ** | −0.006 | −0.015 | 0.022 | −0.018 | −0.035 | |||||
| GDPcap | −0.008 | −0.421 ** | 0.672 ** | 0.130 ** | 0.059 * | ||||||
| GDPgr | 0.064 * | 0.025 | −0.021 | −0.482 ** | |||||||
| Inf | −0.633 ** | 0.162 ** | 0.032 | ||||||||
| CGS | 0.040 | −0.086 ** | |||||||||
| PMIS | 0.005 |
Signif. Codes: 0 ‘***’ 0.001 ‘**’ 0.01 ‘*’ 0.05 ‘.’ 0.1 ‘ ’ 1.
Table 7.
Regression results for ESG_Materiality as a predictor.
| PBV(Model 1) | TQ(Model 2) | |
|---|---|---|
| Coefficients (p-Value) | Coefficients (p-Value) | |
| ESG_Materiality | 0.684 *** (0.000) | 0.127 * (0.01) |
| ROE | 6.073 *** (0.000) | 0.332 ** (0.001) |
| Size | −0.141 *** (0.000) | −0.004 (0.370) |
| Tier1 Capital | 1.695 *** (0.001) | 0.353. (0.056) |
| Capital Adequacy Ratio | 0.809. (0.051) | 1.482 *** (0.000) |
| Concentration | −0.005 *** (0.000) | −0.001. (0.077) |
| GDPcap | 0.000 * (0.014) | 0.000 ** (0.004) |
| GDPgr | −0.016. (0.002) | 0.001 (0.613) |
| Inflation | −0.031 * (0.002) | −0.003 (0.206) |
| Country Governance Score | 0.058 (0.215) | 0.058 *** (0.001) |
| Protect Minority Investors Score | 0.002 (0.484) | 0.001 * (0.016) |
| Global Risk Score-GEPU | −0.003 *** (0.000) | 0.000 (0.312) |
| Constant | 4.339 *** (0.000) | 0.792 *** (0.000) |
| Bank fixed effects | Yes | Yes |
| Time fixed effects | Yes | Yes |
| Breusch-Pagan LM | 415.45 *** | 36,955 *** |
| Hausman Chi-square | 172.17 ** | 688.63 *** |
| Adjusted R-square | 0.531 | 0.127 |
| F (p value) | 106.040 *** | 14.510 *** |
| N | 1115 | 1115 |
| Banks | 223 | 223 |
Signif. Codes: 0 ‘***’ 0.001 ‘**’ 0.01 ‘*’ 0.05 ‘.’ 0.1 ‘ ’ 1.
Table 8.
Regression results for ESG_Combined as a predictor.
| PBV(Model 3) | TQ(Model 4) | |
|---|---|---|
| Coefficients (p-Value) | Coefficients (p-Value) | |
| ESG_Combined | 0.003 ** (0.001) | 0.000 (0.463) |
| ROE | 6.088 *** (0.000) | 0.350 ** (0.001) |
| Size | −0.120 *** (0.000) | 0.001 (0.707) |
| Tier1 Capital | 1.946 *** (0.000) | 0.386 * (0.037) |
| Capital Adequacy Ratio | 0.804 (0.054) | 1.485 *** (0.000) |
| Concentration | −0.004 ** (0.001) | −0.001 (0.236) |
| GDPcap | 0.000 * (0.005) | 0.000 ** (0.009) |
| GDPgr | 0.044. (0.055) | 0.001 (0.666) |
| Inflation | −0.017 *** (0.000) | −0.003 (0.339) |
| Country Governance Score | 0.068 (0.151) | 0.057 ** (0.001) |
| Protect Minority Investors Score | 0.002 (0.386) | 0.002 * (0.010) |
| Global Risk Score | −0.003 *** (0.000) | 0.000 (0.361) |
| Constant | 3.824 *** (0.000) | 0.660 *** (0.000) |
| Bank fixed effects | Yes | Yes |
| Time fixed effects | Yes | No |
| Breusch-Pagan LM | 394.58 *** | 36,502 *** |
| Hausman Chi-square | 518.94 *** | 720.99 *** |
| Adjusted R-square | 0.526 *** | 0.123 *** |
| F (p value) | 104.186 *** | 14.025 *** |
| N | 1115 | 1115 |
| Banks | 223 | 223 |
Signif. Codes: 0 ‘***’ 0.001 ‘**’ 0.01 ‘*’ 0.05 ‘.’ 0.1 ‘ ’ 1.
Publisher’s Note: MDPI stays neutral with regard to jurisdictional claims in published maps and institutional affiliations. |
© 2022 by the authors. Licensee MDPI, Basel, Switzerland. This article is an open access article distributed under the terms and conditions of the Creative Commons Attribution (CC BY) license (https://creativecommons.org/licenses/by/4.0/).
Share and Cite
MDPI and ACS Style
Aras, G.; Hacioglu Kazak, E. Enhancing Firm Value through the Lens of ESG Materiality: Evidence from the Banking Sector in OECD Countries. Sustainability 2022, 14, 15302. https://doi.org/10.3390/su142215302
AMA Style
Aras G, Hacioglu Kazak E. Enhancing Firm Value through the Lens of ESG Materiality: Evidence from the Banking Sector in OECD Countries. Sustainability. 2022; 14(22):15302. https://doi.org/10.3390/su142215302
Chicago/Turabian StyleAras, Guler, and Evrim Hacioglu Kazak. 2022. "Enhancing Firm Value through the Lens of ESG Materiality: Evidence from the Banking Sector in OECD Countries" Sustainability 14, no. 22: 15302. https://doi.org/10.3390/su142215302
Note that from the first issue of 2016, this journal uses article numbers instead of page numbers. See further details here.