Article

Palladium/Graphene Oxide Nanocomposite for Hydrogen Gas Sensing Applications Based on Tapered Optical Fiber

by
Mohammed Majeed Alkhabet
1,2,
Zaher Mundher Yaseen
3,*,
Moutaz Mustafa A. Eldirderi
4,
Khaled Mohamed Khedher
5,6,
Ali H. Jawad
7,
Saad Hayatu Girei
1,8,
Husam Khalaf Salih
9,
Suriati Paiman
10,
Norhana Arsad
11,
Mohd Adzir Mahdi
1 and
Mohd Hanif Yaacob
1,*
1
Wireless and Photonics Network Research Centre, Faculty of Engineering, Universiti Putra Malaysia, Serdang 43400, Selangor, Malaysia
2
Department of Medical Instrumentations Techniques Engineering, Al-Rasheed University College, Baghdad 10053, Iraq
3
Civil and Environmental Engineering Department, King Fahd University of Petroleum & Minerals, Dhahran 31261, Saudi Arabia
4
Department of Chemical Engineering, College of Engineering, King Khalid University, Abha 61421, Saudi Arabia
5
Department of Civil Engineering, College of Engineering, King Khalid University, Abha 61421, Saudi Arabia
6
Department of Civil Engineering, High Institute of Technological Studies, Mrezgua University Campus, Nabeul 8000, Tunisia
7
Faculty of Applied Sciences, Universiti Teknologi MARA, Shah Alam 40450, Selangor, Malaysia
8
Department of Computer Engineering, Federal Polytechnic Mubi, Mubi 650113, Adamawa State, Nigeria
9
Department of Computer Engineering Techniques, Al-Rasheed University College, Baghdad 10053, Iraq
10
Department of Physical, Faculty of Science, Universiti Putra Malaysia, Serdang 43400, Selangor, Malaysia
11
Department of Electrical, Electronic and System Engineering, Faculty of Engineering and Built Environment, Universiti Kebangsaan Malaysia, Bangi 43600, Selangor, Malaysia
*
Authors to whom correspondence should be addressed.
Materials 2022, 15(22), 8167; https://doi.org/10.3390/ma15228167
Submission received: 6 October 2022 / Revised: 30 October 2022 / Accepted: 4 November 2022 / Published: 17 November 2022
(This article belongs to the Special Issue Advanced Materials for Optical Fibers)

Abstract

:
Gaseous pollutants such as hydrogen gas (H2) are emitted in daily human activities. They have been massively studied owing to their high explosivity and widespread usage in many domains. The current research is designed to analyse optical fiber-based H2 gas sensors by incorporating palladium/graphene oxide (Pd/GO) nanocomposite coating as sensing layers. The fabricated multimode silica fiber (MMF) sensors were used as a transducing platform. The tapering process is essential to improve the sensitivity to the environment through the interaction of the evanescent field over the area of the tapered surface area. Several characterization methods including FESEM, EDX, AFM, and XRD were adopted to examine the structure properties of the materials and achieve more understandable facts about their functional performance of the optical sensor. Characterisation results demonstrated structures with a higher surface for analyte gas reaction to the optical sensor performance. Results indicated an observed increment in the Pd/GO nanocomposite-based sensor responses subjected to the H2 concentrations increased from 0.125% to 2.00%. The achieved sensitivities were 33.22/vol% with a response time of 48 s and recovery time of 7 min. The developed optical fiber sensors achieved excellent selectivity and stability toward H2 gas upon exposure to other gases such as ammonia and methane.

1. Introduction

The hydrogen (H2) content of the atmosphere is in trace amounts (1 ppm by vol.); it is the most prevalent element on Earth, mostly found with oxygen in water and hydrocarbons [1,2,3]. Since hydrogen has a high energy content of 142 kJ/g [4], it can be an essential energy carrier for future renewable energy sources [5,6]. It is viewed as a potential substitute for depleting fossil fuels [7]. It is possible to produce hydrogen fuel through the electrolysis of water, breakdown of hydrocarbon via thermoplastics, or high-temperature steam moving overheated coal [8]. Since hydrogen and oxygen combine to produce energy and water as a by-product, it is considered an environmentally beneficial energy source [9,10]. There are numerous industries where hydrogen is used [11,12,13,14,15,16]; for instance, it is utilized in oil refining, liquid rocket propulsion, and cryogenic research for superconducting studies [17]. It is also used during welding for metal heat treatment, cutting, and coating with atomic hydrogen [18].
Currently, many different technologies are being used or under development for the detection of hydrogen, including semiconductor sensors, electrochemical, thermal sensors, and mass spectroscopy [19,20]. Unfortunately, these sensing methods have several disadvantages, such as large size, high cost, dependence on the presence of oxygen, and the potential to create electrical sparks that would be dangerous in explosive environments. There are four main hydrogen sensor types: chemical resistance, surface acoustic waves, optical fiber sensor, and microelectronic sensor [21].
However, these sensors have significant drawbacks, including low selectivity, high power consumption, and electromagnetic interference (EMI), which restrict their utility in sensing applications. Furthermore, all of the above sensors require higher working temperatures (>300 °C) and a large number of moving mechanical parts, which causes implementation issues in remote sensing applications [22]. To overcome these drawbacks, optical fibers have been investigated as an alternative to conventional chemical sensors due to their numerous benefits. Optical fiber sensors with distributed remote-control features may be readily incorporated into operational networks and communication systems [23]. Chemical-based optical fiber sensors have recently gained a lot of interest because of their compact size, immunity to electromagnetic interference, and ability to operate in harsh environments [24]. Since then, optical fiber chemical sensors have been introduced in various applications, and tremendous efforts have been made to improve their performance. Therefore, the author believes that by using optical fiber sensors in a simpler and low-cost manufacturing process in volatile environments, the safety risks associated with H2 leaks can be significantly reduced.
Pallidum (Pd) is a soft, silver–white metal belonging to group 10 of the periodic table. The ability of Pd to absorb H2 has been well-studied up to approximately 900 times its volume [25]. Pd has fast H2 uptake/sorption kinetics, high H solubility, and selectivity, which makes the catalyst a popular choice for H2 optical sensor materials. Several researchers [26,27,28] have developed H2 sensors by coating optical fibers with a layer of Pd. In our previous work [29], a Pd-based tapered optical fiber was created and tested at room temperature with various H2 gas concentrations in synthetic air. According to the findings, when exposed to 2.00% H2 in synthetic air, the Pd-coated based sensor’s absorbance response changed by 63%. The times for response and recovery were 50 and 230 s, respectively. Villatoro et al. [30] further explored this idea to produce a Pd-coated tapered MMF where the waist diameters of tapered sections are between 30 and 70 μm, with the length being 10 mm. The Pd-sensing layer has a thickness of 14 nm. The H2 concentration capable of being detected by the sensor was in the range of 0.3–3.5% (v/v) H2 at standard conditions.
Graphene oxide (GO) has recently been in the spotlight as a suitable nanomaterial that can improve sensor performance due to its unique chemical and optical properties, strong water nature, and large surface area [31]. Being a two-dimensional structure, the entire volume of GO is exposed to its environment, which makes it a better candidate for the application of chemical detection [32]. A few research studies have focused on GO as a sensor in layer-based H2 sensor applications. Wang et al. [33] fabricated a hydrogen sensor integrated into GO nanostructures using AC DEP technology, a simple and economical manufacturing process. More recently, ZnO MW was synthesized and coated with GO by Rush et al. [34] and showed extremely low power consumption (60–200 nW) and excellent H2 detection properties at room temperature
Compared to one-dimensional sensor materials that include nanowires and nanotubes, graphene oxide has clear advantages as a support material for hydrogen detection; it has a perfect two-dimensional structure with a theoretical maximum specified surface area, high load movement, and remarkable structural flexibility [31]. Modifying the surface of graphene is a good way to obtain H2-sensitive detection. Several catalytic hydrogen strategies have been developed to enhance noble metal nanoparticles to enhance the response, as the direct interaction of H2 with unmodified graphene oxide is too weak to elicit a significant response [35]. The palladium metal catalytic nanoparticles that coated the surface of graphene oxide with a chemical or physical functionalization can improve the detection response due to their high efficiency of dissociation of molecular hydrogen in the most reactive atomic form [36].
Field emission scanning electron microscopy (FESEM), energy dispersive X-rays (EDX), X-ray diffraction (XRD), and atomic force microscopy (AFM) were used in this investigation to characterise the materials. These characterization methods are used to determine the morphology, stoichiometry, composition, crystal structure, and optical features of the produced nanostructured thin films.
To the best of our knowledge, the authors can definitively state that this work is the first to assess the performance of a GO composite integrated with Pd metal nanoparticles coated with tapered optical fiber. Hence, it is an important topic of research that attempts to analyse the tapered optical fiber-based H₂ gas sensor using Pd/GO nanocomposites, followed by the assessment of the properties shown by the nanocomposites as well as the functioning of the newly developed sensor. The performance of the new sensor would be investigated based on different parameters, such as response time, recovery time, repeatability, sensitivity, and stability.

2. Materials and Methods

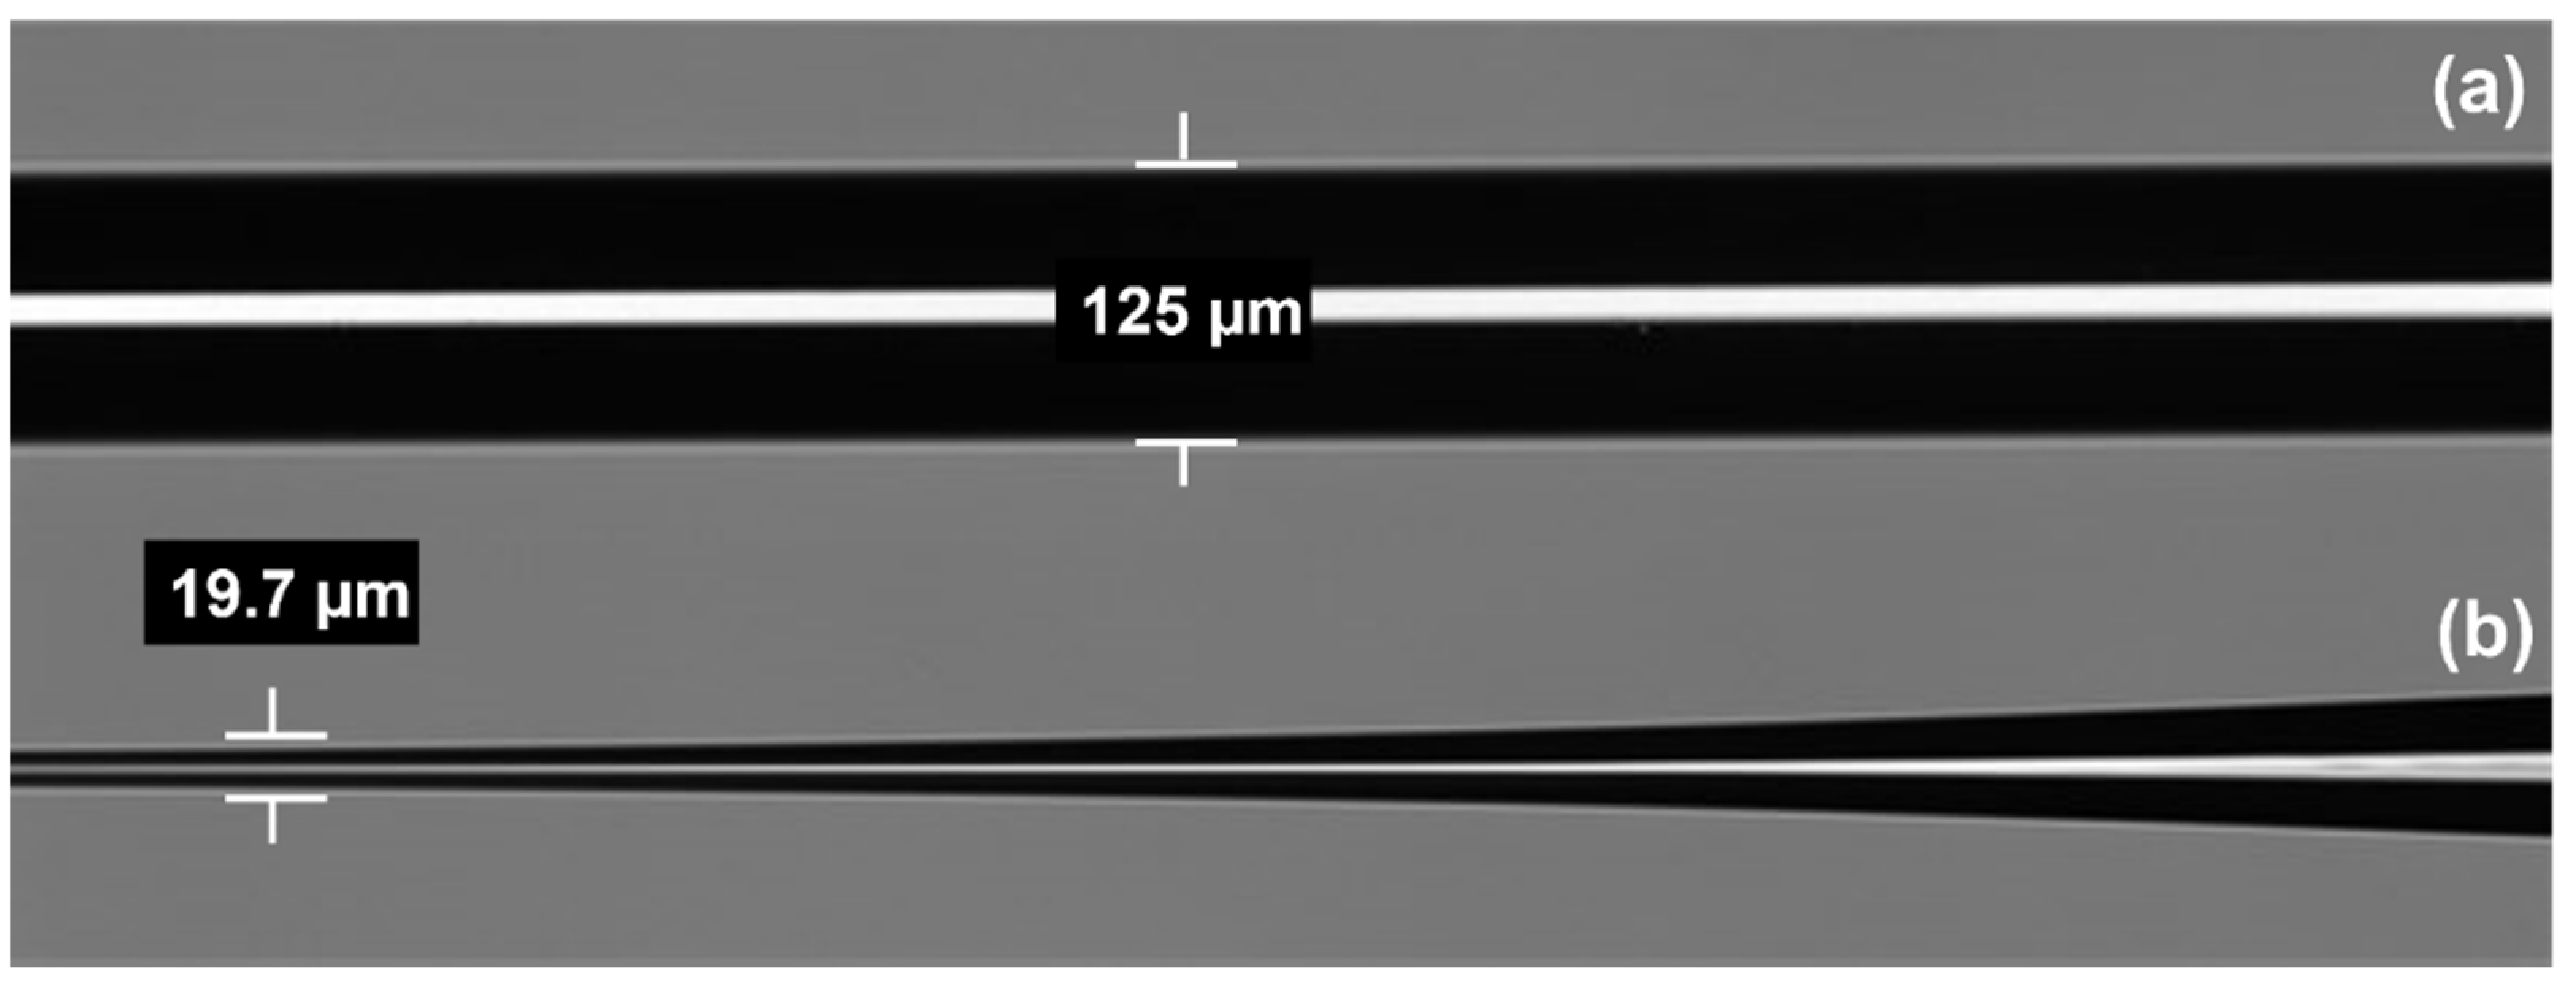
2.1. Design and Fabrication of Optical Fiber Transducers

In this research, the author modified the optical fibers with tapering technology. By tapering, the resulting evanescent field was expected to be sufficient for the sensor to perform well. The tapered area will also become sensitive to its circumference, which is good for detection. The tapered optical fibers were coated with a nanostructured material and then showed an optical signal response when exposed to H2 in different concentrations.
The author used a multimode silica (SiO2) optical fiber purchased from OFS Furukawa. The diameters of the fiber cladding and core are 62.5 μm and 125 μm, respectively. The wide diameter of the multi-mode optical fiber core enables a strong interaction of light with the sensor layer coated in the tapering region. Furthermore, its small size, light weight, and resistance to EMI are also possible for this fabricator’s sensor application used in the visible wavelength range of the near-infrared. Multimode optical fiber provides low attenuation loss and is flexible at high temperatures, making it attractive for a hydrogen sensor in harsh environments. As a result, the properties of silica optical fiber make it an excellent option for high-sensitivity sensors, remote sensing applications, and high-temperature operation [37]. A multimode fiber using a Vytran GPX-3400 glass processing workstation, as shown in Figure 1, were used for the tapered process.
The protective jacket, about 3 cm long, is removed in the tapering step. The tapering procedure is generally performed by pulling and heating the optical fibers. Under a certain pulling force, the optical fiber is stretched and gradually elongated to a desired length and diameter. The shape of the tapered optical fiber can be established by the duration, temperature, and optical fiber tension during the heating step. Argon gas is used in heating to provide an inert local atmosphere. A schematic model of the tapered fiber profile used in this experiment is shown in Figure 2. After the tapering process, the fibers consist of three continuous segments: one tapered waist length segment with a uniform diameter is located in the central region, and is surrounded by two transition regions, called the up-taper and the down-taper regions, whose diameters are gradually changed.
The MMF optical fiber was tapered using this machine to produce various modified optical fiber transducing platforms. The author has a varied parameter from waist diameter to 20 μm with a fixed length of 10 mm and an up/down taper of 5 mm, that the size of the waist diameter of the tapered optical fiber will affect the sensitivity of the sensor. This is due to the depth with which the evanescent field penetrates the coated sensor layer [38]. According to [39], the waist diameter range strongly responds to the gas sensor. Figure 3 illustrates the FESEM images of an optical fiber before and after tapering. After the tapering process, the tapered optical fibers were coated with the Pd/GO nanocomposites sensor layer by a drop casting technique.

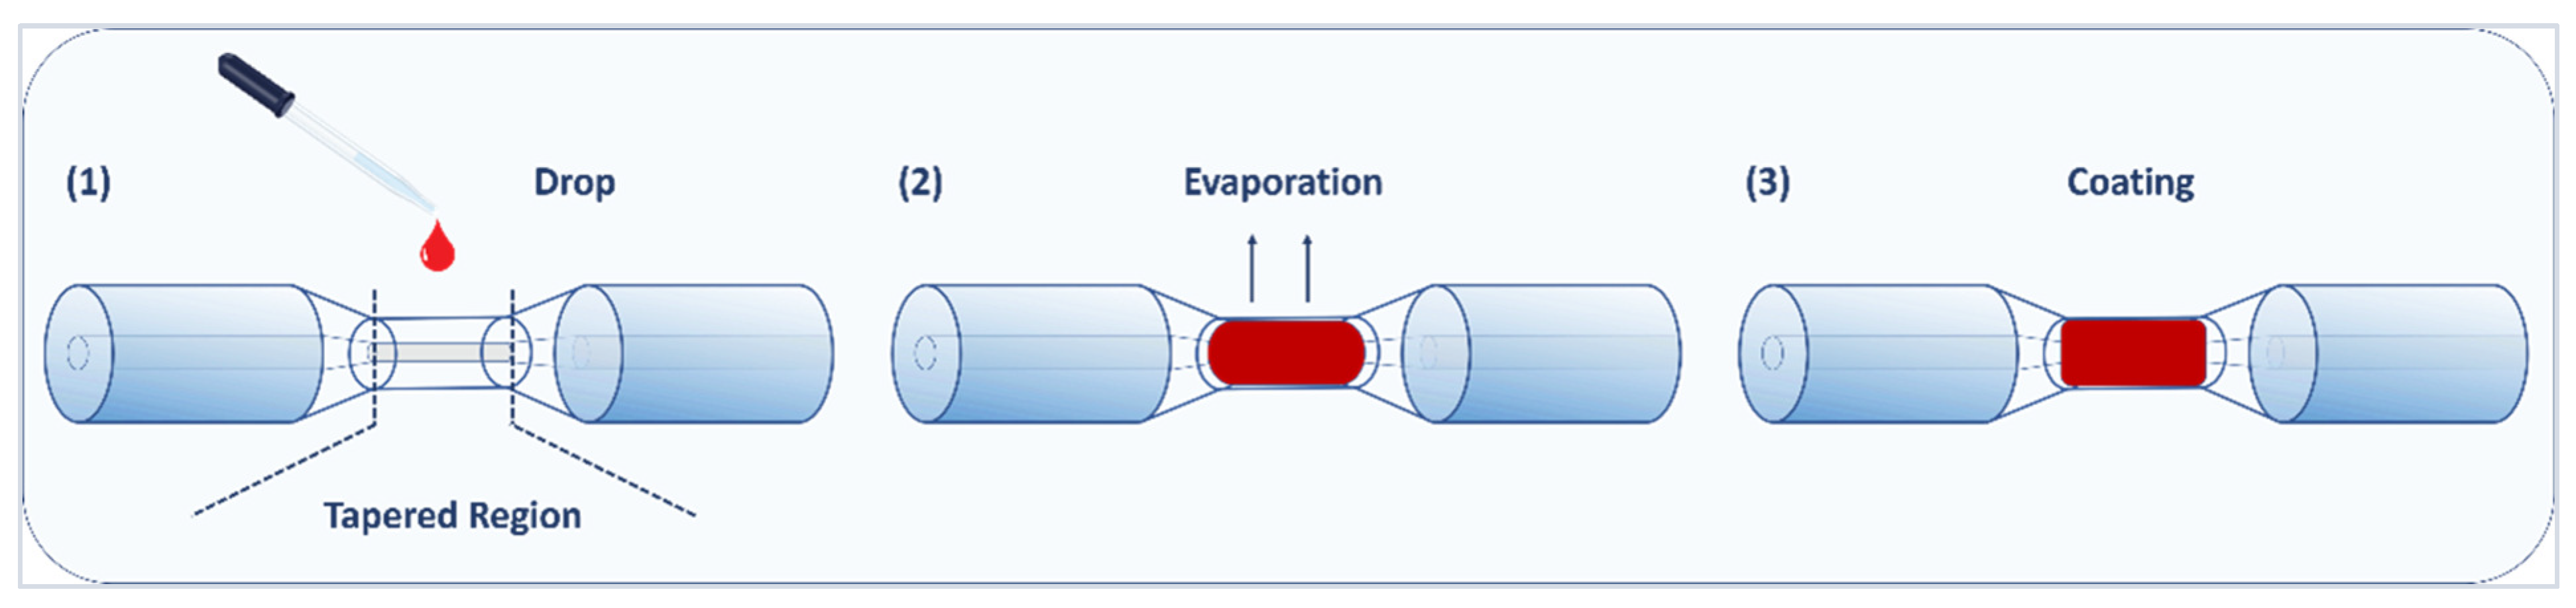
2.2. Synthesis and Deposition of Pd/GO Nanocomposite

In [40], GO was synthesized from modified graphite flakes using the modified hummers process. When the temperature was below 20 °C, the procedure comprised whirling concentrated sulfuric acid with 10 g of graphite powder. Potassium permanganate (KMnO4), a strong oxidant, was progressively added to the reaction chamber while it was immersed in an ice bath for two hours. The combination was mixed for 96 h at room temperature. The reaction system was then filled with diluted sulfuric acid (5.0 wt.%) and hydrogen peroxide. After centrifuging and washing the mixture with hydrochloric acid and deionized water to neutralize the filter and remove any remaining contaminants, it was allowed to dry at room temperature. To produce graphite oxide, the precipitate was dried at room temperature. 200 mg of produced graphite oxide powder was dissolved in 800 mL of deionized water. A two-hour ultrasonic treatment was used to exfoliate the graphite oxide dispersion into individual graphene oxide layers.
A simple one-step procedure was used to produce Pd/GO nanocomposites. First, a 1 mg/mL palladium chloride (PdCl2) solution and a 1 mg/mL GO solution were mixed, followed by 50 µL of hydrazine monohydrate as a reducing agent [41]. After aggressively stirring the resulting solution for 1 h, a stable 10 mL black suspension was obtained. The solution was placed in an ultrasonic bath for an hour to homogenize. The schematic diagram of the Pd/GO nanocomposite is shown in Figure 4.
The tapered optical fiber was coated with Pd/GO nanocomposite using a drop-casting technique, in which about 10 µL of the solution was dropped on the fiber base using a tiny pipette and heated to 60 °C in the oven for 20 min to guarantee full evaporation of the aqueous medium [42]. Figure 5 depicts the drop-casting approach used to functionalize a tapered optical fiber with Pd/GO nanocomposites.

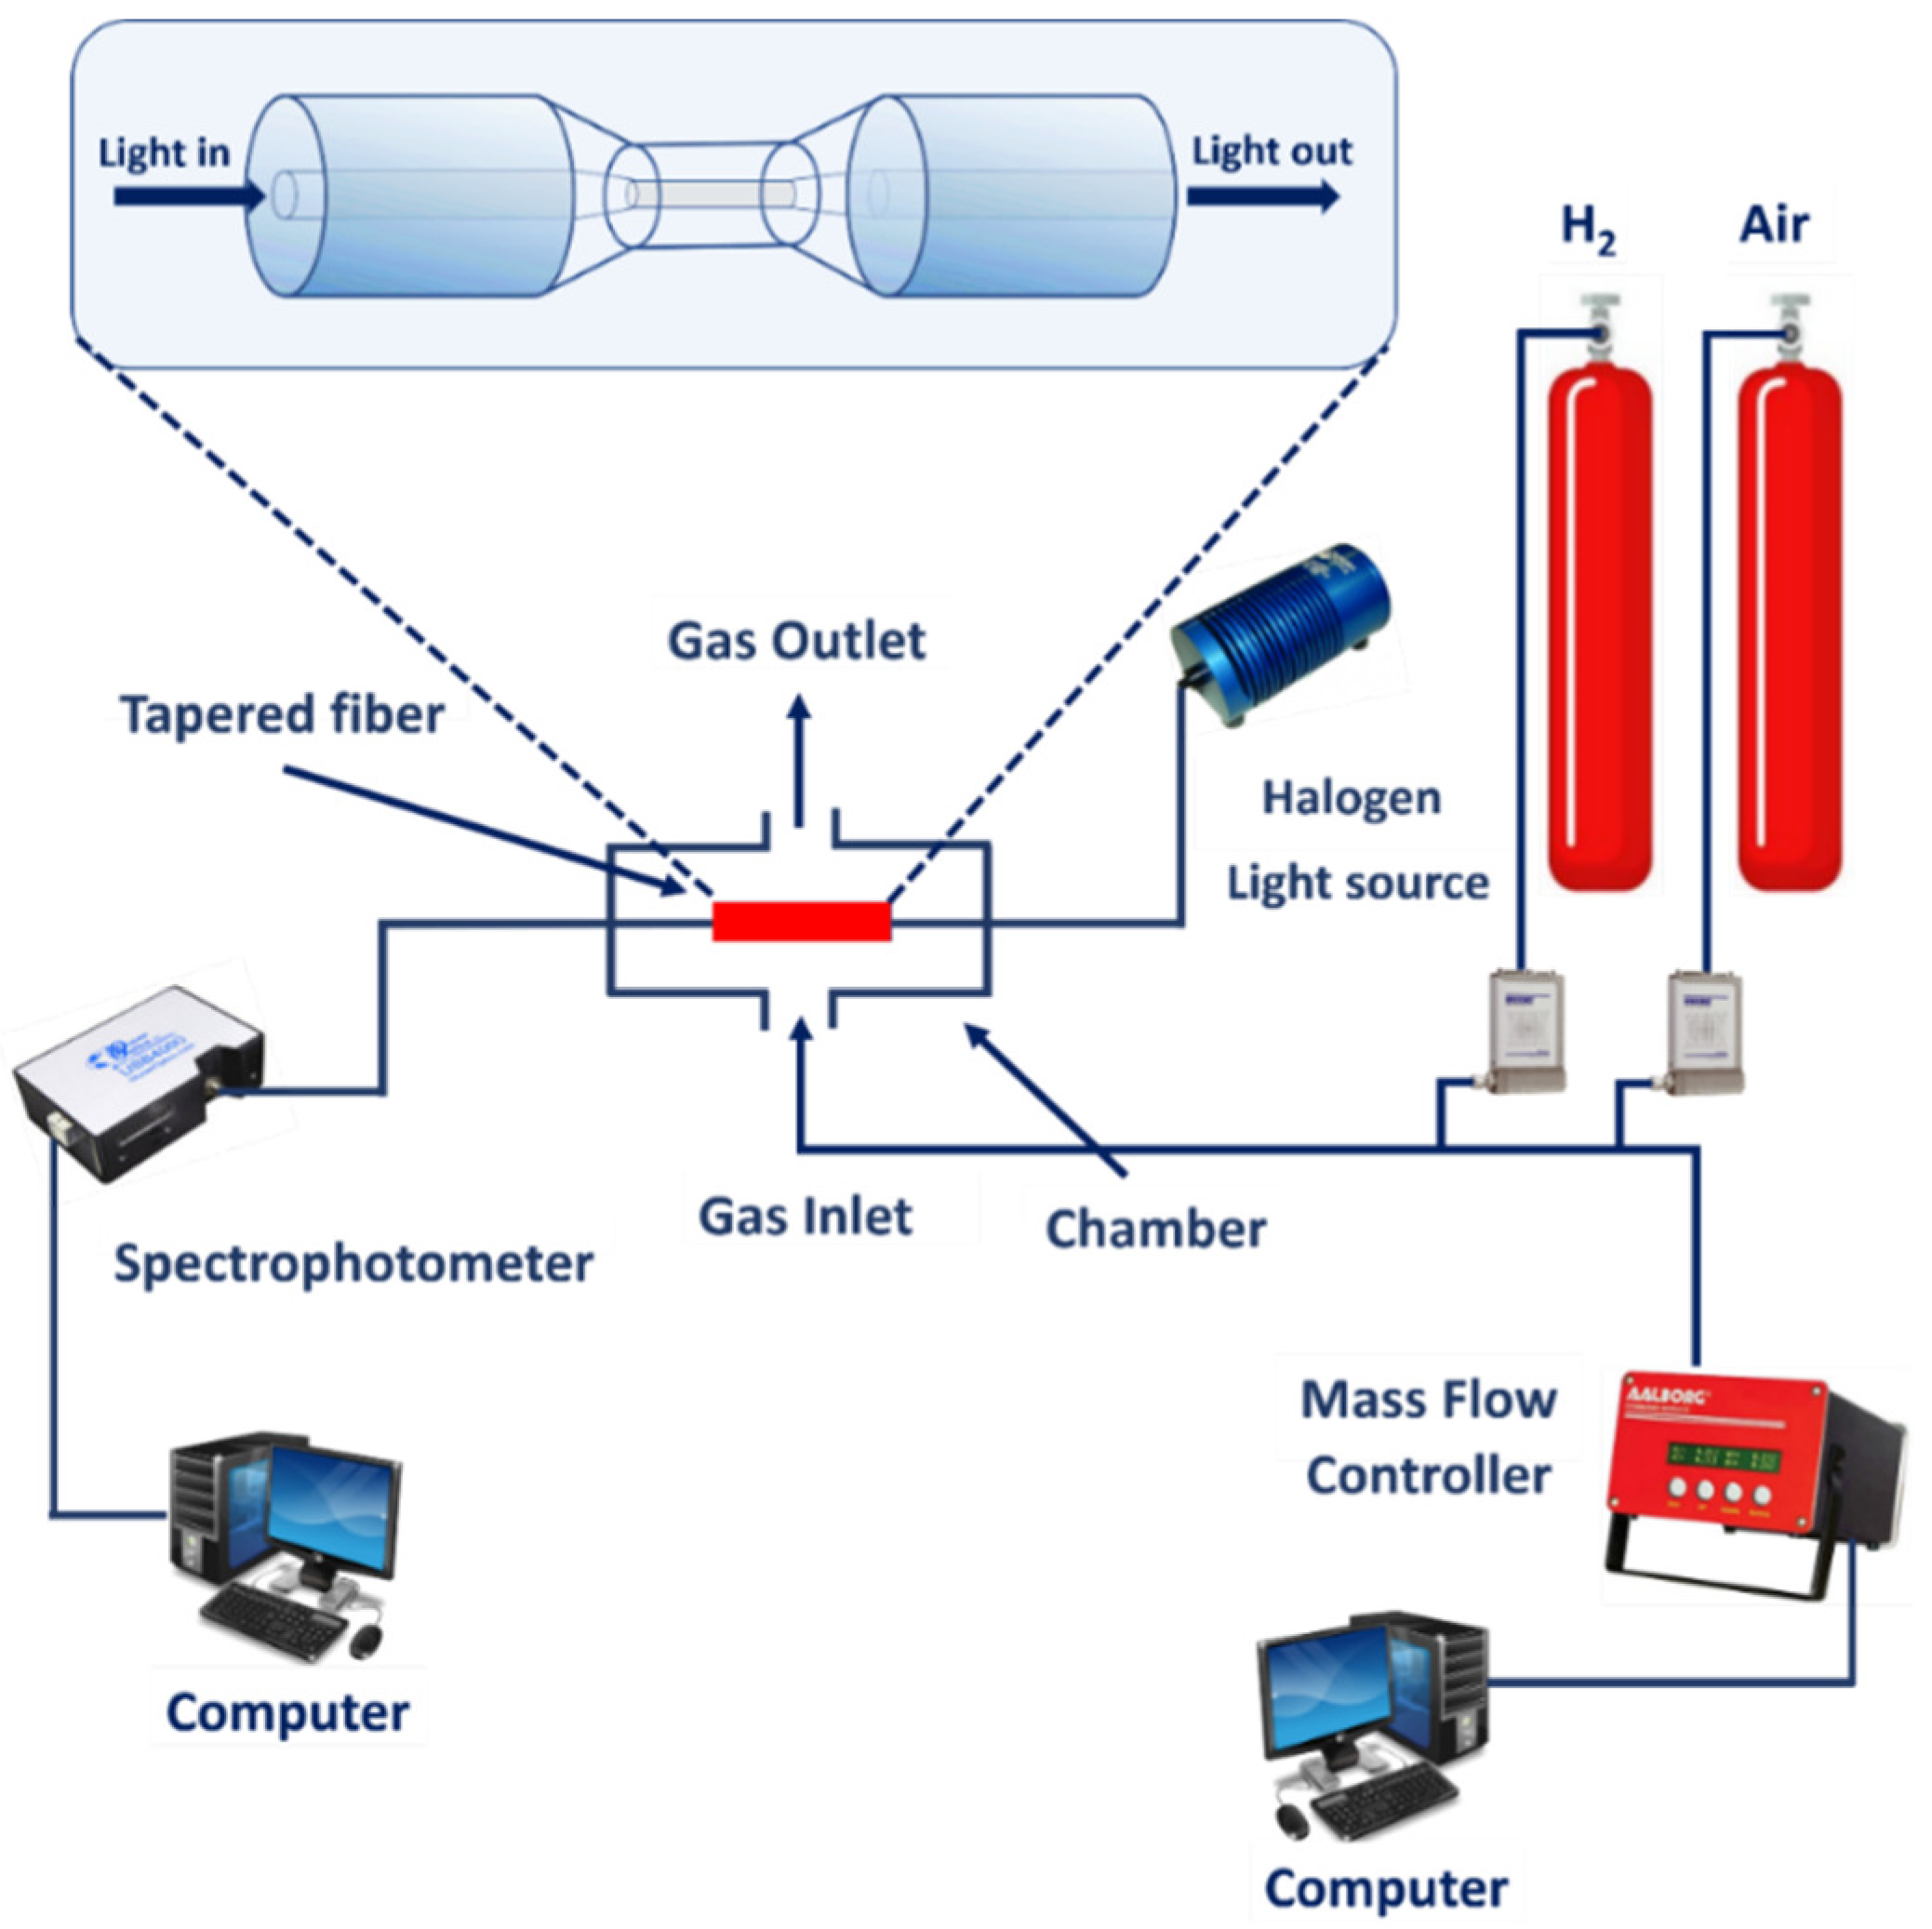
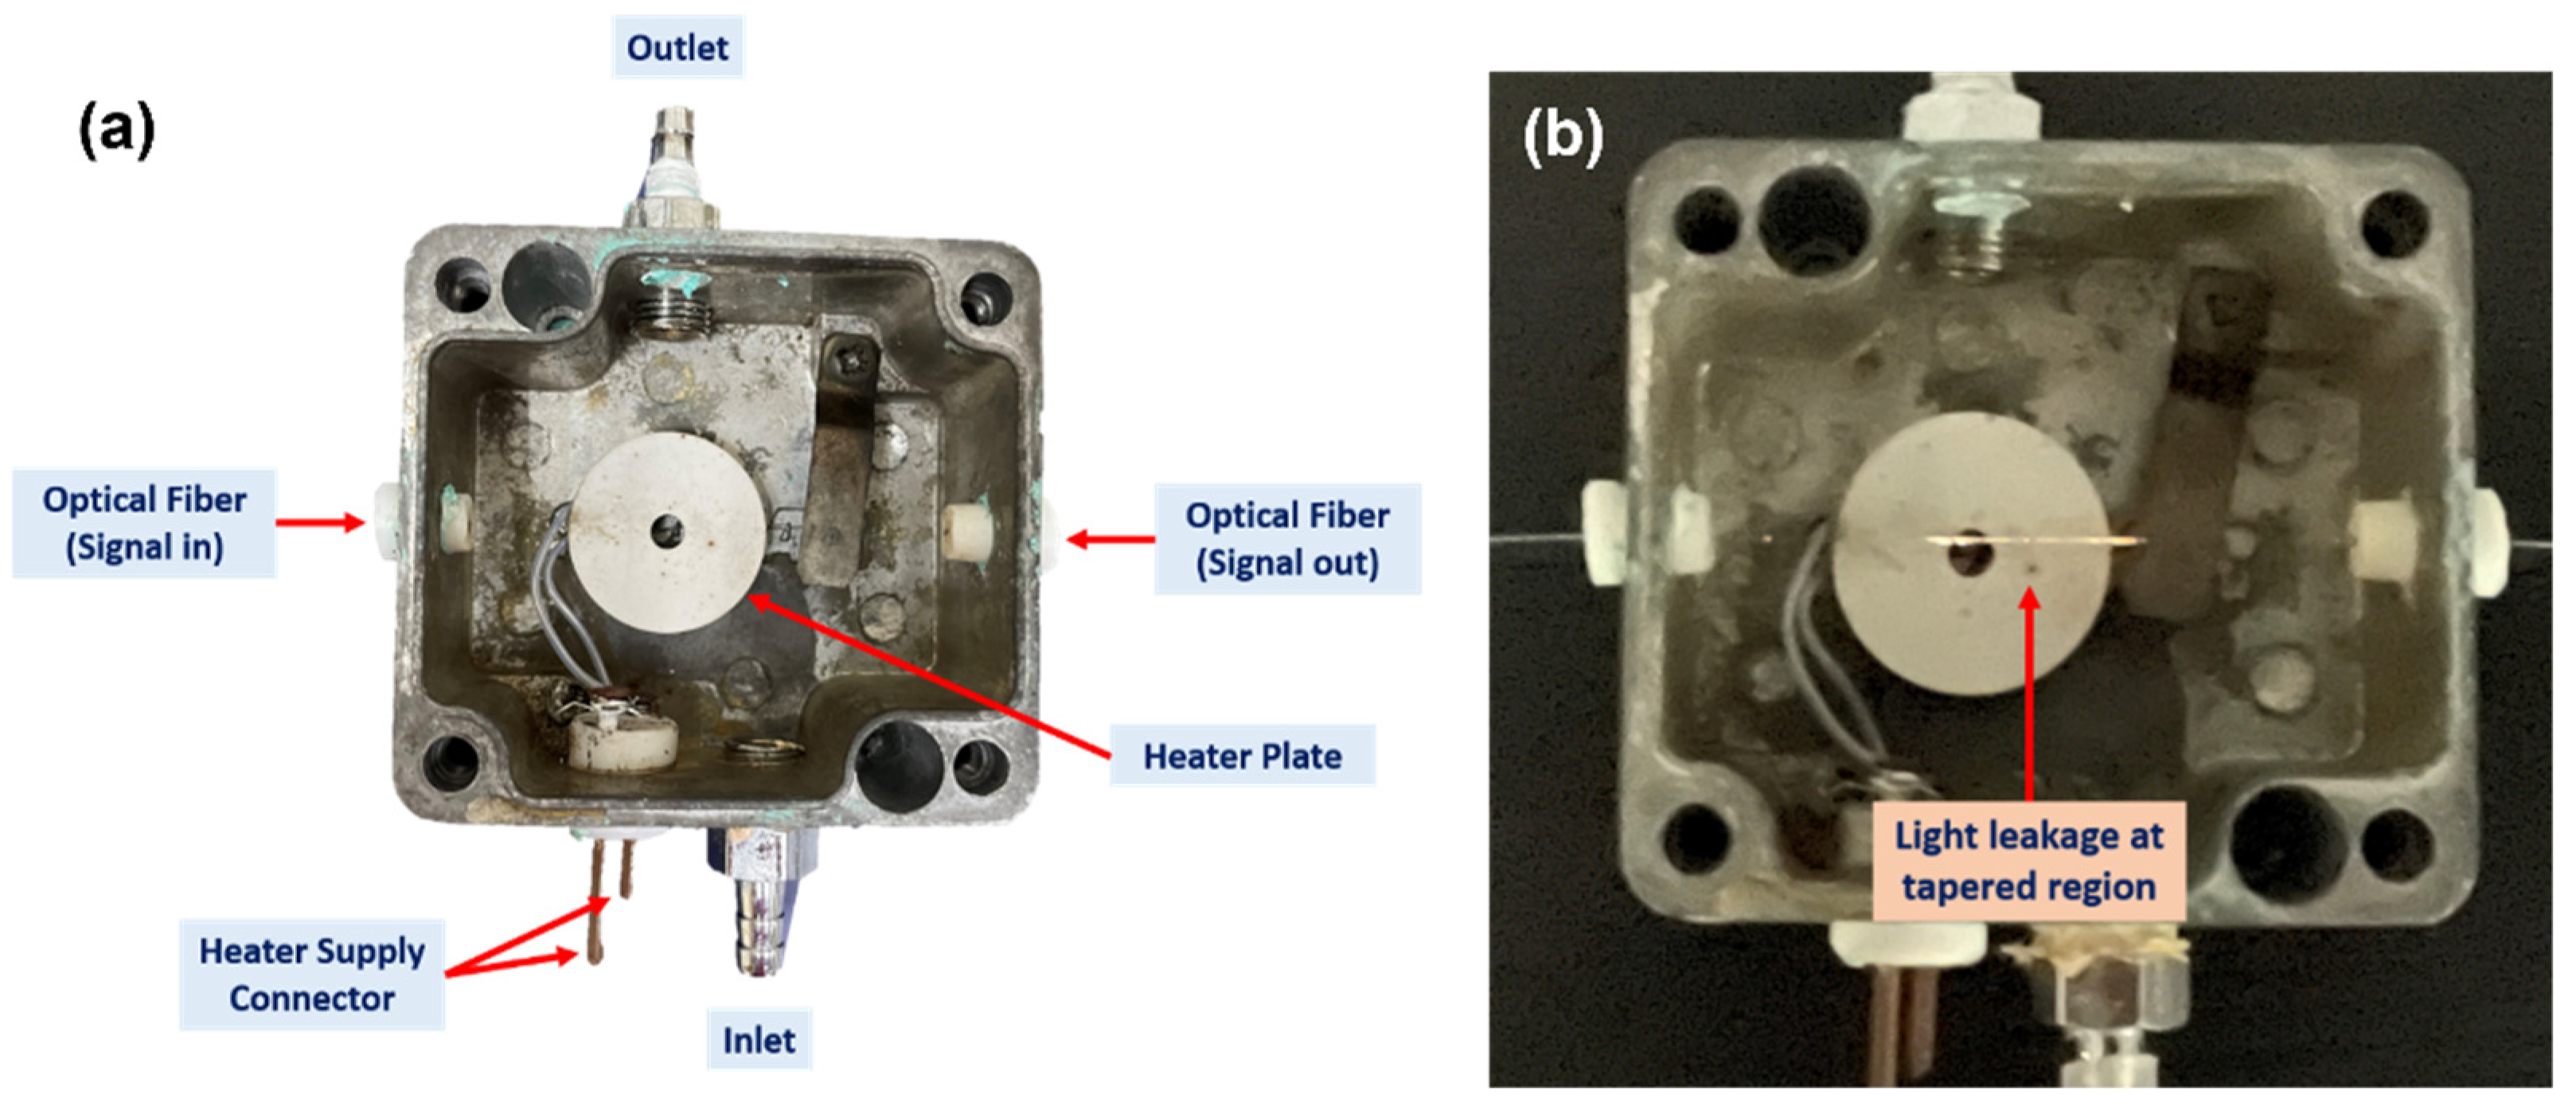
2.3. Optical Gas Testing Setup

The absorbance measurement method was employed by the author in this experiment. The investigation concentrated on how the sensing material’s optical absorption spectra responded to H2. Figure 6 depicts the setup of the experiment. The proposed H2 sensor was installed in a dedicated chamber and optical fiber cables were used to connect it to the tungsten halogen light on one side (Ocean OpticsTM HL 2000, with a wavelength range of 360 to 2400 nm). To measure absorbance, a spectrophotometer (Ocean Optics TM USB-4000, spectral range 200–1100 nm) was connected to the developed sensor. A USB port was used to connect the spectrophotometer to the computer. SpectraSuite (version 6.2) was used to process and evaluate the optical response as it was being measured in real-time with a spectrophotometer. The following formula was used by the software to determine the absorbance Aλ [43]:
A λ =   log ( S λ   D λ R λ   D λ )
where Sλ represents the intensity of light detected at the wavelength λ after being exposed to H2, D represents the intensity stored when no light goes through the fiber, and R represents the reference density of the blank fibers at the wavelength.
A computerized gas calibration system controlled the type and concentration of gas flowing into the chamber (Aalborg Instruments and Controls, Inc., Dunedin, FL, USA). High precision gas concentration control can be achieved with this gas setting. Configuration 1 was connected to the gas titration system using a computer-controlled mass flow controller with a flow rate of 200 m3/min. In this graph, the multi-channel gas calibration setup was based on the volumetric mixing of the gases. Certified synthetic air and H2 gas cylinders (Linde, Malaysia-Singapore Sdn. Bhd, Petaling Jaya, Selangor, Malaysia) were used to mix and purify the gases in the chamber. The absorbance spectrum was taken from the proposed probes using a spectrophotometer and stored with air as a reference. In the room, diluted H2 gas was purified with various concentrations and 100% synthetic air alternatively, while SpectraSuite was analysed and exhibited absorbance with wavelength. The amounts of H2 gas were changed from 0.125% to 2.0% to test the sensor’s sensitivity and capacity to measure concentrations. Changes in absorbance have been used to study the sensor’s dynamic responses (changes in absorbance over time).
Figure 7a shows the modified gas chamber used for H2 sensing. The chamber consists of a heating plate connected to two electrical points connected to the power supply, two ports for gas inlet and outlet, and a thermocouple input. The teflon was drilled on both sides with a hole that meets the optical fiber size. The optical fiber sensor was spliced with a pigtail and connected to the light source and spectrophotometer using an FC-SMA connection. Figure 7b depicts the light that propagates into the optical fiber’s tapered area. According to the image, when exposed to H2, the leaking light interacts with the sensor layer and modifies its characteristics.

3. Characterisation and Chemical Sensing Results

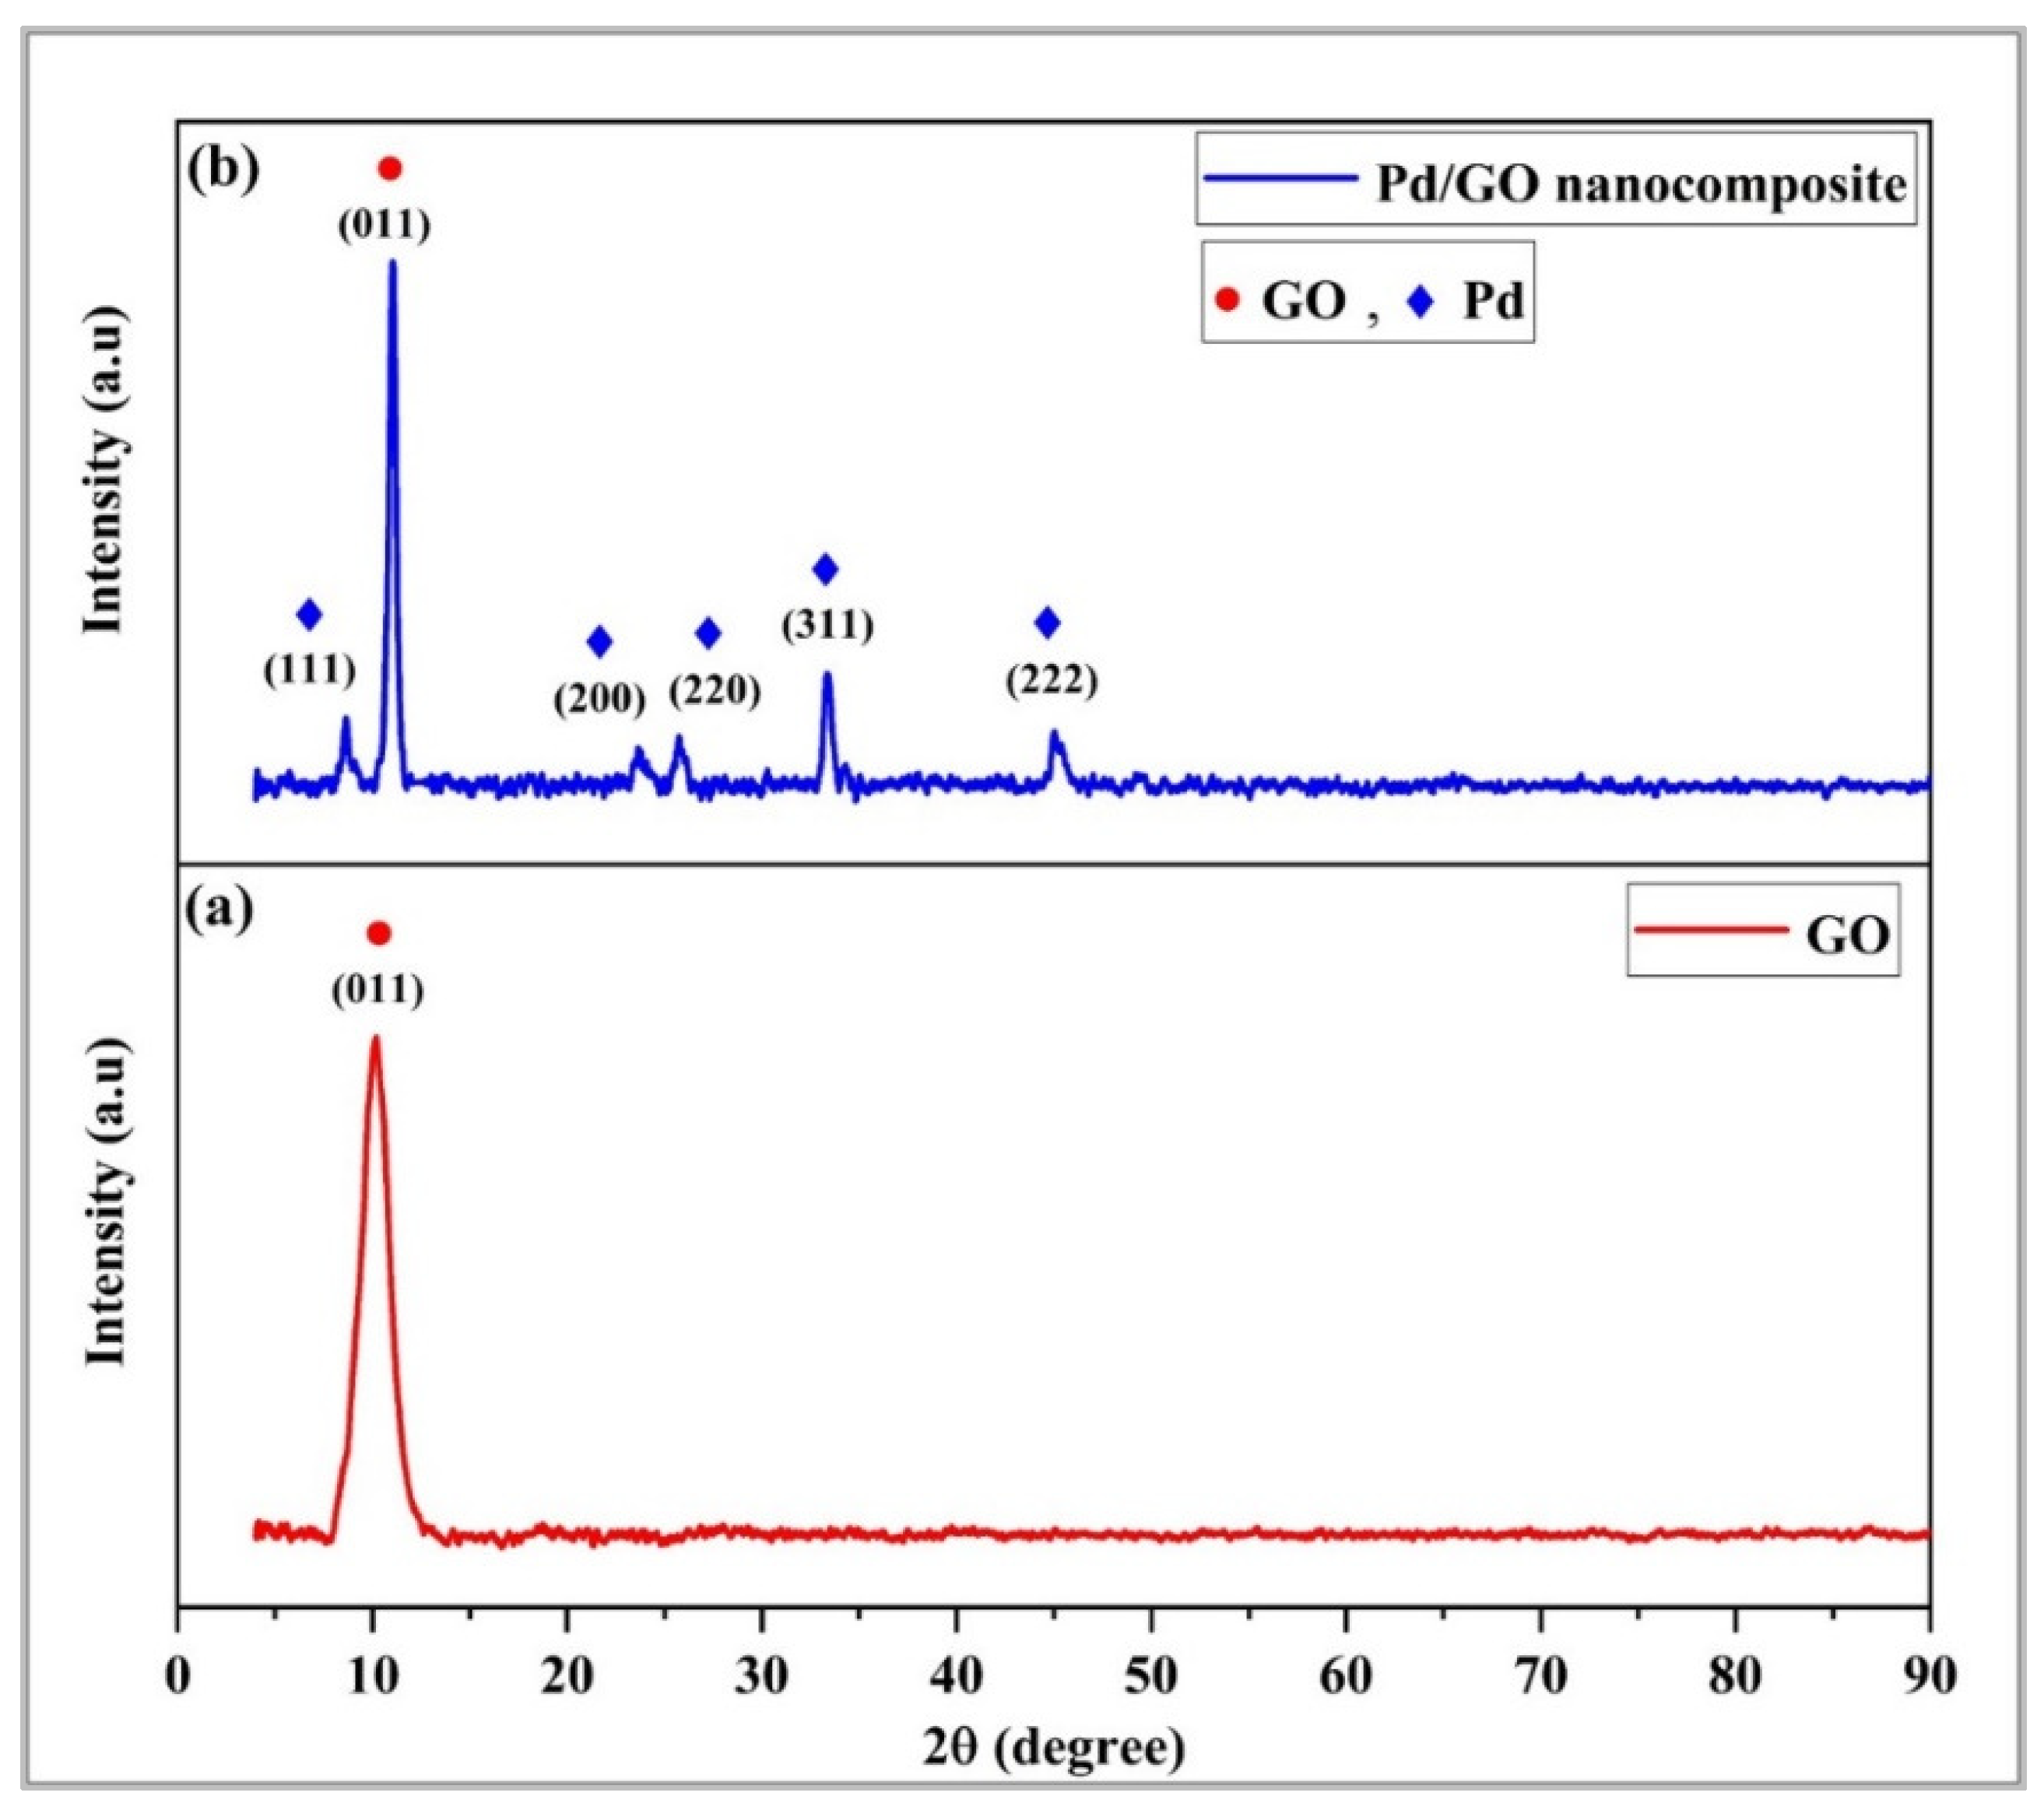
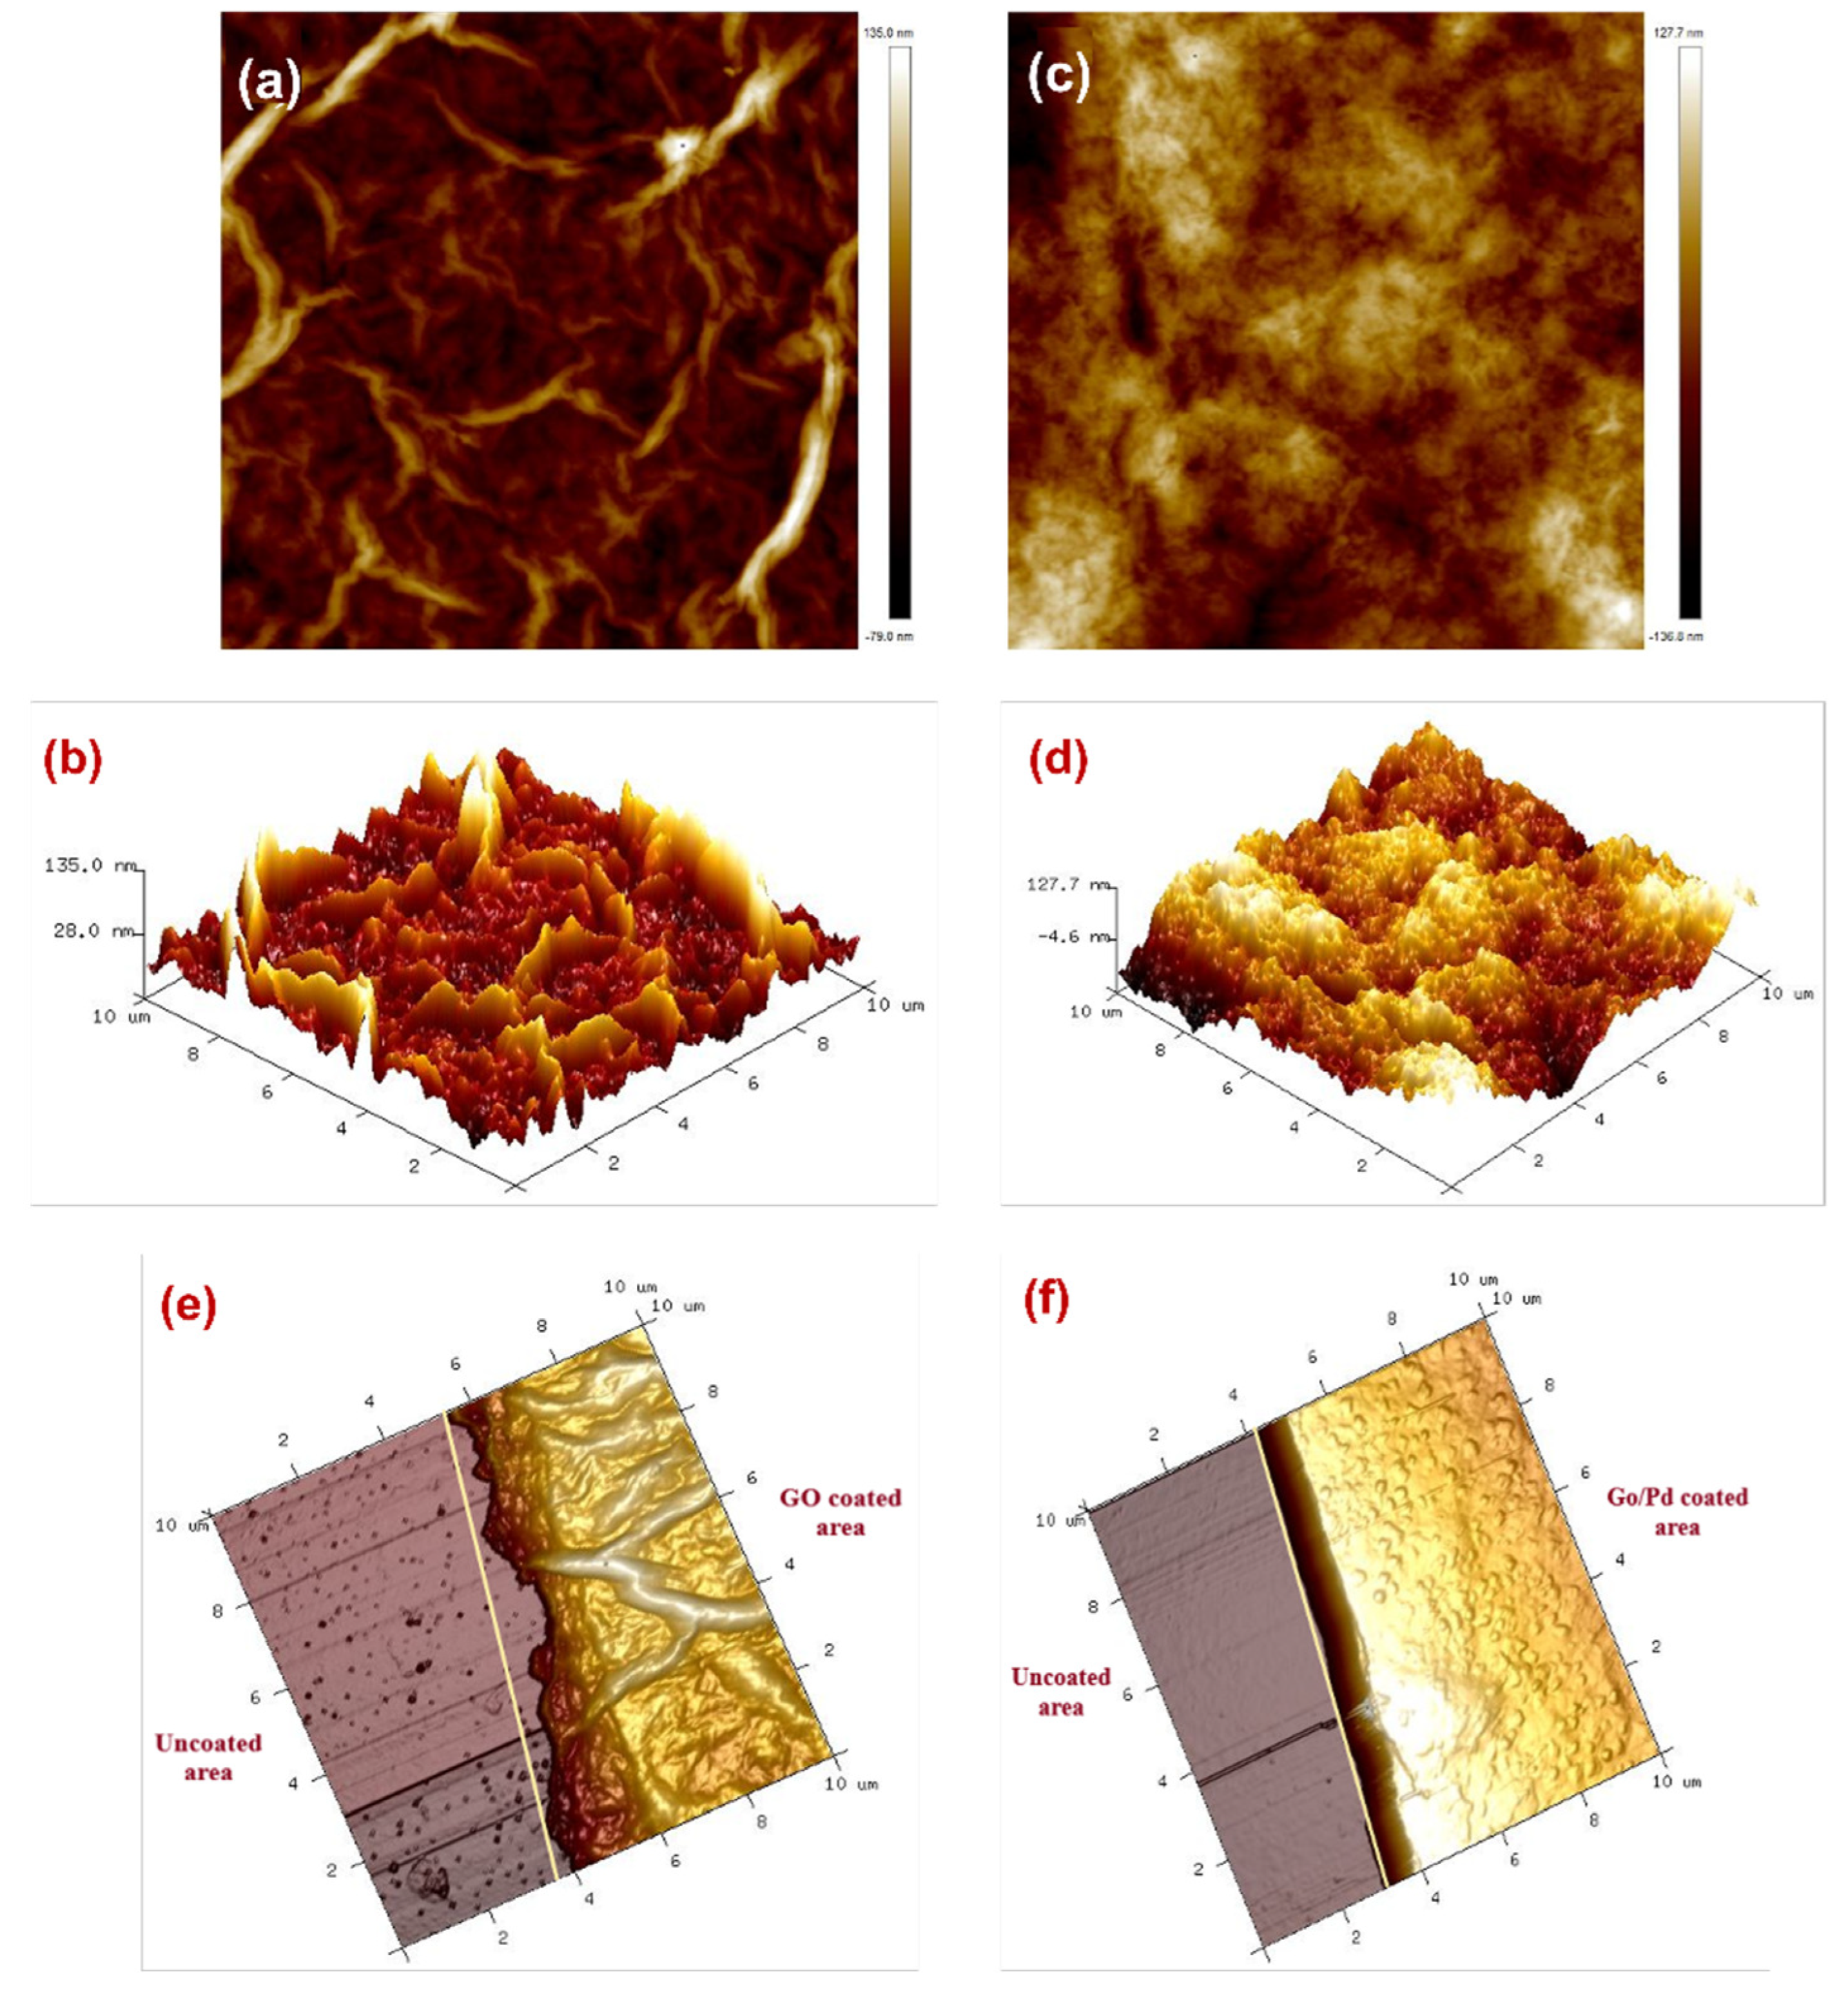
3.1. Micro-Characterizations of Pd/GO Nanocomposite

The author performed the FESEM characterisation of the samples to analyse the GO and Pd/GO nanocomposite morphological characteristics. Figure 8a depicts the successful deposition of the GO and Pd/GO nanocomposite on the surface of the tapered fiber. The coated GO surface was relatively smooth, with a wrinkled structure that might be related to the edges of the GO sheets [44]. As demonstrated in Figure 8, wrinkles are significant for GO surfaces because they provide a large area of surface for robust sensing capability (Figure 8b,c). Furthermore, the picture clearly shows that the GO distribution is uniform, as shown in [45,46].
Regarding Pd/GO nanocomposite films, the Pd NPs on the surface of GO can be identified in Figure 8d,e. It shows a uniform distribution of Pd particles on the GO sheets and indicates that Pd mixes and diffuses uniformly through GO. According to [47,48], the wide aggregation can be attributed to the unequal size of the Pd NPs and the folding of the GO nanoparticles since the small particles interfered with the larger particles in the nanocomposite solution of Pd/GO. The dispersion quality of the Pd particles in the GO matrix significantly influences hydrogen storage in the nanocomposite [49].
The elemental composition of the GO and Pd/GO nanocomposite were measured by EDX performed in FESEM. The EDX results confirm that the present elements of GO are C, O, and Si, as shown in Figure 9a. At the same time, the EDX result of the Pd/GO nanocomposite was C, O, Pd, and Si in the synthesized nanocomposite, as shown in Figure 9b. The silica fibers used the silicon peak (Si) as a substrate.
According to Figure 10, the GO molecule exhibits a distinct intensity peak of 2θ at a value of 10.11, which corresponds to the (011) plane. The larger spacing of GO [50] may be the cause of the existence of oxygen-containing groups like hydroxyl, carboxylate, and epoxy. The spacing between the GO layers was 0.865 nm according to using Bragg’s law [51]:
λ = 2dsin θ
where λ is the X-ray beam’s wavelength (0.154 nm). The d-range of graphene oxide interlayers ranges from 0.6–1.0 and is controlled by the degree of oxidation of graphite and the number of water molecules intercalated in the interlayer apace [52].
The peaks stated in Figure 10, as well as the strong Pd peaks, are maintained similarly in the GO and Pd/GO nanocomposite samples. This suggests that the Pd nanoparticles were successfully fixated to the Pd/GO matrix. The Pd/GO nanocomposite diffraction pattern revealed a crystal peak value of 2 of 8.63°, 25.75°, 28.55°, 33.40°, 45.01° and matching to the (111), (200), (220), (311) and (222) surfaces of the Pd lens’s central cubic structure, respectively. This is consistent with the known literature [53]. The greatest signal was seen at 2 = 33.40°, indicating that Pd nanoparticles had been incorporated into the GO sheets in the dominant plane (311). As can be observed from the XRD profile of the Pd/GO nanocomposite, the peaks gradually became shorter.
The nanocomposite’s GO pattern has an intense peak at 11.80°, which corresponds to an interlayer spacing of 0.55 nm. Because of the addition of oxygenated groups and ultrasonically assisted exfoliation, this is narrower than GO [54].
The surface roughness and thickness of GO and Pd/GO compounds are verified using atomic force microscopy (AFM). The border region was allocated a 10 m × 10 m scan for AFM analysis. The average surface roughness of the GO and Pd/GO compounds was 26 and 30 nm, respectively, as shown in Figure 11. The coarse sensing layer is important because it allows gas molecules to easily diffuse into and out of the layer. As a result, sensing element performance parameters such as reaction time and sensitivity can be significantly improved. The thickness of the thin films of the GO and Pd/GO nanocomposite were measured. A portion of the substrate was covered with aluminium tape to differentiate between coated and uncoated sites during the coating process. The thickness of the GO and Pd/GO composite coatings were measured as 610 nm and 850 nm, respectively.

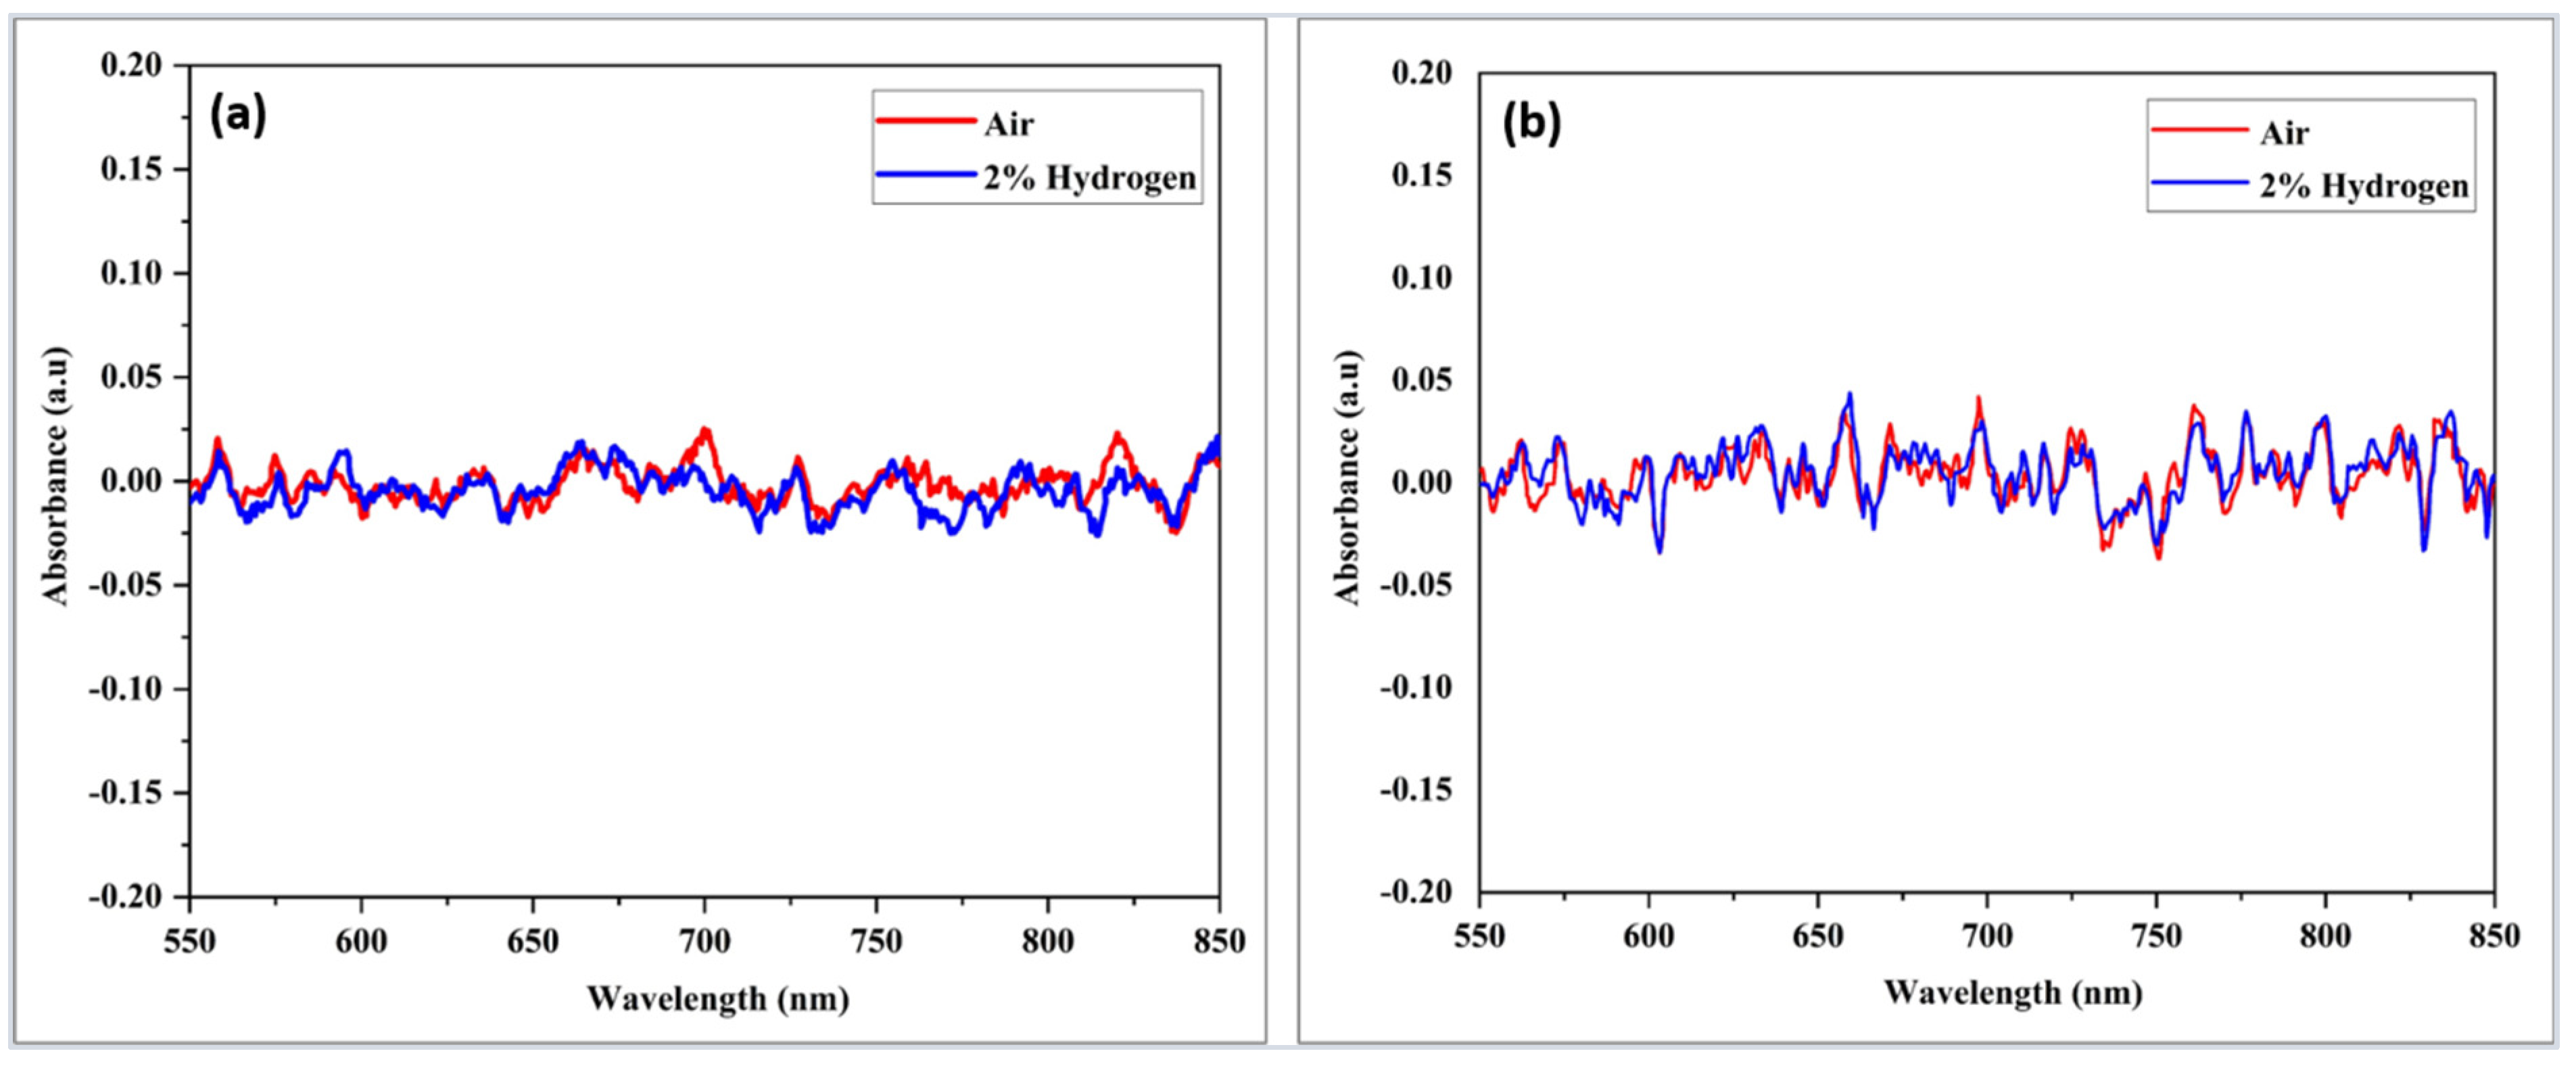
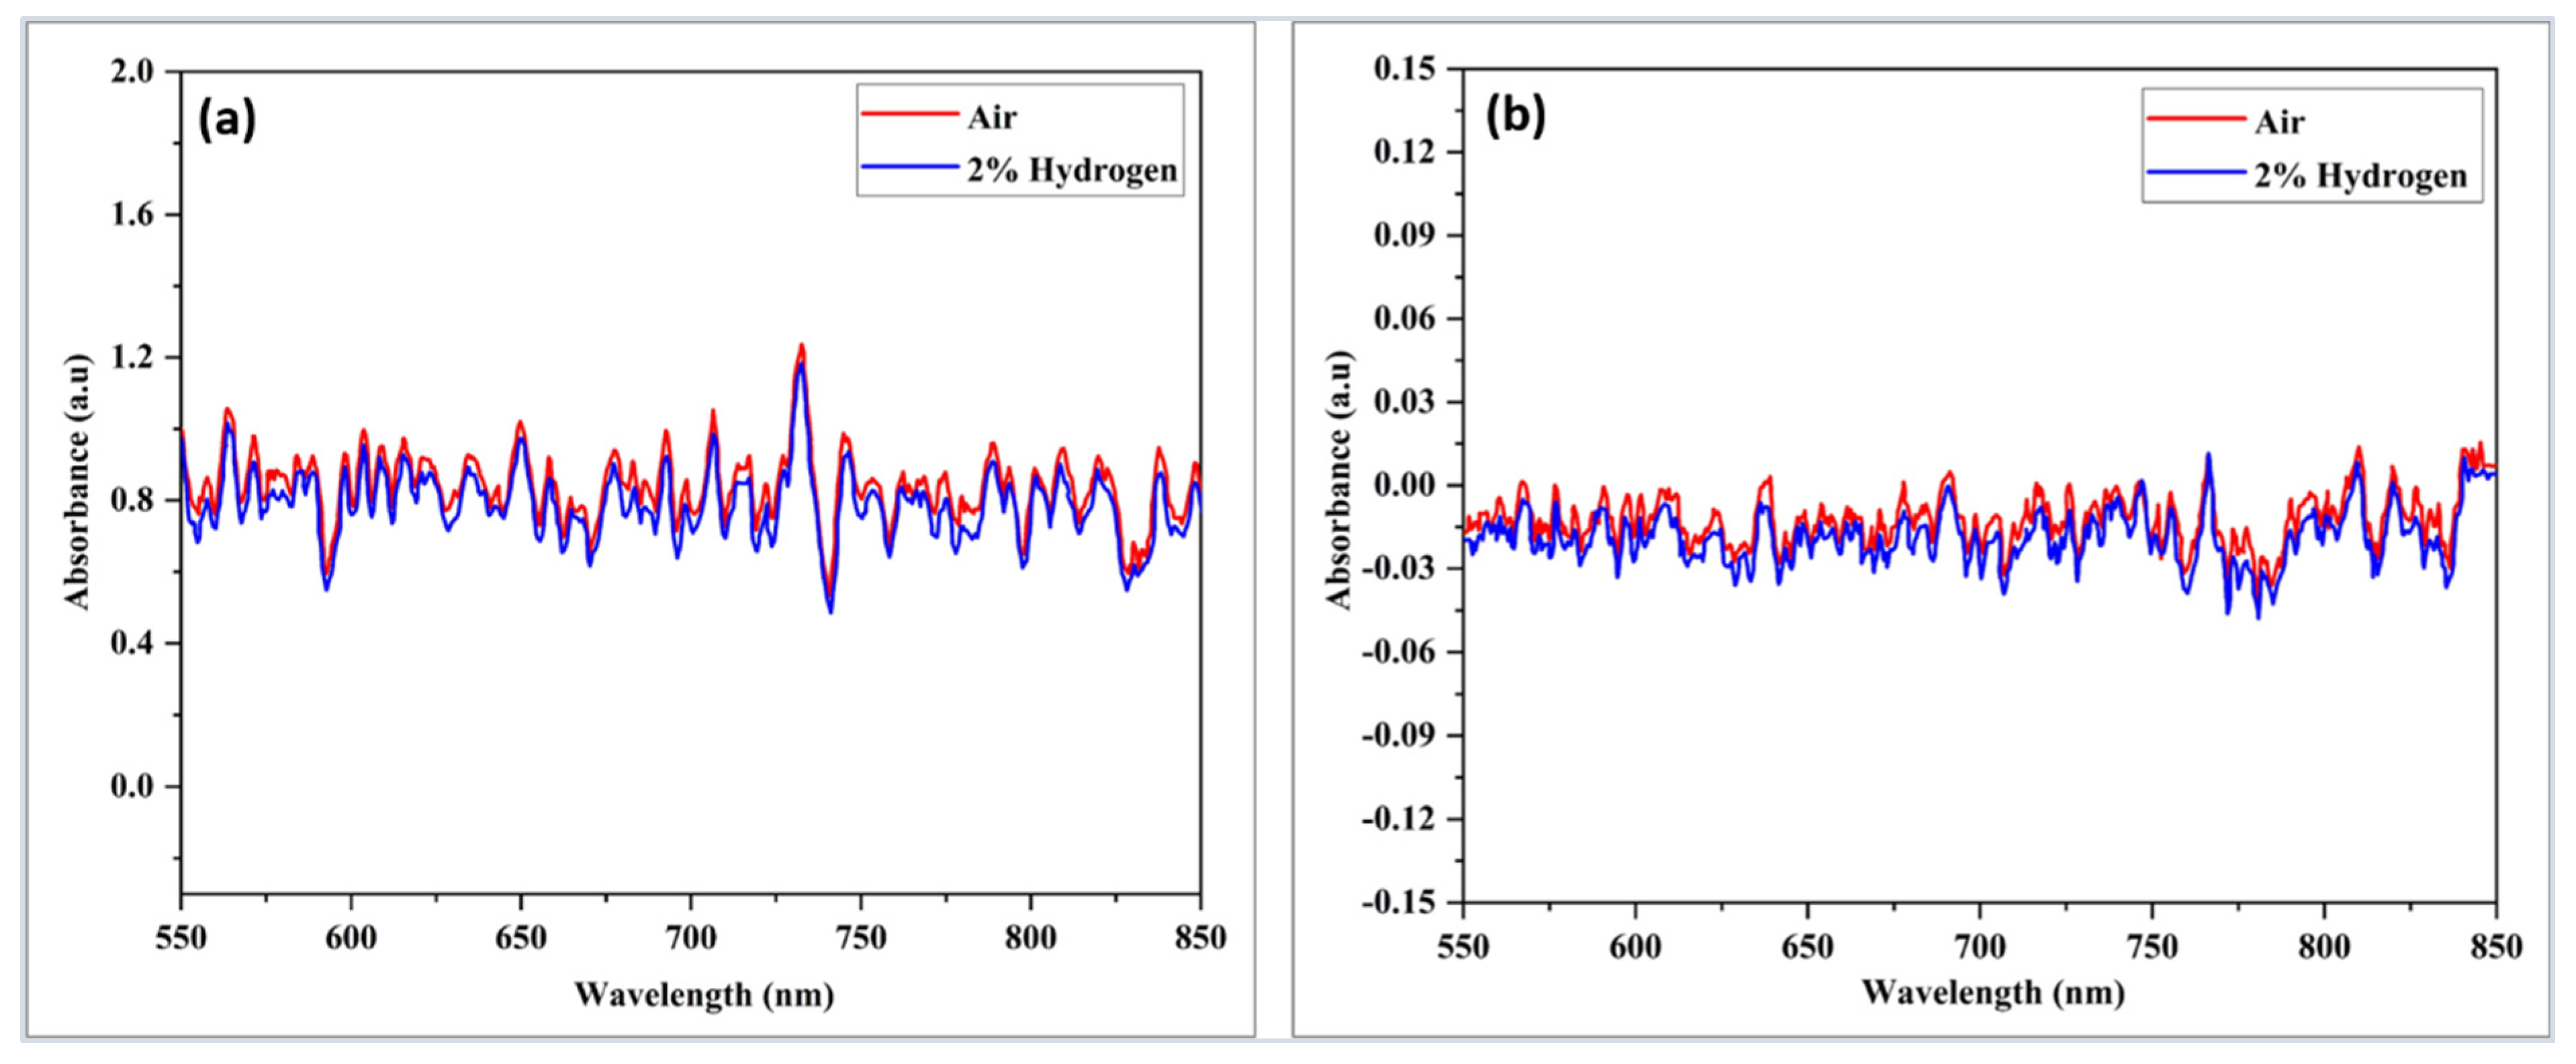
3.2. Hydrogen (H2) Response-Based Pd/GO Nanocomposite

Before performing any H2 testing on the fabricated optical sensor, the original substrate’s preliminary characteristic must be identified first. The uncoated or blank untapered and tapered optical multimode fiber were tested towards H2 to check whether any response was detected from the substrate. The diameter of untapered and tapered blank optical fiber was 125 µm and 20 µm, respectively.
The blank samples were exposed to 2.00% H2 at room temperature, as depicted in Figure 12. It was observed that there was no change in absorbance magnitude for both samples when 2.00% of H2 was purged in the chamber. No response was recorded when the test was continued at the high operating temperature of 200 °C, as demonstrated in Figure 13. It can be concluded that tapered and non-tapered optical fibers do not respond to, H2 since there was no interaction between the optical fiber and H2. Coating tapered optical fibers with nanostructured materials is expected to improve the sensitivity of its absorbance change toward the H2 environment.
The sensor sample was a Pd/GO nanocomposite coated on tapered optical fiber. Figure 14 depicts the change in cumulative absorbance versus operating temperature of GO and Pd/GO nanocomposites coated on tapered optical fibers when exposed to 2.00% H2 in synthetic air. A spectrophotometer incorporated a response curve from the 550–850 nm wavelength range to calculate cumulative absorbance. The figure depicts the optimum operating temperature of the GO and Pd/GO nanocomposite at 100 °C. The Pd/GO nanocomposite-based sensor exhibits a higher absorbance change than the GO sample. At lower operating temperatures, low absorbance may be due to slow chemical activation between the sensor layer and the absorbed gas molecule [55]. It can also be shown that the adsorption reaction slows down as temperature increases, possibly due to the increased reaction rate of adsorbed hydrogen atoms on active sites at higher temperatures [56]. The optimal operating temperature for GO and Pd/GO H2-based tapered optical fiber sensors for H2 was determined as 100 °C.
Figure 15a,b illustrates the absorbance spectra of the developed tapered optical fiber sensor toward different H2 concentrations. A distinctive absorbance change can be observed over the wavelength range of 550 nm to 850 nm. This wavelength is selected as the absorbance spectrum demonstrates the largest response toward H2 within this range based on experiments. The absorbance magnitude proportionally increased when H2 concentration increased. Between 550 and 850 nm, absorbance changes were associated with the Pd/GO nanocomposite coated sensors relative to the GO coated sensors. Nevertheless, the absorbance changes were higher in the Pd/GO nanocomposite-based sensors, which may be attributable to the presence of OH in GO [57].
The dynamic absorbance responses of a tapered optical fiber coated with GO and Pd/GO nanocomposite thin film to different concentrations of H2 gas at 100 °C over the wavelength range of 550–850 nm are shown in Figure 16a,b. As shown in Figure 16a, the dynamic response curve demonstrated that the sensor changed in response to the changing H2 concentrations. As a result, the GO-based sensor was not suitable as an active sensing layer for optical gas sensing applications. At a gas level of 0.125% H2, the gas absorption in the GO layer showed a change in absorbance of 5%. At a concentration 2.00% higher, the absorbance increased to 35%. The observed response and recovery time for 2.00% H2 were calculated as 2 min and 11 min, respectively.
In contrast, the Pd/GO nanocomposite-based sensor demonstrated a superior absorption response with the response and recovery durations of 48 s and 7 min, respectively, compared to the GO-based sensor. Changes in absorption were approximately 14% higher at 0.125% H2 concentration and 70% higher at 2.00% H2 concentration. As demonstrated in Figure 16, the dynamic response of the Pd/GO nanocomposite-based sensor identified less H2 at higher absorption changes than the GO-based sensor Figure 16b. The constructed sensor responds quicker than the optical fiber sensors described by Phan et al. [58]. When synthetic air was pumped into the chamber at 100 °C, the Pd/GO coated-based sensor recovered effectively.
At 100 °C, increasing the H2 concentrations resulted in a faster response with a lower recovery time of GO and Pd/GO nanocomposite coated optical fiber-based sensors, as shown in Figure 17a,b. The response time for the Pd/GO nanocomposite-based sensor was decreased from 205 s to 48 s, whereas the recovery time increased from 175 s to 420 s. The response time of the GO-based sensor, decreased from 195 s to 120 s, but the recovery time increased from 225 s to 660 s.
As illustrated in Figure 18, the suggested sensors were tested three times with H2 at a 2.00% concentration to determine their repeatability. The sensors’ sensitivity, responsiveness, and recovery times were found to be comparable. Excellent sensor repeatability is demonstrated here, which is crucial for precise H2 detection. The response drift that occurred in the GO-based sensor was overcome by tapered optical fibers coated with Pd/GO NC. Overall, the dynamic response of the constructed GO and Pd/GO NC-based sensors demonstrated excellent repeatability at 2.00% H2 and a high degree of absorbance.
Figure 19a depicts the cumulative absorbance change of the GO and Pd/GO nanocomposite sensing layers as a function of H2 concentration in the 550–850 nm wavelength range. The decrease in absorbance is proportional to the increase in H2 concentration, depending on the figure. The tapered optical fiber sensor-based GO and Pd/GO nanocomposite sensitivities were 19.03/vol% and 33.22/vol%, respectively, with an excellent linear slope of about 90% and 96.3%, respectively. Overall, the Pd/GO nanocomposite-based sensor performed noticeably better than the GO-based sensor.
A selectivity test was also performed for sensors coated with GO and Pd/GO nanocomposites towards ammonia (NH3) and methane (CH4). The selectivity measurement and comparison of H2, NH3, and CH4 at the same operating temperature of 100 °C at a concentration of 2.00% were shown in Figure 19b. The sensors were evaluated for selectivity in terms of absorbance response for a specific gas under similar conditions. The H2 absorbance of the Pd/GO nanocomposite sensor was astonishingly high, but its response to NH3 and CH4 gases was noticeably weak. Contrarily, the GO sensor responds to NH3 and CH4 with a greater H2 absorbance response. A high working temperature is required to increase the sensitivity of Pd/GO sensor-based H2 gas because methane is a stable gas that requires significant energy to completely separate H2 from C [59]. The Pd/GO sensor showed less sensitivity to NH3 because Pb is better suited for H2 gas separation [60]. This confirms that the produced Pd/GO nanocomposite-based sensor demonstrates good H2 selectivity compared to the GO-based sensor.
The stability of the GO and Pd/GO nanocomposite-based sensors for 14 days was also measured towards an H2 gas concentration of 2.00% in synthetic air at 100 °C, as shown in Figure 19c. The sensors were stored in a closed container at 20 °C in a dry cabinet to avoid contamination of the sensor surface. After two weeks, the gas response was slightly reduced by 5% and 3% for GO, and Pd/GO nanocomposites-based sensors, respectively. This result indicates that the prepared gas sensors, especially the Pd/GO nanocomposite-based sensor, present excellent stability. The test highlights that contribute greatly to the understanding of the properties of the chemical adsorbent towards H2 are illustrated in Table 1.
The sensing mechanism of the Pd/GO nanocomposite-based sensor can be explained in Figure 20. The Pd/GO nanocomposite-based H2 sensor mechanism is well-known [41,65,66]. When Pd adsorbs the H2 gas molecules, it changes to Pd hydride (PdHx) (where the Pd particle magnitude expands in small proportion), as it has fewer functions than pure Pd. The PdHx feature is handy in transferring more electronics from Pd to GO. In the Pd/GO nanocomposite, it is hypothesized that graphene oxide played a significant role as a support in carrying and detaching Pd nanoparticles on the tapered optical fiber, hence providing channels for the transport of charges. H2 molecules during Pd nanoparticles adsorption and H2 molecules desorption can diffuse even if Pd nanoparticles are coiled and loaded by graphene oxide due to the atomic thickness of graphene oxide.

4. Conclusions

The aim of this study is to develop tapered optical fiber sensors coated with a Pd/GO nanocomposite for H2 sensing applications. The H2 sensing performance analysis is performed by the investigation of the nanocomposite-coated optical fiber. Characterization technologies include FESEM, EDX, XRD, and AFM. The characterization results confirmed the purity of the nanoparticles and their effective deposition onto the tapered optical fiber. The analysis showed that the performance of the Pd/GO nanocomposite-based sensor was repeatable at gas concentrations of 0.125–2.00% in air at 100 °C. When exposed to various gases such as NH3 and CH4, the developed optical fiber sensors demonstrated high response, excellent selectivity, and stability toward H2 gas.

Author Contributions

Conceptualization, M.M.A., S.H.G. and M.H.Y.; data curation, M.M.A., M.M.A.E., K.M.K., A.H.J., S.P., N.A. and M.A.M.; formal analysis, Z.M.Y., M.M.A.E., K.M.K., A.H.J., S.H.G., S.P., N.A., M.A.M. and M.H.Y.; investigation, Z.M.Y., K.M.K., A.H.J., H.K.S., N.A. and M.A.M.; methodology, M.M.A.E., K.M.K., A.H.J. and N.A.; project administration, Z.M.Y.; resources, H.K.S. and M.A.M.; supervision, H.K.S. and M.H.Y.; validation, M.M.A.E., S.H.G., H.K.S., S.P. and M.A.M.; visualization, Z.M.Y., K.M.K., S.H.G., H.K.S. and M.A.M.; writing—original draft, Z.M.Y., M.M.A.E., K.M.K., A.H.J., S.H.G., S.P., N.A. and M.H.Y.; writing—review and editing, Z.M.Y., H.K.S., N.A. and M.H.Y. All authors have read and agreed to the published version of the manuscript.

Funding

This research work was supported by the Deanship of Scientific Research at King Khalid University under grant number R.G.P. 2/246/43. In addition, this research was funded by the Malaysia Ministry of Higher Education and University Putra Malaysia for project funds No. PRGS/2/2019/STG05/UPM/03/1.

Institutional Review Board Statement

Not applicable.

Informed Consent Statement

Not applicable.

Data Availability Statement

Not applicable.

Acknowledgments

This research work was supported by the Deanship of Scientific Research at King Khalid University under Grant number RGP. 2/246/43. In addition, we express our gratitude to the Deanship of Scientific Research, King Khalid University, for its support of this study. Further, an admirable appreciation is keen to the King Fahd University of Petroleum and Minerals, for their technical support.

Conflicts of Interest

The authors declare no conflict of interest.

References

  1. Dimitriou, P.; Kumar, M.; Tsujimura, T.; Suzuki, Y. Combustion and Emission Characteristics of a Hydrogen-Diesel Dual-Fuel Engine. Int. J. Hydrogen Energy 2018, 43, 13605–13617. [Google Scholar] [CrossRef]
  2. Sagar, S.M.V.; Agarwal, A.K. Knocking Behavior and Emission Characteristics of a Port Fuel Injected Hydrogen Enriched Compressed Natural Gas Fueled Spark Ignition Engine. Appl. Therm. Eng. 2018, 141, 42–50. [Google Scholar] [CrossRef]
  3. Singh, A.P.; Kumar, D.; Agarwal, A.K. Particulate Characteristics of Laser Ignited Hydrogen Enriched Compressed Natural Gas Engine. Int. J. Hydrogen Energy 2020, 45, 18021–18031. [Google Scholar] [CrossRef]
  4. Althubaiti, M.; Bernard, M.; Musilek, P. Fuzzy Logic Controller for Hybrid Renewable Energy System with Multiple Types of Storage. In Proceedings of the IEEE 30th Canadian Conference on Electrical and Computer Engineering, Windsor, ON, Canada, 30 April–3 May 2017. [Google Scholar] [CrossRef]
  5. Bychkov, A.L.; Korobeynikov, S.M.; Ryzhkina, A.Y. Determination of the Hydrogen Diffusion Coefficient in Transformer Oil. Tech. Phys. 2011, 56, 421–422. [Google Scholar] [CrossRef]
  6. Islam, M.M.; Lee, G.; Hettiwatte, S.N. A Review of Condition Monitoring Techniques and Diagnostic Tests for Lifetime Estimation of Power Transformers. Electr. Eng. 2018, 100, 581–605. [Google Scholar] [CrossRef]
  7. Peixoto, G.; Pantoja-Filho, J.L.R.; Agnelli, J.A.B.; Barboza, M.; Zaiat, M. Hydrogen and Methane Production, Energy Recovery, and Organic Matter Removal from Effluents in a Two-Stage Fermentative Process. Appl. Biochem. Biotechnol. 2012, 168, 651–671. [Google Scholar] [CrossRef] [PubMed]
  8. Dutta, S. A Review on Production, Storage of Hydrogen and Its Utilization as an Energy Resource. J. Ind. Eng. Chem. 2014, 20, 1148–1156. [Google Scholar] [CrossRef]
  9. Hübert, T.; Boon-Brett, L.; Black, G.; Banach, U. Hydrogen Sensors—A Review. Sens. Actuators B Chem. 2011, 157, 329–352. [Google Scholar] [CrossRef]
  10. Abe, J.O.; Popoola, A.P.I.; Ajenifuja, E.; Popoola, O.M. Hydrogen Energy, Economy and Storage: Review and Recommendation. Int. J. Hydrogen Energy 2019, 44, 15072–15086. [Google Scholar] [CrossRef]
  11. Bevenot, X.; Trouillet, A.; Veillas, C.; Gagnaire, H.; Clement, M. Hydrogen Leak Detection Using an Optical Fibre Sensor for Aerospace Applications. Sens. Actuators B Chem. 2000, 67, 57–67. [Google Scholar] [CrossRef]
  12. Caumon, P.; Zulueta, M.L.-B.; Louyrette, J.; Albou, S.; Bourasseau, C.; Mansilla, C. Flexible Hydrogen Production Implementation in the French Power System: Expected Impacts at the French and European Levels. Energy 2015, 81, 556–562. [Google Scholar] [CrossRef]
  13. Staffell, I.; Scamman, D.; Velazquez Abad, A.; Balcombe, P.; Dodds, P.E.; Ekins, P.; Shah, N.; Ward, K.R. The Role of Hydrogen and Fuel Cells in the Global Energy System. Energy Environ. Sci. 2019, 12, 463–491. [Google Scholar] [CrossRef] [Green Version]
  14. Chi, J.; Yu, H. Water Electrolysis Based on Renewable Energy for Hydrogen Production. Cuihua Xuebao/Chin. J. Catal. 2018, 39, 390–394. [Google Scholar] [CrossRef]
  15. Vinoth Kanna, I.; Paturu, P. A Study of Hydrogen as an Alternative Fuel. Int. J. Ambient. Energy 2020, 41, 1433–1436. [Google Scholar] [CrossRef]
  16. Hisatomi, T.; Domen, K. Reaction Systems for Solar Hydrogen Production via Water Splitting with Particulate Semiconductor Photocatalysts. Nat. Catal. 2019, 2, 387–399. [Google Scholar] [CrossRef]
  17. Hosseini, S.E.; Wahid, M.A. Hydrogen Production from Renewable and Sustainable Energy Resources: Promising Green Energy Carrier for Clean Development. Renew. Sustain. Energy Rev. 2016, 57, 850–866. [Google Scholar] [CrossRef]
  18. Bunker, C.E.; Smith, M.J. Nanoparticles for Hydrogen Generation. J. Mater. Chem. 2011, 21, 12173–12180. [Google Scholar] [CrossRef]
  19. Hübert, T.; Boon-Brett, L.; Palmisano, V.; Bader, M.A. Developments in Gas Sensor Technology for Hydrogen Safety. Int. J. Hydrogen Energy 2014, 39, 20474–20483. [Google Scholar] [CrossRef]
  20. Sazali, N. Emerging Technologies by Hydrogen: A Review. Int. J. Hydrogen Energy 2020, 45, 18753–18771. [Google Scholar] [CrossRef]
  21. Zhang, Y.; Peng, H.; Qian, X.; Zhang, Y.; An, G.; Zhao, Y. Recent Advancements in Optical Fiber Hydrogen Sensors. Sens. Actuators B Chem. 2017, 244, 393–416. [Google Scholar] [CrossRef] [Green Version]
  22. Gu, H.; Wang, Z.; Hu, Y. Hydrogen Gas Sensors Based on Semiconductor Oxide Nanostructures. Sensors 2012, 12, 5517–5550. [Google Scholar] [CrossRef] [PubMed] [Green Version]
  23. Yang, M.; Dai, J. Fiber Optic Hydrogen Sensors: A Review. Photonic Sens. 2014, 4, 300–324. [Google Scholar] [CrossRef] [Green Version]
  24. Dai, J.; Zhu, L.; Wang, G.; Xiang, F.; Qin, Y.; Wang, M.; Yang, M. Optical Fiber Grating Hydrogen Sensors: A Review. Sensors 2017, 17, 577. [Google Scholar] [CrossRef] [PubMed]
  25. Rocha-Rodrigues, P.; Hierro-Rodriguez, A.; Guerreiro, A.; Jorge, P.; Santos, J.L.; Araújo, J.P.; Teixeira, J.M. Hydrogen Optical Metamaterial Sensor Based on Pd Dendritic Nanostructures. ChemistrySelect 2016, 1, 3854–3860. [Google Scholar] [CrossRef]
  26. González-Sierra, N.E.; Gómez-Pavón, L.d.C.; Pérez-Sánchez, G.F.; Luis-Ramos, A.; Zaca-Morán, P.; Muñoz-Pacheco, J.M.; Chávez-Ramírez, F. Tapered Optical Fiber Functionalized with Palladium Nanoparticles by Drop Casting and Laser Radiation for H2 and Volatile Organic Compounds Sensing Purposes. Sensors 2017, 17, 2039. [Google Scholar] [CrossRef] [PubMed] [Green Version]
  27. Bavili, N.; Balkan, T.; Morova, B.; Eryürek, M.; Uysallı, Y.; Kaya, S.; Kiraz, A. Highly Sensitive Optical Sensor for Hydrogen Gas Based on a Polymer Microcylinder Ring Resonaator. Sens. Actuators B Chem. 2020, 310, 127806. [Google Scholar] [CrossRef]
  28. Zhao, Y.; Wu, Q.L.; Zhang, Y.N. High-Sensitive Hydrogen Sensor Based on Photonic Crystal Fiber Model Interferometer. IEEE Trans. Instrum. Meas. 2017, 66, 2198–2203. [Google Scholar] [CrossRef]
  29. Alkhabet, M.M.; Girei, S.H.; Paiman, S.; Arsad, N.; Mahdi, M.A.; Yaacob, M.H. Highly Sensitive Hydrogen Sensor Based on Palladium-Coated Tapered Optical Fiber at Room Temperature. Eng. Proc. 2020, 2, 8. [Google Scholar]
  30. Villatoro, J.; Luna-Moreno, D.; Monzón-Hernández, D. Optical Fiber Hydrogen Sensor for Concentrations below the Lower Explosive Limit. Sens. Actuators B Chem. 2005, 110, 23–27. [Google Scholar] [CrossRef]
  31. Toda, K.; Furue, R.; Hayami, S. Recent Progress in Applications of Graphene Oxide for Gas Sensing: A Review. Anal. Chim. Acta 2015, 878, 43–53. [Google Scholar] [CrossRef] [PubMed]
  32. Ma, J.; Ping, D.; Dong, X. Recent Developments of Graphene Oxide-Based Membranes: A Review. Membranes 2017, 7, 52. [Google Scholar] [CrossRef]
  33. Wang, J.; Singh, B.; Park, J.H.; Rathi, S.; Lee, I.Y.; Maeng, S.; Joh, H.I.; Lee, C.H.; Kim, G.H. Dielectrophoresis of Graphene Oxide Nanostructures for Hydrogen Gas Sensor at Room Temperature. Sens. Actuators B Chem. 2014, 194, 296–302. [Google Scholar] [CrossRef]
  34. Rasch, F.; Postica, V.; Schütt, F.; Mishra, Y.K.; Nia, A.S.; Lohe, M.R.; Feng, X.; Adelung, R.; Lupan, O. Highly Selective and Ultra-Low Power Consumption Metal Oxide Based Hydrogen Gas Sensor Employing Graphene Oxide as Molecular Sieve. Sens. Actuators B Chem. 2020, 320, 128363. [Google Scholar] [CrossRef]
  35. Wang, L.; Chen, M.X.; Yan, Q.Q.; Xu, S.L.; Chu, S.Q.; Chen, P.; Lin, Y.; Liang, H.W. A Sulfur-Tethering Synthesis Strategy toward High-Loading Atomically Dispersed Noble Metal Catalysts. Sci. Adv. 2019, 5, eaax6322. [Google Scholar] [CrossRef] [Green Version]
  36. Fu, L.; Yu, A. Electroanalysis of Dopamine Using Reduced Graphene Oxide-Palladium Nanocomposites. Nanosci. Nanotechnol. Lett. 2015, 7, 147–151. [Google Scholar] [CrossRef]
  37. Chunxia, Y.; Hui, D.; Wei, D.; Chaowei, X. Weakly-Coupled Multicore Optical Fiber Taper-Based High-Temperature Sensor. Sens. Actuators A Phys. 2018, 280, 139–144. [Google Scholar] [CrossRef]
  38. Korposh, S.; James, S.W.; Lee, S.W.; Tatam, R.P. Tapered Optical Fibre Sensors: Current Trends and Future Perspectives. Sensors 2019, 19, 2294. [Google Scholar] [CrossRef] [PubMed] [Green Version]
  39. Tian, K.; Zhang, M.; Farrell, G.; Wang, R.; Lewis, E.; Wang, P. Highly Sensitive Strain Sensor Based on Composite Interference Established within S-Tapered Multimode Fiber Structure. Opt. Express 2018, 26, 33982. [Google Scholar] [CrossRef] [PubMed]
  40. Omidvar, A.; Jaleh, B.; Nasrollahzadeh, M. Preparation of the GO/Pd Nanocomposite and Its Application for the Degradation of Organic Dyes in Water. J. Colloid Interface Sci. 2017, 496, 44–50. [Google Scholar] [CrossRef] [PubMed]
  41. Phan, D.-T.T.; Chung, G.-S.S. Characteristics of Resistivity-Type Hydrogen Sensing Based on Palladium-Graphene Nanocomposites. Int. J. Hydrogen Energy 2014, 39, 620–629. [Google Scholar] [CrossRef]
  42. Coelho, L.; de Almeida, J.M.M.M.; Santos, J.L.; Viegas, D. Fiber Optic Hydrogen Sensor Based on an Etched Bragg Grating Coated with Palladium. Appl. Opt. 2015, 54, 10342. [Google Scholar] [CrossRef]
  43. Liu, G.; Zhang, J.; Larsen, B.; Stark, C.; Breitkreutz, A.; Lin, Z.Y.; Breitkreutz, B.J.; Ding, Y.; Colwill, K.; Pasculescu, A.; et al. ProHits: Integrated Software for Mass Spectrometry-Based Interaction Proteomics; Nature Publishing Group: Rockville Pike Bethesda, MD, USA, 2010; Volume 28. [Google Scholar]
  44. Shamsi, S.; Alagan, A.A.; Sarchio, S.N.E.; Md Yasin, F. Synthesis, Characterization, and Toxicity Assessment of Pluronic F127-Functionalized Graphene Oxide on the Embryonic Development of Zebrafish (Danio Rerio). Int. J. Nanomed. 2020, 15, 8311–8329. [Google Scholar] [CrossRef]
  45. Chamoli, P.; Das, M.K.; Kar, K.K. Structural, Optical and Electronic Characteristics of N-Doped Graphene Nanosheets Synthesized Using Urea as Reducing Agent and Nitrogen Precursor. Mater. Res. Express 2017, 4, 015012. [Google Scholar] [CrossRef]
  46. Huang, H.; Wang, Y.; Zhang, Y.; Niu, Z.; Li, X. Amino-Functionalized Graphene Oxide for Cr (VI), Cu (II), Pb (II) and Cd (II) Removal from Industrial Wastewater. Open Chem. 2020, 18, 97–107. [Google Scholar] [CrossRef] [Green Version]
  47. Sun, K.G.; Hur, S.H. Highly Sensitive Non-Enzymatic Glucose Sensor Based on Pt Nanoparticle Decorated Graphene Oxide Hydrogel. Sens. Actuators B Chem. 2015, 210, 618–623. [Google Scholar]
  48. Aziz, A.; Lim, H.N.; Girei, S.H.; Yaacob, M.H.; Mahdi, M.A.; Huang, N.M.; Pandikumar, A. Silver/Graphene Nanocomposite-Modified Optical Fiber Sensor Platform for Ethanol Detection in Water Medium. Sens. Actuators B Chem. 2015, 206, 119–125. [Google Scholar]
  49. Mohammadi, M.M.; Kumar, A.; Liu, J.; Liu, Y.; Thundat, T.; Swihart, M.T. Hydrogen Sensing at Room Temperature Using Flame-Synthesized Palladium-Decorated Crumpled Reduced Graphene Oxide Nanocomposites. ACS Sens. 2020, 5, 2344–2350. [Google Scholar] [CrossRef]
  50. Tong, X.; Wang, H.; Wang, G.; Wan, L.; Ren, Z.; Bai, J.; Bai, J. Controllable Synthesis of Graphene Sheets with Different Numbers of Layers and Effect of the Number of Graphene Layers on the Specific Capacity of Anode Material in Lithium-Ion Batteries. J. Solid State Chem. 2011, 184, 982–989. [Google Scholar] [CrossRef]
  51. Saleem, H.; Haneef, M.; Abbasi, H.Y. Synthesis Route of Reduced Graphene Oxide via Thermal Reduction of Chemically Exfoliated Graphene Oxide. Mater. Chem. Phys. 2018, 204, 1–7. [Google Scholar] [CrossRef]
  52. Escalona-Villalpando, R.A.; Gurrola, M.P.; Trejo, G.; Guerra-Balcázar, M.; Ledesma-García, J.; Arriaga, L.G. Electrodeposition of Gold on Oxidized and Reduced Graphite Surfaces and Its Influence on Glucose Oxidation. J. Electroanal. Chem. 2018, 816, 92–98. [Google Scholar] [CrossRef]
  53. Rout, D.R.; Senapati, P.; Sutar, H.; Sau, D.C.; Murmu, R. Graphene Oxide (GO) Supported Palladium (Pd) Nanocomposites for Enhanced Hydrogenation. Graphene 2019, 8, 33–51. [Google Scholar] [CrossRef]
  54. Gao, J.; Bao, F.; Zhu, Q.; Tan, Z.; Chen, T.; Cai, H.; Zhao, C.; Cheng, Q.; Yang, Y.; Ma, R. Attaching Hexylbenzene and Poly (9, 9-Dihexylfluorene) to Brominated Graphene via Suzuki Coupling Reaction. Polym. Chem. 2013, 4, 1672–1679. [Google Scholar] [CrossRef]
  55. Corso, A.J.; Tessarolo, E.; Guidolin, M.; Della Gaspera, E.; Martucci, A.; Angiola, M.; Donazzan, A.; Pelizzo, M.G. Room-Temperature Optical Detection of Hydrogen Gas Using Palladium Nano-Islands. Int. J. Hydrogen Energy 2018, 43, 5783–5792. [Google Scholar] [CrossRef]
  56. Arora, K.; Srivastava, S.; Solanki, P.R.; Puri, N.K. Electrochemical Hydrogen Gas Sensing Employing Palladium Oxide/Reduced Graphene Oxide (PdO-RGO) Nanocomposites. IEEE Sens. J. 2019, 19, 8262–8271. [Google Scholar] [CrossRef]
  57. Yaacob, M.H.; Breedon, M.; Kalantar-Zadeh, K.; Wlodarski, W. Absorption Spectral Response of Nanotextured WO3 Thin Films with Pt Catalyst towards H2. Sens. Actuators B Chem. 2009, 137, 115–120. [Google Scholar] [CrossRef]
  58. Phan, D.T.; Chung, G.S. A Novel Pd Nanocube-Graphene Hybrid for Hydrogen Detection. Sens. Actuators B Chem. 2014, 199, 354–360. [Google Scholar] [CrossRef]
  59. Basu, S.; Basu, P.K. Nanocrystalline Metal Oxides for Methane Sensors: Role of Noble Metals. J. Sens. 2009, 2009, 1–20. [Google Scholar] [CrossRef]
  60. Renganathan, B.; Sastikumar, D.; Srinivasan, R.; Ganesan, A.R. Nanocrystalline Samarium Oxide Coated Fiber Optic Gas Sensor. Mater. Sci. Eng. B 2014, 186, 122–127. [Google Scholar] [CrossRef]
  61. Yahya, N.A.M.; Hamid, M.R.Y.; Ibrahim, S.A.; Ong, B.H.; Rahman, N.A.; Zain, A.R.M.; Mahdi, M.A.; Yaacob, M.H. H2 Sensor Based on Tapered Optical Fiber Coated with MnO2 Nanostructures. Sens. Actuators B Chem. 2017, 246, 421–427. [Google Scholar] [CrossRef]
  62. Yu, Z.; Jin, L.; Sun, L.; Li, J.; Ran, Y.; Guan, B.-O. Highly Sensitive Fiber Taper Interferometric Hydrogen Sensors. IEEE Photonics J. 2015, 8, 1–9. [Google Scholar] [CrossRef]
  63. Dai, J.; Yang, M.; Yu, X.; Lu, H. Optical Hydrogen Sensor Based on Etched Fiber Bragg Grating Sputtered with Pd/Ag Composite Film. Opt. Fiber Technol. 2013, 19, 26–30. [Google Scholar] [CrossRef]
  64. Cretu, V.; Postica, V.; Stoianov, D.; Trofim, V.; Sontea, V.; Lupan, O. Hydrogen Gas Sensor Based on Nanograined Pd/α-MoO3 Belts. IFMBE Proc. 2016, 55, 361–364. [Google Scholar] [CrossRef]
  65. Chung, M.G.; Kim, D.-H.; Seo, D.K.; Kim, T.; Im, H.U.; Lee, H.M.; Yoo, J.-B.; Hong, S.-H.; Kang, T.J.; Kim, Y.H. Flexible Hydrogen Sensors Using Graphene with Palladium Nanoparticle Decoration. Sens. Actuators B Chem. 2012, 169, 387–392. [Google Scholar] [CrossRef]
  66. Lange, U.; Hirsch, T.; Mirsky, V.M.; Wolfbeis, O.S. Hydrogen Sensor Based on a Graphene-Palladium Nanocomposite. Electrochim. Acta 2011, 56, 3707–3712. [Google Scholar] [CrossRef]
Figure 1. Vytran GPX-3400 glass processing workstation in Photonics Laboratory, Universiti Putra Malaysia (UPM).
Materials 15 08167 g001
Figure 2. A sketched figure of tapered fiber profile with a uniform waist.
Materials 15 08167 g002
Figure 3. FESEM image of (a) Untapered multimodal fibers (MMF) and (b) a transition region of a tapered MMF.
Materials 15 08167 g003
Figure 4. (a) Synthesis process of Pd/GO nanocomposite, (b) Schematic view of the Pd/GO nanocomposite setting, and (c) The stable solution of PdCl2, GO, and Pd/GO nanocomposite.
Materials 15 08167 g004
Figure 5. Tapered optical fiber functionalization with Pd/GO nanocomposite using the drop-casting method.
Materials 15 08167 g005
Figure 6. Absorbance measurement gas testing setup.
Materials 15 08167 g006
Figure 7. (a) Gas chamber for optical fiber and (b) light propagates into the tapered optical fiber sensor.
Materials 15 08167 g007
Figure 8. FESEM micrographs of (a) tapered MMF coated with Pd/GO composite, (b,c) GO, (d,e) Pd/GO nanocomposite.
Materials 15 08167 g008
Figure 9. EDX measurement of (a) GO and (b) Pd/GO nanocomposite.
Materials 15 08167 g009
Figure 10. XRD pattern for both samples (a) GO thin film and (b) Pd/GO nanocomposite thin film.
Materials 15 08167 g010
Figure 11. 2D topography of AFM images of (a) GO and (c) Pd/GO composite. 3D AFM images of (b) GO and (d) Pd/GO composite. 3D AFM topography images of the boundary region between the uncoated and coated fibers of (e) GO and (f) the Pd/GO composite sensor layer.
Materials 15 08167 g011
Figure 12. Absorbance response versus wavelength for multimode optical fibers (a) untampered and (b) tapered when exposed to 2.00% H2 at room temperature.
Materials 15 08167 g012
Figure 13. Absorption response versus uncoated wavelength (a) untapered, (b) tapered multimodal optical fibers when exposed to 2.00% H2 at 200 °C.
Materials 15 08167 g013
Figure 14. The change of cumulative absorption with an operating temperature of GO and Pd/GO nanocomposite-based optical fiber sensor towards synthetic air and 2.00% H2.
Materials 15 08167 g014
Figure 15. Absorbance versus optical wavelength (a) Pd/GO and (b) GO-coated optical fiber-based sensor towards synthetic air and 2.00% H2 at 100 °C.
Materials 15 08167 g015
Figure 16. Dynamic absorbance curves of sensors coated with (a) GO and (b) Pd/GO nanocomposite to different H2 concentrations in synthetic air at 100 °C.
Materials 15 08167 g016
Figure 17. Effect of H2 concentrations on the response and recovery times of (a) GO and (b) Pd/GO nanocomposite-based sensors at 100 °C.
Materials 15 08167 g017
Figure 18. The repeatability of the developed sensor towards 2.00% concentration of H2 in synthetic air at 100 °C (a) GO and (b) Pd/GO nanocomposite-based sensor.
Materials 15 08167 g018
Figure 19. (a) Absorbance changes at different H2 concentrations for coated GO and Pd/GO nanocomposite-based sensors, (b) comparison bar graph of the selectivity of optical fibers coated with GO and Pd/GO nanocomposite-based sensors, and (c) stability of the fabricated sensors towards 2.00% H2 gas concentration in synthetic air at 100 °C.
Materials 15 08167 g019
Figure 20. Illustration of gas-sensing mechanism between the H2 molecules and Pd/GO nanocomposite on tapered optical fiber.
Materials 15 08167 g020
Table 1. Summary and comparison of the developed tapered optical fiber sensors’ sensing performance.
Sensor-BasedSensor
Structure
Operating
Temperature °C
Sensitivity (Abs/%)Response Time (s)Ref.
Pd NPsQuartz substrateRT15.4050[29]
GOPMMA fiberRT2.3390[33]
Pd/MnO2Tapered MMF 3.609240[61]
Pd NPsMach-Zehnder
interferometer
RT2.5830[62]
Pd NPsTapered MMFRT4.285100[30]
Pd/AgEtched FBGRT2.112280[63]
Pd/α-MoO3Substrate with Pd
electrode
2001.46230[64]
GOTapered MMFRT19.03120This work
Pd/GO nanocompositeTapered MMFRT33.22148This work
Ref. refers to reference and RT refers to reference room temperature.
Publisher’s Note: MDPI stays neutral with regard to jurisdictional claims in published maps and institutional affiliations.

