


Investigation of Waves Generated by Tropical Cyclone Kyarr in the Arabian Sea: An Application of ERA5 Reanalysis Wind Data

Abstract
1. Introduction
2. Materials and Methods
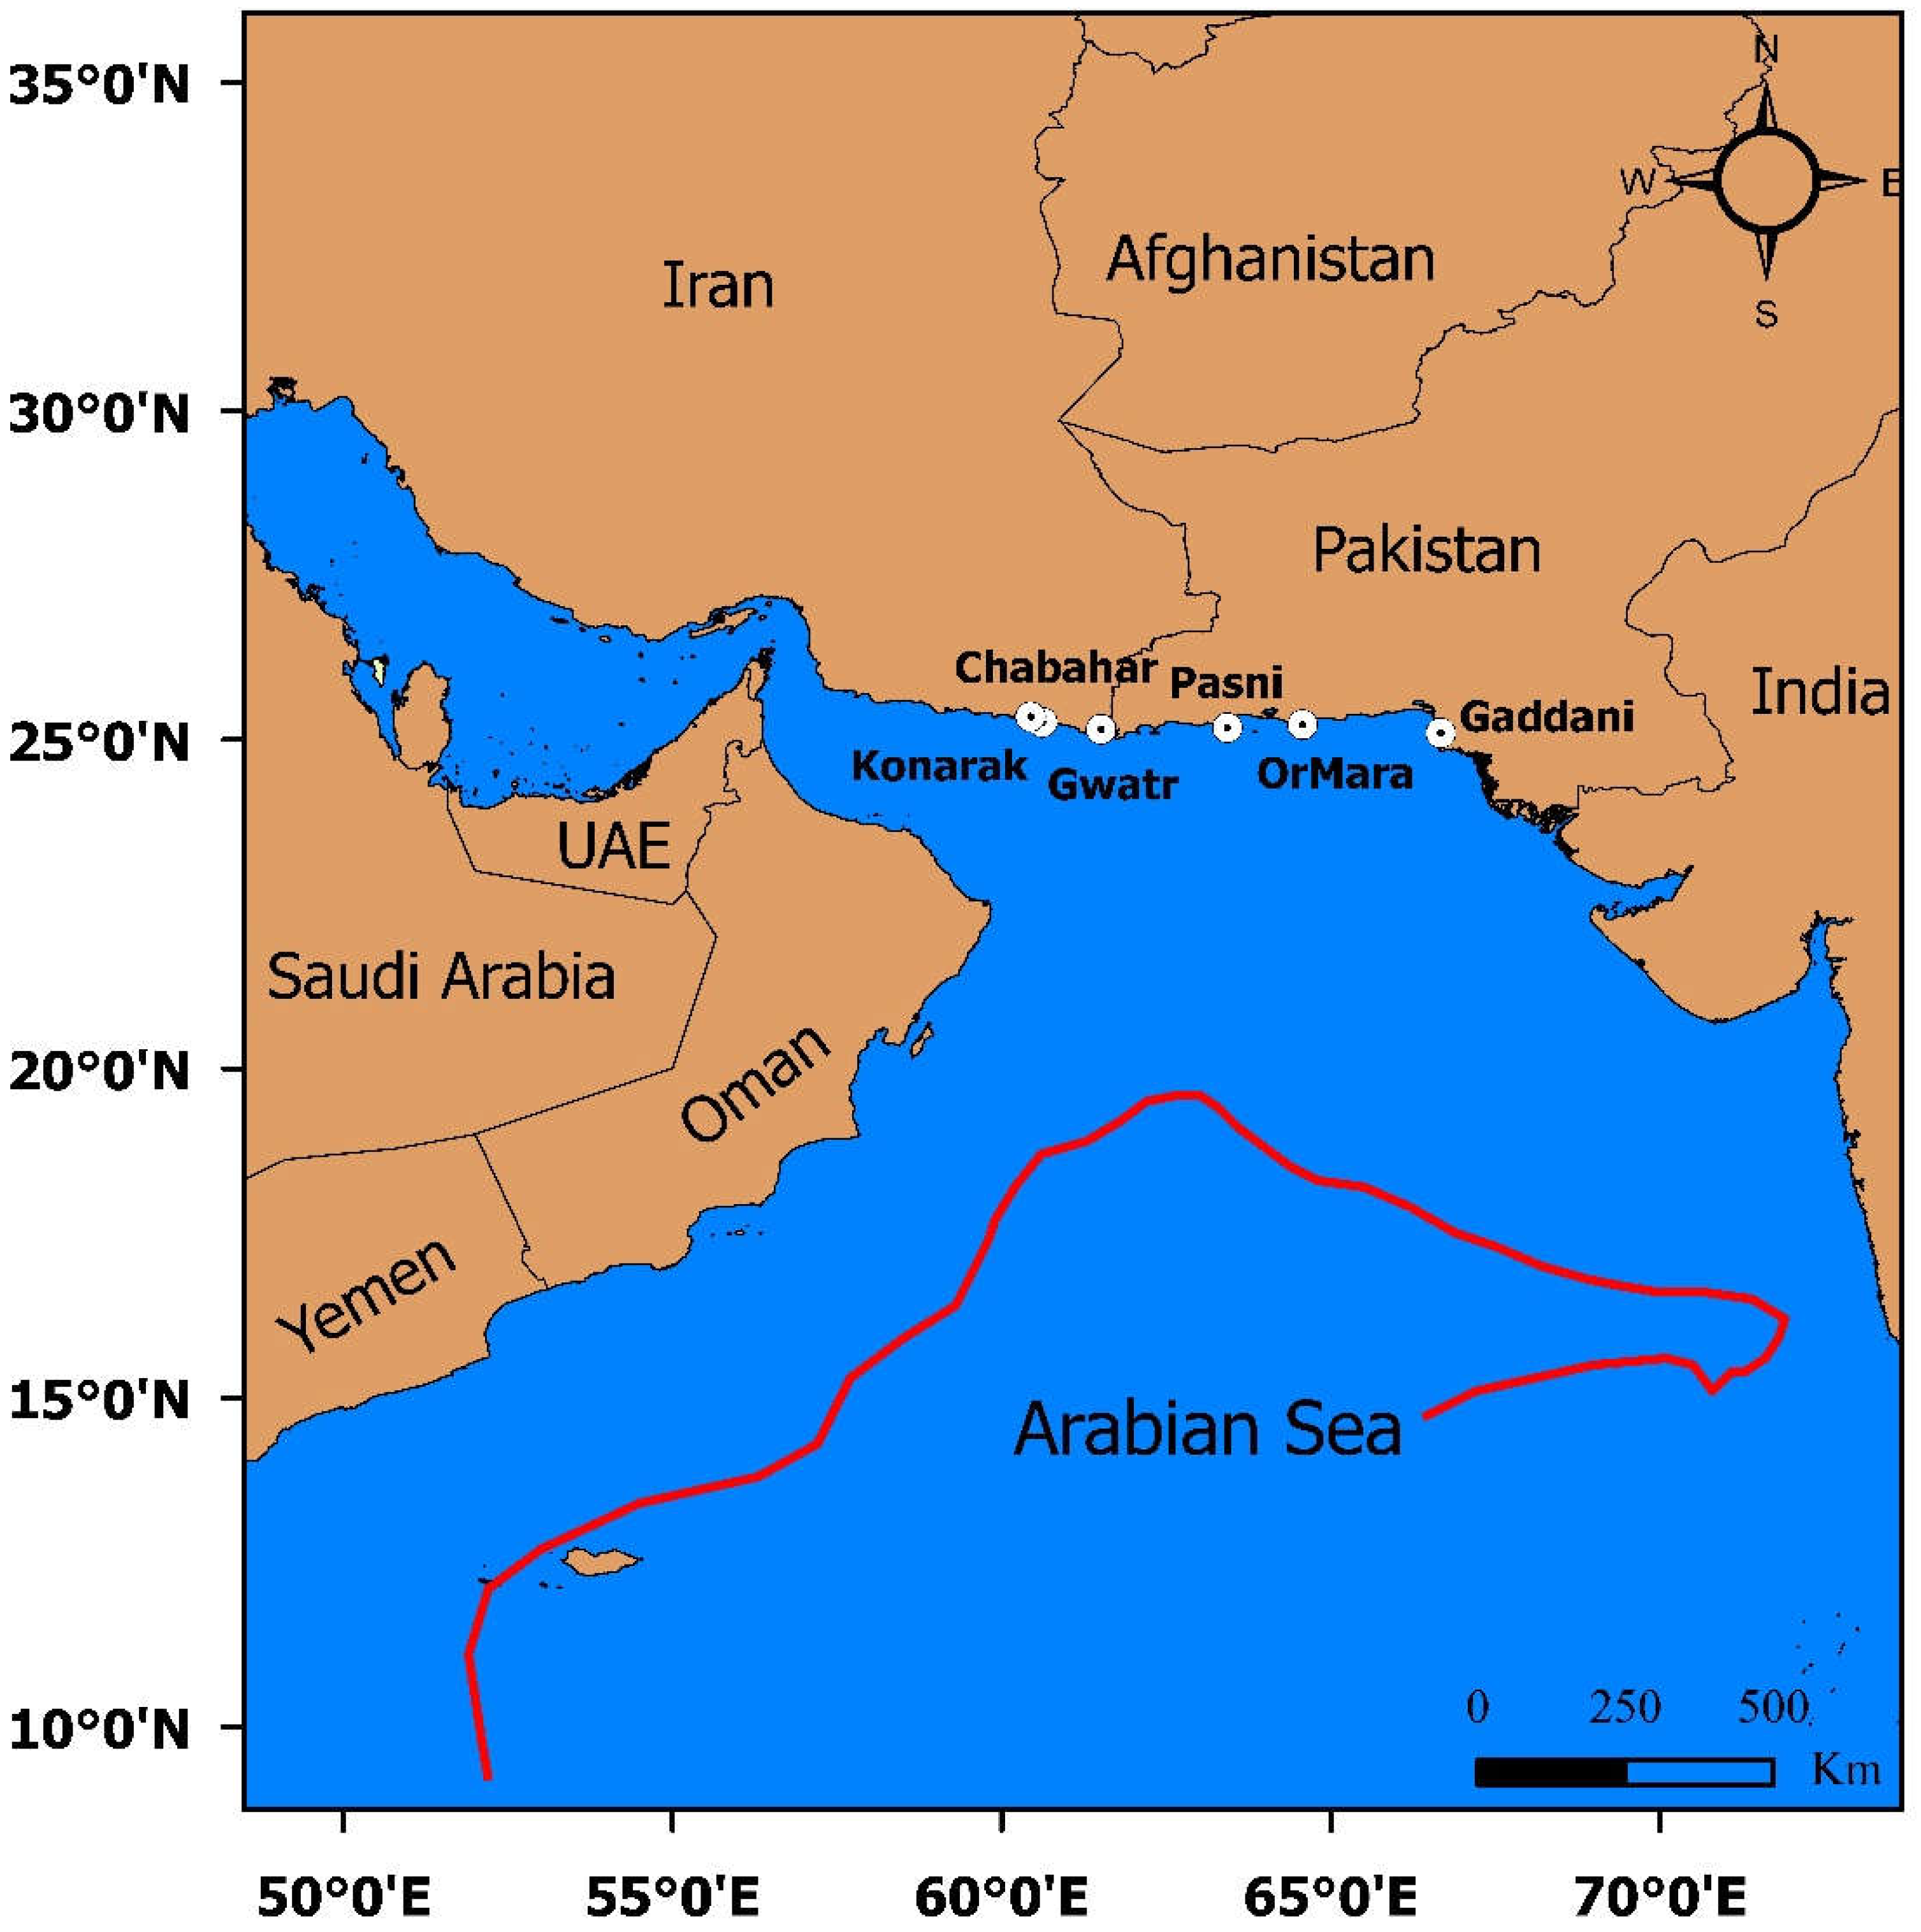
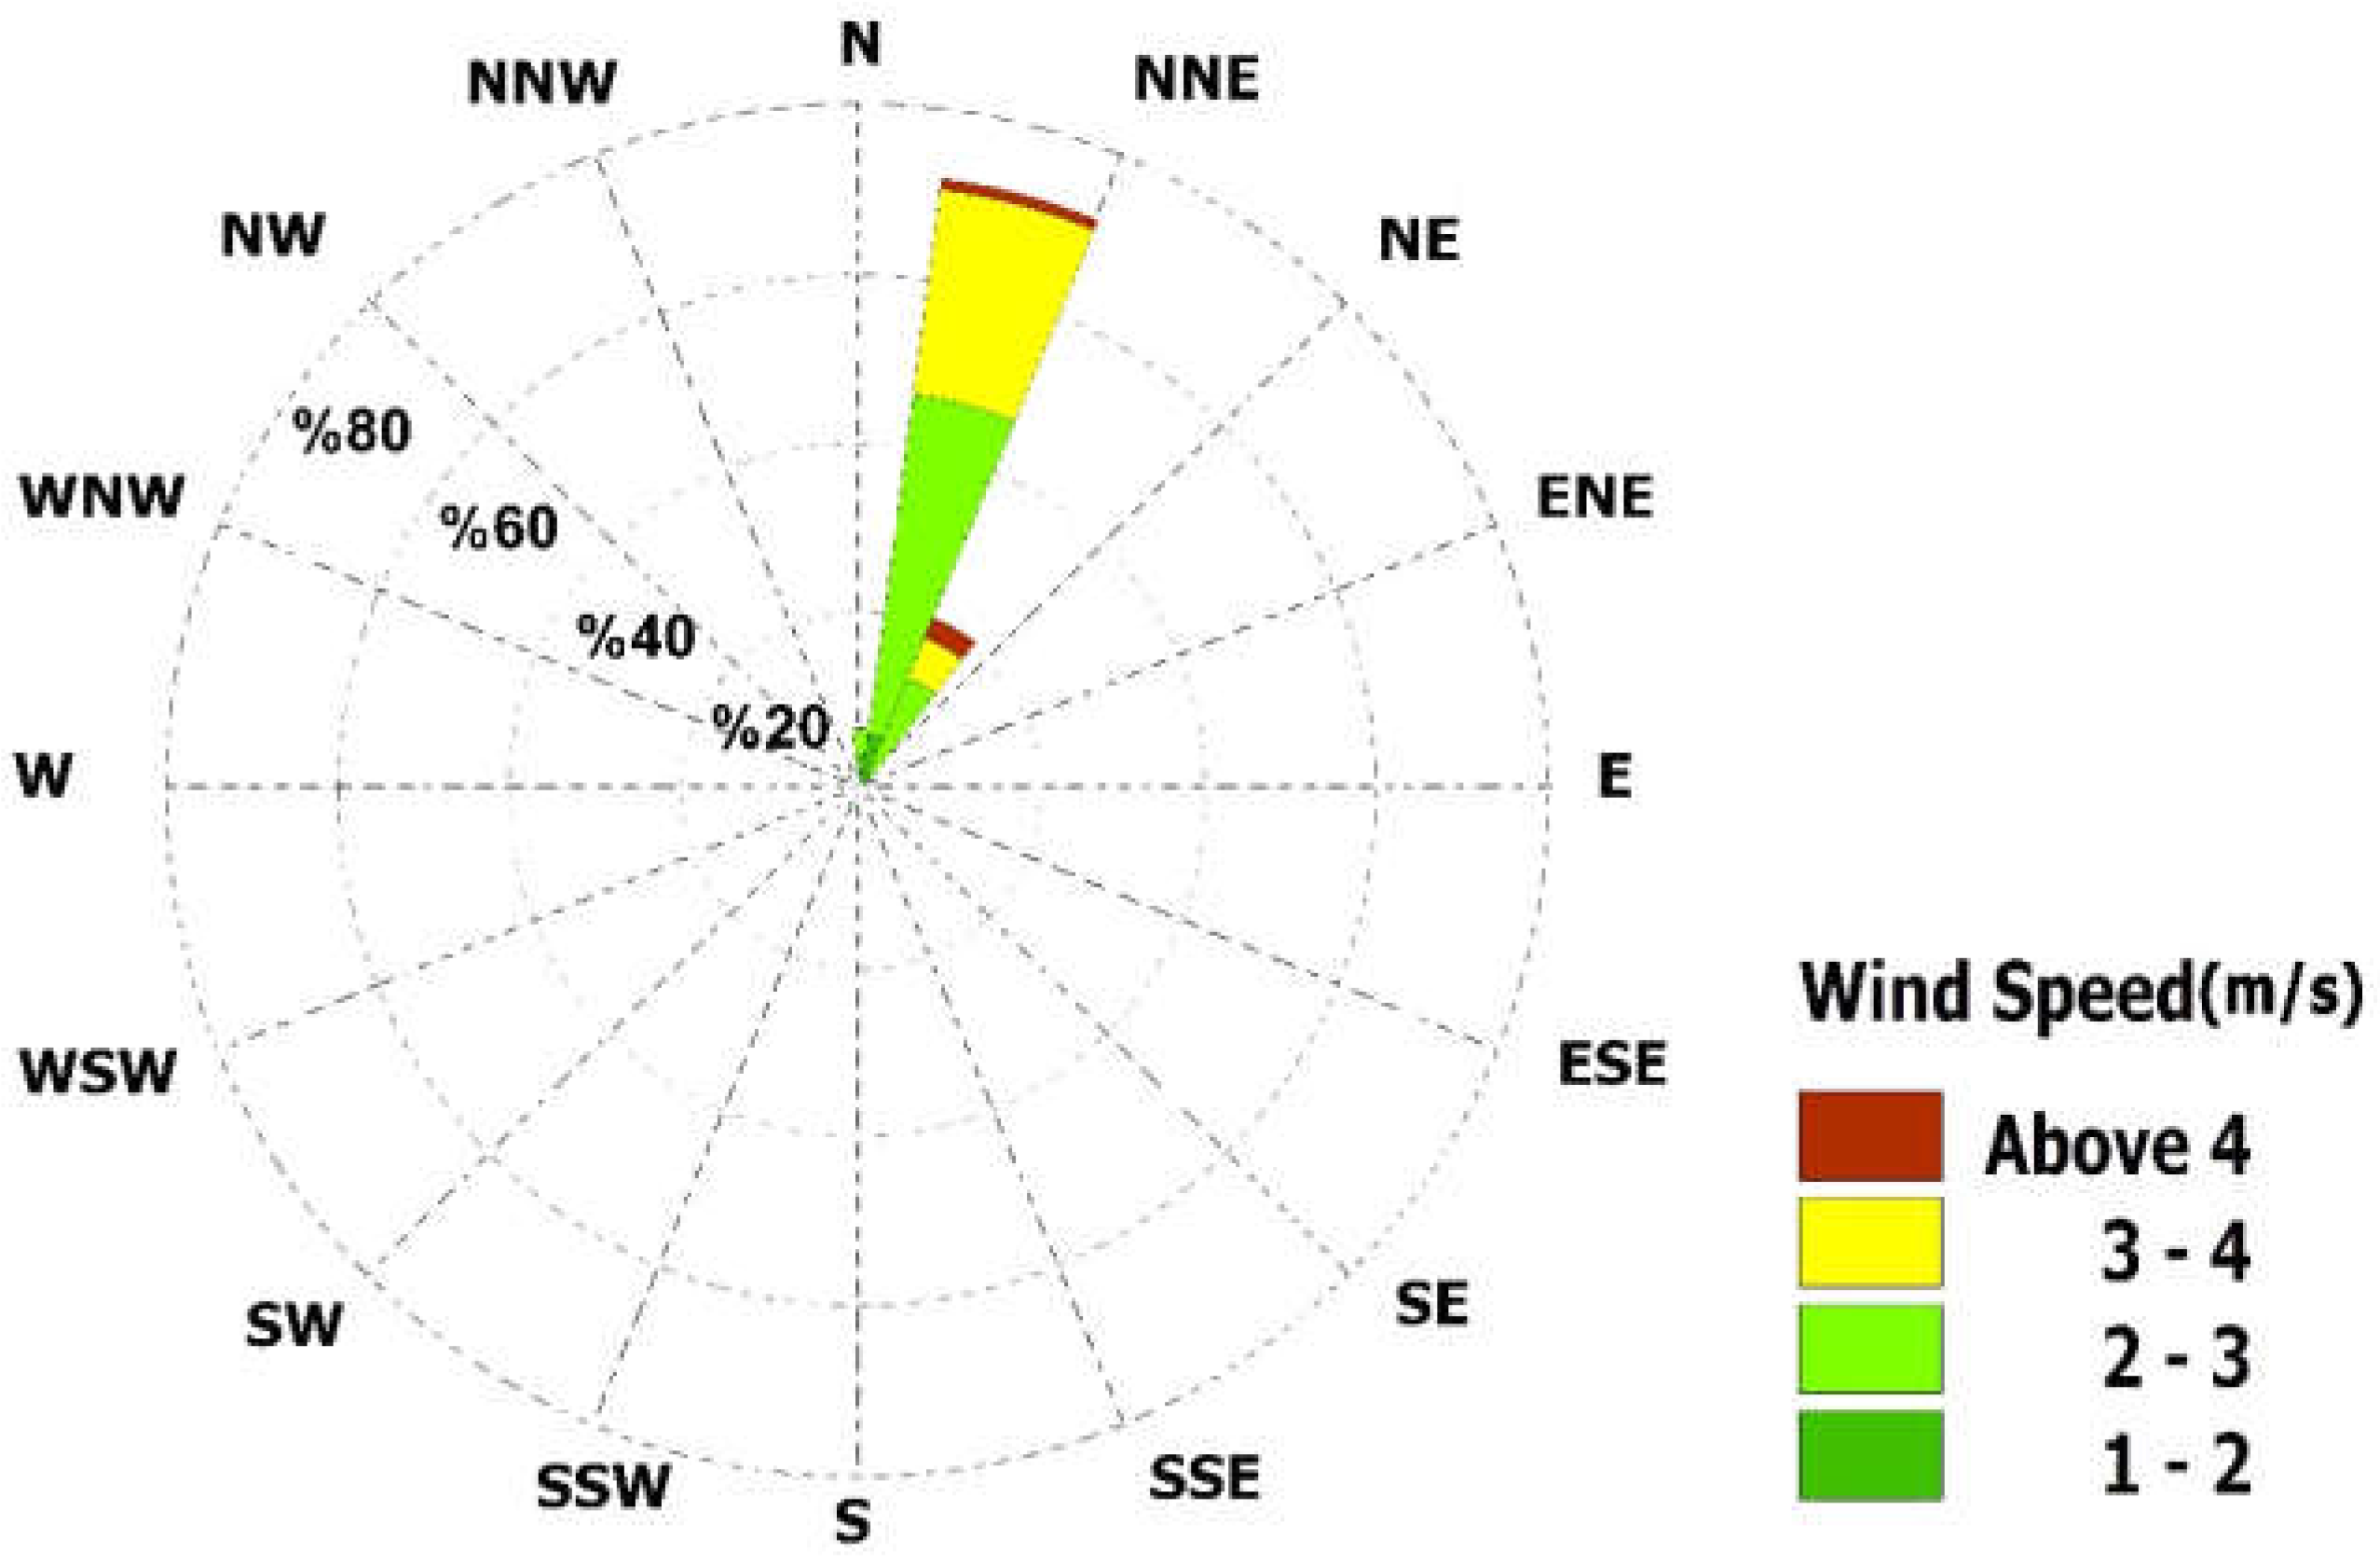
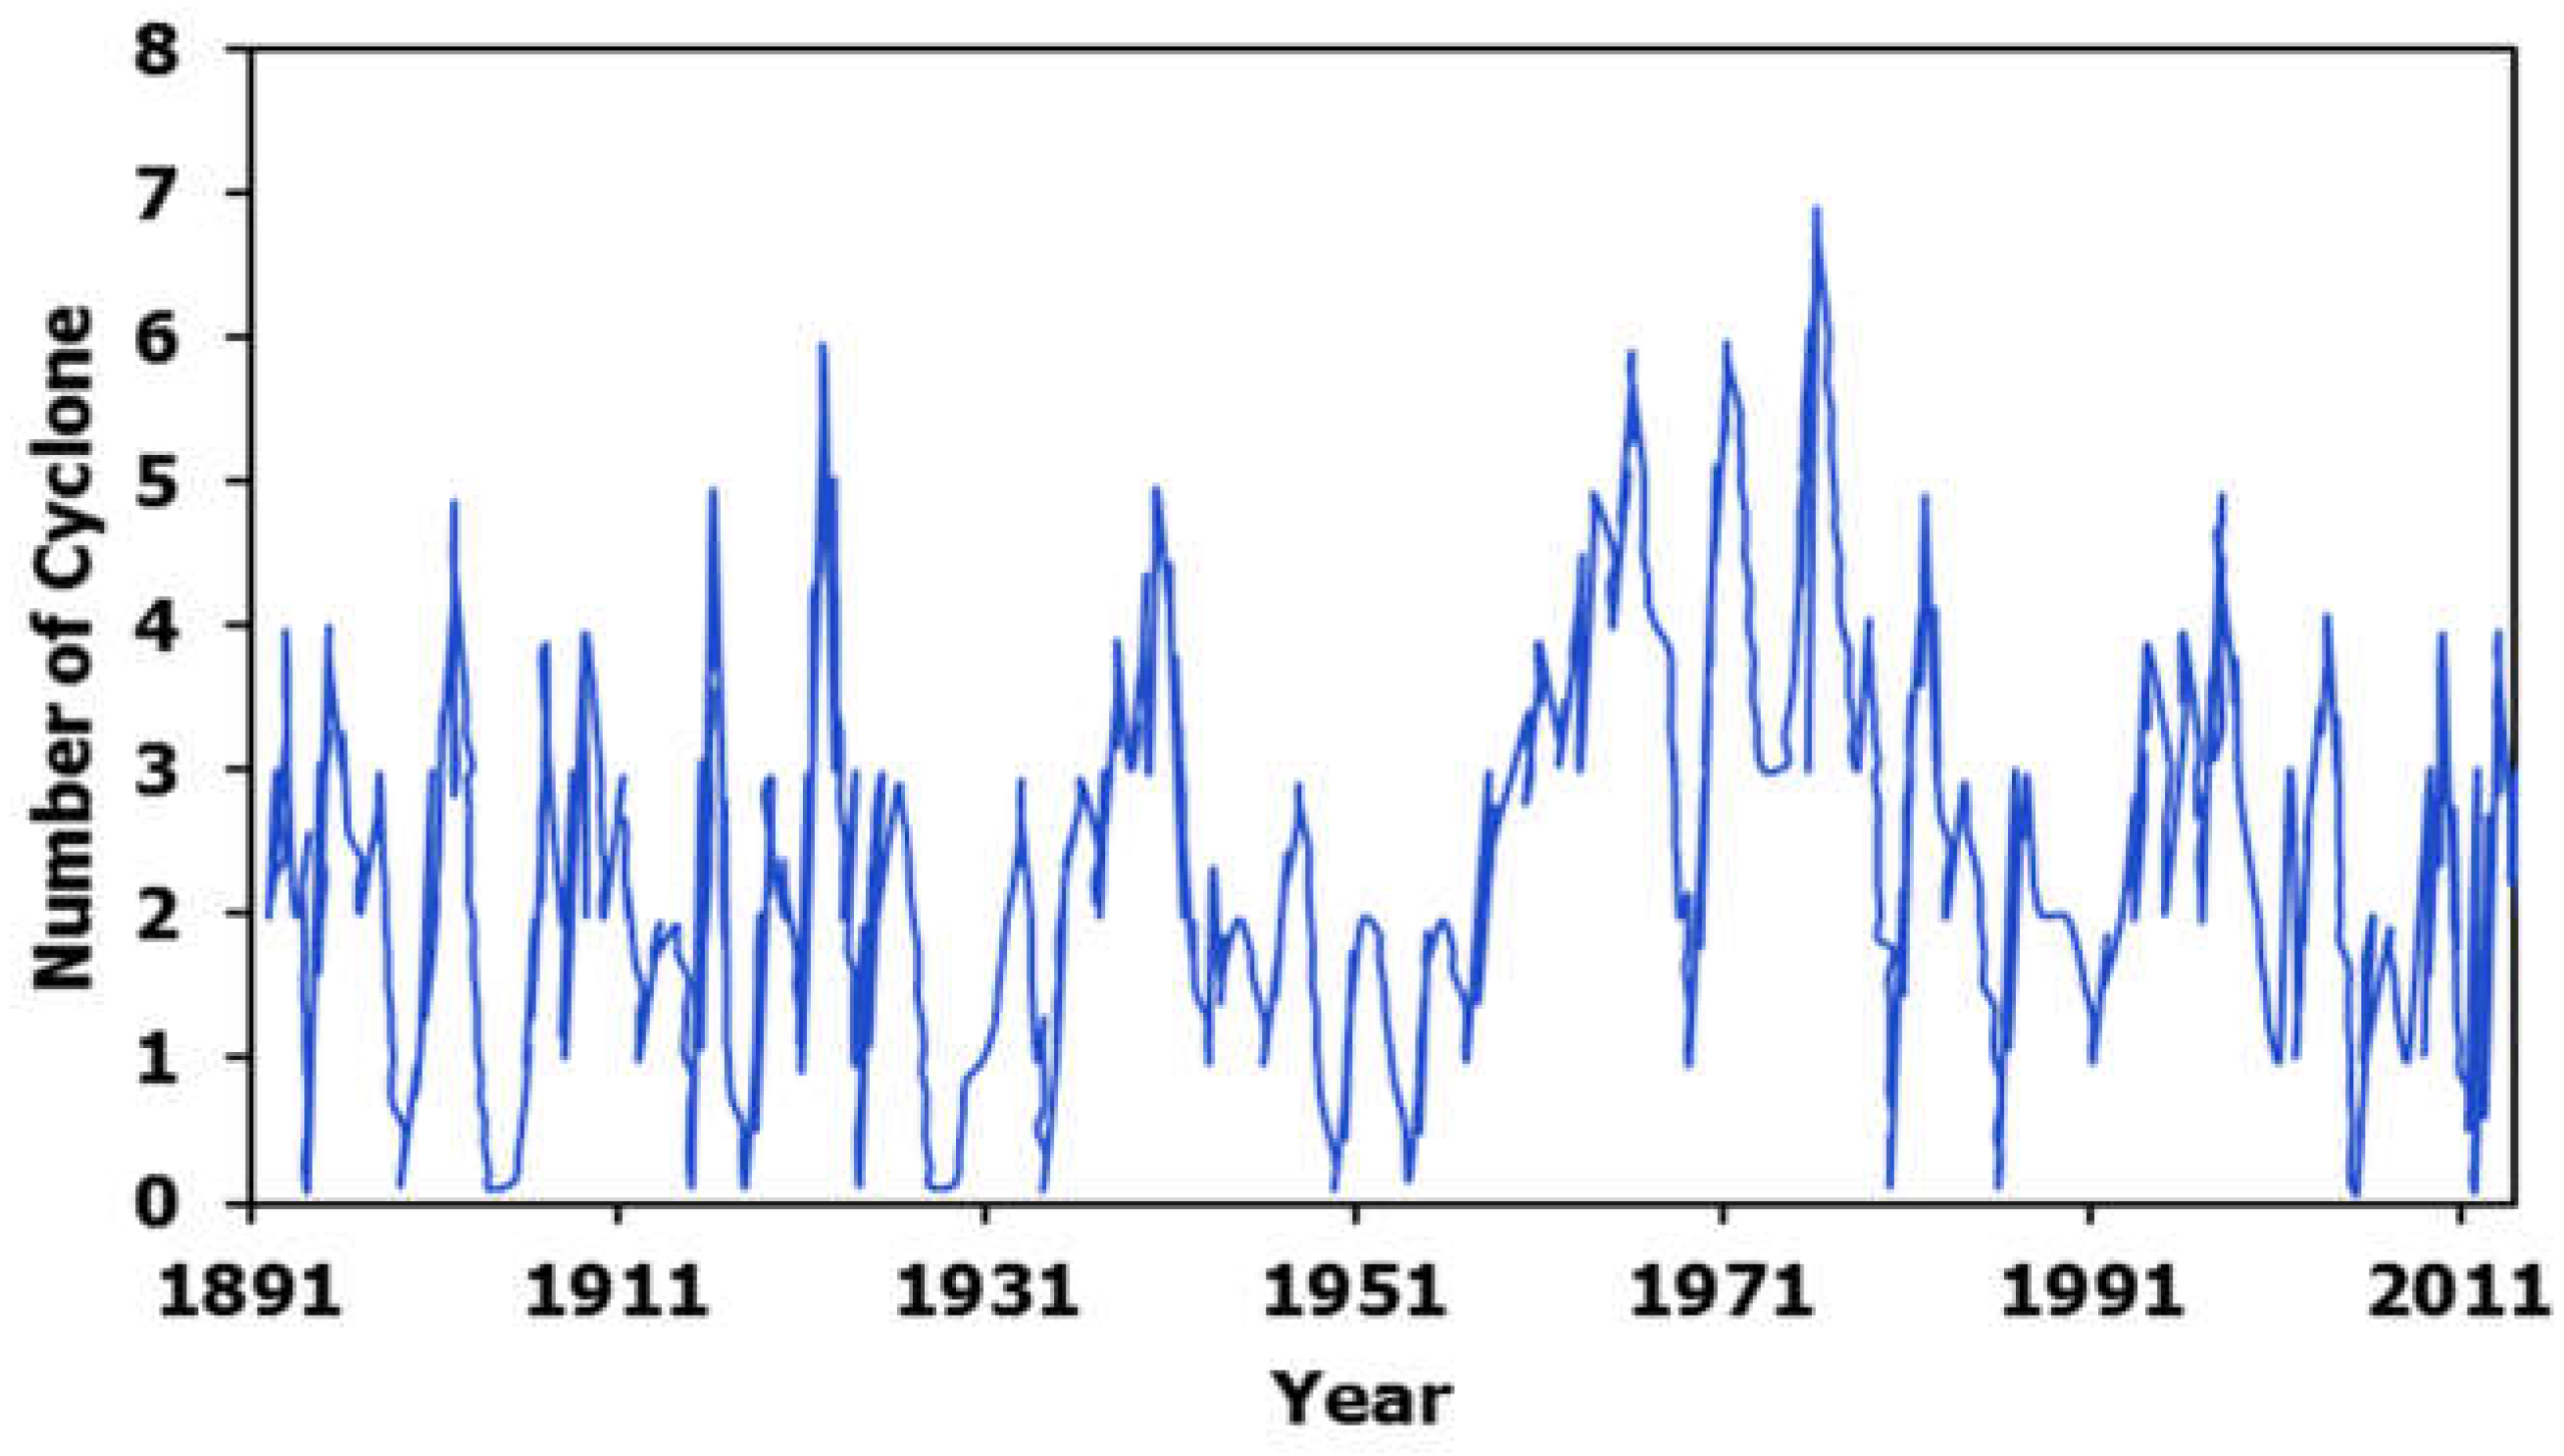
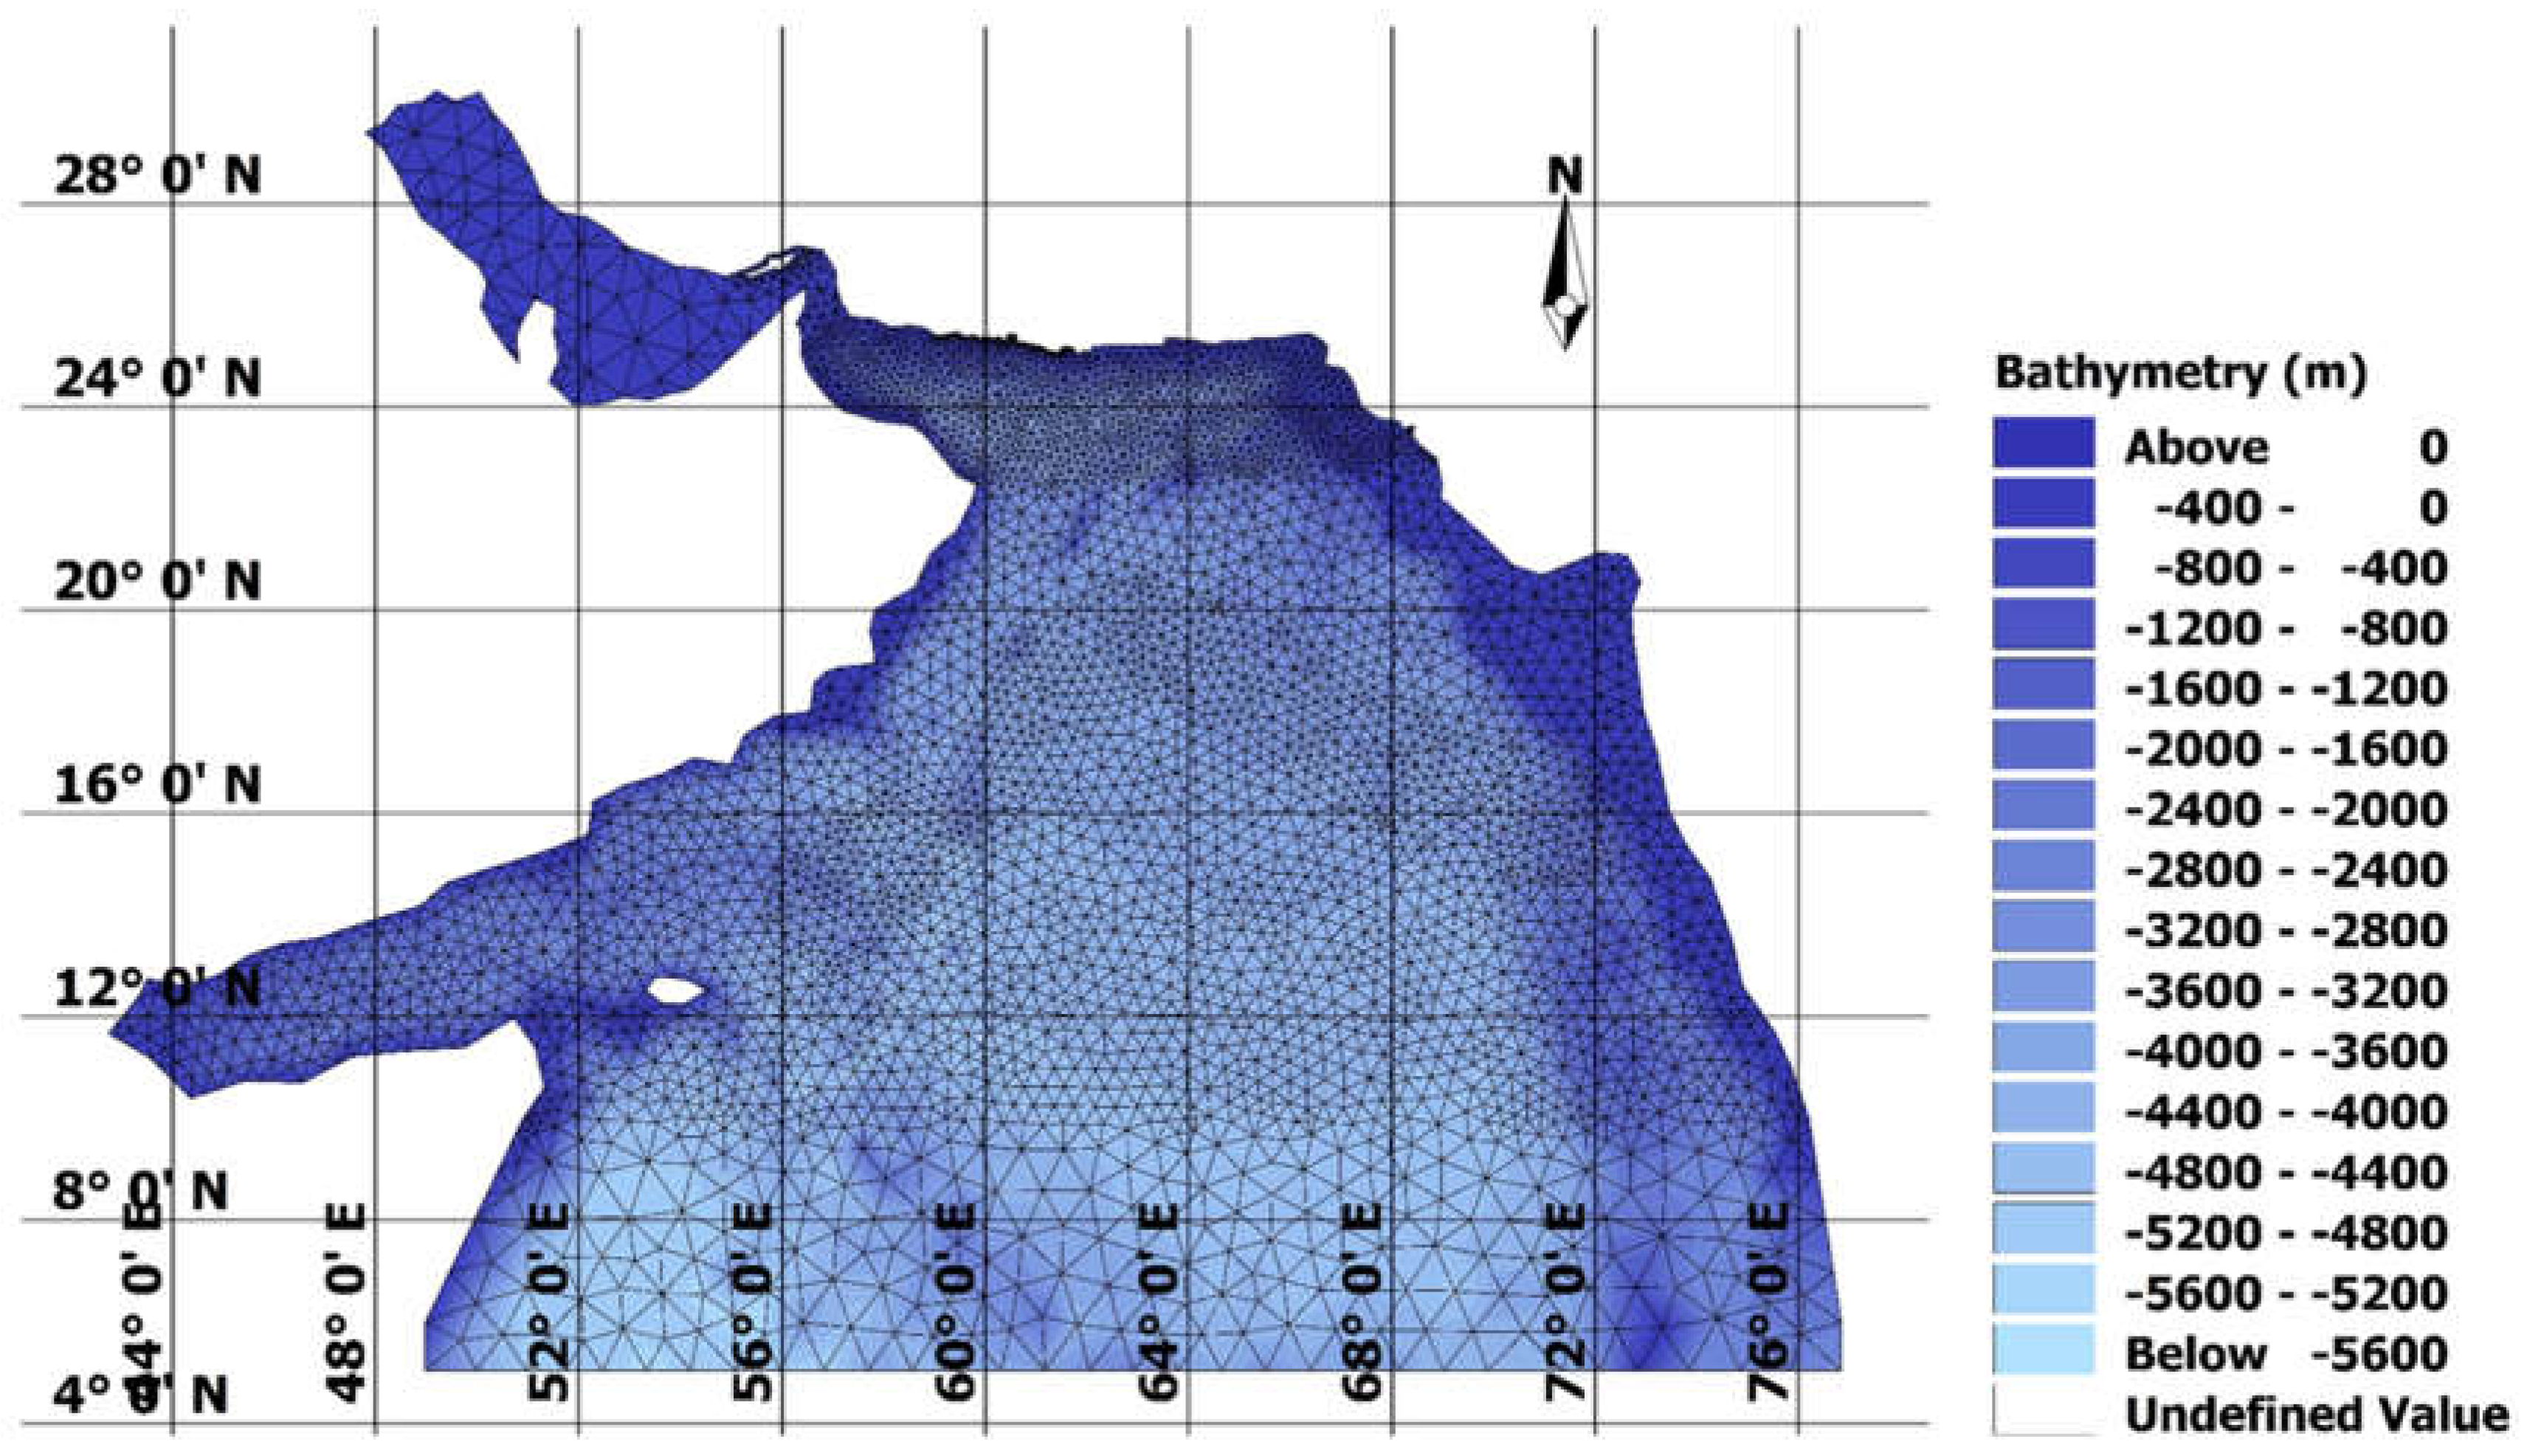
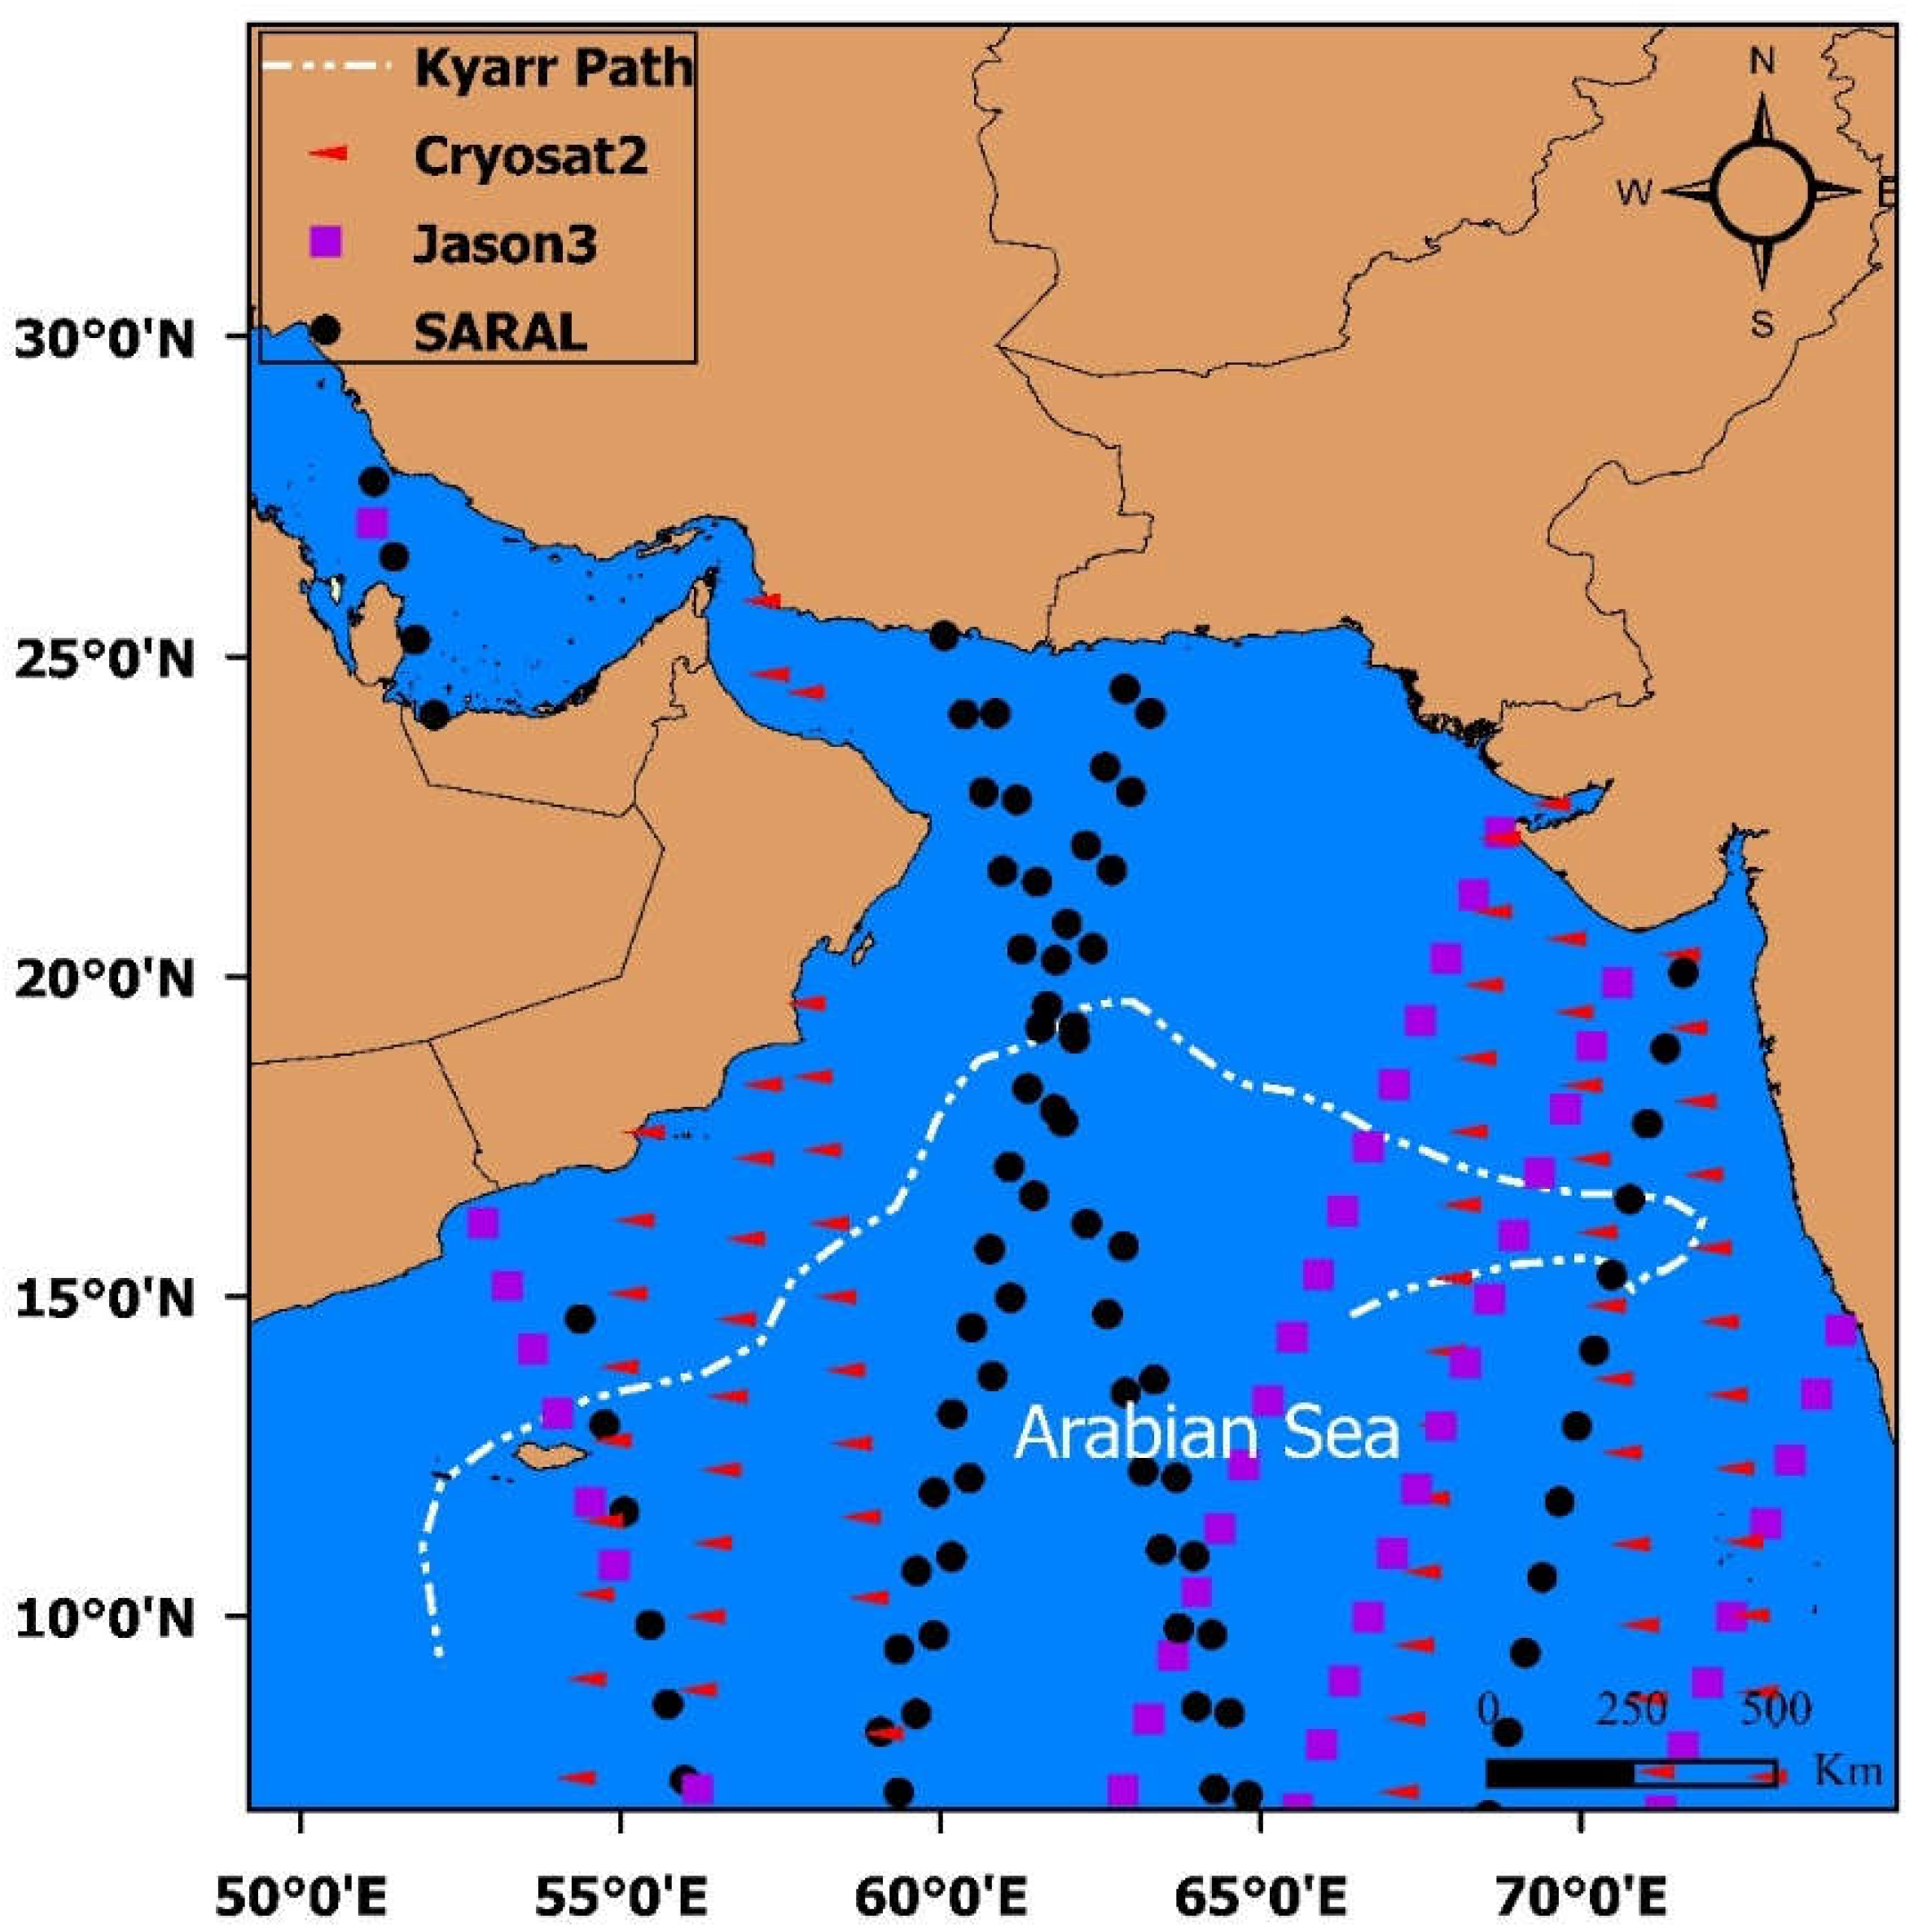
2.1. Study Area/Meteorological Conditions
2.2. General Aspects (Numerical Model)
2.2.1. The Governing Equation of MIKE21 SW
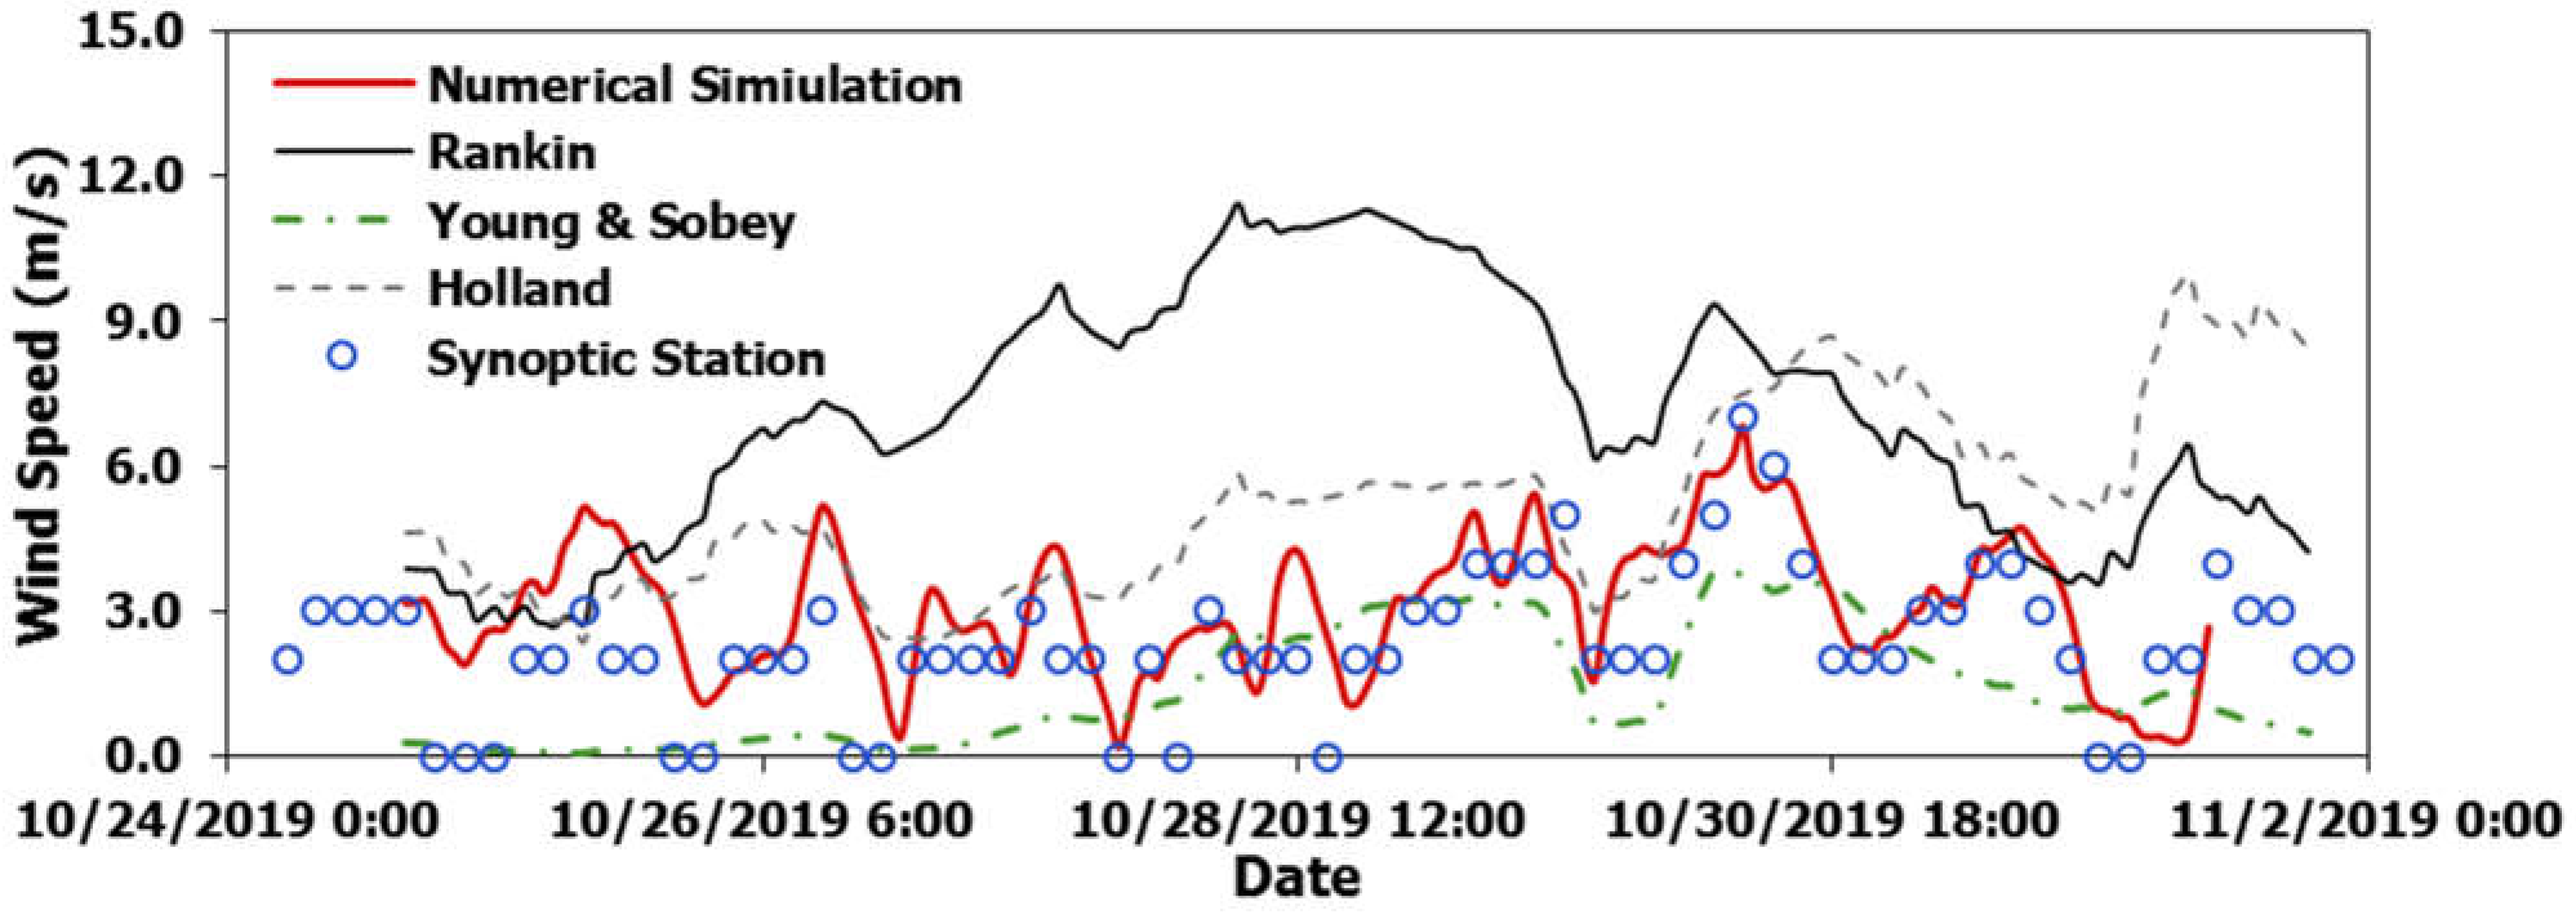
2.2.2. Input Wind Data
2.2.3. Boundary Condition
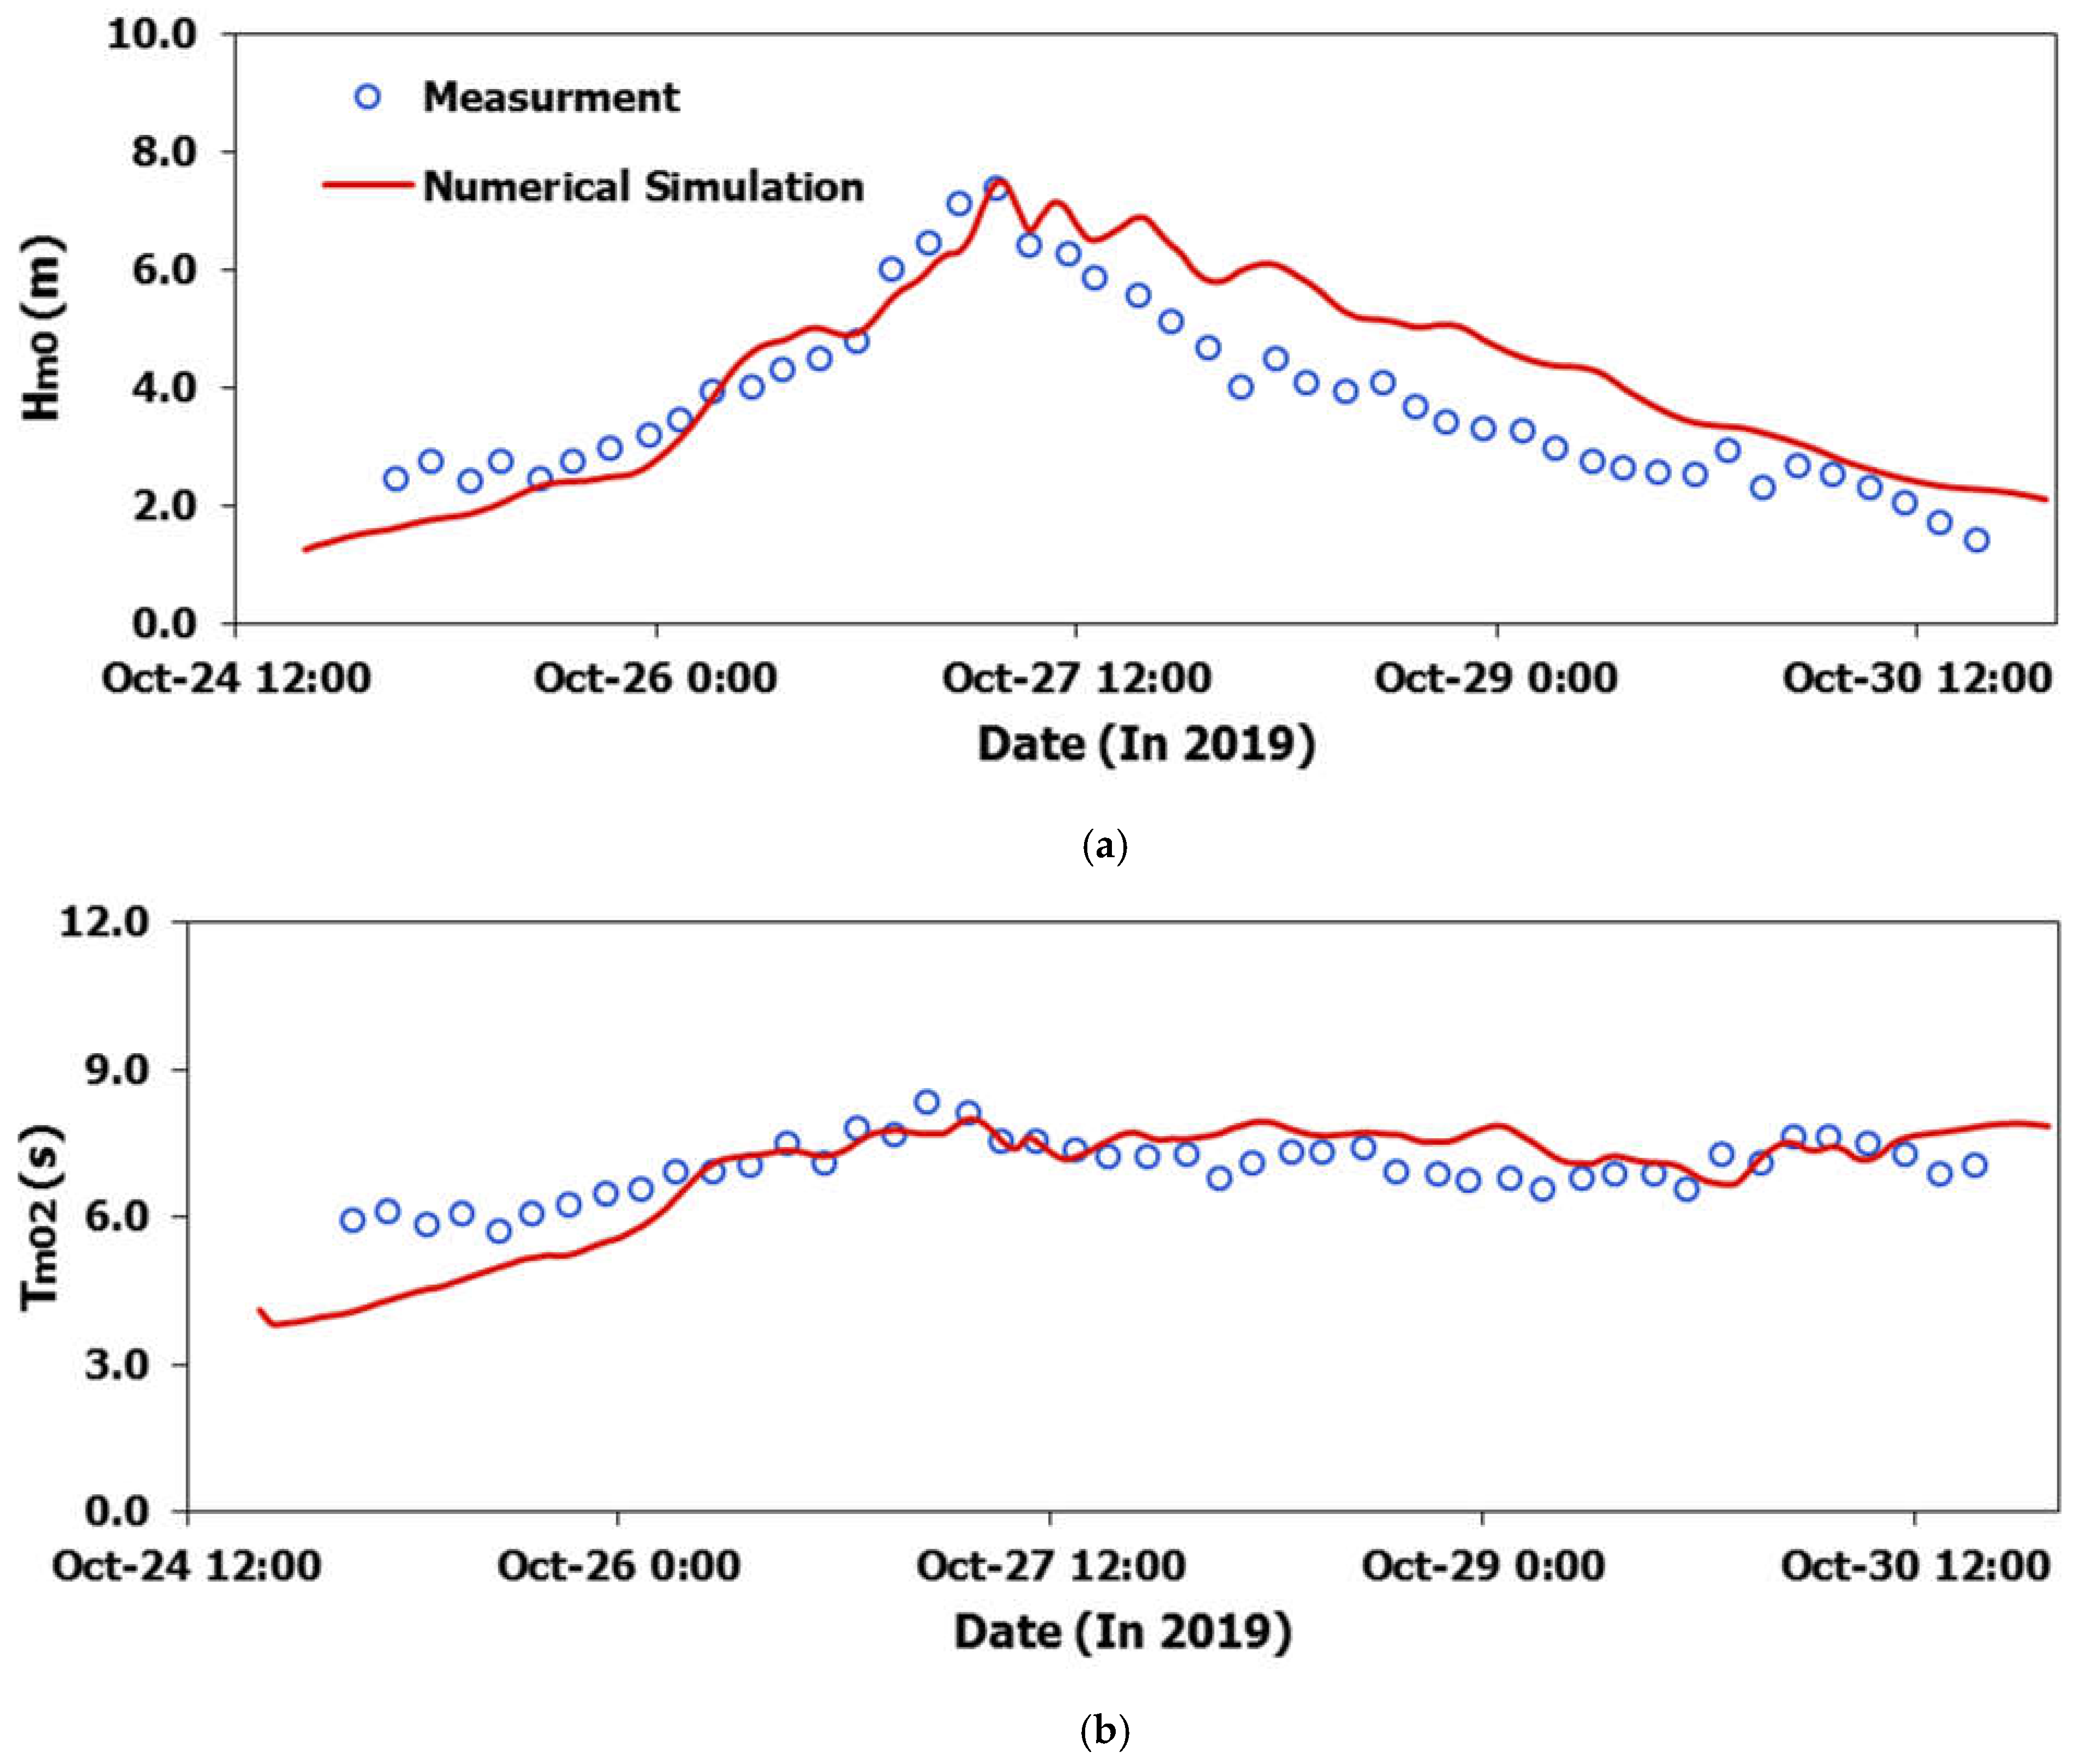
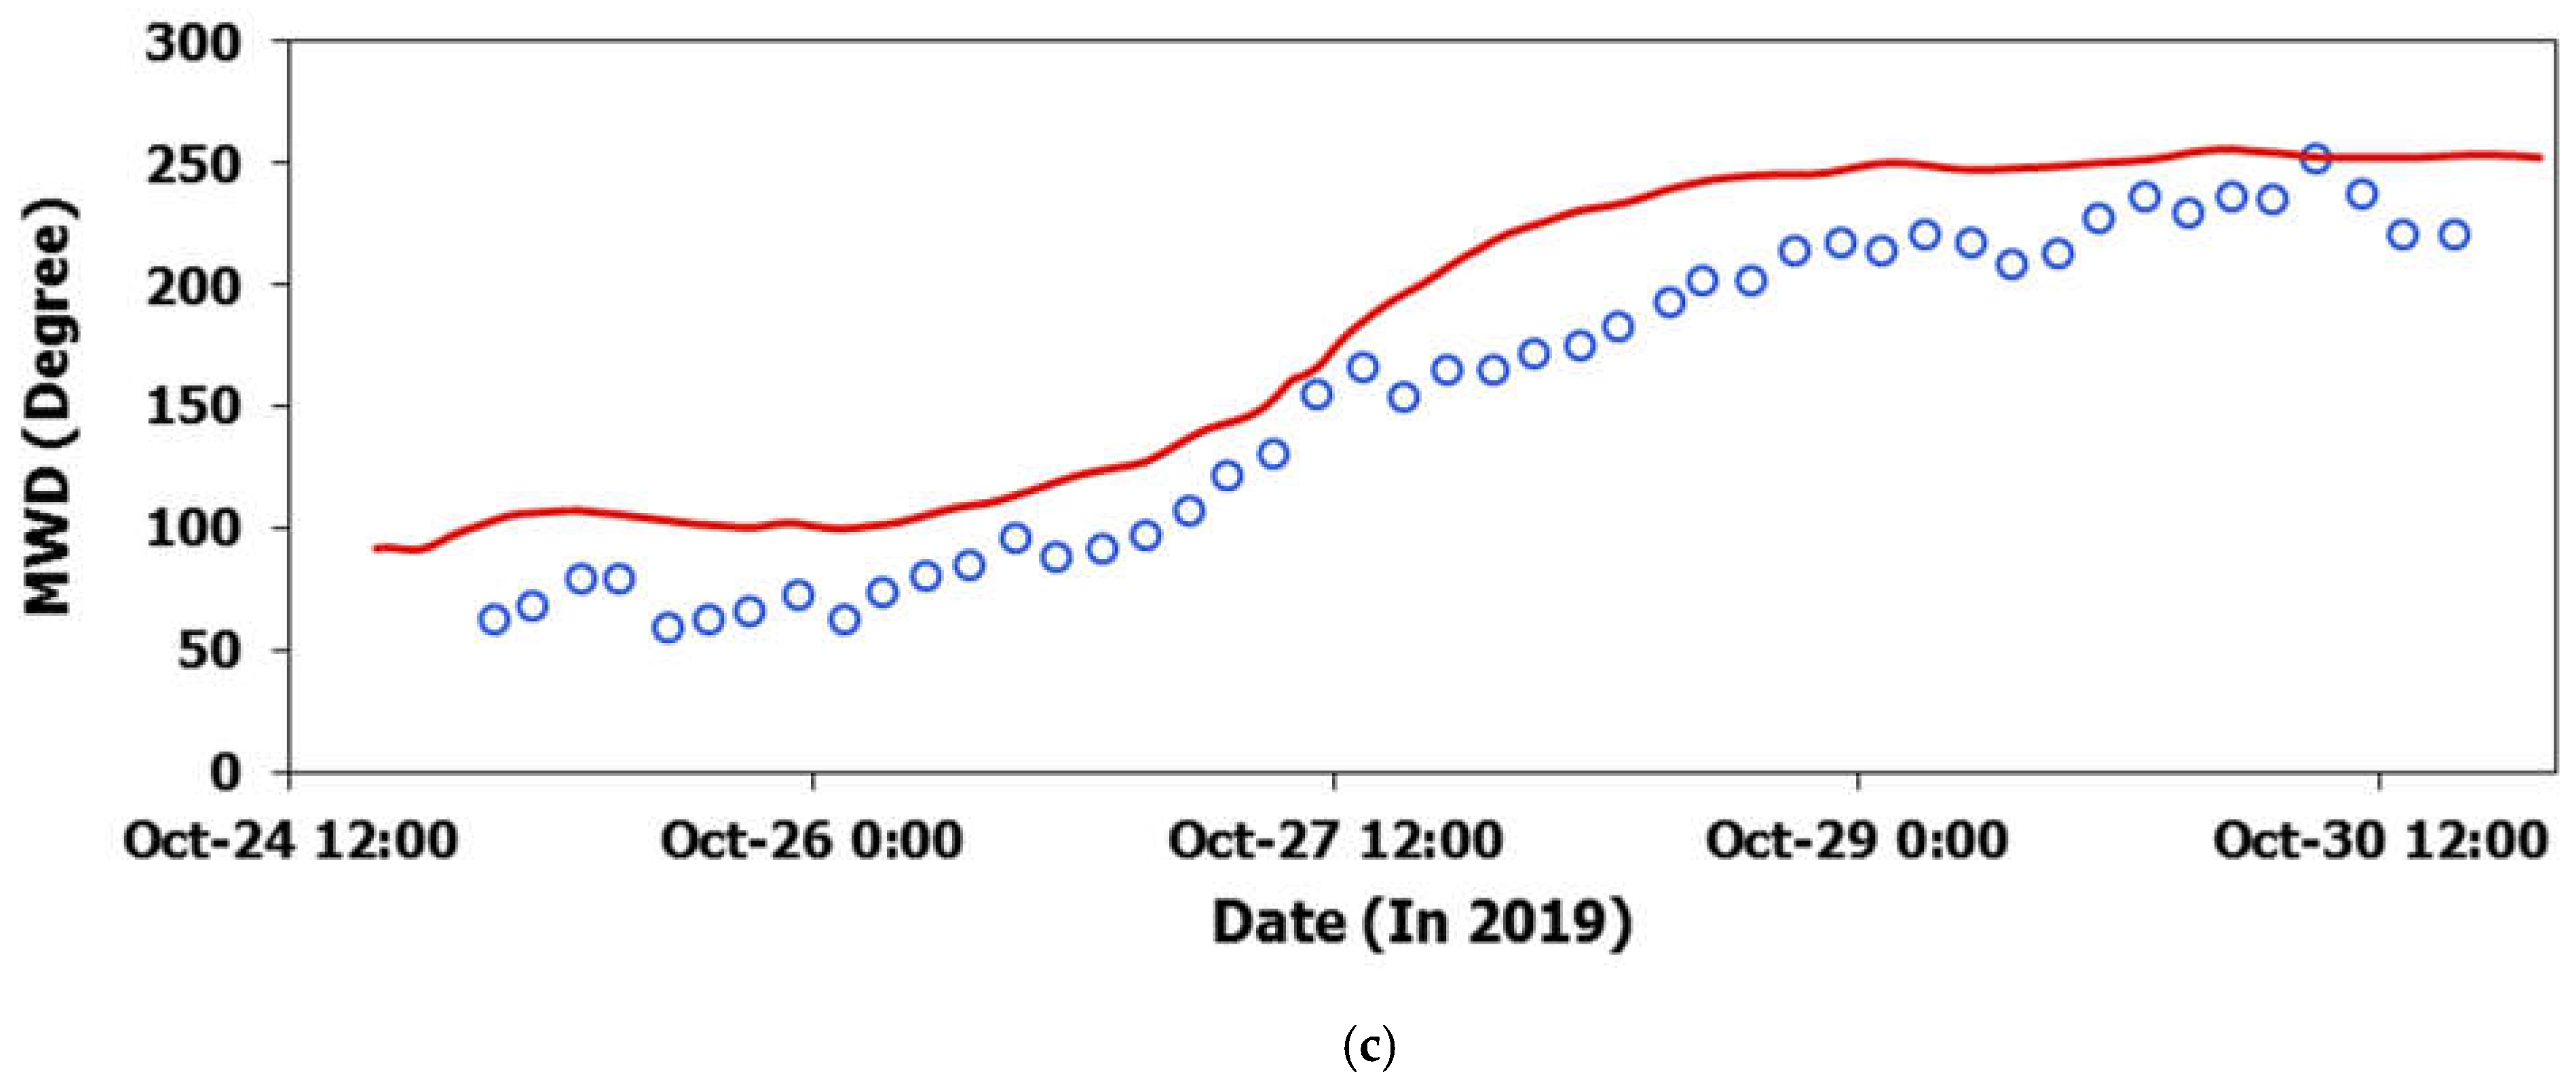
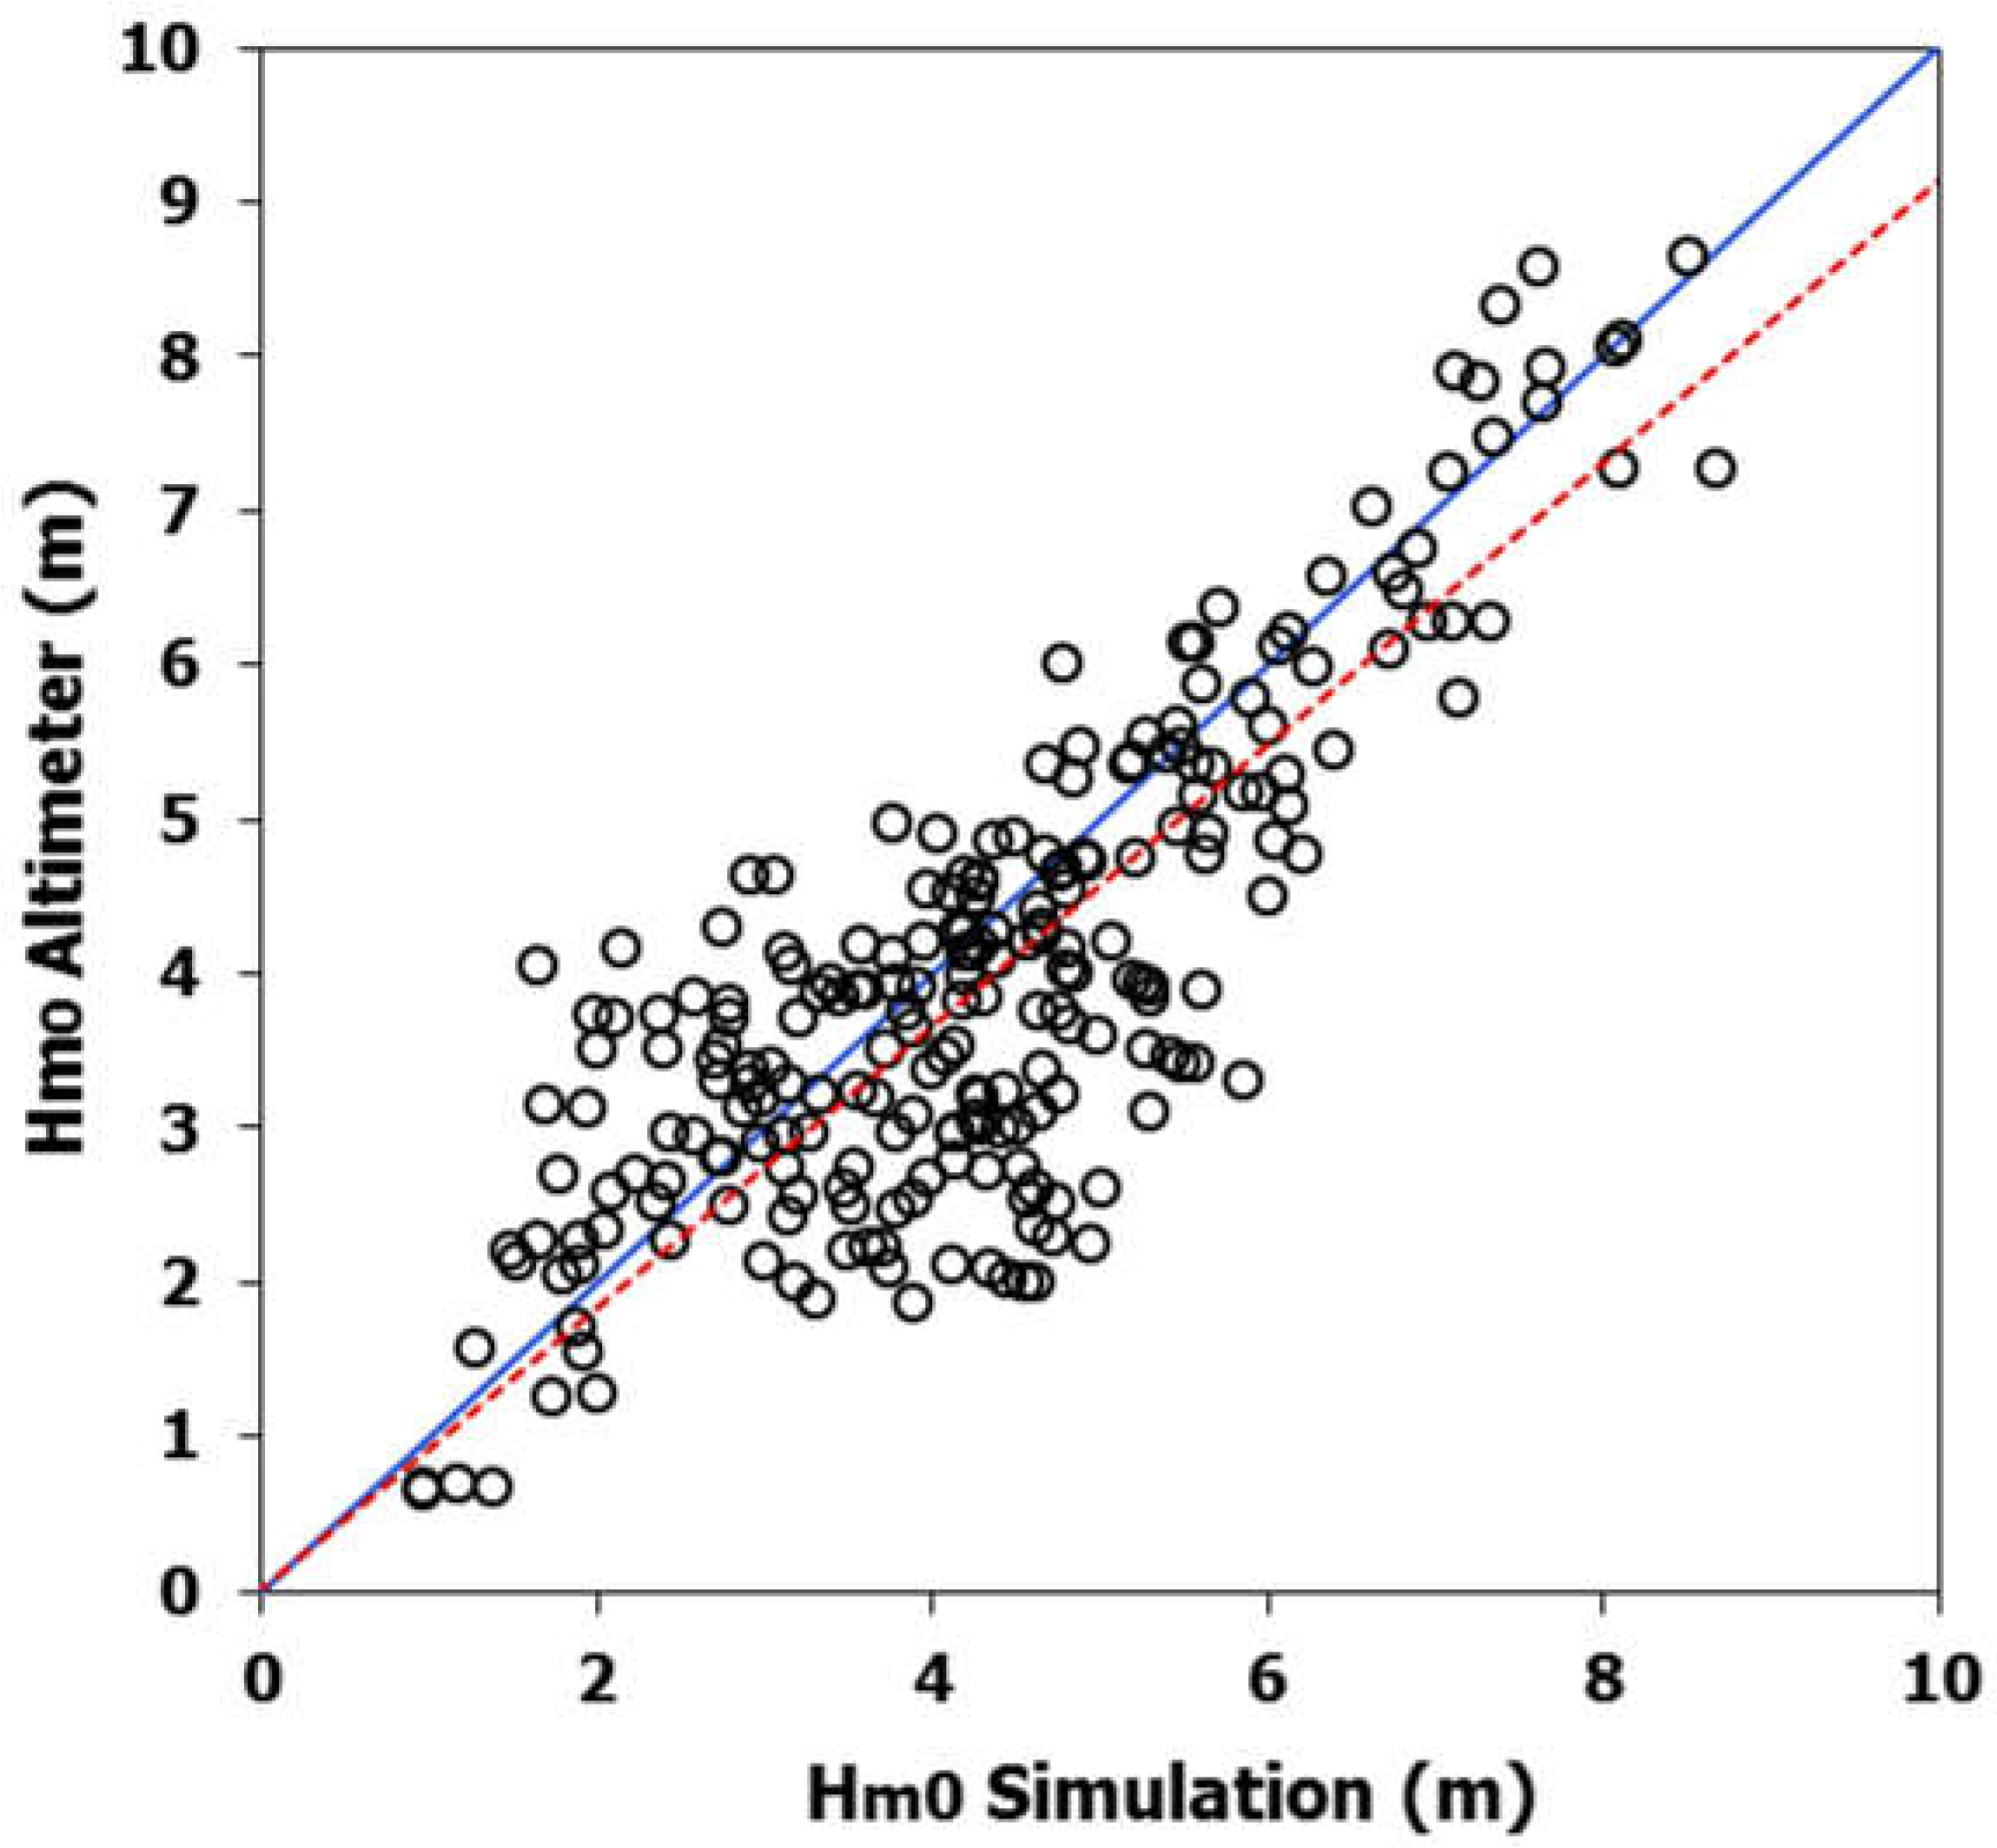
2.3. Model Calibration and Validation
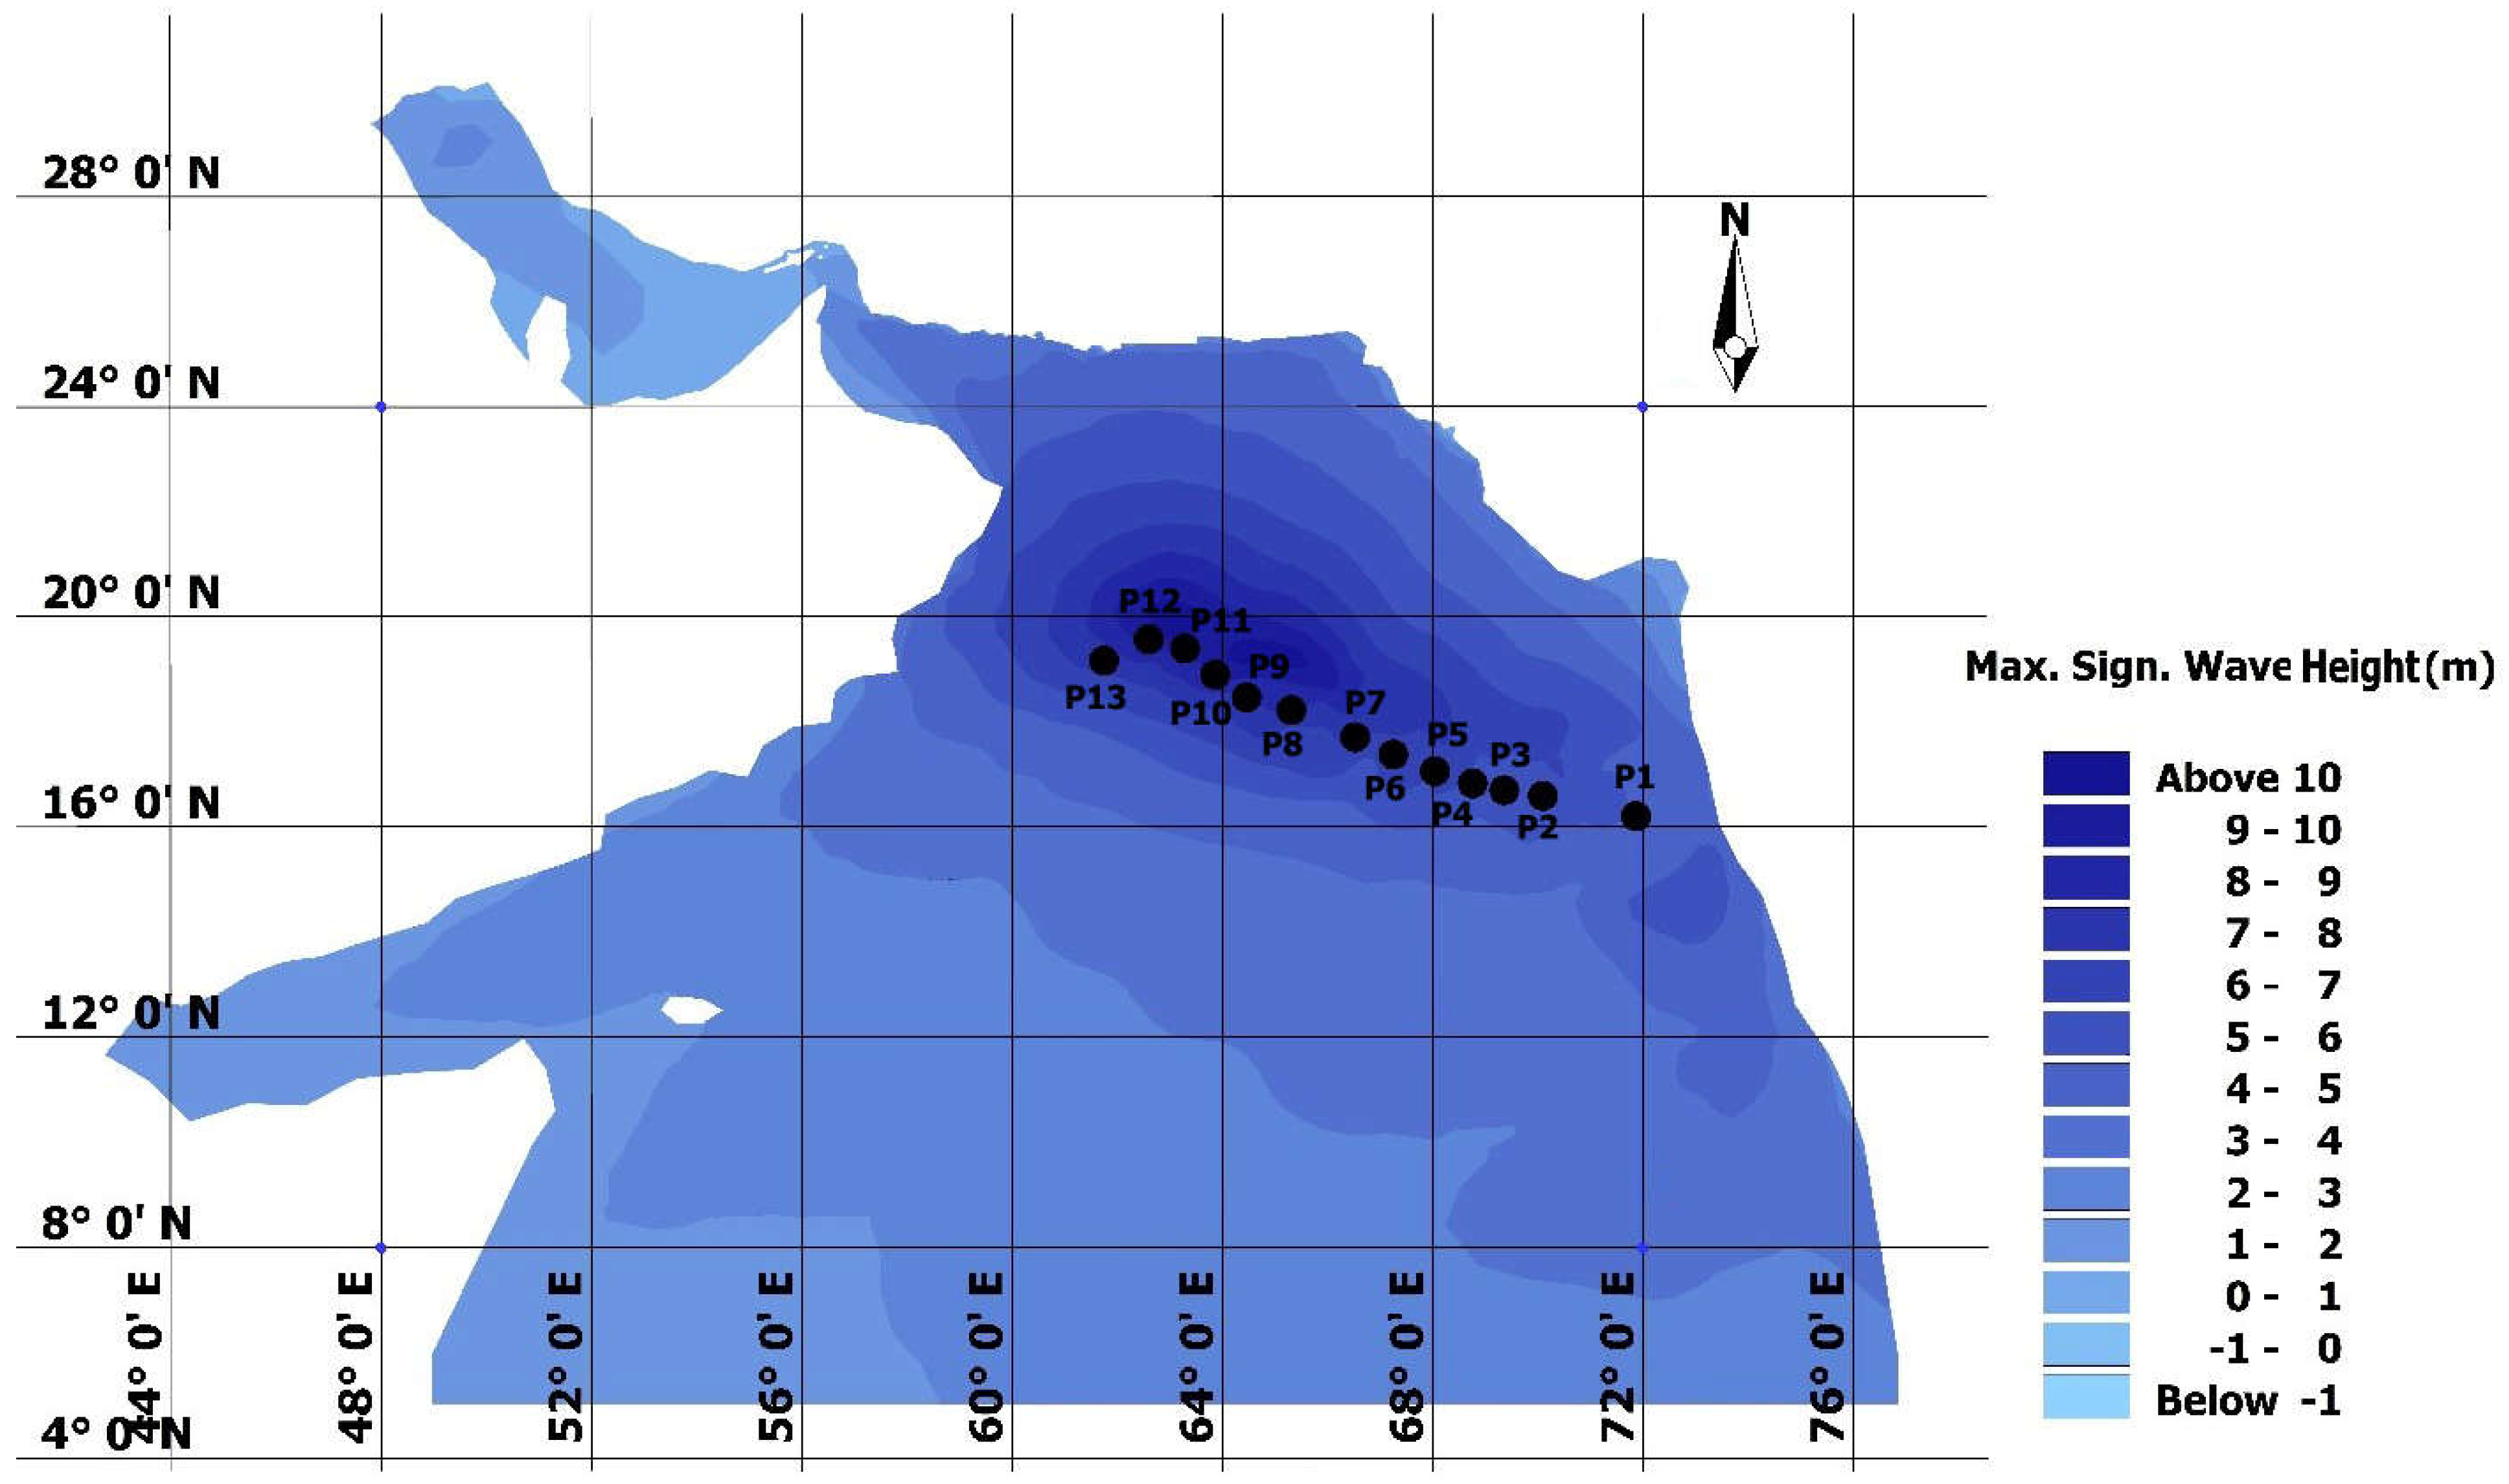
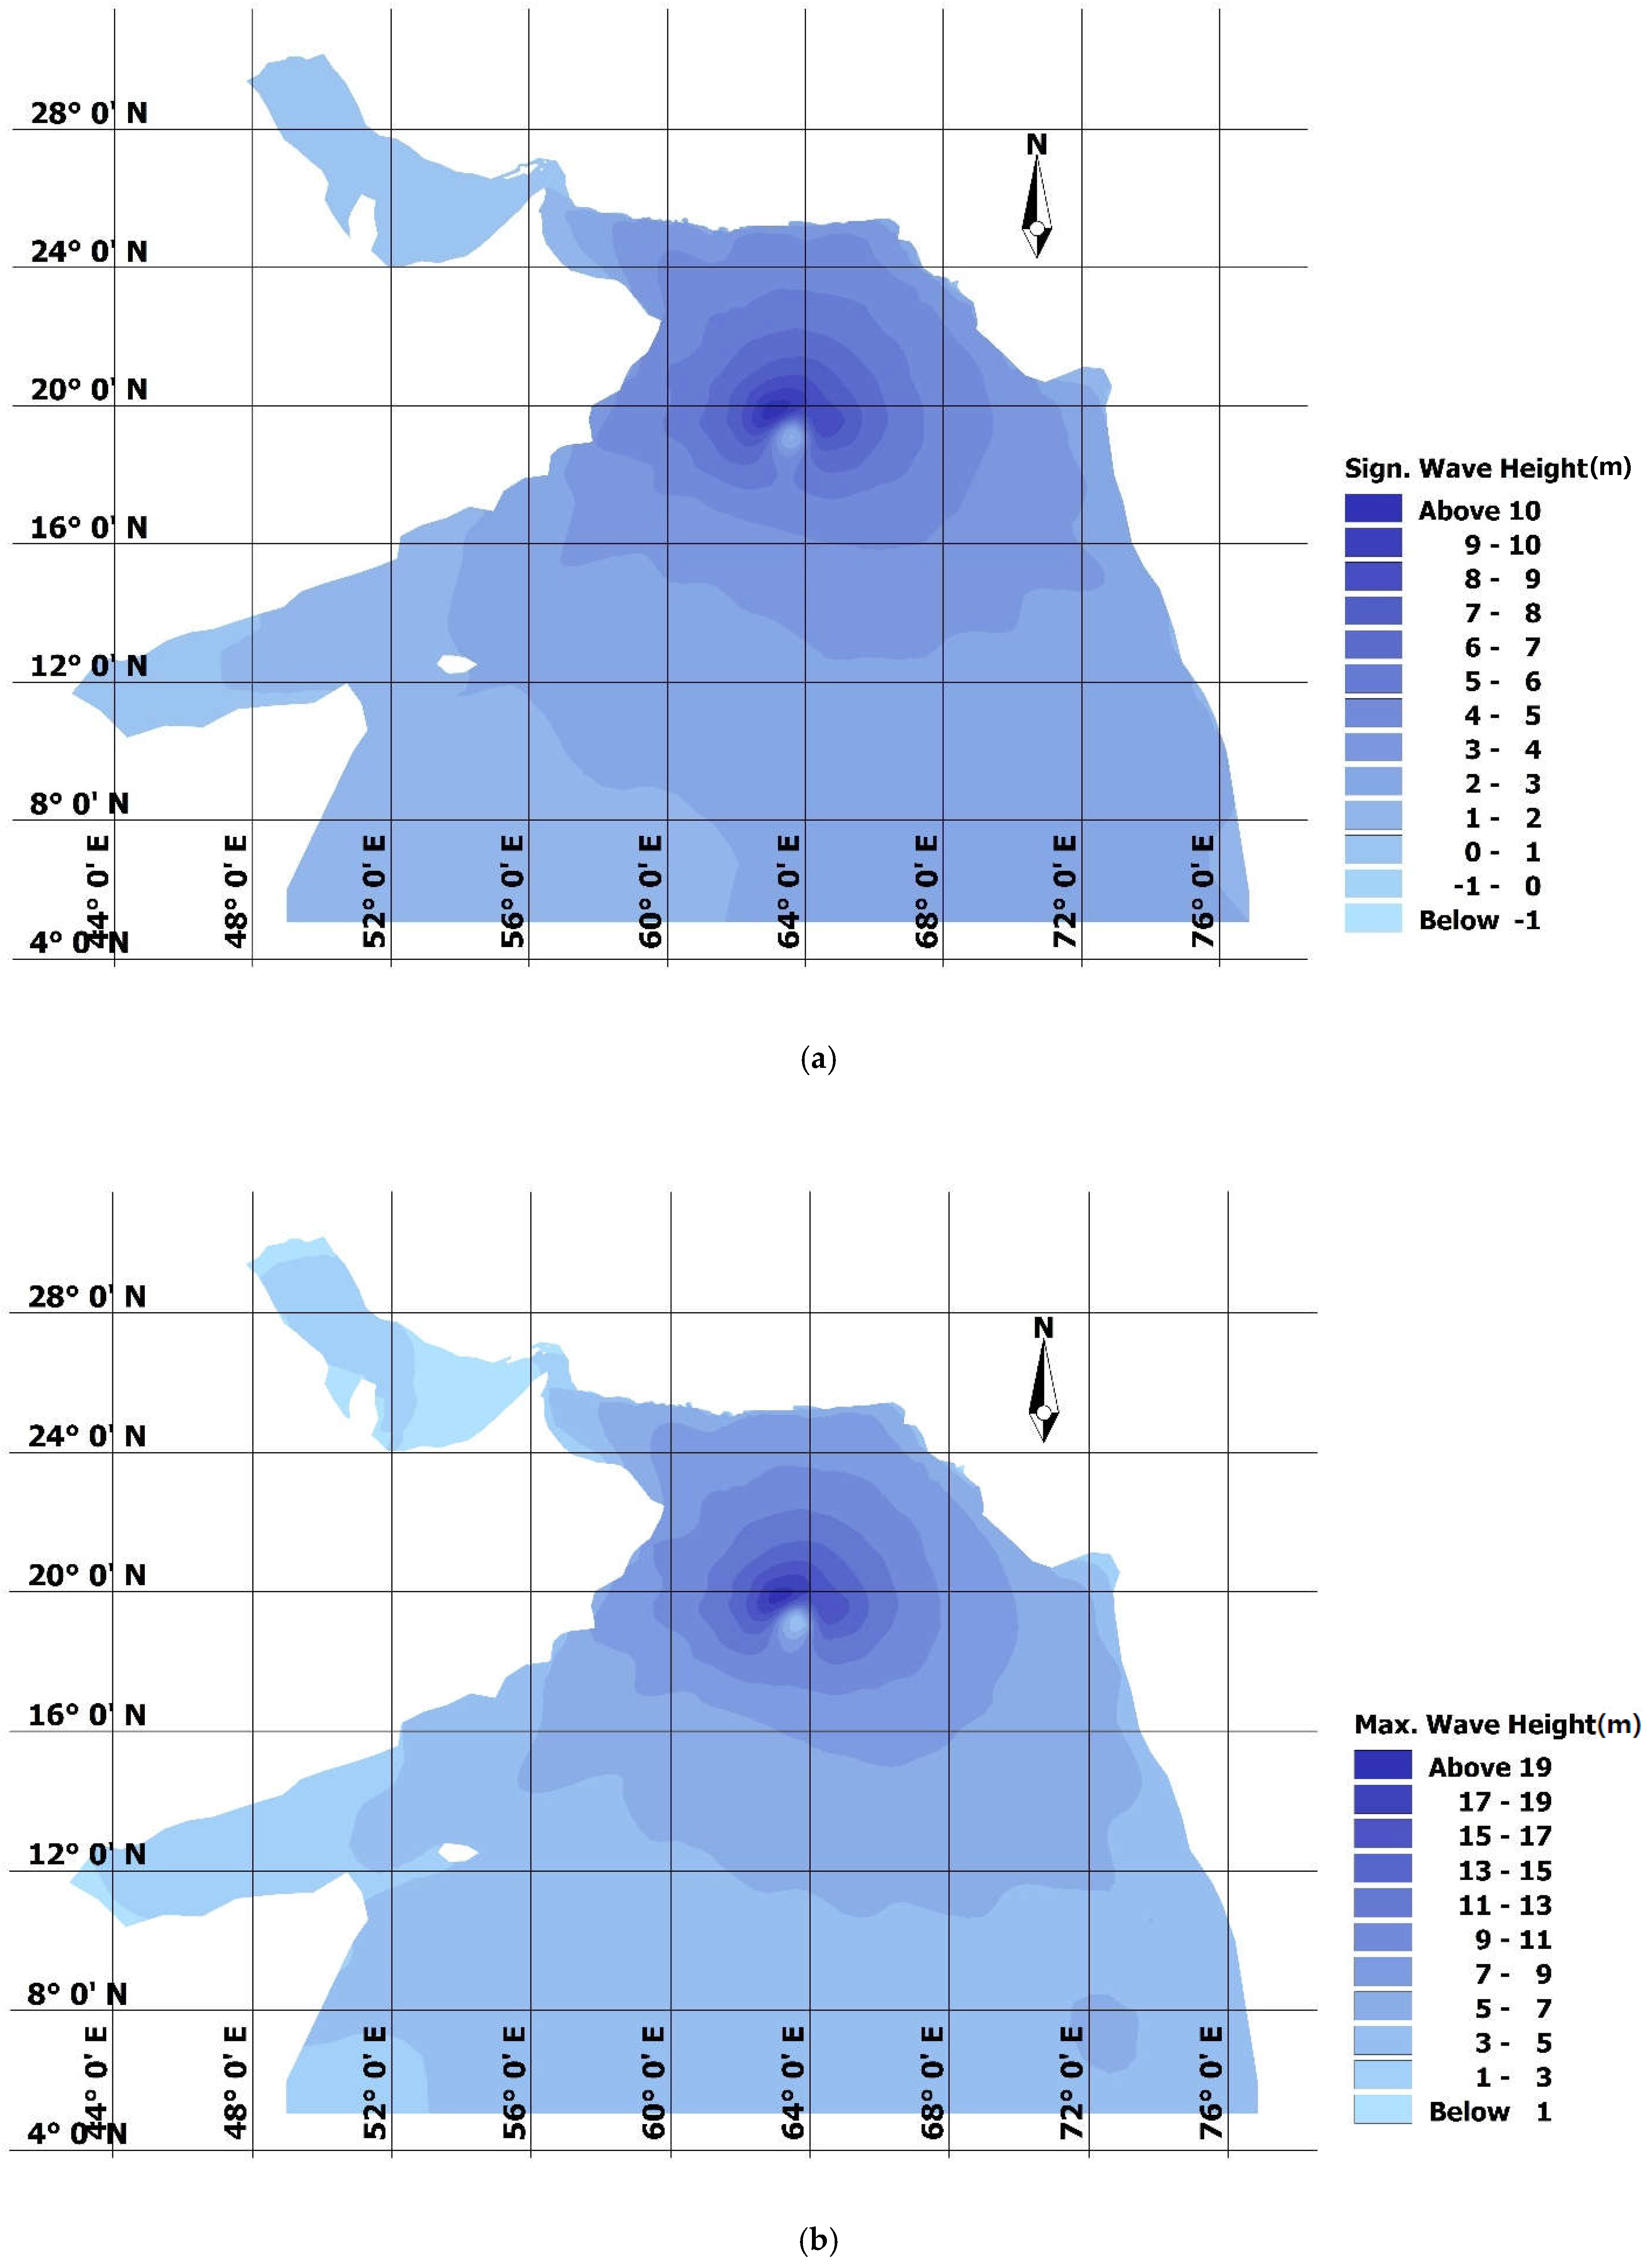
3. Results and Discussion
4. Conclusions
Author Contributions
Funding
Institutional Review Board Statement
Informed Consent Statement
Data Availability Statement
Acknowledgments
Conflicts of Interest
References
- Tasnim, K.M.; Shibayama, T.; Esteban, M.; Takagi, H.; Ohira, K.; Nakamura, R. Field Observation and Numerical Simulation of Past and Future Storm Surges in the Bay of Bengal: Case Study of Cyclone Nargis. Nat. Hazards 2015, 75, 1619–1647. [Google Scholar] [CrossRef]
- Yavari, F.; Salehi Neyshabouri, S.A.; Yazdi, J.; Molajou, A.; Brysiewicz, A. A Novel Framework for Urban Flood damage Assessment. Water Resour. Manag 2022, 36, 1991–2011. [Google Scholar] [CrossRef]
- Azizi, H.; Nejatian, N. Evaluation of the climate change impact on the intensity and return period for drought indices of SPI and SPEI (study area: Varamin plain). Water Supply 2022, 22, 4373–4386. [Google Scholar] [CrossRef]
- Ramsay, H.A.; Singh, M.S.; Chavas, D.R. Response of Tropical Cyclone Formation and Intensification Rates to Climate Warming in Idealized Simulations. J. Adv. Modeling Earth Syst. 2020, 12. [Google Scholar] [CrossRef]
- Booth, J.F.; Narinesingh, V.; Towey, K.L.; Jeyaratnam, J. Storm Surge, Blocking, and Cyclones: A Compound Hazards Analysis for the Northeast United States. J. Appl. Meteorol. Climatol. 2021, 60, 1531–1544. [Google Scholar] [CrossRef]
- Costanza, R.; Anderson, S.J.; Sutton, P.; Mulder, K.; Mulder, O.; Kubiszewski, I.; Wang, X.; Liu, X.; Pérez-Maqueo, O.; Luisa Martinez, M.; et al. The Global Value of Coastal Wetlands for Storm Protection. Glob. Environ. Chang. 2021, 70, 102328. [Google Scholar] [CrossRef]
- Banan-Dallalian, M.; Shokatian-Beiragh, M.; Golshani, A.; Mojtahedi, A.; Lotfollahi-Yaghin, M.A. Study of the Effect of Gonu Tropical Cyclone on the Oman Coastlines Inland Flooding (Case Study: The Coastline of Sur). In Proceedings of the 2nd International Conference on Oceanography for West Asia (RCOWA 2020), Tehran, Iran, 16–17 September 2020. [Google Scholar]
- Mojtahedi, A.; Beiragh, M.S.; Farajpour, I.; Mohammadian, M. Investigation on Hydrodynamic Performance of an Environmentally Friendly Pile Breakwater. Ocean Eng. 2020, 217, 107942. [Google Scholar] [CrossRef]
- Hereher, M.; Al-Awadhi, T.; Al-Hatrushi, S.; Charabi, Y.; Mansour, S.; Al-Nasiri, N.; Sherief, Y.; El-Kenawy, A. Assessment of the Coastal Vulnerability to Sea Level Rise: Sultanate of Oman. Environ. Earth Sci. 2020, 79, 369. [Google Scholar] [CrossRef]
- Ibrahim, O.R.; Al Maghawry, S. Review on Cyclone Shaheen in the Sultanate of Oman. Arab. J. Geosci. 2022, 15, 833. [Google Scholar] [CrossRef]
- Fritz, H.M.; Blount, C.D.; Albusaidi, F.B.; Al-Harthy, A.H.M. Cyclone Gonu Storm Surge in Oman. Estuar. Coast. Shelf Sci. 2010, 86, 102–106. [Google Scholar] [CrossRef]
- Krishna, K.M.; Rao, S.R. Study of the Intensity of Super Cyclonic Storm GONU Using Satellite Observations. Int. J. Appl. Earth Obs. Geoinf. 2009, 11, 108–113. [Google Scholar] [CrossRef]
- Wang, Z.; DiMarco, S.F.; Stössel, M.M.; Zhang, X.; Howard, M.K.; du Vall, K. Oscillation Responses to Tropical Cyclone Gonu in Northern Arabian Sea from a Moored Observing System. Deep-Sea Res. Part I Oceanogr. Res. Pap. 2012, 64, 129–145. [Google Scholar] [CrossRef]
- Soltanpour, M.; Ranji, Z.; Shibayama, T.; Ghader, S. Tropical Cyclones in the Arabian Sea: Overview and Simulation of Winds and Storm-Induced Waves. Nat. Hazards 2021, 108, 711–732. [Google Scholar] [CrossRef]
- Nair, M.A.; Amrutha, M.M.; Kumar, V.S. Spectral Wave Characteristics in the Coastal Waters of the Central West Coast of India during Tropical Cyclone Kyarr. Ocean. Dyn. 2022, 72, 151–168. [Google Scholar] [CrossRef]
- Dibajnia, M.; Soltanpour, M.; Nairn, R.; Allahyar, M. Cyclone Gonu: The Most Intense Tropical Cyclone on Record in the Arabian Sea. In Indian Ocean Tropical Cyclones and Climate Change; Springer: Dordrecht, Netherlands, 2010; pp. 149–157. ISBN 9789048131082. [Google Scholar]
- Sarker, M.A. Cyclone Hazards in the Arabian Sea–A Numerical Modelling Case Study of Cyclone Nilofar. Water Environ. J. 2017, 31, 284–295. [Google Scholar] [CrossRef]
- Bakhtiari, A.; Allahyar, M.R.; Jedari Attari, M.; Haghshenas, S.A.; Bagheri, M. Modeling of Last Recent Tropical Storms in the Arabian Sea. J. Coast. Mar. Eng. 2018, 1, 58–66. [Google Scholar]
- Golshani, A.; Taebi, S. Numerical Modeling and Warning Procedure for Gonu Super Cyclone along Iranian Coastlines. In Proceedings of the Solutions to Coastal Disasters Congress 2008, Oahu, HI, USA, 13–16 April 2008; Volume 312, pp. 268–275. [Google Scholar]
- Jayakrishnan, P.R.; Babu, C.A. Study of the Oceanic Heat Budget Components over the Arabian Sea during the Formation and Evolution of Super Cyclone, Gonu. Atmos. Clim. Sci. 2013, 3, 282–290. [Google Scholar] [CrossRef]
- Ghader, S.; Yazgi, D.; Haghshenas, S.A.; Arab, A.R.; Attari, M.J.; Bakhtiari, A.; Zinsazboroujerdi, H. Hindcasting Tropical Storm Events in the Oman Sea. J. Coast. Res. 2016, 1, 1087–1091. [Google Scholar] [CrossRef]
- Allahdadi, M.N.; Chaichitehrani, N.; Allahyar, M.; McGee, L. Wave Spectral Patterns during a Historical Cyclone: A Numerical Model for Cyclone Gonu in the Northern Oman Sea. Open J. Fluid Dyn. 2017, 7, 131–151. [Google Scholar] [CrossRef]
- Allahdadi, M.N.; Chaichitehrani, N.; Jose, F.; Nasrollahi, A.; Afshar, A.; Allahyar, M. Cyclone-Generated Storm Surge in the Northern Gulf of Oman: A Field Data Analysis during Cyclone Gonu. Am. J. Fluid Dyn. 2018, 8, 10–18. [Google Scholar]
- Sarker, M.A. Numerical Modelling of Waves and Surge from Cyclone Mekunu (May 2018) in the Arabian Sea. J. Atmos. Sci. Res. 2020, 2, 12–20. [Google Scholar] [CrossRef]
- Banan-Dallalian, M.; Shokatian-Beiragh, M.; Golshani, A.; Mojtahedi, A.; Lotfollahi-Yaghin, M.A.; Akib, S. Study of the Effect of an Environmentally Friendly Flood Risk Reduction Approach on the Oman Coastlines during the Gonu Tropical Cyclone (Case Study: The Coastline of Sur). Eng 2021, 2, 141–155. [Google Scholar] [CrossRef]
- Vieira, F.; Cavalcante, G.; Campos, E. Simulation of Cyclonic Wave Conditions in the Gulf of Oman. Nat. Hazards 2021, 105, 2203–2217. [Google Scholar] [CrossRef]
- Li, J.; Pan, S.; Chen, Y.; Pan, Y. Assessment of Tropical Cyclones in Ecmwf Reanalysis Data over Northwest Pacific Ocean. In Proceedings of the 27th International Ocean and Polar Engineering Conference, San Francisco, CA, USA, 25–30 June 2017. [Google Scholar]
- Yu, Y.C.; Chen, H.; Shih, H.J.; Chang, C.H.; Hsiao, S.C.; Chen, W.B.; Chen, Y.M.; Su, W.R.; Lin, L.Y. Assessing the Potential Highest Storm Tide Hazard in Taiwan Based on 40-Year Historical Typhoon Surge Hindcasting. Atmosphere 2019, 10, 346. [Google Scholar] [CrossRef]
- Li, J.; Pan, S.; Chen, Y.; Fan, Y.M.; Pan, Y. Numerical Estimation of Extreme Waves and Surges over the Northwest Pacific Ocean. Ocean Eng. 2018, 153, 225–241. [Google Scholar] [CrossRef]
- Hodges, K.; Cobb, A.; Vidale, P.L. How Well Are Tropical Cyclones Represented in Reanalysis Datasets? J. Clim. 2017, 30, 5243–5264. [Google Scholar] [CrossRef]
- Pan, Y.; Chen, Y.-p.; Li, J.-x.; Ding, X.-l. Improvement of Wind Field Hindcasts for Tropical Cyclones. Water Sci. Eng. 2016, 9, 58–66. [Google Scholar] [CrossRef]
- Malakar, P.; Kesarkar, A.P.; Bhate, J.N.; Singh, V.; Deshamukhya, A. Comparison of Reanalysis Data Sets to Comprehend the Evolution of Tropical Cyclones Over North Indian Ocean. Earth Space Sci. 2020, 7, e2019EA000978. [Google Scholar] [CrossRef]
- Chaichitehrani, N.; Allahdadi, M.N. Overview of Wind Climatology for the Gulf of Oman and the Northern Arabian Sea. Am. J. Fluid Dyn. 2018, 8, 1–9. [Google Scholar] [CrossRef]
- Siahsarani, A.; Karami Khaniki, A.; Aliakbari Bidokhti, A.A.; Azadi, M. Sensitivity Analysis of the Numerical Aspect of the SWAN for the Tropical Cyclone Wave Simulations in the Gulf of Oman. Arab. J. Geosci. 2020, 13, 692. [Google Scholar] [CrossRef]
- Sahoo, B.; Bhaskaran, P.K. A Comprehensive Data Set for Tropical Cyclone Storm Surge-Induced Inundation for the East Coast of India. Int. J. Climatol. 2018, 38, 403–419. [Google Scholar] [CrossRef]
- Komen, G.J.; Cavaleri, L.; Donelan, M.; Hasselmann, K.; Hasselmann, S.; Janssen, P.A.E.M. Dynamics and Modelling of Ocean Waves; Cambridge University Press: Cambridge, UK, 1994. [Google Scholar]
- Young, I.R. Seasonal Variability of the Global Ocean Wind and Wave Climate. Int. J. Climatol. 1999, 19, 931–950. [Google Scholar] [CrossRef]
- DHI Company. Dhi MIKE 21-Spectral Wave Module-Scientific Document; DHI Water & Environment: Hørsholm, Denmark, 2007; Volume 42. [Google Scholar]
- Weisberg, R.H.; Zheng, L. Hurricane Storm Surge Simulations for Tampa Bay. Estuaries Coasts 2006, 29, 899–913. [Google Scholar] [CrossRef]
- Rego, J.L.; Li, C. On the Importance of the Forward Speed of Hurricanes in Storm Surge Forecasting: A Numerical Study. Geophys. Res. Lett. 2009, 36. [Google Scholar] [CrossRef]
- Kennedy, A.B.; Westerink, J.J.; Smith, J.M.; Hope, M.E.; Hartman, M.; Taflanidis, A.A.; Tanaka, S.; Westerink, H.; Cheung, K.F.; Smith, T.; et al. Tropical Cyclone Inundation Potential on the Hawaiian Islands of Oahu and Kauai. Ocean Model. 2012, 52–53, 54–68. [Google Scholar] [CrossRef]
- Sochala, P.; Chen, C.; Dawson, C.; Iskandarani, M. A Polynomial Chaos Framework for Probabilistic Predictions of Storm Surge Events. Comput. Geosci. 2020, 24, 109–128. [Google Scholar] [CrossRef]
- Chao, W.T.; Young, C.C.; Hsu, T.W.; Liu, W.C.; Liu, C.Y. Long-Lead-Time Prediction of Storm Surge Using Artificial Neural Networks and Effective Typhoon Parameters: Revisit and Deeper Insight. Water 2020, 12, 2394. [Google Scholar] [CrossRef]
- Phadke, A.C.; Martino, C.D.; Cheung, K.F.; Houston, S.H. Modeling of Tropical Cyclone Winds and Waves for Emergency Management. Ocean Eng. 2003, 30, 553–578. [Google Scholar] [CrossRef]
- Kazeminezhad, M.H.; Etemad-Shahidi, A.; Mousavi, S.J. Evaluation of Neuro Fuzzy and Numerical Wave Prediction Models in Lake Ontario. J. Coast. Res. 2007, SI 50, 317–321. [Google Scholar]
- van der Westhuysen, A.J.; Zijlema, M.; Battjes, J.A. Nonlinear Saturation-Based Whitecapping Dissipation in SWAN for Deep and Shallow Water. Coast. Eng. 2007, 54, 151–170. [Google Scholar] [CrossRef]
- Ribal, A.; Young, I.R. 33 Years of Globally Calibrated Wave Height and Wind Speed Data Based on Altimeter Observations. Sci. Data 2019, 6, 77. [Google Scholar] [CrossRef]
- Allahdadi, M.N.; He, R.; Ahn, S.; Chartrand, C.; Neary, V.S. Development and Calibration of a High-Resolution Model for the Gulf of Mexico, Puerto Rico, and the U.S. Virgin Islands: Implication for Wave Energy Resource Characterization. Ocean Eng. 2021, 235, 109304. [Google Scholar] [CrossRef]
- Allahdadi, M.N.; Gunawan, B.; Lai, J.; He, R.; Neary, V.S. Development and Validation of a Regional-Scale High-Resolution Unstructured Model for Wave Energy Resource Characterization along the US East Coast. Renew. Energy 2019, 136, 500–511. [Google Scholar] [CrossRef]
- Nabi Allahdadi, M.; He, R.; Neary, V.S. Predicting Ocean Waves along the US East Coast during Energetic Winter Storms: Sensitivity to Whitecapping Parameterizations. Ocean Sci. 2019, 15, 691–715. [Google Scholar] [CrossRef]
- WAMDI Group The WAM Model—A Third Generation Ocean Wave Pre-Diction Model. J. Phys. Oceanogr. 1988, 18, 1775–1810. [CrossRef]
- Wang, S.; Lin, N.; Gori, A. Investigation of Tropical Cyclone Wind Models With Application to Storm Tide Simulations. J. Geophys. Res. Atmos. 2022, 127, e2021JD036359. [Google Scholar] [CrossRef]


| Date | Time | Lat. | Lon. | Wind Speed (m/s) | Category | |
|---|---|---|---|---|---|---|
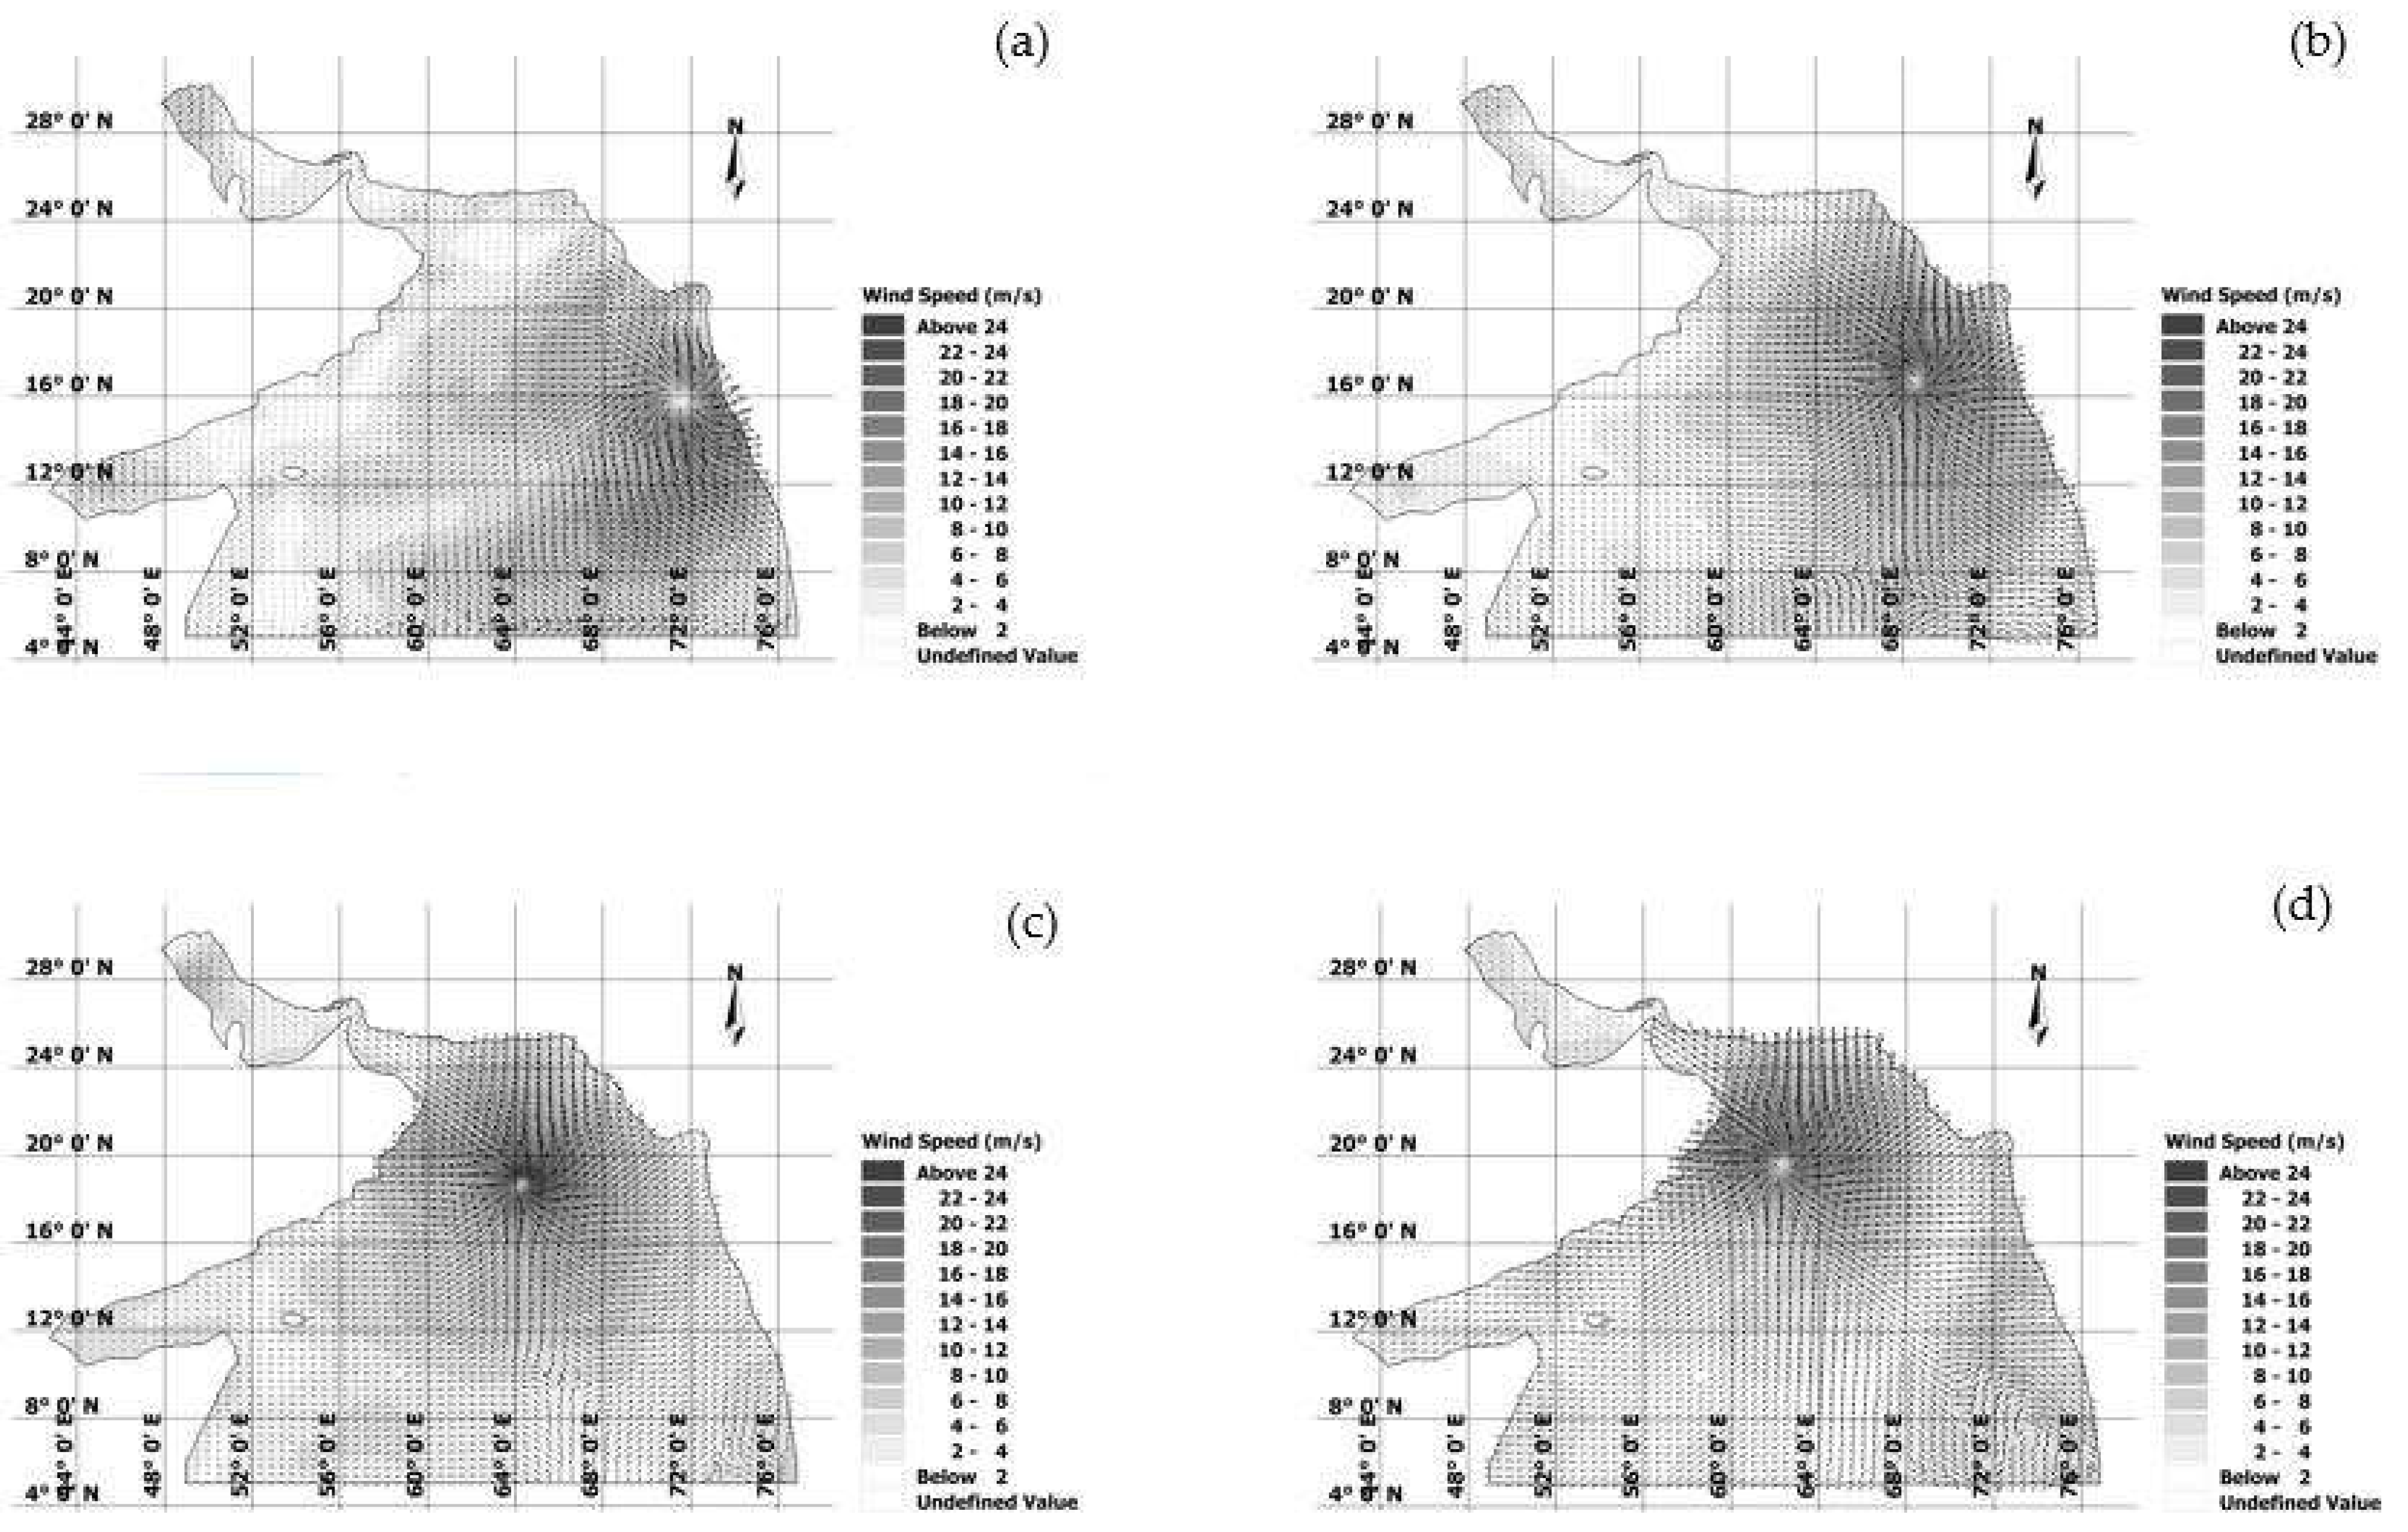
| Formation (a) | 24 October | 18:30 GMT | 15.8 | 71.3 | 17.88 | - |
| Reclassified as a Category 4 cyclone (b) | 26 October | 18:30 GMT | 16.8 | 68.9 | 58 | 4 |
| Highest wind speed (1 min sustained) (c) | 27 October | 12:00 GMT | 17.5 | 66.8 | 69 | 4 |
| Reclassified as a Category 3 cyclone (d) | 29 October | 12:00 GMT | 19.5 | 63 | 53 | 3 |
Publisher’s Note: MDPI stays neutral with regard to jurisdictional claims in published maps and institutional affiliations. |
© 2022 by the authors. Licensee MDPI, Basel, Switzerland. This article is an open access article distributed under the terms and conditions of the Creative Commons Attribution (CC BY) license (https://creativecommons.org/licenses/by/4.0/).
Share and Cite
Golshani, A.; Banan-Dallalian, M.; Shokatian-Beiragh, M.; Samiee-Zenoozian, M.; Sadeghi-Esfahlani, S. Investigation of Waves Generated by Tropical Cyclone Kyarr in the Arabian Sea: An Application of ERA5 Reanalysis Wind Data. Atmosphere 2022, 13, 1914. https://doi.org/10.3390/atmos13111914
Golshani A, Banan-Dallalian M, Shokatian-Beiragh M, Samiee-Zenoozian M, Sadeghi-Esfahlani S. Investigation of Waves Generated by Tropical Cyclone Kyarr in the Arabian Sea: An Application of ERA5 Reanalysis Wind Data. Atmosphere. 2022; 13(11):1914. https://doi.org/10.3390/atmos13111914
Chicago/Turabian StyleGolshani, Aliasghar, Masoud Banan-Dallalian, Mehrdad Shokatian-Beiragh, Majid Samiee-Zenoozian, and Shahab Sadeghi-Esfahlani. 2022. "Investigation of Waves Generated by Tropical Cyclone Kyarr in the Arabian Sea: An Application of ERA5 Reanalysis Wind Data" Atmosphere 13, no. 11: 1914. https://doi.org/10.3390/atmos13111914
APA StyleGolshani, A., Banan-Dallalian, M., Shokatian-Beiragh, M., Samiee-Zenoozian, M., & Sadeghi-Esfahlani, S. (2022). Investigation of Waves Generated by Tropical Cyclone Kyarr in the Arabian Sea: An Application of ERA5 Reanalysis Wind Data. Atmosphere, 13(11), 1914. https://doi.org/10.3390/atmos13111914