


Consistent Changes in Land-Use/Land-Cover in Semi-Arid Areas: Implications on Ecosystem Service Delivery and Adaptation in the Limpopo Basin, Botswana


Abstract
1. Introduction
2. Materials and Methods
2.1. Study Area
2.2. Data Sources
2.3. Image Pre-Processing
2.4. Image Processing
2.4.1. Supervised Image Classification
2.4.2. Accuracy Assessment
2.4.3. Error Matrix
2.5. Household Survey
2.6. Data Analysis
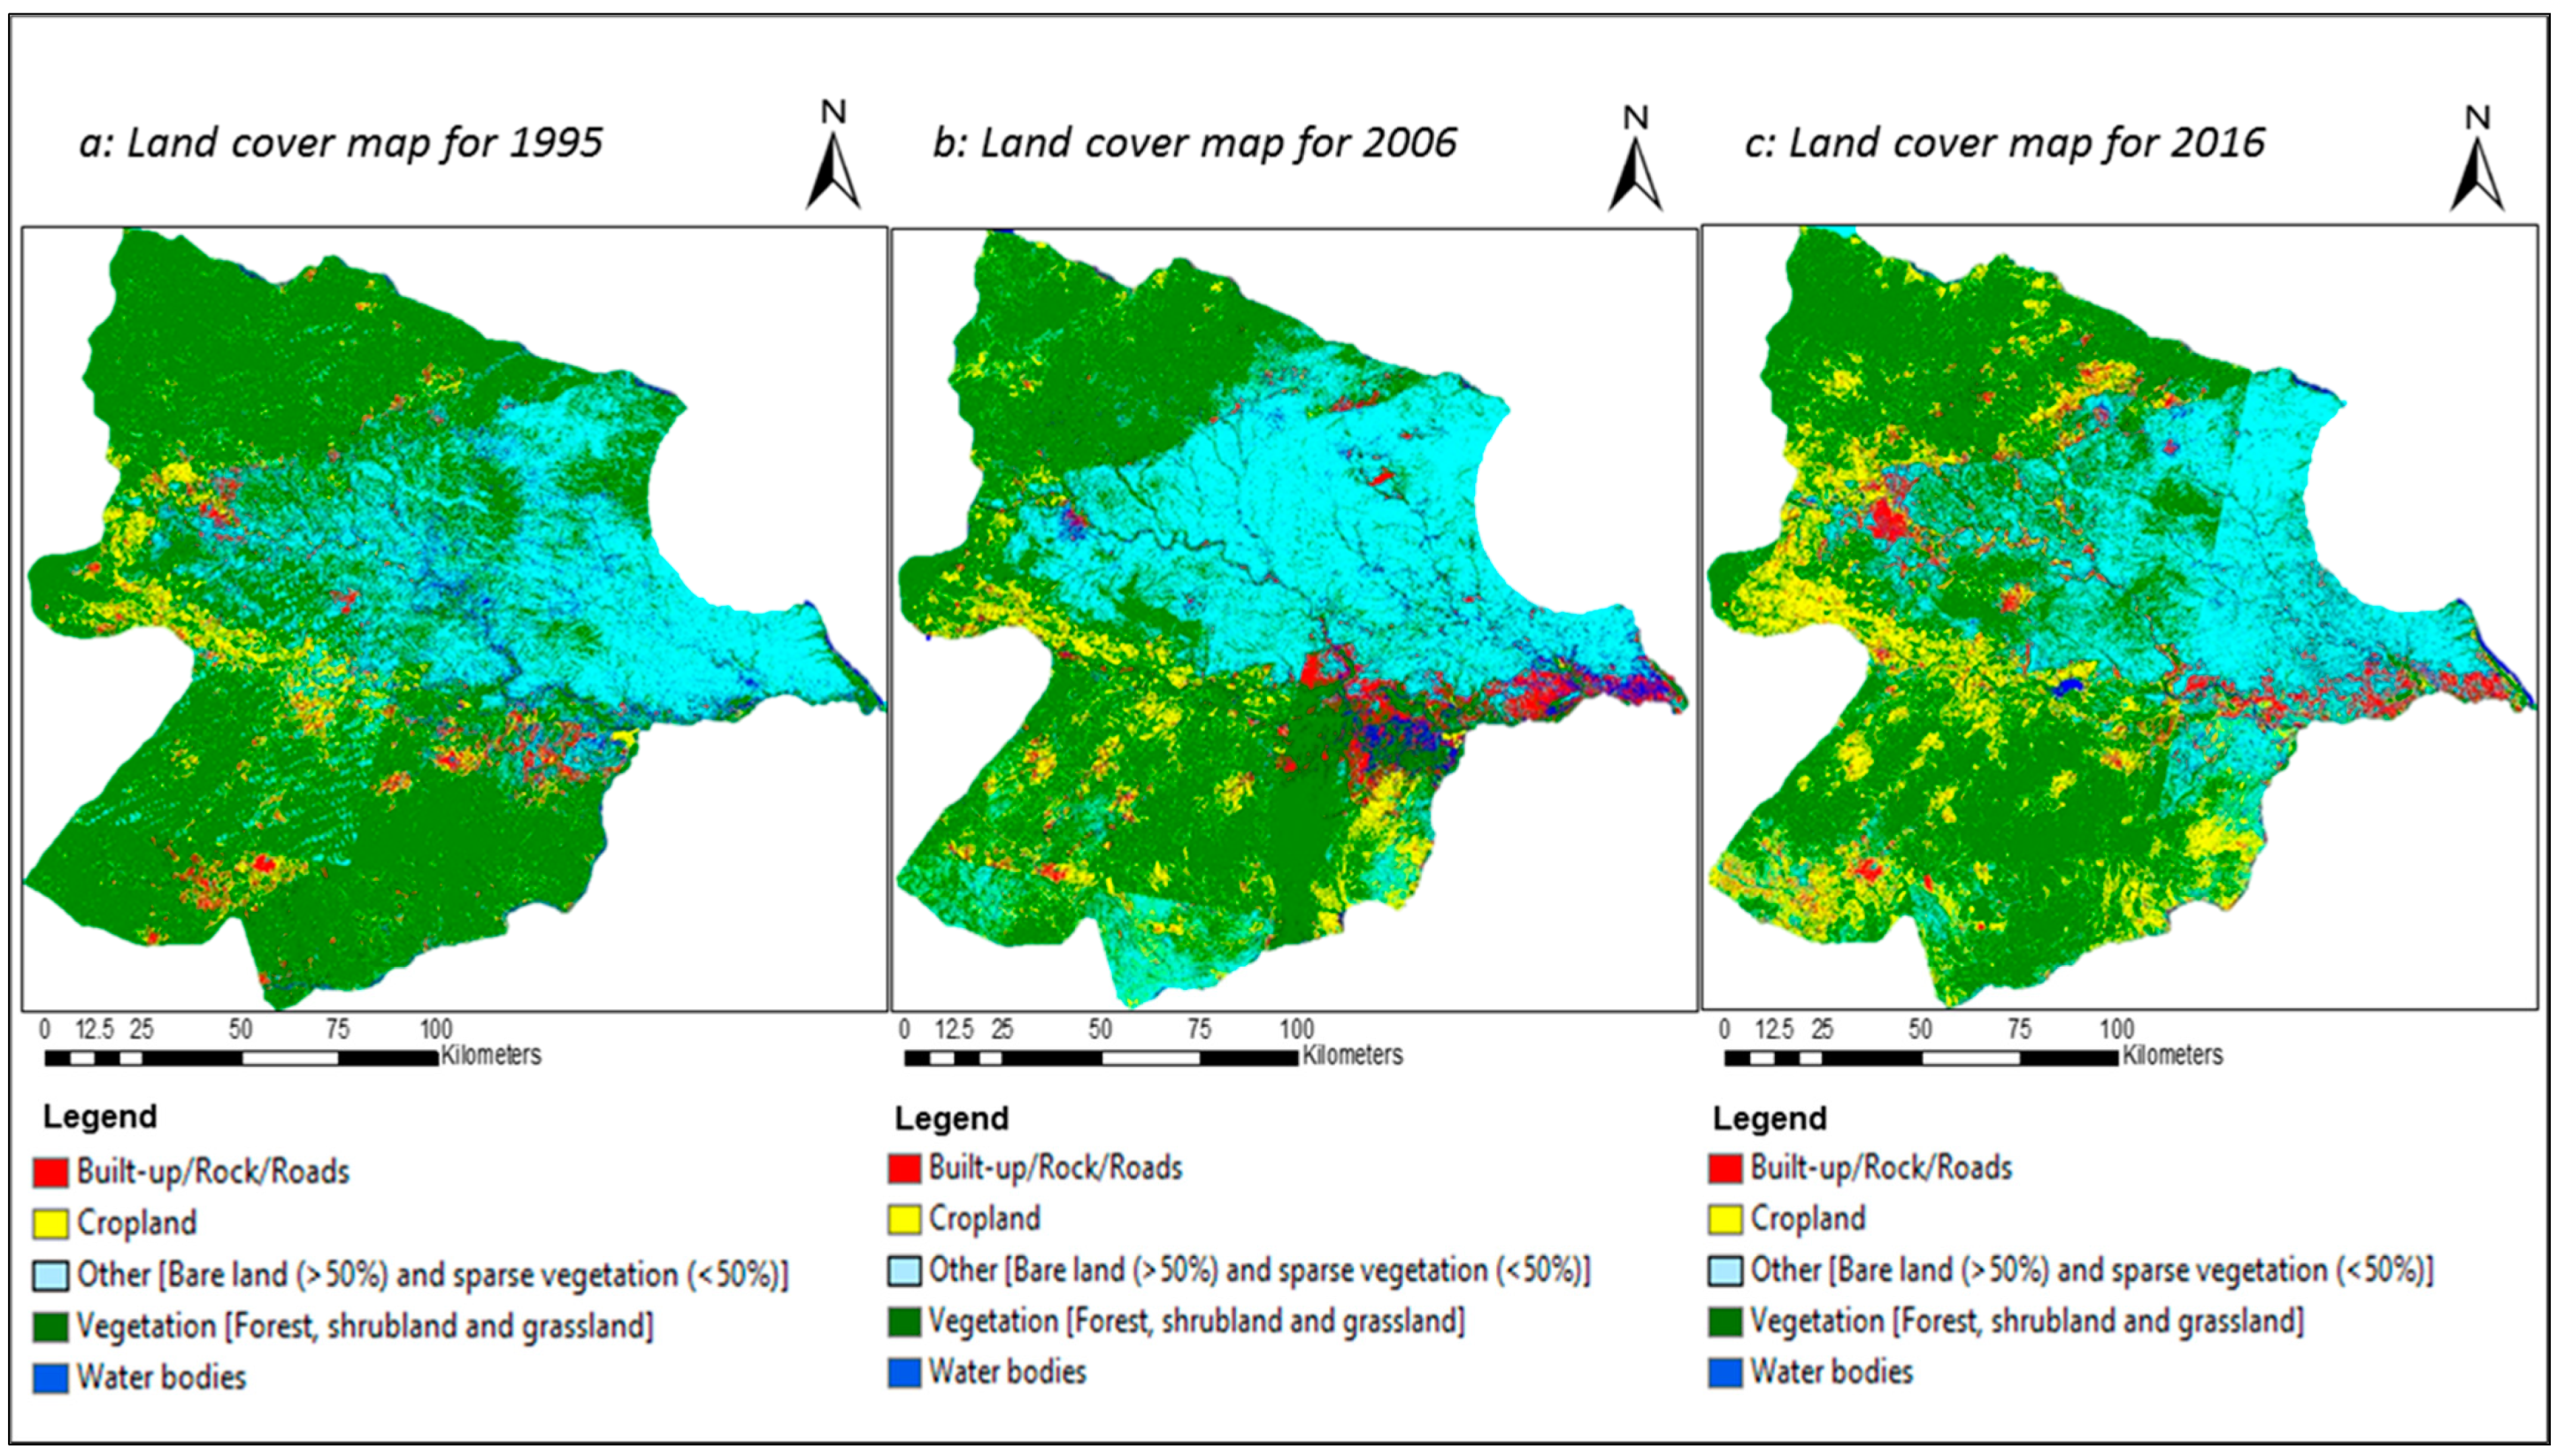
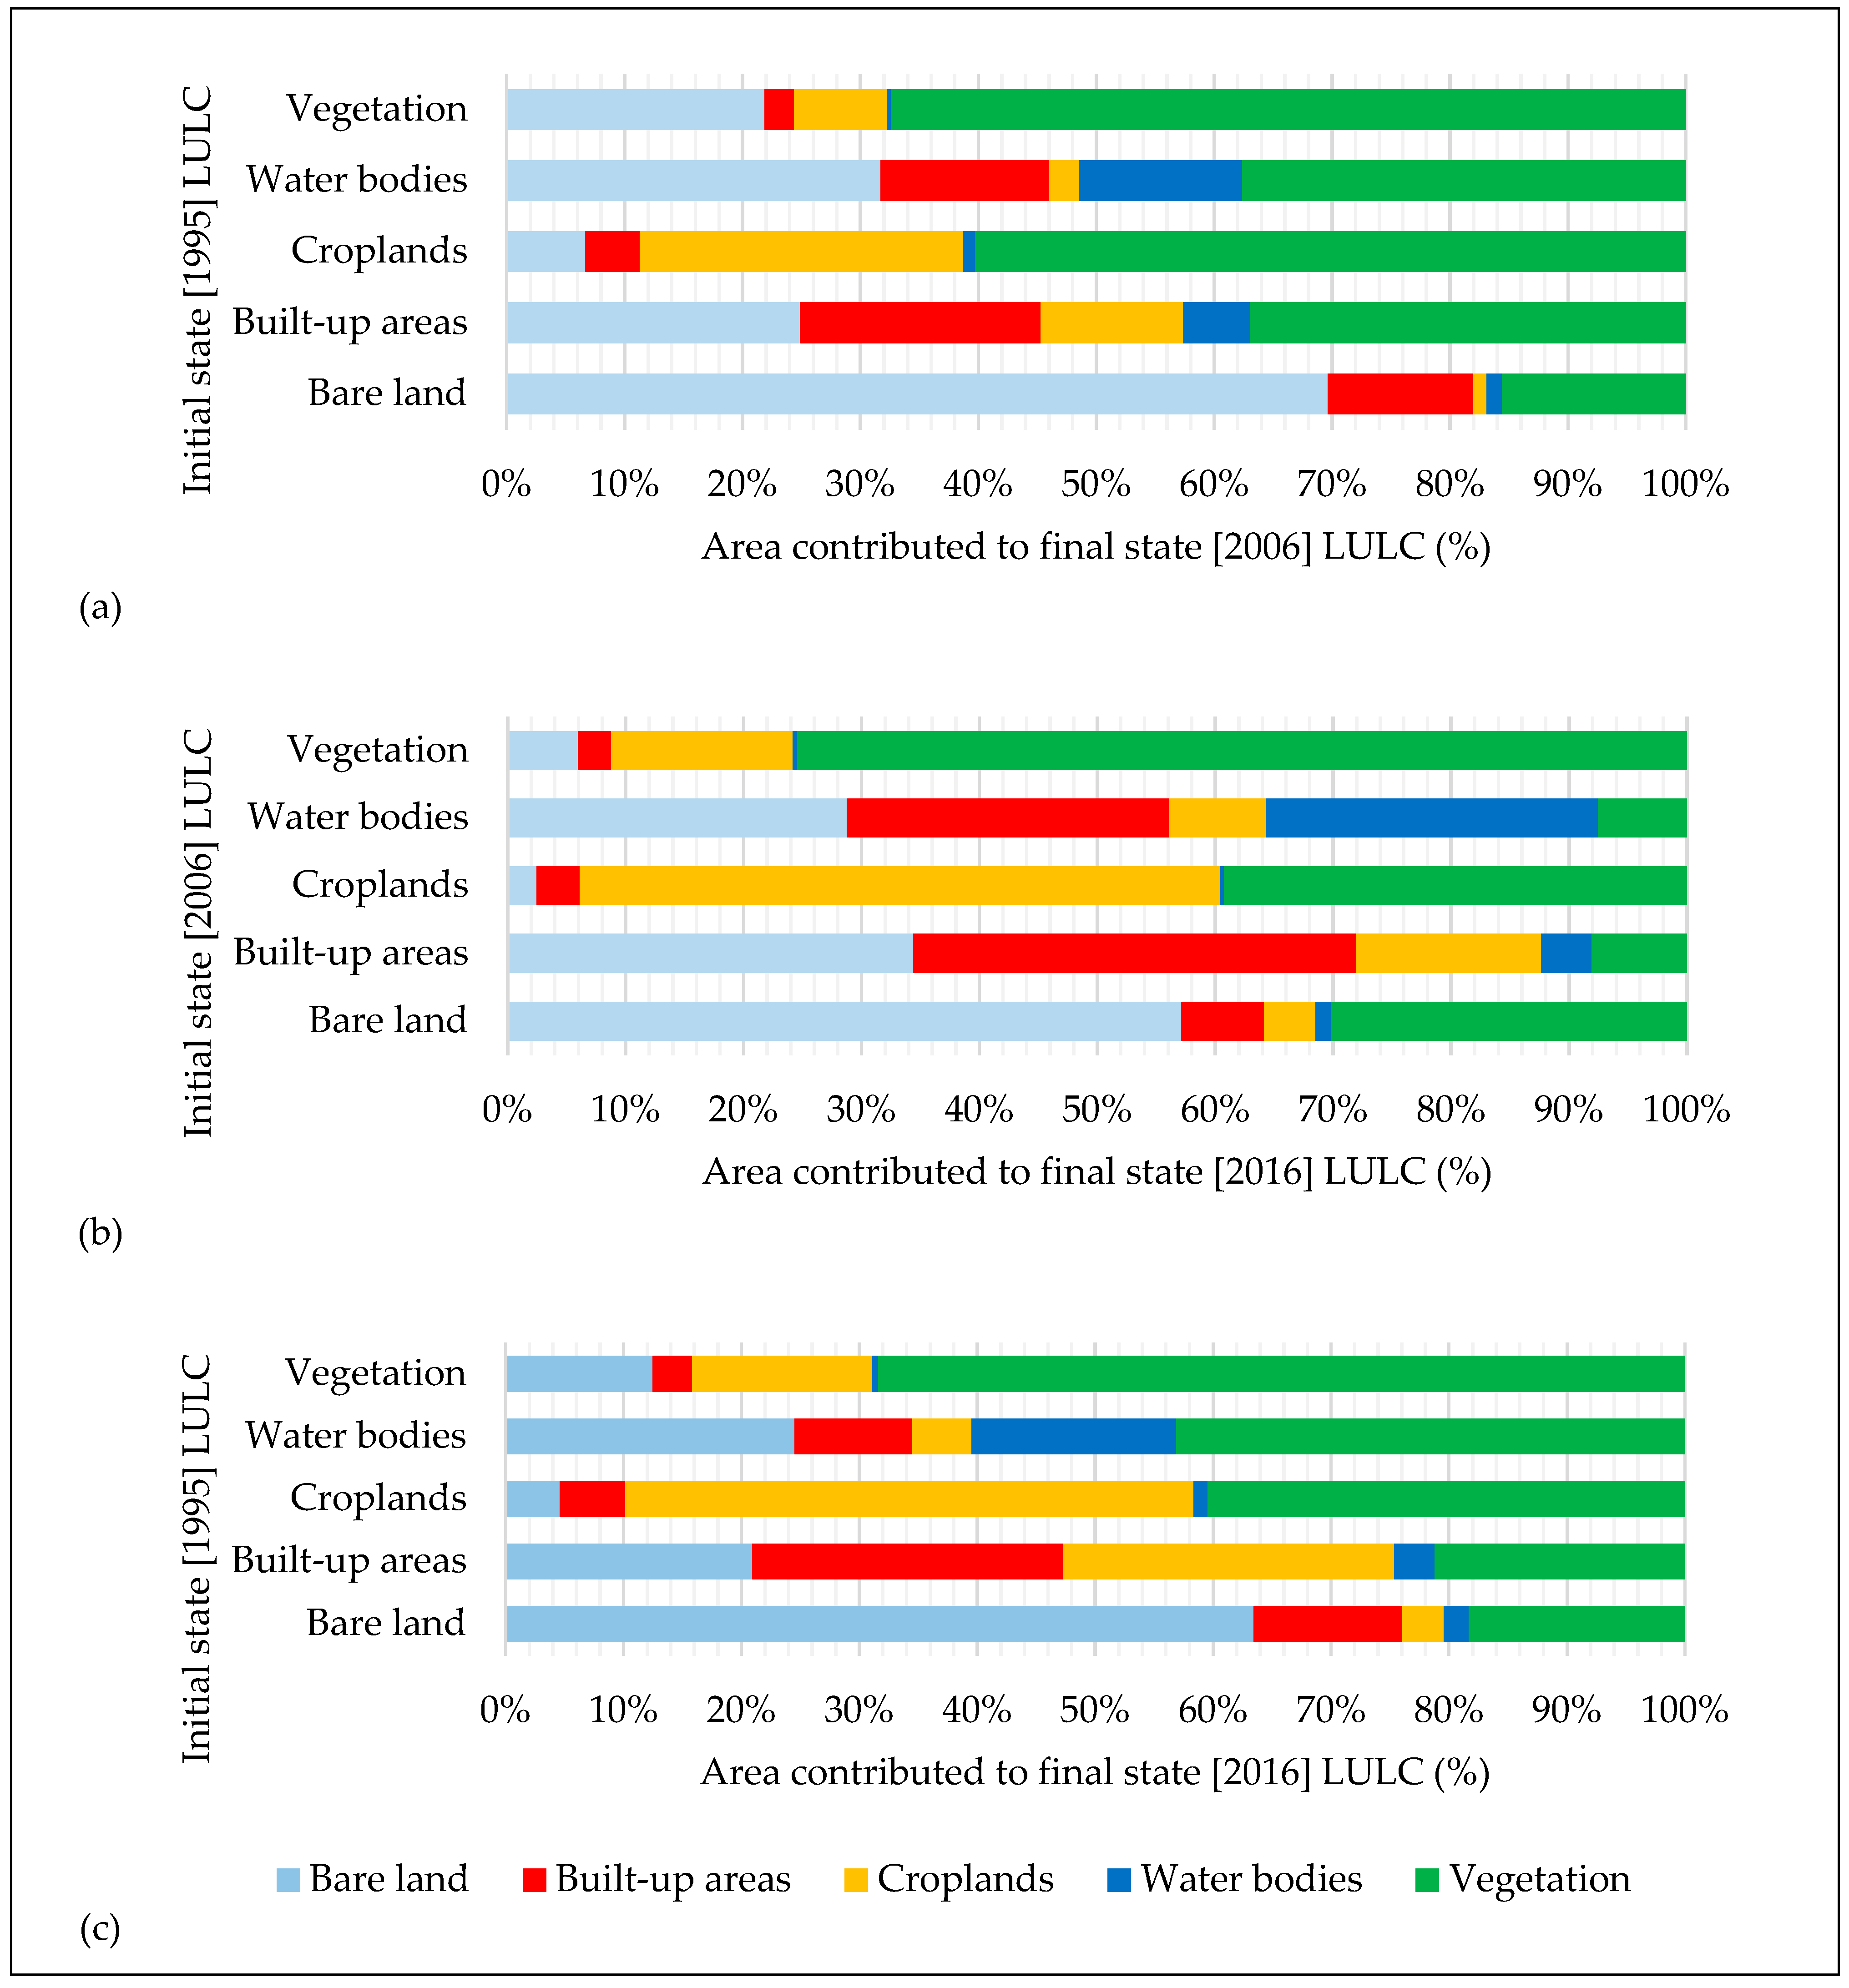
3. Results
3.1. Land-Use and/or Land-Cover Change in Bobirwa Sub-District
3.2. Household Socio-Economic Characteristics
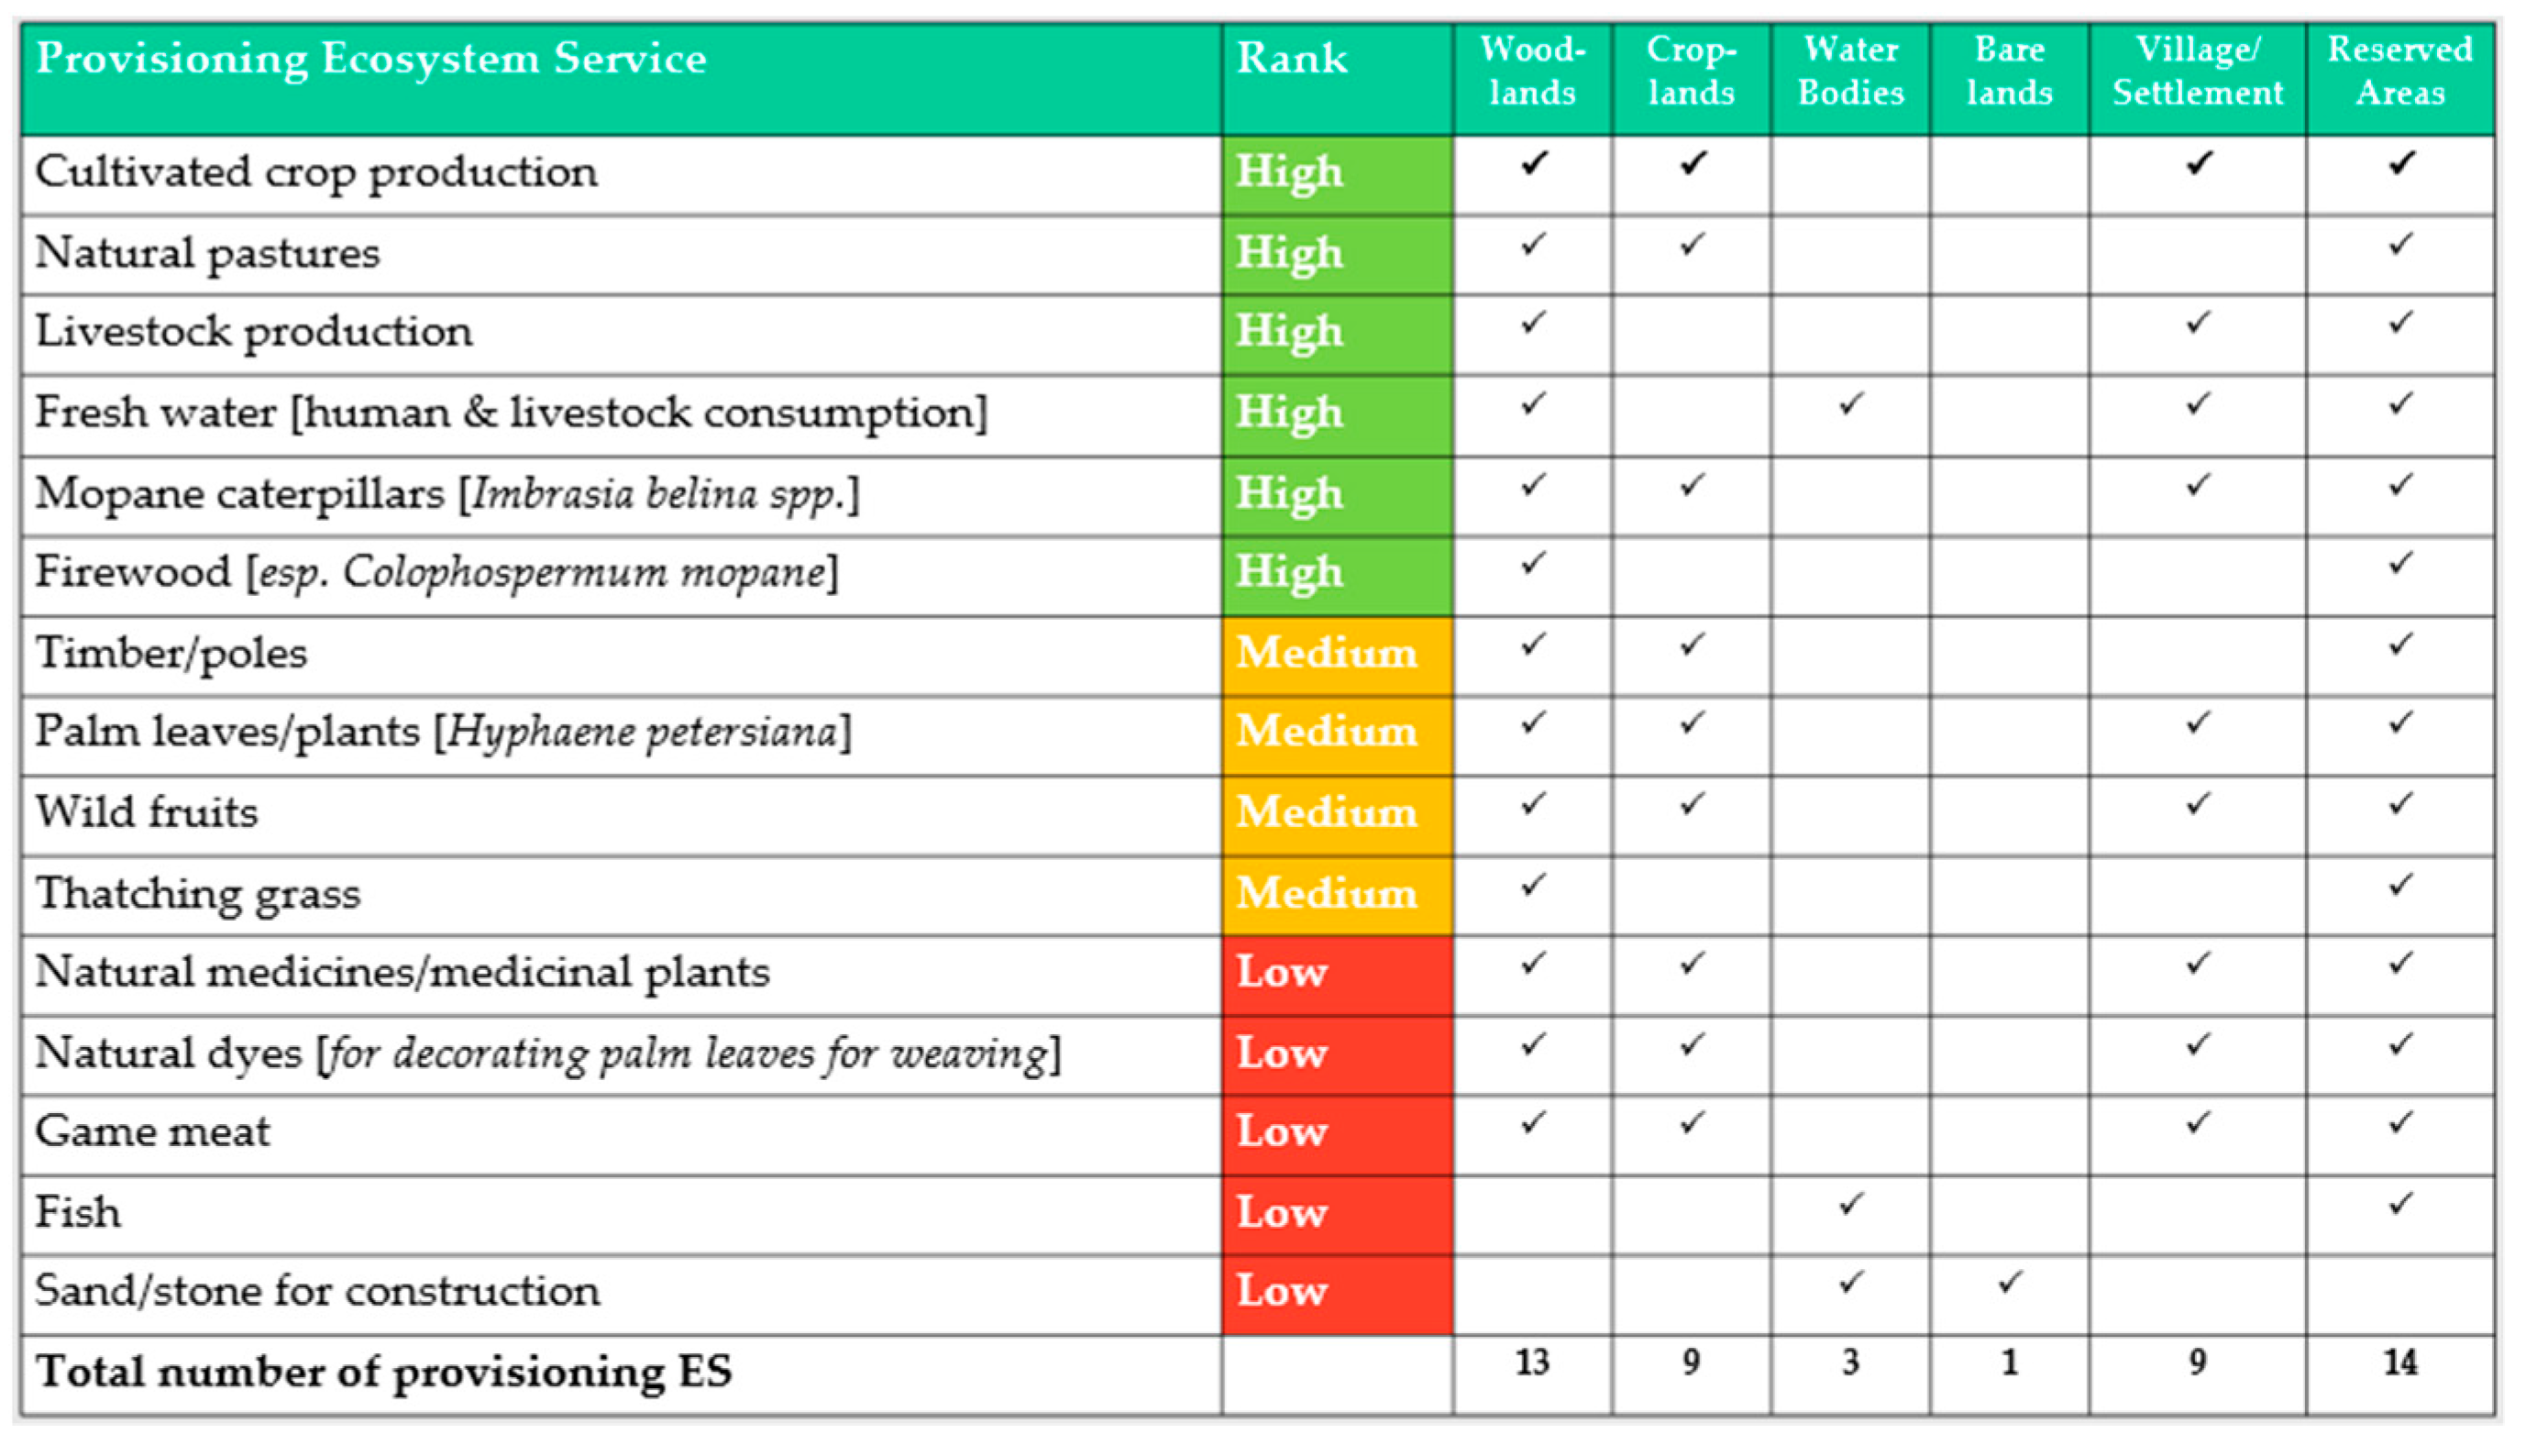
3.3. Key Provisioning Ecosystem Services in Bobirwa Sub-District
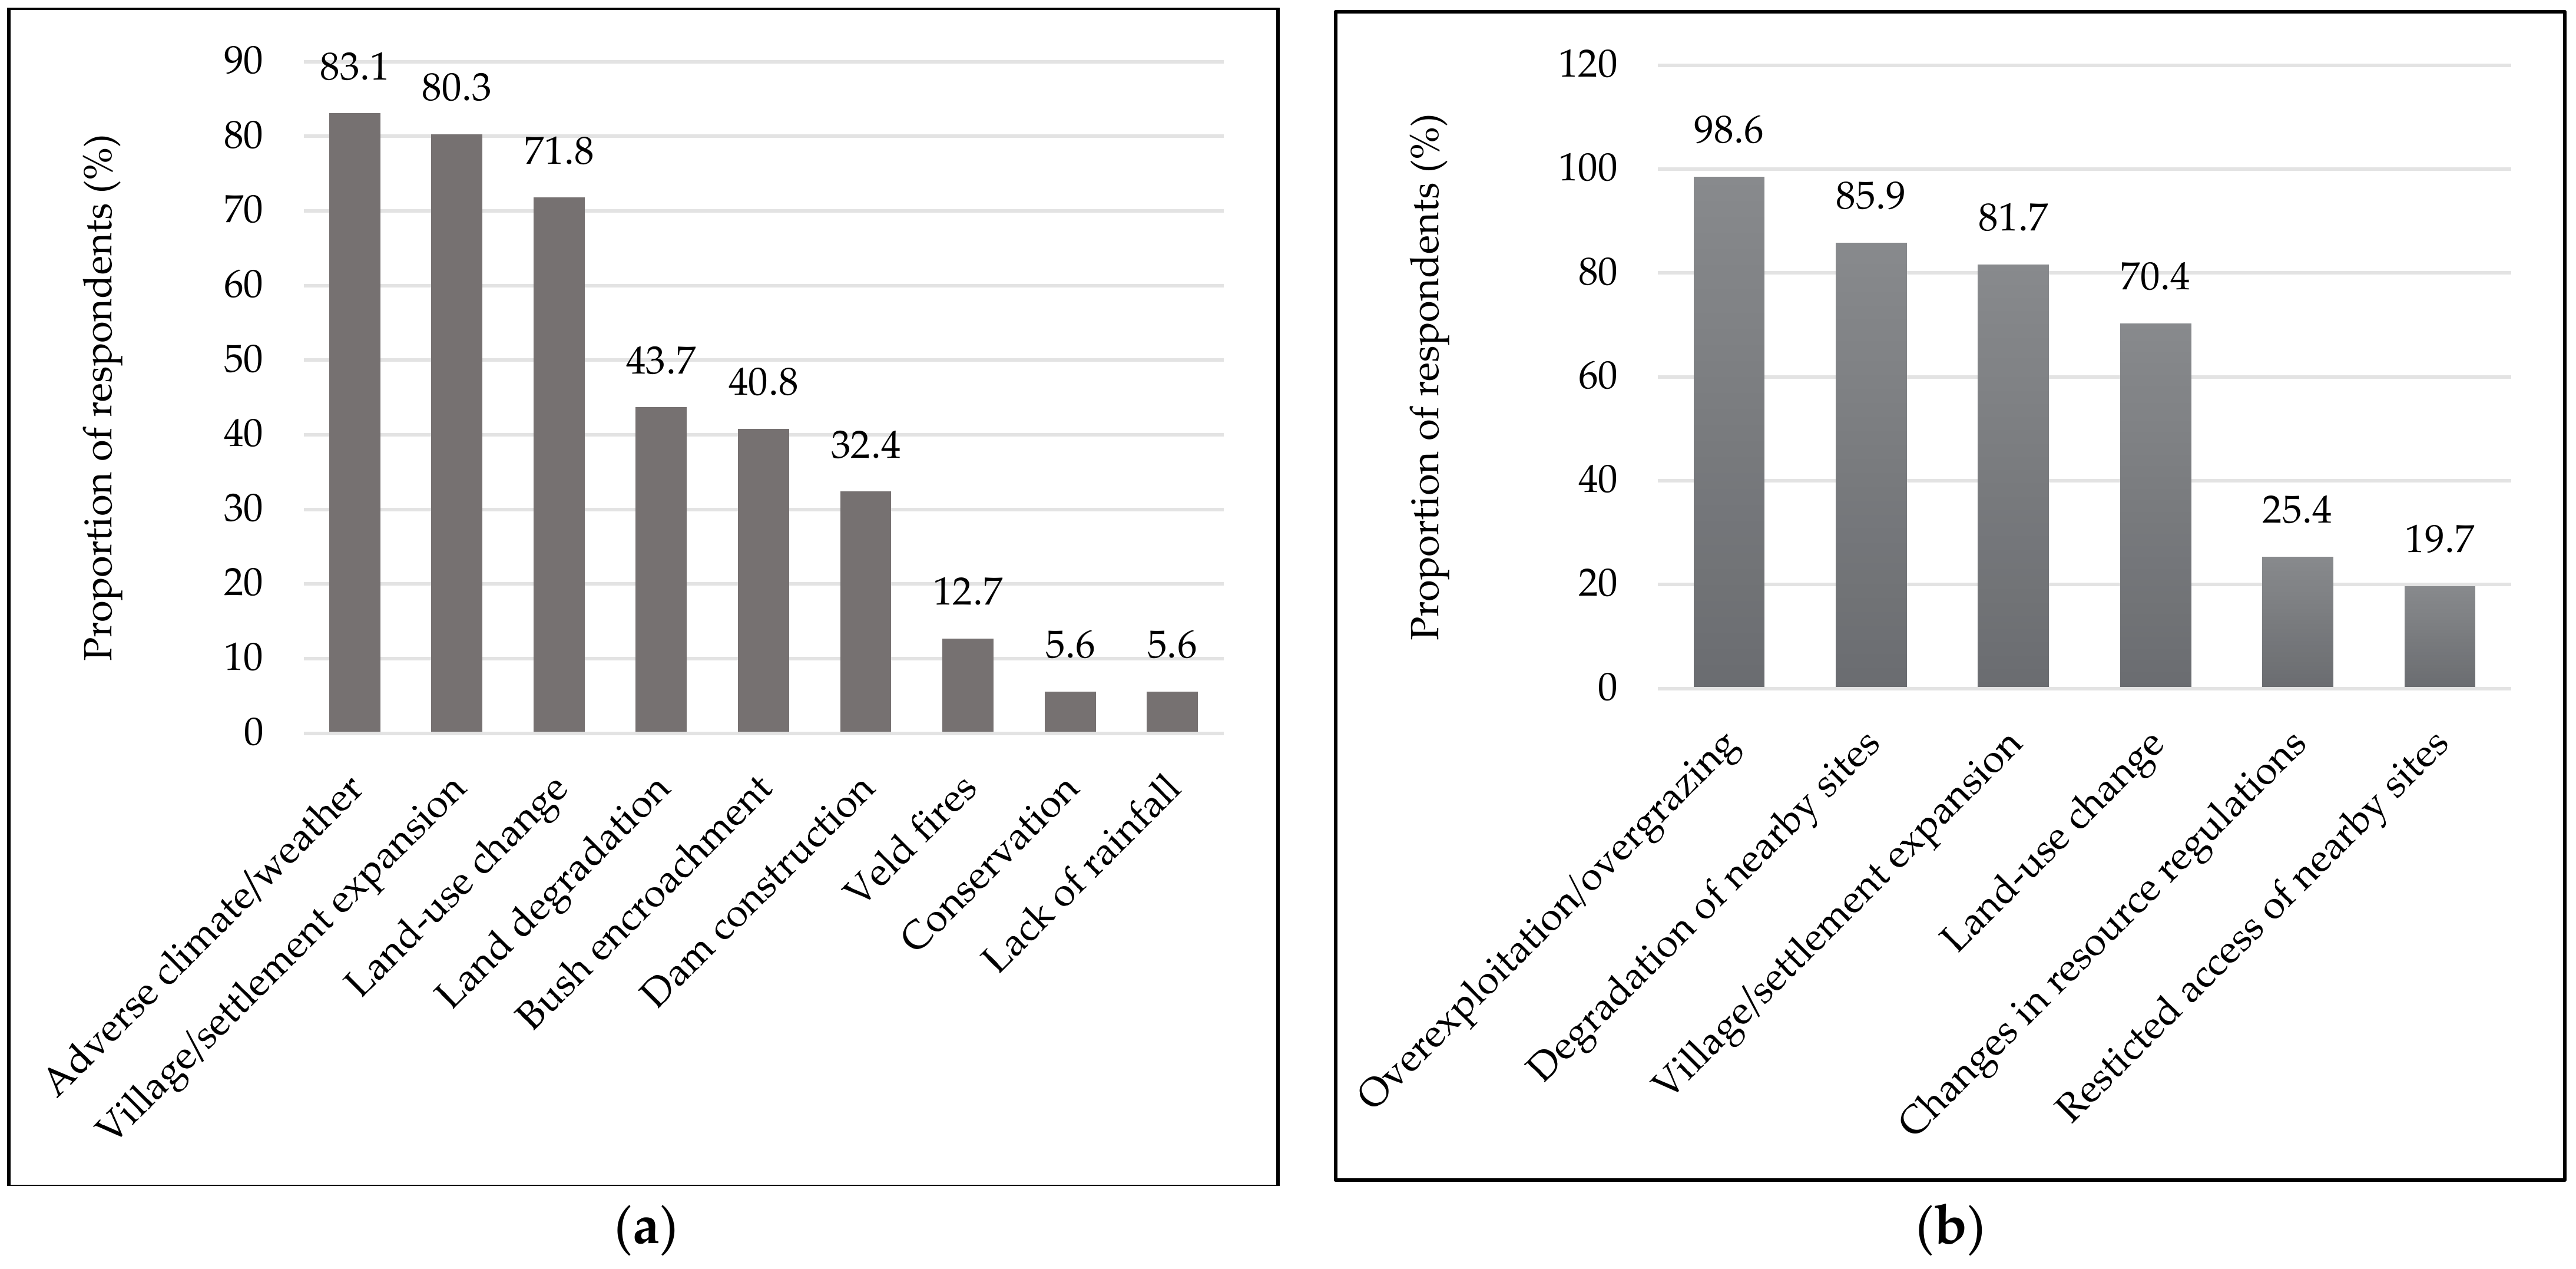
3.4. Perceived Drivers of Change in Provisioning Ecosystem Services
4. Discussion
4.1. Dynamics of Change in Bobirwa Sub-District
4.2. Impacts of LULCC on Ecosystem Service Delivery
5. Conclusions and Recommendations
Supplementary Materials
Author Contributions
Funding
Institutional Review Board Statement
Informed Consent Statement
Data Availability Statement
Acknowledgments
Conflicts of Interest
References
- Najmuddin, O.; Li, Z.; Khan, R.; Zhuang, W. Valuation of Land—Use/Land—Cover—Based Ecosystem Services in Afghanistan—An Assessment of the Past and Future. Land 2022, 11, 1906. [Google Scholar] [CrossRef]
- Matlhodi, B.; Kenabatho, P.K.; Parida, B.P.; Maphanyane, J.G. Evaluating Land Use and Land Cover Change in the Gaborone Dam Catchment, Botswana, from 1984–2015 Using GIS and Remote Sensing. Sustainability 2019, 11, 5174. [Google Scholar] [CrossRef]
- Biratu, A.A.; Bedadi, B.; Gebrehiwot, S.G.; Melesse, A.M.; Nebi, T.H.; Abera, W.; Tamene, L.; Egeru, A. Impact of Landscape Management Scenarios on Ecosystem Service Values in Central Ethiopia. Land 2022, 11, 1266. [Google Scholar] [CrossRef]
- Amini Parsa, V.; Salehi, E. Spatio-Temporal Analysis and Simulation Pattern of Land Use/Cover Changes, Case Study: Naghadeh, Iran. J. Urban Manag. 2016, 5, 43–51. [Google Scholar] [CrossRef]
- Othow, O.O.; Gebre, S.L.; Gemeda, D.O. Analyzing the Rate of Land Use and Land Cover Change and Determining the Causes of Forest Cover Change in Gog District, Gambella Regional State, Ethiopia. J. Remote Sens. GIS 2017, 6, 218. [Google Scholar] [CrossRef]
- Lagrosa, J.J.; Zipperer, W.C.; Andreu, M.G. An Ecosystem Services-Centric Land Use and Land Cover Classification for a Subbasin of the Tampa Bay Watershed. Forests 2022, 13, 745. [Google Scholar] [CrossRef]
- Chen, H.; Chen, Y.; Chen, X.; Zhang, X.; Wu, H.; Li, Z. Impacts of Historical Land Use Changes on Ecosystem Services in Guangdong Province, China. Land 2022, 11, 809. [Google Scholar] [CrossRef]
- Kolawole, O.I.; Mbaiwa, J.E.; Mmopelwa, G. The Environmental Impacts of Tourism on Community People’s Quality of Life in Maun, Botswana. Afr. J. Hosp. Tour. Leis. 2016, 5, 1–14. [Google Scholar]
- Secretariat of the Convention on Biological Diversity Voluntary Guidelines for the Design and Effective Implementation of Ecosystem-Based Approaches to Climate Change Adaptation and Disaster Risk Reduction and Supplementary Information; Secretariat of the Convention on Biological Diversity: Montreal, QC, Canada, 2019.
- UNDP Sustainable Development Goals—United Nations. Available online: http://www.un.org/sustainabledevelopment/sustainable-development-goals/ (accessed on 20 March 2017).
- Díaz, S.; Demissew, S.; Carabias, J.; Joly, C.; Lonsdale, M.; Ash, N.; Larigauderie, A.; Adhikari, J.R.; Arico, S.; Báldi, A.; et al. IPBES The IPBES Conceptual Framework—Connecting Nature and People. Curr. Opin. Environ. Sustain. 2015, 14, 1–16. [Google Scholar] [CrossRef]
- Liao, Z.; Su, K.; Jiang, X.; Zhou, X.; Yu, Z.; Chen, Z.; Wei, C.; Zhang, Y.; Wang, L. Ecosystem and Driving Force Evaluation of Northeast Forest Belt. Land 2022, 11, 1306. [Google Scholar] [CrossRef]
- Motlhanka, D.M.T.; Motlhanka, P.; Selebatso, T. Edible Indigenous Wild Fruit Plants of Eastern Botswana. Int. J. Poult. Sci. 2008, 7, 457–460. [Google Scholar] [CrossRef]
- Dube, O.P.; Sekhwela, M.B.M. Community Coping Strategies in Semiarid Limpopo Basin Part of Botswana: Enhancing Adaptation Capacity to Climate Change; AIACC: Washington, DC, USA, 2007; Volume 47. [Google Scholar]
- Mugari, E.; Masundire, H.; Bolaane, M. Adapting to Climate Change in Semi-Arid Rural Areas: A Case of the Limpopo Basin Part of Botswana. Sustainability 2020, 12, 8292. [Google Scholar] [CrossRef]
- Millenium Ecosystem Assessment. Ecosystems and Their Services. In Ecosystems and Human Well-Being: A Framework for Assessment; Island Press: Washington, DC, USA, 2003; pp. 49–70. ISBN 9781559634038. [Google Scholar]
- GoB. National Adaptation Plan Framework for Botswana; Ministry of Environment, Natural Resources Conservation and Tourism: Gaborone, Botswana, 2020. [Google Scholar]
- Nkemelang, T.; New, M.; Zaroug, M. Temperature and Precipitation Extremes under Current, 1.5 °C and 2.0 °C Global Warming above Pre-Industrial Levels over Botswana, and Implications for Climate Change Vulnerability. Environ. Res. Lett. 2018, 13, 065016. [Google Scholar] [CrossRef]
- Maúre, G.; Pinto, I.; Ndebele-Murisa, M.; Muthige, M.; Lennard, C.; Nikulin, G.; Dosio, A.; Meque, A. The Southern African Climate under 1.5 °C and 2 °C of Global Warming as Simulated by CORDEX Regional Climate Models. Environ. Res. Lett. 2018, 13, 065002. [Google Scholar] [CrossRef]
- Daron, J.D. Regional Climate Messages for Southern Africa. Scientific Report from the CARIAA Adaptation at Scale in Semi-Arid Regions (ASSAR) Project; ASSAR: Cape Town, South Africa, 2014. [Google Scholar]
- Abd, H.A.A.; Alnajjar, H.A. Maximum Likelihood for Land-Use/Land-Cover Mapping and Change Detection Using Landsat Satellite Images: A Case Study “South Of Johor. ” Int. J. Comput. Electron. Res. 2013, 3, 26–33. [Google Scholar]
- Ganasri, B.P.; Dwarakish, G.S. Study of Land Use/Land Cover Dynamics through Classification Algorithms for Harangi Catchment Area, Karnataka State, INDIA. Aquat. Procedia 2015, 4, 1413–1420. [Google Scholar] [CrossRef]
- Khan, S.; Qasim, S.; Ambreen, R.; Syed, Z.-U.-H. Spatio-Temporal Analysis of Landuse/Landcover Change of District Pishin Using Satellite Imagery and GIS. J. Geogr. Inf. Syst. 2016, 08, 361–368. [Google Scholar] [CrossRef]
- Kamusoko, C.; Gamba, J.; Murakami, H. Monitoring Urban Spatial Growth in Harare Metropolitan Province, Zimbabwe. Adv. Remote Sens. 2013, 2, 322–331. [Google Scholar] [CrossRef]
- Haque, M.I.; Basak, R. Land Cover Change Detection Using GIS and Remote Sensing Techniques: A Spatio-Temporal Study on Tanguar Haor, Sunamganj, Bangladesh. Egypt. J. Remote Sens. Space Sci. 2017, 20, 251–263. [Google Scholar] [CrossRef]
- Bektas, B.F.; Karakacan, K.A. Determination of Land Cover/Land Use Using Spot 7 Data With Supervised Classification Methods. Int. Arch. Photogramm. Remote Sens. Spat. Inf. Sci. 2016, 42, 143–146. [Google Scholar] [CrossRef]
- Botswana, S. Central Bobonong Sub-District Population and Housing Census 2011 Selected Indicators; Ministry of Finance and Development Planning: Gaborone, Botswana, 2015. [Google Scholar]
- Dube, O.P.; Sekhwela, M.B.M. Indigenous Knowledge, Institutions and Practices for Coping with Variable Climate in the Limpopo Basin of Botswana. In Climate Change and Adaptation; Leary, N., Adejuwon, J., Barros, V., Burton, I., Kulkarni, J., Lasco, R., Eds.; Earthscan: Gaborone, Botswana, 2012; pp. 71–89. ISBN 9781849770750. [Google Scholar]
- Mogotsi, K.; Nyangito, M.M.; Nyariki, D.M. The Role of Drought among Agro-Pastoral Communities in a Semi-Arid Environment: The Case of Botswana. J. Arid Environ. 2013, 91, 38–44. [Google Scholar] [CrossRef]
- Mugari, E.; Masundire, H.; Bolaane, M.; New, M. Perceptions of Ecosystem Services Provision Performance in the Face of Climate Change among Communities in Bobirwa Sub-District, Botswana. Int. J. Clim. Chang. Strateg. Manag. 2018, 11, 265–288. [Google Scholar] [CrossRef]
- Masundire, H.; Morchain, D.; Raditloaneng, N.; Hegga, S.; Ziervogel, G.; Molefe, C.; Angula, M.; Omari, K. About ASSAR Reports Vulnerability and Risk Assessment in Botswana’s Bobirwa Sub-District: Fostering People-Centred Adaptation to Climate Change; ASSAR: Gaborone, Botswana, 2016. [Google Scholar]
- Khatami, R.; Mountrakis, G. The Interacting Effects of Image Acquisition Date, Number of Images, Classifier, and Number of Training Samples on Accuracy of Binary Classification of Impervious Cover. Remote Sens. Lett. 2018, 9, 189–198. [Google Scholar] [CrossRef]
- ENVI. FLAASH Module User’s Guide; Research Systems, Inc.: Washington, DC, USA, 2005. [Google Scholar]
- Keller, J.M.; Gray, M.R. A Fuzzy K-Nearest Neighbor Algorithm. IEEE Trans. Syst. Man Cybern. 1985, 15, 580–585. [Google Scholar] [CrossRef]
- Coulter, L.L.; Stow, D.A.; Tsai, Y.-H.; Ibanez, N.; Shih, H.; Kerr, A.; Benza, M.; Weeks, J.R.; Mensah, F. Classification and Assessment of Land Cover and Land Use Change in Southern Ghana Using Dense Stacks of Landsat 7 ETM+ Imagery. Remote Sens. Environ. 2016, 184, 396–409. [Google Scholar] [CrossRef]
- Rawat, V.; Puri, M. Land Use/Land Cover Change Study of District Dehradun, Uttarakhand Using Remote Sensing and GIS Technologies. Int. J. Adv. Remote Sens. GIS 2017, 6, 2223–2233. [Google Scholar] [CrossRef]
- Mosammam, H.M.; Nia, J.T.; Khani, H.; Teymouri, A.; Kazemi, M. Monitoring Land Use Change and Measuring Urban Sprawl Based on Its Spatial Forms. The Case of Qom City. Egypt. J. Remote Sens. Space Sci. 2016, 20, 103–116. [Google Scholar] [CrossRef]
- Mugari, E.; Masundire, H.; Bolaane, M. Effects of Droughts on Vegetation Condition and Ecosystem Service Delivery in Data-Poor Areas: A Case of Bobirwa Sub-District, Limpopo Basin and Botswana. Sustainability 2020, 12, 8185. [Google Scholar] [CrossRef]
- Pullanikkatil, D.; Palamuleni, L.; Ruhiiga, T. Assessment of Land Use Change in Likangala River Catchment, Malawi: A Remote Sensing and DPSIR Approach. Appl. Geogr. 2016, 71, 9–23. [Google Scholar] [CrossRef]
- Gumindoga, W.; Rientjes, T.; Shekede, M.D.; Rwasoka, D.T.; Nhapi, I.; Haile, A.T.; Gumindoga, W.; Rientjes, T.; Shekede, M.D.; Rwasoka, D.T.; et al. Hydrological Impacts of Urbanization of Two Catchments in Harare, Zimbabwe. Remote Sens. 2014, 6, 12544–12574. [Google Scholar] [CrossRef]
- Liu, J.; Wilson, M.; Hu, G.; Liu, J.; Wu, J.; Yu, M. How Does Habitat Fragmentation Affect Biodiversity and Ecosystem Functioning Relationship? Landsc. Ecol. 2018, 33, 341–352. [Google Scholar] [CrossRef]
- Kosonei, R.C.; Abuom, P.O.; Bosire, E.; Huho, J.M. Effects of Drought Dynamics on Vegetation Cover in Marigat Sub-County, Baringo County, Kenya. Int. J. Sci. Publ. 2017, 7, 89–98. [Google Scholar]
- Ministry of Agriculture (MOA) Integrated Support Programme for Arable Agriculture Development (ISPAAD). Available online: http://www.gov.bw/en/Ministries--Authorities/Ministries/MinistryofAgriculture-MOA/Tools--Services/Support-Schemes-and-Initiatives/ISPAAD/ (accessed on 10 July 2018).
- UNDP-UNEP PEI. Support to Smallholder Arable Farmers in Botswana: Agricultural Development or Social Protection? Results and Policy Implications from a Poverty and Social Impact Analysis; UNDP: Gaborone, Botswana, 2013. [Google Scholar]
- Owusu, K.; Obour, P.B.; Nkansah, M.A. Downstream Effects of Dams on Livelihoods of River-Dependent Communities: The Case of Ghana’s Kpong Dam. Geogr. Tidsskr. J. Geogr. 2017, 117, 1–10. [Google Scholar] [CrossRef]
- Department of Environmental Affairs Botswana’s National Biodiversity Strategy and Action Plan. Available online: https://www.cbd.int/doc/world/bw/bw-nbsap-v3-en.pdf (accessed on 11 October 2022).
- Bennett, E.M.; Cramer, W.; Begossi, A.; Cundill, G.; Diaz, S.; Egoh, B.N.; Geijzendorffer, I.R.; Krug, C.B.; Lavorel, S. Linking Biodiversity, Ecosystem Services, and Human Well-Being: Three Challenges for Designing Research for Sustainability. Curr. Opin. Environ. Sustain. 2015, 14, 76–85. [Google Scholar] [CrossRef]
- Polasky, S.; Nelson, E.; Pennington, D.; Johnson, K.A.; Polasky, S.; Pennington, D.; Johnson, K.A.; Nelson, E. The Impact of Land-Use Change on Ecosystem Services, Biodiversity and Returns to Landowners: A Case Study in the State of Minnesota. Env. Resour. Econ 2011, 48, 219–242. [Google Scholar] [CrossRef]
- Abate, T.; Angassa, A. Conversion of Savanna Rangelands to Bush Dominated Landscape in Borana, Southern Ethiopia. Ecol. Process. 2016, 5, 1–18. [Google Scholar] [CrossRef]
- Laurance, W.F.; Sayer, J.; Cassman, K.G. Agricultural Expansion and Its Impacts on Tropical Nature. Trends Ecol. Evol. 2014, 29, 107–116. [Google Scholar] [CrossRef] [PubMed]
- Perrings, C. Biodiversity, Ecosystem Services and Climate Change. Econ. Probl. Environ. Dep. Pap. 2010, 120, 39. [Google Scholar]
- Sandifer, P.A.; Sutton-Grier, A.E.; Ward, B.P. Exploring Connections among Nature, Biodiversity, Ecosystem Services, and Human Health and Well-Being: Opportunities to Enhance Health and Biodiversity Conservation. Ecosyst. Serv. 2015, 12, 1–15. [Google Scholar] [CrossRef]
- Fenetahun, Y.; Yong-dong, W.; You, Y.; Xinwen, X. Dynamics of Forage and Land Cover Changes in Teltele District of Borana Rangelands, Southern Ethiopia: Using Geospatial and Field Survey Data. BMC Ecol. 2020, 20, 55. [Google Scholar] [CrossRef]
- Akinyemi, F.O.; Mashame, G. Analysis of Land Change in the Dryland Agricultural Landscapes of Eastern Botswana. Land Use Policy 2018, 76, 798–811. [Google Scholar] [CrossRef]
- Garcia-Nieto, A.P.; Quintas-Soriano, C.; Garcia-Llorente, M.; Palomo, I.; Montes, C.; Martin-Lopez, B. Collaborative Mapping of Ecosystem Services: The Role of Stakeholders’ Profiles. Ecosyst. Serv. 2015, 13, 141–152. [Google Scholar] [CrossRef]
- Quintas-Soriano, C.; Castro, A.J.; Castro, H.; García-Llorente, M. Impacts of Land Use Change on Ecosystem Services and Implications for Human Well-Being in Spanish Drylands. Land Use Policy 2016, 54, 534–548. [Google Scholar] [CrossRef]
- Habib, T.J.; Heckbert, S.; Wilson, J.J.; Vandenbroeck, A.J.K.; Cranston, J.; Farr, D.R. Impacts of Land-Use Management on Ecosystem Services and Biodiversity: An Agent-Based Modelling Approach. PeerJ 2016, 4, e2814. [Google Scholar] [CrossRef]
- Moses, O. Heat Wave Characteristics in the Context of Climate Change over the Past 50 Years in Botswana | Botswana Notes and Records. Botsw. Notes Rec. 2017, 49, 13–25. [Google Scholar]
- Wang, Z.; Wang, Z.; Zhang, B.; Lu, C.; Ren, C. Impact of Land Use/Land Cover Changes on Ecosystem Services in the Nenjiang River Basin, Northeast China. Ecol. Process. 2015, 4, 11. [Google Scholar] [CrossRef]
- Sunitha, V.; Reddy, B.M.; Reddy, M.R. Groundwater Contamination from Agro-Chemicals in Irrigated Environment: Field Trials. Adv. Appl. Sci. Res. 2012, 3, 3382–3386. [Google Scholar]


| Month | Year | Path/Row | |||||||
|---|---|---|---|---|---|---|---|---|---|
| 170/075 | 170/076 | 171/075 | 171/076 | ||||||
| Sensor | Date Acquired | Sensor | Date Acquired | Sensor | Date Acquired | Sensor | Date Acquired | ||
| March/April | 1995 | TM | 17/03/95 | TM | 17/03/95 | TM | 09/04/95 | TM | 09/04/95 |
| 2006 | ETM | 08/04/06 | ETM | 10/05/06 | ETM | 07/04/06 | ETM | 07/04/06 | |
| 2016 | OLI | 02/03/16 | OLI | 02/03/16 | OLI | 02/04/16 | OLI | 02/04/16 | |
| Land Cover Class | Description |
|---|---|
| Built-up areas Croplands | Village settlements, rock surfaces, paved roads, etc. Cultivated areas under rain-fed and irrigation, plantations |
| Water bodies | Dams, ponds, rivers, streams, etc. |
| Vegetation | Predominantly trees, shrubs, or grasslands |
| Bare land | Bare lands with exposed soil surfaces, with no vegetation all year round, or with very sparse vegetation |
| LULC Class | Changes from 1995–2006 | Changes from 2006–2016 | Changes from 1995–2016 | |||
|---|---|---|---|---|---|---|
| km2 (km2/Year) | % (%/Year) | km2 (km2/Year) | % (%/Year) | km2 (km2/Year) | % (%/Year) | |
| Bare land | 727.94 (66.18) | 43.25 (3.93) | −612.83 (−61.28) | −25.42 (−2.54) | 115.11 (5.48) | 6.84 (0.33) |
| Built-up areas | 165.18 (15.02) | 65.82 (5.98) | 64.87 (6.49) | 15.59 (1.56) | 230.05 (10.95) | 91.67 (4.37) |
| Croplands | 168.66 (15.33) | 42.65 (3.88) | 545.72 (54.57) | 96.74 (9.67) | 714.39 (34.02) | 180.65 (8.60) |
| Water bodies | −14.01 (−1.27) | −16.77 (−1.52) | 18.61 (1.86) | 26.77 (2.68) | 4.60 (0.22) | 5.51 (0.26) |
| Vegetation | −1047.78 (−95.25) | −20.42 (−1.86) | −16.37 (−1.64) | −0.40 (−0.04) | −1064.15 (−50.67) | −20.74 (−0.99) |
| Socio-Economic Characteristics | N/Mean | % of Cases | χ2 | p-Value | |
|---|---|---|---|---|---|
| Age of household head | Young (20–40) | 57 | 18.4 | ||
| Adult (40–60) | 128 | 41.3 | 9.332 | 0.009 ** | |
| Elderly (>60) | 125 | 40.3 | |||
| Gender of household head | Female | 247 | 79.7 | ||
| Male | 63 | 20.3 | 7.688 | 0.006 ** | |
| Education level of household head | None | 84 | 27.1 | ||
| Primary | 122 | 39.4 | |||
| Secondary | 71 | 22.9 | 0.014 * | ||
| Tertiary | 33 | 10.7 | |||
| Employment status of household head | Full-time farmer | 100 | 32.3 | 0.160 | 0.689 |
| Part-time farmer | 210 | 67.7 | |||
| Household size | 5.88 | - | |||
| Arable farm size (ha) | Total land owned | 8.85 | - | ||
| Cultivated area | 2.32 | 26.2 | |||
| Annual income of household (BWP) (USD 1 ≈ BWP 13.4) | <5000 | 193 | 62.3 | ||
| 5000–10,000 | 39 | 12.6 | |||
| 10,001–15,000 | 19 | 6.1 | 4.160 | 0.385 | |
| 15,001–20,000 | 15 | 4.8 | |||
| >20,000 | 44 | 14.2 | |||
| Household sources of income | Crop production | 164 | 52.9 | ||
| Casual labor (Ipelegeng) | 115 | 37.1 | |||
| Mopane caterpillars | 91 | 29.4 | |||
| Formal employment | 86 | 27.7 | |||
| Small livestock | 76 | 24.5 | |||
| Poultry products | 76 | 24.5 | |||
| Informal trade | 64 | 20.6 | |||
| Cattle | 48 | 15.5 | |||
| Timber/firewood | 48 | 15.5 | |||
| NTFPs | 10 | 3.2 | |||
| Livestock owned | Cattle | 6.27 | 37.4 | 0.201 | 0.654 |
| Donkeys | 1.42 | 26.1 | 5.117 | 0.077 | |
| Goats | 7.77 | 55.5 | 9.633 | 0.008 ** | |
| Sheep | 1.02 | 10.3 | 0.649 | 0.421 | |
| Government (ISPADD) input support received | Full subsidy | 145 | 46.8 | ||
| Partial subsidy | 17 | 5.5 | 1.145 | 0.887 | |
| None | 148 | 47.7 | |||
| Major farm implements used | Hand-held | 204 | 65.8 | 3.514 | 0.037 * |
| Animal-drawn | 137 | 44.2 | 9.257 | 0.026 * | |
| Tractor-drawn | 11 | 3.5 | 0.004 | 0.950 | |
| Access to climate and agricultural information | Yes | 282 | 91.0 | 0.071 | 0.790 |
| No | 28 | 9.0 | |||
| Average grain yield (kg/ha) [last 3 seasons] | Sorghum | 168.9 | |||
| Millet | 167.5 | ||||
| Maize | 164.3 | ||||
| Cowpeas | 122.3 | ||||
Publisher’s Note: MDPI stays neutral with regard to jurisdictional claims in published maps and institutional affiliations. |
© 2022 by the authors. Licensee MDPI, Basel, Switzerland. This article is an open access article distributed under the terms and conditions of the Creative Commons Attribution (CC BY) license (https://creativecommons.org/licenses/by/4.0/).
Share and Cite
Mugari, E.; Masundire, H. Consistent Changes in Land-Use/Land-Cover in Semi-Arid Areas: Implications on Ecosystem Service Delivery and Adaptation in the Limpopo Basin, Botswana. Land 2022, 11, 2057. https://doi.org/10.3390/land11112057
Mugari E, Masundire H. Consistent Changes in Land-Use/Land-Cover in Semi-Arid Areas: Implications on Ecosystem Service Delivery and Adaptation in the Limpopo Basin, Botswana. Land. 2022; 11(11):2057. https://doi.org/10.3390/land11112057
Chicago/Turabian StyleMugari, Ephias, and Hillary Masundire. 2022. "Consistent Changes in Land-Use/Land-Cover in Semi-Arid Areas: Implications on Ecosystem Service Delivery and Adaptation in the Limpopo Basin, Botswana" Land 11, no. 11: 2057. https://doi.org/10.3390/land11112057
APA StyleMugari, E., & Masundire, H. (2022). Consistent Changes in Land-Use/Land-Cover in Semi-Arid Areas: Implications on Ecosystem Service Delivery and Adaptation in the Limpopo Basin, Botswana. Land, 11(11), 2057. https://doi.org/10.3390/land11112057