

Influence of Slide Burnishing Parameters on the Surface Layer Properties of Stainless Steel and Mean Positron Lifetime

 , , , and
Abstract
:1. Introduction
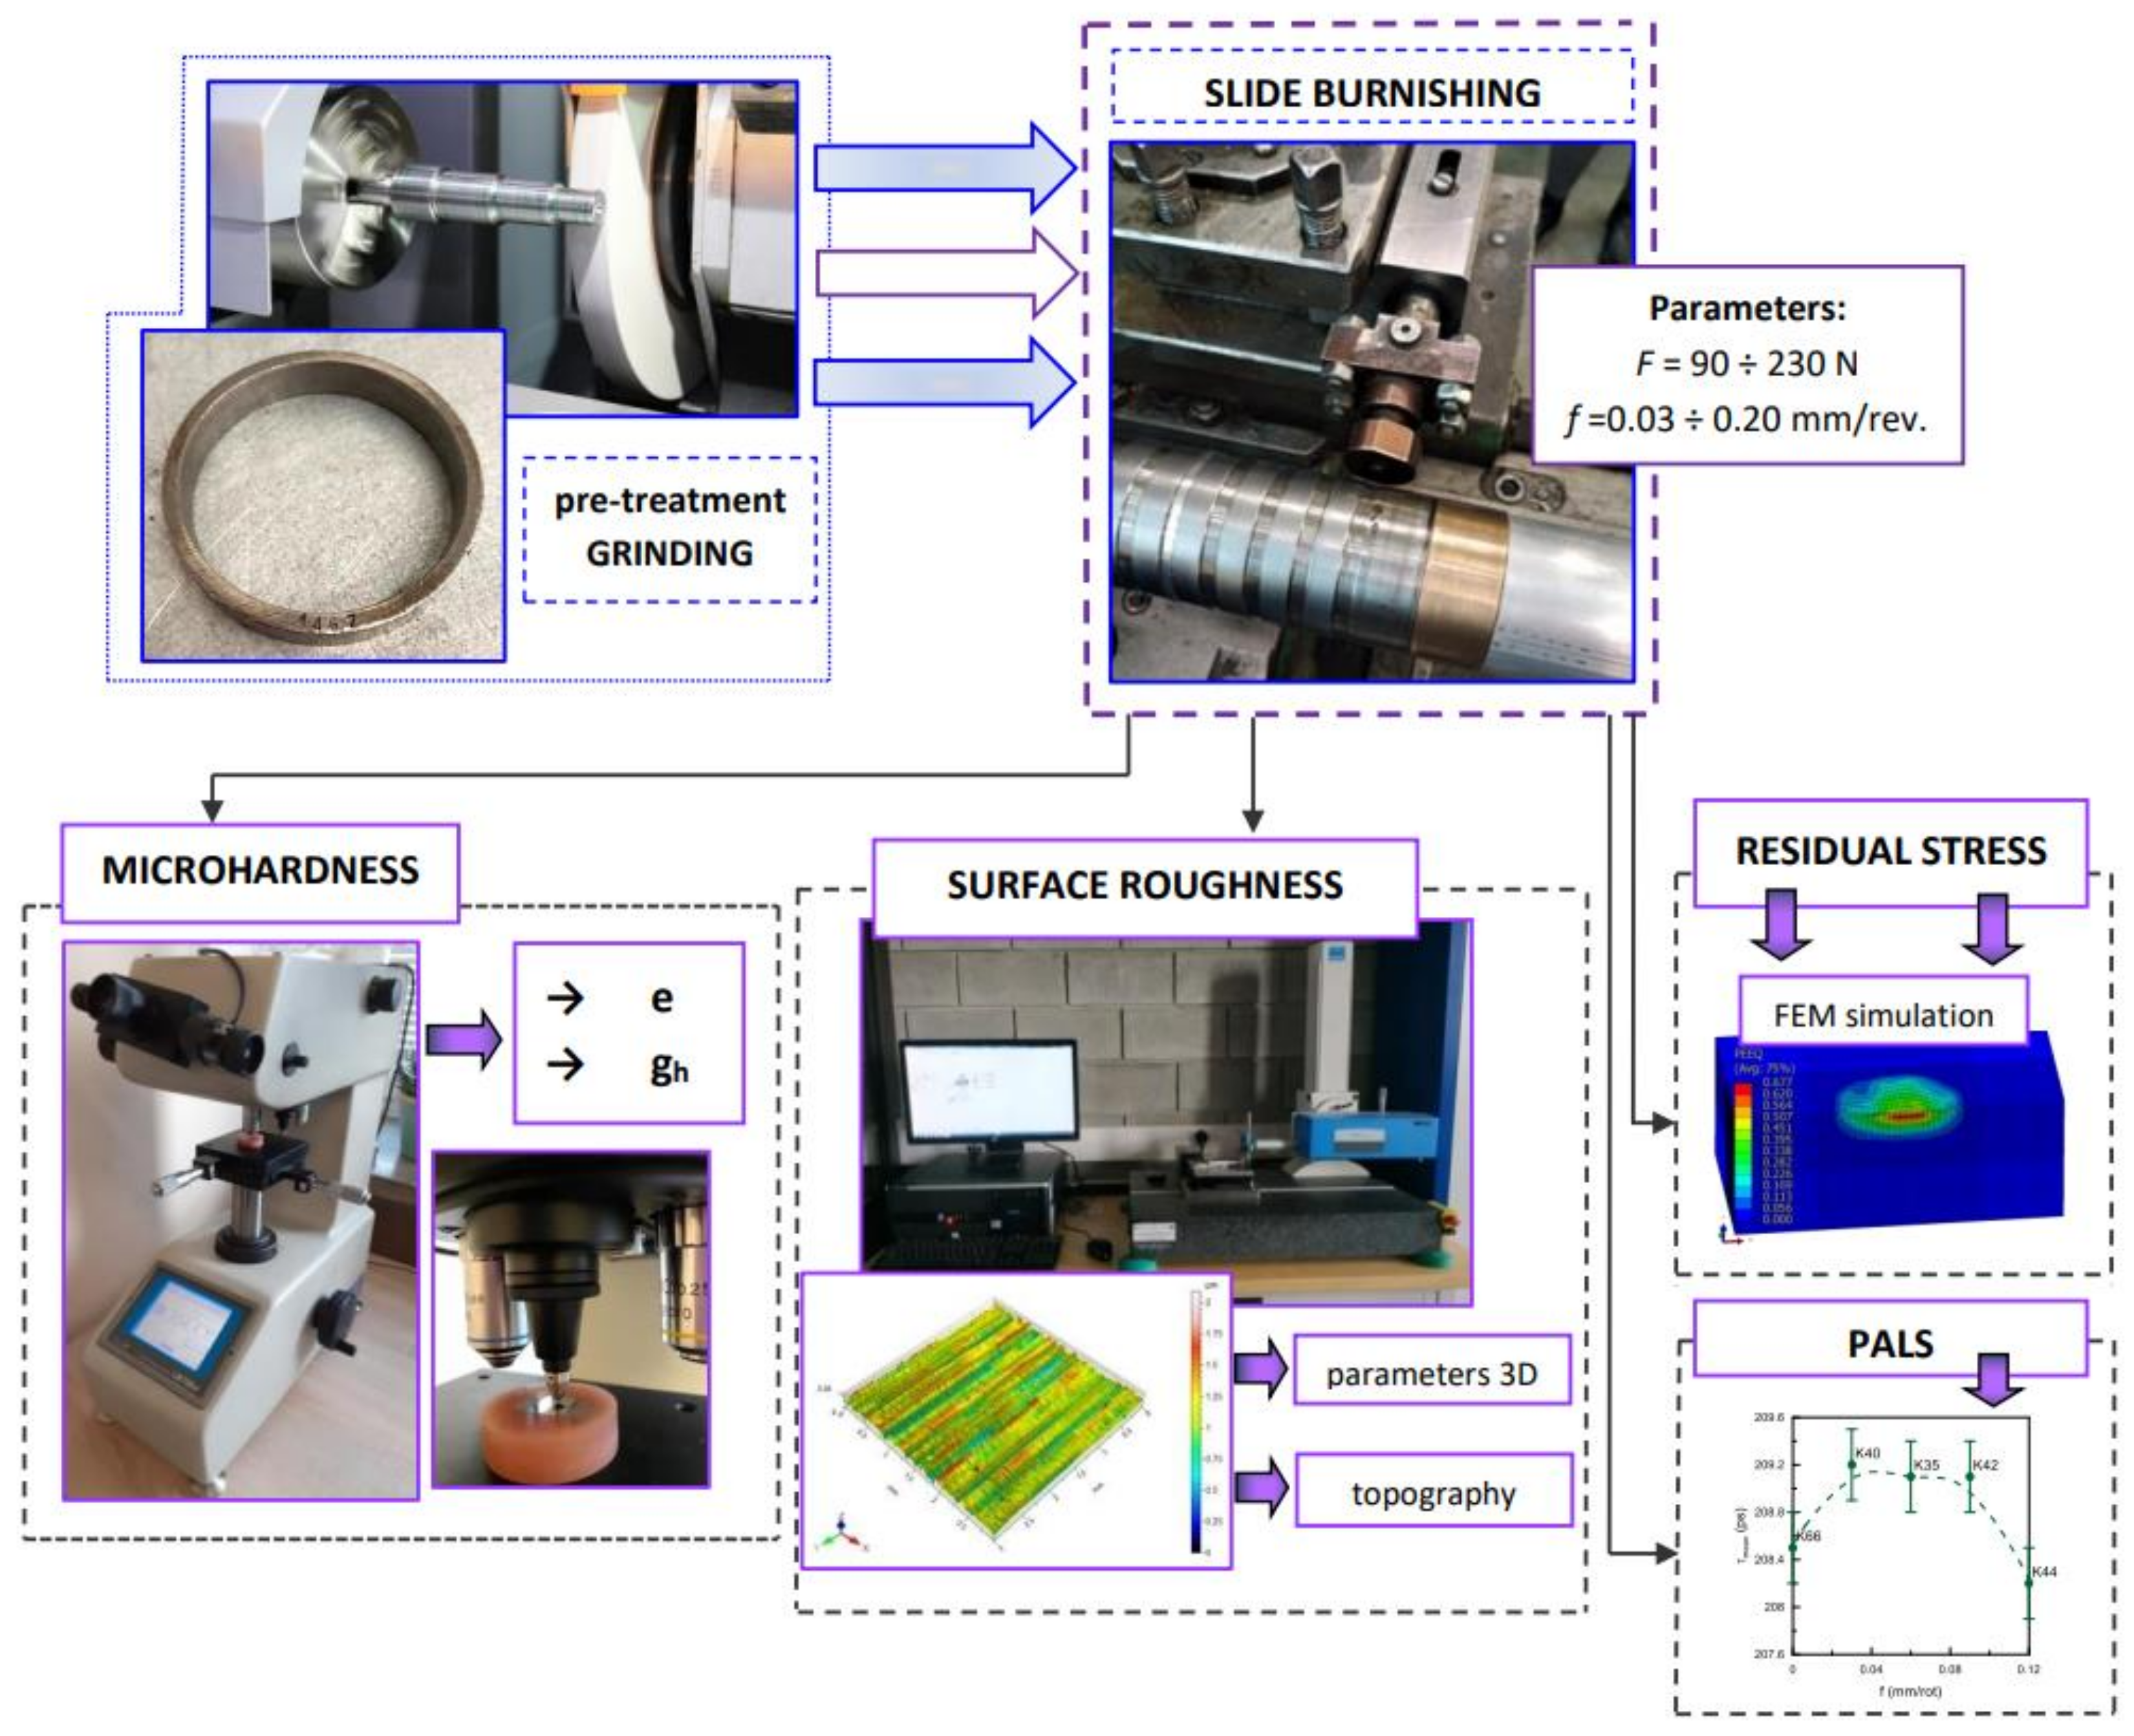
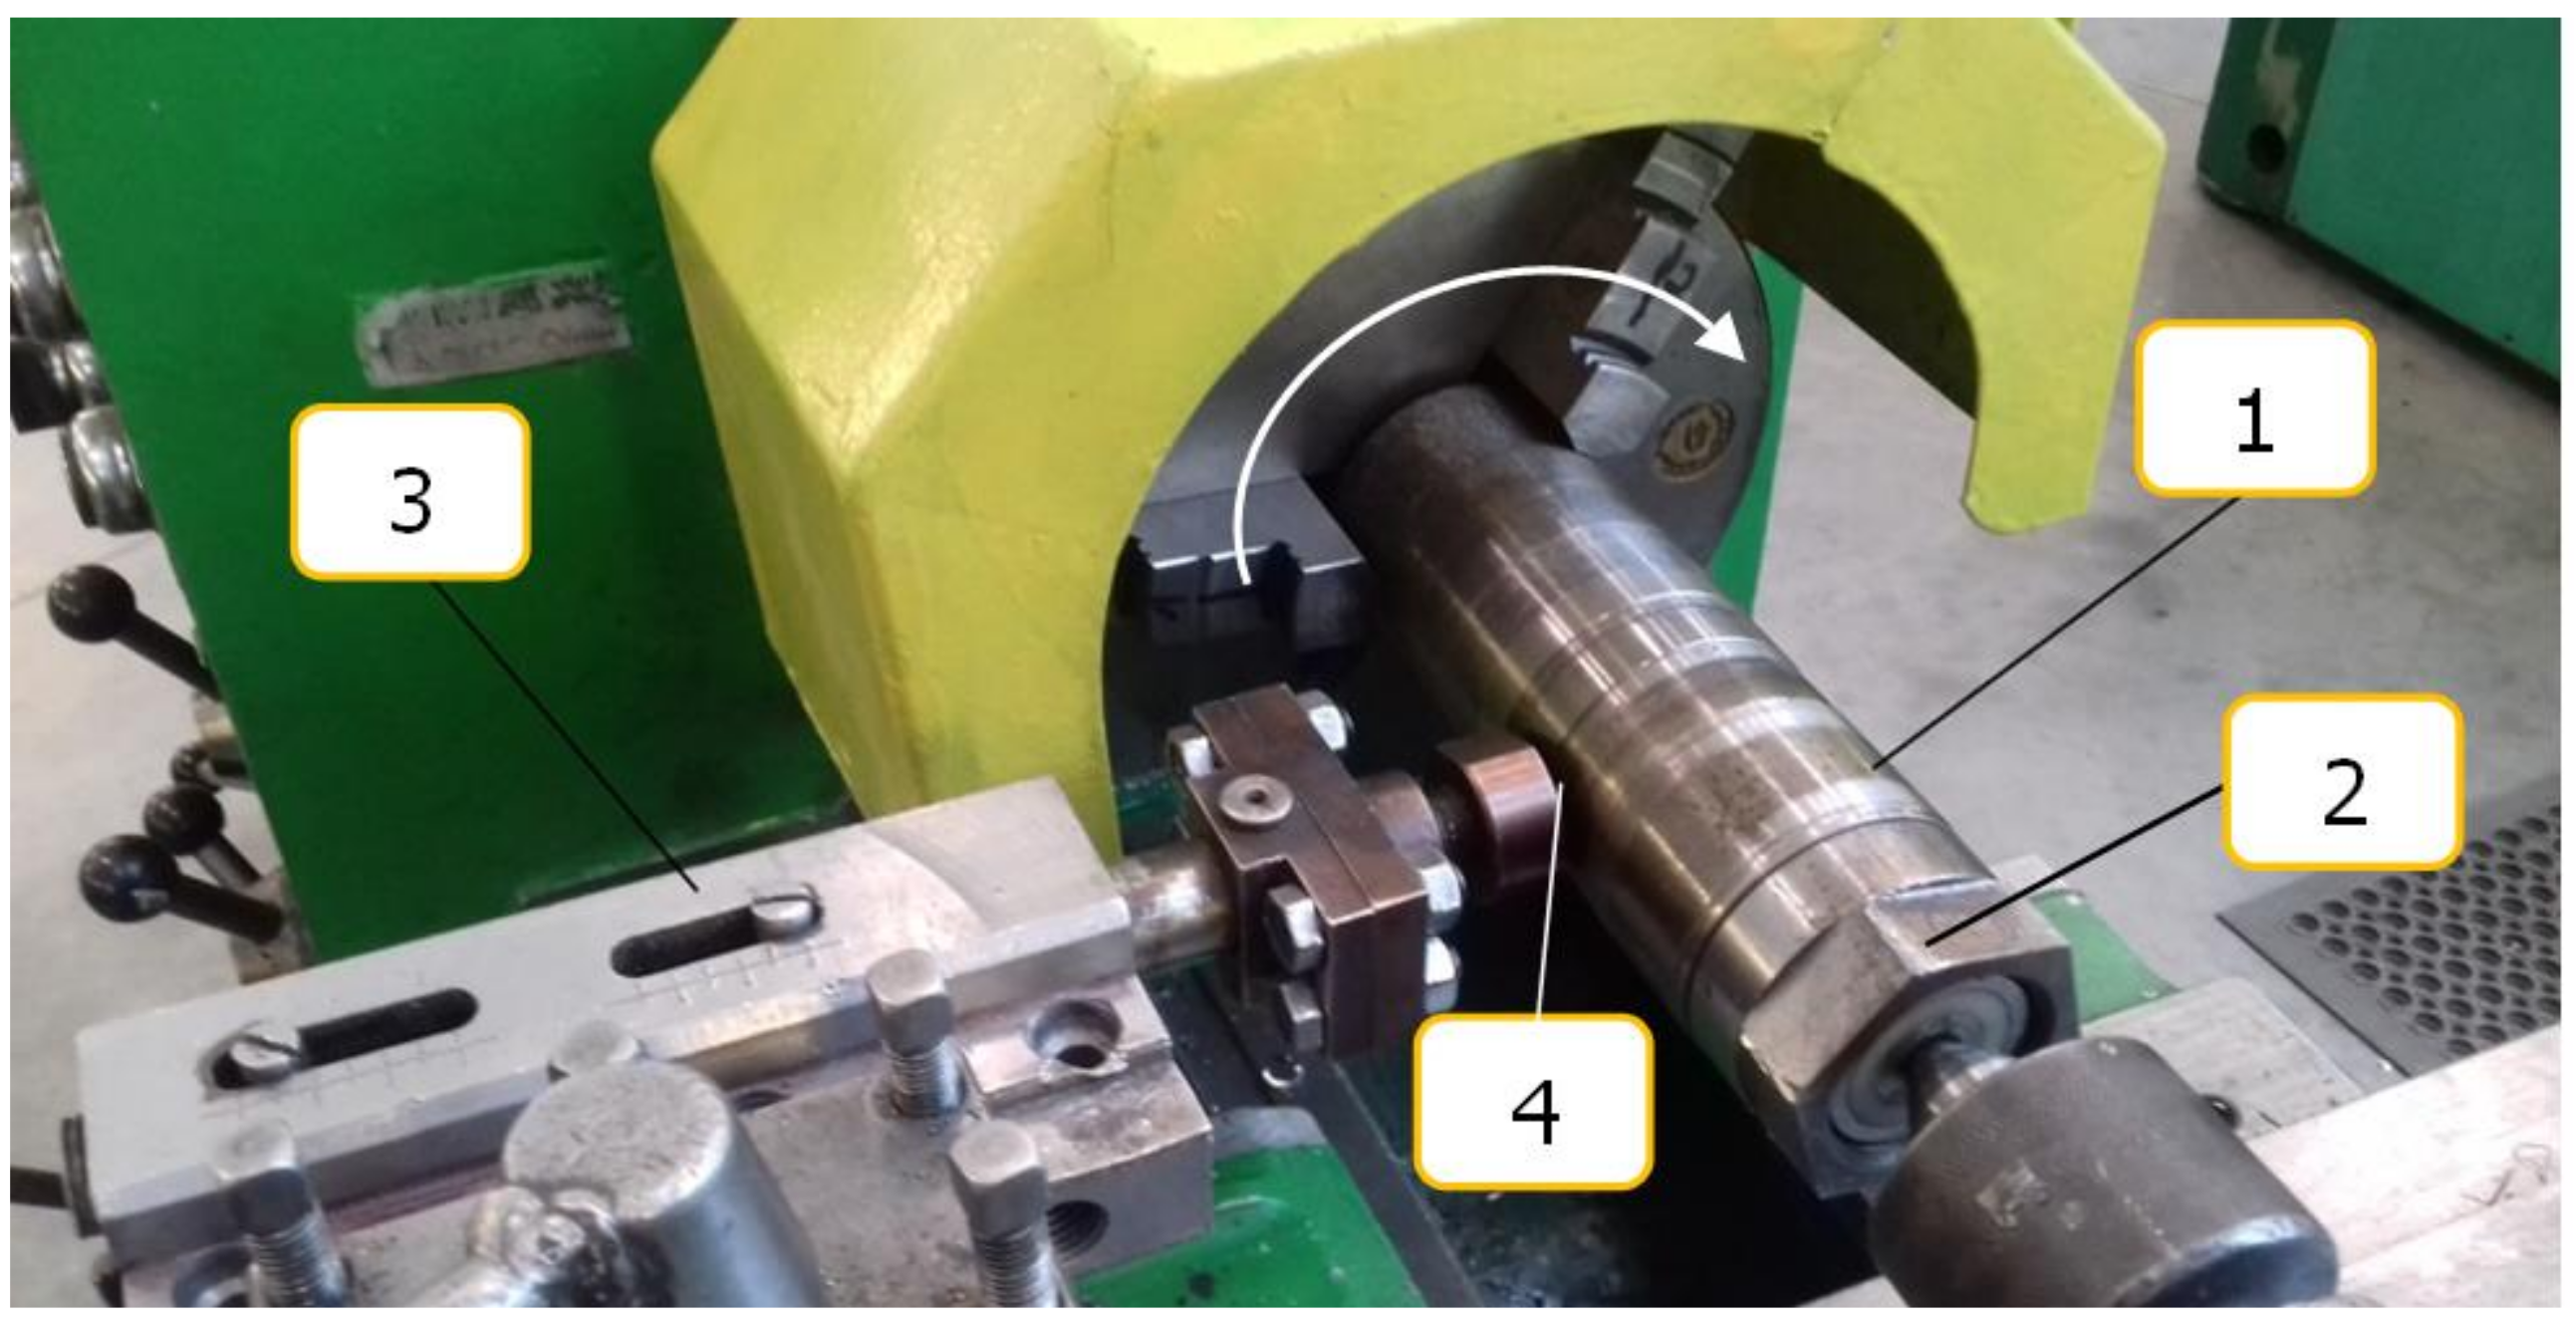
2. Materials and Methods
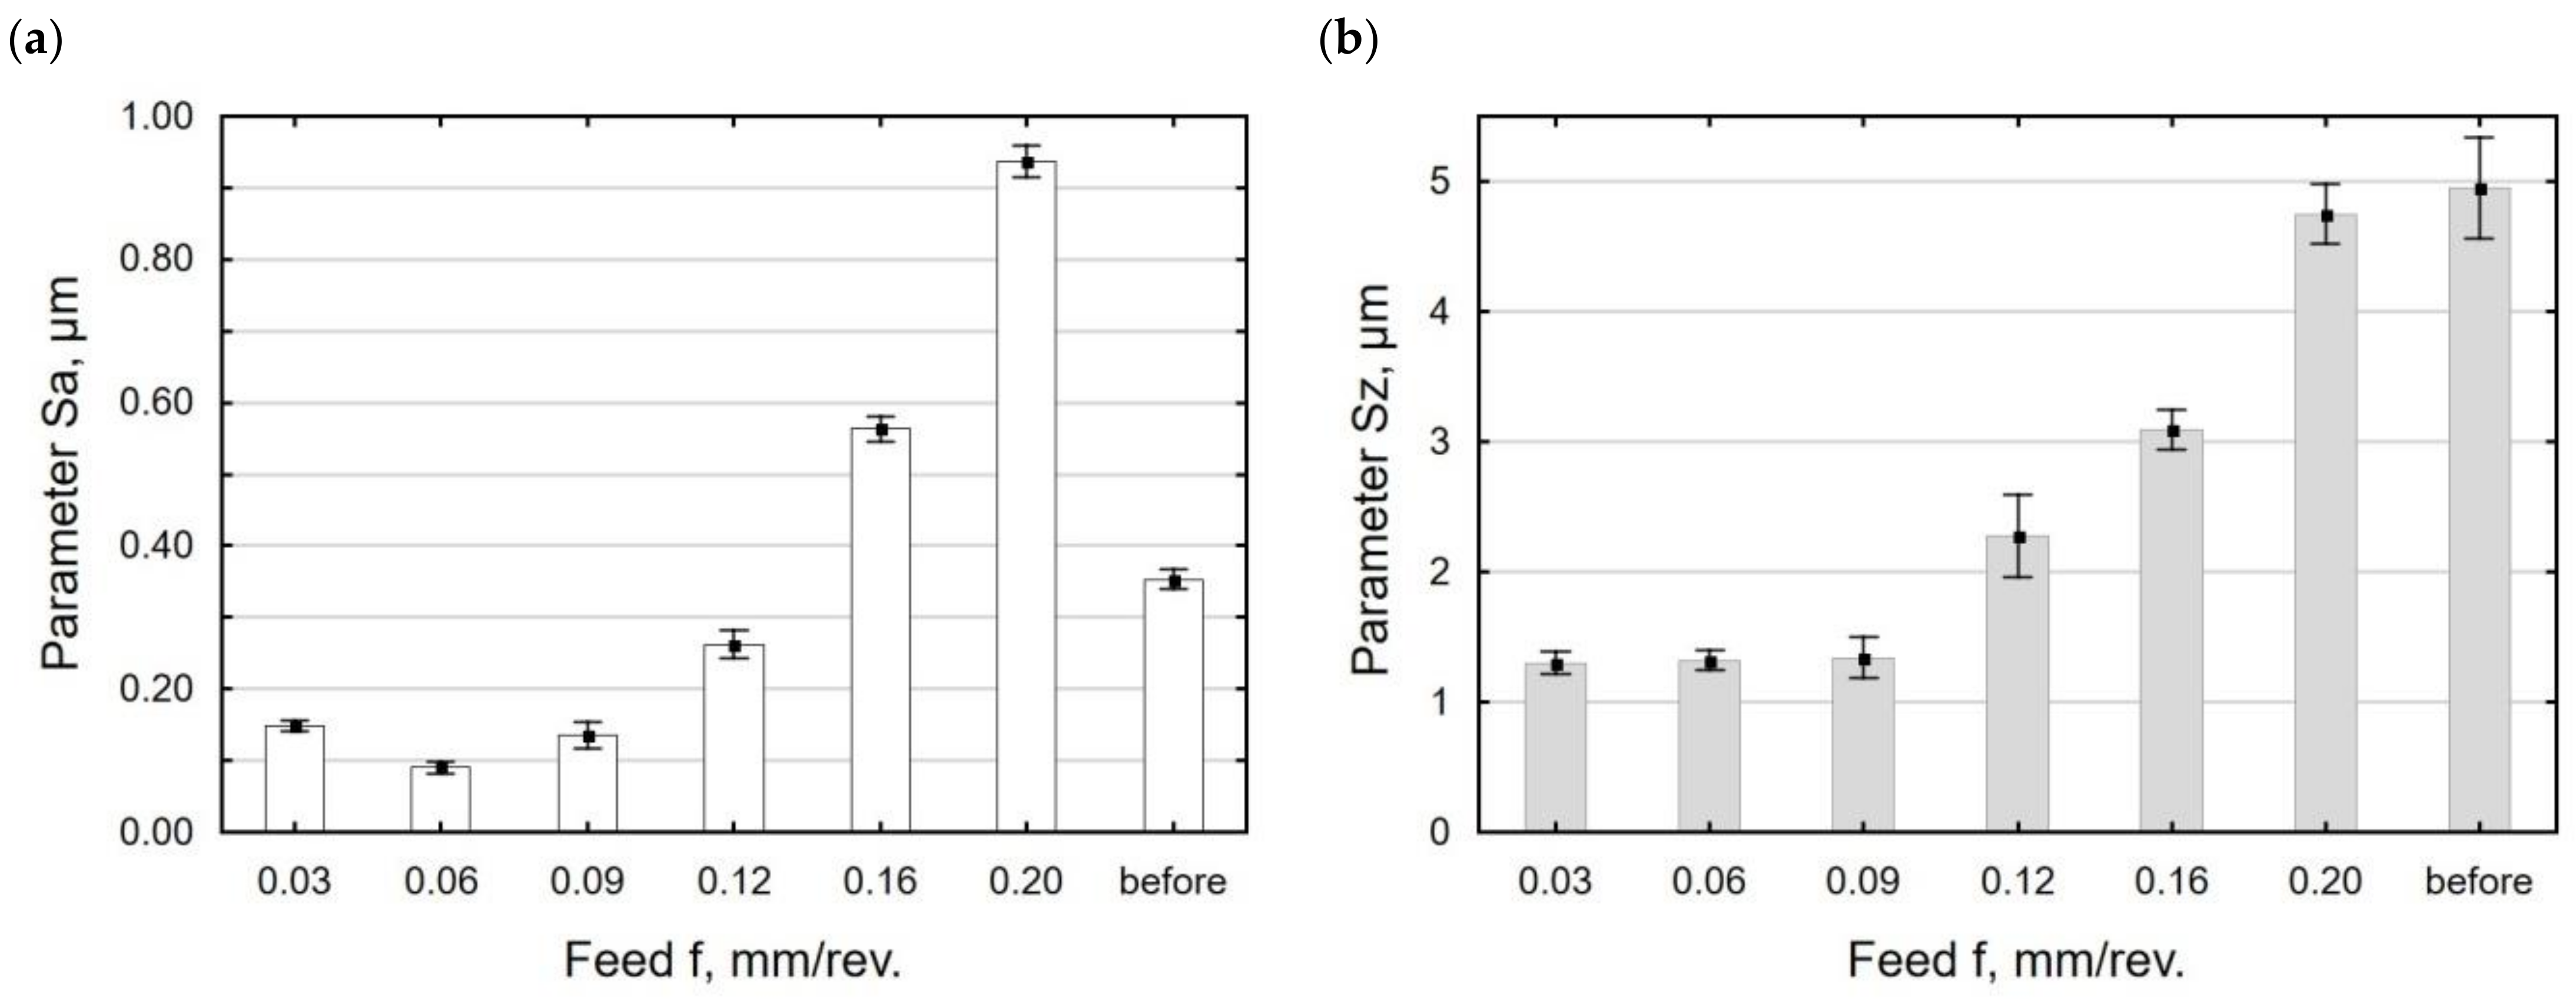
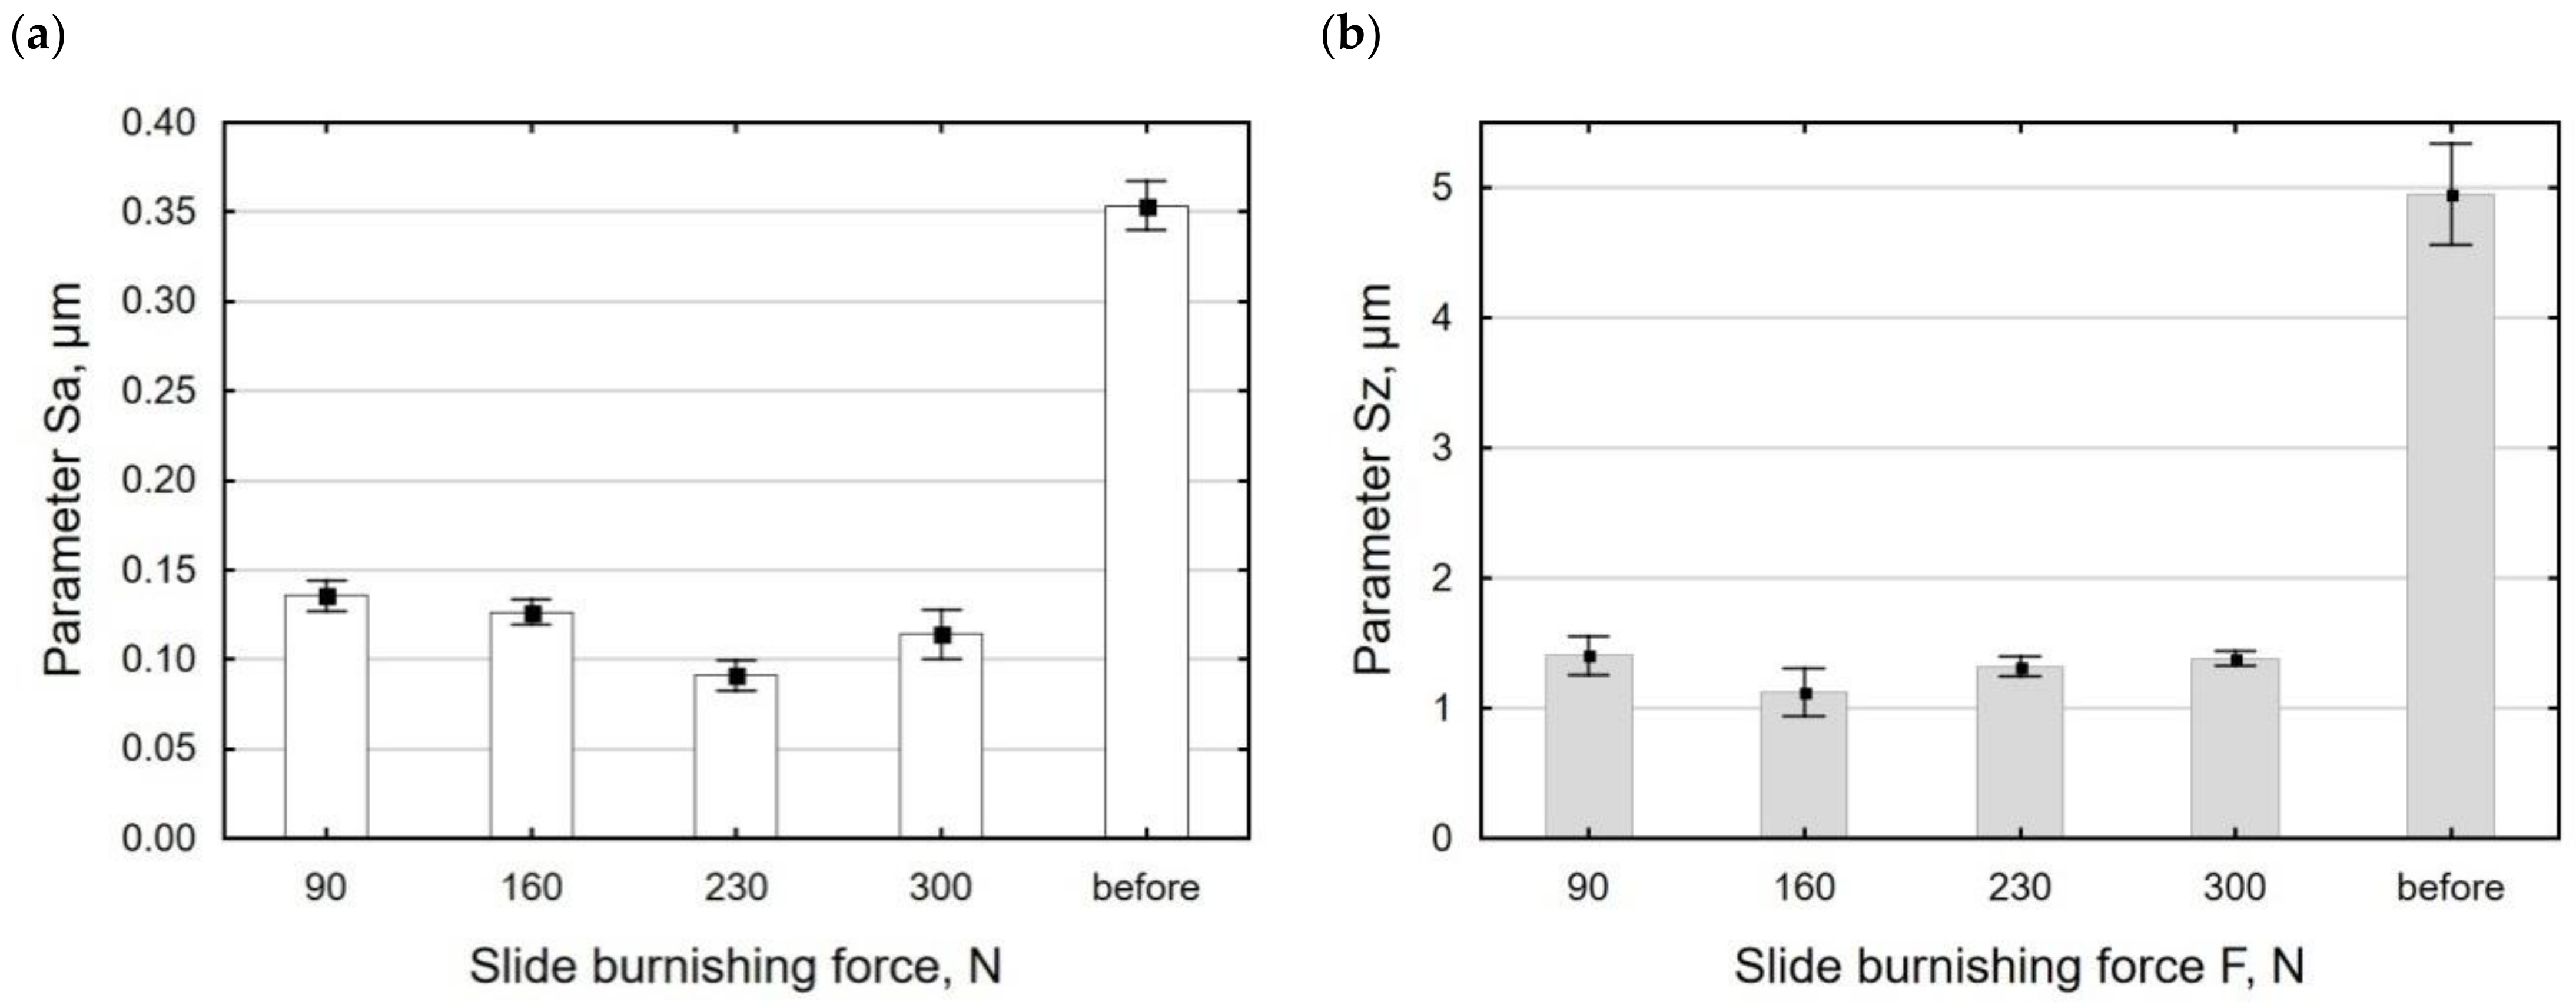
- Sa: arithmetical mean height of the surface;
- Sz: maximum height of the surface;
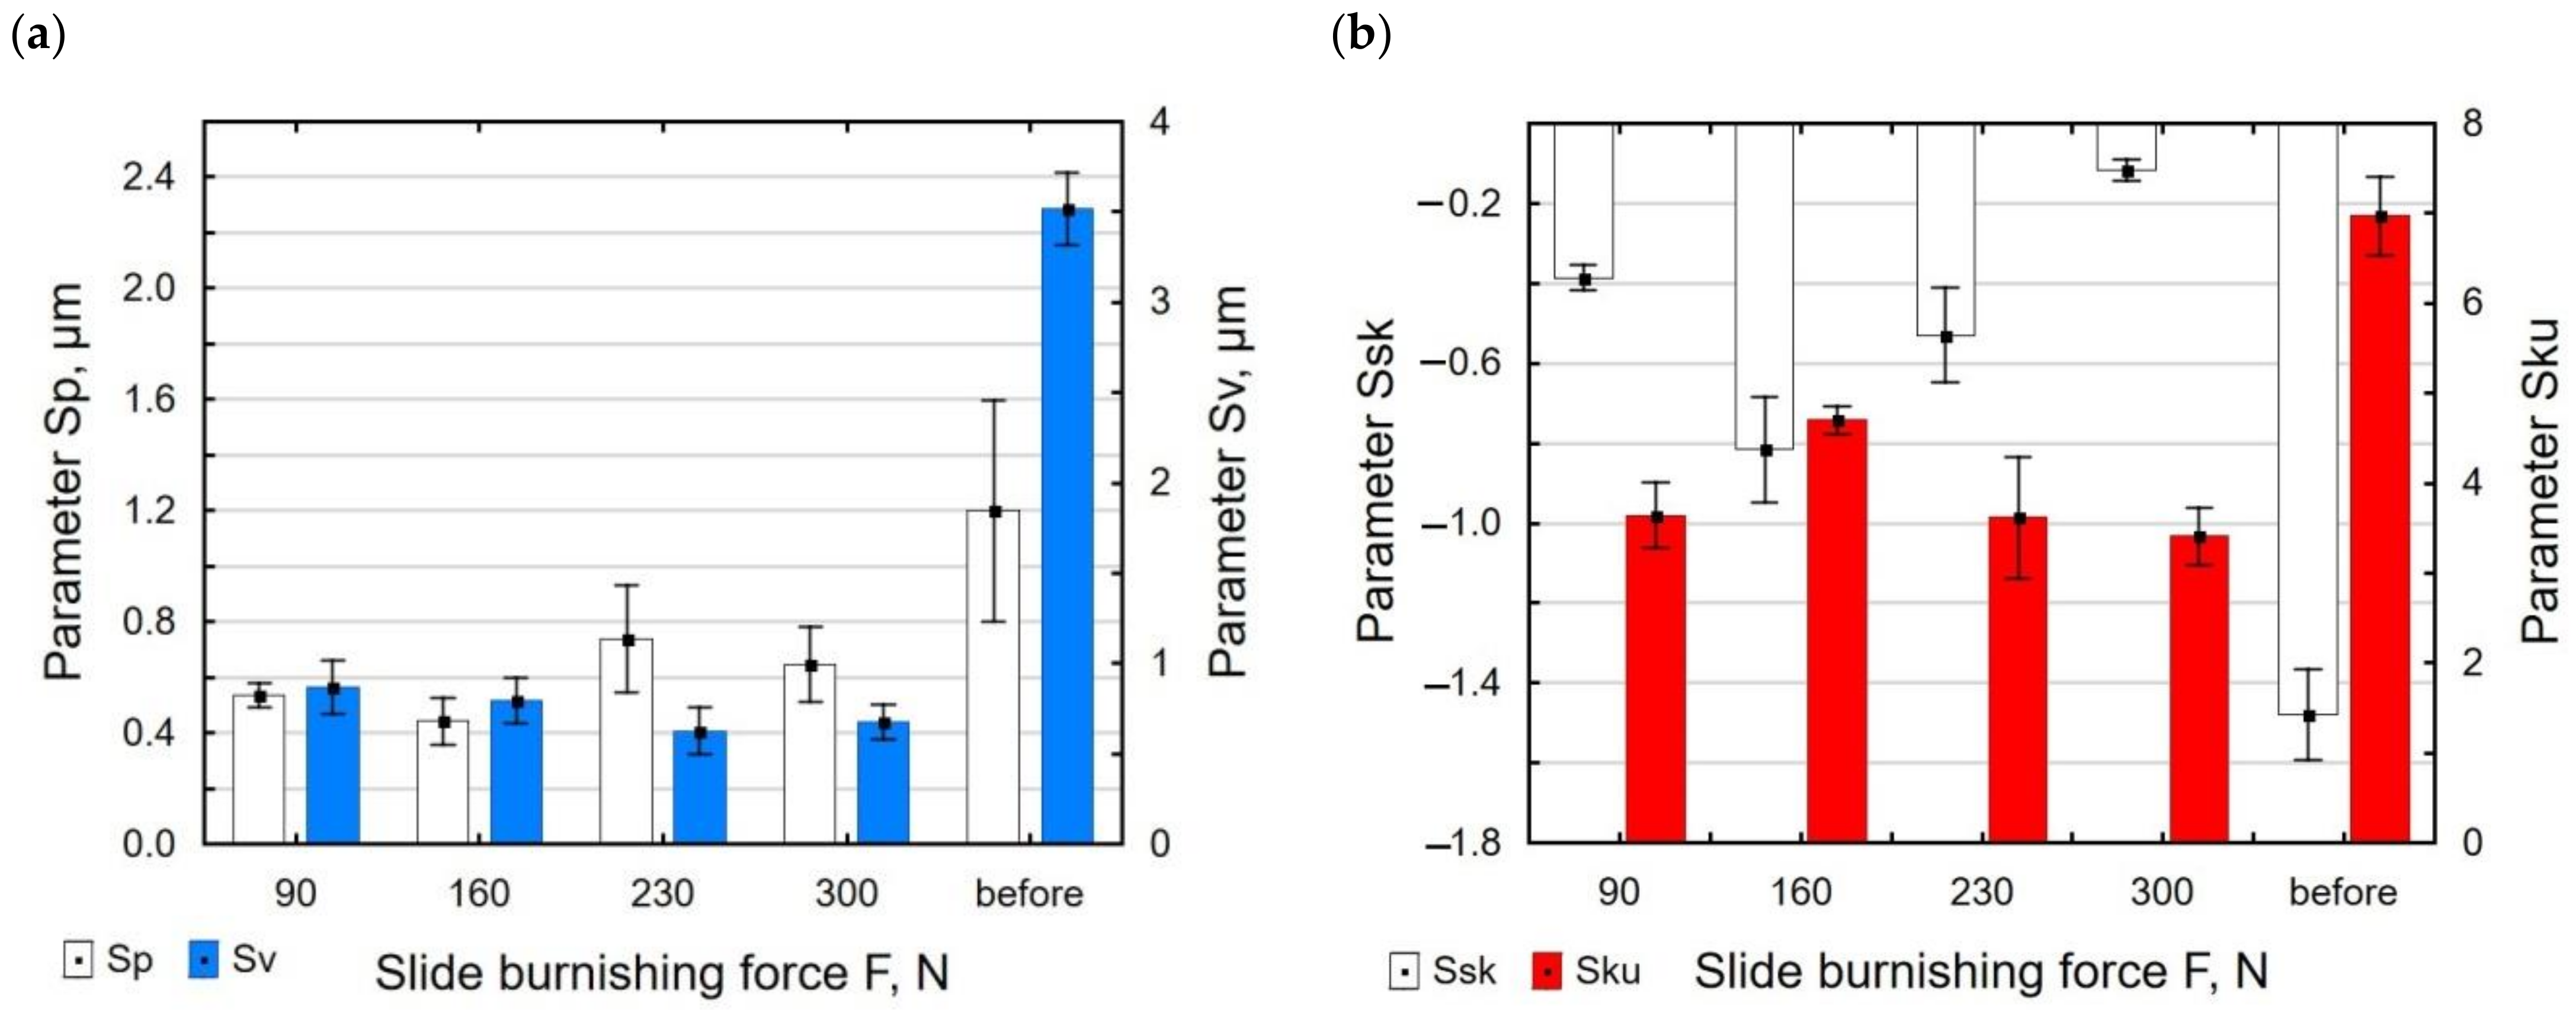
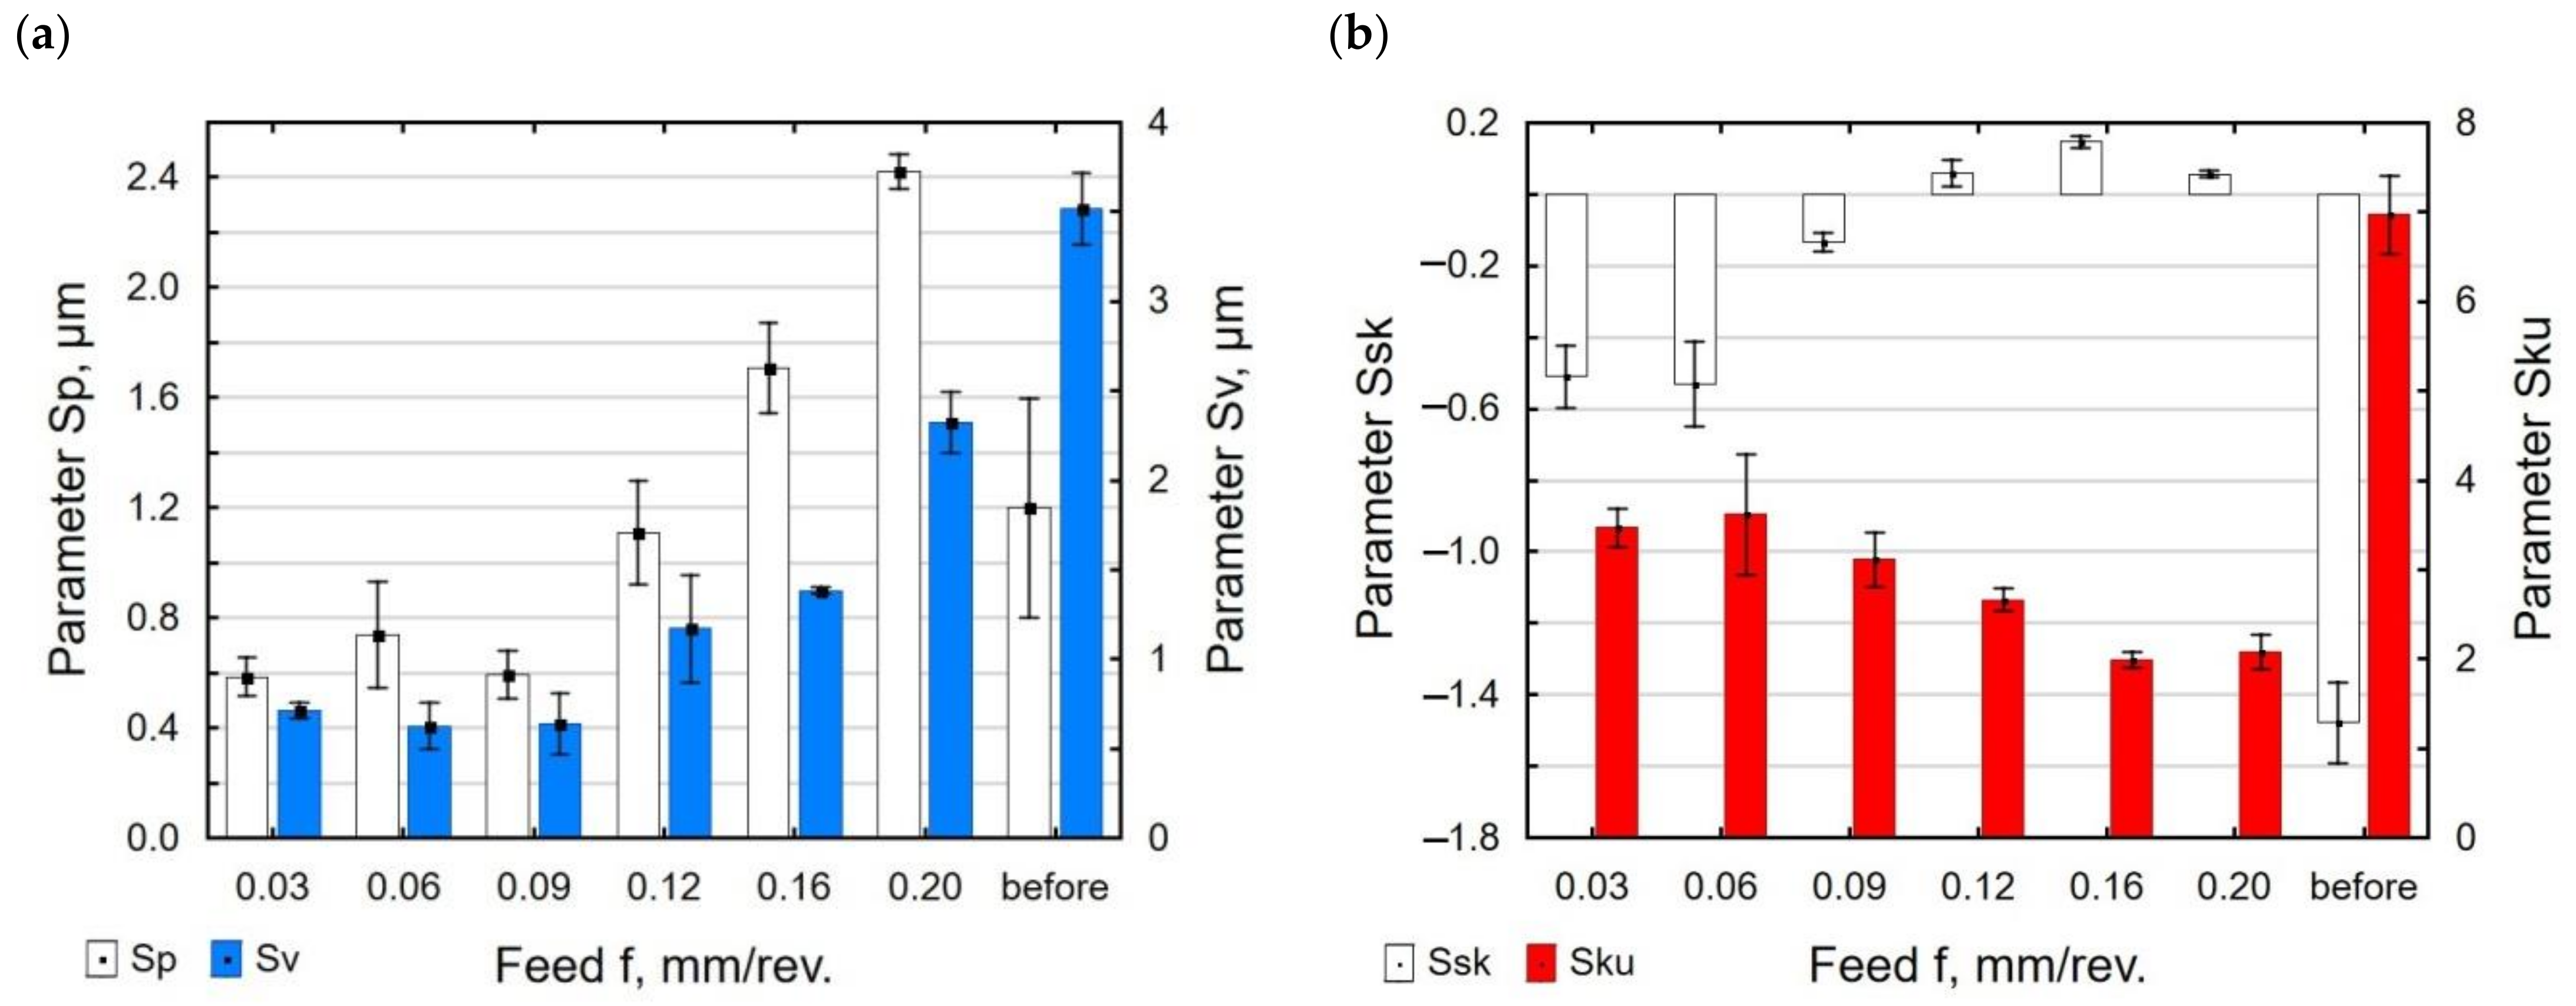
- Sp: maximum peak height of the surface;
- Sv: maximum pit height of the surface;
- Ssk: skewness;
- Sku: kurtosis
3. Results and Discussion
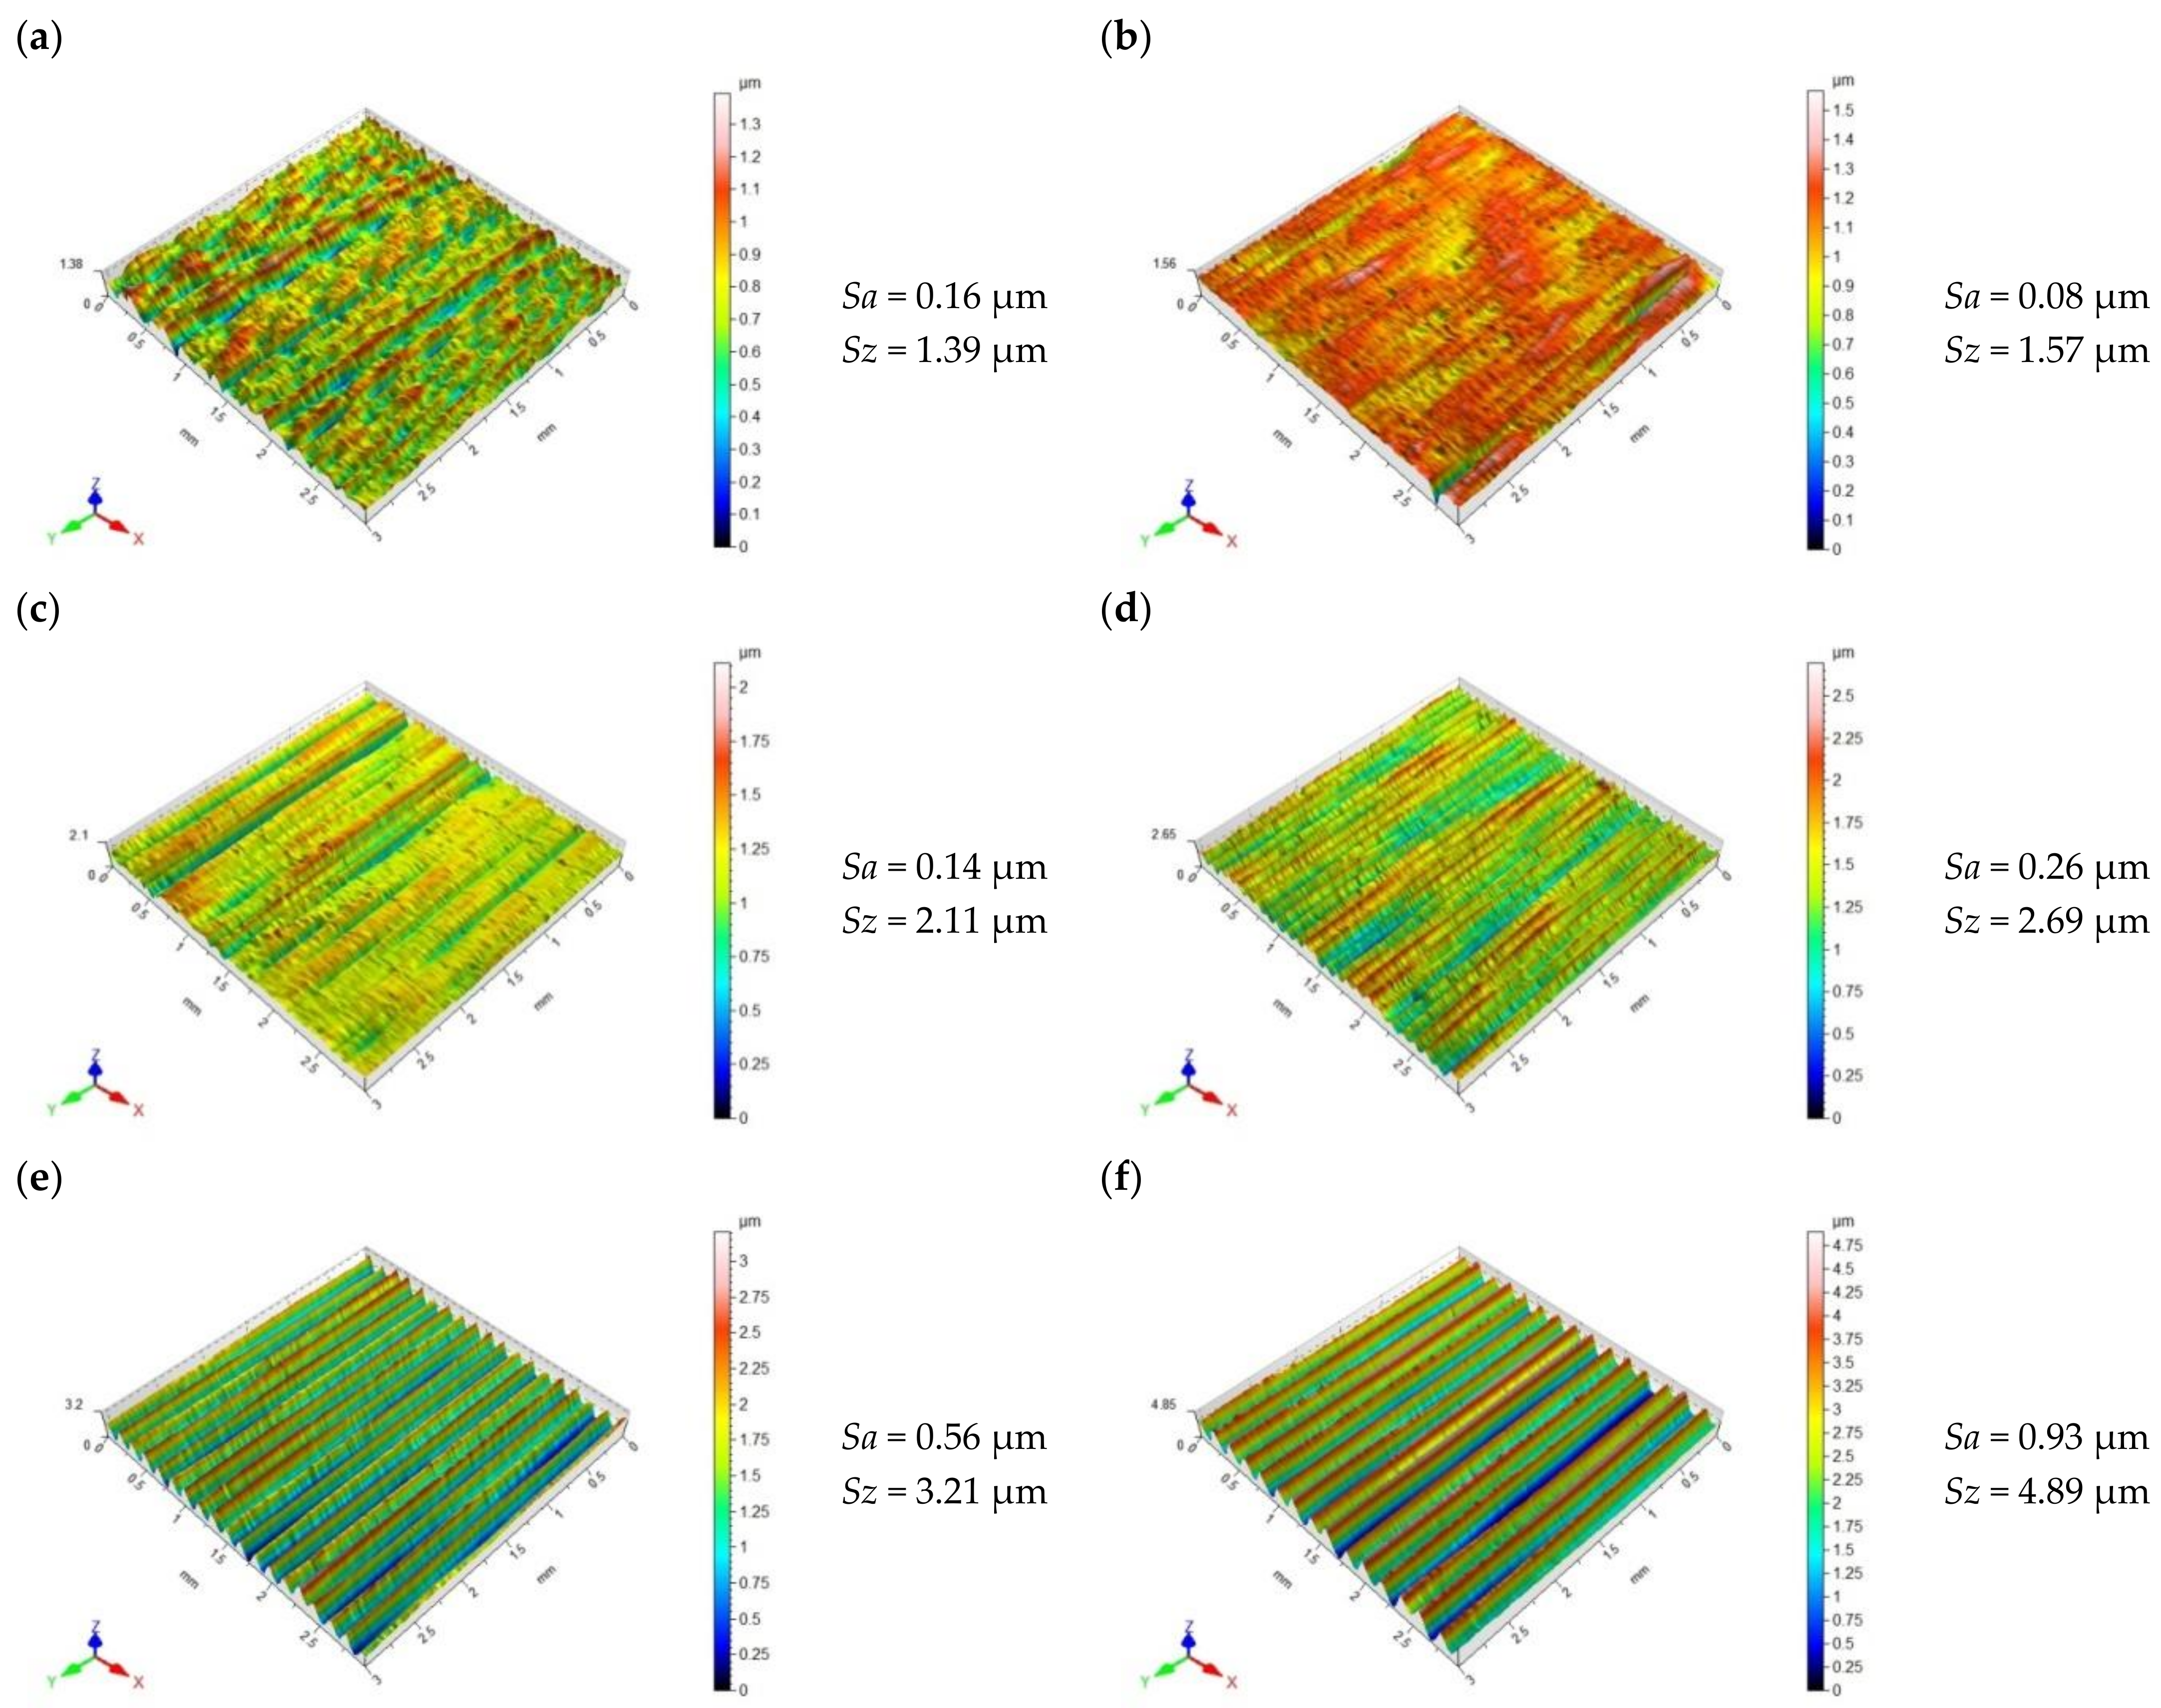
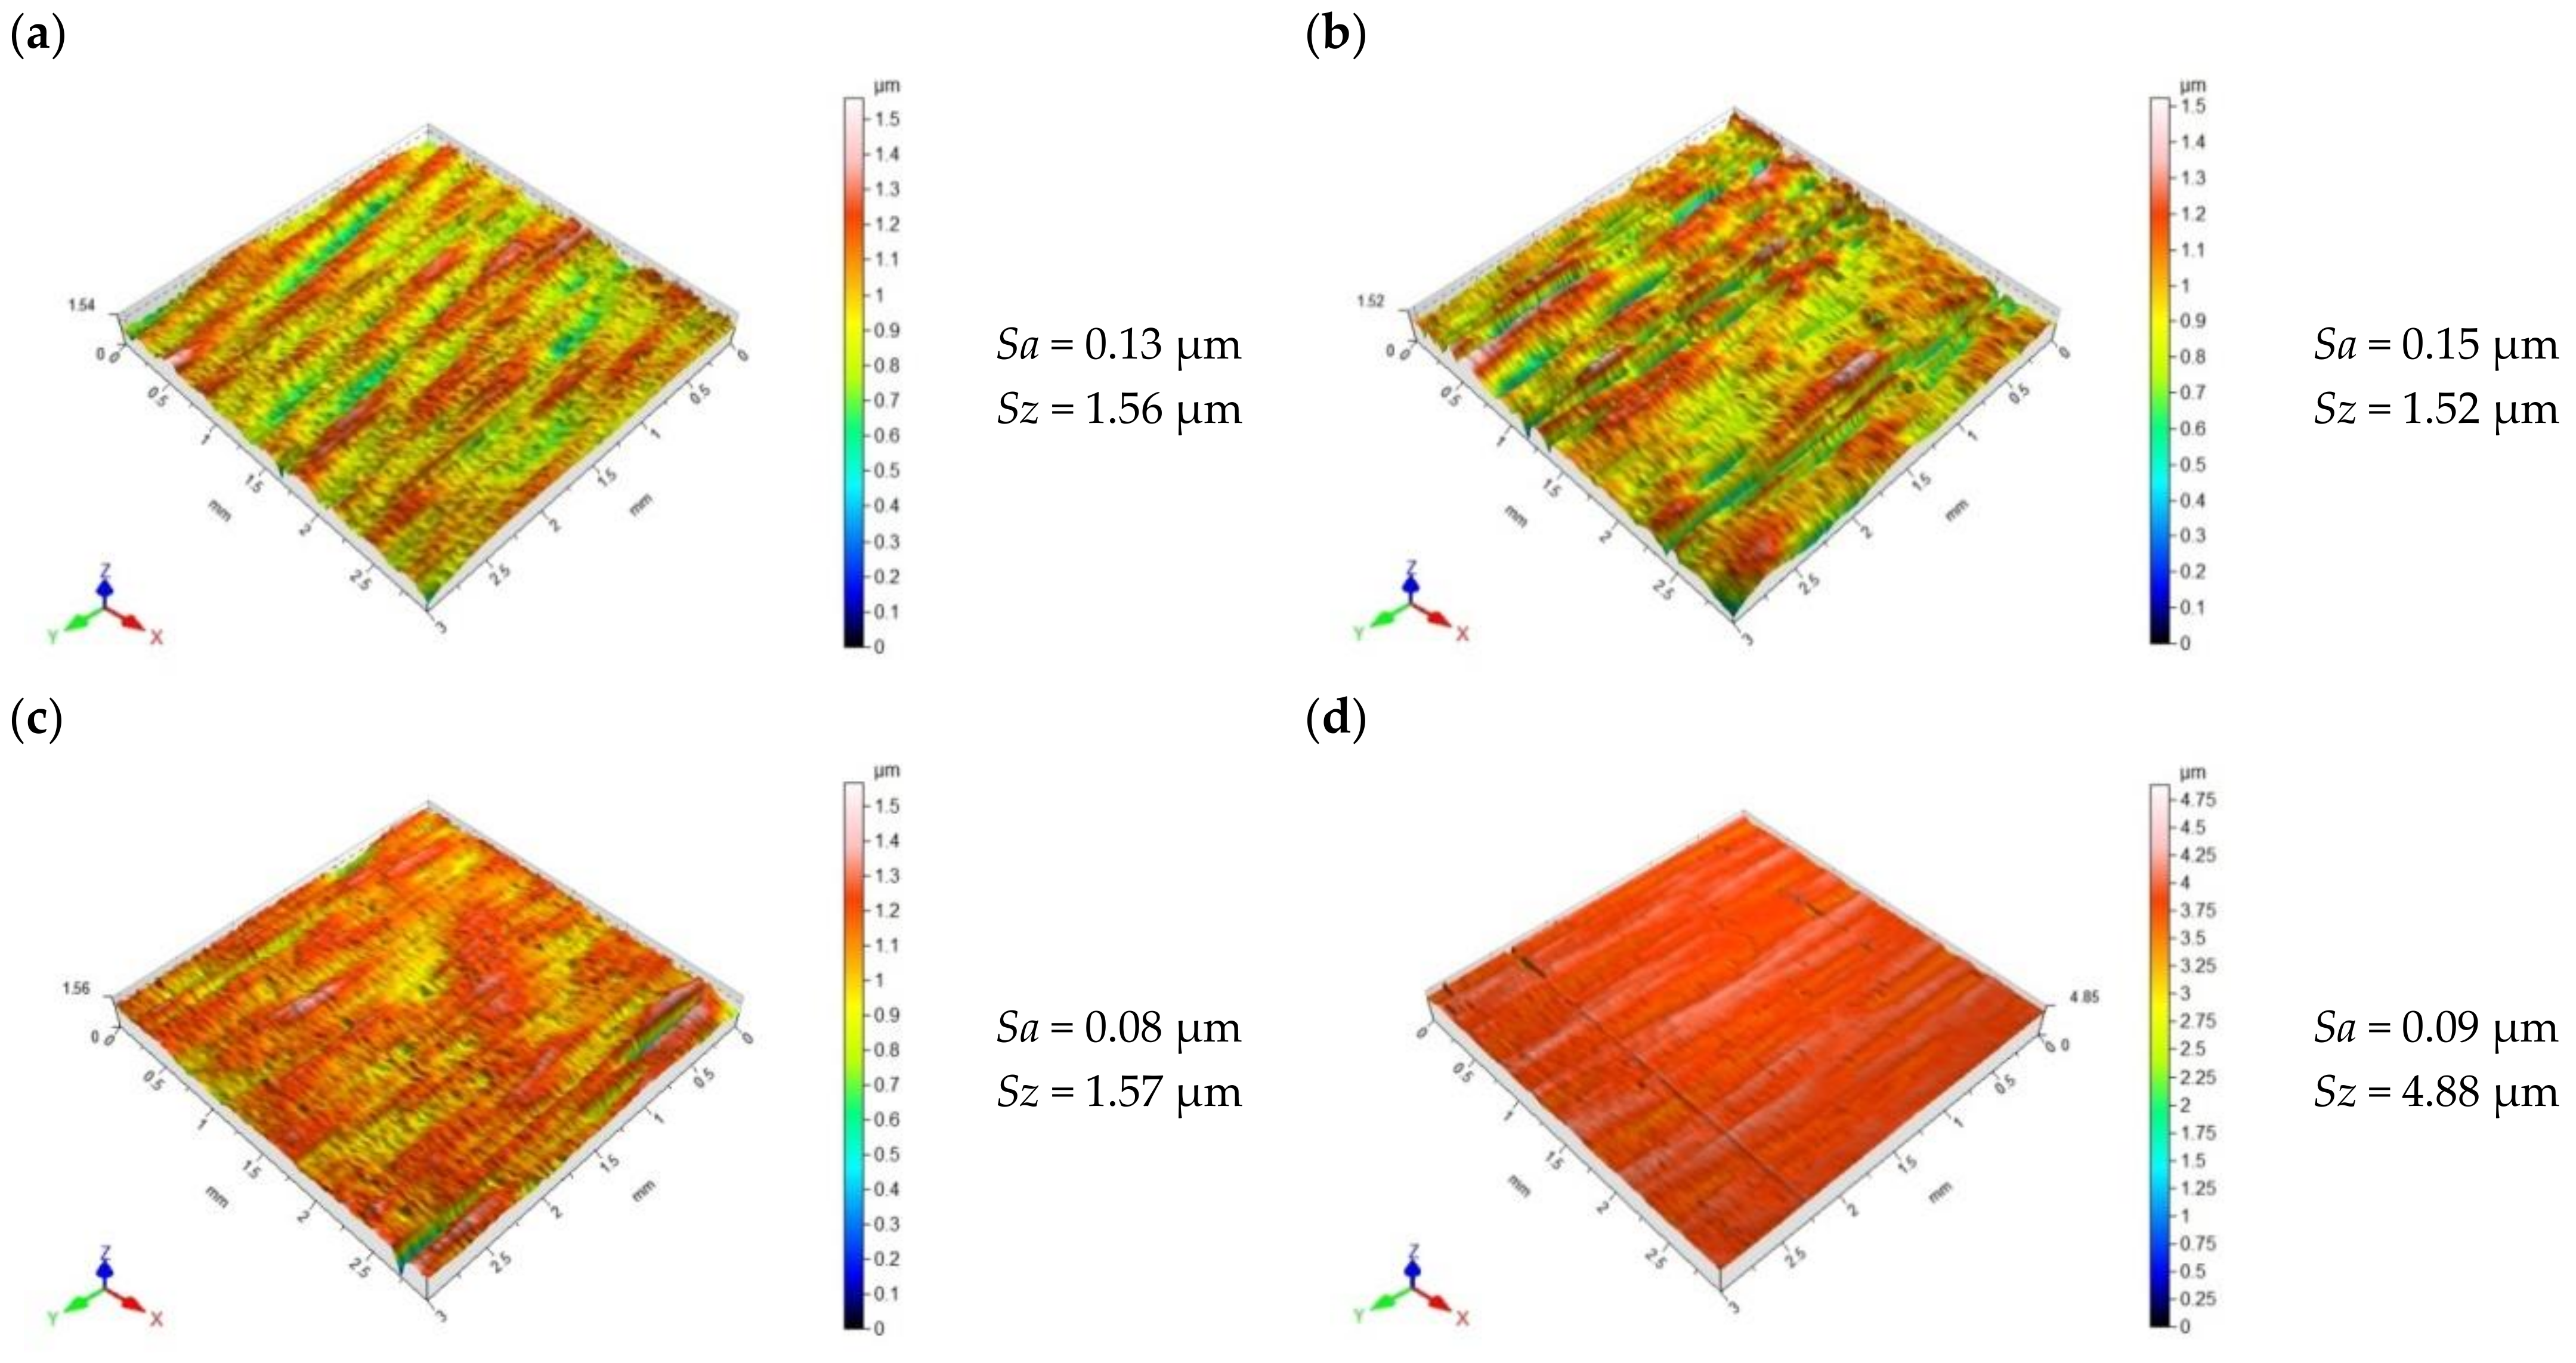
3.1. Topography and Surface Roughness
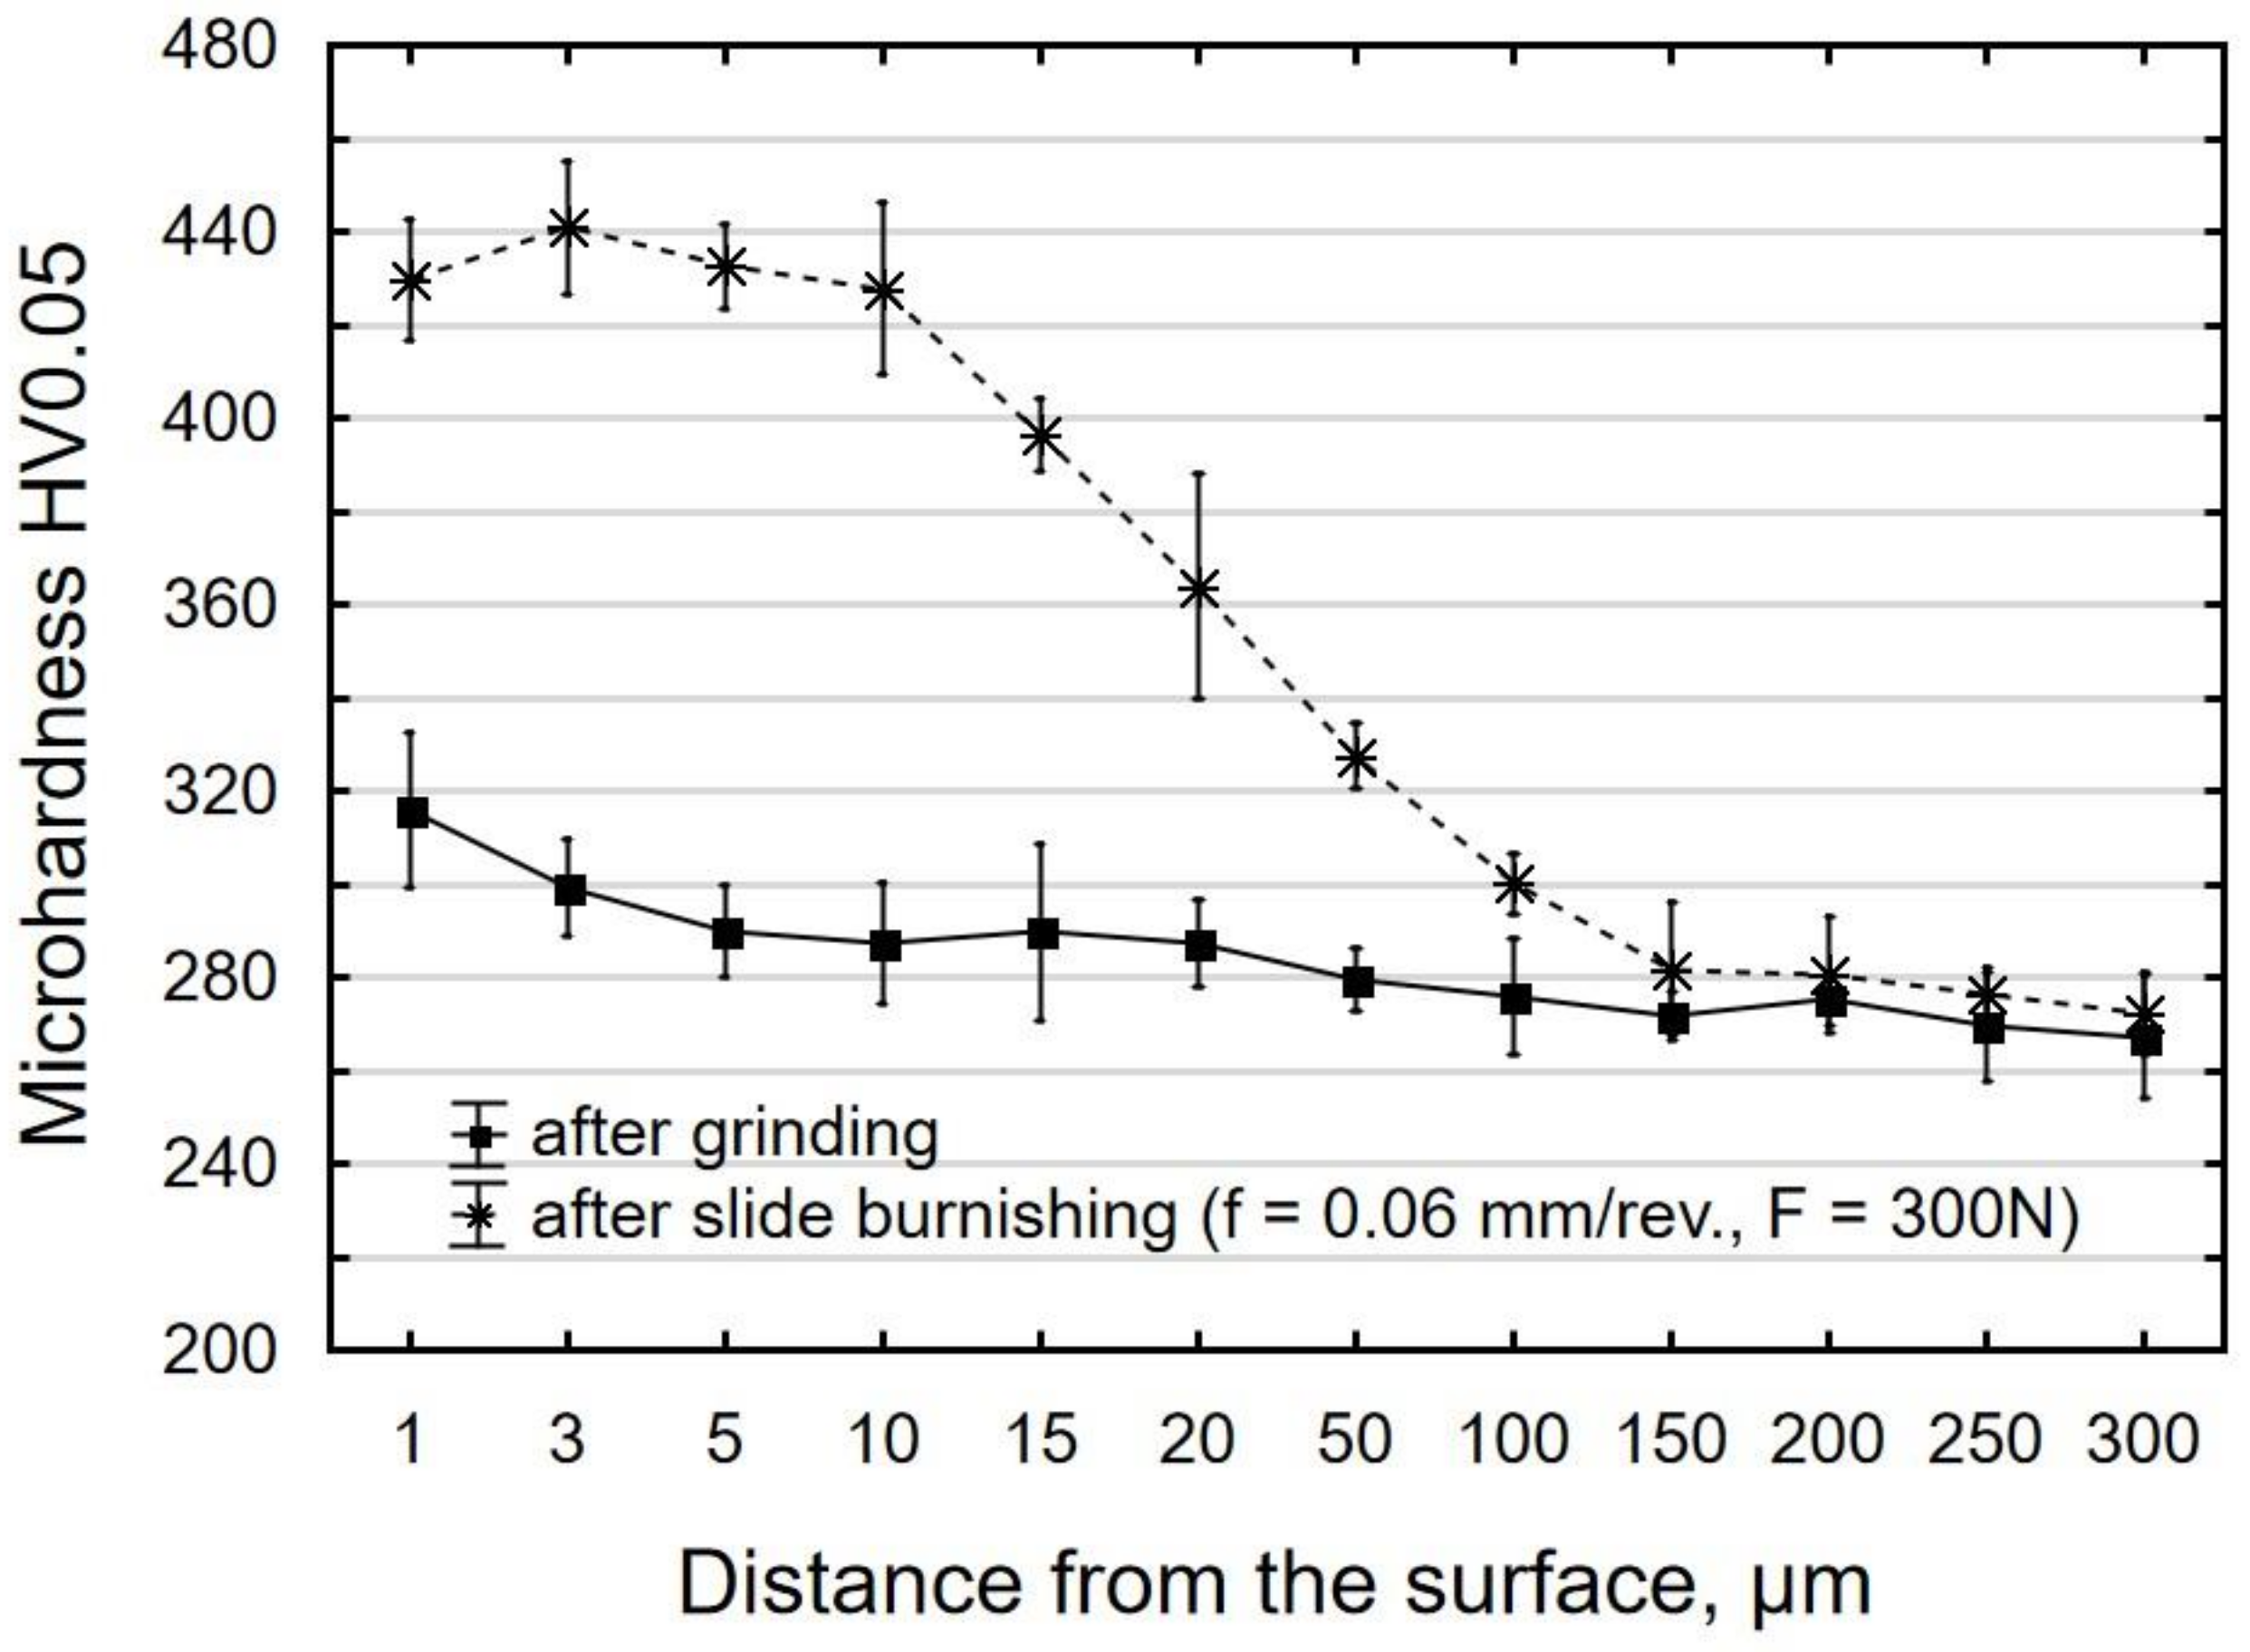
3.2. Microhardness
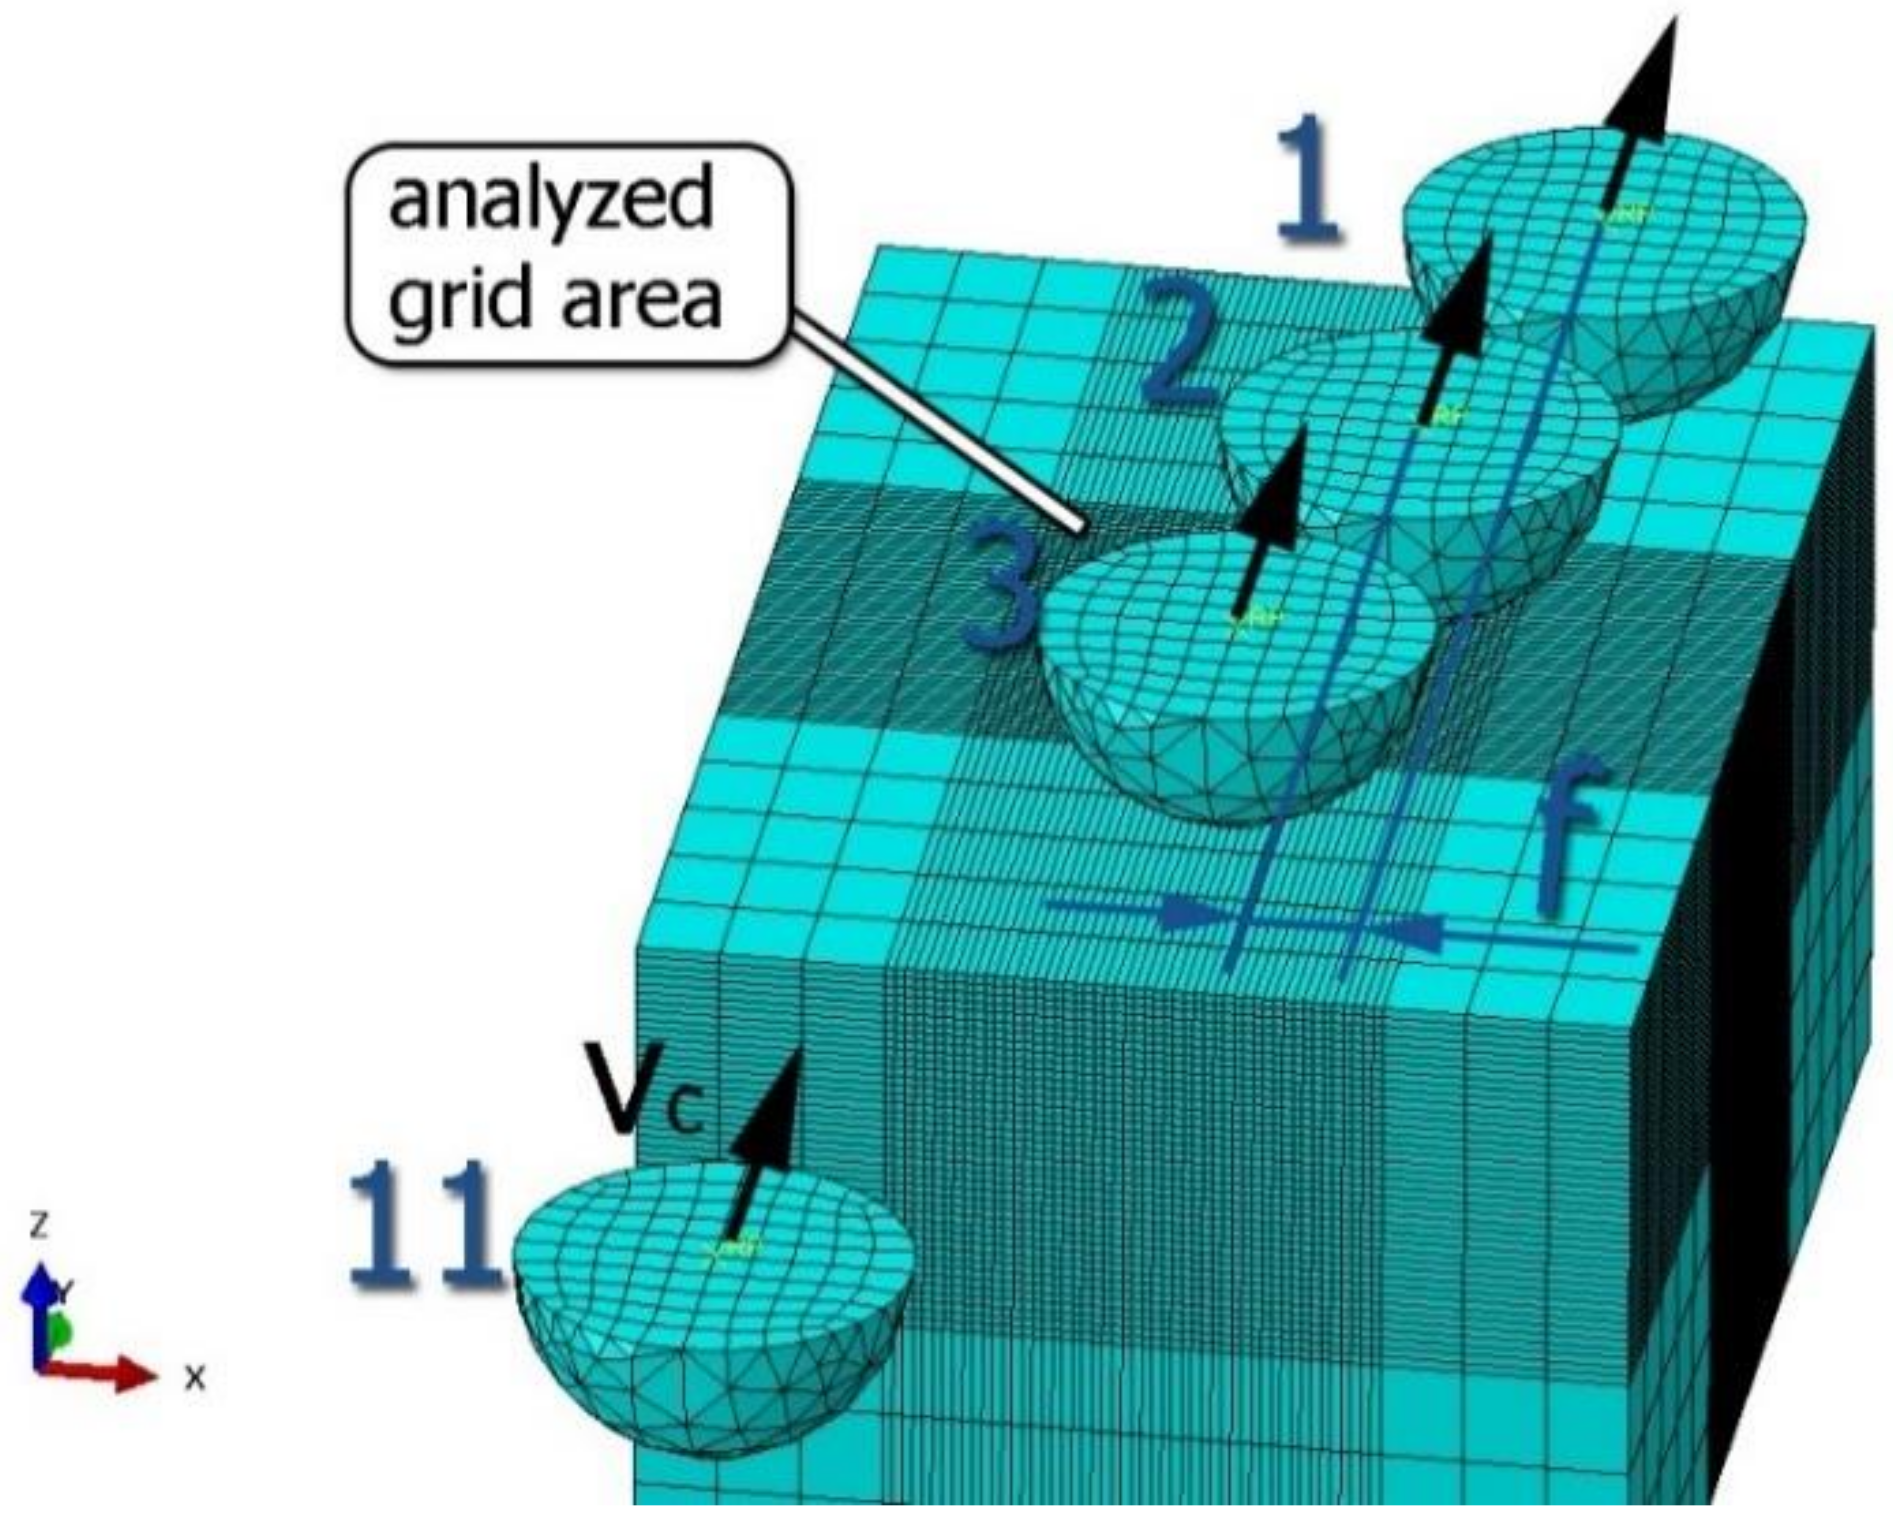
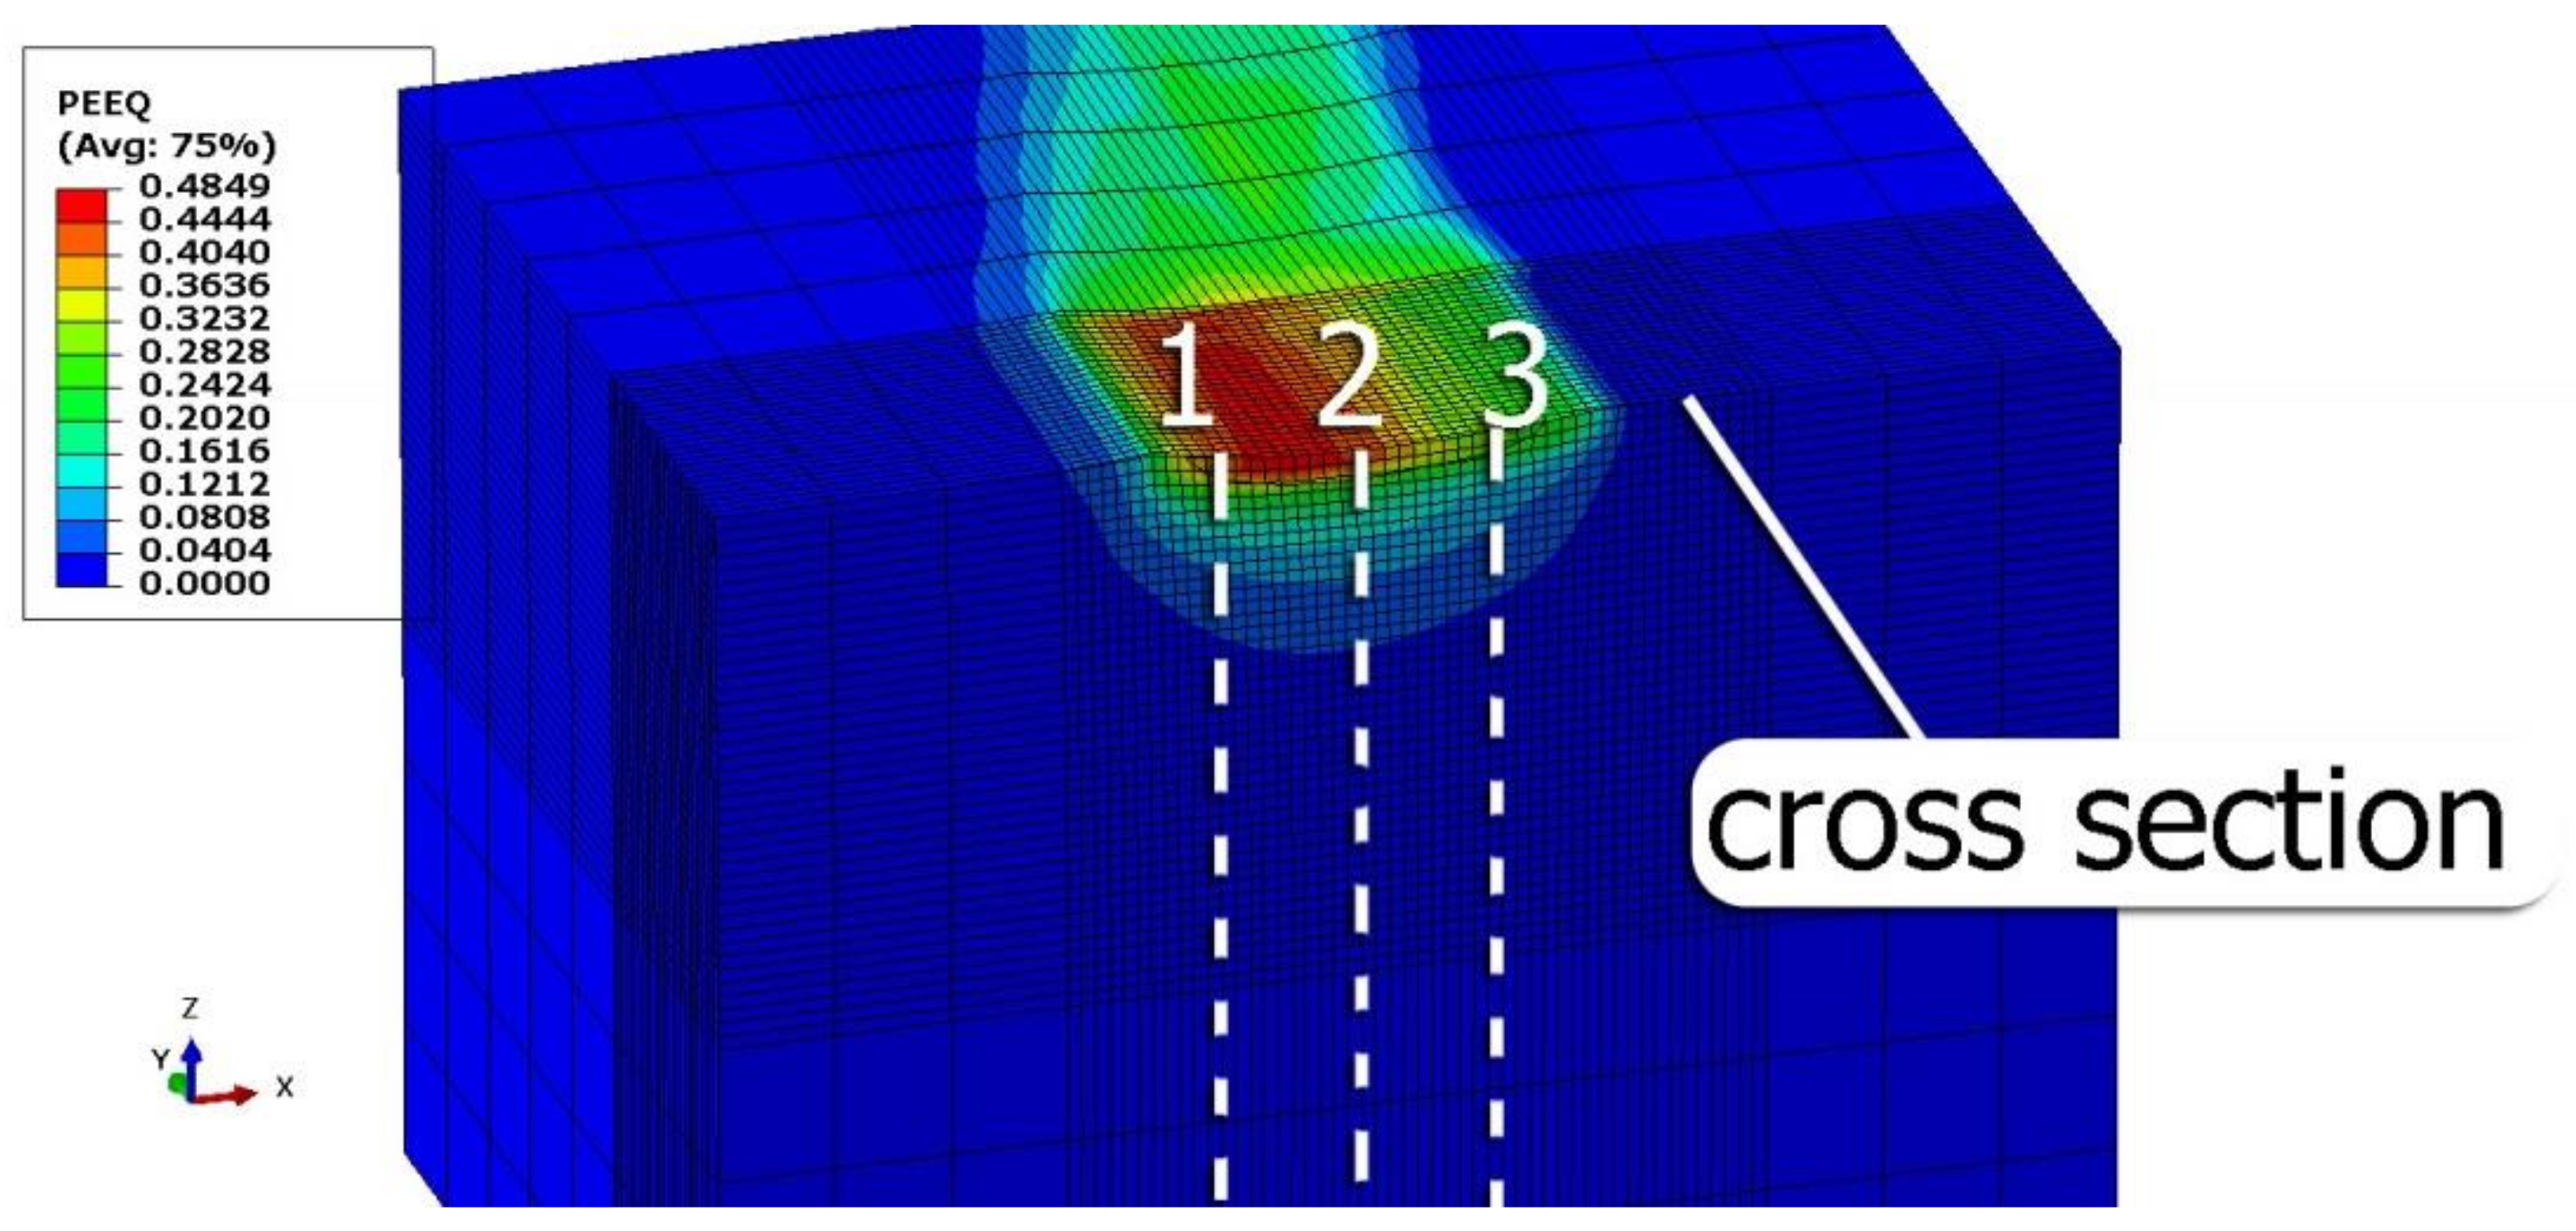
3.3. Residual Stress
3.4. Positron Annihilation Lifetime Spectroscopy
4. Conclusions
- The use of the burnishing feed ranging f = 0.03–0.12 mm/rev. and slide burnishing force ranging F = 90–300 N led to a decrease in the analyzed surface roughness parameters (Sa, Sz, Sp, and Sv) in relation to their reference values (after grinding).
- The surface shape after slide burnishing was plastically deformed. Changes in the shape and dimensions of the surface micro-irregularities were visible.
- The obtained skewness value and kurtosis for the surface after slide burnishing mean that this surface can be considered a good bearing surface.
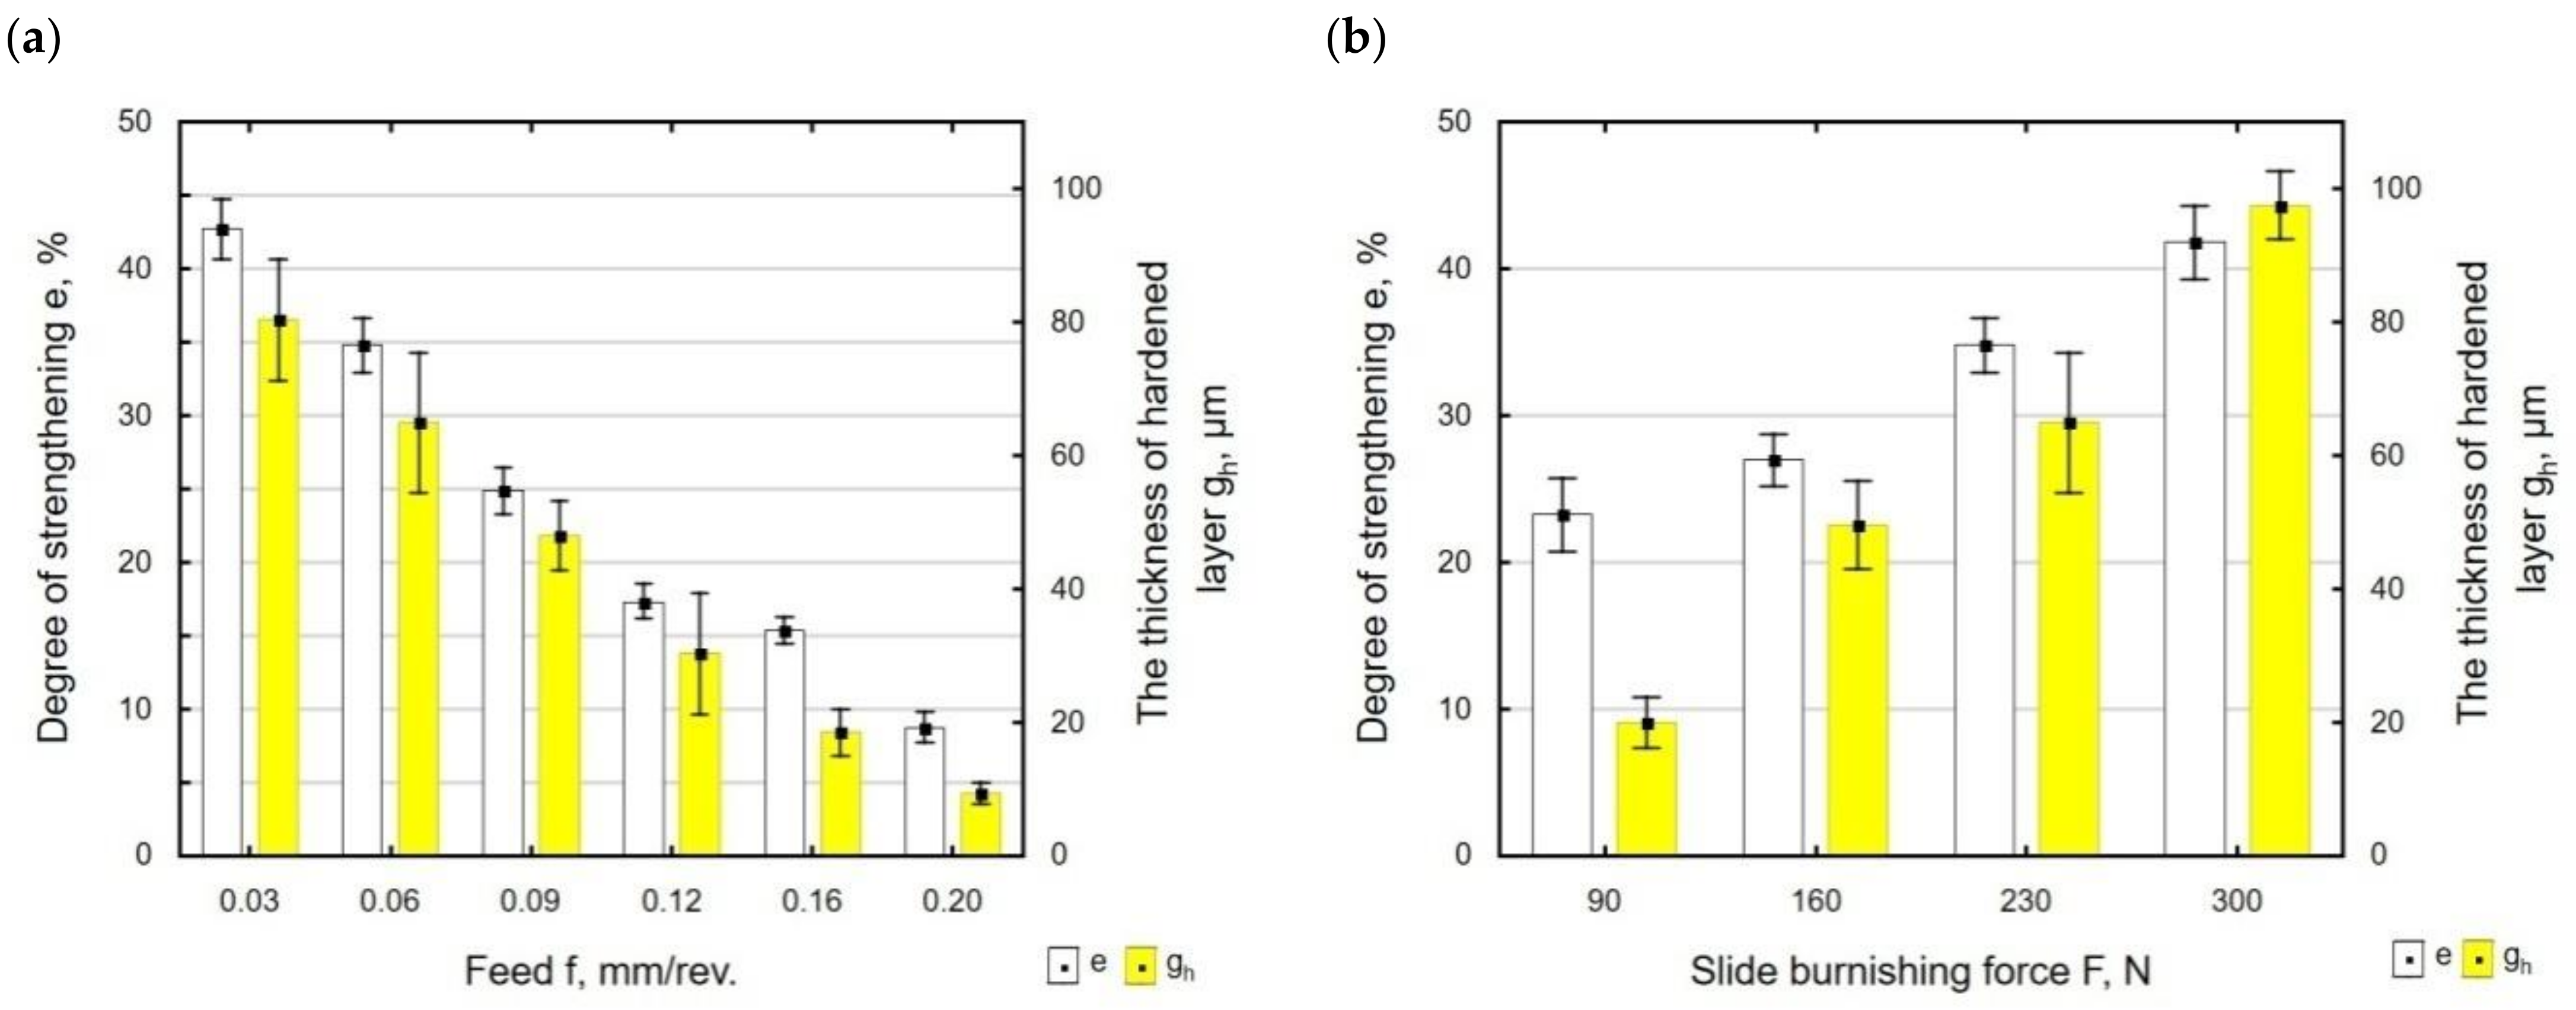
- After slide burnishing, the surface layer was strengthened. The microhardness of the surface layer and depth of the hardened layer gh increased. The maximum degree of strengthening e was obtained after slide burnishing conducted with F = 230 N and f = 0.03 mm/rev (e = 42%), while the greatest increase in the hardened layer thickness of gh = 97.50 μm was obtained for F = 300 N and f = 0.06 mm/rev.
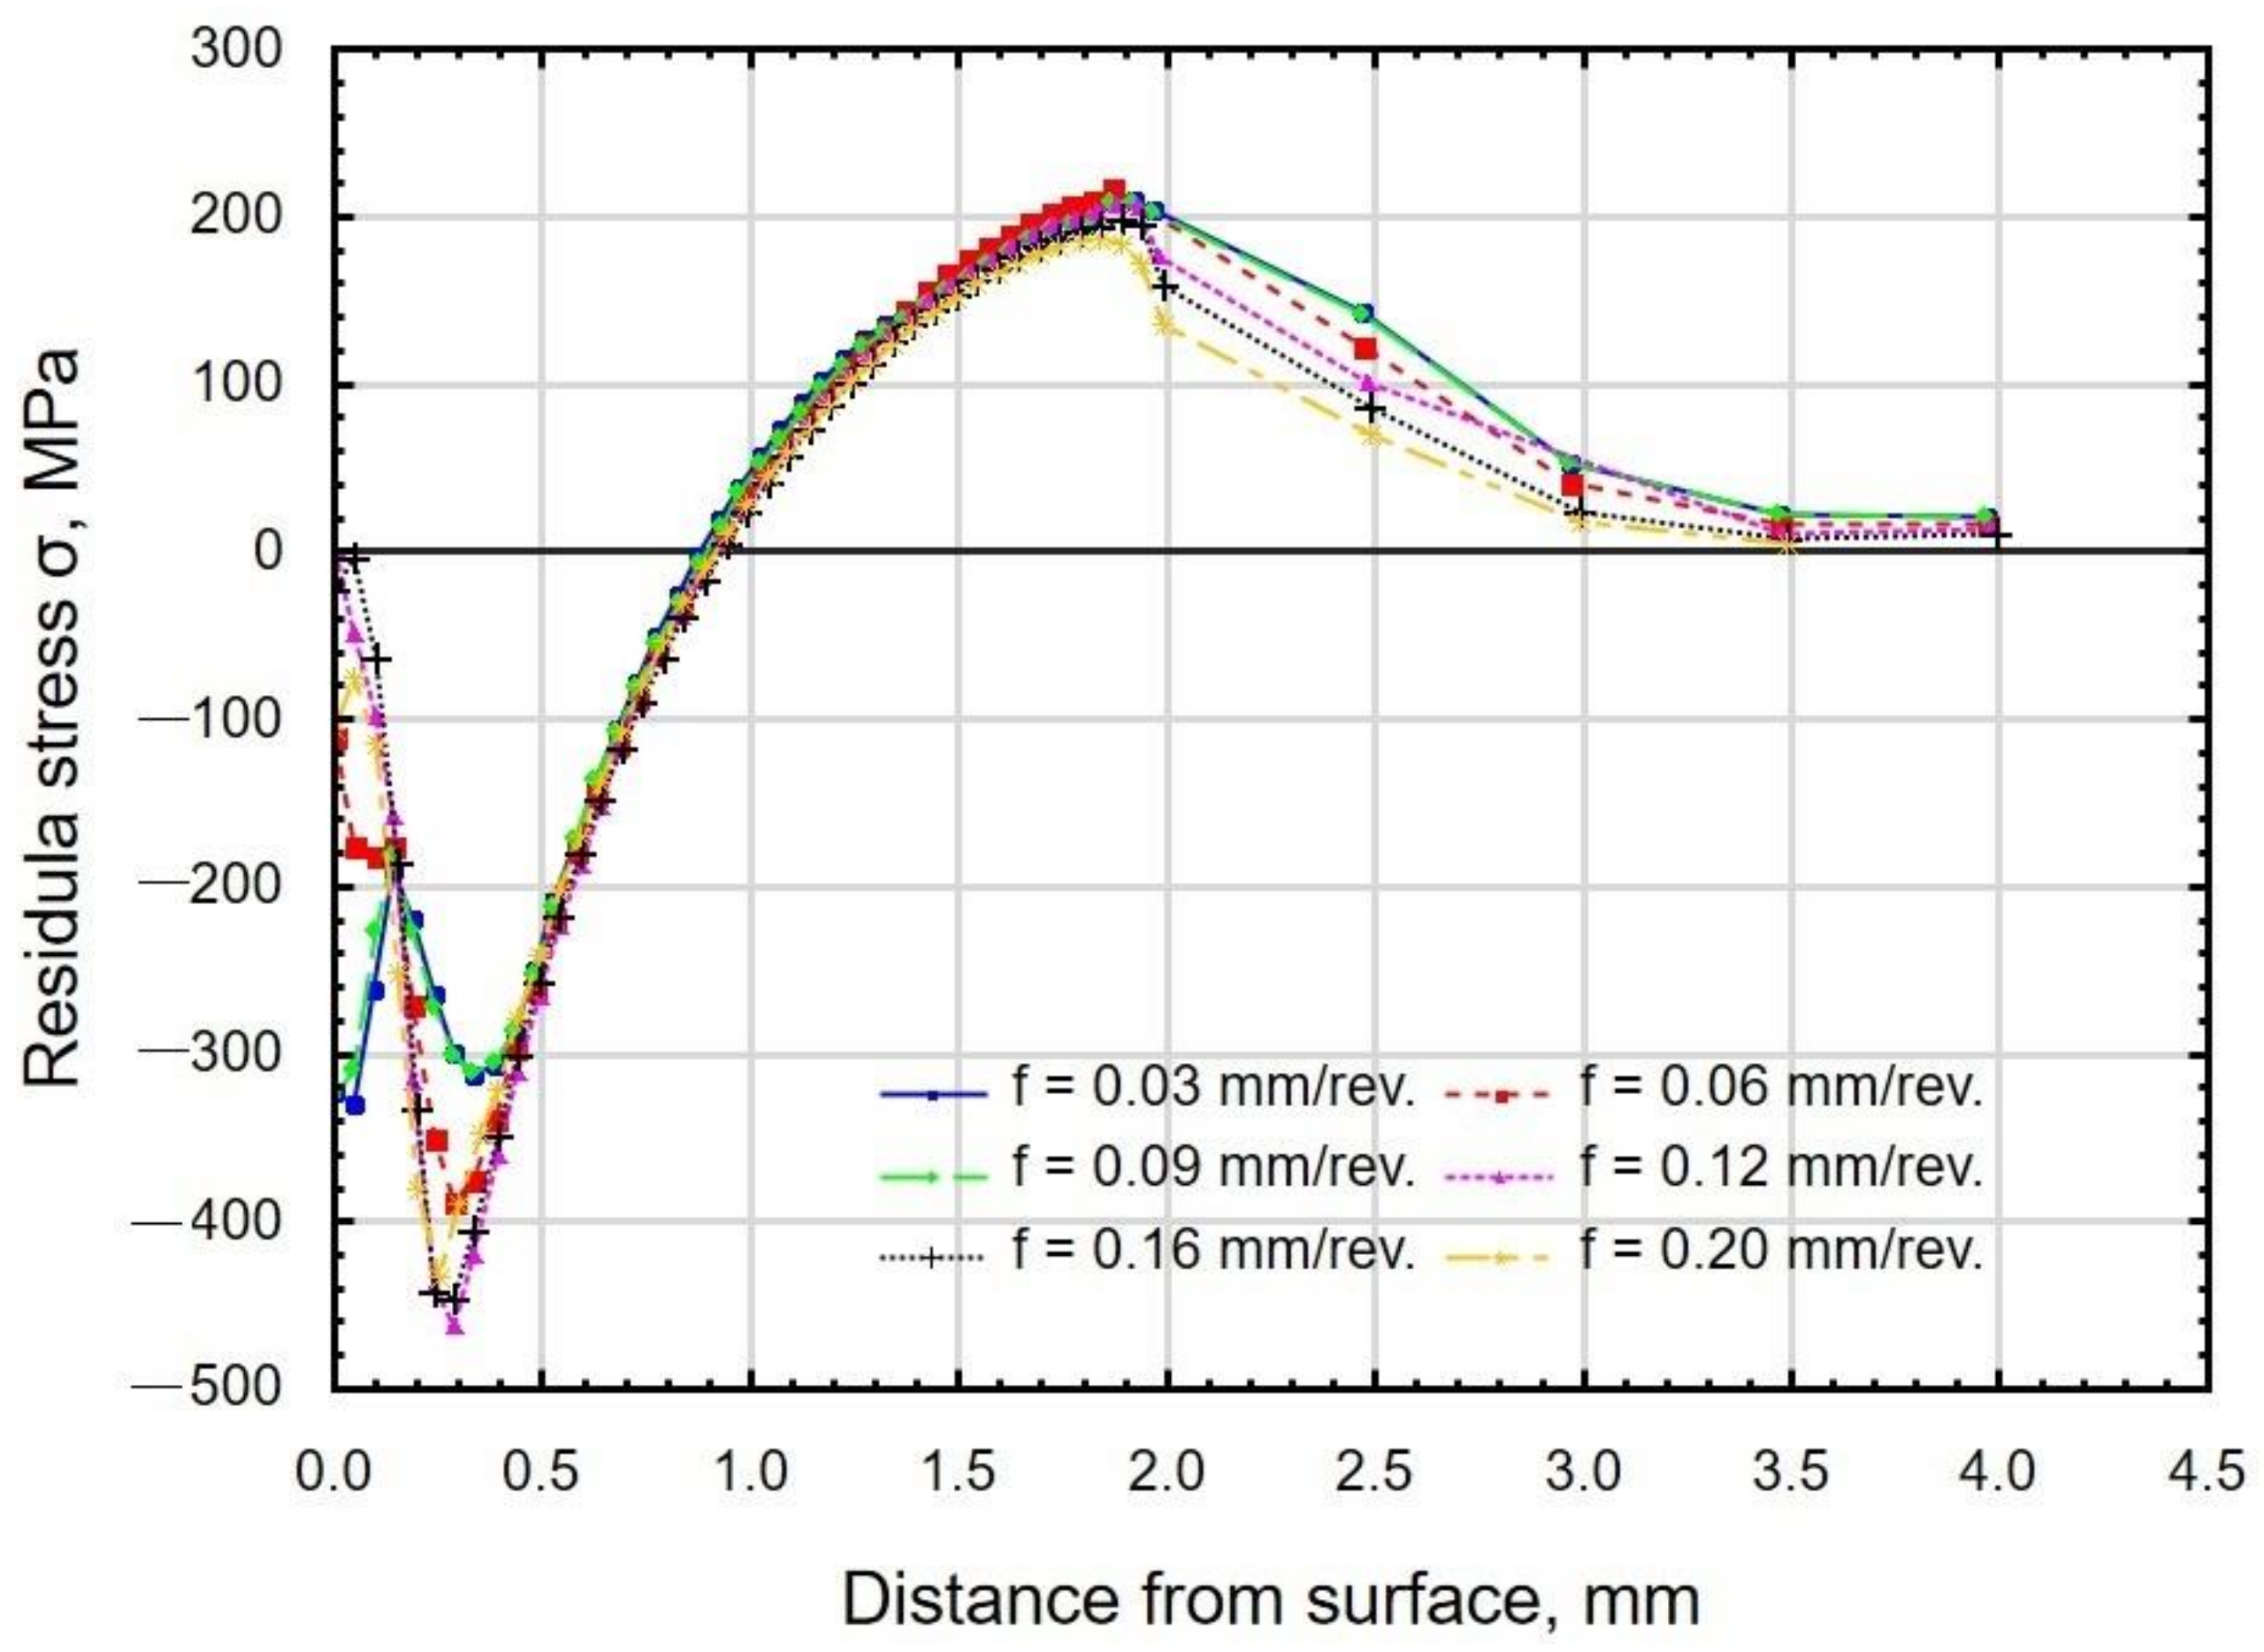
- The FEM simulations of the slide burnishing process demonstrated the favorable nature of the residual compressive stresses occurring in the subsurface zones. It was noticed that the slide burnishing force had a greater impact on the depth of the compressive residual stresses than the feed.
- The plastic deformation wave moved the area of concentration of the maximum equivalent plastic strains from the axis of symmetry of the workpiece toward the end passes of the burnishing element.
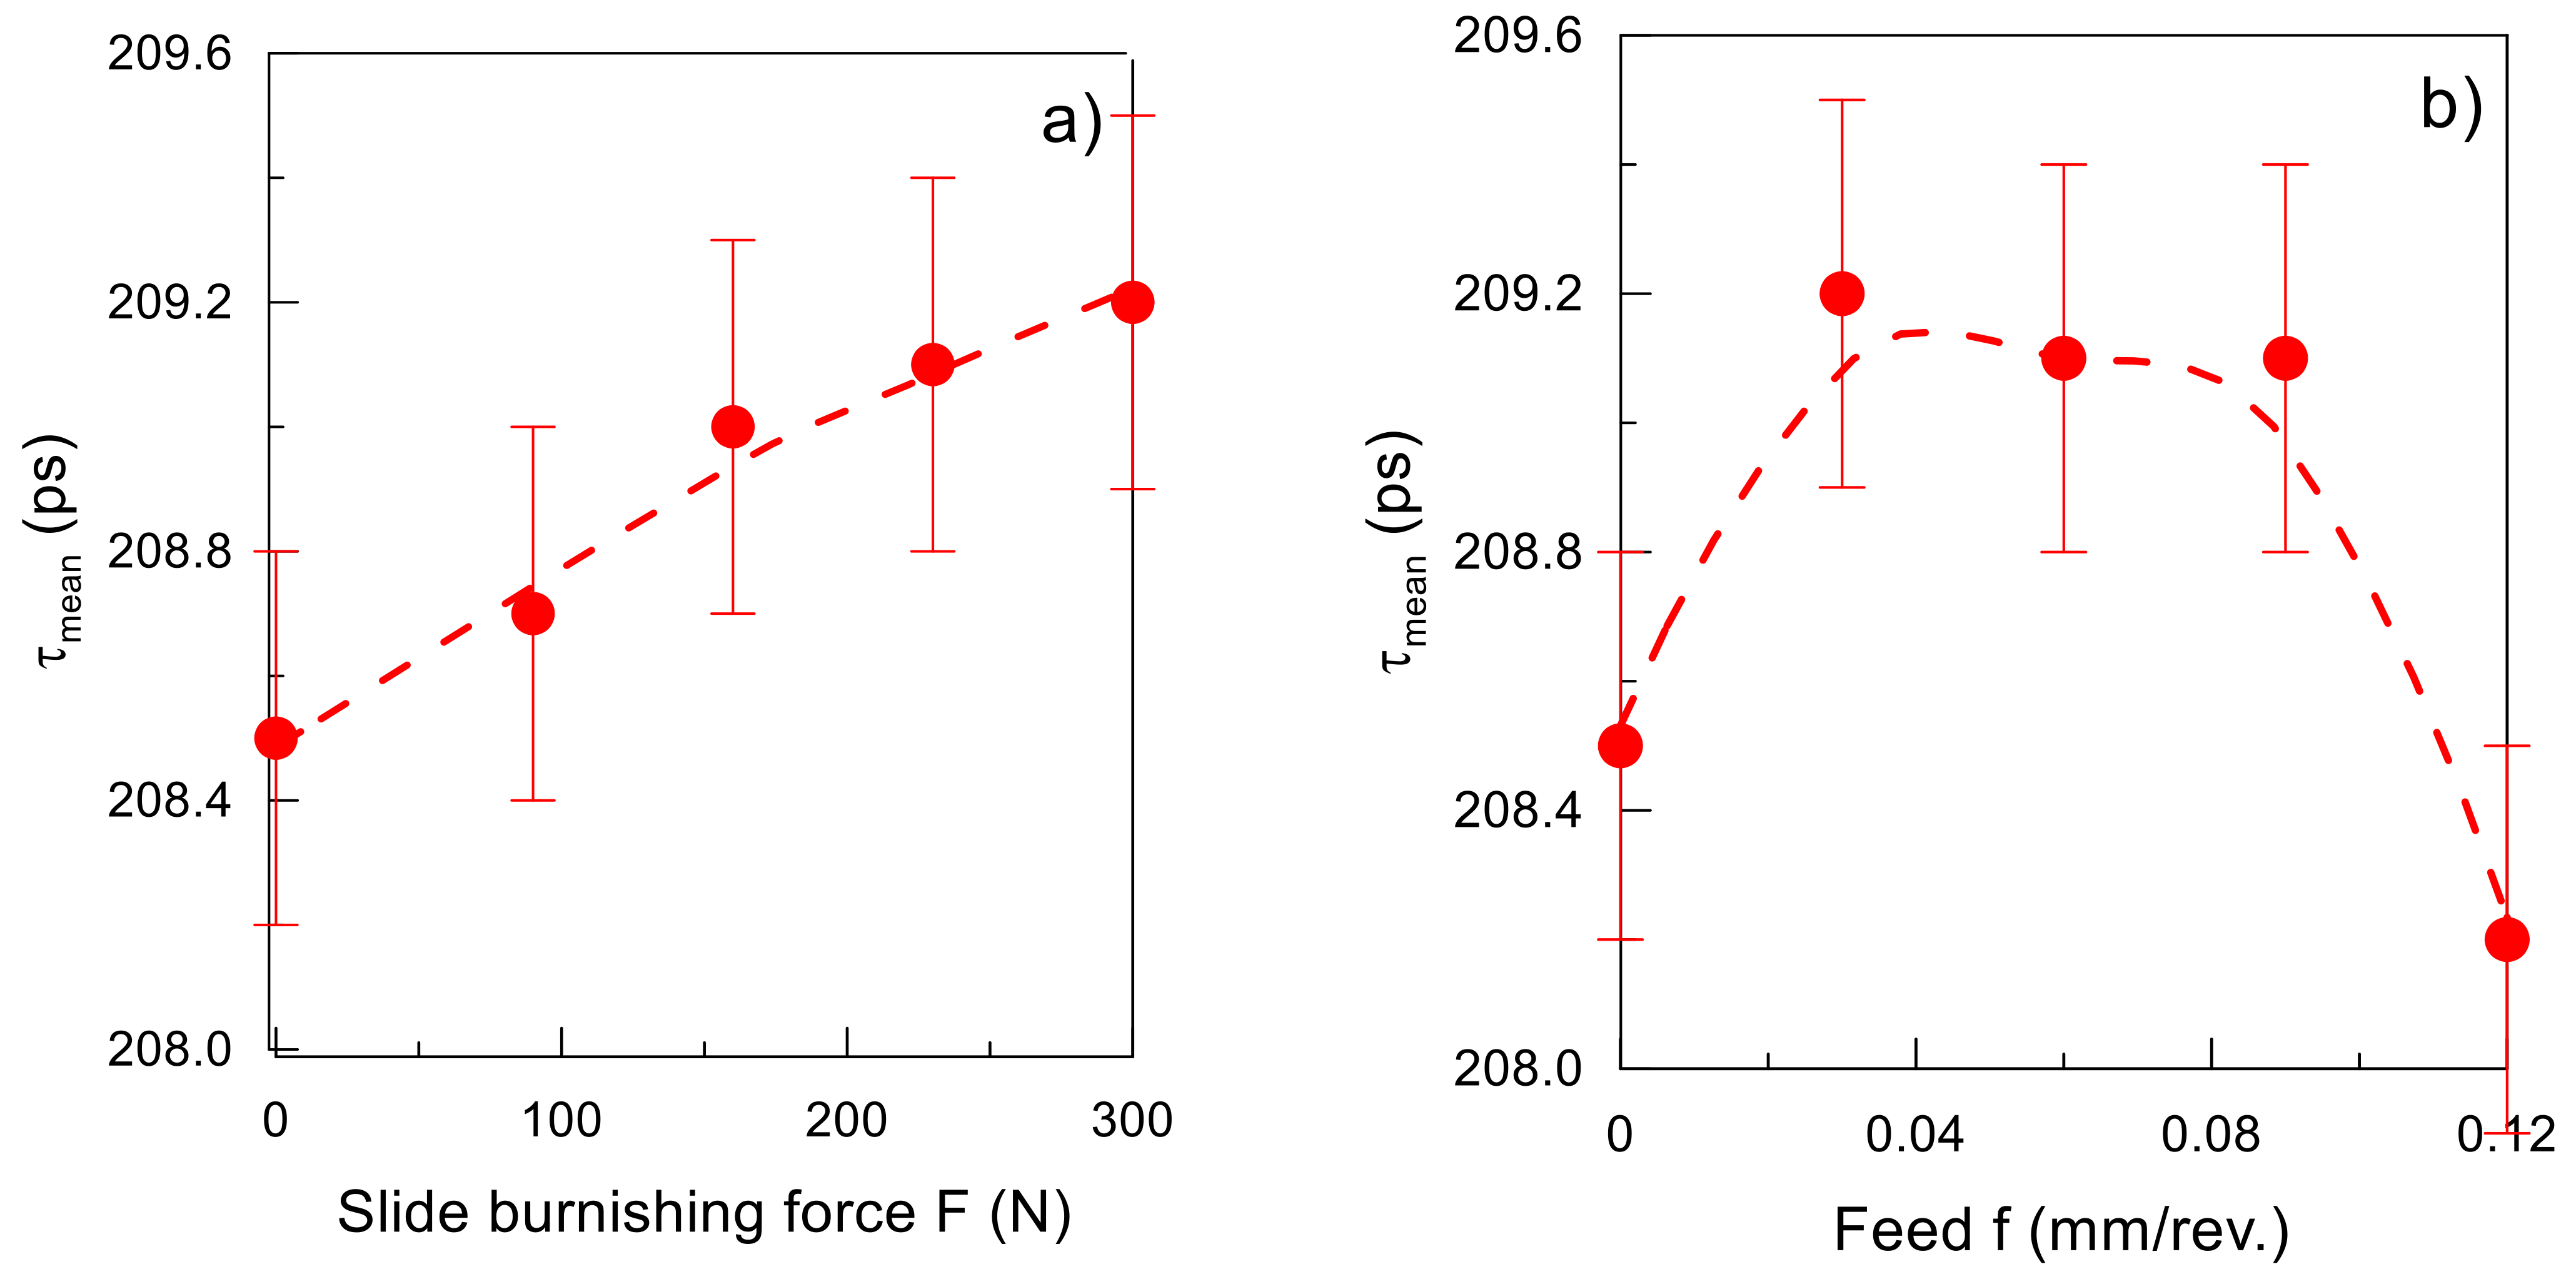
- The positron mean lifetime τmean increased slightly yet systematically with the increase in the burnishing force F; with an increase in feed, those changes had a different nature.
Author Contributions
Funding
Informed Consent Statement
Data Availability Statement
Conflicts of Interest
References
- Silva-Alvarez, D.F.; Marquez-Herrera, A.; Saldana-Robles, A.; Zapata-Torres, M.; Mis-Fernandez, R.; Pena-Chapa, J.L.; Moreno-Palmerin, J.; Hernandez-Rodiguez, E. Improving the surface integrity of CoCrMo alloy by the ball burnishing technique. J. Mater. Technol. 2020, 9, 7592–7601. [Google Scholar] [CrossRef]
- Das, T.; Erdogan, A.; Kursuncu, B.; Maleki, E.; Unal, O. Effect of severe vibratory peening on microstructural and tribological properties of hot rolled AISI 1020 mild steel. Surf. Coat. Technol. 2020, 403, 126383. [Google Scholar] [CrossRef]
- Kulisz, M.; Zagórski, I.; Matuszak, J.; Kłonica, M. Properties of the surface layer after trochoidal milling and brushing: Experimental and artificial neural network simulation. Appl. Sci. 2020, 10, 75. [Google Scholar] [CrossRef] [Green Version]
- Zhang, P.; Lindemann, J.; Leyens, C. Shot peening on the high-strength wrought magnesium Alloy AZ80—Effect of peening media. J. Mater. Process. Technol. 2010, 210, 445–450. [Google Scholar] [CrossRef]
- Maximov, J.T.; Duncheva, G.V.; Anchev, A.P.; Dunchev, V.P.; Ichkova, M.D. Improvement in fatigue strength of 41Cr4 steel through slide diamond burnishing. J. Bras. Soc. Mech. Sci. Eng. 2020, 42, 197. [Google Scholar] [CrossRef]
- Zielecki, W.; Bucior, M.; Trzepicinski, T.; Ochał, K. Effect of slide burnishing of shoulder fillets on the fatigue strength of X19NiCrMo4 steel shafts. Int. J. Adv. Manuf. Technol. 2020, 106, 2583–2593. [Google Scholar] [CrossRef]
- Zaleski, K. The effect of shot peening on the fatigue life of parts made of titanium alloy Ti6Al4V. Eksploat. Niezawodn.–Maint. Reliab. 2009, 4, 65–71. [Google Scholar]
- Nie, L.; Wu, Y.; Gong, H.; Chen, D.; Guo, X. Effect of shot peening on redistribution of residual stress field in friction stir welding of 2219 aluminum alloy. Materials 2020, 13, 3169. [Google Scholar] [CrossRef]
- Dzierwa, A.; Gałda, L.; Tupaj, M.; Dudek, K. Investigation of wear resistance of selected materials after slide burnishing process. Eksploat. Niezawodn.–Maint. Reliab. 2020, 22, 432–439. [Google Scholar] [CrossRef]
- Revankar, G.D.; Shetty, R.; Rao, S.S.; Gaitonde, V.N. Wear resistance enhancement of titanium alloy (Ti-6Al-4V) by ball burnishing process. J. Mater. Res. Technol. 2017, 6, 13–32. [Google Scholar] [CrossRef] [Green Version]
- Nagit, G.; Slatineau, L.; Dodun, O.; Mihalache, A.M.; Ripanu, M.I.; Hrituc, A. Influence of some microchanges generated by different processing methods on selected tribological characteristics. Micromachines 2022, 13, 29. [Google Scholar] [CrossRef]
- Swirad, S.; Pawlus, P. The effect of ball burnishing on dry fretting. Materials 2021, 14, 7073. [Google Scholar] [CrossRef]
- Maheshwari, A.S.; Gawande, R.R. Influence of specially designed high—Stiffness ball burnishing tool on surface quality of titanium alloy. Mater. Today Proc. 2017, 4, 1405–1413. [Google Scholar] [CrossRef]
- Swirad, S.; Wydrzynski, D.; Nieslony, P.; Krolczyk, G.M. Inflence of hydrostatic burnishing strategy on the surface topography of martensitic steel. Measurement 2019, 138, 590–601. [Google Scholar] [CrossRef]
- Ahmed, A.A.; Mhaede, M.; Basha, M.; Wollman, M.; Wagner, L. The effect of shot peening parameters and hydroxyapalite coating on surface properties and corrosion behavior of medical grade AISI 316L stainless steel. Surf. Coat. Technol. 2015, 280, 347–358. [Google Scholar] [CrossRef]
- Skoczylas, A.; Zaleski, K. Selected properties of Surface layer of C45 steel parts subjected to laser cutting and ball burnishing. Materials 2020, 13, 3429. [Google Scholar] [CrossRef]
- Matuszak, J.; Zaleski, K.; Skoczylas, A.; Ciecieląg, K.; Kęcik, K. Influence of semi—Random and regular shot peening on selected surface layer properties of aluminum alloy. Materials 2021, 14, 7620. [Google Scholar] [CrossRef]
- Zaleski, K.; Skoczylas, A. Effect of slide burnishing on the surface layer and fatigue life of titanium alloy parts. Adv. Mater. Sci. 2019, 19, 35–45. [Google Scholar] [CrossRef] [Green Version]
- Kowalik, M.; Trzepieciński, T.; Kukiełka, L.; Paszta, P.; Maciąg, P.; Legutko, S. Experimental and numerical analysis of the depth of the strengthened layer on shafts resulting from roller burnishing with roller braking moment. Materials 2021, 14, 5844. [Google Scholar] [CrossRef]
- Sidhu, A.S.; Singh, S.; Kumar, R.; Pimenov, D.Y.; Giasin, K. Prioritizing Energy-Intensive Machining Operations and Gauging the Influence of Electric Parameters: An Industrial Case Study. Energies 2021, 14, 4761. [Google Scholar] [CrossRef]
- Rinaldi, S.; Rotella, G.; Umbrello, D. Experimental and numerical analysis of roller burnishing of Waspaloy. Procedia Manuf. 2019, 34, 65–72. [Google Scholar] [CrossRef]
- Kluz, R.; Antosz, K.; Trzepieciński, T.; Bucior, M. Modelling the Influence of Slide Burnishing Parameters on the Surface Roughness of Shafts Made of 42CrMo4 Heat-Treatable Steel. Materials 2021, 14, 1175. [Google Scholar] [CrossRef] [PubMed]
- Korzynski, M.; Zarski, T. Slide diamond burnishing influence stereometric structure of an AZ91 alloy. Surf. Coat. Technol. 2016, 307, 590–595. [Google Scholar] [CrossRef]
- Nestler, A.; Schubert, A. Effect of machining parameters on surface properties in slide diamond burnishing of aluminum matrix composites. Mater. Today Proc. 2015, 2, 156–161. [Google Scholar] [CrossRef]
- Toboła, D.; Brostow, W.; Czechowski, K.; Rusek, P. Improvement of wear resistance of some cold working tool steels. Wear 2017, 382, 29–39. [Google Scholar] [CrossRef]
- Kato, H.; Hirokawa, W.; Todaka, Y.; Yasunaga, K. Improvement in Surface roughness and hardness for carbon steel by slide burnishing process. Mater. Sci. Appl. 2021, 12, 171–181. [Google Scholar] [CrossRef]
- Kato, H.; Yamamoto, K.; Yasunaga, K. Nano-Crystallization of Steel Surface by Slide-Burnishing. Key Eng. Mater. 2020, 841, 48–53. [Google Scholar] [CrossRef]
- Yang, S.; Zeng, W.; Yang, J. Characterization of shot peening properties and modelling on the fatigue performance of 304 austenitic stainless steel. Int. J. Fatigue 2020, 137, 105621. [Google Scholar] [CrossRef]
- Chen, M.; Liu, H.; Wang, L.; Zhu, K.; Xu, Z.; Jiang, C.; Ji, V. Evaluation of the residual stress and microstructure character in SAF 2507 duplex stainless steel after multiple shot peening process. Surf. Coat. Technol. 2018, 344, 132–140. [Google Scholar] [CrossRef]
- Menezes, M.R.; Godoy, C.; Buono, V.T.L.; Schwartzman, M.M.M.; Wilson, J.C.A.-B. Effect of shot peening and treatment temperature on wear and corrosion resistance of sequentially plasma treated AISI 316L steel. Surf. Coat. Technol. 2017, 309, 651–662. [Google Scholar] [CrossRef]
- Gopi, R.; Saravanan, I.; Devaraju, A.; Loganathan, G.b. Investigation of shot peening process on stainless steel and its effects for tribological applications. Mater. Today Proc. 2020, 22, 580–584. [Google Scholar] [CrossRef]
- Walczak, M.; Szala, M. Effect of shot peening on the surface properties, corrosion and wear performance of 17-4PH steel produced by DMLS additive manufacturing. Arch. Civ. Mech. Eng. 2021, 21, 157. [Google Scholar] [CrossRef]
- Spadaro, L.; Herenu, S.; Strubbia, R.; Gomez-Rosas, G.; Bolmaro, R.; Rubio-Gonzalez, C. Effects of laser shock processing and shot peening on 253MA austenitic stainless steel and their consequences on fatigue properties. Opt. Laser Technol. 2020, 122, 105892. [Google Scholar] [CrossRef]
- Bouzid Sai, W.; Lebrun, J.L. Inflence of finishing by burnishing on surface characteristics. J. Mater. Eng. Perform. 2003, 12, 37–40. [Google Scholar]
- Attabi, S.; Himour, A.; Laouar, L.; Motallebzadeh, A. Mechanical and wear behaviors of 316L stainless steel after ball burnishing treatment. J. Mater. Res. Technol. 2021, 15, 3255–3267. [Google Scholar] [CrossRef]
- Duncheva, G.V.; Maximov, J.T.; Anchev, A.P.; Dunchev, V.P.; Argirov, Y.B. Improvement in Wear Resistance Performance of CuAl8Fe3 Single-Phase Aluminum Bronze via Slide Diamond Burnishing. J. Mater. Eng. Perform. 2022, 13, 2466–2478. [Google Scholar] [CrossRef]
- Valiorgue, F.; Zmelty, V.; Dumas, M.; Chomienne, M.; Verdu, C.; Lefebvre, F.; Rech, J. Influence of residual stress profile and surface microstructure on fatigue life of a 15-5PH. Procedia Eng. 2018, 213, 623–629. [Google Scholar] [CrossRef]
- Konefal, K.; Korzynski, M.; Byczkowska, Z.; Korzynska, K. Improved corrosion resistance of stainless steel X6CrNiMoTi17-12-2 by slide diamond burnishing. J. Mater. Process. Technol. 2013, 213, 1997–2004. [Google Scholar] [CrossRef]
- Horodek, P.; Dryzek, J.; Wróbel, M. Positron annihilation study of defect induced by various cutting methods in stainless steel grade 304. Tribol. Lett. 2012, 45, 341–347. [Google Scholar] [CrossRef] [Green Version]
- Skowron, K.; Dryzek, E.; Wróbel, M.; Cieniek, Ł. Laser peened austenitic stainless steel studied by positron annihilation spectroscopy. Acta Phys. Pol. B 2020, 51, 317–321. [Google Scholar] [CrossRef] [Green Version]
- Zaleski, R.; Zaleski, K.; Gorgol, M.; Wiertel, M. Positron annihilation study of aluminum, titanium and iron alloys surface after shot peening. Appl. Phys. A 2015, 120, 551–559. [Google Scholar] [CrossRef] [Green Version]
- Skoczylas, A.; Zaleski, K.; Zaleski, R.; Gorgol, M. Analysis of Surface properties of nickel alloy elements exposed to impulse shot peening with use of positron annihilation. Materials 2021, 14, 7328. [Google Scholar] [CrossRef] [PubMed]
- Ashby, M.; Shercliff, H.; Cebon, D. Material Engineering; Galaktyka Publishing House: Łódź, Poland, 2011. (In Polish) [Google Scholar]
- Becvár, F. Methodology of positron lifetime spectroscopy: Present status and perspectives. Nucl. Instrum. Methods Phys. Res. Sect. B 2007, 261, 871–874. [Google Scholar] [CrossRef]
- Olsen, J.V.; Kirkegaard, P.; Pedersen, N.J.; Eldrup, M. PALSfit: A new program for the evaluation of positron lifetime spectra. Phys. Stat. Solidi C 2007, 4, 4004–4006. [Google Scholar] [CrossRef]
- Djourelov, N.; Misheva, M. Source correction in positron annihilation lifetime spectroscopy. J. Phys. Condens. Matter 1996, 8, 2081. [Google Scholar] [CrossRef]
- Maximov, J.T.; Duncheva, G.V.; Anchev, A.P.; Ganev, N.; Amudjev, I.M.; Dunchev, V.P. Effect of slide burnishing method on the surface integrity of AISI 316Ti chromium–nickel steel. J. Bras. Soc. Mech. Sci. Eng. 2018, 40, 194. [Google Scholar] [CrossRef]
- Tayebi, N.; Polycarpou, A.A. Modeling the effect of skewness and kurtosis on the static coefficient of rough surfaces. Tribol. Int. 2004, 37, 491–505. [Google Scholar] [CrossRef]
- Sedlacek, M.; Podgornik, B.; Vizitin, J. Influence of surface preparation on roughness parameters, friction and wear. Wear 2009, 266, 482–487. [Google Scholar] [CrossRef]
- Sachin, B.; Rao, C.M.; Naik, G.M.; Puneet, N.P. Infuence of slide burnishing process on the surface characteristics of precipitation hardenable steel. SN Appl. Sci. 2021, 3, 223. [Google Scholar] [CrossRef]
- Maximov, J.T.; Anchev, A.V.; Dunchev, V.P.; Ganev, N.; Duncheva, G.V.; Selimov, K.F. Effect of slide burnishing basic parameters on fatigue performance of 2024-T3 high-strength aluminium alloy. Fatigue Fract. Eng. Mater. Struct. 2017, 40, 1893–1904. [Google Scholar] [CrossRef]
- Skoczylas, A.; Zaleski, K. Study on the Surface Layer Properties and Fatigue Life of a Workpiece Machined by Centrifugal Shot Peening and Burnishing. Materials 2022, 15, 6677. [Google Scholar] [CrossRef]
- Salahshoora, M.; Guo, Y.B. Surface integrity of magnesium-calcium implants processed by synergistic dry cutting-finish burnishing. Procedia Eng. 2011, 19, 288–293. [Google Scholar] [CrossRef]
- Park, Y.-K.; Waber, J.T.; Meshii, M.; Snead, C.L.; Park, C.G. Dislocation studies on deformed single crystals of high-purity iron using positron annihilation: Determination of dislocation densities. Phys. Rev. B 1986, 34, 823. [Google Scholar] [CrossRef]
- Ohkubo, H.; Tang, Z.; Nagai, Y.; Hasegawa, M.; Tawara, T.; Kiritani, M. Positron annihilation study of vacancy-type defects in high-speed deformed Ni, Cu and Fe. Mater. Sci. Eng. A 2003, 350, 95–101. [Google Scholar] [CrossRef]


| Element | Fe | Cr | Ni | Mn | Si | P | S |
|---|---|---|---|---|---|---|---|
| wt% | 70.4 | 18.9 | 8.3 | 1.7 | 0.5 | 0.1 | 0.1 |
| Yield point (min) | 220 MPa | ||||||
| Tensile strength (max) | 720 MPa | ||||||
| Hardness (max) | 215 HB | ||||||
| No. | F [N] | f [mm/rev] | vn [m/min] | i |
|---|---|---|---|---|
| 1. | 90 | 0.06 | 35 | 1 |
| 2. | 160 | |||
| 3. | 230 | |||
| 4. | 300 | |||
| 5. | 230 | 0.03 | ||
| 6. | 0.09 | |||
| 7. | 0.12 | |||
| 8. | 0.16 | |||
| 9. | 0.20 |
| Burnishing Force (N) (f = const. = 0.06 mm/rev.) | Burnishing Feed (mm/rev) (F = const = 230 N) | ||
|---|---|---|---|
| 90 | 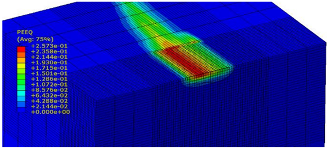 | 0.03 | 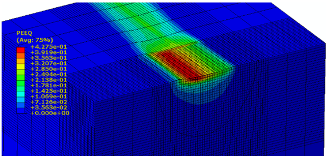 |
| 160 |  | 0.06 | 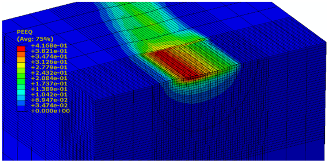 |
| 230 | 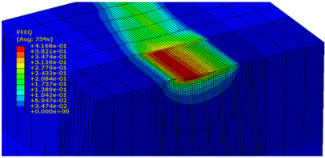 | 0.09 | 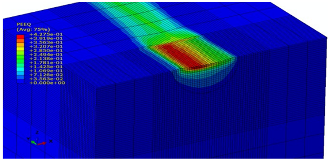 |
| 300 | 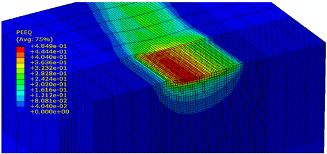 | 0.12 |  |
| 0.16 | 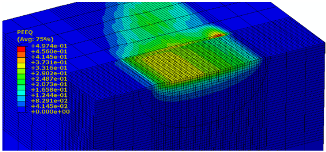 | ||
| 0.20 |  | ||
Publisher’s Note: MDPI stays neutral with regard to jurisdictional claims in published maps and institutional affiliations. |
© 2022 by the authors. Licensee MDPI, Basel, Switzerland. This article is an open access article distributed under the terms and conditions of the Creative Commons Attribution (CC BY) license (https://creativecommons.org/licenses/by/4.0/).
Share and Cite
Skoczylas, A.; Zaleski, K.; Matuszak, J.; Ciecieląg, K.; Zaleski, R.; Gorgol, M. Influence of Slide Burnishing Parameters on the Surface Layer Properties of Stainless Steel and Mean Positron Lifetime. Materials 2022, 15, 8131. https://doi.org/10.3390/ma15228131
Skoczylas A, Zaleski K, Matuszak J, Ciecieląg K, Zaleski R, Gorgol M. Influence of Slide Burnishing Parameters on the Surface Layer Properties of Stainless Steel and Mean Positron Lifetime. Materials. 2022; 15(22):8131. https://doi.org/10.3390/ma15228131
Chicago/Turabian StyleSkoczylas, Agnieszka, Kazimierz Zaleski, Jakub Matuszak, Krzysztof Ciecieląg, Radosław Zaleski, and Marek Gorgol. 2022. "Influence of Slide Burnishing Parameters on the Surface Layer Properties of Stainless Steel and Mean Positron Lifetime" Materials 15, no. 22: 8131. https://doi.org/10.3390/ma15228131